Embed Size (px)
Citation preview

doi:10.1016/j.jmb.2008.03.056 J. Mol. Biol. (2008) 379, 174–187
Available online at www.sciencedirect.com
Structural Analysis of the Saf Pilus by ElectronMicroscopy and Image Processing
Osman Salih1,2, Han Remaut1,2, Gabriel Waksman1,2,3 andElena V. Orlova1,2⁎
1Institute of StructuralMolecular Biology at UCL/Birkbeck, London WC1E 7HX,UK2Department ofCrystallography, BirkbeckCollege, University of London,Malet Street, London WC1E7HX, UK3Department of Biochemistryand Molecular Biology,University of London, GowerStreet, London WC1E 6BT, UK
Received 16 December 2007;received in revised form13 March 2008;accepted 18 March 2008Available online3 April 2008
*Corresponding author. E-mail [email protected] used: Saf, Salmonel
CU, chaperone/usher; Nte, N-termiFG-loop Short; FGL, FG-loop Long;microscopy; WT, wild type; MSA, manalysis; MRA, multireference aligntransfer function.
0022-2836/$ - see front matter © 2008 E
Bacterial pili are important virulence factors involved in host cellattachment and/or biofilm formation, key steps in establishing andmaintaining successful infection. Here we studied Salmonella atypicalfimbriae (or Saf pili), formed by the conserved chaperone/usher pathway.In contrast to the well-established quaternary structure of typical/FGS-chaperone assembled, rod-shaped, chaperone/usher pili, little is knownabout the supramolecular organisation in atypical/FGL-chaperoneassembled fimbriae. In our study, we have used negative stain electronmicroscopy and single-particle image analysis to determine the three-dimensional structure of the Salmonella typhimurium Saf pilus. Our resultsshow atypical/FGL-chaperone assembled fimbriae are composed of highlyflexible linear multi-subunit fibres that are formed by globular subunitsconnected to each other by short links giving a “beads on a string”-likeappearance. Quantitative fitting of the atomic structure of the SafA pilussubunit into the electron density maps, in combination with linkermodelling and energy minimisation, has enabled analysis of subunitarrangement and intersubunit interactions in the Saf pilus. Short inter-subunit linker regions provide the molecular basis for flexibility of the Safpilus by acting as molecular hinges allowing a large range of movementbetween consecutive subunits in the fibre.
© 2008 Elsevier Ltd. All rights reserved.
Keywords: pilus; electron microscopy; image processing; single-particleanalysis; atomic structure fitting
Edited by W. BaumeisterIntroduction
Gram-negative bacteria commonly assemble extra-cellular adhesive organelles called pili or fimbriae, alarge group of which are assembled through thechaperone/usher (CU) pathway.1,2 These organellesconstitute important virulence factors that enablehost-specific attachment to target tissues, and canmediate host cell invasion or promote biofilm forma-tion in various pathogenic Enterobacteriaceae andPseudomonads as well as Burkholderia, Bordetella and
ess:
la atypical fimbriae;nal extension; FGS,EM, electronultivariate statisticalment; CTF, contrast
lsevier Ltd. All rights reserve
Haemophilus species.3,4 CU pili consist of linearpolymers of non-covalently linked subunits orga-nised in rigid ∼7-nm-thick helically wound rods orextended, thin (∼2 nm) flexible fibrillae depending onthe specific operon.3–6 CU organelle assemblyinvolves a specialised periplasmic chaperone and anouter membrane protein, called the usher. Nascentpilus subunits are translocated across the innermembrane and into the periplasmic space throughthe SecYEG general secretory pathway.7,8 Here, pilussubunits are bound by the periplasmic chaperone.This interaction facilitates subunit folding and capstheir interactive surfaces, thereby preventing prema-ture aggregation in the periplasm.2,8–11 Solublechaperone–subunit complexes are then targeted tothe usher protein, which acts as a pilus assemblyplatform as well as a pilus-specific secretion channelin the bacterial outer membrane.12,13
CU pilus subunits interact with the chaperoneand with one another through a fold complemen-tation mechanism.3 Pilus subunits consist of an
d.
175Structural Analysis of the Saf Pilus
immunoglobulin-like fold that lacks its seventh, C-terminal β-strand.14,15 The periplasmic chaperonesdonate part of a β-strand to complement the missingstructural element in the pilus subunits in a processcalled donor-strand complementation. Similarly, inthe mature fibre, pilus subunits donate a 10- to 20-residue-long N-terminal extension (Nte) peptide tocomplement the missing structural information in apreceding subunit. Thus, CU pilus subunits polymer-ise into linear filaments through their N-terminalextension peptides in an in trans fold complementa-tion interaction.16,17 The mechanism by which thedonated chaperone'sβ-strand is exchanged for theN-terminal extension peptide of the subunit coming nextin assembly is termed “donor-strand exchange” andwas shown to proceed via a zip-in–zip-out processstarting at a defined initiation site.18
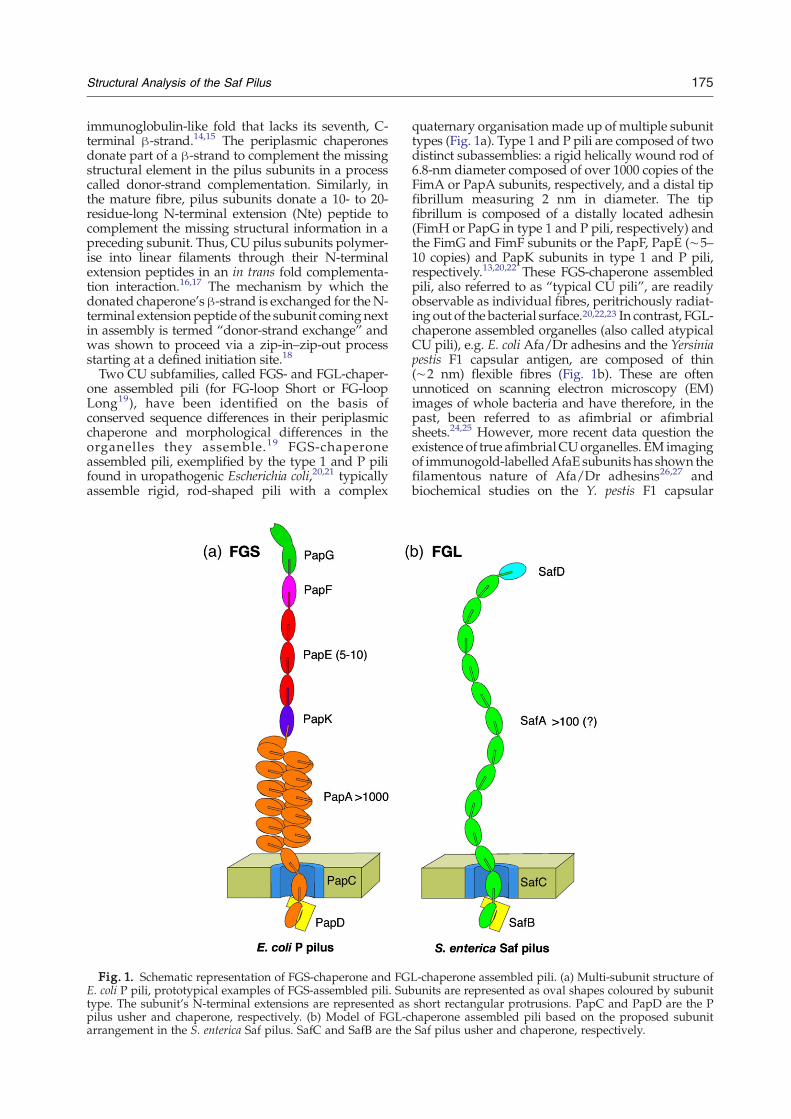
Two CU subfamilies, called FGS- and FGL-chaper-one assembled pili (for FG-loop Short or FG-loopLong19), have been identified on the basis ofconserved sequence differences in their periplasmicchaperone and morphological differences in theorganelles they assemble.19 FGS-chaperoneassembled pili, exemplified by the type 1 and P pilifound in uropathogenic Escherichia coli,20,21 typicallyassemble rigid, rod-shaped pili with a complex
Fig. 1. Schematic representation of FGS-chaperone and FGE. coli P pili, prototypical examples of FGS-assembled pili. Subtype. The subunit's N-terminal extensions are represented aspilus usher and chaperone, respectively. (b) Model of FGL-carrangement in the S. enterica Saf pilus. SafC and SafB are the
quaternary organisation made up of multiple subunittypes (Fig. 1a). Type 1 and P pili are composed of twodistinct subassemblies: a rigid helically wound rod of6.8-nm diameter composed of over 1000 copies of theFimA or PapA subunits, respectively, and a distal tipfibrillum measuring 2 nm in diameter. The tipfibrillum is composed of a distally located adhesin(FimH or PapG in type 1 and P pili, respectively) andthe FimG and FimF subunits or the PapF, PapE (∼5–10 copies) and PapK subunits in type 1 and P pili,respectively.13,20,22 These FGS-chaperone assembledpili, also referred to as “typical CU pili”, are readilyobservable as individual fibres, peritrichously radiat-ing out of the bacterial surface.20,22,23 In contrast, FGL-chaperone assembled organelles (also called atypicalCU pili), e.g. E. coli Afa/Dr adhesins and the Yersiniapestis F1 capsular antigen, are composed of thin(∼2 nm) flexible fibres (Fig. 1b). These are oftenunnoticed on scanning electron microscopy (EM)images of whole bacteria and have therefore, in thepast, been referred to as afimbrial or afimbrialsheets.24,25 However, more recent data question theexistence of true afimbrialCUorganelles. EM imagingof immunogold-labelledAfaE subunits has shown thefilamentous nature of Afa/Dr adhesins26,27 andbiochemical studies on the Y. pestis F1 capsular
L-chaperone assembled pili. (a) Multi-subunit structure ofunits are represented as oval shapes coloured by subunitshort rectangular protrusions. PapC and PapD are the Phaperone assembled pili based on the proposed subunitSaf pilus usher and chaperone, respectively.

176 Structural Analysis of the Saf Pilus
antigen showed Caf1 fimbrial subunits organise intolinear fibres through a donor-strand complementa-tion mechanism.28 Indeed, crystallographic analysisand NMR of FGL-system subunits [Y. pestis F1capsular antigen, E. coli Afa/Dr adhesins andSalmonella enterica atypical fimbriae (Saf) pili] laterrevealed they share the incomplete Ig-like fold typicalfor CUpilus subunits and interactwith one another ortheir respective chaperones via strand complemen-tation.17,18,29 Together, these studies demonstrate thatstrand complementation is a generic mechanism forthe assembly of surface-exposed polymers via the CUpathway, shared by both FGS and FGL systems. FGL-chaperone assembled systems lack the complexsubunit ordering and quaternary organisation seenin FGS-assembled pili: they are composed of just asingle or two different subunit types that often coil upinto an amorphous mass on the bacterial surface.30,31In contrast to FGS-chaperone assembled pili, whichhave a single adhesive subunit at the distal end of theorganelle, in FGL-chaperone assembled fibres theadhesive unit is formed by the main structuralsubunit that builds up the polymer.4,27,29
Fig. 2. Negative stain EM of Saf pili. (a) Negative stain mindicated by white arrows, with a width of ∼2.5 nm. (b) A setaverages (∼10 images per class) of the Saf pilus. indicates a csubunits, whereas points to a class average displaying the piluof two conformations of the Saf pilus designated type A (left) anclearly observed in each class average. (e) Reprojections of the tythe left and right panels, respectively. The white and black scal
Saf pili are FGL-chaperone assembled fimbriaecomprising two subunit types, SafA and SafD.32,33
SafD is classified as putative invasin, based on itssequence similarity with E. coli AfaD. Like AfaD,SafD does not appear to contain an N-terminal ex-tension peptide and is predicted to be present as asingle copy at the distal end of the fibre.29,33 SafAforms the major pilus subunit and polymerises viathe classic donor-strand exchange mechanismthrough the subunit'sN-terminal extension peptide.18
Here we present the analysis of FGL-organellesuperstructure and subunit interaction based onnegative stain EM and single-particle analysis ofSafA pili from Salmonella enterica sv. Typhimurium(S. typhimurium).
Results
Microscopy and image analysis
SafA pili were grown in vitro by allowingspontaneous SafA polymerisation from purified
icrograph of Saf pili. The image shows fibrous complexes,of Saf pilus images after alignment. (c) Representative classlass average showing the Saf pilus composed of four SafAsmade up of five subunits. (d) Representative class averagesd type B (right). Two discrete SafA subunits (49 Å×24 Å) arepe A and type B Saf pilus 3-D reconstructions are shown ine bars represent 20 and 10 nm, respectively.

177Structural Analysis of the Saf Pilus
SafB:SafA chaperone–subunit complexes (see Mate-rials and Methods). Due to the temperature-labilenature of the Saf fibre, the heat extraction methodol-ogy described for the isolation of in vivo surface-exposed P and type 1 pili34 was not applicable to theformer. Since the usher is not known to alter thequaternary structure of the assembled fibres, thismaterial forms a representative approximation ofwild-type (WT) Saf pili. Indeed, we previouslydemonstrated that in vitro grown P pilus rods are
Fig. 3. Three-dimensional reconstruction of the Saf pilus. Su(a) and the type B Saf pilus (b). Each reconstruction is contou(28.8 kDa). Both structures are viewed from three orthogonal dstretch of density. US, upper subunit; LS, lower subunit.
indistinguishable in structure from P pili extractedfrom the E. coli cell surface.35
The Saf pilus under study is composed of manySafAWT monomers, each with a molecular mass of14.4 kDa. Since Saf pili are thin and flexible fibres,negative stain EMwas used to study the complex. Anexample of a micrograph is shown in Fig. 2a, whereSaf pili appear as faint, curved fibres that have variouslengths ranging from 15 to 60 nm, with an averagewidth of∼2.5 nm. Due to their curviness (Fig. 2a), we
rface representation of the 3-D map of the type A Saf pilusred at the molecular mass expected for two SafA subunitsirections and show two subunits connected by a narrower

†http://www.pymol.org
178 Structural Analysis of the Saf Pilus
have used the single-particle approach to analyse thestructure of Saf pili. Over 10,000 images of relativelystraight pilus fibre segments were manually selectedfrom the micrographs and boxed into 128×128 pixelframes.The images of pilus segments were aligned (Fig.
2b) and then subjected to multivariate statisticalanalysis (MSA) for classification.36,37 The resultantclass averages clearly present Saf pili as fibres with a“beads on a string”-like appearance where subunitsare bound to each other through thin, short links ofdensity. The orientations of the best few classaverages that showed Saf pili with distinct structuralfeatures were determined by angular reconstitutionwith C1 point-group symmetry.38The first 3-D reconstruction of the Saf pili
confirmed their discrete organisation. The subunitsappeared to have a small tilt with respect to thevertical axis. In addition, a twist seemed to existbetween the subunits along the length of the pilus.Refinement of the structure was performed using a3-D model of the fibre composed of four averagedsubunits. The averaged 3-D model of one subunitwas generated by density averaging four differentsubunits from the first map, which were aligned byoperations of translation and rotation. Projectionsaround the long axis of the averaged fibre wereused for multireference alignment (MRA) of thepilus segments, which were then statisticallyanalysed.37 Upon visual inspection of the newclass averages, it was observed that some classaverages displayed Saf pili with four SafA subunits,whereas other class averages revealed pili com-posed of five subunits (Fig. 2c). The dimensions ofthe subunits (∼48 Å×25 Å) were in good agreementwith those observed in the X-ray crystal structure ofthe SafA subunit bound to a peptide derived fromthe N-terminal extension of SafA (referred to as theSafA:ANte complex).18 To capture the variouspossible states of the Saf pilus and overcome theheterogeneity problem, six class averages differingin the distance between the subunits (ranging from35 to 50 Å) were used as references for MRA of theentire data set. All images in the data set were thenseparated into six large groups, according to thereference producing the best alignment for eachimage. Each group represented in the range of 12–21% of the data.Further analysis was focused on the images that
aligned to the two states of the Saf pilus differingmost in appearance and arrangement of subunits;that with five SafA subunits and the other with foursubunits, designated “type A” and “type B” Saf pili,respectively. Analysis of these two subsets of imageswas performed separately, and the final sets of classaverages (Fig. 2d) were compared to reprojections(Fig. 2e) of the final 3-D reconstructions obtained tocheck for consistency.
3-D reconstructions of the Saf pilus
Two 3-D reconstructions representing two possi-ble states of the Saf pilus resulted from image
analysis. The type A (Fig. 3a) and type B (Fig. 3b) Safpilus reconstructions are similar in that they bothshow two discrete densities corresponding toseparate subunits that are connected to one anothervia a narrow linker of density. Subunit dimensionsfor both pilus types matched those of the SafA:ANtecrystal structure.18 The width and length of thelinking density is similar in each reconstruction.However, the two 3-D reconstructions mainly differin the rotations of the subunits. In the type Areconstruction, the tilt between subunits withrespect to the long axis of the fibre is ∼10°, whereasthe tilt between subunits in the type B structure is∼5°. There is an ∼18° rotation around the long axisof the fibre between subunits in the type Areconstruction, whereas the rotation between sub-units in the type B structure is ∼53°.
Docking the crystal structure of the SafA:ANtecomplex
Preliminary fitting of the X-ray crystal structure ofthe SafA:ANte complex (Protein Data Bank code2CO4)18 into the 3-D electron density maps wasperformed manually using PyMOL†.39 Refinementof this fitting was carried out for each individualsubunit in both 3-D maps using URO.40 The fittingwas optimised for the spatial frequency band of 17–50 Å. The correlation values between the fittedatomic structures and the two 3-Dmaps correspond-ing to the upper and lower subunits of the type Areconstruction are both 0.55 (Fig. 4a). In the type Breconstruction, the correlation values between thefitted atomic structures and the 3-D maps of theupper and lower subunits are both 0.67 (Fig. 4b). Allother orientations of the atomic structure in each 3-Dmap resulted in lower correlations. Fits of the atomicstructure into the 3-D maps in an upside-downorientation, or with a 90° rotation around thevertical axis in an upright or upside-down orienta-tion, gave lower correlation values (∼10% lower),which enabled the polarity of the reconstructions tobe determined (Fig. 4a and b). Furthermore, thealternative orientations of the subunits do not satisfythe spatial restraints on the angle and distancebetween adjacent subunits to be in donor-strandexchange. Alternate fits of the subunits have suchtilts and rotations that increase the distance betweenthe subunit and its N-terminal peptide that is indonor-strand exchange with the adjacent subunit.This further supports the determined polarity andrelative subunit position in the docked models.To compare the type A and type B conformations of
the Saf pilus, the two 3-D maps were aligned usingthe fits of the atomic structure in the upper subunits(Fig. 4c). By aligning the maps according to therotation matrix calculated for the fitted atomicstructure in the upper subunits, we were able toanalyse the differences in the position of the lowersubunits. Comparison of the fitted structures in the

179Structural Analysis of the Saf Pilus
lower subunit of the type A and B reconstructionsreveals that there is a 35° rotational difference aroundthe vertical axis between the two structures (Fig. 4c,
Fig. 4. Fitting of the crystal structure of the SafANtd2:ANteSemi-transparent rendered surface representation of the 3-Dmshowing the docking of two copies of the atomic resolution Sareconstructions. The four-residue linker wasmodelled betweenshown in cartoon representation and all termini are labelled (Nstructures of A and B maps are viewed from three orthogonasubunits, there is a 35° rotational difference around the verticalcoming out of the plane of the page (left). There is also a 7 Å trthe two lower subunits (middle).
right panel). The lower subunit of the two Saf pilusstructures also differ by an 11° rotation around theperpendicular axis coming out of the plane of the
complex into the type A and type B maps of the Saf pilus.ap of the type A and type B Saf pilus. (a and b) Stereo viewsfANtd2:ANte complex into the type A and type B Saf pilusthe subunits and energy-minimised. Crystal structures are-termini: N, N′, Nʺ; C-termini: C, C′, Cʺ). (c) The overlaidl directions. Analysis reveals that between the two loweraxis (right) and an 11° rotational difference around the axisanslational difference away from the vertical axis between
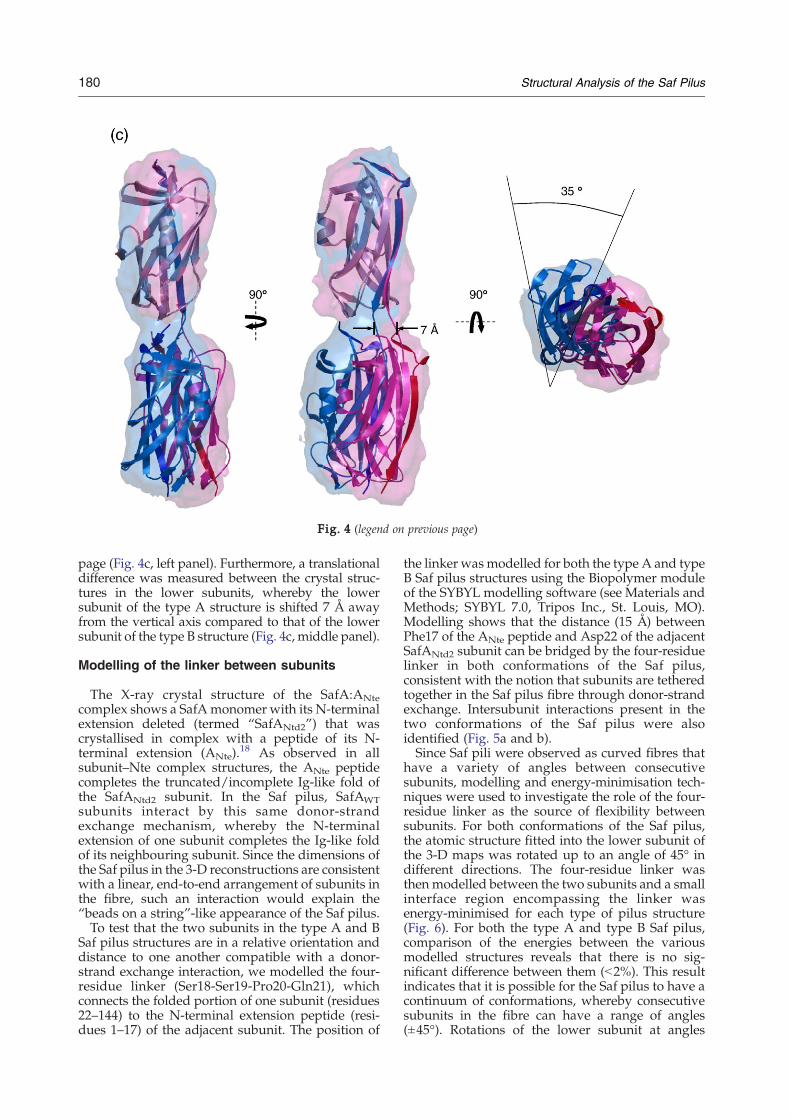
Fig. 4 (legend on previous page)
180 Structural Analysis of the Saf Pilus
page (Fig. 4c, left panel). Furthermore, a translationaldifference was measured between the crystal struc-tures in the lower subunits, whereby the lowersubunit of the type A structure is shifted 7 Å awayfrom the vertical axis compared to that of the lowersubunit of the type B structure (Fig. 4c, middle panel).
Modelling of the linker between subunits
The X-ray crystal structure of the SafA:ANtecomplex shows a SafA monomer with its N-terminalextension deleted (termed “SafANtd2”) that wascrystallised in complex with a peptide of its N-terminal extension (ANte).
18 As observed in allsubunit–Nte complex structures, the ANte peptidecompletes the truncated/incomplete Ig-like fold ofthe SafANtd2 subunit. In the Saf pilus, SafAWTsubunits interact by this same donor-strandexchange mechanism, whereby the N-terminalextension of one subunit completes the Ig-like foldof its neighbouring subunit. Since the dimensions ofthe Saf pilus in the 3-D reconstructions are consistentwith a linear, end-to-end arrangement of subunits inthe fibre, such an interaction would explain the“beads on a string”-like appearance of the Saf pilus.To test that the two subunits in the type A and B
Saf pilus structures are in a relative orientation anddistance to one another compatible with a donor-strand exchange interaction, we modelled the four-residue linker (Ser18-Ser19-Pro20-Gln21), whichconnects the folded portion of one subunit (residues22–144) to the N-terminal extension peptide (resi-dues 1–17) of the adjacent subunit. The position of
the linker was modelled for both the type A and typeB Saf pilus structures using the Biopolymer moduleof the SYBYL modelling software (see Materials andMethods; SYBYL 7.0, Tripos Inc., St. Louis, MO).Modelling shows that the distance (15 Å) betweenPhe17 of the ANte peptide and Asp22 of the adjacentSafANtd2 subunit can be bridged by the four-residuelinker in both conformations of the Saf pilus,consistent with the notion that subunits are tetheredtogether in the Saf pilus fibre through donor-strandexchange. Intersubunit interactions present in thetwo conformations of the Saf pilus were alsoidentified (Fig. 5a and b).Since Saf pili were observed as curved fibres that
have a variety of angles between consecutivesubunits, modelling and energy-minimisation tech-niques were used to investigate the role of the four-residue linker as the source of flexibility betweensubunits. For both conformations of the Saf pilus,the atomic structure fitted into the lower subunit ofthe 3-D maps was rotated up to an angle of 45° indifferent directions. The four-residue linker wasthen modelled between the two subunits and a smallinterface region encompassing the linker wasenergy-minimised for each type of pilus structure(Fig. 6). For both the type A and type B Saf pilus,comparison of the energies between the variousmodelled structures reveals that there is no sig-nificant difference between them (b2%). This resultindicates that it is possible for the Saf pilus to have acontinuum of conformations, whereby consecutivesubunits in the fibre can have a range of angles(±45°). Rotations of the lower subunit at angles

Fig. 5. Interface interactions between subunits in the type A and type B Saf pilus. Semi-transparent rendered surfacerepresentation of the 3-D map of the type A and type B Saf pilus. (a and b) Stereo views showing the interaction areabetween subunits at the interface for the type A and type B Saf pilus structures. SafANtd2:ANte crystal structures are shownin cartoon and line representation, and termini involved in interactions are labelled. Residues forming intersubunitinteractions are shown as sticks and are labelled. Interactions between residues are represented using dashed lines.
181Structural Analysis of the Saf Pilus
greater than 45° led to straining of the linker andclashes between consecutive subunits, which wasreflected in the elevated energies of the structuresranging from ∼7% to ∼65% for both types of pilus.This suggests that conformations of the Saf piluswith subunit angles b45° are thermodynamicallymore favourable, hence more likely to be observed
in physiological conditions. This prediction wastested bymeasurements of the trajectory of the fibreson the electron micrographs (Fig. 7). The majority ofpili observed in the electron micrographs werecomposed of consecutive subunits with the anglesbetween them measuring b45°. The range of anglesbetween consecutive subunits of the Saf pili in the

Fig. 6. Analysis of linker flexibility through modelling and energy minimisation. Semi-transparent rendered surface representation of the 3-D map of the type A and type B Safpilus. Analysis of the flexibility of the four-residue linker reveals that a continuum of conformations of the Saf pilus is possible, although the tilts with intersubunit angles b45° arethermodynamically more favourable than those with angles N45°. (a and b) Modelled conformations of the type A Saf pilus shown with the electron density and fittedconformation seen in Fig. 4a. (c and d) Stereo views showing the linker areas (enlarged). (e and f) Modelled conformations of the type B Saf pilus shown with the electron densityand possible positions of the second subunit. (g and h) Stereo views showing the linkers in the type B structure (enlarged).
182StructuralA
nalysisof
theSaf
Pilus

Fig. 7. Modelling of the Saf pilus. The range of possibleangles between subunits of the type A and type B Saf pilusat the fixed length of the four-residue linker was iden-tified. This enabled the simulation of the 3-D organisationof a Saf pilus observed on an electron micrograph. (a)Semi-transparent rendered surface representation of the 3-D map of a modelled Saf pilus showing a variety of anglesbetween consecutive subunits permitted by the donor-strand exchange interaction. SafANtd2:ANte crystal struc-tures are shown in cartoon representation. (b) An electronmicrograph image of a curvy Saf pilus (left and centre)revealing bead-like subunits, upon which the 3-D Safpilus in (a) was modelled. A pictorial representation ofthe Saf pilus (right). Yellow ovals outline the position ofthe SafA subunits. Blue, green, orange and pink linesindicate the orientation of the subunits in the pilus.Measurements of the major angles between consecutivesubunits in the fibre were all b45° at 38°, 31° and 21°from top to bottom, respectively. The black scale barrepresents 10 nm.
183Structural Analysis of the Saf Pilus
images is 43° (Fig. 2a), which is in close agreement tothat determined by modelling at 45° (Fig. 6).
Discussion and Conclusions
The superstructure of the S. typhimurium Saf piluswas analysed by negative stain EM. Images of in vitrogrown Saf pili reveal the organelles consist ofextended linear fibres. The individual Saf fibresappear as highly curved threads consisting of bead-like subunits. The single-particle approach and 3-Dreconstruction were used to analyse the variation insubunit–subunit organisation in Saf pili. This resultedin six large reference groups, each representingbetween 12–21% of the data. Of these, two inter-subunit conformational states were refined, corre-sponding to 12% and 21% of the observedintersubunit contacts in the SafA fibres. The twostructures resolved represent two possible conforma-tions of the Saf pilus. Analysis of the two 3-Dreconstructions demonstrates the head-to-tail interac-
tion of discrete subunits, separated by short, ∼7 Ålinkers. The fitting of the SafANtd2:ANte complexstructure into the 3-D density suggested that theintersubunit density can easily accommodate thefour-residue linker sequence that connects the foldedportion of a subunit to itsN-terminal extension,whichis in donor strand exchange with the next subunit inrow. The two 3-D reconstructions show that subunitinterfaces in the SafA fibre consist of only limitedsurface–surface interactions (68 and 248 Å2 in type Aand type B, respectively), explaining the highconformational freedom observed. Modelling of thelink in the type A and B structures indicates theinterface can possess between three and six hydrogenbonds and one possible electrostatic interaction. Thedifference in the buried surface area between the twoconformations of the Saf pilus is reflected in theenergetic state of the structures. The type B Saf pilus isenergetically more favourable than the type A Safpilus. This prediction from modelling is supportedfrom the finding that compared to the type A Safpilus, the type B conformation has a larger number ofpotential interactions at the interface and constituted agreater proportion of observed pili (21%).Other than the present study, the only structural
information of the subunit–subunit interface in FGL-assembled pili comes from the X-ray structure of theCaf1′:Caf1”:CafM subunit–subunit–chaperone tern-ary complex of the Y. pestis F1 capsular antigen.17 Inthe F1 fibre, the interface comprises 127 Å2 and therelative subunit orientation is stabilised by threehydrogen bonds and a salt bridge. The F1 fibre wasmodelled as a helically wound filament based on arepetition of the subunit interface seen in the Caf1′:Caf1ʺ:CafM crystals. The subunit interface in our typeA and type B 3-D reconstructions of the Saf pilus iscomparable in size to that seen in the F1 crystalstructure and involves a similar amount of polarinteractions. However, single-particle analysis of theSaf pili revealed at least six conformationally differentgroups for the subunit–subunit interactions along thefibre, none ofwhichwas predominant. EM imaging ofother FGL-chaperone assembled organelles on wholebacteria26–29 also shows a high degree of flexibilityalong the fibres. Taken together, this suggests thesubunit–subunit interactions in this group of orga-nelles are not as rigid as suggested by an extrapolationof the Caf1′:Caf1ʺ unit in the F1 crystal structure.Rather, our modelling data suggest the polar interac-tions in the subunit interfaces are likely to adopt arange of different conformations along the fibre,resulting in the high level of flexibility and unstruc-tured nature seen in these organelles.Quantitative fitting of the atomic resolution
SafANtd2:ANte complex into the electron densitymaps, linker modelling and energy minimisation hasenabled analysis of subunit arrangement and inter-actions in the Saf pilus. The combined resultsdemonstrate the inherent flexibility of the Saf pilusabout the linker regions, which act as molecularhinges allowing a large range of movement betweenconsecutive subunits in the fibre. Although a possibleadhesive character of Saf pili is undocumented, most

184 Structural Analysis of the Saf Pilus
known FGL-chaperone assembled organelles appearto be “polyadhesins”.4 In these polyadhesins, the ad-hesive unit is formed by the main structural subunit(e.g. AfaE, DraE or DaaE in case of E. coli Afa/Dr-family adhesins) that forms the polymer.4,27,41–44 Itseems reasonable to speculate that the high conforma-tional freedom observed in FGL-assembled piliprovides the organelles with the flexibility requiredto reach their receptors on the host cell surface.The EM maps of the type A and type B Saf pilus
have been deposited in the macromolecular struc-ture database (EBI) with accession numbers EMD-1494 and EMD-1495, respectively. Fitted modelcoordinates of the type A and type B Saf pilushave been deposited to the Protein Data Bank (PDB)with entry codes 3CRE and 3CRF, respectively.
Materials and Methods
Expression and purification of Saf pili
S. enterica sv. Typhimurium LT2 SafB:SafA was cloned,expressed and purified as previously described for the non-polymerising SafA N-terminal deletion mutants.18 PurifiedSafB:SafA was brought to 20 mM Tris–HCl (pH 8.5) and150 mM NaCl to allow spontaneous SafA polymerisationovernight at ambient temperature. SafA polymers, non-polymerised SafB:SafA complex and the free chaperone,SafB, were separated by hydrophobic interaction chromato-graphy over a phenyl-Sepharose column, where SafApolymers elute at high salt concentrations (0.8 M ammo-nium sulphate). SafA polymers were further separated bysize and buffer-exchanged into 20 mMTris–HCl (pH 8) and100 mMNaCl over a Superose 6 size-exclusion column (GEHealthcare). Fractions corresponding to a calculated poly-mer size of 20–50 units were pooled and concentrated to afinal concentration of 1 mg/ml.
Electron microscopy
Protein concentrations ranging from 0.25 to 0.035 mg/mlwere examined to identify those that gave monodispersedpili. Successful conditions for single-particle imaging of Safpili required the protein to bediluted to a final concentrationof 56 μg/ml in 10 mMTris–HCl (pH 8) and 10 mMNaCl. A5-μl aliquot of the solution was applied to glow-discharged,continuous-carbon films on copper grids with a 400-squaremesh. Excess solutionwas partially blotted after 10 s to leavea thin film and 3 μl of 2% ammonium molybdate (pH 7.4)was applied to the grid to negatively stain the Saf pili. Thefinal protein concentration on the grid was ∼35 μg/ml.After 5 s, the solution was blotted completely and the gridswere left overnight to dry. Electron microscopy was carriedout using the Philips Tecnai 100-kV electron microscope.Approximately 130 micrographs were recorded at amagnification of 44,000× and a defocus range of 400 to900 nm was used. All images were exposed with a lowelectron dose. Micrographs where checked for astigmatismand drift on an optical diffractometer prior to digitisation.
Image processing
Densitometry of the best micrographs was performedusing a step size of 7 μm on the densitometer, Zeiss-SCAI,
or 1.59 Å/pixel at the specimen level. Analysis of defocusand contrast transfer function (CTF) using the MedicalResearch Council (MRC) program CTFFIND345 andIMAGIC-546 showed that the first zero corresponds to∼13–15 Å. The aim of this study was to determine the 3-Dstructure of the Saf pilus, to identify the arrangement ofthe subunits in the fibre and analyse the extent of theirflexibility. Since a moderate-resolution 3-D reconstructionof the Saf pilus would be sufficient to achieve this aim andas the resolution of the structure was not expected to behigher than 10 Å, CTF corrections were not performed.A total of 10,022 pilus segmentsweremanually selected at
∼3-nm intervals using the MRC program Ximdisp47 andwindowed into 128×128 pixel images. Images were band-pass filtered at 15–200 Å to remove background, andnormalised. The pilus segments were then translationallyand rotationally aligned to a soft-edged, vertical rectanglewith a 3-nm width that corresponds to the width of the Safpili measured in the images. Following alignment, the pilussegments were classified by MSA, which sorts the imagesinto class averages with similar features. The class averagesobtained have an improved signal-to-noise ratio andrepresent characteristic molecular views of the Saf pilus.Most class averages showed Saf pili with distinct, subunit-like features. Subsequent iterations of alignments and MSAclassification led to homogeneous class averages displayingSaf pili with evident globular subunits arranged sequen-tially, and with discernible subunit features. A controlexperiment was performed to test whether the extended,linear fibres selected were not artefacts due to noise. Over5000 frames of the same size were randomly selected fromareas with no visible Saf pili and subjected to the sameprocedure: centring and statistical analysis. Subsequentclassification led to class averages (∼20 images per class)with no discernible fibres, just random noise.The initial model was determined from four side views
of the Saf pilus and one end view. As a first approximation,the end view was taken as a rotationally symmetrisedaverage. The 3-D map was then refined using additionalclasses displaying side views and a reprojection of thereconstruction along the z-axis as the end view. Iterativerefinement of this structure led to the identification ofdifferent Saf pilus states and the 3-D reconstruction of thetype A and type B conformation of the fibre. 3-D maps ofthe Saf pilus were calculated using the exact-filter back-projection algorithm.48 Reprojections were compared forconsistencywith input class averages to check the accuracyof the Euler angles assigned to the class averages.37
A tomographic approachwas used to refine the structure.This involved generating a “belt” of reprojections aroundaveraged Saf pilus models. The reprojections attained werethen used as references for a comprehensive MRA37 of thepilus segments, which refined their in-plane position androtation. Orientations of the pilus segments were refined bygenerating “anchor set” reprojections of the 3-D map overdifferent angle directions.49 Angle determination withrespect to anchor set reprojections enabled refinement ofthe angular orientations and led to an improved 3-Dreconstruction of the Saf pilus. Image processing of Saf piliwas performed using software packages IMAGIC-546 andSPIDER.50 The structures were refined by iterating proce-dures of alignment and classification, and the final 3-Dmaps of the fibres were obtained at 17 Å resolution usingthe 0.5 threshold of the Fourier shell correlation function.48
3-D visualisation
3-D-rendered surface representations were visualised inPyMOL39 and UCSF Chimera.51 The 3-D maps were

185Structural Analysis of the Saf Pilus
contoured using threshold levels that correspond to themolecular mass for two SafA subunits (∼28.8 kDa),assuming a specific density of 0.83 Da/Å.
Docking
The initial fit of the atomic structure into each separatesubunit of the 3-D electron density maps was performedmanually using PyMOL.39 The fitting was refined usingURO.40 Since URO searches local minima only, the qualityof the fitting was checked using several starting points forthe atomic coordinates of the model. The final fits of the X-ray crystal structure presented in the paper have thehighest correlation with the 3-D electron density maps.The results of the automatic fits produced using UROwere visualised in PyMOL.
Modelling
The four-residue linker (Ser18-Ser19-Pro20-Gln21) wasmodelled for both pilus types using the Biopolymermodule of the SYBYL modelling software (SYBYL 7.0,Tripos Inc.). Several solutions for the conformation of theshort linking sequence were identified by SYBYL. For eachpilus type, the solution with the greatest homologybetween the linker sequence and known structures inthe protein database was selected for incorporationbetween the two fitted subunits of the SafANtd2:ANtecrystal structure. Residues within the subunit-interfaceregion were analysed by conjugate gradient energyminimisation in SYBYL, using the Tripos force-field52
and AMBER charges.53 Each subunit-interface region wasenergy-minimised using 1000 steps of iteration until thetotal energy of the system was at its lowest, havingreached a plateau, and represented one of the mostthermodynamically favoured conformations.PROCHECK54 was used to inspect the stereochemical
quality of the two final models for the type A and B Safpilus structures. All residues fell into the appropriateallowed regions of the Ramachandran plot for bothstructures, indicating that the phi (φ) and psi (ψ) torsionangles of every residue in the structures are stericallypermitted. Since there are no clashes between the atoms inspace, the final models generated here represent twopossible conformations of the Saf pilus.The buried surface area of the interface between the two
SafA subunits of the type A and B Saf pilus and the twoCaf1 subunits of the F1 capsular antigen was calculatedusing PISA (protein interfaces, surfaces and assemblies),‡European Bioinformatics Institute.55
Acknowledgements
We thank David Houldershaw, Richard Westlakeand Patrick Cates for computer and softwaresupport, and Luchun Wang for help and supportwith electron microscopy. This work was funded byNIH grant AI49950 and MRC grant 58149 to G.W.
‡http://www.ebi.ac.uk/msd-srv/prot_int/pistart.html
References
1. Thanassi, D. G., Saulino, E. T. & Hultgren, S. J. (1998).The chaperone/usher pathway: a major terminalbranch of the general secretory pathway. Curr. Opin.Microbiol. 1, 223–231.
2. Thanassi, D. G. & Hultgren, S. J. (2000). Assembly ofcomplex organelles: pilus biogenesis in gram-negativebacteria as a model system. Methods, 20, 111–126.
3. Sauer, F. G., Remaut, H., Hultgren, S. J. & Waksman,G. (2004). Fiber assembly by the chaperone-usherpathway. Biochim. Biophys. Acta, 1694, 259–267.
4. Zavialov, A., Zav'yalova, G., Korpela, T. & Zav'ya-lov, V. (2007). FGL chaperone-assembled fimbrialpolyadhesins: anti-immune armament of Gram-negative bacterial pathogens. FEMS Microbiol. Rev.31, 478–514.
5. Sauer, F. G., Mulvey, M. A., Schilling, J. D., Martinez,J. J. & Hultgren, S. J. (2000). Bacterial pili: molecularmechanisms of pathogenesis. Curr. Opin. Microbiol. 3,65–72.
6. Thanassi, D. G. & Hultgren, S. J. (2000). Multiplepathways allow protein secretion across the bacterialouter membrane. Curr. Opin. Cell Biol. 12, 420–430.
7. Driessen, A. J., Fekkes, P. & Van Der Wolk, J. P. (1998).The Sec system. Curr. Opin. Microbiol. 1, 216–222.
8. Sauer, F. G., Barnhart, M., Choudhury, D., Knight,S. D., Waksman, G. & Hultgren, S. J. (2000).Chaperone-assisted pilus assembly and bacterialattachment. Curr. Opin. Struct. Biol. 10, 548–556.
9. Jones, C. H., Pinkner, J. S., Nicholes, A. V., Slonim, L. N.,Abraham, S. N. & Hultgren, S. J. (1993). FimC is aperiplasmic PapD-like chaperone that directs assemblyof type 1 pili in bacteria. Proc. Natl. Acad. Sci. USA, 90,8397–8401.
10. Kuehn, M. J., Ogg, D. J., Kihlberg, J., Slonim, L. N.,Flemmer, K., Bergfors, T. & Hultgren, S. J. (1993).Structural basis of pilus subunit recognition by thePapD chaperone. Science, 262, 1234–1241.
11. Jones, C. H., Danese, P. N., Pinkner, J. S., Silhavey, T. J.& Hultgren, S. J. (1997). The chaperone-assistedmembrane release and folding pathway is sensedby two signal transduction systems. EMBO J. 16,6394–6406.
12. Thanassi, D. G., Saulino, E. T., Lombardo, M.-J., Roth,R., Heuser, J. & Hultgren, S. J. (1998). The PapC usherforms an oligomeric channel: implications for pilusbiogenesis across the outer membrane. Proc. Natl.Acad. Sci. USA, 95, 3146–3151.
13. Saulino, E. T., Bullitt, E. & Hultgren, S. J. (2000).Snapshots of usher-mediated protein secretion andordered pilus assembly. Proc. Natl. Acad. Sci. USA, 97,9240–9245.
14. Sauer, F. G., Futterer, K., Pinkner, J. S., Dodson, K.,Hultgren, S. J. & Waksman, G. (1999). Structural basisof chaperone function and pilus biogenesis. Science,285, 1058–1061.
15. Choudhury, D., Thompson, A., Stojanoff, V., Langer-mann, S., Pinkner, J., Hultgren, S. J. & Knight, S. D.(1999). X-ray structure of the FimC–FimH chaperone–adhesin complex from uropathogenic Escherichia coli.Science, 285, 1061–1066.
16. Sauer, F. G., Pinkner, J. S.,Waksman, G. &Hultgren, S. J.(2002). Chaperone priming of pilus subunits facilitates atopological transition that drives fiber formation. Cell,111, 543–551.
17. Zavialov, A. V., Berglund, J., Pudney, A. F., Fooks, L. J.,Ibrahim, T. M., MacIntyre, S. & Knight, S. D. (2003).Structure and biogenesis of the capsular F1 antigen
186 Structural Analysis of the Saf Pilus
from Yersinia pestis: preserved folding energy drivesfiber formation. Cell, 113, 587–596.
18. Remaut, H., Rose, R. J., Hannan, T. J., Hultgren, S. J.,Radford, S. E., Ashcroft, A. E. & Waksman, G. (2006).Donor-strand exchange in chaperone-assisted pilusassembly proceeds through a concerted β stranddisplacement mechanism. Mol. Cell, 22, 831–842.
19. Hung, D. L., Knight, S. D., Woods, R. M., Pinkner, J. S.& Hultgren, S. J. (1996). Molecular basis of twosubfamilies of immunoglobulin-like chaperones.EMBO J. 15, 3792–3805.
20. Kuehn, M. J., Heuser, J., Normark, S. & Hultgren, S. J.(1992). P pili in uropathogenic E. coli are compositefibres with distinct fibrillar adhesive tips. Nature, 356,252–255.
21. Jones, C. H., Pinkner, J. S., Roth, R., Heuser, J.,Nicholes, A. V., Abraham, S. N. & Hultgren, S. J.(1995). FimH adhesin of type 1 pili is assembled into afibrillar tip structure in the Enterobacteriaceae. Proc.Natl. Acad. Sci. USA, 92, 2081–2085.
22. Hahn, E., Wild, P., Hermanns, U., Sebbel, P., Glock-shuber, R., Häner, M. et al. (2002). Exploring the 3Dmolecular architecture of Escherichia coli type 1 pili.J. Mol. Biol. 323, 845–857.
23. Soto, G. E. & Hultgren, S. J. (1999). Bacterial adhesins:common themes and variations in architecture andassembly. J. Bacteriol. 181, 1059–1071.
24. Ahrens, R., Ott, M., Ritter, A., Hoschützky, H.,Bühler, T., Lottspeich, F. et al. (1993). Genetic analysisof the gene cluster encoding nonfimbrial adhesin Ifrom an Escherichia coli uropathogen. Infect. Immun.61, 2505–2512.
25. Garcia, M. I., Labigne, A. & LeBouguenec, C. (1994).Nucleotide sequence of the afimbrial-adhesin-encod-ing afa-3 gene cluster and its translocation via flankingIS1 insertion sequences. J. Bacteriol. 176, 7601–7613.
26. Gounon, P., Jouve, M. & Le Bouguénec, C. (2000).Immunocytochemistry of the AfaE adhesin and AfaDinvasin produced by pathogenic Escherichia coli strainsduring interaction of the bacteria with HeLa cells byhigh-resolution scanning electron microscopy. Microb.Infect. 2, 359–365.
27. Keller, R., Ordoñez, J. G., de Oliveira, R. R., Trabulsi,L. R., Baldwin, T. J. & Knutton, S. (2002). Afa, adiffuse adherence fibrillar adhesin associated withenteropathogenic Escherichia coli. Infect. Immun. 70,2681–2689.
28. Zavialov, A. V., Kersley, J., Korpela, T., Zav'yalov, V. P.,MacIntyre, S. & Knight, S. D. (2002). Donor strandcomplementationmechanism in the biogenesis of non-pilus systems. Mol. Microbiol. 45, 983–995.
29. Anderson, K. L., Billington, J., Pettigrew, D., Cota, E.,Simpson, P., Roversi, P. et al. (2004). An atomicresolution model for assembly, architecture, andfunction of the Dr adhesins. Mol. Cell. 15, 647–657.
30. Clouthier, S. C., Müller, K. H., Doran, J. J.,Collinson, S. K. & Kay, W. W. (1993). Characteriza-tion of three fimbrial genes, sefABC, of Salmonellaenteritidis. J. Bacteriol. 175, 2523–2533.
31. Iriarte, M., Vanooteghem, J. C., Delor, I., Díaz, R.,Knutton, S. & Cornelis, G. R. (1993). The Myf fibrillaeof Yersinia enterocolitica. Mol. Microbiol. 9, 507–520.
32. Folkesson, A., Advani, A., Sukupolvi, S., Pfeifer, J. D.,Normark, S. & Löfdahl, S. (1999). Multiple insertionsof fimbrial operons correlate with the evolution ofSalmonella serovars responsible for human disease.Mol. Microbiol. 33, 612–622.
33. Strindelius, L., Folkesson, A., Normark, S. & Sjöholm,I. (2004). Immunogenic properties of the Salmonella
atypical fimbriae in BALB/c mice. Vaccine, 22,1448–1456.
34. Hoschützky, H., Lottspeich, F. & Jann, K. (1989).Isolation and characterization of the alpha-galacto-syl-1,4-beta-galactosyl-specific adhesin (P adhesin)from fimbriated Escherichia coli. Infect. Immun. 57,76–81.
35. Verger, D., Bullitt, E., Hultgren, S. J. & Waksman, G.(2007). Crystal structure of the P pilus rod subunitPapA. PLoS Pathog. 3, 674–682.
36. van Heel, M. (1984). Multivariate statistical classifica-tion of noisy images (randomly oriented biologicalmacromolecules). Ultramicroscopy, 13, 165–183.
37. van Heel, M., Gowen, B., Matadeen, R., Orlova, E. V.,Finn, R., Pape, T. et al. (2000). Single-particle electroncryo-microscopy: towards atomic resolution. Q. Rev.Biophys. 33, 307–369.
38. van Heel, M. (1987). Angular reconstitution: a poster-iori assignment of projection directions for 3Dreconstruction. Ultramicroscopy, 21, 111–124.
39. DeLano, W. L. (2005). The PyMOL Molecular GraphicsSystem. DeLano Scientific LLC, South San Francisco,CA.
40. Navaza, J., Lepault, J., Rey, F. A., Alvarez-Rua, C. &Borge, J. (2002). On the fitting of model electrondensities into EM reconstructions: a reciprocal-spaceformulation. Acta Crystallogr., Sect. D: Biol. Crystallogr.58, 1820–1825.
41. Guignot, J., Peiffer, I., Bernet-Camard, M. F., Lublin,D., Carnoy, C., Moseley, S. L. & Servin, A. L. (2000).Recruitment of CD55 and CEACAM5 brush border-associated glycosylphosphatidylinositol-anchoredproteins by members of the Afa/Dr diffusely-adher-ing Escherichia coli family infecting the humanpolarized intestinal Caco-2/TC7. Infect. Immun. 68,3554–3563.
42. Van Loy, C. P., Sokurenko, E. V. & Moseley, S. L.(2002). The major structural subunits of Dr andF1845 fimbriae are adhesins. Infect. Immun. 70,1694–1702.
43. Berger, C. N., Billker, O., Meyer, T. F., Servin, A. L. &Kansau, I. (2004). Differential recognition of membersof the carcinoembryonic antigen family by Afa/Dradhesins of diffusely adhering Escherichia coli (Afa/DrDAEC). Mol. Microbiol. 52, 963–983.
44. Piatek, R., Zalewska, B., Kolaj, O., Ferens, M., Now-icki, B. & Kur, J. (2005). Molecular aspects ofbiogenesis of Escherichia coli Dr fimbriae: characteriza-tion of DraB–DraE complexes. Infect. Immun. 73,135–145.
45. Mindell, J. A. & Grigorieff, N. (2003). Accuratedetermination of local defocus and specimen tilt inelectron microscopy. J. Struct. Biol. 142, 334–347.
46. van Heel, M., Harauz, G., Orlova, E. V., Schmidt, R.& Schatz, M. (1996). A new generation of theIMAGIC image processing system. J. Struct. Biol.116, 17–24.
47. Crowther, R. A., Henderson, R. & Smith, J. M. (1996).MRC image processing programs. J. Struct. Biol. 116,9–16.
48. Harauz, G. & van Heel, M. (1986). Exact filters forgeneral geometry three-dimensional reconstruction.Optik, 73, 146–156.
49. Schatz, M., Orlova, E. V., Dube, P., Jager, J. & van Heel,M. (1995). Structure of Lumbricus terrestris hemoglobinat 30 Å resolution determined using angular recon-stitution. J. Struct. Biol. 114, 28–40.
50. Frank, J., Radermacher, M., Penczek, P., Zhu, J., Li, Y.,Ladjadj, M. & Leith, A. (1996). SPIDER and WEB:

187Structural Analysis of the Saf Pilus
processing and visualization of images in 3D electronmicroscopy and related fields. J. Struct. Biol. 116,190–199.
51. Pettersen, E. F., Goddard, T. D., Huang, C. C., Couch,G. S., Greenblatt, D. M., Meng, E. C. & Ferrin, T. E.(2004). UCSF Chimera—a visualization system forexploratory research and analysis. J. Comput. Chem.25, 1605–1612.
52. Clark, M., Cramer, R. D. & van Opdenbosch, N.(1989). Validation of the general purpose Tripos 5.2force field. J. Comput. Chem. 10, 982–1012.
53. Weiner, S. J., Kollman, P. A., Case, D. A., Singh, U. C.,Ghio, C., Alagona, G. et al. (1984). A new force-fieldfor molecular mechanical simulation of nucleic acidsand proteins. J. Am. Chem. Soc. 106, 765–784.
54. Laskowski, R. A., MacArthur, M. W., Moss, D. S. &Thornton, J. M. (1993). PROCHECK: a program tocheck the stereochemical quality of protein structures.J. Appl. Crystallogr. 26, 283–291.
55. Krissinel, E. & Henrick, K. (2007). Inference of macro-molecular assemblies from crystalline state. J. Mol. Biol.372, 774–797.