Embed Size (px)
Citation preview

Structural Analysis
Apurva Mehta

Physics of Diffraction
X-ray Lens not very good
Mathematically
Intersection of
Ewald sphere with Reciprocal Lattice

outline
Information in a Diffraction pattern
Structure Solution
Refinement Methods
Pointers for Refinement quality data

What does a diffraction pattern tell us?
Peak Shape & Width:crystallite sizeStrain gradient
Peak Positions:Phase identificationLattice symmetryLattice expansion
Peak Intensity:Structure solutionCrystallite orientation

Sample Diffraction
a
asin (e
itF(
e it + i
F(
e it + i3
e it + i2F(
F(
e it + in
F(
e it + in
F(A =
A = F e i n
e it
A(e niasin(
= FT(a)
eit
Laue’s Eq.
A = cos(n i
sin(n)

Sample Diffraction
= x *
Diffraction Pattern ~ {FT(sample) } {FT(sample) }
Sample size (S) Infinite Periodic
Lattice (P)
Motif
(M)

Sample Diffraction
FT(Sample) = FT((S x P)*M)
Convolution theorem
FT(Sample) = FT(S x P) x FT(M)
FT(Sample) = (FT(S) * FT(P)) x FT(M)

FT(S)
X
Y

FT(P)

FT (S x P) = FT(S) * FT(P)
*
=
y
x

FT(M)

FT(sample) = FT(S x P) x FT(M)Along X direction
xX

What does a diffraction pattern tell us?
Peak Shape & Width:crystallite sizeStrain gradient
Peak Positions:Phase identificationLattice symmetryLattice expansion
Peak Intensity:Structure solutionCrystallite orientation

Structure Solution
Single Crystal Protein Structure
Sample with heavy Z problems Due to
Absorption/extinction effects
Mostly used in Resonance mode
Site specific valence Orbital ordering.
Powder Due to small crystallite size
kinematic equations valid
Many small molecule structures obtained via synchrotron diffraction
Peak overlap a problem – high resolution setup helps
Much lower intensity – loss on super lattice peaks from small symmetry breaks. (Fourier difference helps)

Diffraction from Crystalline Solid
Long range order ----> diffraction pattern periodic crystal rotates ----> diffraction pattern rotates
Pink beam laue pattern
Or intersection of a large Ewald Sphere with RL

From 4 crystallites

From Powder

Powder Pattern
Loss of angular information
Not a problem as peak position = fn(a, b &
Peak Overlap :: A problem But can be useful for
precise lattice parameter measurements
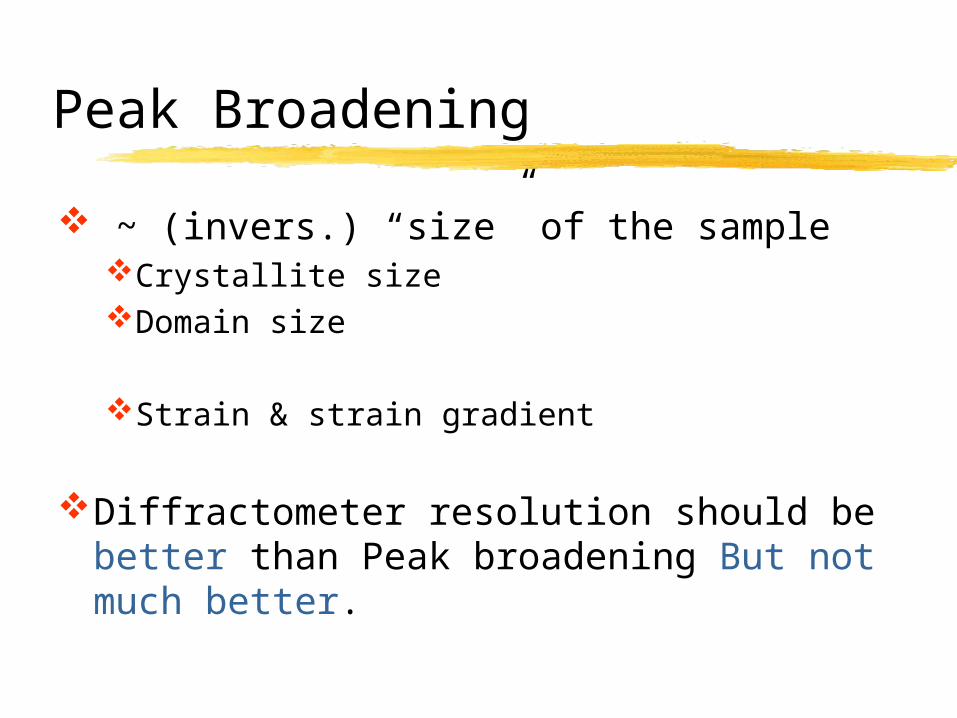
Peak Broadening
~ (invers.) “size” of the sampleCrystallite sizeDomain size
Strain & strain gradient
Diffractometer resolution should be better than Peak broadening But not much better.

Diffractometer Resolution
Wd2 = M2 x b
2 + s2
M= (2 tan tan m -tan a/ tan m -1)
Where
b
= divergence of the incident beam,
s = cumulative divergences due to slits and apertures
a and
m = Bragg angle for the sample, analyzer and the monochromator
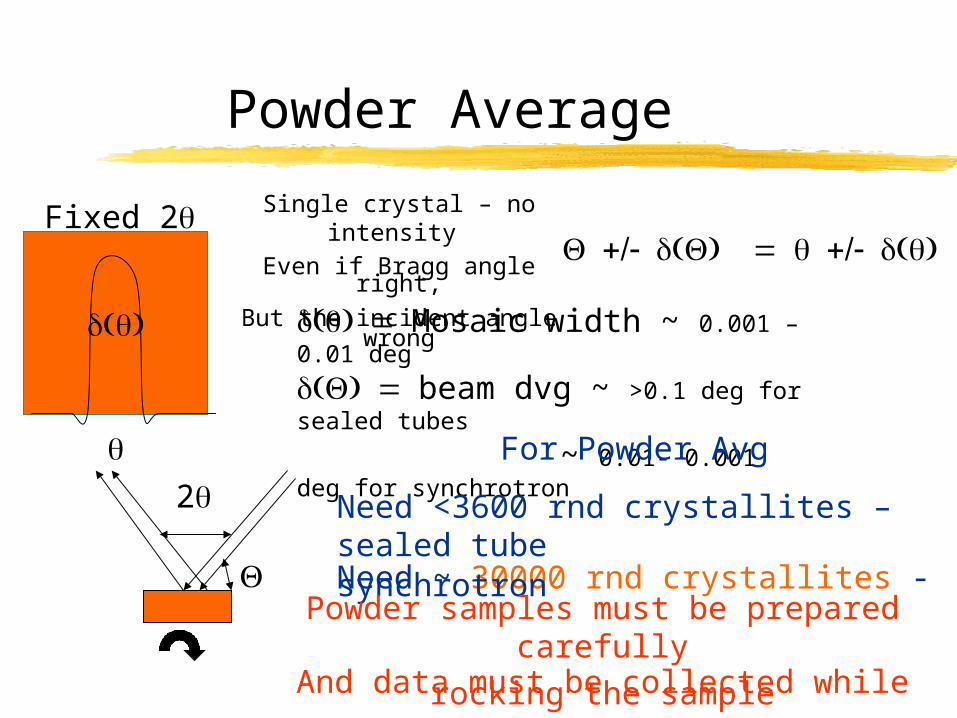
Powder Average
Fixed 2
2
Single crystal – no intensity
Even if Bragg angle right,
But the incident angle wrong
Mosaic width ~ 0.001 – 0.01 deg
beam dvg ~ >0.1 deg for sealed tubes
~ 0.01- 0.001 deg for synchrotron For Powder Avg
Need <3600 rnd crystallites – sealed tubeNeed ~ 30000 rnd crystallites - synchrotron
Powder samples must be prepared carefullyAnd data must be collected while rocking the sample

Physics of Diffraction
No X-ray Lens
Mathematically

Phase Problem
xyz = hkl Fhkl exp(-2i{hx + ky + lz})
Fhkl is a Complex quantity
Fhkl(fi, ri): (Fhkl)2 = Ihkl/(K*Lp*Abs)
xyz = hkl CIhkl exp(-) = phase unknown
Hence Inverse Modeling

Solution to Phase Problem
Must be guessedAnd then refined.
How to guess?Heavy atom substitution, SAD or MADSimilarity to homologous compounds
Patterson function or pair distribution analysis.

Procedure for Refinement/Inverse Modeling
Measure peak positions:Obtain lattice symmetry and point group
Guess the space group. Use all and compare via F-factor analysis
Guess the motif and its placementPhases for each hkl
Measure the peak widthsUse an appropriate profile shape function
Construct a full diff. pattern and compare with measurements

Inverse Modeling Method 1
Reitveld Method Data
Model Refined Structure
40 60 80 100 120 140 160
0
1000
2000
3000
4000
5000
6000
7000
Inte
nsity
Profile shape
Background

Inverse Modeling Method 2
Fourier Method Data
Model Refined Structure
40 60 80 100 120 140 160
0
1000
2000
3000
4000
5000
6000
7000
Inte
nsity
Profile shape
Backgroundsubtract
phases
Integrated Intensities

Inverse Modeling Methods
Rietveld Method More precise Yields Statistically
reliable uncertainties
Fourier Method Picture of the real space Shows “missing” atoms,
broken symmetry, positional disorder
Should iterate between Rietveld and Fourier.Be skeptical about the Fourier picture if Rietveld
refinement does not significantly improve the fit with the “new” model.

Need for High Q
Many more reflections at higher Q.
Therefore, most of the structural information is at higher Q

Profile Shape function
EmpiricalVoigt function modified for axial
divergence (Finger, Jephcoat, Cox)Refinable parameters – for crystallite size,
strain gradient, etc…
From Fundamental Principles

Collect data on Calibrant under the same conditions
Obtain accurate wavelength and diffractometer misalignment parameters
Obtain the initial values for the profile function (instrumental only parameters)
Refine polarization factor
Tells of other misalignment and problems

Selected list of Programs
CCP14 for a more complete listhttp://www.ccp14.ac.uk/mirror/want_to_do.html
GSASFullprofDBWMAUD
Topaz – not free - Bruker – fundamental approach

Structure of MnO
40 60 80 100 120 140 160-1000
0
1000
2000
3000
4000
5000
6000
7000
MnO @ 6530eV
structural fit
72 74 76
0
2000
Inte
ns
ity
2
Inte
nsi
ty
2
Scatteringdensity
fMn(x,y,z,T,E)
fO(x,y,z,T,E)

Resonance Scattering
Fhkl = xyz fxyz exp(2i{hx + ky + lz})
40 60 80 100 120 140 160
0
1000
2000
3000
4000
5000
6000
7000
Inte
nsi
ty
fxyz = scattering densityAway from absorption edge
electron density

Anomalous Scattering Factors
fxyz = fe{fixyzT} fe = Thomson scattering for an
electron
fi = fi0(q) + fi’(E) + i fi”(E)
(E) = E * fi”(E)Kramers -Kronig :: fi’(E) <->
fi”(E) dEEfEfEE
E
0
0 20
2)("2
)('

Resonance Scattering vs Xanes
6440 6460 6480 6500 6520 6540 6560 6580 6600-13
-12
-11
-10
-9
-8
-7
-6
-5
-4
-3
-2
from KK transform of XANES
from resonance scattering
MnO2
f'
Energy(eV)6500 6520 6540 6560 6580 6600
0.0
0.2
0.4
0.6
0.8
1.0
=
f"/
E
Energy (eV)
40 60 80 100 120 140
0
1000
2000
3000
4000
5000
6000
7000
Inte
nsi
ty
2
40 60 80 100 120 140
0
1000
2000
3000
4000
5000
6000
7000
8000
9000
Inte
nsi
ty
2
40 60 80 100 120 140
0
1000
2000
3000
4000
5000
Inte
nsity
2
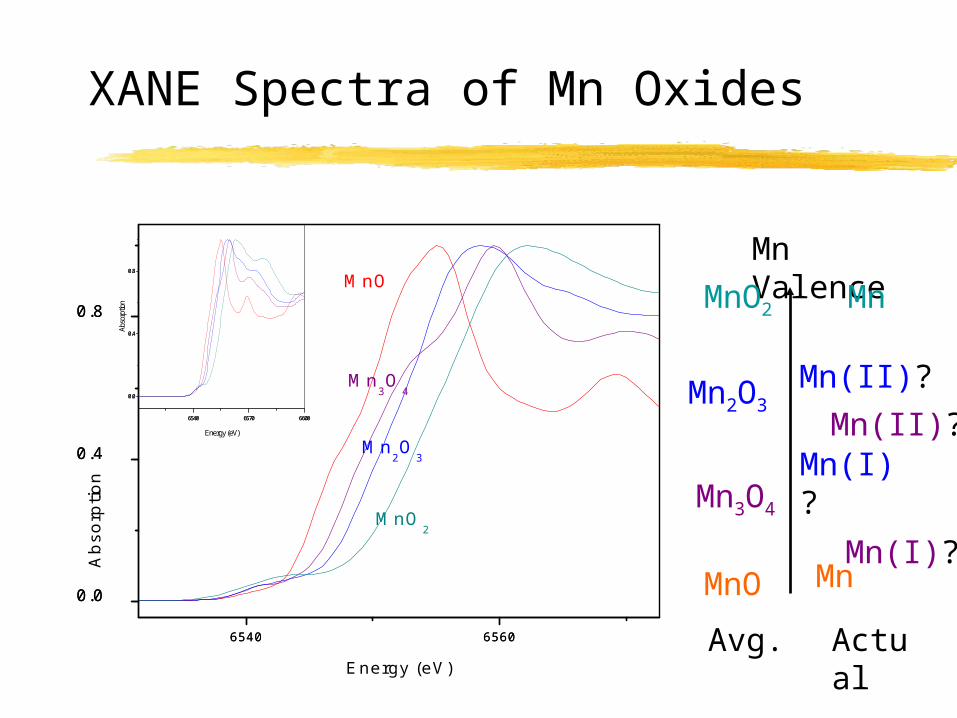
XANE Spectra of Mn Oxides
6540 6560
0.0
0.4
0.8
6540 6560
0.0
0.4
0.8
MnO2
Mn2O
3
Mn3O
4
MnO
6540 6570 6600
0.0
0.4
0.8
6540 6570 6600
0.0
0.4
0.8
Abso
rptio
n
Energy (eV)
Abs
orpt
ion
Energy (eV)
Mn Valence
MnO
MnO2
Avg. Actual
Mn
Mn
Mn(II)?
Mn(I)?Mn(II)?
Mn(I)?
Mn3O4
Mn2O3

F’ for Mn Oxides
6450 6500 6550
-9
-6
-3
f' (e
lect
rons
)
Energy (eV)
6530 6540 6550 6560
-10
-8
-6
MnO2
Mn2O
3:1
Mn2O
3:2
Mn3O
4:2
Mn3O
4:1
MnO
Cromer-Liberman Mn
f' (
ele
ctr
on
s)
Energy (eV)

Why Resonance Scattering?
Sensitive to a specific crystallographic phase. (e.g., can
investigate FeO layer growing on metallic Fe.)Sensitive to a specific
crystallographic site in a phase. (e.g., can investigate the tetrahedral and the
octahedral site of Mn3O4)

Mn valences in Mn Oxides
6540 6544 6548 6552 6556
0
CL
d(f')
/dE
X Axis Title
•Mn valence of the two sites in Mn2O3 very similar
•Valence of the two Mn sites in Mn3O4 different but not as different as expected.
6460 6480 6500 6520 6540
-9
-8
-7
-6
-5
-4
-3
A. Mehta, A. Lawson, and J. Arthur
Mn3O
4
f'
Energy (eV)
Mn1 Mn2