Embed Size (px)
Citation preview
Sensors 2013, 13, 12070-12092; doi:10.3390/s130912070
sensors ISSN 1424-8220
www.mdpi.com/journal/sensors
Article
Strontium-Doped Hematite as a Possible Humidity Sensing
Material for Soil Water Content Determination
Jean-Marc Tulliani 1,*, Chiara Baroni
1, Laura Zavattaro
2 and Carlo Grignani
2
1 Department of Applied Science and Technology, Politecnico di Torino, C.so Duca degli Abruzzi 24,
10129 Torino, Italy; E-Mail: [email protected] 2
Department of Agricultural, Forest and Food Sciences, Università di Torino,
Via Leonardo da Vinci, 44, 10095 Grugliasco, Italy; E-Mails: [email protected] (L.Z.);
[email protected] (C.G.)
* Author to whom correspondence should be addressed; E-Mail: [email protected];
Tel.: +39-011-090-4700; Fax: +39-011-090-4624.
Received: 22 July 2013; in revised form: 21 August 2013 / Accepted: 26 August 2013 /
Published: 10 September 2013
Abstract: The aim of this work is to study the sensing behavior of Sr-doped hematite for
soil water content measurement. The material was prepared by solid state reaction from
commercial hematite and strontium carbonate heat treated at 900 °C. X-Ray diffraction,
scanning electron microscopy and mercury intrusion porosimetry were used for microstructural
characterization of the synthesized powder. Sensors were then prepared by uniaxially
pressing and by screen-printing, on an alumina substrate, the prepared powder and
subsequent firing in the 800–1,000 °C range. These sensors were first tested in a laboratory
apparatus under humid air and then in an homogenized soil and finally in field. The results
evidenced that the screen printed film was able to give a response for a soil matric potential
from about 570 kPa, that is to say well below the wilting point in the used soil.
Keywords: hematite; strontium hexaferrite; humidity sensor; soil water content determination
1. Introduction
It is well known that only 2.5% of global water resources is potentially available for human, animal
and plant consumption, while the remaining 97.5% resides in the oceans [1]. Water for irrigation
constitutes one of the greatest pressures on freshwater resources. Agriculture accounts for about 70%
OPEN ACCESS
Sensors 2013, 13 12071
of global freshwater withdrawals (reaching up to 90% in some fast-growing economies), while it is
generally reported that approximately 20% of the world’s freshwater withdrawals are used by industry,
although this varies between regions and countries, and 10% by the municipal sector [2]. Global
population growth projections of 2 to 3 billion people over the next 40 years, combined with changing
diets, result in a predicted increase in food demand of 70% by 2050 [2]. Thus, water demand will
increase too. Moreover, water is needed also to produce and make use of energy: all forms of energy
require water at some stage of their life cycle, which includes production, conversion, distribution and
use. Global energy consumption is expected to increase by about 50% between 2007 and 2035, to meet
rising populations and living standards [2]. Climate change further complicates the issue: the fast
alternate cycles of floods (in Central Europe, South of China and other Asian countries in 2002 and
2011) and long periods of drought (in Europe in 2003 and in the Horn of Africa in 2011) are
susceptible to lead to emerging crisis and regional conflicts because of food scarcity.
In such a context, a substantial increase of irrigation water productivity, of investments in the
existing irrigation systems modernization, and of new water resource developments are clearly needed.
The automation of irrigation in modern farms, greenhouses or buildings has expanded over the last
years, in order to increase the irrigation efficiency and to reduce the maintenance expenses. Frequently,
automatic irrigation systems are based on prescheduling, which does not account for the exact
conditions. Thus, water wasting may follow a sudden rain or crop losses can result from unexpected
dry atmosphere conditions. For a good irrigation practice, water should be applied to the soil at the
right time and amount, to avoid both crop stress (and consequent yield reduction) and losses due to
deep percolation and runoff. As a consequence, measurements of the water content in soil should be
used for evaluating the level of water reserve.
The existing irrigation systems are based on four categories of basic sensors, used for irrigation
scheduling [3,4]:
(a) Tensiometers, which measure soil water potential through a ceramic cup which is inserted into
the soil and establishes an equilibrium with the soil water tension up to ca. 0.8 bar;
(b) Gypsum blocks, which measure soil water content and work on the simple principle of electrical
resistance measurement, better suited to dry soils than wet soils;
(c) Neutron probes, which measure soil water content through detecting interaction of water and
neutrons emitted by a radioactive source; these need to be calibrated for each type of soil and are
subject to specific norms that limit their use in most countries;
(d) Methods that directly or indirectly measure the soil dielectric constant: time domain
reflectometry (TDR), that measures the propagating velocity of an electro-magnetic pulse travelling
along the sensor; and capacitance, that measures the resonance frequency of a circuit, in which the
probe itself is used as a capacitor [3]. Thus, when the amount of water changes in the soil, the probe
will measure a change in capacitance that can be directly correlated with a change in water content [3].
Several commercial sensors have been developed on the basis of these relationships.
All these methods are discontinuous, quite expensive or subjected to accelerated deterioration, often
require a soil-specific calibration, and are sometimes complex, difficult to install, and results must be
evaluated by experts. Finally, the variability of soil environment and the influence of water content on
different chemical and physical properties of soils make all measurements carried out so far
problematic to analyze in a proper way, since they are affected by uncertainty and they are related to
Sensors 2013, 13 12072
few soil typologies. Thus, measurement of soil water content is still an unsolved technical problem.
The necessity to develop new humidity sensors that do not possess the above mentioned drawbacks is
then obvious.
Soil is comprised of minerals, soil organic matter, water and air. The composition and proportion of
these components greatly influence soil physical properties, including texture, structure, and porosity,
the fraction of pore space in a soil. In turn, these properties affect air and water movement in a soil,
and thus the soil’s ability to function and sustain productivity [3]. Water in soil occupies pore spaces
that arise from the physical arrangement of the particulate solid phase, competitively and often
concurrently with the soil gas phase [3]. The porosity in the soil generally lies in the range 0.3 L/L (in
coarse sandy soils) to 0.6 L/L (in fine clayey soils) [3]. Water evaporation depends on soil properties
and on atmospheric conditions; in a saturated soil, the free water in larger pores evaporates first, the
remaining water is retained mainly in small soil pores by strong capillary forces, and vapor pressure of
the air in equilibrium with the pore water will therefore be lower than in the air close to a free water
surface [5]. Therefore, the devices used for measuring the atmospheric moisture have been also
proposed for soil water content determination. These sensors are based on electrical resistance
measurements of porous materials such as polymers and ceramics [6,7]. Ultrasonic waves have been
also envisaged for this aim [8].
A sensor to measure soil air relative humidity should exhibit several characteristic: it should be
small and rugged so that it can be inserted in soil without significantly affecting the surrounding
porous medium, while also being able to resist damage by adjacent soil particles. The sensor should be
relatively insensitive to salinity, which can be relevant in semiarid and arid regions. Hysteresis should
be minimal. It should be able to withstand or compensate for change in temperature, and should be
inexpensive so that multiple sensors can be installed. The sensors should also be able to measure
relative humidity values over a broad range, ideally 0–100% and not require calibration for different
soil types [7].
It is well known in the literature that ceramic humidity sensors features are linked to bulk and surface
properties, specifically, pore size distribution, mean grain size and doping. The materials composition,
their microstructure and porosity can strongly influence their electrical conductivity and the presence of
active catalytic sites, thus their functional properties [9–12]. Hematite and doped-hematite are known gas
and humidity sensors [13–16]. The humidity properties of pure and doped -Fe2O3 and of ferrites have
been studied in detail throughout the years: iron oxide [17,18], MgFe2O4 [19,20], Sn4+
or Mo6+
-doped
MgFe2O4 [21], MgFe2O4-CeO2 [22], Li-doped Fe2O3 [23,24], Zn2+
and Au3+
-doped Fe2O3 [25], K, Na,
Mg, Ca, Rb, Ba, Sr-doped Fe2O3 [24], Au-doped LiFe2O3 [26], Mg-Cu ferrite [27], Li substituted
Mg-ferrite [28], LaFeO3 [29], La0.8Sr0.2Fe1-xCuxO3 [30], Fe2O3 nanoparticles on sepiolite [31,32],
K+--ferrite [33], Mn-Zn ferrite [34] and silica-Fe2O3 [35] were already evaluated as humidity sensors.
Much interest has been focused on study of Mg-based ferrite as humidity sensitive material since it
is inexpensive and robust [27]. However, in the Sigma-Aldrich catalogue, strontium carbonate is about
seven times more expensive than magnesium carbonate, nevertheless, due to the small amount used in
this study, we believe that strontium-doped hematite humidity sensors are still competitive, from an
economical point of view, with respect to other ferrites. Therefore, the scope of this work is to study
the sensing behavior of Sr-doped hematite for soil water content determination. To this aim, the
electrical response of this material was first studied in air, then in a simulated soil and finally, in field.
Sensors 2013, 13 12073
2. Experimental Section
-Fe2O3 powder (Aldrich > 99%, particle size distribution below 2 m) was mixed in ethanol with
strontium carbonate used as a precursor of 5 wt% equivalent of strontium oxide respect to hematite
(Fluka > 99%), in a planetary mill for 1 h. After drying overnight, the mixture was uniaxially pressed
at 370 MPa and calcined at 900 °C for 1 h. The pellets were then manually ground by means of an
agate mortar and an agate pestle, prior to be planetary milled for 6 h in ethanol, in order to reach the
same particle size distribution as the starting hematite. After drying overnight, the powder was ready to
use. Then, pellets were pressed again in the same conditions above mentioned and fired in the
temperature range 800–1,000 °C. Finally, gold electrodes (ESL 520 A) were screen printed on the
surface of the pellets and after drying overnight, all the sensors were fired at 520 °C for 18 min,
according to the ink’s manufacturer recommendations (Figure 1a).
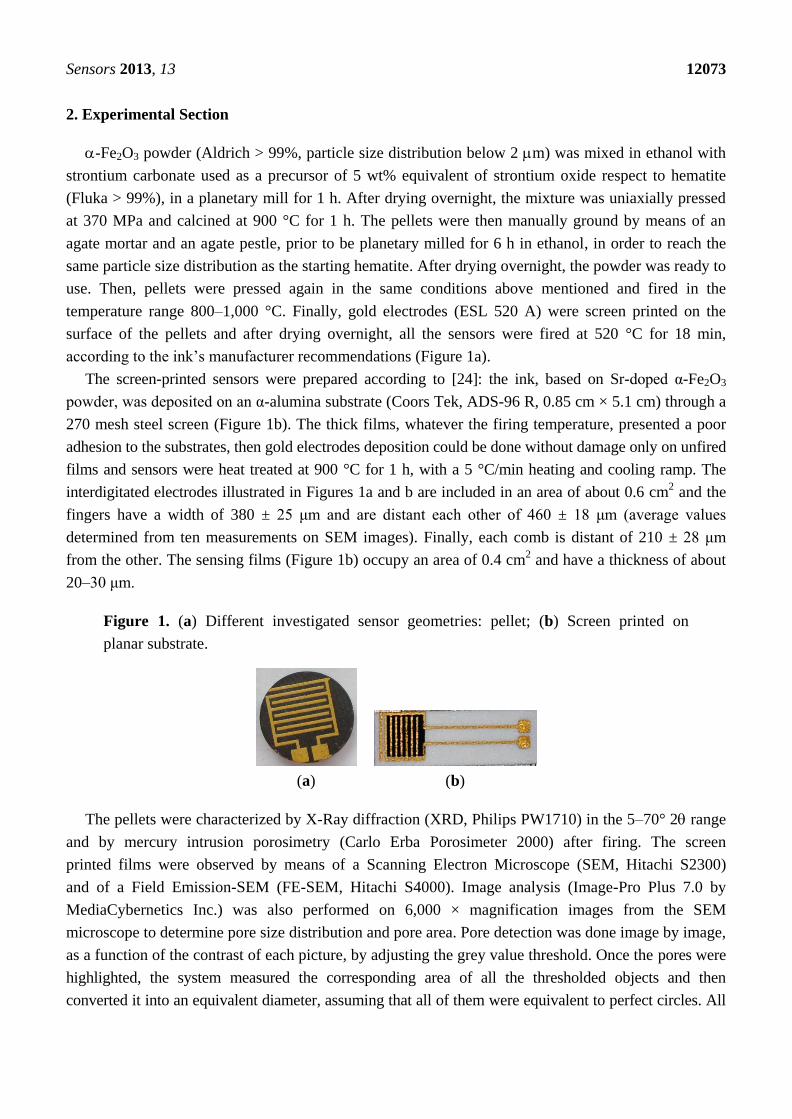
The screen-printed sensors were prepared according to [24]: the ink, based on Sr-doped α-Fe2O3
powder, was deposited on an α-alumina substrate (Coors Tek, ADS-96 R, 0.85 cm × 5.1 cm) through a
270 mesh steel screen (Figure 1b). The thick films, whatever the firing temperature, presented a poor
adhesion to the substrates, then gold electrodes deposition could be done without damage only on unfired
films and sensors were heat treated at 900 °C for 1 h, with a 5 °C/min heating and cooling ramp. The
interdigitated electrodes illustrated in Figures 1a and b are included in an area of about 0.6 cm2 and the
fingers have a width of 380 ± 25 μm and are distant each other of 460 ± 18 μm (average values
determined from ten measurements on SEM images). Finally, each comb is distant of 210 ± 28 μm
from the other. The sensing films (Figure 1b) occupy an area of 0.4 cm2 and have a thickness of about
20–30 μm.
Figure 1. (a) Different investigated sensor geometries: pellet; (b) Screen printed on
planar substrate.
(a) (b)
The pellets were characterized by X-Ray diffraction (XRD, Philips PW1710) in the 5–70° 2 range
and by mercury intrusion porosimetry (Carlo Erba Porosimeter 2000) after firing. The screen
printed films were observed by means of a Scanning Electron Microscope (SEM, Hitachi S2300)
and of a Field Emission-SEM (FE-SEM, Hitachi S4000). Image analysis (Image-Pro Plus 7.0 by
MediaCybernetics Inc.) was also performed on 6,000 × magnification images from the SEM
microscope to determine pore size distribution and pore area. Pore detection was done image by image,
as a function of the contrast of each picture, by adjusting the grey value threshold. Once the pores were
highlighted, the system measured the corresponding area of all the thresholded objects and then
converted it into an equivalent diameter, assuming that all of them were equivalent to perfect circles. All
Sensors 2013, 13 12074
these diameters were finally “high-passed filtered” by means of a minimum value (0.09 m) chosen to
remove the smallest objects corresponding to pores or parts of pores that were not correctly detected.
The humidity response of the sensors in the 0–100% RH range was studied in a laboratory
apparatus at room temperature, under an air flow rate of 0.05 L/s [24]. The relative humidity was
increased by steps, each one of three minutes. A commercial humidity and temperature probe was used
as a reference for temperature and RH values (Delta Ohm HD2101.1), accuracy: ±0.1% in the 0–100%
RH range and −50–250 °C temperature range. Each tested sensor was alimented by an external
alternating voltage (V = 3.6 V at the rate of 1 kHz; cost of all the electronic components of this circuit:
about 40 euros) and then constituted a variable resistance of this electrical circuit. A multimeter
(Keithley 2000) was used to measure the tension VDC at the output of the circuit. The sensor resistance
was determined by substituting them, in the circuit, by known resistances and then by plotting a
calibration curve R = f(VDC).
The sensor response SR was calculated from the sensors resistance value [Equation (1)] [36]:
0
0
2
22
OH
OHOH
PR
PRPRSR (1)
where OHPR2
is the total resistance of the material when exposed under OHP2
partial pressure and
02 OHPR is the resistance measured under dry air.
An experimental laboratory system (Figure 2) was also set-up for continuous monitoring of soil
mass, by means of an electronic balance connected to a PC, after the addition of a known quantity of
water to a 2 mm sieved and homogenized soil and its subsequent progressive evaporation with time.
The water content in soil is then given by Equation (2):
soil
water
Volume
VolumeContentWater (2)
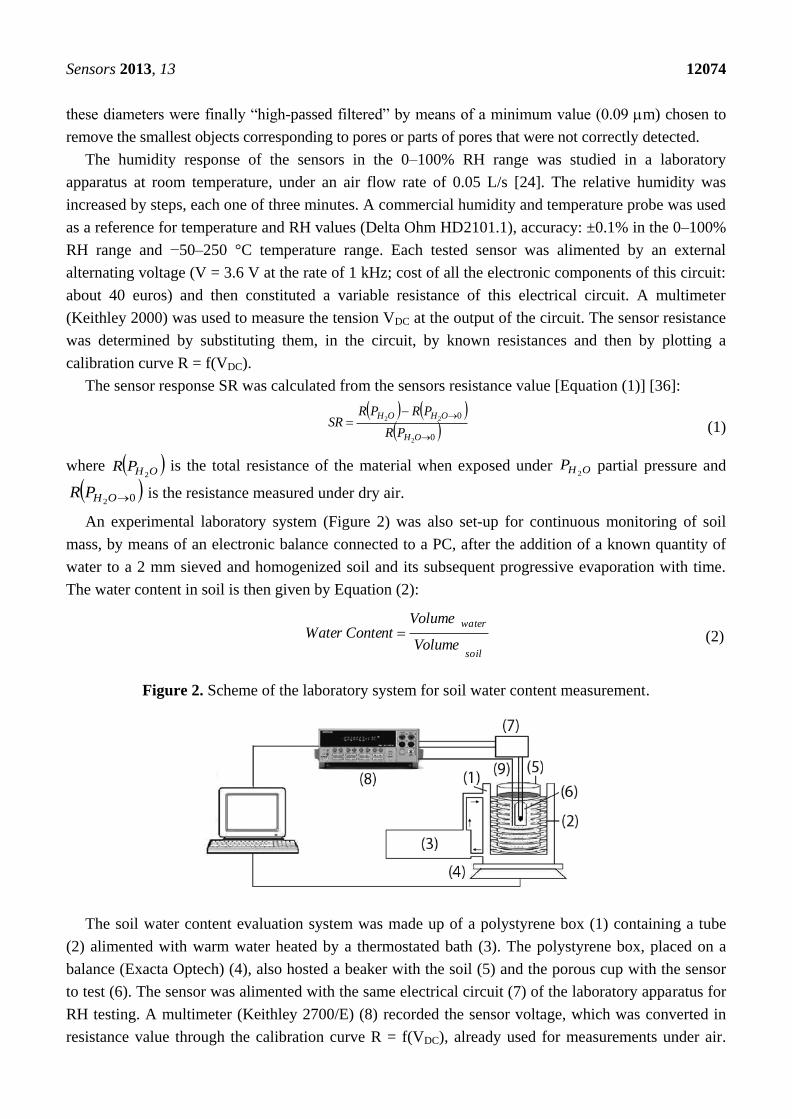
Figure 2. Scheme of the laboratory system for soil water content measurement.
The soil water content evaluation system was made up of a polystyrene box (1) containing a tube
(2) alimented with warm water heated by a thermostated bath (3). The polystyrene box, placed on a
balance (Exacta Optech) (4), also hosted a beaker with the soil (5) and the porous cup with the sensor
to test (6). The sensor was alimented with the same electrical circuit (7) of the laboratory apparatus for
RH testing. A multimeter (Keithley 2700/E) (8) recorded the sensor voltage, which was converted in
resistance value through the calibration curve R = f(VDC), already used for measurements under air.
Sensors 2013, 13 12075
The decrease in water content was then correlated to the variation of the sensors tension. Finally, the
effective temperature of the soil was monitored by means of a Pt100 thermocouple connected to
the multimeter (9).
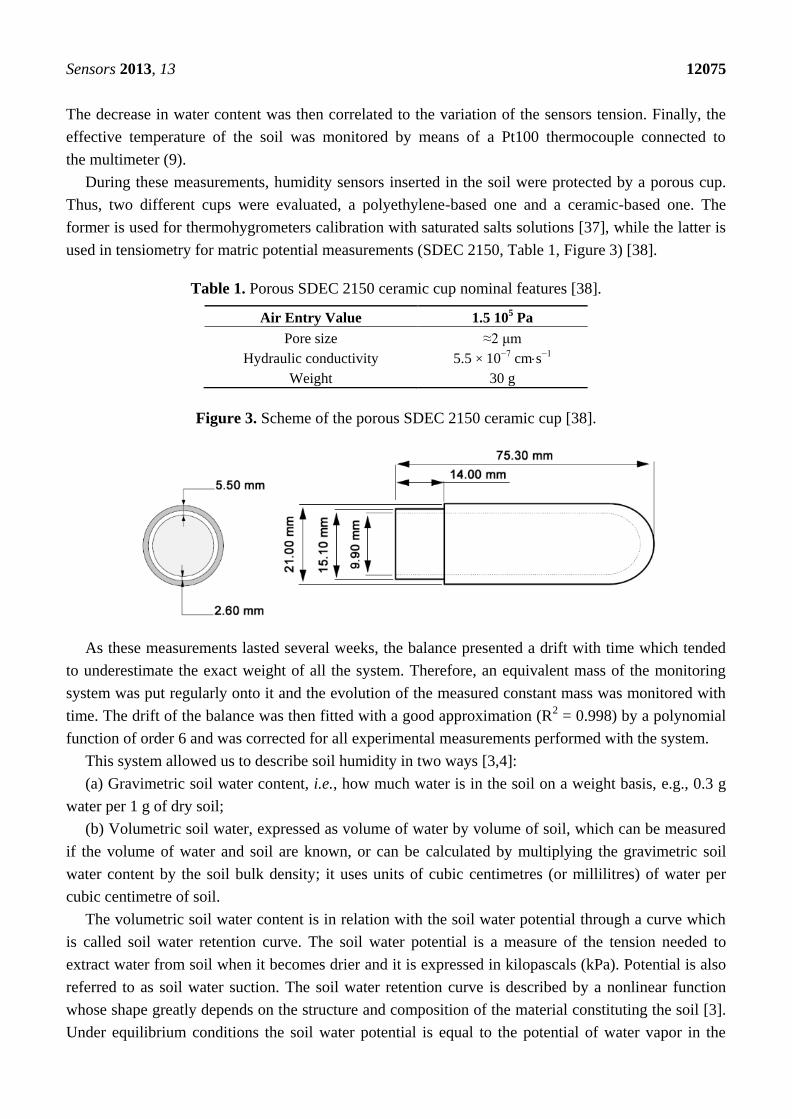
During these measurements, humidity sensors inserted in the soil were protected by a porous cup.
Thus, two different cups were evaluated, a polyethylene-based one and a ceramic-based one. The
former is used for thermohygrometers calibration with saturated salts solutions [37], while the latter is
used in tensiometry for matric potential measurements (SDEC 2150, Table 1, Figure 3) [38].
Table 1. Porous SDEC 2150 ceramic cup nominal features [38].
Air Entry Value 1.5 105 Pa
Pore size ≈2 μm
Hydraulic conductivity 5.5 × 10⁻⁷ cms−1
Weight 30 g
Figure 3. Scheme of the porous SDEC 2150 ceramic cup [38].
As these measurements lasted several weeks, the balance presented a drift with time which tended
to underestimate the exact weight of all the system. Therefore, an equivalent mass of the monitoring
system was put regularly onto it and the evolution of the measured constant mass was monitored with
time. The drift of the balance was then fitted with a good approximation (R2 = 0.998) by a polynomial
function of order 6 and was corrected for all experimental measurements performed with the system.
This system allowed us to describe soil humidity in two ways [3,4]:
(a) Gravimetric soil water content, i.e., how much water is in the soil on a weight basis, e.g., 0.3 g
water per 1 g of dry soil;
(b) Volumetric soil water, expressed as volume of water by volume of soil, which can be measured
if the volume of water and soil are known, or can be calculated by multiplying the gravimetric soil
water content by the soil bulk density; it uses units of cubic centimetres (or millilitres) of water per
cubic centimetre of soil.
The volumetric soil water content is in relation with the soil water potential through a curve which
is called soil water retention curve. The soil water potential is a measure of the tension needed to
extract water from soil when it becomes drier and it is expressed in kilopascals (kPa). Potential is also
referred to as soil water suction. The soil water retention curve is described by a nonlinear function
whose shape greatly depends on the structure and composition of the material constituting the soil [3].
Under equilibrium conditions the soil water potential is equal to the potential of water vapor in the
Sensors 2013, 13 12076
surrounding soil air. The relative humidity is related to the water potential of the vapor through the
Kelvin Equation (3) [3]:
RTMe
eRH www /exp
0
(3)
where: e is water vapor pressure, e0 is saturated water vapor pressure at the same temperature, wM is
the molecular weight of water (0.018 kgmol−1
), R is the ideal gas constant (8.314 Jmol−1K
−1), T is
absolute temperature, w is the density of water (1,000 kg/m3 at 20 °C). Often, the entire range of
plant-available water is such that 98 < RH% < 100. In these conditions, Equation (3) can be also
approximated as Equation (4), for w in kPa:
1462
0e
eTw (4)
In this work, prior to each run, a water content equal to 0.30 L/L of soil was added to the soil,
roughly corresponding to the soil water content after free drainage [4]. The soil water content was also
expressed as relative to saturation, i.e., the amount of pores filled with water relative to total volume of
pores (it is also called degree of saturation).
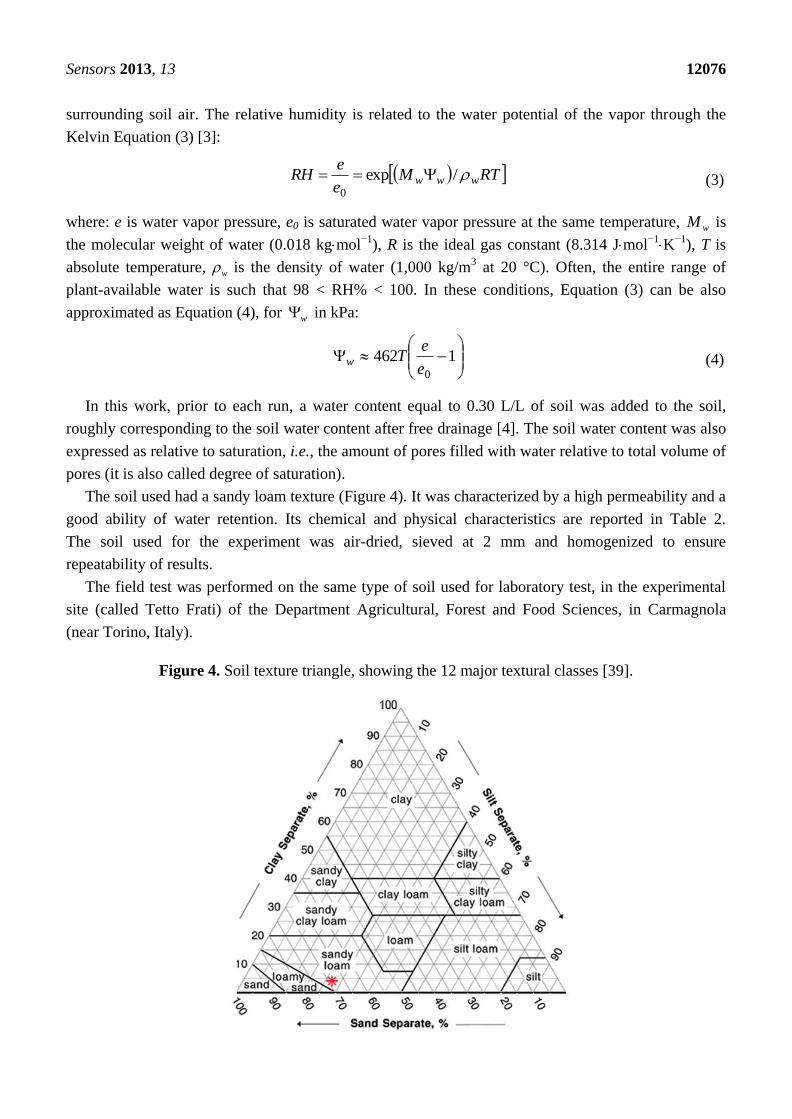
The soil used had a sandy loam texture (Figure 4). It was characterized by a high permeability and a
good ability of water retention. Its chemical and physical characteristics are reported in Table 2.
The soil used for the experiment was air-dried, sieved at 2 mm and homogenized to ensure
repeatability of results.
The field test was performed on the same type of soil used for laboratory test, in the experimental
site (called Tetto Frati) of the Department Agricultural, Forest and Food Sciences, in Carmagnola
(near Torino, Italy).
Figure 4. Soil texture triangle, showing the 12 major textural classes [39].
Sensors 2013, 13 12077
Table 2. Chemical and physical characteristics of the soil used in this work.
Tetto Frati
Coarse sand 7.5%
Fine sand 61.2%
Coarse silt 8.6%
Fine silt 18.2%
Clay 4.5%
pH (H2O) 7.6
CaCO3 tot. 28.8%
Organic content 1.18%
Bulk density 1.42 g/cm3
A rectangular field (150 m in length and 7 m in width, for a total area of 1,050 m2) with a slight slope
(0.5%) along the longest side to facilitate irrigation, and seeded with corn (in rows spaced 75 cm), was
used for field sensors testing. During field water content monitoring, one irrigation was carried out on
August 7th, by surface irrigation. The water content in soil was measured in different ways: by
gravimetric method (soil sampling, oven drying at 105 °C and weighing, then multiplying by an
independently- measured soil bulk density), by the TDR technique, by matric tension monitoring through
tensiometers placed at 20 and 40 cm depth in a row and between two adjacent crop rows, and finally, by
the sensors based on doped-hematite. All these measurements were carried out before and after irrigation
for about one month; temperature and relative humidity of air, as well as rainfall, were measured.
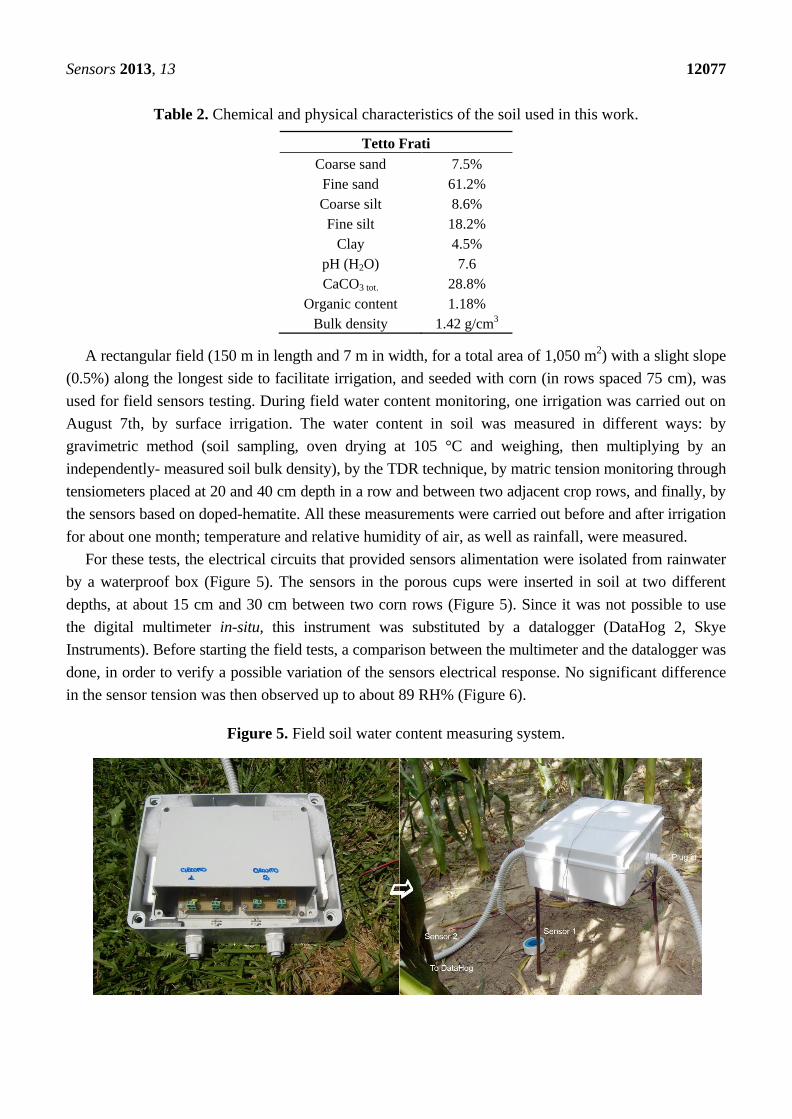
For these tests, the electrical circuits that provided sensors alimentation were isolated from rainwater
by a waterproof box (Figure 5). The sensors in the porous cups were inserted in soil at two different
depths, at about 15 cm and 30 cm between two corn rows (Figure 5). Since it was not possible to use
the digital multimeter in-situ, this instrument was substituted by a datalogger (DataHog 2, Skye
Instruments). Before starting the field tests, a comparison between the multimeter and the datalogger was
done, in order to verify a possible variation of the sensors electrical response. No significant difference
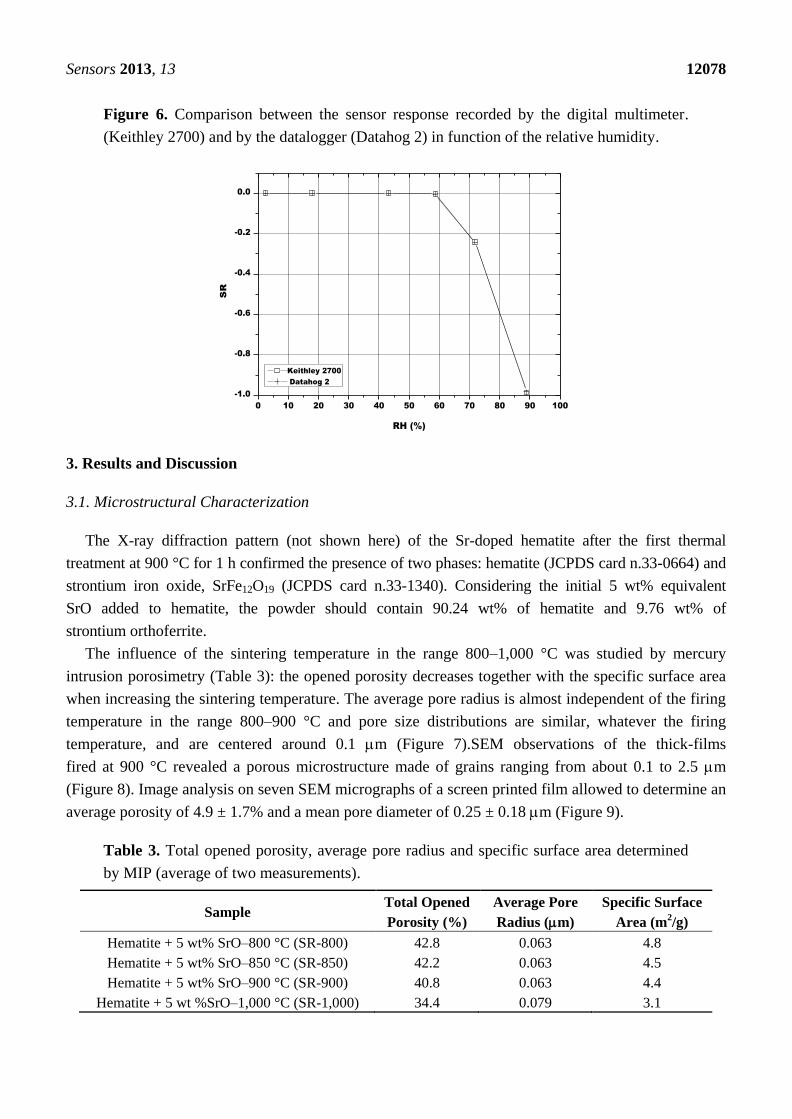
in the sensor tension was then observed up to about 89 RH% (Figure 6).
Figure 5. Field soil water content measuring system.
Sensors 2013, 13 12078
Figure 6. Comparison between the sensor response recorded by the digital multimeter.
(Keithley 2700) and by the datalogger (Datahog 2) in function of the relative humidity.
0 10 20 30 40 50 60 70 80 90 100
-1.0
-0.8
-0.6
-0.4
-0.2
0.0
SR
RH (%)
Keithley 2700
Datahog 2
3. Results and Discussion
3.1. Microstructural Characterization
The X-ray diffraction pattern (not shown here) of the Sr-doped hematite after the first thermal
treatment at 900 °C for 1 h confirmed the presence of two phases: hematite (JCPDS card n.33-0664) and
strontium iron oxide, SrFe12O19 (JCPDS card n.33-1340). Considering the initial 5 wt% equivalent
SrO added to hematite, the powder should contain 90.24 wt% of hematite and 9.76 wt% of
strontium orthoferrite.
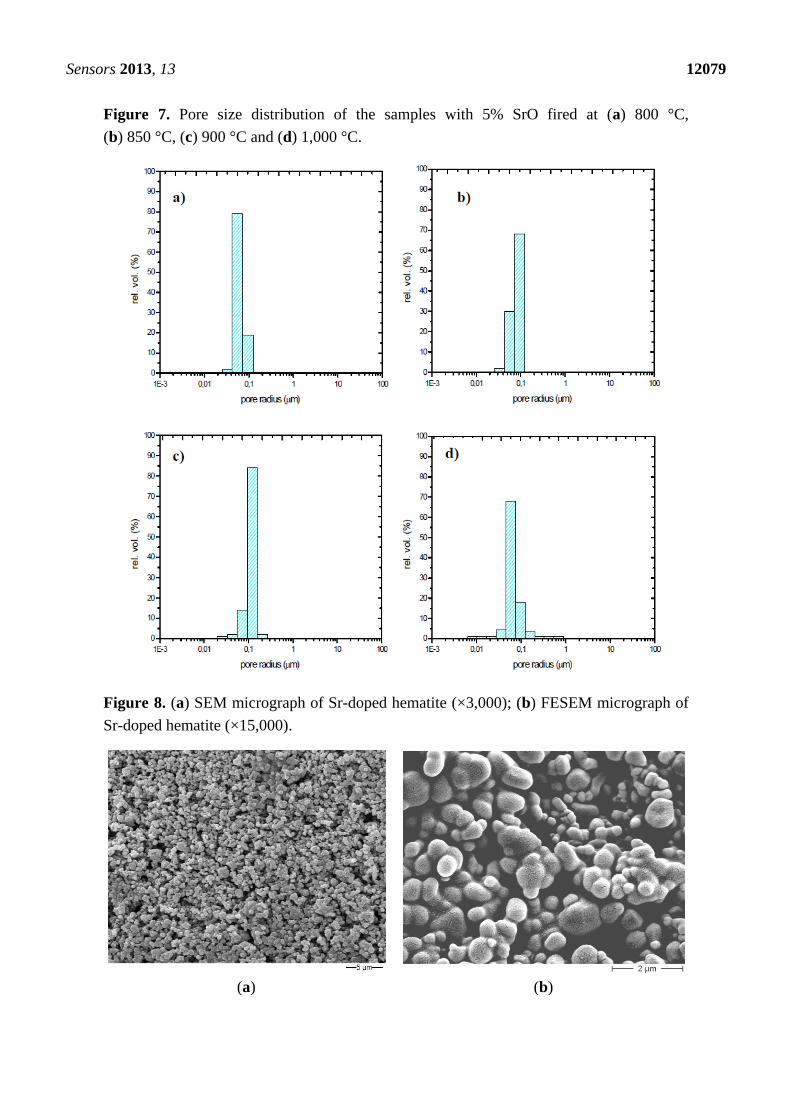
The influence of the sintering temperature in the range 800–1,000 °C was studied by mercury
intrusion porosimetry (Table 3): the opened porosity decreases together with the specific surface area
when increasing the sintering temperature. The average pore radius is almost independent of the firing
temperature in the range 800–900 °C and pore size distributions are similar, whatever the firing
temperature, and are centered around 0.1 m (Figure 7).SEM observations of the thick-films
fired at 900 °C revealed a porous microstructure made of grains ranging from about 0.1 to 2.5 m
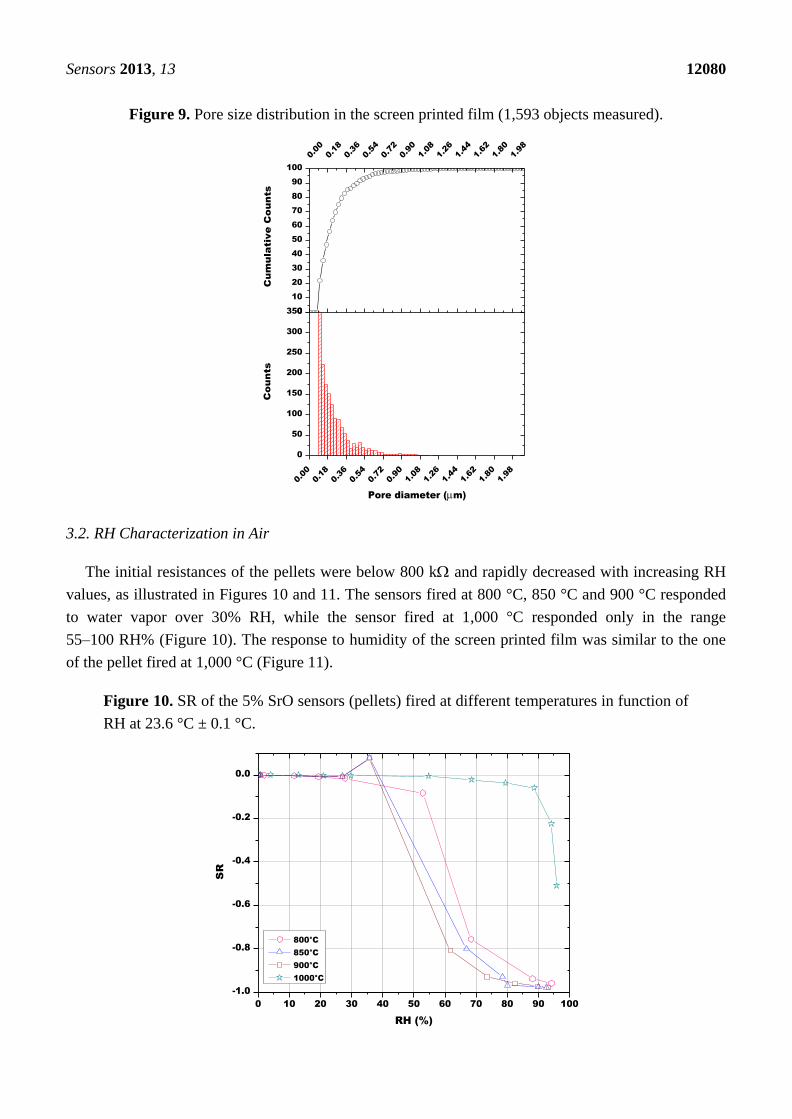
(Figure 8). Image analysis on seven SEM micrographs of a screen printed film allowed to determine an
average porosity of 4.9 ± 1.7% and a mean pore diameter of 0.25 ± 0.18 m (Figure 9).
Table 3. Total opened porosity, average pore radius and specific surface area determined
by MIP (average of two measurements).
Sample Total Opened
Porosity (%)
Average Pore
Radius (m)
Specific Surface
Area (m2/g)
Hematite + 5 wt% SrO–800 °C (SR-800) 42.8 0.063 4.8
Hematite + 5 wt% SrO–850 °C (SR-850) 42.2 0.063 4.5
Hematite + 5 wt% SrO–900 °C (SR-900) 40.8 0.063 4.4
Hematite + 5 wt %SrO–1,000 °C (SR-1,000) 34.4 0.079 3.1
Sensors 2013, 13 12079
Figure 7. Pore size distribution of the samples with 5% SrO fired at (a) 800 °C,
(b) 850 °C, (c) 900 °C and (d) 1,000 °C.
Figure 8. (a) SEM micrograph of Sr-doped hematite (×3,000); (b) FESEM micrograph of
Sr-doped hematite (×15,000).
(a) (b)
Sensors 2013, 13 12080
Figure 9. Pore size distribution in the screen printed film (1,593 objects measured).
3.2. RH Characterization in Air
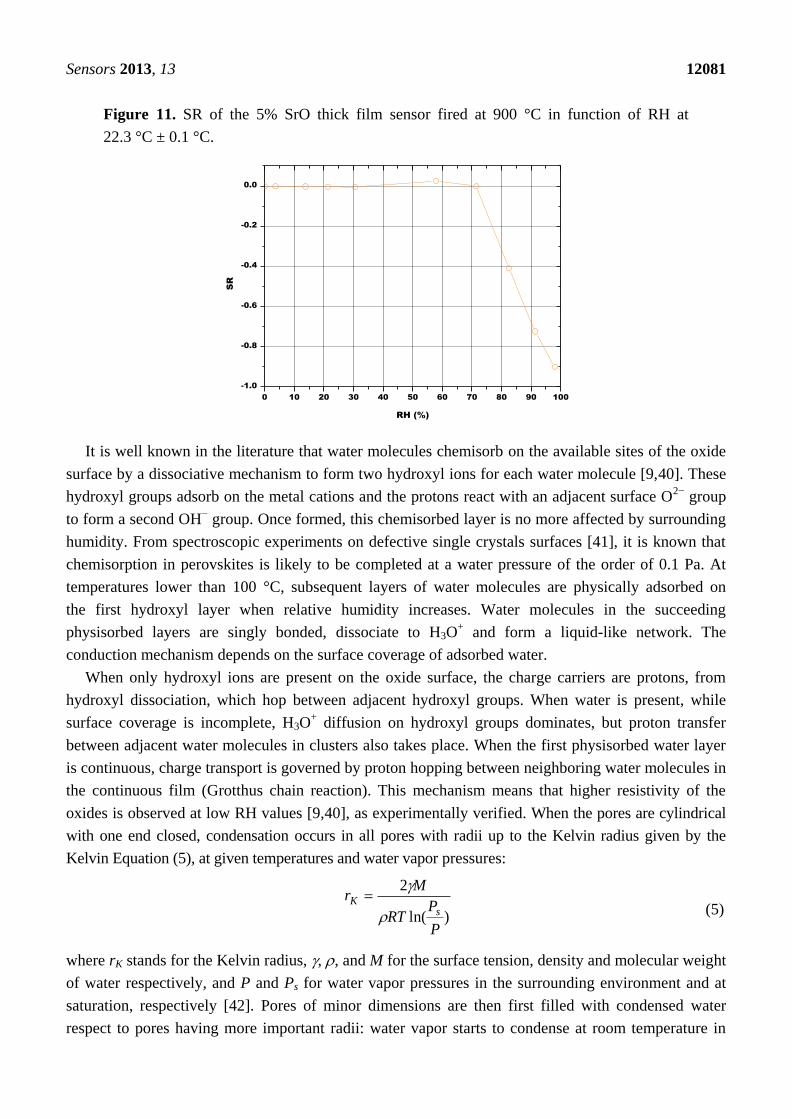
The initial resistances of the pellets were below 800 k and rapidly decreased with increasing RH
values, as illustrated in Figures 10 and 11. The sensors fired at 800 °C, 850 °C and 900 °C responded
to water vapor over 30% RH, while the sensor fired at 1,000 °C responded only in the range
55–100 RH% (Figure 10). The response to humidity of the screen printed film was similar to the one
of the pellet fired at 1,000 °C (Figure 11).
Figure 10. SR of the 5% SrO sensors (pellets) fired at different temperatures in function of
RH at 23.6 °C ± 0.1 °C.
0
10
20
30
40
50
60
70
80
90
100
0.0
0
0.1
8
0.3
6
0.5
4
0.7
2
0.9
0
1.0
8
1.2
6
1.4
4
1.6
2
1.8
0
1.9
8
0.0
0
0.1
8
0.3
6
0.5
4
0.7
2
0.9
0
1.0
8
1.2
6
1.4
4
1.6
2
1.8
0
1.9
8
0
50
100
150
200
250
300
350
Co
un
ts
Pore diameter (m)
Cu
mu
la
tive
C
ou
nts
0 10 20 30 40 50 60 70 80 90 100
-1.0
-0.8
-0.6
-0.4
-0.2
0.0
SR
RH (%)
800°C
850°C
900°C
1000°C
Sensors 2013, 13 12081
Figure 11. SR of the 5% SrO thick film sensor fired at 900 °C in function of RH at
22.3 °C ± 0.1 °C.
It is well known in the literature that water molecules chemisorb on the available sites of the oxide
surface by a dissociative mechanism to form two hydroxyl ions for each water molecule [9,40]. These
hydroxyl groups adsorb on the metal cations and the protons react with an adjacent surface O2−
group
to form a second OH− group. Once formed, this chemisorbed layer is no more affected by surrounding
humidity. From spectroscopic experiments on defective single crystals surfaces [41], it is known that
chemisorption in perovskites is likely to be completed at a water pressure of the order of 0.1 Pa. At
temperatures lower than 100 °C, subsequent layers of water molecules are physically adsorbed on
the first hydroxyl layer when relative humidity increases. Water molecules in the succeeding
physisorbed layers are singly bonded, dissociate to H3O+ and form a liquid-like network. The
conduction mechanism depends on the surface coverage of adsorbed water.
When only hydroxyl ions are present on the oxide surface, the charge carriers are protons, from
hydroxyl dissociation, which hop between adjacent hydroxyl groups. When water is present, while
surface coverage is incomplete, H3O+ diffusion on hydroxyl groups dominates, but proton transfer
between adjacent water molecules in clusters also takes place. When the first physisorbed water layer
is continuous, charge transport is governed by proton hopping between neighboring water molecules in
the continuous film (Grotthus chain reaction). This mechanism means that higher resistivity of the
oxides is observed at low RH values [9,40], as experimentally verified. When the pores are cylindrical
with one end closed, condensation occurs in all pores with radii up to the Kelvin radius given by the
Kelvin Equation (5), at given temperatures and water vapor pressures:
)ln(
2
P
PRT
Mr
sK
(5)
where rK stands for the Kelvin radius, , , and M for the surface tension, density and molecular weight
of water respectively, and P and Ps for water vapor pressures in the surrounding environment and at
saturation, respectively [42]. Pores of minor dimensions are then first filled with condensed water
respect to pores having more important radii: water vapor starts to condense at room temperature in
0 10 20 30 40 50 60 70 80 90 100
-1.0
-0.8
-0.6
-0.4
-0.2
0.0
SR
RH (%)
Sensors 2013, 13 12082
mesopores of size 20 Å around 15% RH and continues to around 1,000 Å under a saturated
atmosphere. At this time, the electrical conduction is likely to occur through the continuous water
layers within the porous sample [43]. Moreover, at 20 °C and under atmospheric pressure, the mean
free path of water vapor molecules decreases from 85.44 to 84.82 nm in dry air containing humidity
traces and up to the water vapor saturation. The molecular entry into the pore is possible if the free
path of the incident vapor molecule is less than the pore size [44]. The desired pore size should be
comparable to the molecular free path of vapor at all humidity conditions, so that the molecules can
impinge and adsorb on the pore wall [44]. Finally, in addition to the protonic conduction in the adsorbed
layers, electrolytic conduction occurs in the liquid layer of water condensed within capillary pores,
thereby resulting in an enhancement of conductivity. These mechanisms explain why SR, defined in
Equation (1), tends to decrease with increasing RH, for all the prepared sensors (Figures 10 and 11).
Table 4. Soil water content.
Depth (cm)
Irrigation Event: August 7th
Water Content
(% sat) Before
Water Content
(% sat) After
Gravimetric Method
0–20 0.408 0.466
20–40 0.543 0.568
TDR
20 0.283 0.328
40 0.390 0.445
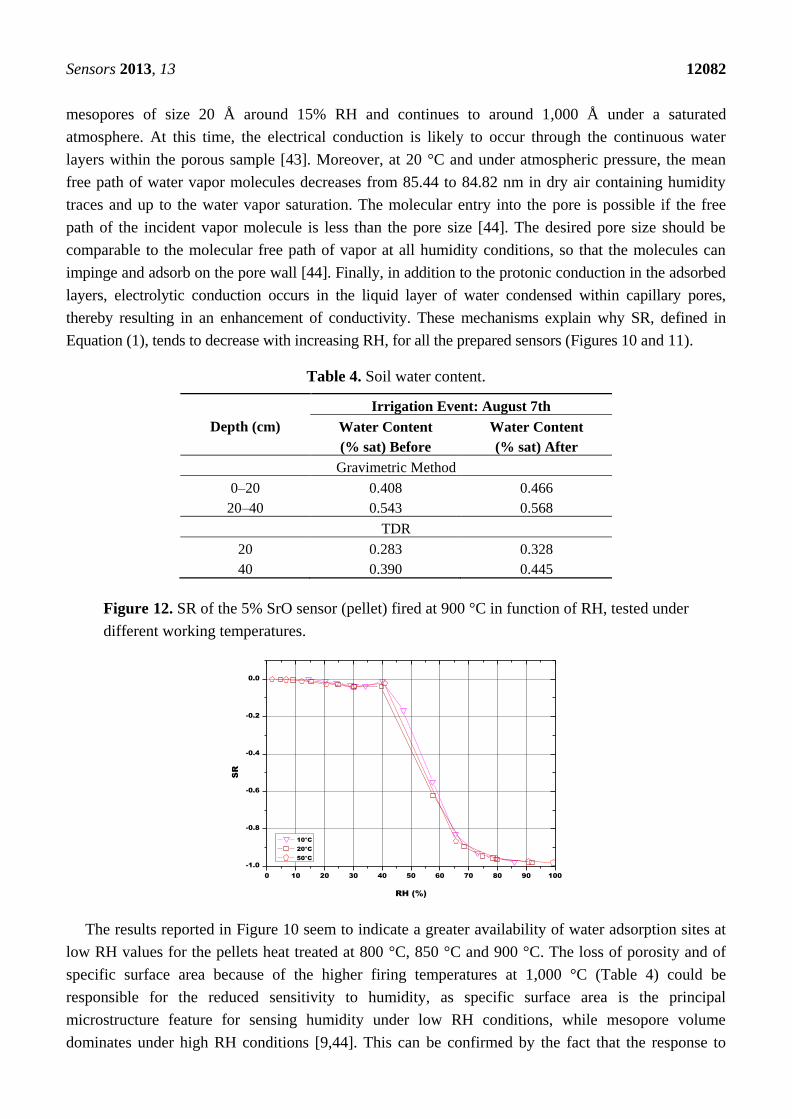
Figure 12. SR of the 5% SrO sensor (pellet) fired at 900 °C in function of RH, tested under
different working temperatures.
The results reported in Figure 10 seem to indicate a greater availability of water adsorption sites at
low RH values for the pellets heat treated at 800 °C, 850 °C and 900 °C. The loss of porosity and of
specific surface area because of the higher firing temperatures at 1,000 °C (Table 4) could be
responsible for the reduced sensitivity to humidity, as specific surface area is the principal
microstructure feature for sensing humidity under low RH conditions, while mesopore volume
dominates under high RH conditions [9,44]. This can be confirmed by the fact that the response to
0 10 20 30 40 50 60 70 80 90 100
-1.0
-0.8
-0.6
-0.4
-0.2
0.0
SR
RH (%)
10°C
20°C
50°C
Sensors 2013, 13 12083
humidity of this last sample is close to the one of the thick-film fired at 900 °C (Figure 11). As a
matter of fact, the screen-printed film evidenced a limited porosity (4.9% ± 1.7%, estimated by image
analysis from SEM micrographs).
Finally, the pellets fired at 900 °C were also tested at different temperatures, in order to study the
influence of this parameter onto the sensors response (Figure 12). The results showed that the sensing
material was almost insensitive to the working temperature, in the investigated temperature range
(10–50 °C).
3.3. Soil Water Content Monitoring in the Laboratory
The first measurement (Figure 13) was devoted to the comparison between the monitoring system
with the porous PE cup and with the porous ceramic cup above described, as the sensors cannot be
inserted in soil without any protection. To this aim, two pellets of Sr-doped hematite fired at 900 °C
were used. During the test, the sensors response reached quickly an absolute value close to 1, meaning
that their resistance became very low, because they were in contact with an atmosphere saturated in
water vapor (Figure 13a). After some days, their resistance started to increase progressively, indicating
that the atmosphere in the porous cups contained less humidity. The sensors response were then plotted
as a function of the soil water content (not shown here); these curves presented an almost constant
region from the higher water content to near 0.09 L/L of water in soil. At that point, the sensor
response decreased significantly. The intercept between these two regions was used to determine the
minimum volumetric water content which led to a significant sensor response change. These
volumetric water contents calculated for the different sensors were used to determine, on Figure 13a,
the associated time after which the sensor’s response changed significantly, as well as, the
corresponding sensor’s response. The ceramic cup exchanged humidity with the soil in a more
progressive way with respect to the PE cup: the sensor response to relative humidity changes was
observed after 178 h with the ceramic cup, against the 278 h necessary for the sensor in the PE cup
(Figure 13a).
The water content in the simulated soil when the Sr-doped hematite went out of saturated water
vapor atmosphere was 0.09 L/L for the sensor in the porous cup and 0.07 L/L for the one in the PE
cup. Then, it was decided from now on to use only the ceramic protective envelope. Finally, no
significant change in the sensor response has been observed with the porous ceramic cup mounted
around the sensor, when the sensors were tested only under humid air. The plot of the sensors’
response in function of the degree of saturation (Figure 13b) confirmed obviously that the ceramic
porous cup favored the humidity exchanges with the soil, as the minimum water content which led to a
significant change in the sensor response was higher with respect to the polymeric cup (17.2% and
13.3%, respectively).
Subsequently, the influence of the sintering temperature (800 °C, 850 °C, 900 °C and 1,000 °C) on
the Sr-doped hematite sensor response was investigated (Figures 14–17).
Sensors 2013, 13 12084
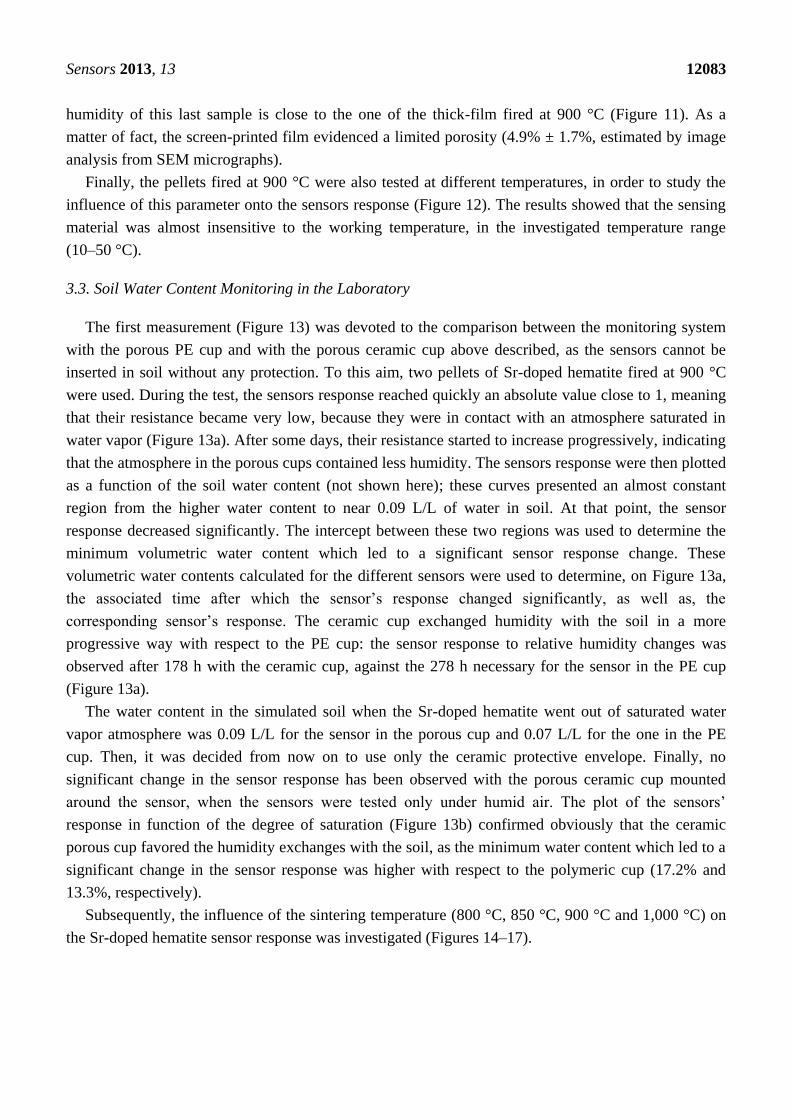
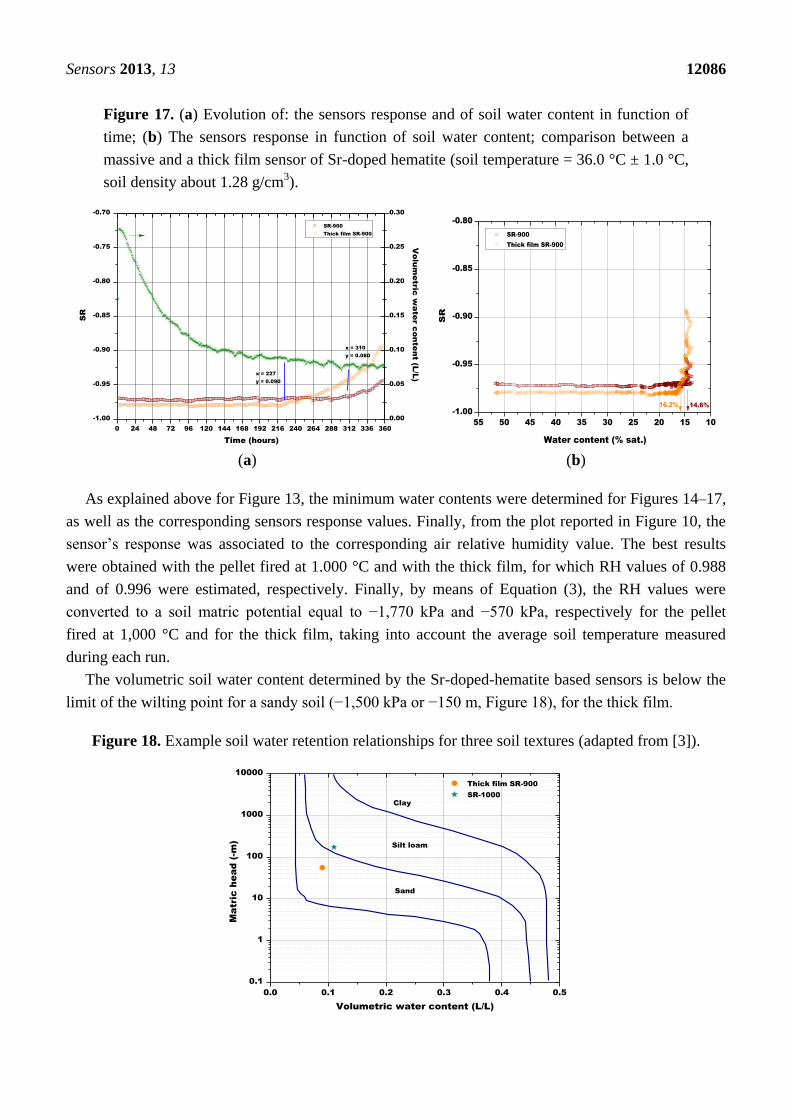
Figure 13. (a) Evolution of: the sensors response and of soil water content in function of
time; (b) The sensors response in function of soil water content; influence of the PE and of
the ceramic porous cup (soil temperature = 50.5 °C ± 0.8 °C, soil density about 1.30 g/cm3).
(a) (b)
Figure 14. (a) Evolution of: the sensors response and of soil water content in function of
time; (b) The sensors response in function of soil water content; comparison between the
pellets fired at 800 °C and 900 °C (soil temperature = 41.5 °C ± 0.8 °C, soil density about
1.28 g/cm3).
(a) (b)
The last monitoring of the humidity content in the simulated soil was done with a pellet made of
-Fe2O3 + 5 wt% of SrO and a screen printed film based on the same material, both fired at 900 °C
(Figure 17). The massive sensor gave a slower response than the thick film sensor to the variations of
the water content in soil. In fact, the response of the pellet happened after 310 h and the one of the
thick film sensor was recorded after 227 h, for soil water content of 0.090 and 0.080, respectively.
0 24 48 72 96 120 144 168 192 216 240 264 288
-1.00
-0.95
-0.90
-0.85
-0.80
-0.75
-0.70
PE cup
Ceramic cup
SR
Time (hours)
0.00
0.05
0.10
0.15
0.20
0.25
0.30
x = 278
y = 0.07V
olu
me
tric
w
ate
r c
on
te
nt (L
/L
)
x = 178
y = 0.09
60 55 50 45 40 35 30 25 20 15 10
-1.00
-0.95
-0.90
-0.85
-0.80
17.2%
PE cup
Ceramic cup
SR
Water content (% sat.)
13.3%
0 24 48 72 96 120 144 168 192 216 240 264 288 312 336 360
-1.00
-0.95
-0.90
-0.85
-0.80
-0.75
-0.70
SR-900
SR-800
SR
Time (hours)
0.00
0.05
0.10
0.15
0.20
0.25
0.30
x = 318
y = 0.04
Vo
lu
me
tric
w
ate
r c
on
te
nt (L
/L
)
x = 200
y = 0.07
60 55 50 45 40 35 30 25 20 15 10 5 0
-1.00
-0.95
-0.90
-0.85
-0.80
Water content (% sat.)
SR-900
SR-800
SR
7%12.5%
Sensors 2013, 13 12085
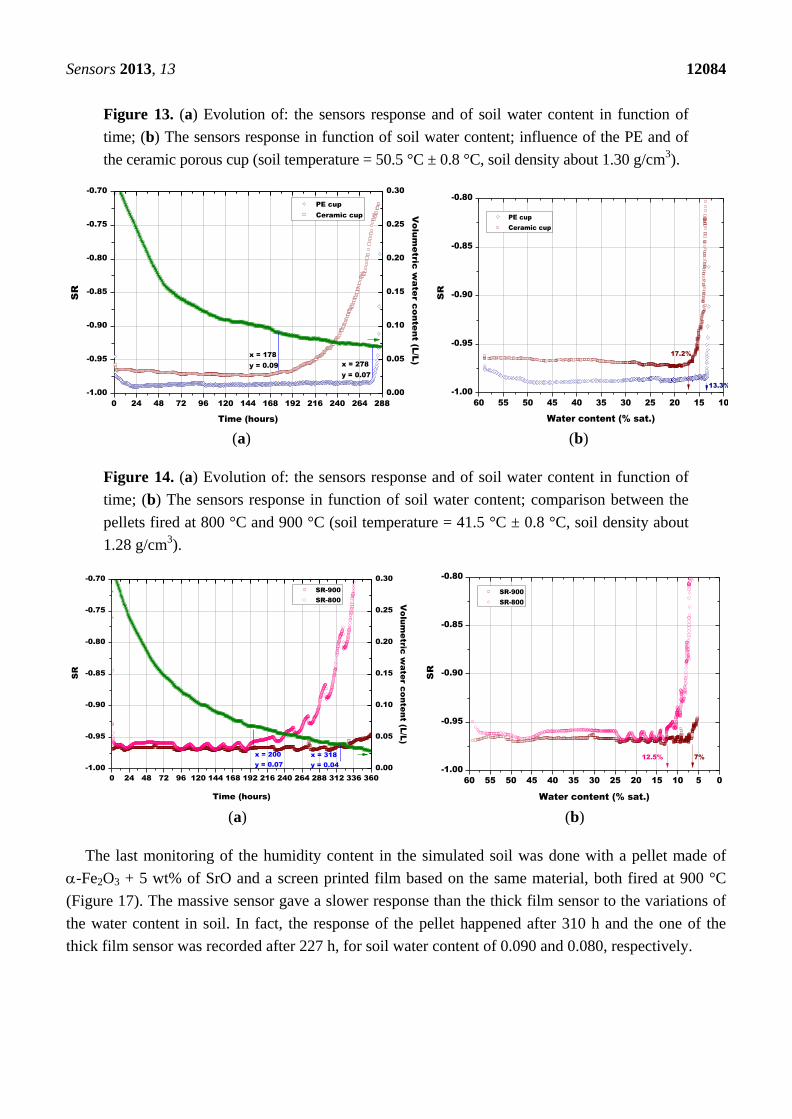
Figure 15. (a) Evolution of: the sensors response and of soil water content in function
of time; (b) The sensors response in function of soil water content; comparison between
the pellets fired at 850 °C and 900 °C (soil temperature = 38.7 °C ± 1.4 °C, soil density
about 1.28 g/cm3).
(a) (b)
Figure 16. (a) Evolution of: the sensors response and of soil water content in function
of time; (b) The sensors response in function of soil water content; comparison between
the pellets fired at 900 °C and 1,000 °C (soil temperature = 45.0 °C ± 0.8 °C, soil density
about 1.28 g/cm3).
(a) (b)
A certain dependence of the temperature variations was observed for all the sensors, as their
response fluctuated in the same way as the temperature changed in the soil, as monitored by means of a
Pt100 thermocouple: any decrease in temperature caused an increase of the sensor response and
vice versa (Figures 14–17). These results can be explained by the fact that in a porous system as soil is,
when temperature increases, the internal RH does the same, because the internal RH is linked to the
meniscus curvature of water surface in pores which decreases due to a lowering in surface tension.
Therefore, the sensor resistance goes down because of an increase in RH.
0 24 48 72 96 120 144 168 192 216 240 264 288 312 336
-1.00
-0.95
-0.90
-0.85
-0.80
-0.75
-0.70
SR-850
SR-900
SR
Time (hours)
0.0
0.1
0.2
0.3
Vo
lu
me
tric
w
ate
r c
on
te
nt (L
/L
)
x = 221
y = 0.091
55 50 45 40 35 30 25 20 15 10
-1.00
-0.95
-0.90
-0.85
-0.80
Water content (% sat.)
SR
SR-850
SR-900
16.4%
0 24 48 72 96 120 144 168 192 216 240 264 288 312 336
-1.00
-0.95
-0.90
-0.85
-0.80
-0.75
-0.70
SR-1000
SR-900
SR
Time (hours)
0.00
0.05
0.10
0.15
0.20
0.25
0.30
Vo
lu
me
tric
w
ate
r c
on
te
nt (L
/L
)
x = 240
y = 0.11
55 50 45 40 35 30 25 20 15
-1.00
-0.95
-0.90
-0.85
-0.80
20.6%21%
Water content (% sat.)
SR-1000
SR-900
SR
Sensors 2013, 13 12086
Figure 17. (a) Evolution of: the sensors response and of soil water content in function of
time; (b) The sensors response in function of soil water content; comparison between a
massive and a thick film sensor of Sr-doped hematite (soil temperature = 36.0 °C ± 1.0 °C,
soil density about 1.28 g/cm3).
(a) (b)
As explained above for Figure 13, the minimum water contents were determined for Figures 14–17,
as well as the corresponding sensors response values. Finally, from the plot reported in Figure 10, the
sensor’s response was associated to the corresponding air relative humidity value. The best results
were obtained with the pellet fired at 1.000 °C and with the thick film, for which RH values of 0.988
and of 0.996 were estimated, respectively. Finally, by means of Equation (3), the RH values were
converted to a soil matric potential equal to −1,770 kPa and −570 kPa, respectively for the pellet
fired at 1,000 °C and for the thick film, taking into account the average soil temperature measured
during each run.
The volumetric soil water content determined by the Sr-doped-hematite based sensors is below the
limit of the wilting point for a sandy soil (−1,500 kPa or −150 m, Figure 18), for the thick film.
Figure 18. Example soil water retention relationships for three soil textures (adapted from [3]).
0 24 48 72 96 120 144 168 192 216 240 264 288 312 336 360
-1.00
-0.95
-0.90
-0.85
-0.80
-0.75
-0.70
0.00
0.05
0.10
0.15
0.20
0.25
0.30
x = 310
y = 0.080
SR-900
Thick film SR-900
SR
Time (hours)
x = 227
y = 0.090
Volu
metric
w
ate
r c
on
te
nt (L
/L
)
55 50 45 40 35 30 25 20 15 10
-1.00
-0.95
-0.90
-0.85
-0.80
14.6%16.2%
Water content (% sat.)
SR-900
Thick film SR-900
SR
0.0 0.1 0.2 0.3 0.4 0.5
0.1
1
10
100
1000
10000
Thick film SR-900
SR-1000
Clay
Silt loam
Ma
tric
h
ea
d (-m
)
Volumetric water content (L/L)
Sand
Sensors 2013, 13 12087
The thick films response time were then determined, though, for the targeted application, this
parameter is not crucial. To calculate this feature, the relative humidity was varied by steps, each of
30 min. The results (not shown here) evidenced that only negligible variations of sensor’s response
were observed after 1 min, indicating that the sensor’s response time was quite fast in the investigated
RH range. Recovery times were of the same order of magnitude: about 30 s were necessary for water
molecules desorption when relative humidity changed from 92.4% to 10.3%. These results may be due
to the large micropores, above 0.5 m (Figure 8), that are necessary for rapid response to humidity
changes [21]. The measured response and recovery times are shorter than the values reported in [21],
for pure and Sn4+
or Mo6+
-doped MgFe2O4, and in [28], for Li-substituted Mg-ferrite, and are
comparable to the ones mentioned in [34] for Mn-Zn ferrites.
3.4. Preliminary Field Testing
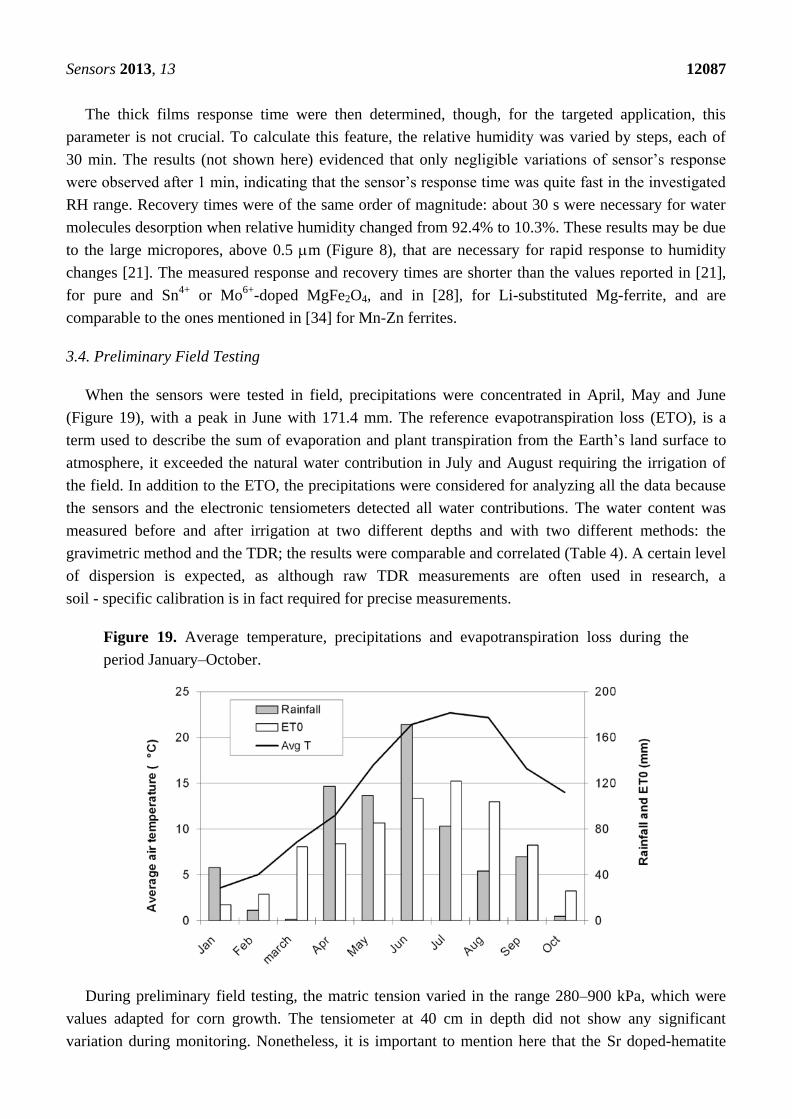
When the sensors were tested in field, precipitations were concentrated in April, May and June
(Figure 19), with a peak in June with 171.4 mm. The reference evapotranspiration loss (ETO), is a
term used to describe the sum of evaporation and plant transpiration from the Earth’s land surface to
atmosphere, it exceeded the natural water contribution in July and August requiring the irrigation of
the field. In addition to the ETO, the precipitations were considered for analyzing all the data because
the sensors and the electronic tensiometers detected all water contributions. The water content was
measured before and after irrigation at two different depths and with two different methods: the
gravimetric method and the TDR; the results were comparable and correlated (Table 4). A certain level
of dispersion is expected, as although raw TDR measurements are often used in research, a
soil - specific calibration is in fact required for precise measurements.
Figure 19. Average temperature, precipitations and evapotranspiration loss during the
period January–October.
During preliminary field testing, the matric tension varied in the range 280–900 kPa, which were
values adapted for corn growth. The tensiometer at 40 cm in depth did not show any significant
variation during monitoring. Nonetheless, it is important to mention here that the Sr doped-hematite
Sensors 2013, 13 12088
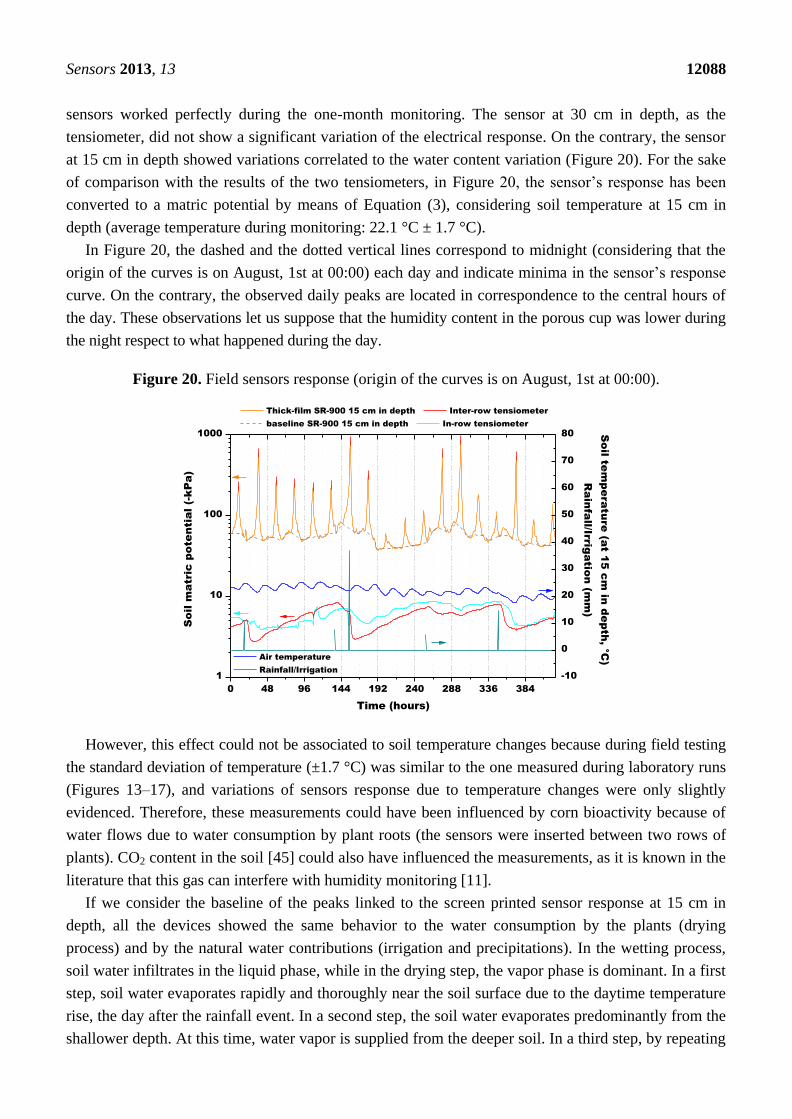
sensors worked perfectly during the one-month monitoring. The sensor at 30 cm in depth, as the
tensiometer, did not show a significant variation of the electrical response. On the contrary, the sensor
at 15 cm in depth showed variations correlated to the water content variation (Figure 20). For the sake
of comparison with the results of the two tensiometers, in Figure 20, the sensor’s response has been
converted to a matric potential by means of Equation (3), considering soil temperature at 15 cm in
depth (average temperature during monitoring: 22.1 °C ± 1.7 °C).
In Figure 20, the dashed and the dotted vertical lines correspond to midnight (considering that the
origin of the curves is on August, 1st at 00:00) each day and indicate minima in the sensor’s response
curve. On the contrary, the observed daily peaks are located in correspondence to the central hours of
the day. These observations let us suppose that the humidity content in the porous cup was lower during
the night respect to what happened during the day.
Figure 20. Field sensors response (origin of the curves is on August, 1st at 00:00).
However, this effect could not be associated to soil temperature changes because during field testing
the standard deviation of temperature (±1.7 °C) was similar to the one measured during laboratory runs
(Figures 13–17), and variations of sensors response due to temperature changes were only slightly
evidenced. Therefore, these measurements could have been influenced by corn bioactivity because of
water flows due to water consumption by plant roots (the sensors were inserted between two rows of
plants). CO2 content in the soil [45] could also have influenced the measurements, as it is known in the
literature that this gas can interfere with humidity monitoring [11].
If we consider the baseline of the peaks linked to the screen printed sensor response at 15 cm in
depth, all the devices showed the same behavior to the water consumption by the plants (drying
process) and by the natural water contributions (irrigation and precipitations). In the wetting process,
soil water infiltrates in the liquid phase, while in the drying step, the vapor phase is dominant. In a first
step, soil water evaporates rapidly and thoroughly near the soil surface due to the daytime temperature
rise, the day after the rainfall event. In a second step, the soil water evaporates predominantly from the
shallower depth. At this time, water vapor is supplied from the deeper soil. In a third step, by repeating
0 48 96 144 192 240 288 336 384
1
10
100
1000
So
il m
atric
p
ote
ntia
l (-k
Pa
)
Time (hours)
Thick-film SR-900 15 cm in depth Inter-row tensiometer
baseline SR-900 15 cm in depth In-row tensiometer
-10
0
10
20
30
40
50
60
70
80
Air temperature
Rainfall/Irrigation
So
il te
mp
era
tu
re
(a
t 1
5 c
m in
d
ep
th
, °C
)
Ra
in
fa
ll/Irrig
atio
n (m
m)
Sensors 2013, 13 12089
diurnal variations of humidity, surface soil becomes dry due to the decreasing of the supply of water
vapor from deeper soil [46]. All the instruments recorded the humidity changes in the soil. However,
sensor response times were variable: the tensiometers tended to detect the wetting front before the
screen printed sensors. Water moves through the soil profile at variable rates depending on the initial
soil moisture status. The initial (pre-rainfall/pre-irrigation) soil moisture content was comparable for
each of the sensors as all have identical irrigation (and rainfall) histories. They also have been installed
in a quite identical relative position in the irrigation wetting zone. Given these factors it could be assumed
that the sensors were in identical soil environments, however, soil is not a homogenous medium. Soil
properties always vary even in the most uniform soil types [3,4]. Then, variation in soil properties
(and the presence of preferential pathways) could contribute to the observed variation in response time.
Finally, installation may be another factor responsible for the observed differences in response time.
The soil profile has to be disturbed to install a soil moisture sensor, particularly bulk density, which of
course affects infiltration rates and consequently response times.
To conclude, both thick films, once removed from field testing, were again tested on the laboratory
apparatus, and their response (not reported here) were very close to the one plotted on Figure 11,
indicating that prolonged (one month) contact with humidity, and also probably with liquid water, did
not alter their responses.
4. Conclusions
Five wt% strontium oxide-doped hematite is a suitable material to produce low-cost humidity
sensors for soil water content determination: the material was sensitive in the range 75–100 RH% in
air, and results in simulated soil demonstrated that the sensors’ response were below the wilting point
in a sandy loam soil. During field tests, the electrical signal of the sensors was correlated to the
measurements performed with two tensiometers. It was then demonstrated that the sensor response was
influenced by water content in soil, and probably also by plants’ bioactivity.
The results also indicate the importance to evaluate and compare soil moisture sensors under
different soil characteristics (texture, temperature, bulk density, and salinity) and under different
moisture regimes, to check the influence of these features on sensor responses. The possible
interference of CO2 during humidity measurements must be studied too. This would allow a better
quantification of the accuracy of in situ measurements. In the future, different compositions could be
investigated too, in order to increase the sensors response in the range 98–100 RH%.
Acknowledgments
The Authors greatly acknowledge the Regione Piemonte (Piedmont Region) for financing this
research, through the “Bando Ricerca Scientifica Applicata”, project B17 “Messa a punto di sensori
ceramici per il controllo dell’umidità dei suoli in vista dello sviluppo di un sistema di irrigazione
sostenibile”.
Conflicts of Interest
The authors declare no conflict of interest.
Sensors 2013, 13 12090
References
1. WWAP (World Water Assessment Programme). The United Nations World Water Development
Report 2: State of the Resource: Quantity. UNESCO: Paris, France, 2012; pp. 381–400. Available
online: http://www.unesco.org/new/en/natural-sciences/environment/water/wwap/wwdr/wwdr4–2012/
(accessed on 21 July 2013)
2. WWAP (World Water Assessment Programme). The United Nations World Water Development
Report 4: Managing Water under Uncertainty and Risk. UNESCO: Paris, France, 2012;
pp. 22–43. Available online: http://www.unesco.org/new/en/natural-sciences/environment/water/
wwap/wwdr/wwdr4–2012/ (accessed on 21 July 2013).
3. Or, D.; Wraith, J.M. Soil Water Content and Water Potential Relationships. In Soil Physics
Companion, 2nd ed.; Warrick, A.W., Ed.; CRC Press LLC: Boca Raton, FL, USA, 2002; pp. 43–84.
4. Charlesworth P. Soil Water Monitoring, an Information Package. In Irrigation Insights No. 1,
2nd ed., Currey, A. Ed.; Naturally Resourceful Pty Ltd: Lismore, Australia, 2005; pp. 1–96.
5. Alvenäs, G.; Jansson, P.E. Model for evaporation, moisture and temperature of bare soil:
calibration and sensitivity analysis. Agric. For. Meteorol. 1997, 88, 47–56.
6. Fabregat-Santiago, F.; Ferriols, N.S.; Garcia-Belmonte, G.; Bisquert, J. Determination of the
humidity of soil by monitoring the conductivity with indium tin oxide glass electrodes.
Appl. Phys. Lett. 2002, 80, 2785–2787.
7. Albrecht, B.A.; Benson, C.H.; Beuermann, S. Polymer capacitance sensors for measuring soil gas
humidity in drier soil. ASTM Geotech. Test. J. 2003, 26, 3–11.
8. Carullo, A.; Parvis, M.; Vallan, A. Water Content Measurement in Granular Materials Using
Ultrasonic Waves. In Proceedings of the IEEE Instrumentation & Measurement Technology
Conference, Sensing, Processing, Networking, Ottawa, ON, Canada, 19–21 May 1997;
pp. 1246–1251.
9. Traversa, E. Ceramic sensors for humidity detection: the state-of-the-art and future developments.
Sens. Actuators B: Chem. 1995, 23, 135–156.
10. Kulwicki, B.M. Humidity sensors. J. Am. Ceram. Soc. 1991, 74, 697–708.
11. Seiyama, T.; Yamazoe, N.; Arai, H. Ceramic humidity sensors. Sens. Actuator 1983, 4, 85–96.
12. Bonnet, J.P.; Onillon, M.; Santilli, C.V. Influence of the powder morphology on the electrical
properties of -Fe2O3 ceramics. Silica. Ind. 1989, 7–8, 109–112.
13. Suri, K.; Annapoorni, S.; Sarkar, A.K.; Tandon, R.P. Gas and humidity sensors based on iron
oxide-polypyrrole nanocomposites. Sens. Actuators B: Chem. 2002, 81, 277–282.
14. Neri, G.; Bonavita, A.; Galvagno, S.; Siciliano, P.; Capone, S. CO and NO2 sensing properties of
doped-Fe2O3 thin films prepared by LPD. Sens. Actuators B: Chem. 2002, 82, 40–47.
15. Tulliani, J.M.; Baroni, C.; Lopez, C.; Dessemond, L. New NOx sensors based on hematite doped
with alkaline and alkaline-earth elements. J. Eur . Ceram. Soc. 2011, 31, 2357–2364.
16. Debliquy, M.; Baroni, C.; Boudiba, A.; Tulliani, J.M.; Olivier, M.; Zhang, C. Sensing
characteristics of hematite and barium oxide doped hematite films towards ozone and nitrogen
dioxide. Proced. Eng. 2011, 25, 219–222.
Sensors 2013, 13 12091
17. Pelino, M.; Colella, C.; Cantalini, C.; Faccio, M.; Ferri, G.; D'Amico, A. Microstructure and
electrical properties of an -hematite ceramic humidity sensor. Sens. Actuators B: Chem. 1992, 7,
464–469.
18. Traversa, E.; Gnappi, G.; Montenero, A.; Gusmano, G. Ceramic thin films by sol gel processing
as novel materials for integrated humidity sensors. Sens. Actuators B: Chem. 1996, 31, 59–70.
19. Shimizu, Y.; Arai, H.; Seiyama, T. Theoretical studies on the impedance-humidity characteristics
of ceramic humidity sensors. Sens. Actuator 1985, 7, 11–22.
20. Gusmano, G.; Montesperelli, G.; Morten, B.; Prudenziati, M.; Pumo, A.; Traversa, E. Thick films
of MgFe2O4 for humidity sensors. J. Mater. Process. Technol. 1996, 56, 589–599.
21. Rezlescu, N.; Doroftei, C.; Rezlescu, E.; Popa, P.D. Structure and humidity sensitive electrical
properties of the Sn4+
and/or Mo6+ substituted Mg ferrite. Sens. Actuators B: Chem. 2006, 115,
589–595.
22. Shah, J.; Kotnala, R.K.; Singh, B.; Kishan, H. Microstructure-dependent humidity sensitivity of
porous MgFe2O4–CeO2 ceramic. Sens. Actuators B: Chem. 2007, 128, 306–311.
23. Neri, G.; Bonavita, A.; Galvagno, S.; Pace, C.; Patanè, S.; Arena, A. Humidity sensing properties
of Li–iron oxide based thin films. Sens. Actuators B: Chem. 2001, 73, 89–94.
24. Tulliani. J.M; Bonville, P. Influence of the dopants on the electrical resistance of hematite-based
humidity sensors. Ceram. Int. 2005, 31, 507–514.
25. Neri. G.; Bonavita, A.; Galvagno, S.; Donato, N.; Caddemi, A. Electrical characterization of
Fe2O3 humidity sensors doped with Li+, Zn
2+ and Au
3+ ions. Sens. Actuators B: Chem. 2005,
111–112, 71–77.
26. Neri, G.; Bonavita, A.; Milone, C.; Pistone, A.; Galvagno, S. Gold promoted Li–Fe2O3 thin films
for humidity sensors. Sens. Actuators B: Chem. 2003, 92, 326–330.
27. Rezlescu, E.; Rezlescu, N.; Popa, P.D. Fine-grained MgCu ferrite with ionic substitutions used as
humidity sensor. J. Magn. Magn. Mater. 2005, 290–291, 1001–1004.
28. Kotnala, R.K.; Shah, J.; Singh, B.; Kishan, H.; Singh, S.; Dhawan, S.K.; Sengupta, A. Humidity
response of Li-substituted magnesium ferrite. Sens. Actuators B: Chem. 2008, 129, 909–914.
29. Zhang, J.L.; Lu, Y.D.; Wu, G.B.; Li, B.R. Electrical conduction of La1−xSrxFeO3 ceramics under
different relative humidities. Sens. Actuators A: Phys. 1991, 29, 43–47.
30. Cavalieri, A.; Caronna, T.; Natali Sora, I.; Tulliani, J.M. Electrical characterization of room
temperature humidity sensors in La0.8Sr0.2Fe1-xCuxO3 (x = 0, 0.05, 0.10). Ceram. Int. 2012, 38,
2865–2872.
31. Esteban-Cubillo, A.; Tulliani, J.M.; Pecharromán, C.; Moya, J.S. Iron-oxide nanoparticles
supported on sepiolite as a novel humidity sensor. J. Eur . Ceram. Soc. 2007, 27, 1983–1989.
32. Tulliani, J.M.; Naglieri, V.; Baroni, C. Humidity Sensors Based on Nanocrystalline Iron Oxides.
In Special Topics on Materials Science and Technology - An Italian Panorama. Acierno, D.;
D'Amore, A., Caputo, D., Cioffi, R., Eds. Brill: Leiden, The Netherlands, 2009; pp. 387–395.
33. Ito, S.; Washio, M.; Makino, I.; Koura, N.; Akashi, K. Role of potassium ions in humidity
sensitivity of K+--ferrite. Solid State Ion. 1996, 86–88, 1005–1011.
34. Arshaka, K.; Twomey, K.; Egan D. A ceramic thick film humidity sensor based on mnzn ferrite.
Sensors 2002, 2, 50–61.
Sensors 2013, 13 12092
35. Pelino, M.; Cantalini, C.; Sun, H.T.; Faccio, M. Silica effect on -Fe2O3 humidity sensor.
Sens. Actuators B: Chem. 1998, 3, 186–193.
36. Nenov, T.G.; Yordanov, S.P. Ceramic Sensor: Technology and Applications, 1st ed.; Technomic
Publishing Company, Inc.: Lancaster, PA, USA, 1996.
37. Delta Ohm srl. Available online: http://www.deltaohm.com/ver2012/download/Humiset_M_uk.pdf
(accessed on 21 July 2013).
38. SDEC France. Available online: http://www.sdec-france.com (accessed on 21 July 2013).
39. United States Department of Agriculture - Natural Resources Conservation Service. Available
online: http://soils.usda.gov/education/resources/lessons/texture/textural_tri_hi.jpg (accessed on
16 August 2013).
40. McCofferty, E.; Zettlemoyer, A.C. Adsorption of water vapour on -Fe2O3. Discuss. Faraday Soc.
1971, 52, 239–254.
41. Henrich, V.E. Electron Spectroscopic Determination of the Electronic, Geometric and
Chemisorption Properties of Oxide Surfaces. In Surfaces and Interfaces of Ceramic Materials;
Dufour L.C., Monty C., Petot-Ervas G., Eds.; Kluwer Academic Publishers: Dordrecht,
The Netherlands, 1989; pp. 1–28.
42. Yamazoe, N.; Shimizu, Y. Humidity sensors: Principles and applications. Sens. Actuator 1986,
10, 379–398.
43. Chou, K.S.; Lee, T.K.; Liu, F.J. Sensing mechanism of a porous ceramic as humidity sensors.
Sens. Actuators B: Chem. 1999, 56, 106–111.
44. Banerjee, G.; Sengupta, K. Pore size optimization of humidity sensor - a probabilistic approach.
Sens. Actuators B: Chem. 2002, 36, 34–41.
45. Wang, Y.Y.; Hu, C.S.; Ming, H.; Zhang, Y.M.; Li, X.X.; Dong, W.X.; Oenema, O. Concentration
profiles of CH4, CO2 and N2O in soils of a wheat–maize rotation ecosystem in North China Plain,
measured weekly over a whole year. Agric. Ecosyst. Environ. 2013, 164, 260–272.
46. Ishizuka, M.; Mikami, M.; Zeng, F.; Gao, W.; Yamada, Y. Measurements of soil water content
using Time Domain Reflectometry sensor and water vapor in surface soil at the Gobi site in
Taklimakan desert. J. Meteorol. Soc. Jpn. 2005, 83, 6, 987–999.
© 2013 by the authors; licensee MDPI, Basel, Switzerland. This article is an open access article
distributed under the terms and conditions of the Creative Commons Attribution license
(http://creativecommons.org/licenses/by/3.0/).