Embed Size (px)
Citation preview

Stronger. Safer. Better.
25th ANNUAL ENERGY SUMMITVail, Colorado
March 2, 2020

Forward-Looking and Cautionary Statements
2 |
ImagineMore
This presentation contains “forward‐looking statements” within the meaning of the Private Securities Litigation Reform Act of 1995. Forward‐looking statements include statements regardingthe long‐term fundamentals for the industry, including horizontal rig count, frac fleet supply, demand, pricing and utilization; recovery plans; expected Q1 annualized adjusted EBITDA per fleet,average active fleets, net pricing and stages per average active fleet; benefits of automation; number of dual fuel fleets expected to be operating by end of March; the rebuild cycle and cost bymajor pump component; expected investment/upgrade costs for Tier 2, Tier 4, and electric fleets; anticipated improvements of brand perception; and other statements identified by wordssuch as “could,” “may,” “might,” “will,” “likely,” “anticipates,” “intends,” “potential,” “plans,” “seeks,” “believes,” “estimates,” “expects,” “continues,” “projects” and similar references tofuture periods. Forward‐looking statements are based on FTSI’s current expectations and assumptions regarding capital market conditions, FTSI’s business, the economy and other futureconditions. Because forward‐looking statements relate to the future, by their nature, they are subject to inherent uncertainties, risks and changes in circumstances that are difficult to predict.As a result, FTSI’s actual results may differ materially from those contemplated by the forward‐looking statements. Important factors that could cause actual results to differ materially fromthose in the forward‐looking statements include, but are not limited to, the projected operations of FTSI; results of litigation, arbitration, settlements and investigations; actions by third parties,including governmental agencies; volatility in customer spending and in oil and natural gas prices, which could adversely affect demand for FTSI’s services and capital expenditures; globaleconomic conditions; excess availability of pressure pumping equipment; liabilities from operations; weather; decline in, and ability to realize, backlog; potential delay in future equipmentspecialization and new technologies, including electric fleets; shortages, delays in delivery and interruptions of supply of equipment and materials; ability to hire and retain personnel; loss of, orreduction in business with, key customers; difficulty with growth and in integrating acquisitions; product liability; political, economic and social instability risk; ability to effectively identify andenter new markets; cybersecurity risk; dependence on our subsidiaries to meet our long‐term debt obligations; variable rate indebtedness risk; and anti‐takeover measures in our charterdocuments and other risks and uncertainties. Any forward‐looking statement made in this presentation speaks only as of the date on which it is made. FTSI undertakes no obligation to publiclyupdate or revise any forward‐looking statement, except as required by law.
When considering these forward‐looking statements, you should keep in mind the risk factors and other cautionary statements in FTSI’s filings with the SEC, including the most recently filedForms 10‐Q and 10‐K. FTSI’s filings may be reviewed on FTSI’s website at ftsi.com or through the SEC’s Electronic Data Gathering and Analysis Retrieval System (EDGAR) at http://www.sec.gov.
This presentation also contains non‐GAAP measures, which are used by management to evaluate the operating performance of the business and Adjusted EBITDA is a metric used formanagement incentive compensation. These non‐GAAP measures should not be used by investors or others as the sole basis for formulating investment decisions, as they exclude a number ofimportant items. The Company believes the non‐GAAP measures it uses are important indicators of operating performance because they exclude the effects of the Company’s capital structureand certain non‐cash items from the Company’s operating results. FTSI’s definition of non‐GAAP measures may differ from other industry peer companies. The Company does not providecertain reconciliations of forward‐looking non‐GAAP measures included herein or the most directly comparable forward looking GAAP measures because the timing and nature of excludeditems are unreasonably difficult to fully and accurately estimate.

FTSI At A GlanceLarge, Pure-Play Pressure Pumper with unwavering attention to safety and service quality
3 |
ImagineMore
Pure-Play Focus on Frac
~$2.5mm
Maint Capex per Fleet~1/2 peer Average
~$104MM FCF (1)
IN 2019
3rd Highest Net Promoter Score
of public Competitors
Disciplined Capital
Deployment
50%+ Savings on Consumables
vs. 3rd Parties
Operating at
RecordEfficiency
ProvenmGMT Team
Dedicated Customer Model
Large Scalewith broad
geographic reach
Benefits fromInternal Manufacturing
Note: See Appendix for a reconciliations and calculations of FTSI’s Free Cash Flow, Free Cash Flow, including asset disposal and joint venture sale proceeds, and Net Debt.(1) Includes proceeds from disposal of assets of $3.3 million and proceeds from sale of equity interest in joint venture affiliate of $30.7 million.
~$93mm reduction in
net debt IN 2019
Ahead of Schedule on
Cost Cutting- $40MM Annualized Target -

Recent Company Trends

200
250
300
350
400
450
500
550
4Q17 1Q18 2Q18 3Q18 4Q18 1Q19 2Q19 3Q19 4Q19 1Q20 2Q20 3Q20 4Q20 1Q21 2Q21 3Q21 4Q21
US Frac Fleet Demand US Frac Fleet Supply (Analyst Estimates) Illustrative US Supply with 1.5% Reduction
Illustrative US Supply with 3.0% Reduction Illustrative US Supply with 5.0% Reduction
Long-Term Fundamentals Are Stabilizing
5 |
ImagineMore
Frac Fleet Supply / Demand & Utilization
Source: Wall Street research and FactSet transcripts.(1) Reduction from Q4 2019 to Q1 2020.
Frac Fleets
Frac fleet supply growth outpaced demand in late 2017 and 2018 resulting in oversupply that put pressure on pricing
Furthermore, demand for frac equipment declined in 2019 incentivizing operators to stack under‐performing fleets and eventually retire equipment
Looking to the future, we see the market and pricing stabilizing evidenced by a modestly tightening supply / demand imbalance; however, we expect there to be limited pricing power for the foreseeable future
(1)
Significant pricing pressureModerate pricing pressure
(1)
(1)

FTSI Gas BasinsFTSI Oil Basins
Legend:
...Reposition Fleets into More Active Oil‐Rich RegionsDespite the Worsening Supply / Demand Imbalance
FTSI in 2018 & 2019 Redeploying Fleets to More Active Regions Came at a Steep Cost
6 |
ImagineMore
0
5
10
15
100
150
200
250
1Q17 2Q17 3Q17 4Q17 1Q18 2Q18 3Q18 4Q18 1Q19 2Q19 3Q19 4Q19FTSI Gas Basin Fleets US Gas Rigs
Natural Gas Weakness Initiated PrecipitousDecline in US Gas Basin Rig Counts Causing Us To...
Considerable price concessions were
necessary to successfully redeploy
fleets into Mid‐Con & Texas10
12
14
16
18
400
500
600
700
1Q17 2Q17 3Q17 4Q17 1Q18 2Q18 3Q18 4Q18 1Q19 2Q19 3Q19 4Q19FTSI Oil Basin Fleets FTSI Oil Basin Rig Count
Rigs Fleets
Rigs Fleets
Source: Baker Hughes rig count. (1) FTSI active fleet count in Haynesville and Marcellus / Utica.(2) Total US gas rig count.(3) FTSI active fleet count in Eagle Ford, Mid‐Con and Permian.(4) Total oil rig count in Eagle Ford, Mid‐Con and Permian.
(3) (4)
(1) (2)
E&P sentiment shifted towards operating within cash flow, which resulted in a sudden and significant lowering of E&P capex
Lower E&P capex, coupled with depressed commodity prices, fundamentally lowered drilling and completion spending across the U.S.
The pressure pumping industry became oversupplied and E&P operators were able to successfully negotiate lower prices across the board
Gas basins, particularly Appalachia and the Haynesville, historically a strength for FTSI, have been hit especially hard in the recent macro environment
As contracts in the weaker gas basins rolled off, FTSI relocated ~1/3 of its fleet during a declining demand environment where the Company was a price taker

Positioning for Success in a Challenging Environment
7 |
ImagineMore
Cost Control1
Enhanced Commercial Strategy2
Relentlessly Push Efficiency to New Records3
Innovative Solutions w/ Fast Follower Technology Adoption4

Taking Aggressive Action to Control Costs
8 |
ImagineMore
In only one quarter we have achieved approximately 70% of our $40 million annualized target (80% of COGS / 60% of SG&A)
Driven by this initiative, we expect annualized adjusted EBITDA per fleet to be between $6 – $7 million in Q1, an increase of 9% – 27% from Q4
Management has kept costs under control ever since they took over the helm in 2014
SG&A, excluding stock‐based compensation, has increased minimally since the prior trough in 2016
• Fleet count doubled during that same time period
• Once fully implemented, we expect our cash‐SG&A spend to approach trough levels
80%
60%
70%
50%
60%
70%
80%
90%
100%
COGS(Labor and R&M)
SG&A Total
Ahead of Schedule on Cost Cuts
We’ve Had a firm grip on costs Throughout the Cycle
204 154
64 81 73 74
2
2
‐ ‐ 15 15
$206
$156
$64 $81 $88 $89
$‐
$100
$200
$300
2014 2015 2016 2017 2018 2019
Equity‐based Compensation SG&A (excl. Equity‐based Compensation)
($ in millions)

Enhanced Sales Process Allows Us to Target the Right Customers
9 |
ImagineMore In late 2018, we began directing more of our sales resources towards
solidifying longer‐term relationships instead of chasing transactional work
As 2019 progressed, we developed a new formal sales process based on customer feedback and our past success
New, finalized sales process systematically produced repeated results and an increased conversion rate in Q4 2019 and continues to prove its strength
New process produced win rate nearly 3x higher than 2019 average
Change in sales strategy is beginning to produce results
• In the last six months we placed two fleets with strategic accounts that we view as long‐term partners
• Converted one spot customer, which had used us as a swing provider, to a more stable, highly efficient, dedicated customer
• Q1 operations calendar filled up quickly and we received more‐than‐usual RFPs during the recent RFP season
Our IDEAL Customer
High Fleet Utilization Well Capitalized
Efficiency Driven
Full Development Mode
Multi-Rig Program
Values Business Partnership
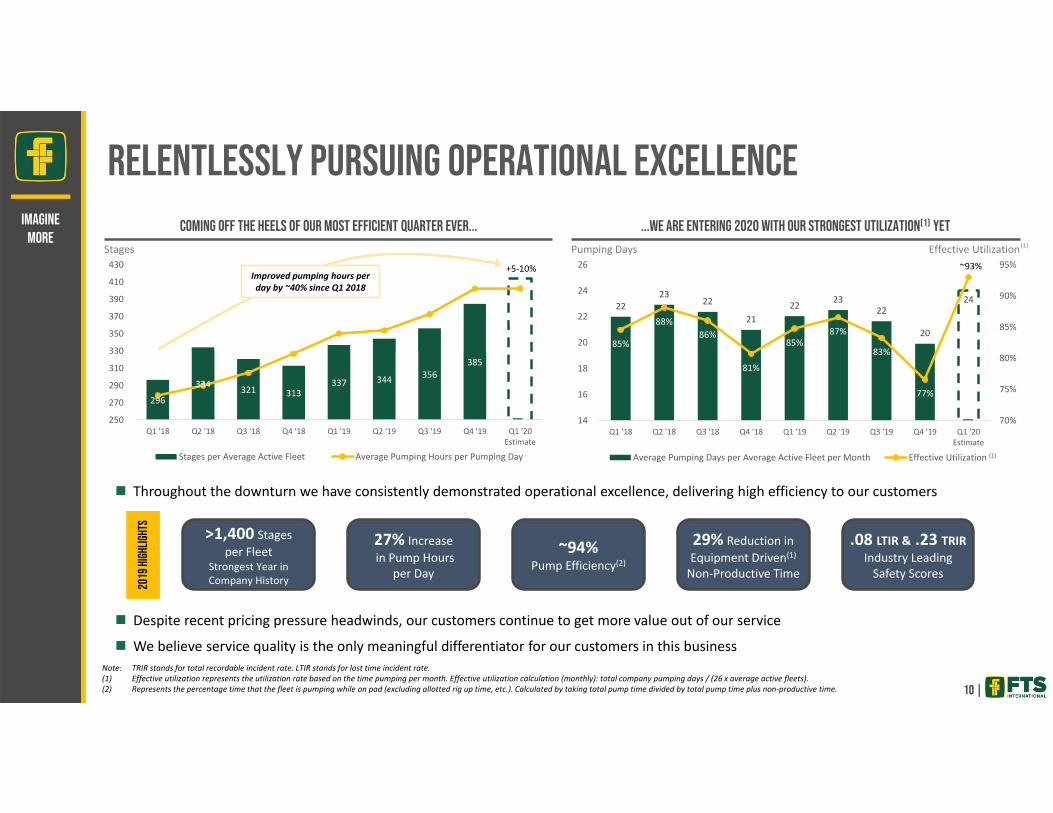
2223
22
2122 23
22
20
24
85%
88%86%
81%
85%87%
83%
77%
~93%
70%
75%
80%
85%
90%
95%
14
16
18
20
22
24
26
Q1 '18 Q2 '18 Q3 '18 Q4 '18 Q1 '19 Q2 '19 Q3 '19 Q4 '19 Q1 '20Estimate
Average Pumping Days per Average Active Fleet per Month Effective Utilization
296
334 321 313337 344 356
385
+5‐10%
8
9
10
11
12
13
14
15
250
270
290
310
330
350
370
390
410
430
Q1 '18 Q2 '18 Q3 '18 Q4 '18 Q1 '19 Q2 '19 Q3 '19 Q4 '19 Q1 '20Estimate
Stages per Average Active Fleet Average Pumping Hours per Pumping Day
Relentlessly Pursuing Operational Excellence
10 |
ImagineMore
Throughout the downturn we have consistently demonstrated operational excellence, delivering high efficiency to our customers
Despite recent pricing pressure headwinds, our customers continue to get more value out of our service
We believe service quality is the only meaningful differentiator for our customers in this business
...We Are Entering 2020 with Our Strongest Utilization(1) Yet
Note: TRIR stands for total recordable incident rate. LTIR stands for lost time incident rate.(1) Effective utilization represents the utilization rate based on the time pumping per month. Effective utilization calculation (monthly): total company pumping days / (26 x average active fleets).(2) Represents the percentage time that the fleet is pumping while on pad (excluding allotted rig up time, etc.). Calculated by taking total pump time divided by total pump time plus non‐productive time.
>1,400 Stages per Fleet
Strongest Year in Company History
27% Increasein Pump Hours
per Day
~94%Pump Efficiency(2)
29% Reduction in Equipment Driven(1)
Non‐Productive Time
.08 LTIR & .23 TRIRIndustry Leading Safety Scores
2019
Hig
hlig
hts
Pumping Days Effective Utilization
Coming Off the Heels of our Most Efficient Quarter Ever...
Stages
Improved pumping hours per day by ~40% since Q1 2018
(1)
(1)

Non‐Pumping Time per Pumping Day Pump Time per Pumping Day
2018 2019
11 |
ImagineMore
...Have Helped Bring NPT Down by >29%
Ong
oing
Initiatives
National Operations Center (NOC) Data Analytics
Helped to reduce engineering costs by >40% while also enabling the sharing of best practices
Faster recognition of equipment issues on site enables cost‐saving preventative maintenance
Ability to identify and differentiate human error from normal equipment wear in real time
Data analytics and additional equipment sensors have enabled:
• Smarter integrity management and more efficient preventative maintenance to more effectively avoid costly unplanned downtime
• Continued design enhancements of fluid ends
• Significant progress toward equipment automation
Minimizing NPT time is a major focus at FTSI and has helped improve customer satisfaction
Our Culture of Innovation Doesn’t Wait for Better DaysWe relentlessly pursue Innovative Solutions
Ongoing Technology Initiatives & Developments...
EquipmentAutomation
Predictive Sensor Analytics
Fluid End Redesign
Improved Fluid End
Components
PackingRedesign
Improved Low Pressure Manifold + MonoboreMissile
Complete Blender Redesign
Non‐Productive Time per Pumping Day Pump Time per Pumping Day

Major Operational Initiatives Are On Track
12 |
ImagineMore
/ OEM Partnership
Pump R&D
Automation project now live
Computer‐assisted pump control can now automatically take action to shut down pumps that show indicators of probable failure
Ability to seamlessly redistribute load to other pumps is in testing phase
Innovation will allow us to get more reliable hours out of our equipment, reduce costly repairs, and deliver higher quality stages
Currently focused on expanding the list of faults that result in shut down
Automation Redesigned Blender Dual Fuel
Diesel to Natural Gas Initiative
New blender incorporates more than 100 improvements from the field
Considerably more durable, easier to operate, and easier to maintain
After we complete field testing, we will decide on a cadence for deploying across company
Ended 2019 with 5 dual fuel fleets active in field
Will have 7 DF capable fleets by the end of March
Seen significant interest from customers on DF over the last 6 months to save on fuel costs
Results of initial field test of Tier 4 DGB are very good
Entered into partnership with OEM to design and test next gen pump and consumables
Keeping abreast of the latest designs and technology so we can be a “fast follower” when a superior design emerges that meets ours and our customers’ needs

$‐
$200
$400
$600
$800
$1,000
$1,200
$1,400
Q1 '17 Q2 '17 Q3 '17 Q4 '17 Q1 '18 Q2 '18 Q3 '18 Q4 '18 Q1 '19 Q2 '19 Q3 '19 Q4 '19
Gross Debt Net Debt
Free Cash Flow and Ample Liquidity Gives Us Flexibility to Address Debt While Continuing to Invest for the FutureMaintaining liquidity while deleveraging the balance sheet remains top priority
13 |
ImagineMore
Note: See Appendix for a reconciliations and calculations of FTSI’s Free Cash Flow, Free Cash Flow, including asset disposal and joint venture sale proceeds, Gross Debt (defined as Principal Amount of Debt) and Net Debt.(1) 2019 free cash flow includes asset disposal and joint venture sale proceeds totaling $34.0 million in the aggregate.(2) Through‐cycle refers to the period of Q1 2017 through Q4 2019. Through‐Cycle Free Cash Flow refers to the summation of free cash flow in the through‐cycle period.
Reduced gross debt by
over $745mm since 1Q17;
over $440mm beyond
our IPO proceeds
...Enabled Continued Deleveraging Activity Despite Market HeadwindsFree Cash Flow(1) Through-Cycle(2)...
$(38)
$10
$55
$89
$37
$71
$111
$67
$22
$(0)
$61
$21
$(28)$27
$116 $153
$223
$334
$400
$423 $422
$483 $504
$(100)
$‐
$100
$200
$300
$400
$500
$600
$(60)
$(40)
$(20)
$‐
$20
$40
$60
$80
$100
$120
Q1 '17 Q2 '17 Q3 '17 Q4 '17 Q1 '18 Q2 '18 Q3 '18 Q4 '18 Q1 '19 Q2 '19 Q3 '19 Q4 '19
Free Cash Flow Cummulative Through‐Cycle Free Cash Flow
Free Cash Flow in millions $ in millions
(1) (1)
Cumulative Through‐Cycle Free Cash Flow in millions

Recent Performance & Guidance
14 |
ImagineMore
SG&A
Annualized Adj. EBITDA per Active Fleet
Q1 2020 Guidance Compared to Q4 2019 Results
Average Active Fleets & Stages per Average Active Fleet
24.2 17.4 16.5 15.3
20.6 18.0 18.2 16.9
1.6
3.4 3.2 7.0 3.0
3.7 2.9 5.8
$25.8
$20.8 $19.7 $22.3 $23.6
$21.7 $21.1 $22.7
$‐
$5
$10
$15
$20
$25
$30
Q1 '18 Q2 '18 Q3 '18 Q4 '18 Q1 '19 Q2 '19 Q3 '19 Q4 '19
SG&A (excl. Stock‐based Compensation Stock‐based Compensation
$ in millions
$19.1 $20.8
$17.4
$13.9
$7.9 $8.0
$4.2 $5.5
$‐
$5
$10
$15
$20
$25
Q1 '18 Q2 '18 Q3 '18 Q4 '18 Q1 '19 Q2 '19 Q3 '19 Q4 '19
Inflection Point
$ in millions
Average Active Fleets 16.5 ~17(ending w/ 18‐19 active)
Net Pricing Down ~5% from Q3 Down ~5% from Q4(stable outlook thereafter)
Annualized Adjusted EBITDAper Average Active Fleet
$5.5 million $6 ‐ $7 million
Stages per average Active Fleet (Efficiency)
385 +5‐10%(driven by less white‐space)
Q4 2019 Results Q1 2020 Guidance
27.5 28.0
21.8 19.3 20.0 21.0
19.8 16.5
296.4
334.1 320.7
312.8 337.0 344.3
356.1
384.6
250
275
300
325
350
375
400
‐
5
10
15
20
25
30
Q1 '18 Q2 '18 Q3 '18 Q4 '18 Q1 '19 Q2 '19 Q3 '19 Q4 '19
Average Active Fleets Stages per Average Active Fleet
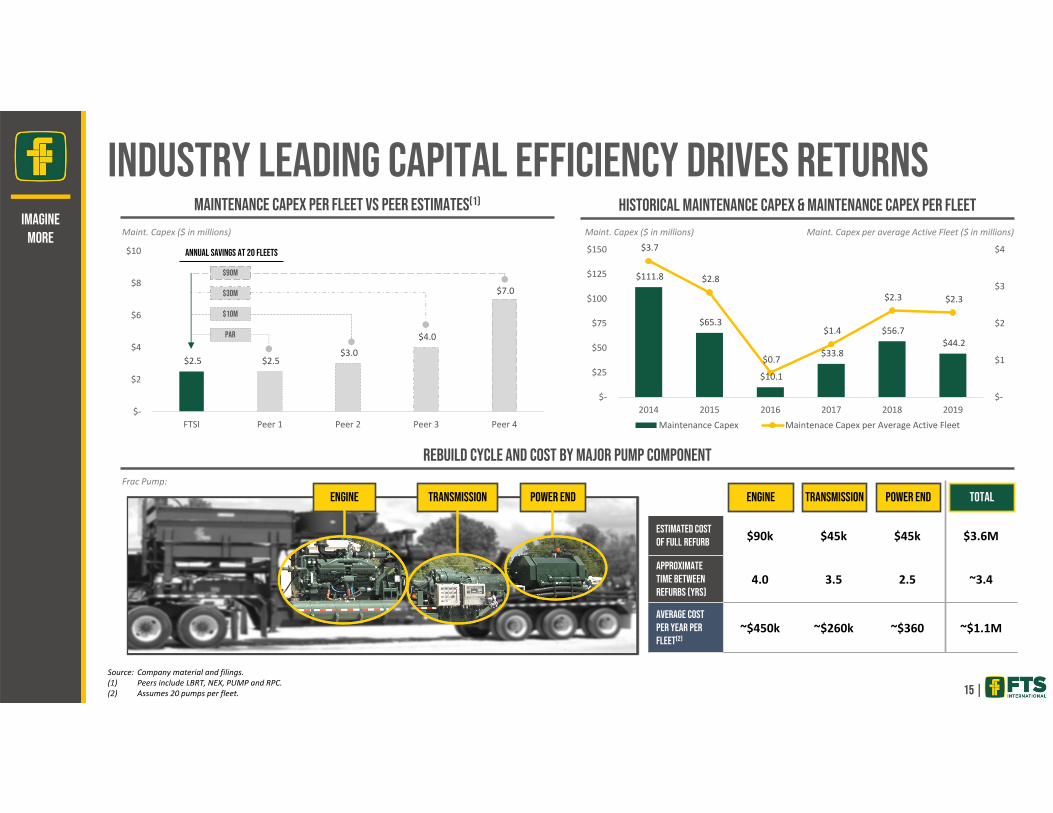
Industry Leading Capital Efficiency Drives ReturnsImagine
More
$111.8
$65.3
$10.1
$33.8
$56.7 $44.2
$3.7
$2.8
$0.7
$1.4
$2.3 $2.3
$‐
$1
$2
$3
$4
$‐
$25
$50
$75
$100
$125
$150
2014 2015 2016 2017 2018 2019Maintenance Capex Maintenace Capex per Average Active Fleet
Maint. Capex ($ in millions)
Historical Maintenance Capex & Maintenance Capex per FleetMaintenance Capex per Fleet vs Peer Estimates(1)
Maint. Capex per average Active Fleet ($ in millions)
$2.5 $2.5 $3.0
$4.0
$7.0
$‐
$2
$4
$6
$8
$10
FTSI Peer 1 Peer 2 Peer 3 Peer 4
Maint. Capex ($ in millions)
Annual Savings at 20 Fleets
$90M
$30M
$10M
Par
Source: Company material and filings.(1) Peers include LBRT, NEX, PUMP and RPC.(2) Assumes 20 pumps per fleet.
Rebuild Cycle and Cost by Major Pump Component
Engine Transmission Power End
15 |
Frac Pump:
Engine Transmission Power End
Estimated Cost of Full Refurb $90k $45k $45k $3.6M
Approximate Time Between Refurbs (Yrs)
4.0 3.5 2.5 ~3.4
Average Cost per Year per Fleet(2)
~$450k ~$260k ~$360 ~$1.1M
Total

Appendix

17 |
ImagineMore
Corporate Headquarters (Fort Worth, TX)Manufacturing Facility (Fort Worth, TX)Maintenance & Refurb Facility (Aledo, TX)District LocationsTier 2 Diesel FleetTier 2 Dual Fuel Fleet
Legend
Permian BasinEagle Ford Shale
Haynesville Shale
MidcontinentMarcellus / Utica Shale
1
1
3
6
1
1
1
3
Eagle Ford /Haynesville
(Mobile)
Marcellus/ Utica
Midcontinent
Eagle Ford
Permian/Delaware
Tier 2 Diesel Tier 2 Dual Fuel
4
9
2
1
1
Active Fleets by Location(1)
1.4 million of HHP across 28 total fleets with 17 fleets active across 5 of the most prolific basins
Large Scale Operator with Uniform “Plug and Play” Equipment BaseBroad Footprint and Plug-and-Play Equipment Allow Us to Quickly Go Where the Work Is
(1) As of 02/29/2020.

Dual Fuel – Fulfilling a Strong Interest in Natural Gas Burning Fleets
18 |
ImagineMore
It has become imperative to continuously improve efficiencies and offer cost saving solutions to customers to win and retain business
Fuel savings are a new battleground in which pressure pumpers will try to differentiate themselves
Several of our current and target customers have shown interest in retaining a natural gas burning fleet in 2020 and some will mandate dual fuel and/or electric fleets
We are ahead of our peers on Tier 2 dual fuel fleets with our first deployed in 2018
• 5 fleets have already been converted to Tier 2 dual fuel with 2 more to be converted in early 2020
• We are evaluating Tier 4 dual fuel conversions and opportunities
Tier 2 conversions cost $1.5 million per fleet while we estimate that a Tier 4 conversion would cost approximately $10 million per fleet
(1) Q4 2019 annualized adjusted EBITDA per fleet was $5.5 million.
CO2
Reduced Flaring& Emissions
Reduce FuelCosts
Natural Gas Burning Fleets Side-by-Side Comparison
Tier 2Dual Fuel
Tier 4Dual Fuel
Turbine‐PoweredElectric
Average Diesel Displacement Rate ~50% ~75% 100%
Investment / Upgrade Cost per Fleet ~$1.5 mm ~$10.0 mm ~$55.0 mm
Payback Period at 4Q19 Annualized Adj. EBITDA per Fleet (Years)(1)
0.3 1.8 10.0

Advanced Equipment Monitoring Continues to Redefine Equipment Lifecycle and Customer Experience
19 |
ImagineMore
Began monitoring vibration signatures of our equipment to provide insight into the operating health of equipment in service
2016 | Stage 1 Catch Failures
Utilized vibration signatures to augment operations and reduce damage accumulation
2017 | Stage 2 Reduce Damage
Using machine learning we are now able to remotely diagnose most equipment problems and perform targeted (conditional) maintenance before failure
2018 / 2019 | Stage 3 Change Behavior
Enable computer assisted operations to ensure consistent service quality and optimal problem resolution on every single job
2020+ | Automation

(9%)(17%)
39%
(40%)
–
40%
80%
FTSI
2017 2018 2019
0% 0% 8% 12%
25% 27%
52% 57%
Peer 1 Peer 2 Peer 3 Peer 4 Peer 5 Peer 6 Peer 7 Peer 8
Continuous Improvement Yielding ResultsCustomers Recognize Strong Improvement in Performance & Quality
20 |
ImagineMore Net Promotor Score (NPS)
Results from the 2019 Kimberlite survey shows that FTSI has improved its perception in the marketplace
• We improved our performance while some of our closest peers deteriorated
• Regionally, we are viewed most favorably in the Permian, Eagle Ford and Haynesville
• Remain favorably viewed with respect to price competitiveness and customer service
• Customers recognized improvement in equipment reliability and technical support
We achieved a significant increase in our net promotor score (“NPS”) in 2019 implying that ~6 customers went from detractor to promoter or ~12 customers went from passive to promoter
Anticipate further improvement of FTSI brand perception in 2020 survey results
(1) Peer consists of CJ, FRAC, LBRT, PTEN, PUMP, RES, SPN and USWS.
/

Adjusted EBITDA Reconciliation
21 |
ImagineMore
Adjusted EBITDA is a non‐GAAP financial measure that FTSI defines as earnings before interest; income taxes; and depreciation and amortization, as well as, the following items, if applicable: gain or loss ondisposal of assets; debt extinguishment gains or losses; inventory write‐downs, asset and goodwill impairments; gain on insurance recoveries; acquisition earn‐out adjustments; stock‐based compensation; supplycommitment charges; gain on sale of equity interest in joint venture affiliate; and acquisition or disposition transaction costs. The most comparable financial measure to Adjusted EBITDA under GAAP is netincome or loss. The Company also uses Adjusted EBITDA per average active fleet on an annualized basis, which is a non‐GAAP measure and is defined as Adjusted EBITDA divided by the average active fleets perquarter then multiplying the result by four. Adjusted EBITDA and Adjusted EBITDA per average active fleet on an annualized basis are used by management to evaluate the operating performance of the businessfor comparable periods and Adjusted EBITDA is a metric used for management incentive compensation. Adjusted EBITDA and Adjusted EBITDA per average active fleet on an annualized basis should not be usedby investors or others as the sole basis for formulating investment decisions, as they exclude a number of important items. The Company believes Adjusted EBITDA and Adjusted EBITDA per average active fleeton an annualized basis are important indicators of operating performance because they exclude the effects of the Company’s capital structure and certain non‐cash items from the Company’s operating results.Adjusted EBITDA is also commonly used by investors in the oilfield services industry to measure a company's operating performance, although FTSI’s definition of Adjusted EBITDA may differ from other industrypeer companies.
In addition, the Company does not provide a reconciliation of Q1 2020 annualized adjusted EBITDA per average active fleet or the most directly comparable forward‐looking GAAP measure of net income (loss)because the timing and nature of excluded items are unreasonably difficult to fully and accurately estimate.
(1) For the year ended December 31, 2016, Adjusted EBITDA has not been adjusted to exclude the following items: employee severance costs of $0.8 million and lease abandonment charges of $2.0 million.
$ in millions Year Ended(1) Three Months Ended Year Ended Three Months Ended Year Ended Three Months Ended Year EndedDec 31, 2016 Mar 31, 2017 Jun 30, 2017 Sep 30, 2017 Dec 31, 2017 Dec 31, 2017 Mar 31, 2018 Jun 30, 2018 Sep 30, 2018 Dec 31, 2018 Dec 31, 2018 Mar 31, 2019 Jun 30, 2019 Sep 30, 2019 Dec 31, 2019 Dec 31, 2019
Net income (loss) (188.5)$ (20.1)$ 44.3$ 83.6$ 92.9 200.7$ 78.7$ 103.6$ 49.6$ 26.5$ 258.4$ (55.0)$ 5.9$ (10.8)$ (13.0)$ (72.9)$ Interest expense, net 87.5 21.2 21.5 22.1 21.9 86.7 17.4 12.1 10.4 9.4 49.3 8.2 7.7 7.6 7.2 30.7 Income tax expense (benefit) (1.6) 0.1 0.4 0.4 0.7 1.6 1.0 0.9 0.2 (0.1) 2.0 0.2 0.1 1.0 0.1 1.4 Depreciation and amortization 112.6 21.8 21.3 22.1 21.4 86.6 20.6 20.7 21.1 22.3 84.7 22.4 22.8 22.7 22.1 90.0 Loss (gain) on disposal of assets 1.0 (0.4) (0.4) (0.8) 0.2 (1.4) 0.5 (0.2) (0.1) (0.3) (0.1) 0.3 (1.2) (0.1) (0.4) (1.4) (Gain) Loss on extinguishment of debt (53.7) ‐ ‐ ‐ 1.4 1.4 9.3 0.8 0.6 (0.9) 9.8 (0.5) 0.1 (0.8) ‐ (1.2) Stock‐based compensation ‐ ‐ ‐ ‐ ‐ ‐ 1.6 3.4 3.2 7.0 15.2 3.0 3.7 2.9 5.8 15.4 Non‐cash provision for supply commitment charges 2.5 ‐ ‐ ‐ 1.2 1.2 2.0 4.0 10.0 3.2 19.2 56.6 0.1 0.9 0.9 58.5 Inventory write‐down ‐ ‐ ‐ ‐ ‐ ‐ ‐ ‐ ‐ ‐ ‐ 1.4 ‐ ‐ ‐ 1.4 Impairment of assets and goodwill 7.0 ‐ ‐ ‐ ‐ ‐ ‐ ‐ ‐ ‐ ‐ 2.8 2.7 4.2 ‐ 9.7 Gain on sale of equity interest in joint venture affiliate ‐ ‐ ‐ ‐ ‐ ‐ ‐ ‐ ‐ ‐ ‐ ‐ ‐ (7.0) ‐ (7.0) Gain on insurance recoveries (15.1) (2.6) (0.3) ‐ ‐ (2.9) ‐ ‐ ‐ ‐ ‐ ‐ ‐ ‐ ‐ ‐
Adjusted EBITDA (48.3)$ 20.0$ 86.8$ 127.4$ 139.7$ 373.9$ 131.1$ 145.3$ 95.0$ 67.1$ 438.5$ 39.4$ 41.9$ 20.6$ 22.7$ 124.6$
Annualization factor 1.0 4.0 4.0 4.0 4.0 1.0 4.0 4.0 4.0 4.0 1.0 4.0 4.0 4.0 4.0 1.0 Annualized Adjusted EBITDA (48.3)$ 80.0$ 347.2$ 509.6$ 558.8$ 373.9$ 524.4$ 581.2$ 380.0$ 268.4$ 438.5$ 157.6$ 167.6$ 82.4$ 90.8$ 124.6$
Average Active Fleets 15.6 20.0 22.3 24.8 26.2 23.3 27.5 28.0 21.8 19.3 24.2 20.0 21.0 19.8 16.5 19.3 Annualized Adjusted EBITDA / Average Active Fleet (3.1)$ 4.0$ 15.6$ 20.5$ 21.3$ 16.0$ 19.1$ 20.8$ 17.4$ 13.9$ 18.1$ 7.9$ 8.0$ 4.2$ 5.5$ 6.5$

Free Cash Flow Reconciliation
22 |
ImagineMore
Free cash flow is a non‐GAAP financial measure that FTSI defines as cash flow from operations less capital expenditures, and free cash flow, including asset disposal and joint venture sale proceeds, is a non‐GAAPfinancial measure that FTSI defines as cash flow from operations less capital expenditures plus proceeds from disposal of assets plus proceeds from sale of equity interest in joint venture affiliate. The mostcomparable financial measure to free cash flow and free cash flow, including asset disposal and joint venture sale proceeds, is net cash provided by (used in) operating activities. Free cash flow and free cash flow,including asset disposal and joint venture sale proceeds, are used by management to evaluate our ongoing business operations. Free cash flow and free cash flow, including asset disposal and joint venture saleproceeds, should not be used by investors or others as the sole basis for formulating investment decisions, as it excludes important items. These calculations are commonly used as a basis for investors toevaluate and compare the operating performance and value of companies within our industry, although FTSI’s definition of free cash flow and free cash flow, including asset disposal and joint venture saleproceeds, may differ from other industry peer companies.
$ in millions Three Months Ended Year Ended Three Months Ended Year Ended Three Months Ended Year EndedMar 31, 2017 Jun 30, 2017 Sep 30, 2017 Dec 31, 2017 Dec 31, 2017 Mar 31, 2018 Jun 30, 2018 Sep 30, 2018 Dec 31, 2018 Dec 31, 2018 Mar 31, 2019 Jun 30, 2019 Sep 30, 2019 Dec 31, 2019 Dec 31, 2019
Net income (loss) (20.1)$ 44.3$ 83.6$ 92.9$ 200.7$ 78.7$ 103.6$ 49.6$ 26.5$ 258.4$ (55.0)$ 5.9$ (10.8)$ (13.0)$ (72.9)$
Add: non cash itemsDepreciation, depletion and amortization 21.8 21.3 22.1 21.4 86.6 20.6 20.7 21.1 22.3 84.7 22.4 22.8 22.7 22.1 90.0 Stock‐based compensation ‐ ‐ ‐ ‐ ‐ 1.6 3.4 3.2 7.0 15.2 3.0 3.7 2.9 5.8 15.4 Amortization of debt discounts and issuance costs 0.9 1.0 1.0 1.0 3.9 0.9 0.6 0.5 0.5 2.5 0.5 0.4 0.5 0.4 1.8 Impairment of assets and goodwill ‐ ‐ ‐ ‐ ‐ ‐ ‐ ‐ ‐ ‐ 2.8 2.7 4.2 ‐ 9.7 (Gain) loss on disposal of assets (0.4) (0.4) (0.8) 0.2 (1.4) 0.5 (0.2) (0.1) (0.3) (0.1) 0.3 (1.2) (0.1) (0.4) (1.4) Loss (gain) on extinguishment of debt ‐ ‐ ‐ 1.4 1.4 9.3 0.8 0.6 (0.9) 9.8 (0.5) 0.1 (0.8) ‐ (1.2) Gain on sale of equity interest in JV affiliate ‐ ‐ ‐ ‐ ‐ ‐ ‐ ‐ ‐ ‐ ‐ ‐ (7.0) ‐ (7.0) Gain on insurance recovery (2.6) (0.3) ‐ ‐ (2.9) ‐ ‐ ‐ ‐ ‐ ‐ ‐ ‐ ‐ ‐ Non‐cash provision for supply commitment charges ‐ ‐ ‐ 1.2 1.2 2.0 4.0 10.0 3.2 19.2 56.6 0.1 0.9 0.9 58.5 Cash paid to settle commitment charges ‐ ‐ ‐ (1.8) (1.8) ‐ (2.0) (0.1) (3.2) (5.3) ‐ (15.9) (0.2) (1.5) (17.6) Inventory write‐down ‐ ‐ ‐ ‐ ‐ ‐ ‐ ‐ ‐ ‐ 1.4 ‐ ‐ ‐ 1.4 Other non‐cash items (0.7) (0.3) 1.4 0.1 0.5 0.1 1.0 0.7 (3.4) (1.6) (0.8) 0.8 1.6 3.1 4.7
Net income adjusted for non cash items (1.1) 65.6 107.3 116.4 288.2 113.7 131.9 85.5 51.7 382.8 30.7 19.4 13.9 17.4 81.4
Changes in operating assets and liabilities:Accounts receivable (28.2) (71.8) (61.2) 6.3 (154.9) (32.1) (22.7) 70.8 56.7 72.7 7.7 9.1 21.9 40.3 79.0 Accounts receivable from related parties (23.1) 5.4 (4.5) 19.3 (2.9) (34.2) 14.8 15.0 7.4 3.0 ‐ ‐ ‐ ‐ ‐ Inventories (9.7) 1.5 (10.0) (1.9) (20.1) (9.1) (8.2) (6.0) 0.7 (22.6) (1.7) 7.3 11.2 2.2 19.0 Prepaid expenses and other assets 0.5 (0.6) (4.9) 0.6 (4.4) (0.3) (0.5) 1.9 1.7 2.8 0.3 (8.9) 1.7 5.4 (1.5) Accounts payable 18.1 30.2 23.8 (6.3) 65.8 26.7 (5.7) (46.2) (16.4) (41.6) (11.3) (1.0) (16.2) (18.8) (47.3) Accrued expenses and other liabilities 12.2 (7.5) 18.3 (14.7) 8.3 9.6 (10.4) 8.1 (19.6) (12.3) 8.2 (12.5) 10.1 (12.5) (6.7)
Changes in operating assets and liabilities (30.2) (42.8) (38.5) 3.3 (108.2) (39.4) (32.7) 43.6 30.5 2.0 3.2 (6.0) 28.7 16.6 42.5
Net cash provided by (used in) operating activities (31.3) 22.8 68.8 119.7 180.0 74.3 99.2 129.1 82.2 384.8 33.9 13.4 42.6 34.0 123.9 Less: capital expenditures (6.7) (13.1) (13.6) (30.6) (64.0) (37.8) (28.5) (18.6) (15.6) (100.5) (11.7) (14.8) (13.0) (14.9) (54.4)
Free cash flow (38.0)$ 9.7$ 55.2$ 89.1$ 116.0$ 36.5$ 70.7$ 110.5$ 66.6$ 284.3$ 22.2$ (1.4)$ 29.6$ 19.1$ 69.5$
Plus: Proceeds from disposal of assets 0.6 1.2 0.2 2.1 4.1 0.3 0.3 0.4 0.9 1.9 0.1 1.2 0.6 1.4 3.3 Plus: Proceeds from sale of equity interest in joint venture affiliate ‐ ‐ ‐ ‐ ‐ ‐ ‐ ‐ ‐ ‐ ‐ ‐ 30.7 ‐ 30.7
Free cash flow, including asset disposal and joint venture sale proceeds (37.4)$ 10.9$ 55.4$ 91.2$ 120.1$ 36.8$ 71.0$ 110.9$ 67.5$ 286.2$ 22.3$ (0.2)$ 60.9$ 20.5$ 103.5$

Net Debt Reconciliation
23 |
ImagineMore
Net debt is a non‐GAAP financial measure that FTSI defines as total long‐term debt plus unamortized discount and debt issuance costs less cash and cash equivalents. The most comparable financial measure tonet debt under GAAP is long‐term debt. Net debt is used by management as a measure of our financial leverage and helps our investors better understand our financial leverage. Net debt should not be used byinvestors or others as the sole basis in formulating investment decisions as it does not represent the Company’s actual indebtedness.
$ in millions Mar 31, 2017 Jun 30, 2017 Sep 30, 2017 Dec 31, 2017 Mar 31, 2018 Jun 30, 2018 Sep 30, 2018 Dec 31, 2018 Mar 31, 2019 Jun 30, 2019 Sep 30, 2019 Dec 31, 2019
Senior floating rate notes due June 2020 350.0$ 350.0$ 350.0$ 290.0$ ‐$ ‐$ ‐$ ‐$ ‐$ ‐$ ‐$ ‐$ Term loan due April 2021 431.0 431.0 431.0 431.0 331.0 231.0 161.0 121.0 106.0 101.0 90.0 90.0 Senior notes due May 2022 426.3 426.3 426.3 409.0 404.0 404.0 404.0 386.9 374.9 374.9 369.9 369.9
Total principal amount of debt (gross debt) 1,207.3 1,207.3 1,207.3 1,130.0 735.0 635.0 565.0 507.9 480.9 475.9 459.9 459.9 Less: unamortized discount and debt issuance costs (17.7) (16.7) (15.7) (13.6) (7.8) (6.5) (5.5) (4.7) (4.1) (3.7) (3.3) (3.0)
Long‐term debt 1,189.6 1,190.6 1,191.6 1,116.4 727.2 628.5 559.5 503.2 476.8 472.2 456.6 456.9 Add: unamortized discount and debt issuance costs 17.7 16.7 15.7 13.6 7.8 6.5 5.5 4.7 4.1 3.7 3.3 3.0
Total principal amount of debt (gross debt) 1,207.3 1,207.3 1,207.3 1,130.0 735.0 635.0 565.0 507.9 480.9 475.9 459.9 459.9 Less: cash and cash equivalents (126.7) (138.5) (193.8) (208.1) (155.5) (126.3) (167.2) (177.8) (172.1) (162.1) (204.2) (223.0) Net debt 1,080.6$ 1,068.8$ 1,013.5$ 921.9$ 579.5$ 508.7$ 397.8$ 330.1$ 308.8$ 313.8$ 255.7$ 236.9$


![WELCOME [s22.q4cdn.com]s22.q4cdn.com/364334381/files/doc_presentations/NVIDIA_Investor... · drivable L3/L4 self-driving car, connected to all HD maps, continuously driving/testing/refining,](https://img.pdfslide.us/doc/110x75/5afb225b7f8b9ae92b8ea0e5/welcome-s22q4cdncoms22q4cdncom364334381filesdocpresentationsnvidiainvestordrivable.jpg)