Embed Size (px)
Citation preview

Strong FoundationEvolving Challenges
A Case Study to Support Leadership Transition in the Boston Public Schools
Prepared by
The Aspen Institute — Education and Society Program
Annenberg Institute for School Reform at Brown University
March 2006

Strong Foundation | Evolving Challenges
Contents Introduction..................................................................................................................1 Context: The City and Its Schools ...............................................................................2
Governance ...............................................................................................................2 The Boston Public Schools ......................................................................................3 Public Funding..........................................................................................................4 Partners .....................................................................................................................4
Private Investment................................................................................................4 Local Partners .......................................................................................................5 Community ...........................................................................................................5 The Boston Teachers Union ................................................................................6
Reform in BPS: A Theory of Action.........................................................................6 Findings .........................................................................................................................7
Accomplishments ......................................................................................................7 Student Achievement............................................................................................8 Instructional Capacity ..........................................................................................9 Culture/Climate..................................................................................................10 District Supports ................................................................................................11
Challenges ...............................................................................................................12 Equity..................................................................................................................13 Coherence and Alignment ..................................................................................14 Partnerships and Community Involvement........................................................15
Moving Forward..........................................................................................................16 Equity......................................................................................................................17 Coherence and Alignment ......................................................................................17 Partnerships and Community Involvement............................................................18
Implications for the Transition in Leadership............................................................18 Appendices ..................................................................................................................20

Strong Foundation | Evolving Challenges
Aspen Institute | Annenberg Institute 1
Introduction
Ten years ago, Thomas W. Payzant became superintendent of the Boston Public Schools and launched a reform program based on the idea that focusing on instruction, particularly in literacy and mathematics, would improve learning for all students. This case study examines the extent of instructional improvement a decade later and the complementary efforts that the district has made to improve the capacity of teachers, principals, and central office in support of continuously improving instruction. It also identifies some of the challenges now facing the Boston Public Schools.
The purpose of the study is to inform the leadership transition that will occur as Payzant’s superintendency comes to a close in June 2006. While the superintendent’s departure is a landmark event in itself, it is likely to be accompanied by the departure of several key central office staff, and it coincides with the expected retirement of a greater-than-usual number of Boston teachers. Thus, the study is designed to inform not just a superintendent search, but a broader transition in leadership of the Boston Public Schools.
Through its programs for urban superintendents, the Aspen Institute is acutely aware of how many city school systems will be experiencing transitions similar to the one in Boston. Since Boston was to host Aspen’s biannual urban superintendents meeting in December 2005, Superintendent Payzant agreed that a study examining Boston’s experience would be informa-tive for the group. Aspen joined with the Annenberg Institute for School Reform to undertake the study. Aspen and Annenberg fielded a team of researchers to conduct the research and interviews on which the case is based. The research design was co-constructed by the Aspen-Annenberg team and a team from the Boston school district and its partners. (See Appendix A for a list of the members of the case study team.)
The research was conducted from September through November 2005 (see Appendix B for details on the study process and research methods). The process consisted of an extensive document review, a review of data on student outcomes, and interviews or focus groups with ninety-eight individuals – students, educators, central office administrators, and com-munity leaders. While this set of respondents is not a representative sample of the Boston community, it does typify a set of key roles within the district, its partners, and the co-mmunity. The resulting interviews generated a remarkably consistent set of observations about what has been accomplished, what is under way that should be preserved, and what challenges Boston’s next leadership team must address. A major purpose of this case study is to share these observations.
The case has one additional, and crucial, purpose: to spark and support a conversation about how the city—its educators, families, and communities—searches for and identifies new leadership, engages that leadership in building on what has been accomplished, and formulates the remaining challenges that new leadership needs to address.
This report is not the final nor the only word on this important subject. Several local groups are also developing documents that will inform numerous discussions over leadership transi-

Strong Foundation | Evolving Challenges
Aspen Institute | Annenberg Institute 2
tion in the Boston schools. We hope that the accumulated body of evidence and recom-mendations will enable the city to proceed confidently into the next stage of its education reform.
Context: The City and Its Schools
In recent years the city of Boston has, by many indicators, benefited from a cultural, eco-nomic, and civic resurgence. Boston’s economy boomed in the late 1990s, bringing historically low rates of crime, unemployment, and office vacancy. While Massachusetts and its flagship city are still recovering from the more difficult post–September 11, 2001, financial climate, Boston remains vital. Wages in the city are well above the average among urban areas—though, correspondingly, so are housing prices, which are fourth highest in the country. The city is home to thirty-five colleges and universities and dozens of museums, and the region boasts one of the highest rates of educational attainment in the nation. The “Big Dig,” the largest civil-works project in the history of the United States, is near completion, opening the way for improved travel in and out of the city and developing over 300 acres of parks and open space. Forbes magazine1 reported in 2004 that Boston offered the best public education of any big city in the United States.
Governance Mayor Thomas Menino has led the city since 1993 and was reelected to a fourth term in November 2005. From the beginning, education reform has been at or near the top of his agenda, assisted in part by a 1992 referendum that dissolved the elected school board and replaced it with a school committee appointed by the mayor. The stars aligned in 1995, the first opportunity for the appointed school committee to hire a superintendent. Thomas Payzant took the reins of a school system in turmoil after frequent leadership turnover: he was the third superintendent in five years. Previously, he had led several large-city school systems and served as Assistant Secretary for Elementary and Secondary Education in the Clinton administration. Payzant has enjoyed strong and consistent backing from the school committee and the mayor throughout his tenure in Boston.
A year after the school committee referendum, the Massachusetts Education Reform Act was signed into law. It led to the Massachusetts Comprehensive Assessment System (MCAS), a standards-based performance-measurement system for all students, schools, and districts in the commonwealth. MCAS testing associated with the statewide standards and curriculum frameworks began in 1998. In a comparison of the rigor of state assessment systems, published in the summer 2005 issue of Education Next, Massachusetts was one of only five states to receive an overall grade of A, meaning it is among the most rigorous. The Education Reform Act also led to the development of charter schools, public schools unaffiliated with a local school board and free from collective-bargaining agreements. The first Massachusetts charter
1 The article is available online at <www.forbes.com/realestate/2004/02/13/cx_bs_0213home.html>.
Strong Foundation | Evolving Challenges
Aspen Institute | Annenberg Institute 3
schools opened their doors in 1995. Currently, more than 4,000 Boston children attend charter schools.
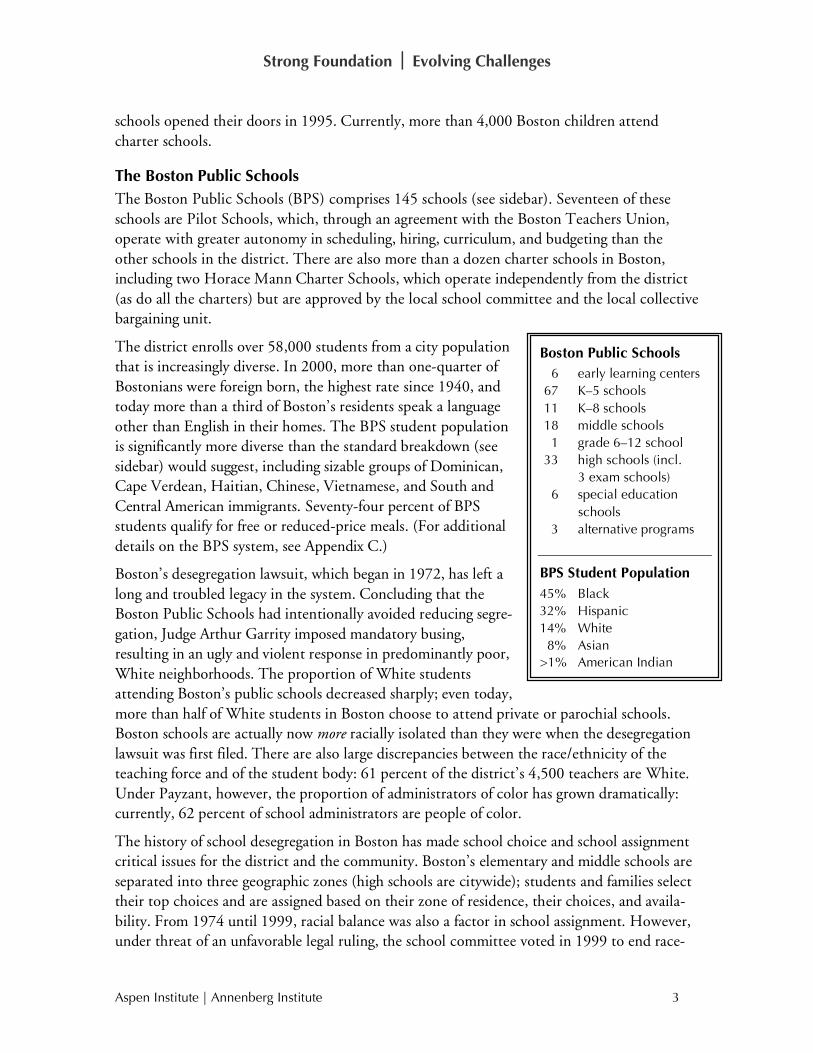
The Boston Public Schools The Boston Public Schools (BPS) comprises 145 schools (see sidebar). Seventeen of these schools are Pilot Schools, which, through an agreement with the Boston Teachers Union, operate with greater autonomy in scheduling, hiring, curriculum, and budgeting than the other schools in the district. There are also more than a dozen charter schools in Boston, including two Horace Mann Charter Schools, which operate independently from the district (as do all the charters) but are approved by the local school committee and the local collective bargaining unit.
The district enrolls over 58,000 students from a city population that is increasingly diverse. In 2000, more than one-quarter of Bostonians were foreign born, the highest rate since 1940, and today more than a third of Boston’s residents speak a language other than English in their homes. The BPS student population is significantly more diverse than the standard breakdown (see sidebar) would suggest, including sizable groups of Dominican, Cape Verdean, Haitian, Chinese, Vietnamese, and South and Central American immigrants. Seventy-four percent of BPS students qualify for free or reduced-price meals. (For additional details on the BPS system, see Appendix C.)
Boston’s desegregation lawsuit, which began in 1972, has left a long and troubled legacy in the system. Concluding that the Boston Public Schools had intentionally avoided reducing segre-gation, Judge Arthur Garrity imposed mandatory busing, resulting in an ugly and violent response in predominantly poor, White neighborhoods. The proportion of White students attending Boston’s public schools decreased sharply; even today, more than half of White students in Boston choose to attend private or parochial schools. Boston schools are actually now more racially isolated than they were when the desegregation lawsuit was first filed. There are also large discrepancies between the race/ethnicity of the teaching force and of the student body: 61 percent of the district’s 4,500 teachers are White. Under Payzant, however, the proportion of administrators of color has grown dramatically: currently, 62 percent of school administrators are people of color.
The history of school desegregation in Boston has made school choice and school assignment critical issues for the district and the community. Boston’s elementary and middle schools are separated into three geographic zones (high schools are citywide); students and families select their top choices and are assigned based on their zone of residence, their choices, and availa-bility. From 1974 until 1999, racial balance was also a factor in school assignment. However, under threat of an unfavorable legal ruling, the school committee voted in 1999 to end race-
Boston Public Schools 6 early learning centers 67 K–5 schools 11 K–8 schools 18 middle schools 1 grade 6–12 school 33 high schools (incl.
3 exam schools) 6 special education
schools 3 alternative programs
BPS Student Population 45% Black 32% Hispanic 14% White 8% Asian >1% American Indian

Strong Foundation | Evolving Challenges
Aspen Institute | Annenberg Institute 4
based school assignments. The resultant plan set aside one-half of a school’s available seats for students living in that school’s “walk zone,” with the remaining seats open to anyone in the school’s geographic zone (North, West, or East).
The elimination of the practice of taking race into consideration in school assignment most affected Boston’s three “exam” schools—high schools that require students to take and score well on an entrance test to attend. There is tremendous competition to get into the exam schools, and they are perceived as the best schools in the city, particularly Boston Latin, the nation’s oldest public school. Only the exam score and GPA are considered in assigning students to Boston Latin, Latin Academy, and O’Bryant High School of Mathematics and Science. Compared with White enrollment in BPS as a whole (14 percent), both Boston Latin and Latin Academy are disproportionately White: Boston Latin’s enrollment is over 53 percent White; Latin Academy is 39 percent White.
Public Funding Massachusetts’s and Boston’s commitment to education reform in the 1990s brought an influx of financial resources to BPS. Overall, per pupil spending increased from $6,587 in 1994 to $11,795 in 2004, an average annual increase significantly higher than the statewide average. Thirty-five percent of the total city budget is directed to BPS.2 Still, the district faced serious financial crises in fiscal years 2003 and 2004. Decreases in expected revenues, espe-cially state aid and grants, coupled with increases in fixed costs related to salaries, benefits, new schools, and mandates, led to cuts of $85 million over two years. The cuts included a 10 percent budget reduction in all schools, central office and support-service reductions of 20 percent or more, and school closings. The district is still recovering from this crisis, and, on average, schools remain funded at 6 percent below where the district believes they should be.
Partners Private investment, key partnerships, community groups, and the teachers union have each had an impact on the reform effort in BPS.
Private Investment Between 1995 and 2005, private foundations and other donors invested nearly $100 million in the city schools. For example, Carnegie Corporation and the Bill & Melinda Gates Foun-dation have provided multiyear grants totaling over $21 million to focus on improving high school education in the city. Additionally, over the last decade the Annenberg Foundation made two grants totaling $20 million, which stimulated millions more in private dollars. These investments enabled the development of Collaborative Coaching and Learning and the implementation of the district’s instructional model, Readers and Writers Workshop. (For more on these two elements, see the Reform in BPS section on page 6.)
2 In comparison, 23 percent of New York City’s budget was allocated to the public schools in 2005–06. But Hartford, Connecticut, invested more than half of its budget in its public schools.

Strong Foundation | Evolving Challenges
Aspen Institute | Annenberg Institute 5
Massachusetts 2020, an organization focusing on expanding after-school and summer learning opportunities for children across the state, helped to launch in 2004 Boston’s After School & Beyond initiative, which became the largest public-private partnership dedicated to children in Boston’s history. Built on a strong foundation laid by both Mayor Menino in the “2:00-to-6:00” initiative and the Boston After-School for All Partnership, this effort seeks to expand after-school availability for low-income children, increase resources available for after-school programs, and support research and data on out-of-school time and activities.
Local Partners The Boston Plan for Excellence (BPE) has played a significant role in the district’s reform efforts. BPE researched and co-designed key aspects of the reform, including the Whole School Improvement Planning model, Collaborative Coaching and Learning, and Readers and Writers Workshop. It also helped maintain the investment—both financial and political—of national funders and the city’s elites in the reform.
Other local organizations, such as the Boston Foundation, the Center for Collaborative Education, Jobs for the Future, and the Boston Private Industry Council (PIC), have also made it possible to build and sustain both structural and instructional reforms. For example, since 1982, the Boston PIC has convened the Boston Compact, an agreement among the city’s elites to commit their resources and support to reach key educational goals. Signers of the current Compact—made in 2000 and focused on meeting high standards, developing career and college opportunities, and developing principals and teachers—include the mayor, the school committee chair, the president and CEO of the Federal Reserve Bank of Boston, the board chair of the Boston Plan for Excellence (who is also chair emeritus of the Bank of America), the former Boston Teachers Union president, college presidents, and the chairs of the Boston Human Services Coalition and the Boston Cultural Partnership. Over the years, the Compact has had a role in the development of the Boston Plan for Excellence, Pilot Schools, and Mayor Menino’s “2:00-to-6:00” after-school initiative, among others.
Community Lively and engaged community partners have also contributed much to the city’s education reform efforts. The Boston Parent Organizing Network (BPON), with thirty-six member organizations, began as a citywide family- and community-engagement initiative launched by a diverse constituency of parents, activists, and community members “to support and advocate for the improvement of Boston Public Schools.” BPON successfully advocated for the new position of Deputy Superintendent for Family and Community Engagement and the reorgani-zation of the BPS Family Resource Centers.
The Citywide Parents Council, Inc., Massachusetts Advocates for Children, the Black Minis-terial Alliance of Greater Boston, Mass English Plus, and other groups have also worked relentlessly as voices for children and parents, particularly those without access to equal educational opportunities.

Strong Foundation | Evolving Challenges
Aspen Institute | Annenberg Institute 6
The Boston Teachers Union The Boston Teachers Union (BTU) is a powerful force in the city. The BTU represents over 8,000 members, about 4,500 of whom are teachers working in the school system. In the past fifteen years, agreements to develop Pilot Schools, to limit some seniority-transfer provisions, and to build many of the components of whole-school improvement and Collaborative Coaching and Learning (see page 6) into the contract have given the school district more flexibility in hiring and developing school staffs. The current contract, signed in 2003, expires in August 2006. Both Payzant and BTU’s leader, Richard Stutman, hope to come to agree-ment before the superintendent departs. One potential sticking point is the BTU’s current position on Pilot Schools: Stutman has pushed for compensation for teachers working longer hours and more days in those schools.
Reform in BPS: A Theory of Action In 1996, under Payzant’s leadership, the Boston Public Schools adopted Focus On Children, a five-year education reform plan. The goal, as Payzant explained it, was not to create a few more good schools; the idea was to improve the entire district, so that all schools would be good schools. An extension of the plan, Focus on Children II, was adopted in 2001. (For a timeline of major events in BPS related to the reform efforts, see Appendix D.)
To reach that goal, the reform focuses on five elements that collectively represent a theory of action for district change.
• Setting clear expectations for what students should learn in all major subjects. To accomplish this, Boston adopted citywide learning standards, one of the first large cities to do so.
• Establishing a curriculum that gives students and teachers access to rigorous content. In place of the plethora of materials in use throughout the district, Boston adopted a single mathematics program for each grade level, for use in all schools, and a handful of reading programs.
• Creating expectations about instructional practices through a pedagogical approach, based on the Readers and Writers Workshop model but applicable to all subject areas, that encourages teachers to enable students to read, write, talk, and explore topics with teachers and their peers.
• Providing extensive support for teachers through a coherent professional development strategy designed to help them improve their instructional practice. As one element of this strategy, the district developed, in partnership with the Boston Plan for Excel-lence, a professional development approach to help teachers implement the Work-shop model effectively. Known as Collaborative Coaching and Learning, the approach provides in-school, in-classroom support from coaches skilled in content areas, along with time for teachers to collaborate with one another and the coaches to analyze student data, observe model lessons, try out the model lessons, and reflect on their practices together.

Strong Foundation | Evolving Challenges
Aspen Institute | Annenberg Institute 7
• Developing and using assessments that serve two purposes: formative (ongoing review through the school year of the progress students are making) and summative (end-of-year assessments that can be used for accountability purposes).
In addition, the theory of action suggested that high-quality school leadership was vital to school success. To that end, the district enhanced the supervision of principals and head-masters, established a program to prepare new school leaders, and provided more professional development for school leaders.
Findings
Our review of the data and our face-to-face interviews with a wide range of Boston residents yielded a rich story of an urban school district that has accomplished much and faces a number of challenges. Of course, the same could be said about many school districts. But Boston’s challenges are different from those of many other districts, in large part because of its stability. Boston’s ten-year effort to focus on instructional improvement has had some positive effects on classroom practices and outcomes; the challenge now is to build on the solid foun-dation and ensure that all children in all schools are served well. Some of these challenges might have been anticipated from the outset, but many grew out of the construction and implementation of the new system.
In some respects, one of the most remarkable aspects of the situation Boston is in is the fact that it is in that situation at all. The rapid turnover of leadership in urban districts—and the concomitant turnover in district agendas—are well known. Very few large cities have pursued an educational reform path for a decade. That Boston is considering how to move reform to a second decade is highly unusual, and it speaks well to its leaders’ vision and to the strong support for that vision in the community.
In this section we highlight some of the major findings—both accomplishments and chal-lenges—from our review. We look first at accomplishments in four areas: student achieve-ment, instructional capacity, culture/climate, and district supports.
Accomplishments Over the past ten years, the Boston Public Schools has accomplished much and has much to be proud of. Although they acknowledged that the district still has much it can improve, central office administrators, principals/headmasters, teachers, and parents all spoke very positively about the district and what it has done. They believe the district is headed in the right direction.
Perhaps the most impressive accomplishment is the success of Superintendent Payzant and district leaders in laying out a compelling vision of a whole system of successful schools and implementing it in a sustained way. Keeping the eyes on the prize has helped ensure wide-spread ownership of the district’s reforms.

Strong Foundation | Evolving Challenges
Aspen Institute | Annenberg Institute 8
Districtwide gains in achievement have attracted the attention of national funders, who have shown their support for the district’s accomplishments by investing some $96 million over the past ten years.
Student Achievement BPS has made strides in raising academic achievement, particularly among low-performing and minority students and particularly at the elementary level. (See Appendices E and F for graphs of MCAS achievement overall and by subgroups). For example, in fourth grade, the percentage of African American students passing the state’s English language arts test—that is, showing at least a “partial understanding of subject matter”—rose from 56 percent in 1998 to 71 percent in 2005, while the proportion of Hispanic fourth-graders passing the test rose from 56 percent to 66 percent over the same period. These gains were not linear, however. Passing scores rose sharply from 1998 to 2001, then leveled off between 2001 and 2003. Scores rose again in 2004, but in 2005 there was another slight drop-off in scores that was consistent across most subgroups. Still, every subgroup is performing much better than it was in 1998.
The results in mathematics have been even more dramatic. The percentage of African Ameri-can fourth-graders passing the state test rose from 35 percent to 60 percent between 1998 and 2005, and the percentage of Hispanic fourth-graders passing the test increased from 41 per-cent to 65 percent. Unlike in other districts, where improvements in elementary school have not been matched by gains in upper grades, Boston has seen achievement rise in middle and high school as well. Among tenth-graders, for example, the proportion of African American students passing the state mathematics test increased more than fourfold, from 15 percent to 62 percent, from 1998 to 2005, while the proportion of Hispanic tenth-graders passing the test jumped from 13 percent to 65 percent during that period. White and Asian passing rates, just above 50 percent in 1998, rose to 85 percent and 95 percent, respectively, in 2005. The White and Asian passing rates have been fairly steady since 2001, while the African American and Hispanic passing rates have risen each year except for 2005.
Boston’s achievement results are also reflected on national tests. In the 2005 Trial Urban District Assessment conducted by the National Assessment of Educational Progress (NAEP), Boston fourth- and eighth-graders performed as well or better than their counterparts in other large central cities in both reading and mathematics. Average scale scores in reading and mathematics for Black eighth-graders were significantly higher in Boston than for Black students in other large central cities.
Other measures of achievement also show improvements. More of Boston’s high school graduates attended postsecondary education or training: a study conducted for the Boston Private Industry Council found that 74 percent of the class of 2003 were enrolled in educa-tion or training, the highest enrollment rate in the eighteen years in which the follow-up study of graduates has been conducted.
Anecdotal evidence from our interviews also suggest improvements in student achievement. Middle and high school teachers told us that they believed that their students were more prepared than previous students.

Strong Foundation | Evolving Challenges
Aspen Institute | Annenberg Institute 9
Instructional Capacity Our interviews with educators in the central office and the schools have convinced us that the achievement gains described above did not come about by accident. The district has made a concerted effort to build instructional capacity and improve the ability of teachers and school leaders to teach effectively; these efforts have taken root and borne fruit.
Focus on Children, Boston’s reform plan, was, and is, at its heart a focus on instruction, and the centrality of teaching and learning is obvious throughout the district. Teachers, coaches, principals, and central office administrators all view instruction and learning as their primary responsibility—not the case in other districts. The district has sought to build instructional capacity by addressing four areas: curriculum, instruction, professional development, and educator quality.
Educators interviewed cited the district’s common curricula and pedagogical approaches in literacy3 and mathematics4 as a significant step. The previous practice, in which each school essentially chose its own curriculum, resulted in what one called “Greek city-states” that produced wide variations in quality. By contrast, the common curriculum has helped create coherence and promote equity by helping to make it crystal clear that all children can and should be learning to the same standards, no matter where they happen to attend school.
And, although teachers and parents have some concerns about the curriculum the district is using (see, for example, page 14), many we spoke with support the new curriculum programs. In mathematics, for example, elementary teachers praise the Investigations program, saying it provides good opportunities for open-ended problem solving that enables children to under-stand mathematics and see the connections to the real world. A study by the state office of Educational Quality and Accountability (EQA) confirms that there was a great effort at the elementary level to implement Investigations.
In addition to establishing a common curriculum, Boston took the unusual step of introduc-ing a pedagogical model and providing support to help teachers implement and use it. The Workshop model is now nearly ubiquitous in Boston classrooms, according to the EQA report, and our interviews suggest that teachers find it praiseworthy, particularly for English language arts, where teachers say the Workshop model has increased rigor in reading and writing instruction.
The district took to heart the idea of reciprocal accountability: if teachers are responsible for improving student achievement, then the district is responsible for providing teachers with the support they need to improve student learning. In putting in place the instructional strategy, Boston made a considerable investment in professional development to enable teachers to learn and use the curriculum and pedagogical approach effectively in all subjects.
3 There is no one literacy program for all Boston Public Schools; schools can choose from a handful of literacy models approved by the district. These include the Literacy Collaborative (grades 1–3), Developing Literacy First (K–3), Mondo Balanced Early Literacy (K–2), Supporting Literacy (4–8), Success for All (PK–5), and First Steps (K–3). 4 In mathematics, the common curricula used are Investigations and Connected Math.

Strong Foundation | Evolving Challenges
Aspen Institute | Annenberg Institute 10
The district used a 1999 audit by the Boston Plan for Excellence of its professional develop-ment offerings to provide more focus and coherence in professional development.5 Boston also invested heavily in school-based coaches, which teachers and principals—after some initial skepticism—now say they enthusiastically support. Teachers also told us that they consider coaching an opportunity for them to learn, which they greatly appreciate, and that they are thrilled that schools have provided them time to work on issues of practice in a sustained manner. Coaching also offers a first step toward differentiated career ladders for teachers.
The creation of Instructional Leadership Teams in each school has strengthened school leadership by enabling principals/headmasters to distribute leadership responsibilities appro-priately; and the teams, along with the institutionalization of coaching, have created new roles for classroom teachers. The recent turnover in school leadership, and the efforts by the district to strengthen the capacity of the new leaders, will help ensure stability during the transition in district leadership.
To bolster its commitment to strengthen instructional capacity, Boston and its partners have taken steps to develop a strong corps of teachers and school leaders. Despite concerns from area colleges and universities with teacher preparation programs, the district established the Boston Teacher Residency program to create an alternative route to certification for teaching in Boston. Likewise, the district created a School Leadership Institute to prepare school leaders at a time when district leaders believed that universities were not producing the leaders they needed. This program has produced a number of minority principals/ headmasters.
Culture/Climate Boston’s accomplishments in improving the culture and the climate of the district have been remarkable. To a degree rare in large school systems, teachers, school leaders, and central office administrators are focused on teaching and learning. Teachers talk knowledgeably about their students’ learning; principals talk capably about instruction; and central office adminis-trators, through initiatives like REACT (Resource Action Team), are framing more of their decisions in terms of the likely effects on schools’ ability to deliver quality instruction to all children. Moreover, educators at all levels tend to use the same language when talking about instruction.
Like the improvements in achievement, these positive changes reflect the district’s efforts to focus on instruction and to support this focus with a coherent set of policies and practices. The common curriculum has created a common vocabulary for teachers and administrators, which facilitates discussions about learning. Focused professional development and coaching provide opportunities for teachers and school leaders to address instructional issues. And the steady emphasis on achieving success at scale, not just in a few schools or programs, signaled to people throughout the district that the reform could not be waited out or avoided.
5 In 2005, BPS updated the audit, using the same framework, to measure progress on professional development spending since 1999.

Strong Foundation | Evolving Challenges
Aspen Institute | Annenberg Institute 11
These consistent messages from the district, combined with the accountability for student performance the state of Massachusetts has implemented, have strengthened Boston teachers’ and principals’/headmasters’ sense of accountability for student learning. Increasing numbers of teachers and other school staff are clear about what and how to teach and about their role in improving student achievement.
The stability in the district’s agenda also supports this cultural shift. Teachers and school leaders appear to believe that Focus on Children is the work of the district, not “the flavor of the month.”
The cultural shift affects the district’s relationships with its partners and with the city as well. The clarity of the district’s goals have facilitated partnerships, because partners can more easily be aligned with a focused agenda. The stability of the city and district leadership has also played a role in this shift toward a consistent, long-term improvement strategy. The mayor and the school committee have consistently lined up in support of the district agenda and have helped maintain its staying power. Mayor Menino, who is about to become Boston’s longest-serving mayor, has strongly backed the reforms and has appointed School Committee members who share his enthusiasm for it. The epic battles that once characterized Boston school committee meetings are no more.
District Supports In addition to developing policies and practices to support classroom instruction and help change the culture in the district, Boston has also made impressive strides in creating at the district level an infrastructure to support schools, educators, and students. This infrastructure will help ensure that the improvements last over time.
One important piece of the infrastructure we heard about repeatedly in interviews is the MyBPS system. MyBPS is a Web-based system, updated daily, for examining student data by classroom and by school. MyBPS includes such basic data as attendance, report grades, and schedule information, as well as MCAS scores by student and by item. Teachers and, espe-cially, principals/headmasters strongly support this system; more important, they say they use it to analyze data and understand students’ strengths and needs. This tool is helping turn the Boston Public Schools into a district where evidence-based practice is becoming a way of life.
Another important part of the infrastructure is the emerging portfolio of high schools and a broadened set of options for students, including exam schools, pilot schools, new small schools, and small learning communities within larger schools. Students and parents told us they like having more options, and data6 suggest that Pilot School achievement exceeds achievement in other district schools.
6 An analysis done by the Boston Public Schools on 2005 MCAS data showed higher achievement levels for tenth-graders in both English language arts and mathematics in Pilot Schools than in non-Pilot Schools. In English language arts, 78 percent of tenth-graders in Pilot Schools were passing, as opposed to 69 percent in non-Pilot Schools. In math, 70 percent in Pilot Schools were passing, as opposed to 63 percent in non-Pilot Schools. (Source: BPS Power-Point presentation, “Ensuring Coherence in Transition and Sustainability,” Boston Funders’ Conference, November 14, 2005)

Strong Foundation | Evolving Challenges
Aspen Institute | Annenberg Institute 12
Boston has also strengthened many of the operations of the district central office. Notably, the human resources office is considered much more efficient than it was in the past; as a result, schools no longer have to scramble to hire teachers after the start of school. In addi-tion, the 1999 merger of the Special Education Department and the Student Support Services Team into a single Unified Services Team has been a positive development. The goal was to align support services for students with support for classroom teaching in order to reduce the number of referrals to special education and out-of-school placements for students with dis-abilities. The effort has produced results: private placements are much lower, and the propor-tion of BPS students enrolled in special education has decreased modestly, from 22 to 19 percent.
The district also improved the communication with principals/headmasters and the super-vision of the school leaders. Payzant named principals/headmasters to the superintendent’s leadership team, which meets twice a month, and has begun to hold monthly breakfasts with principals in a school cluster, so school leaders have a better sense of district policies and district leaders have a better sense of school concerns. And Payzant’s decision to replace the reporting system for principals/headmasters with a system in which they report directly to one of three deputy superintendents has resulted in better support for principals. Principals, particularly those in elementary schools, now say they have stronger supervision and know whom to call for resources and support.
Superintendent Payzant has also undertaken a number of steps to engage communities in district reforms. Many cited the creation of the position of deputy superintendent for family and community engagement as a welcome move. The High School Renewal Group—a diverse team formed as part of the efforts to improve high school education in the city—includes partner representatives from the Boston Plan for Excellence, Jobs for the Future, and the Center for Collaborative Education, among others, in decision-making roles. And the super-intendent launched regular informal meetings with a group of community leaders to listen to their concerns.
Challenges Boston’s accomplishments are impressive and deserve recognition. But, like any district, Boston also faces challenges. In many respects, the district’s challenges are qualitatively differ-ent from those most districts face, because Boston has accomplished so much. Boston is not moving from “below basic” to “basic” in developing and sustaining reform; the district is trying to reach for “proficiency” or beyond for the full range of students.
The data suggest that the district, despite its progress so far, still has a way to go. Although the passing rates on state tests have gone up, “passing” is not “proficient,” which the state defines as “solid understanding of challenging subject matter.” While the state proficiency level is one of the highest in the nation, the proportion of Boston students who demonstrate that level of understanding is quite low. In fourth grade, for example, only 25 percent of students attained the proficient level or higher in English language arts in 2005, and only 21 percent reached those levels in mathematics. In middle and high school the proficiency rates

Strong Foundation | Evolving Challenges
Aspen Institute | Annenberg Institute 13
in both subjects are generally higher, but from 50 to 60 percent of students are still below proficiency. Achievement gaps are also substantial. In eighth-grade mathematics, half of all White students (and two-thirds of Asian students) reached the proficient level or above in 2004; only 13 percent of African American students and 15 percent of Hispanic students reached that level.
The four-year graduation rate in Boston high schools remains very low. Only 42 percent of the class of 2001—and only 30 percent of Hispanics in that class—graduated on time, according to a study by Christopher Swanson of the Urban Institute.7 However, many students remain in school for more than four years; the proportion of the class of 2001 that dropped out over five years was 23 percent. The Boston Private Industry Council’s follow-up study of graduates warns that the high dropout rate might have contributed to the high rate of college-going among the class of 2003; the proportion of students attending college would be higher if lower-performing students never even made it to graduation.
The good news is that the work thus far provides a foundation on which the district can build in the next phase of reform. And the culture of learning that the district has adopted can enable that work to go forward. Boston’s reform will never be “done”; improvement is continual.
Equity In interviews, parents expressed concerns about the uneven quality of Boston schools. They spoke frankly about going to extraordinary lengths to secure places in programs and schools they believe are good—such as advanced work classes in elementary schools, some of the Pilot Schools, and the exam high schools. The Educational Quality and Accountability study provides evidence that such concerns might be valid: the study found “noticeably” higher-quality instruction in the advanced classes and found that high school instruction was gener-ally poor except in Pilot and exam schools. Parents believe that these schools will provide opportunities for their children that they might not get in other schools. These actions produce a race for a limited number of coveted spaces, which in turn places a premium on knowledge of the options that are available, which is not always equitably shared.
The EQA study also found wide variations in instructional conditions in schools, including disparities in resources, expectations, equipment, programs, and staffing, as well as in rates of student and teacher absenteeism. These findings corroborate the stories students told us about overcrowded classrooms and inadequate facilities.
The perceptions about school quality also carry a racial undercurrent. Two of the three exam schools, for example, have disproportionately high White populations. Enrollment in the exam schools is coveted in the district, but it is unclear what combination of factors con-tributes to the perception of the schools’ superiority. Is it true superiority, or is it selectivity, history, traditional curriculum. or reputation? Given Boston’s racial history, the composition
7 Swanson, C.B. 2004. Who Graduates? Who Doesn’t? A Statistical Portrait of Public High School Graduation, Class of 2001. Washington, DC: Urban Institute.

Strong Foundation | Evolving Challenges
Aspen Institute | Annenberg Institute 14
of the student population might also be a factor. In any event, whether or not it reflects a real superiority, the existence of a “the best and the rest” categorizing of schools may be damaging to students in the other schools, who in some cases appear to have set lower sights for their academic future.
We also heard considerable concern over the quality of instruction for students with disabili-ties and English-language learners (ELL). Despite an attempt to integrate special education with regular education at the district level, many schools continue to separate the two,8 and special education teachers end up with fewer opportunities for professional development. As one principal put it, special education teachers have “almost zero” content knowledge, and expectations for students with disabilities remain low. Largely as a result, achievement for students with disabilities is low and the gaps between students in special education and those in regular education are widening.
In addition, the state initiative limiting native-language instruction for English-language learners has curtailed supports for a large population of students (more than 9,000 students, or one-sixth of the student body). And there is little understanding of how this policy change has affected outcomes for these students. Teachers feel a need for support to address student needs. In some cases, teachers said, ELL students are being referred to special education in order to receive instructional attention. Another possible concern is the literacy requirements in the elementary mathematics curriculum: students who are learning English may be having difficulty learning mathematics because of language barriers, not mathematics barriers.
We also heard concerns over equity in the central office. Although Payzant has done much to broaden and diversify the leadership team—of the ten highest-ranking central office admini-strators, six are people of color—informants we spoke with inside and outside the central office continue to hold the perception that a few administrators who are predominantly White and male control access to most resources and decision making.
Coherence and Alignment Under Focus on Children, BPS has taken a number of steps to bring coherence to the instruc-tional program and supports for schools. But our interviews suggest that a lack of alignment still remains in several areas.
One such area is the mathematics curriculum. Teachers are enthusiastic about the elementary curriculum and, to a lesser extent, the middle school program, but they also expressed con-cerns that these programs place too great an emphasis on problem solving and not enough on basic skills. Although schools can supplement the standard curriculum with additional materials, there is little central guidance on supplementary materials, and the quality of such materials varies widely from school to school. Teachers also noted that there appears to be a lack of coherence in the mathematics program across grade levels. While the K–8 programs stress investigations and problem solving, the high school program places a fairly traditional 8 In the 2005–06 school year, over 5,000 students—who constituted 44.9 percent of special education students and 8.8 percent of the total BPS student body—were enrolled in “substantially separate” special education classes. (Source: http://boston.k12.ma.us/bps/bpsglance.asp)

Strong Foundation | Evolving Challenges
Aspen Institute | Annenberg Institute 15
emphasis on procedures. Teachers feared that students leaving middle school might get lost in the high school program.
We also heard concerns about a lack of alignment in instruction. High school teachers told us the Workshop model is not as effective in mathematics as it is in English language arts. The district’s professional development efforts, while highly praised, have also been uneven. Teachers reported that there were not enough math coaches. And they suggested that coaches and other professional development strategies did not do enough to help them differentiate instruction for all students, particularly those far behind.
We also found concerns about the ability of teachers to learn from one another across schools. High school teachers and headmasters did not appear to have had opportunities to visit other schools, particularly the Pilot Schools, which were supposed to be “greenhouses” that fostered knowledge about effective practice. One Pilot School headmaster told us that she has received hundreds of visits from outside the district, but none from the Boston Public Schools. We do not know whether this is attributable to a lack of interest or opportunity on the part of Boston educators, a limitation imposed by the teachers union, which has been skeptical of the Pilots from the outset, or some other reason. In any case, the lack of communication across schools inhibits learning.
At the same time, there appears to be a lack of communication across departments within central office. Although Payzant has reorganized the office to strengthen supervision of prin-cipals, improve human resource supports, and streamline services for students, people told us that the office also remains “siloed,” with little sharing of information from department to department. For example, elementary teachers talked about the lack of direction from central office about how to integrate math, literacy, and other subject-area curricula. They attributed this to a lack of collaboration at the district office. And principals described the confusing array of coaches—literacy coaches, math coaches, and language-acquisition coaches, among others—all managed by different central office departments.
Another issue related to coherence concerns the schools’ links with community agencies, par-ticularly after-school programs. In some cases, simple logistical problems impede the coordi-nation that might enable the after-school programs to enhance student learning. For example, if the district and city could coordinate bus schedules, students would have an easier time getting from school to after-school programs. Due in part to the prevalence of choice in the district, BPS already spends about one-eighth of its budget on transportation.
Partnerships and Community Involvement District leaders have reached out to the city community and have won an impressive level of support for the reform effort. But from parents and community groups we also heard concerns about inclusiveness. There is a sense that the city’s elites—the political leadership, the business community, and the universities—have greater access to decision-making authority than other groups. The district’s close partnership with the Boston Plan for Excell-ence, which is tied to the city’s elites, is an example that many people referred to; one called the organization “the shadow government.” In part, the close tie to the elites reflects

Strong Foundation | Evolving Challenges
Aspen Institute | Annenberg Institute 16
historical connections: the twenty-year-old Boston Compact was a collaboration between the schools, the universities, and the business community. But many city residents and grassroots groups feel left out. They feel they have opportunities to provide input but are not at the table when decisions are made.
The concerns over community involvement also point to another issue we heard repeatedly: the perception of top-down decision making by the district leadership. This concern arose in particular around issues of high school redesign and the creation of small schools and small learning communities. Superintendent Payzant gave schools the opportunity to develop their own restructuring plans (although they failed to do so). Nevertheless, principals/headmasters and community leaders believe that decisions about high school redesign are made centrally, with little input from the field. One headmaster reported that he did not find out that his school was being converted into small learning communities until he heard it at a meeting.
We also heard concerns that the district’s collective bargaining agreement with the Boston Teachers Union may be impeding reforms. Although a recent contract loosened some rules over seniority and gave principals/headmasters greater authority to choose teachers compati-ble with their school’s mission, there are other provisions that some believe are hindering the reform effort. For example, even though the district is breaking some large high schools into small learning communities that are expected to be largely autonomous, some of these buildings remain, under the union agreement, single bargaining units with a single union representative. This structure threatens to undercut the redesign. In addition, union rules on overtime have made it impossible for Boston to implement the kind of extended learning opportunities enjoyed by students in some Pilot Schools, which are exempt from some parts of the bargaining agreement.
Union opposition to expanding the number of Pilot Schools threatens the district’s efforts to build a “portfolio of schools” with a variety of options for students and families. Mayor Menino has indicated that he would support lifting the statewide cap on charter schools if the union persists in blocking Pilot School applications; a confrontation is not desirable, but parents strongly support additional options. The challenge is to provide more options without affecting equity and further challenging “the rest” of the schools by leaving them with the least-motivated teachers, students, and families, exacerbating their disadvantages.
Moving Forward
Our findings point to a system that has in place many elements of a strong reform structure. The challenge is not that of creating a wholly new reform agenda. The challenge is identifying improvements that can accelerate progress toward higher levels of performance so that the Boston school system works for all students in all schools. Our findings point to three areas that the Boston education community should address as the system prepares for a transition in leadership.

Strong Foundation | Evolving Challenges
Aspen Institute | Annenberg Institute 17
Equity Many of the issues we heard about, from educators and community leaders alike, center on race and class. These are common concerns in urban districts, but few communities tackle them head on. In Boston, as in other communities, race and class are part of the story in the varying quality of schools, as well as part of the concerns about the education of English-language learners and special education students. Left unaddressed, they seep into the environment and make reform hard to sustain.
In examining whether all students are served well, Boston might ask the following questions:
• What can be done to catalyze productive communitywide conversations about the issues of race and class in the city and their impact on the city schools? How might these conversations be focused on areas of inequity that were identified above, espe-cially high schools, special education, central office leadership, and faculty racial imbalance? How might the results of such focused conversations, as well as inevitable continued concerns, both real and perceived, be factored into improvement efforts of the future?
• How can BPS ensure that all children, no matter where they attend school, have access to high-quality instruction? And how can the system and schools work to develop a “portfolio” of schools in which programs vary to meet the different needs of students, but expectations, outcomes, and rigor are consistent?
• How can BPS improve the quality of instruction for students with disabilities and English-language learners? What changes in teacher professional development, curricula, and pedagogical approach are needed to meet these students’ needs?
• How can district leaders ensure that a broad range of the city’s communities are involved in decisions about schooling?
Coherence and Alignment Focus on Children is a well-thought-out strategy to improve teaching and learning at scale in a large urban school system. The plan has a number of critical components, and Superintendent Payzant made clear from the outset that all of them had to be addressed simultaneously in order to produce the results the city needed.
At this point, it might be worthwhile for the district to take stock of the implementation of the plan to determine whether all the elements fit together and whether the district and the schools are organized as effectively as they might be to carry it out. In doing so, the district might seek answers to the following questions:
• How can the district’s curriculum and instructional approach be strengthened to provide schools with a coherent program that meets the needs of all students at all grade levels?
• How can the central office be organized to provide more efficient and effective service to schools? Can it be accomplished by making changes to the existing structure or

Strong Foundation | Evolving Challenges
Aspen Institute | Annenberg Institute 18
does the organization need to be altered more significantly? In particular, in the area of human resources, how can the district take advantage of and build on existing flexi-bility in the teachers’ contract to accelerate the hiring of and expand its efforts to “grow its own” high-quality teachers and principals?
• What is the right mix of central authority and school/educator autonomy? In what ways can central instructional guidance both accommodate and build on teacher expertise and knowledge? In particular, how can the district use the Pilot Schools to better understand and address tensions between central authority and school and educator autonomy?
• What data, in addition to standardized test scores, does the district need to collect to evaluate school quality? What data would provide information on conditions that would lead to improvement in learning down the road?
Partnerships and Community Involvement District leaders have engaged a wide range of partners to support reform efforts. Continuing and expanding the reform will require even greater resources, which additional community partners might provide. In engaging a broader segment of the community, Boston leaders should consider:
• How can parents and grassroots community members and organizations be involved to a greater degree than they now are in decisions about schooling? How might rela-tionships with existing partners, which are strongest among the elite civic, cultural, and business communities, need to change to incorporate more voices?
• How can the district enlist partners who can expand learning opportunities available to students?
• What additional information can the district provide to parents and community members about school quality, school options, and district programs?
Implications for the Transition in Leadership
In discussions of the transitions facing the Boston Public Schools, much of the attention has focused on Superintendent Payzant. He has been a visible symbol of the reform, and he has had an extraordinarily long tenure. But as Boston moves to the next phase of reform, the community needs to think about how the next leadership team will go forward.
Because of the strong support for the vision of Focus on Children, and the success that the reform has had so far, Boston would do well to select leaders who embrace the vision and who bring additional skills to make needed adjustments and carry it forward to the next level. These skills include community engagement, instruction for English-language learners and students with disabilities, and central office redesign, to name three that have emerged from our interviews as top priorities.

Strong Foundation | Evolving Challenges
Aspen Institute | Annenberg Institute 19
The new leaders might also reexamine the pace of reform. Although the district has made considerable progress, there are concerns that recent scores have plateaued. Whether that is true or not, the goal of proficiency for all students will require more rapid gains in achieve-ment. To accelerate improvement, the new administration will need to seek a balance between staying the course in key areas and taking strong and innovative action in others. The community conversations during the transition should focus on whether the community is ready for such bolder approaches to produce more dramatic improvements.
Yet, as they consider the next phase of reform, community members and the new leaders should be mindful of history—both the history of the previous decade and the longer history of education in Boston. The undercurrent of race is never far from the surface, and the new leaders would do well to remember that some members of the community feel that reform is often done to them.
Fortunately, Boston has a great deal of experience and expertise that can be brought to bear in support of the next stage of reform. By embracing partners from the community and from the local and national reform-support community, Boston can expand on the past decade’s work and serve all students well.

Strong Foundation | Evolving Challenges
Aspen Institute | Annenberg Institute 20
Appendices
A. The Case Study Team
B. Methods: How the Study Was Conducted
C. Facts and Figures: Boston Public Schools at a Glance
D. Timeline of Major Events in BPS: 1992–2005
E. English Language Arts and Mathematics Achievement in Grades 4, 8, and 11: 1998–2005
F. MCAS Performance by Race/Ethnicity – Grades 4, 7 & 8, and 10

Strong Foundation | Evolving Challenges
Appendix A
Aspen Institute | Annenberg Institute A-1
The Case Study Team
Many people contributed to the development of this case study. A four-member External Review Team with deep expertise in complex urban school system reform led the design, data collection, analysis, and writing of the case study.
• Anthony Bryk, Aspen Education Program advisor and professor at the Stanford University School of Education
• Deanna Burney, an independent consultant with experience as a teacher, principal and central administrator
• Norm Fruchter, Director, Institute for Education and Social Policy at New York University • Warren Simmons, Executive Director, Annenberg Institute for School Reform
The work of the External Review Team and research staff was coordinated and organized by
• Judy Wurtzel, Aspen Institute • Ellen Foley, Annenberg Institute • Dennie Palmer Wolf, Annenberg Institute
working closely with
• Greg Baker, superintendent-in-training working in Boston Public Schools Baker served as the point person in the district for gathering documents, scheduling interviews and focus groups, and advising on the case study. He also led a Liaison Team made up of Boston Public School employees and partners, who advised on the design of the case study and reviewed draft versions of this report. The Liaison Team included:
• Rachel Curtis, Assistant Superintendent, Boston Public Schools • Maryellen Donahue, Director of Research and Evaluation, Boston Public Schools • Ellen Guiney, Executive Director, Boston Plan for Excellence • Elliot Stern, Principal, Edison Middle School • Anand Vaishnav, Chief of Staff, Boston Public Schools • Janet Williams, Deputy Superintendent, Boston Public Schools
In addition, the Rev. Gregory Groover of the Black Ministerial Alliance and John Mudd of Mass Advocates for Children commented on a draft of the case prior to its publication.
The following Annenberg Institute staff members reviewed documents, researched key background information, recorded notes in interviews and focus groups, coded and analyzed data, and/or responded to drafts of the case:
• Frank Barnes • Charley Cummings • Pia Durkin
• Deborah King • Michael Kubiak • Tracie Potochnik
• Hal Smith • Joanne Thompson • Marla Ucelli
Anita Nester of the Annenberg Institute developed the Web-based briefing book that housed all the background on the case for use by the members of the case-study team. Robert Rothman of the Annenberg Institute was the primary author of the case study. Susan Fisher edited and formatted the final document, with Margaret Balch-Gonzalez and Mary Arkins; Haewon Kim designed the cover.

Strong Foundation | Evolving Challenges
Appendix B
Aspen Institute | Annenberg Institute B-1
Methods: How the Study Was Conducted
This case focused on Boston’s efforts to build an infrastructure to support instructional improvement, with attention to the policies, investments, and partnerships related to building this capacity, the evidence about the effects of these efforts, and identification of the challenges that are the most stubborn and urgent to address in the future.
It is a core belief of both the Annenberg Institute and the Aspen Institute that collaboration and partnership are integral aspects of education reform and of effective practice in supporting education reform. To that end, we utilized a tiered staffing plan that drew on core leaders and partners of the Boston Public Schools and a team of major external consultants, as well as Annenberg and Aspen staff. Appendix A describes the roles of all the people involved.
Developing the case involved three major steps:
• Review of existing information on reform implementation and reform outcomes • Research design, data collection, and coding • Analysis and writing
Step 1. Review of Existing Information In September and October, with the help of the Liaison Team and the BPS Point Person, Annenberg Institute staff developed an electronic briefing book that included over fifty documents, among them descriptions of key BPS policies, research reports done by external organizations, and additional information gathered by Annenberg staff (contextual information about Boston, a reform timeline, budget summary, etc.). Documents were organized in the following areas: Boston Background, Essential Reading on Instructional Improvement, Student Achievement, and Building Human Resources.
All the documents were reviewed and summarized systematically by Annenberg staff and coded summaries were loaded into a qualitative data analysis program (N6). This database was then used to support the development of lists of informants and interview and focus-group protocols for Step 2.
Step 2. Research Design, Data Collection, and Coding Through consultation among the BPS Liaison Team, the BPS Point Person, the External Review Team, and Annenberg Institute and Aspen Institute staff, a list of key informants and key focus areas was developed. The BPS Point Person scheduled almost all the data-collection efforts, totaling twenty-nine interviews and fourteen focus groups, primarily conducted by the External Review Team over four days in mid- to late October. Table 1 describes the characteristics of all ninety-eight people who served as informants. Individuals are not identified because they were promised confidentiality.

Strong Foundation | Evolving Challenges
Aspen Institute | Annenberg Institute B-2
Table 1 Characteristics of Focus Group and Interview Participants,
Boston Case Study: October–November 2005
Race/Ethnicity
Gender Data-
Collection Method
Participant Total White Black Latino Asian Not
recorded Male Female Inter-
view Focus Group
Central Office Staff
16 9 5 1 1 0 7 9 16 0
Partners 7 7 0 0 0 0 4 3 7 0
Community Leaders
9 3 5 1 0 0 5 4 5 1
Principals 10 4 4 2 0 0 4 6 1 2
Instructional Leaders*
17 10 3 2 1 1 3 14 0 4
Teachers 13 11 2 0 0 0 3 10 0 3
Students 17 1 5 6 4 1 9 8 0 2
Parents 9 4 3 2 0 0 3 6 0 2
Total Number 98 49 27 14 6 2 38 60 29 14
Percentage of total 100.0% 50.0% 27.6% 14.3% 6.1% 3.1% 38.8% 61.2%
* Includes Instructional Coaches and Instructional Leadership Team Members
External Review Team members facilitated a large majority of the interviews and all of the focus groups; Annenberg and Aspen staff documented them using a semi-structured protocol. All informants were asked to reflect on the accomplishments and challenges of the Payzant era and on the key issues to be addressed under a new superintendent. Additionally, individuals with knowledge in particular areas (special education or family/ community partnerships, for example) were asked questions specific to their expertise. All the notes from the interviews and focus groups were coded and loaded into the N6 qualitative database, housed at the Annenberg Institute, for further coding and analysis.
Step 3. Analysis and Writing By early November 2005, the N6 database included about ninety coded documents, include-ing close to fifty document summaries and forty-three sets of field notes. Through debriefs with the External Review Team and Aspen and Annenberg staff working on the case, a set of topic areas was generated and a text search feature was used to create additional nodes of coded data in such areas as coaching, special education, and literacy. Annenberg and Aspen staff were assigned specific sections of the notes to read and analyze, generating an early set of

Strong Foundation | Evolving Challenges
Aspen Institute | Annenberg Institute B-3
findings that was reviewed by the External Review Team. Their comments, revisions, and queries led to another draft of the document.
That draft was shared with the Liaison Team and with Superintendent Payzant. Their com-ments, which helped us identify factual problems and add nuance to the case, were incorpo-rated into this version of the case study and shared at the Aspen Urban Superintendents Network.
Next Steps Annenberg Institute and Aspen Institute staff will consult with Superintendent Payzant to strategize about how to use the case study to inform the leadership transition in Boston. Annenberg and Aspen staff will collaborate on how to utilize our experience in this work to support other districts undergoing leadership transition.

Strong Foundation | Evolving Challenges
Appendix C
Aspen Institute | Annenberg Institute C-1
Facts and Figures: The Boston Public Schools at a Glance
(Source: http://boston.k12.ma.us/bps/bpsglance.asp)
Schools & Students
Number of schools in the BPS: 145 6 early learning centers (K– grade 1)
67 elementary schools (K–5) 11 elementary & middle schools (K–8) 18 middle schools (6–8)
1 middle & high school (6–12) 30 high schools (9–12)
3 "exam" schools (7–12) 6 special education schools (K–12) 3 alternative (at–risk) programs
Of these, 17 are pilot schools (2 early learning centers, 1 elementary, 4 K-8, 2 middle, 8 high) and 2 high schools are Horace Mann charter schools approved and funded by the BPS.
Enrollment: 58,600, including: 5,470 students in kindergarten
20,500 students in grades 1-5 12,640 students in grades 6-8 18,810 students in grades 9-12
Student Demographics: 45% Black 32% Hispanic 14% White
8% Asian <1% American Indian
Free/reduced Meals: 74% of BPS students are eligible to receive free meals in school (67% free, 7% eligible for reduced-price meals).
Students Who Don't Attend the BPS*: Of the 80,300 (est.) school-age children living in Boston, 21,050 (or 26%) do not attend Boston Public Schools. They are: 44% White, 42% Black, 10% Hispanic, and 3% Asian. Of these students:

Strong Foundation | Evolving Challenges
Aspen Institute | Annenberg Institute C-2
13,450 go to private & parochial schools 3,000 go to suburban schools through METCO 4,020 go to public charter schools 580 go to private special education schools
* BPS data as of 4/5/04.
History: First in the U.S. Boston Latin School: oldest public school, 1635 Mather: oldest public elementary school, 1639 BPS: oldest public school system, 1647 English High: oldest public high school, 1821
Staff The 2005-06 school budget (all funds) includes 8,814 staff positions (FTE), a decrease of 43 positions from FY05. Here is a comparison of budgeted positions:
FY06 FY05 Positions 4,733 4,769 teachers
612 630 administrators 488 483 support personnel
1,063 1,050 aides & monitors 357 354 secretaries & clerical staff
1,109 1,124 custodial/safety/technical 451 448 part-time & summer staff
Staff Demographics
Group Teachers Administrators
Black 26% 43%
White 61% 38% Hispanic 9% 16%
Asian 5% 4%
Male 27% 33%
Female 73% 67%
Leadership Superintendent (since 10/95) Dr. Thomas W. Payzant Deputy Supt. for Teaching & Learning Christopher Coxon Deputy Supt. for Clusters & School Leaders Dr. Ingrid Carney Dr. Muriel Leonard Dr. Janet Williams Deputy Superintendent for Family Karen Richardson
& Community Engagement Chief Communications Officer Christopher Horan

Strong Foundation | Evolving Challenges
Aspen Institute | Annenberg Institute C-3
Chief Operating Officer Michael Contompasis Chief Information Officer Kimberly Rice Chief of Staff Anand Vaishhav Chief Financial Officer John McDonough
School Committee The BPS is governed by a 7-member School Committee, appointed by the Mayor from among nominees recommended by a broad-based Nominating Committee. Members serve 4-year terms.
The appointed committee replaced a 13-member elected committee in January 1992, as the result of a November 1991 referendum. In a November 1996 referendum, voters chose to retain the appointed committee rather than return to the 13-member elected committee. Current members and term expiration dates are: Dr. Elizabeth Reilinger, Chair 1/2/06 Marchelle Raynor, Vice-Chair 1/7/08 William Boyan 1/1/07 Michele Brooks 1/5/09 Helen M. Dájer 1/2/06 Alfreda Harris 1/1/07 Dr. Angel Amy Moreno 1/7/08
School Improvement: The Six Essentials Focus on Children II is the BPS's 5-year school improvement plan that builds on the work of the previous 5-year plan. Its goal is to continue raising student achievement. It states that, from SY02-06, instruction will be organized around these Six Essentials for Whole School Improvement:
1. Use effective instructional practices and create a collaborative school climate to improve student learning;
2. Examine student work and data to drive instruction and professional development; 3. Invest in professional development to improve instruction; 4. Share leadership to sustain instructional improvement; 5. Focus resources to support instructional improvement and improved student learning; 6. Partner with families and the community to support student learning;
Special Education About 11,760 students with disabilities (19% of total) are enrolled in special education programs, including:
5,160 students with mild to moderate disabilities 5,680 students with more severe disabilities who attend special BPS schools 530 students with severe disabilities who attend private and residential schools 390 students, ages 3-4, in Early Childhood programs
In addition, about 550 students enrolled in non-BPS schools receive some special education services in BPS schools.

Strong Foundation | Evolving Challenges
Aspen Institute | Annenberg Institute C-4
English Language Learning and Support About 9,800 students (17% of total) are “English language learners” (ELL) or “limited English proficient” (LEP): English is not their first language, and they are not able to perform ordinary class work in English. All receive English language support – some in formal programs and others in general education from highly qualified teachers of English. Approximate ELL enrollment by program, grades 1-12, is:
Program Approx. # of Students Sheltered English Instruction 5,450 General education with ELL support 3,870 Transitional Bilingual Education 190 Two-way* 300 * Students whose first language is Spanish and whose first language is English learn together in both
languages.
The five most common home languages of LEP students are:
Spanish 4,670 Haitian Creole 810 Cape Verdean Creole 540 Chinese 540 Vietnamese 430
BPS English language learners come from 114 different countries!
Class Size Under the contract (9/1/03-8/31/06) between the BPS and the Boston Teachers Union, the maximum numbers of students per teacher in regular education classes are: K-2 Grade 3-5 Grades 6-8 Grades 9-12 22 25 28 31
The FY05 systemwide ratio of all students to all teachers is about 13 to 1.
School Choice Elementary and middle schools are organized in three geographic zones. Students are assigned to schools in their zone of residence, based on choice and availability of seats. All high schools are citywide.
In 1999, the School Committee voted to drop race-based assignments, a policy that had been in place since 1974. The 1999 plan sets aside 50% of a school’s seats for students living in the school’s walk zone. Remaining seats are open to all applicants.
In 12/03, the committee and Superintendent appointed a task force to seek input from the public on what families like about the current plan and what they would change. In fall 2004, based on the task force’s recommendations, the committee voted to:
• maintain the current zone structure and allow students to apply for schools outside their zone of residence but within their walk zone;
• create more K-8 schools; and • convene a work group on how to measure school quality.

Strong Foundation | Evolving Challenges
Aspen Institute | Annenberg Institute C-5
Student Achievement Mass. Comprehensive Assessment System (MCAS).
On the 2004 statewide tests, the % of students who “passed” (performed at levels Needs Improvement, Proficient and Advanced) and % change from 2003 were:
% Students Passing 2004 MCAS and % Change from 2003
Grade / Test BPS % +/- State % +/- 3 Read 82% + 3% 94% + 1%
4 ELA 77% + 5% 91% + 1% 4 Math 70% + 8% 86% + 2%
6 Math 47% - 2% 75% + 1%
7 ELA 85% + 1% 93% N/C
8 Math 53% + 6% 71% + 4% 10 ELA 77% + 7% 90% + 2%
10 Math 74% + 10% 85% + 6%
SAT I.
63% of the BPS Class of 2004 took the 2004 SAT I.
Comparative results:
SAT I Results
Group ‘03 Verbal ‘04 Verbal ‘03 Math ‘04 Math BPS 434 431 453 445
MA 516 518 522 523 US 507 508 519 518
Dropout Rates
% of students who dropped out in one year:
% of starting 9th graders who dropped out over five years:
SY02: 7.2% 1997/01: 23.1% SY03: 8.0% 1998/02: 22.5%
After High School 77% of the 3,516 grads of the Class of 2002 responded to a survey for the Boston Private Industry Council on post-high school activity:
65% are in college or a training program (32% school only; 33% school & work) 27% are working only or in the military 6% are jobless but looking for work 2% are jobless and not looking for work

Strong Foundation | Evolving Challenges
Aspen Institute | Annenberg Institute C-6
Money Matters: Budget, Salaries, Per Pupil Costs
FY06 General Fund: $712,413,221*
Program Budget % of total Instruction: $417,667,702 58.6%
Regular ed. 239,905,784 33.7%
Special ed. 145,535,028 20.4%
Bilingual ed./SEI 27,504,033 3.9%
Career & tech. ed. 4,139,201 0.6% Adult ed. 325,908 0.0%
Summer Session 257,748 0.0%
Support Services $294,745,519 41.4% Employee benefits 96,382,562 13.5% Transportation 67,775,400 9.5%
Physical plant 62,917,487 8.8%
Student/school support services 46,621,278 6.5%
General admin. 16,827,840 2.4% Safety 4,220,952 0.6%
* Approved budget as of 3/23/05. Does not include supplemental appropriations for collective bargaining agreements approved after that date.
FY06 External Funds (est.): $139,959,146 Includes formula grants (e.g. No Child Left Behind), reimbursement grants (National School Lunch, Impact Aid), and competitive grants (e.g. National Science Foundation).
FY06 Average Salaries:
Title Average Salary Teachers (reg. ed.)1 $70,215 Elementary school principals2 $93,999
Middle school principals2 $96,684 High school headmasters2 $103,767 Central administrators $104,605 Custodians $40,475 Secretaries/clerical staff $39,843 School police officer $42,051 Nurses $74,304 Substitute teachers per diem $108 1 $41,521 to $80,092 2 Base salary; does not include career awards, degrees, or enrollment factors.

Strong Foundation | Evolving Challenges
Aspen Institute | Annenberg Institute C-7
FY04 Spending per Pupil (City budget):
Regular ed. Bilingual ed. Mod sped (.3) Sub sep sped (.4) Private sped (.5)
$7,610 $9,269 $13,212 $20,982 $61,937
The average FY04 per pupil expenditure (PPE) is about $10,739. In FY03, the BPS’s PPE was $10,057.
The state average was $8,273. Other district PPEs: Brockton: $8,641 – Brookline: $10,578 Cambridge: $14,840 Milton: $7,850 Worcester: $7,962

Strong Foundation | Evolving Challenges
Appendix D
Aspen Institute | Annenberg Institute D-1
Timeline of Major Events in BPS: 1992–2005
This timeline was constructed by Annenberg Institute staff by combining data from existing time-lines. Most of the information was drawn from two sources: a Boston Plan for Excellence “Timeline of Major Events” and a timeline used in presentations by Assistant Superintendent Rachel Curtis. We also consulted with other members of the Boston Case Study Liaison Team. Thanks go to all of them. Time Event
January 1992 • New, appointed Boston School Committee sworn in
June 1993 • Massachusetts Education Reform Act signed into law; includes commitment to develop state standards and assessments
August 1995 • Ellen Guiney becomes director of the Boston Plan for Excellence (BPE) and takes on focus of helping district adopt standards-based instruction
October 1995 • Tom Payzant becomes superintendent of Boston Public Schools
June 1996 • Payzant releases “Focus On Children,” a five-year strategy to raise achievement through standards-based reform
• BPE awards 21st Century School grants to 27 schools (later to be known as Cohort I)
August 1996 • The “Six Essentials” are introduced to Cohort I schools
• Cohort I schools get one day per week “coach” to support implementation of the Six Essentials
September 1996 • City-Wide Learning Standards in English Language Arts introduced
• Comprehensive School Planning implemented by BPS
November 1996 • Annenberg Foundation awards Boston $10 million Challenge grant
May 1997 • $20-million match for Annenberg Foundation grant raised
• Payzant pledges that Annenberg funds will be used to incorporate all BPS schools into reform over time
September 1997 • 23 more schools begin the reform work (Cohort II)
• Literacy coaches introduced in Cohort I schools
• City-Wide Learning Standards in Math introduced
• Comprehensive School Reform grant

Strong Foundation | Evolving Challenges
Aspen Institute | Annenberg Institute D-2
November 1997 • Boston School Committee approves the Six Essentials as the basis for reform in all BPS schools
April 1998 • Resource Action Team convened involving BPS leaders in cross-departmental effort to resolve issues that inhibit reform
May 1998 • First administration of Massachusetts Comprehensive Assessment System (MCAS) in grades 4, 8, and 10
September 1998 • Cohort III schools begin reform work, managed by new BPS office
• City-Wide Learning Standards in Science introduced
• SMART goals-promotion policy developed
• Teacher supervision and evaluation training for school administrators begins
• In-depth Review (a school quality–type review of every school) begins
December 1998 • State releases results of first MCAS test
August 1999 • Payzant adds math as an instructional focus for BPS
September 1999 • Formative assessments in reading and writing begin
• Cohort IV begins reform work, managed by BPS; all BPS schools are now engaged in reform work
• Preparation for Principalship supports begin
• Whole School Change [later, “Improvement”] Planning begins
December 1999 • Boston Plan for Excellence undertakes, with district approval, an audit of the professional development offerings; the district used the findings to increase focus and coherence in the programs
January 2000 • Payzant unifies responsibility for professional development under one deputy superintendent in response to BPE report concluding that BPS PD was “highly fragmented” and “unfocused”
March 2000 • Open hiring—giving schools more control over their staffs—is incorporated into negotiations with the teachers union, based on recommendations by the REACT Team/BPE; this proposal supported in later months by a large coalition of civic, social service, and religious groups

Strong Foundation | Evolving Challenges
Aspen Institute | Annenberg Institute D-3
September 2000 • Implementation of new math curricula (K–12)
• Math coaches introduced
• BPS coaching model defined
• Math formative assessments developed/implemented
• Reinventing Education grant from IBM—developed foundation for MyBPS assessment
October 2000 • Teachers’ contract settled, achieving more time for professional development, more flexibility in hiring, smaller class sizes, and 12% pay raises over three years
March 2001 • Payzant reorganizes central office to work more directly with principals on Whole School Improvement Planning (WSIP)
May 2001 • Payzant names 26 Effective Practice schools, based on improved achievement and implementation of WSIP
August 2001 • Second Annenberg Foundation grant ($10 million over five years), this one focused on improving professional development
September 2001 • “Cohorts” eliminated
• Collaborative Coaching and Learning (CCL) and instruction based on Readers and Writers Workshop piloted in Effective Practice schools
• School Climate initiative begins
• Literacy professional development includes Lucy Calkins, Carl Anderson, and Randy Bomer
• Revision of Six Essentials
• Development of new Whole School Improvement Planning rubric
October 2001 • Carnegie Corporation awards Boston a Schools for a New Society grant ($8.1 million over five years) to reform the city’s 12 comprehensive high schools
August 2002 • Superintendent makes CCL and Readers and Writers Workshop a priority for the system
• MyBPS—an online system to give school easy access to student performance data—begins development

Strong Foundation | Evolving Challenges
Aspen Institute | Annenberg Institute D-4
September 2002 • CCL scaled up in literacy and math
• Increase in literacy coaching in all schools
• High schools get full-time literacy coach and small learning communities begin to be developed
November 2002 • MyBPS assessment goes online
January 2003 • Federal No Child Left Behind law takes effect
• Whole School Improvement Planning realigned to NCLB
• In-depth review suspended
May 2003 • Boston Teacher Residency program is funded by Strategic Grant Partners
July 2003 • Gates Foundation awards BPS and its partners a grant ($13.6 million over four years) to create more small high schools
August 2003 • Payzant priorities include Workshop instruction, CCL, and WSIP
September 2003 • 27 Effective Practice schools named; six of the original schools dropped, seven added
December 2003 • Effective Practice schools pilot new MCAS-aligned formative assessments
March 2004 • Teachers’ contract settled with language formalizing staff roles in WSIP, CCL, and Workshop instruction
April 2004 • Disaggregated data (by gender and race/ethnicity) added to MyBPS assessment
May 2004 • Payzant’s contract extended through June 2006
June 2005 • Payzant moves responsibility for professional development to one new institute
September 2005 • Data coaches hired to work with schools on understanding formative assessment results

Strong Foundation | Evolving Challenges
Appendix E
Aspen Institute | Annenberg Institute E-1
Boston Public Schools
English Language Arts and Mathematics Achievement in Grades 4, 8, and 10
1998–2005 (Source: Massachusetts Department of Education Web site [section on MCAS])
Grade 4 ELA: Proficient or above: Dramatic increase from 2000 to 2001, followed by two years of
incremental increases (3 percentage points in 2002 and 2003), then dropping back to the 2001 level in 2005.
Needs Improvement: Growth in that category in 1999 and 2000, followed by dramatic
decrease in 2001 (13 points); has hovered between 45 and 49 percent from 2001 to 2005. Warning: Large decrease from 1998 to 1999 (8 percentage points), then sporadic small
differences from 2000 to 2004; increase from 2004 to 2005 (from 23% to 27%).

Strong Foundation | Evolving Challenges
Aspen Institute | Annenberg Institute E-2
Grade 4 Math: Proficient or above: Large increase from 1998 to 1999 (6 percentage points); basically steady
from 1999 to 2003; another large increase in 2004 (6 percentage points) and basically maintained in 2005 (drop of 1 percentage point).
Needs Improvement: Trend of increasing proportion of students scoring in this category from
1998 to 2005 (exceptions are 2000 and 2002). Warning: Overall trend of decreasing proportion of students scoring in this category (from 57%
to 32%): large decreases from 2002 to 2004 (7 percentage points each year); basically maintained (1 percentage point higher in 2005 than 2004).

Strong Foundation | Evolving Challenges
Aspen Institute | Annenberg Institute E-3
Grade 8 ELA: Proficient or above: Steady but not large increases in proportion of students in this category
from 1998 to 2000; large increase (6 percentage points) from 2000 to 2001; that increase basically maintained through 2005, with increase of 5 percentage points from 2003 to 2004 and slight drop back (3 percentage points) in 2005.
Needs Improvement: The proportion of students in this category ranges from 37% to 42% from
1998 to 2005; no clear trend and no large increases or decreases. Warning: Overall trend of steady decrease from 1998 to 2004; largest decrease from 2000 to
2001 with a drop of 6 percentage points; increase of 2 percentage points in 2005.

Strong Foundation | Evolving Challenges
Aspen Institute | Annenberg Institute E-4
Grade 8 Math: Proficient or above: No clear change from 1998 to 2000; increase of 5 percentage points from
2000 to 2001, maintained from 2001 to 2003; then another increase from 2003 to 2004 (4 percentage points); basically maintained (1 percentage point decrease) in 2005.
Needs Improvement: Growth of students scoring in this category was sporadic between 1998 to
2000, then large increase from 2000 to 2001 (8 percentage points) that has been maintained, more or less, over the next 3 years.
Warning: Overall steady trend of decreasing numbers of students in this category, with large
decrease occurring from 1998 to 1999 (8 percentage points) and larger decrease from 2000 to 2001 (11 percentage points); since 2002, proportion hovers between 47% and 54%.

Strong Foundation | Evolving Challenges
Aspen Institute | Annenberg Institute E-5
Grade 10 ELA: Proficient or above: Incremental improvement from 1998 to 2000; large increase from 2000 to
2001 (9 percentage points) and increase from 2001 to 2002 (4 percentage points); incremental progress since then.
Needs Improvement: No clear trend from 1998 to 2000, but large increase from 2000 to 2001;
incremental improvements in 2002 and 2003; slight drop-off in 2005 (2 percentage points). Warning: Steady and sometimes dramatic decreases of students scoring in this category,
particularly from 2000 to 2001 (16 percentage points), followed by 5 percentage point decreases in 2002, 2003, and 2004; slight increase in 2005 (2 percentage points).

Strong Foundation | Evolving Challenges
Aspen Institute | Annenberg Institute E-6
Grade 10 Math: Proficient or above: Fairly steady overall trend of improvement: incremental improvement from
1998 to 1999; increase of 7 percentage points from 1999 to 2000, followed by 6 point gain in 2001; 4 point drop-off in 2002, recovered with large increase in 2003 (12 percentage points), followed by 6 point gain in 2004; 3 point decrease in 2005.
Needs Improvement: No real change from 1998 to 2000; dramatic increase from 2000 to 2001
(13 percentage points); basically steady in 2002 and incremental growth in 2003 and 2004, tailing off in 2005 (drop of 3 percentage points from 2004 to 2005).
Warning: Fairly steady trend of decreasing percentages of students in this category: no real
change from 1998 to 1999, dramatic decreases in 2000 and 2001 (13 and 19 point drops respectively); 4 point increase in 2002, followed by dramatic drops in 2003 (14 points) and 2004 (10 points); 6 point growth between 2004 and 2005, but overall still 42 points lower than in 1998.

Aspen Institute | Annenberg Institute F - 1
Strong Foundation | Evolving Challenges
Appendix F
)
))) )
))
)'
'' ' ' ' ''
#
## #
# # # #
,
,, ,
, , ,,
1998 1999 2000 2001 2002 2003 2004* 2005* .0
20
40
60
80
100Percent Passing
Black
White
Asian
Hispanic
,#')
Black 56 65 62 71 70 70 74 71
White 73 83 80 84 83 85 87 87
Asian 77 85 88 86 85 84 88 86
Hispanic 56 63 60 62 72 67 75 66
WA
BH
N & % of Native American Passing: 1998: 14 (74%) of 19; 1999: 17 (63%) of 27; 2002: 24 (80%) of 30; 2001: 18 (86%) of 21; 2002: 11 (69%) of 16; 2003: 15 (79%) of 19 2004*: 17 (74%) of 23; 2005*: 17 (71%) or 24.
* SIMS file information (MCAS School and District Reports from Mass. DOE released on 9/20/04, 9/21/05)
)
)
) )) )
)
)'
''
''
''
'
#
#
# ## #
##
,
,
,,
,,
,,
1998 1999 2000 2001 2002 2003 2004* 2005* .0
20
40
60
80
100Percent Passing
Black
White
Asian
Hispanic
,#')
Black 35 49 46 51 47 55 63 60
White 61 74 74 79 76 79 84 84
Asian 77 87 91 87 83 86 91 92
Hispanic 41 50 50 54 54 60 69 65
AW
HB
N & % of Native American Passing: 1998: 8 (42%) of 19; 1999: 12 (46%) of 26; 2000: 16 (53%) of 30; 2001: 17 (81%) of 21; 2002: 8 (50%) of 16; 2003: 14 (74%) of 19 2004*: 14 (61%) of 23; 2005*: 19 (80%) of 24.
* SIMS file information (MCAS School and District Reports from Mass. DOE released on 9/20/04, 9/21/05)
MCAS Performance – Grade 4Percent of Students Passing by Race/Ethnicity
MathematicsEnglish Language Arts
Note: Grade 4 ELA test results prior to 2001 are not directly comparable with subsequent years because of changes in Performance Standards.

Aspen Institute | Annenberg Institute F - 2
Strong Foundation | Evolving Challenges
Appendix F
)
)
) )
) ) )
)
'
'
' '
' '' '
#
###
# # # #
,
,
,,
,, ,
,
1998 1999 2000 2001 2002 2003 2004* 2005* .0
20
40
60
80
100Percent Passing
Black
White
Asian
Hispanic
,#')
Black 19 28 23 33 38 36 42 40
White 55 67 61 72 70 72 75 69
Asian 67 76 74 84 81 87 87 86
Hispanic 18 22 24 38 39 39 48 43
A
W
HB
N & % of Native American Passing: 1998: 5 (29%) of 17; 1999: 6 (29%) of 21; 2000: 4 (25%) of 16; 2001: 10 (45%) of 22: 2002: 6 (35%) of 17; 2003: 8 (38%) of 21: 2004*: 8 (53%) of 15; 2005*: 12 (60%) of 20.
* SIMS file information (MCAS School and District Reports from Mass. DOE released on 9/20/04, 9/21/05)
)
)
)) )
) ) )'
'' ' '
' ' '
#
### #
# # #
,
,
, , ,
,, ,
1998(G.8)
1999(G.8)
2000(G.8)
2001(G.7)
2002(G.7)
2003(G.7)
2004*(G.7)
2005*(G.7)
.0
20
40
60
80
100Percent Passing
Black
White
Asian
Hispanic
,#')
Black 66 69 71 68 80 85 84 81
White 80 88 84 84 91 92 93 90
Asian 78 88 85 86 95 92 92 92
Hispanic 57 63 66 67 76 79 82 77
AW BH
N & % of Native American Passing: 1998: 13 (76%) of 17; 1999: 18 (95%) of 19; 2000: 13 (81%) of 16; 2001: 13 (72%) of 18; 2002: 17 (77%) of 22; 2003: 17 (85%) of 20 2004*: 16 (100%) of 16; 2005*: fewer than 10 tested.
* SIMS file information (MCAS School and District Reports from Mass. DOE released on 9/20/04, 9/21/05)
MCAS Performance – Grades 7 & 8Percent of Students Passing by Race/Ethnicity
Mathematics (Grade 8)English Language Arts (Grades 7 & 8)

Aspen Institute | Annenberg Institute F - 3
Strong Foundation | Evolving Challenges
Appendix F
)
)
) )
)) )
)
'
'
' '
''
' '
#
#
# #
# # # #
,
,
, ,
, ,,
,
1998 1999 2000 2001 2002 2003 2004* 2005* .0
20
40
60
80
100Percent Passing
Black
White
Asian
Hispanic
,#')
Black 35 36 34 62 61 66 72 69
White 67 69 69 85 87 88 89 90
Asian 61 66 64 78 86 89 90 91
Hispanic 32 36 33 55 60 63 72 64
AW
BH
N & % of Native American Passing: 1998: 4 (40%) of 10; 1999: 2 (33%) of 6; 2001: 8 (89%) of 9; 2002: 7 (64%) of 11; 2003: 13 (87%) of 15; 2004*: frewer than 10 tested;
2005*: 15 (83%) of 18.
* SIMS file information (MCAS School and District Reports from Mass. DOE released on 9/20/04, 9/21/05)
)
)
)
)
))
)
)
'
'
'
'
''
' '
#
#
#
#
##
# #
,
,
, ,
,
,
,
,
1998 1999 2000 2001 2002 2003 2004* 2005* .0
20
40
60
80
100Percent Passing
Black
White
Asian
Hispanic
,#')
Black 15 17 20 50 41 57 68 62
White 52 53 62 83 79 84 87 85
Asian 57 63 75 92 87 94 95 95
Hispanic 13 14 23 48 44 59 70 65
A
W
HB
N & % of Native American Passing: 1998: 2 (20%) of 10; 1999: 1 (17%) of 6; 2000: 7 (58%) of 12; 2001: 4 (36%) of 11; 2002: 4 (36%) of 11; 2003: 12 (80%) of 15 2004*: 6 (55%) of 11; 2005*: 12 (67%) of 18.
* SIMS file information (MCAS School and District Reports from Mass. DOE released on 9/20/04, 9/21/05)
MCAS Performance – Grade 10Percent of Students Passing by Race/Ethnicity
MathematicsEnglish Language Arts

Aspen Institute | Annenberg Institute F - 4
Strong Foundation | Evolving Challenges
Appendix F
N & % of Native American in Proficient & Advanced Levels: 1998: 1 (5%) of 19; 1999: 2 (8%) of 26; 2000: 6 (20%) of 30; 2001: 3 (14%) of 21; 2002: 5 (31%) of 16; 2003: 2 (11%) of 19; 2004*: 3 (13%) of 23; 2005*: 4 (17%) of 24.
* SIMS file information (MCAS School and District Reports from Mass. DOE released on 9/20/04, 9/21/05)
)
)) ) ) ) )
)
'
'' ' ' ' ' '
#
#
# # # # # #
,
,, , , , ,
,
1998 1999 2000 2001 2002 2003 2004* 2005* . . 20140
20
40
60
80
100Percent meeting Proficient
Black
White
Asian
Hispanic
,#')
Black 4 8 8 7 8 9 15 14
White 20 29 32 33 36 37 40 40
Asian 31 45 43 44 41 43 47 52
Hispanic 5 9 9 9 11 11 19 15
100%
*
A W
H B
)
)
) )
) ) ))
'
'
' '
'' ' '
#
#
##
##
# #
,
,
, ,
, , ,,
1998 1999 2000 2001 2002 2003 2004* 2005* . . 20140
20
40
60
80
100Percent meeting Proficient
Black
White
Asian
Hispanic
,#')
Black 2 3 3 17 19 21 25 20
White 10 13 18 41 46 52 53 45
Asian 12 15 16 49 44 44 47 47
Hispanic 2 2 2 19 20 20 26 19
100%
*
A W
B H
N & % of Native American in Proficient & Advanced Levels: 1998: 0 (0%) of 19; 1999: 2 (7%) of 27; 2000: 5 (17%) of 30; 2001: 11 (52%) of 21; 2002: 2 (13%) of 16; 2003: 7 (37%) of 19; 2004*: 8 (35%) of 23; 2005*: 7 (29%) of 24.
* SIMS file information (MCAS School and District Reports from Mass. DOE released on 9/20/04, 9/21/05)
MCAS Performance – Grade 4Percent of Students in Proficient and Advanced Levels
by Race/EthnicityEnglish Language Arts Mathematics
Note: Grade 4 ELA test results prior to 2001 are not directly comparable with subsequent years because of changes in Performance Standards.

Aspen Institute | Annenberg Institute F - 5
Strong Foundation | Evolving Challenges
Appendix F
)
)
) ) ) ) ) )
'
'
' '
''
' '
#
## ## # # #
,,
, , , , , ,
1998 1999 2000 2001 2002 2003 2004* 2005* . . 20140
20
40
60
80
100Percent meeting Proficient
Black
White
Asian
Hispanic
,#')
Black 6 6 6 9 10 11 13 12
White 34 42 40 46 44 46 48 45
Asian 42 47 50 59 52 64 66 64
Hispanic 6 6 7 9 9 12 15 16
100%
*
A
W
HB
N & % of Native American in Proficient & Advanced Levels: 1998: 2 (12%) of 17; 1999: 1 (5%) of 21; 2000: 0 (0%) of 16; 2001: 5 (23%) of 22; 2002: 0 (0%) of 17; 2003: 2 (10%) of 21; 2004*: 5 (33%) of 15; 2005*: 4 (25%) of 20.
* SIMS file information (MCAS School and District Reports from Mass. DOE released on 9/20/04, 9/21/05)
)
)
)) )
) ))
'
'
' ''
' ''
#
#
# ##
# # #
,
,, ,
,, ,
,
1998(G.8)
1999(G.8)
2000(G.8)
2001(G.7)
2002(G.7)
2003(G.7)
2004*(G.7)
2005*(G.7)
. . 20140
20
40
60
80
100Percent meeting Proficient
Black
White
Asian
Hispanic
,#')
Black 24 26 29 25 33 36 42 35
White 53 63 61 57 66 67 70 73
Asian 45 57 58 53 66 64 73 68
Hispanic 20 19 26 24 30 33 38 32
100%
*
WA
BH
N & % of Native American in Proficient & Advanced Levels: 1998: 5 (29%) of 17; 1999: 6 (32%) of 19; 2000: 7 (44%) of 16; 2001: 3 (17%) of 18; 2002: 8 (36%) of 22; 2003: 11 (55%) of 20; 2004*: 13 (81%) of 16; 2005*: fewer than 10 tested.
* SIMS file information (MCAS School and District Reports from Mass. DOE released on 9/20/04, 9/21/05)
MCAS Performance – Grades 7 & 8Percent of Students in Proficient and Advanced Levels
by Race/EthnicityMathematics (Grade 8)English Language Arts (Grades 7 & 8)

Aspen Institute | Annenberg Institute F - 6
Strong Foundation | Evolving Challenges
Appendix F
)
)
) )) )
))'
'
'
'
' '
' '
#
#
#
#
##
# #
,
,
,,
,,
,,
1998 1999 2000 2001 2002 2003 2004* 2005* . . 20140
20
40
60
80
100Percent meeting Proficient
Black
White
Asian
Hispanic
,#')
Black 4 6 10 19 15 25 31 26
White 32 36 49 65 61 65 65 70
Asian 32 39 57 72 69 84 86 87
Hispanic 5 6 9 15 13 28 35 31
100%
*A
W
HB
N & % of Native American in Proficient & Advanced Levels: 1998: 2 (20%) of 10; 1999: 1 (17%) of 6; 2000: 5 (42%) of 12; 2001: 1 (9%) of 11; 2002: 0 (0%) of 11; 2003: 8 (53%) of 15; 2004*: 0 (0%) of 11, 2005*: 8 (45%) of 18.
* SIMS file information (MCAS School and District Reports from Mass. DOE released on 9/20/04, 9/21/05)
)
)
) )
) ) ))
'
'
''
'
' ' '
#
#
# #
# # # #
,
,
,,
, , , ,
1998 1999 2000 2001 2002 2003 2004* 2005* . . 20140
20
40
60
80
100Percent meeting Proficient
Black
White
Asian
Hispanic
,#')
Black 10 10 13 25 27 28 30 28
White 46 45 47 68 68 69 68 69
Asian 32 32 38 48 62 61 62 68
Hispanic 8 10 12 21 24 24 28 27
100%
*
WA
BH
N & % of Native American in Proficient & Advanced Levels: 1998: 1 (10%) of 10; 1999: 1 (17%) of 6; 2000: 4 (33%) of 12; 2001: 4 (44%) of 9; 2002: 1 (9%) of 11; 2003: 9 (60%) of 15; 2004*: fewer than 10 tested, 2005*: 9 (50%) of 18.
* SIMS file information (MCAS School and District Reports from Mass. DOE released on 9/20/04, 9/21/05)
MCAS Performance – Grade 10Percent of Students in Proficient and Advanced Levels
by Race/EthnicityMathematicsEnglish Language Arts

One Dupont Circle, NWSuite 700Washington, DC 20036Phone: (202) 736-5800
The Education and Society Program provides an informed and neutralforum for education practitioners, researchers and policy leaders toengage in focused dialogue regarding their efforts to improve studentachievement, and to consider how public policy changes can affectprogress. Through our meetings, analysis, commissioned work and struc-tured networks of policymakers and practitioners, the Program for over25 years has developed intellectual frameworks on critical educationissues that assist federal, state and local policy makers working to improveAmerican education. (Information at www.aspeninstitute.org/education)
Annenberg: Brown UniversityBox 1985Providence RI 02912Phone: (401) 863-7990
The Annenberg Institute for School Reform is a national policy-researchand reform-support organization at Brown University that focuses onimproving conditions and outcomes in urban schools, especially thoseserving disadvantaged children. The Institute works through partnershipswith school districts and school reform networks and in collaborationwith national and local organizations skilled in educational research, pol-icy, and effective practices to offer an array of tools and strategies to helpdistricts strengthen their local capacity to provide and sustain high-qual-ity education for all students. (Information at www.annenberginstitute.org)
06-008