Embed Size (px)
Citation preview
Strong coupling between single-electron tunneling and
nano-mechanical motion
G. A. Steele1, A. K. Huttel1,∗ , B. Witkamp1, M. Poot1, H. B. Meerwaldt1, L. P. Kouwenhoven1
and H. S. J. van der Zant1
1Kavli Institute of NanoScience, Delft University of Technology, PO Box 5046, 2600 GA, Delft, The
Netherlands.
Abstract
Nanoscale resonators that oscillate at high frequencies are useful in many measurement applications.
We studied a high-quality mechanical resonator made from a suspended carbon nanotube driven into
motion by applying a periodic radio frequency potential using a nearby antenna. Single-electron charge
fluctuations created periodic modulations of the mechanical resonance frequency. A quality factor exceed-
ing 105 allows the detection of a shift in resonance frequency caused by the addition of a single-electron
charge on the nanotube. Additional evidence for the strong coupling of mechanical motion and electron
tunneling is provided by an energy transfer to the electrons causing mechanical damping and unusual
nonlinear behavior. We also discovered that a direct current through the nanotube spontaneously drives
the mechanical resonator, exerting a force that is coherent with the high-frequency resonant mechanical
motion.
∗Present address: Institute for Experimental and Applied Physics, University of Regensburg, 93040 Regensburg, Germany
1
arX
iv:1
001.
4372
v1 [
cond
-mat
.mes
-hal
l] 2
5 Ja
n 20
10
Nanomechanical systems [1, 2] have promising applications, such as ultra-sensitive mass detection [3, 4, 5].
The combination of a high resonance frequency and a small mass also makes nanomechanical resonators
attractive for a fundamental study of mechanical motion in the quantum limit [6, 7, 8, 9]. For a successful
observation of quantum motion of a macroscopic object, a high-frequency nanoscale resonator must have low
dissipation (which implies a high quality-factor Q), and a sensitive detector with minimum back-action (i.e.
quantum limited) [10, 11]. Here, we demonstrate a dramatic backaction that strongly couples a quantum
dot detector to the resonator dynamics of a carbon nanotube, and which, in the limit of strong feedback,
spontaneously excites large amplitude resonant mechanical motion.
Nanomechanical resonators have been realized by etching down larger structures. In small devices, how-
ever, surfaces effects impose a limit on the quality-factor [2]. Alternatively, suspended carbon nanotubes can
be used to avoid surface damage from the (etching) fabrication process. We recently developed a mechani-
cal resonator based on an ultra-clean carbon nanotube with high resonance frequencies of several 100 MHz
and a Q exceeding 105 [12]. Here, we exploit this resonator to explore a strong coupling regime between
single electron tunneling and nanomechanical motion. We followed the pioneering approaches in which alu-
minium single electron transistors were used as position detectors [6, 7, 8] and AFM cantilevers as resonators
[13, 14, 15]; however, our experiment is in the limit of much stronger electro-mechanical coupling, achieved
by embedding a quantum dot detector in the nanomechanical resonator itself.
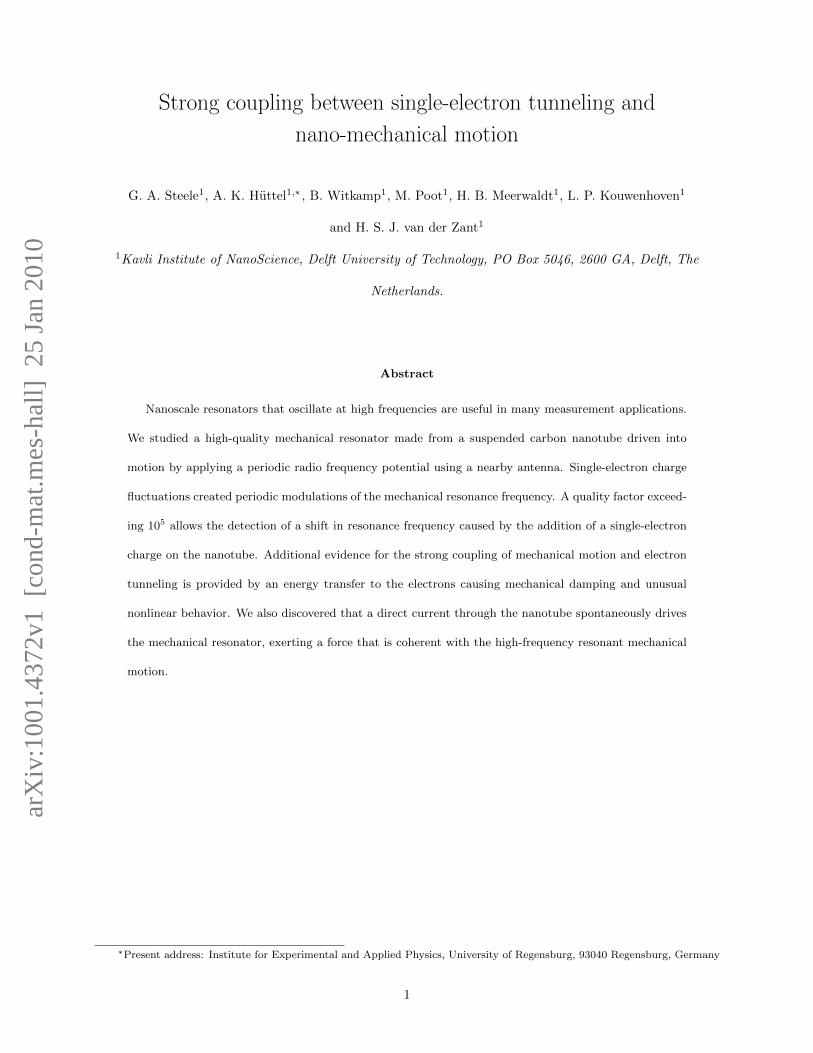
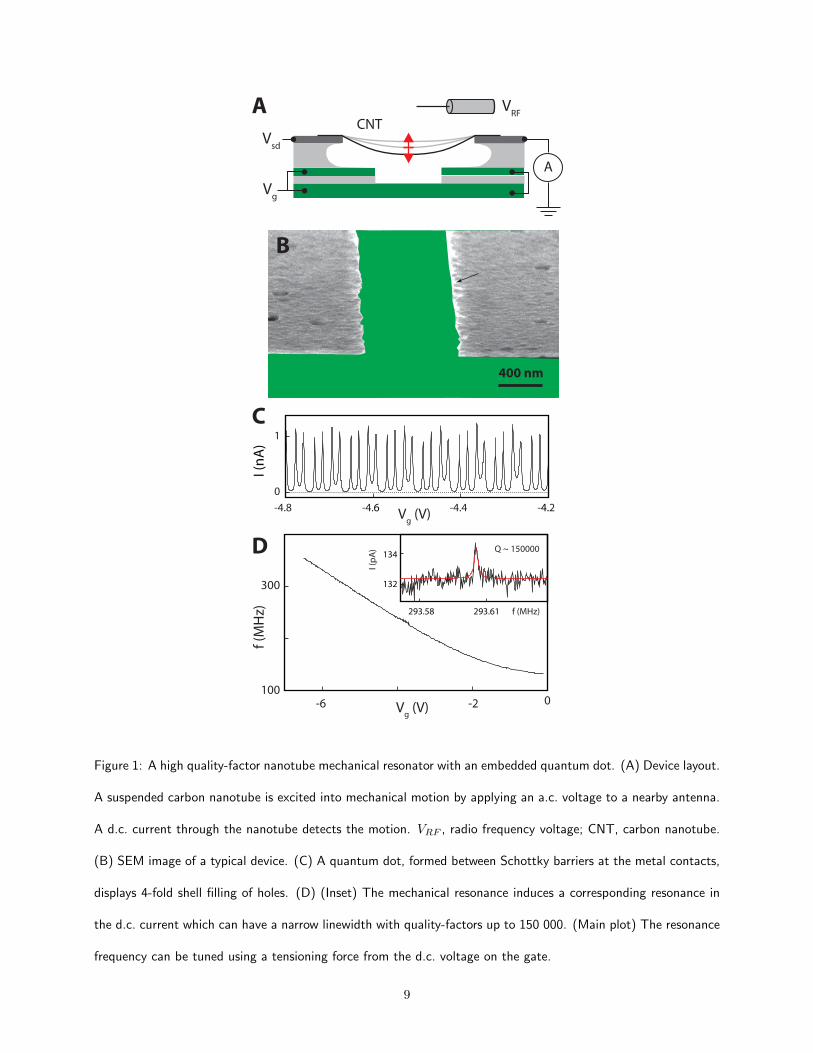
Our device consists of a nanotube suspended across a trench that makes electrical contact to two metal
electrodes (Fig. 1). Electrons are confined in the nanotube by Schottky barriers at the Pt metal contacts,
forming a quantum dot in the suspended segment. The nanotube growth is the last step in the fabrication
process, yielding ultra-clean devices [16], as demonstrated by the four-fold shell-filling of the Coulomb peaks
(Fig. 1C). All measurements were performed at a temperature of 20 mK with an electron temperature of
∼80 mK.
We actuate the resonator with a nearby antenna, and detect the resonator motion by its influence on
the d.c. current through the nanotube. The inset to Fig. 1D shows a peak in the current at the resonance
frequency, which we have identified as a bending-mode mechanical resonance of the nanotube [12]. The
Q-factor typically exceeds 105, which is an increase of more than two orders of magnitude compared to
2
previous nanotube studies [17, 18, 4]. The resonance frequency is tuned by more than a factor of 2 with the
gate voltage (Fig. 1D). Here, the electric field from the gate voltage pulls the nanotube toward it, and the
subsequent lengthening of the nanotube induces more tension, similar to the tuning of a guitar string [17].
Our detection signal results from a change in gate capacitance, ∆Cg, during a displacement of the nan-
otube. This changes the effective quantum dot potential and, if positioned initially beside a Coulomb peak
(Fig. 1C), can move it onto the peak, thereby increasing the current. For a nanotube oscillating on reso-
nance, the effective potential oscillates, and the non-linearity of Coulomb blockade allows it to be rectified
to a detectable d.c. current.
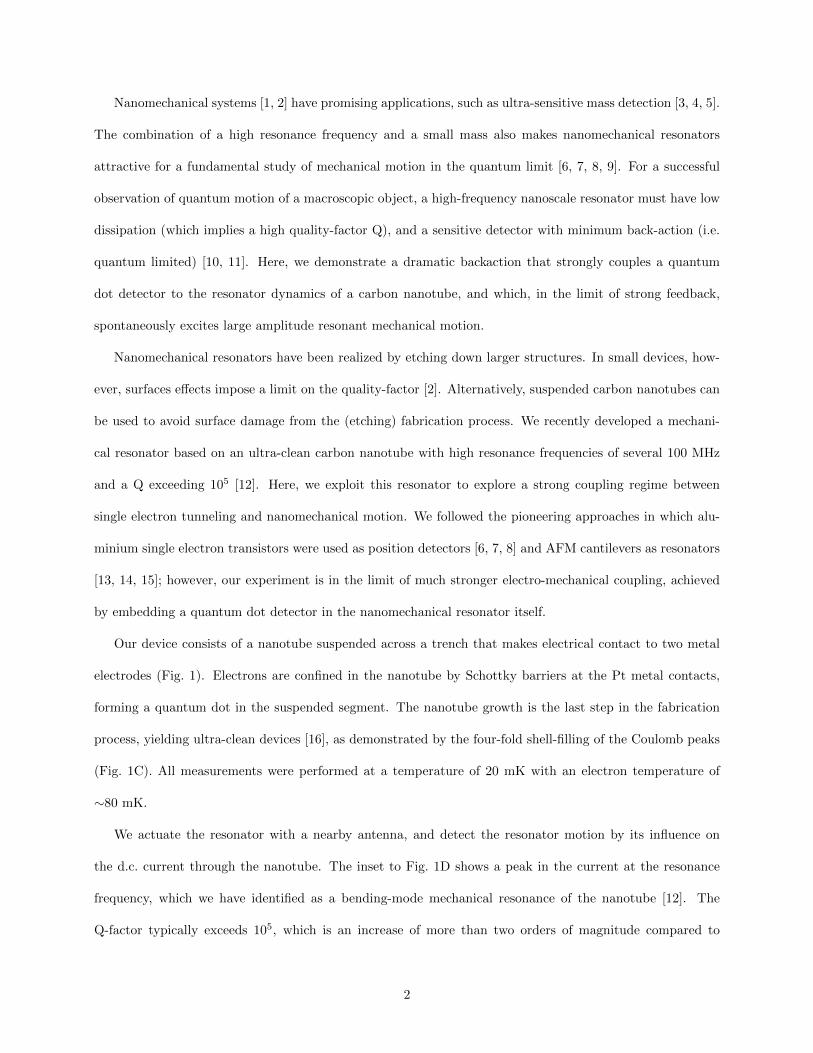
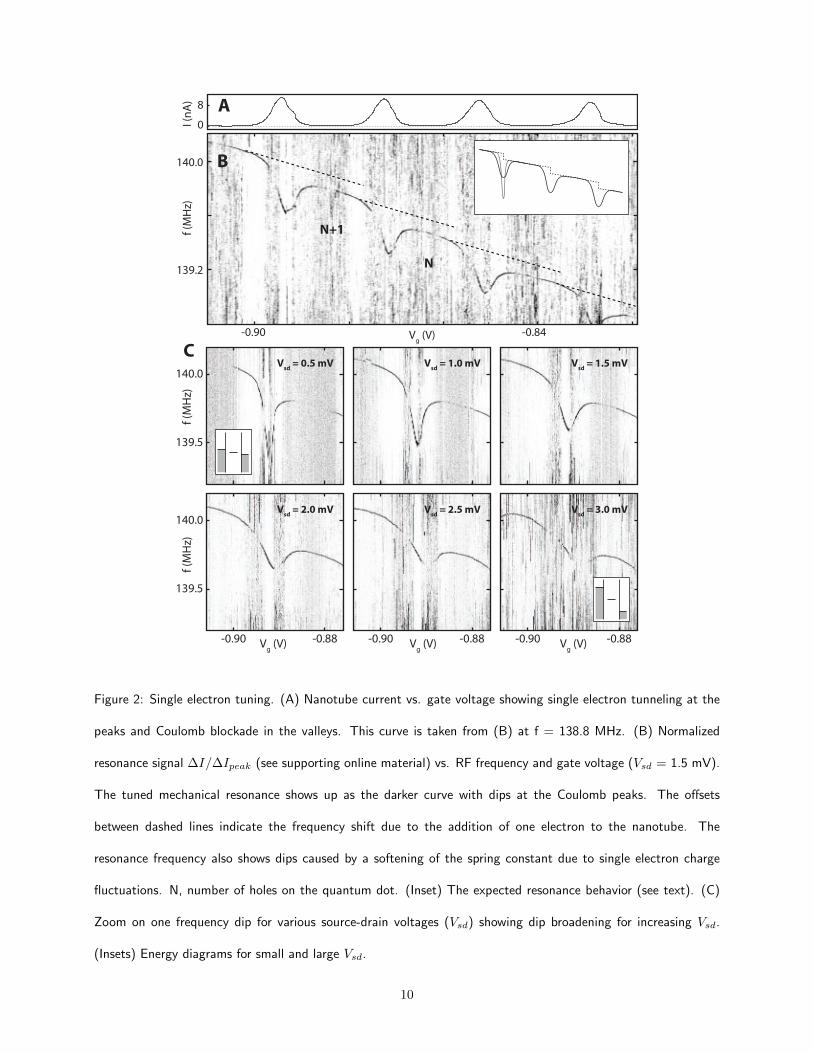
The narrow linewidth of the resonance peak due to the high Q-factor provides an unprecedented sensitive
probe for studying nanomechanical motion. We first show the influence of a single electron on the resonance
frequency, f0. The Coulomb oscillations in Fig. 2A are caused by single electron tunneling giving rise to
current peaks, and Coulomb blockade fixes the electron number in the valleys. From valley to valley, the
electron number changes by one. Fig. 2B shows the mechanical resonance signal recorded at the same time.
Overall, a more negative gate voltage (right to left) increases the total charge on the nanotube, increasing the
tension. This process stiffens the mechanical spring constant and increases the resonance frequency. Linear
stiffening occurs in the Coulomb valleys (indicated with dashed lines), whereas at Coulomb peaks, a peculiar
softening occurs, visible as dips in f0.
We first focus on the change in resonance frequency caused by the addition of one electron, which is
measured as offsets of about 0.1 MHz between the dashed lines. This shift from single electron tuning,
predicted in [19], is about 20 times our linewidth and thus clearly resolvable. Because we compare valleys
with a fixed electron number, this single electron tuning comes from a change in a static force on the nanotube.
The (electro-) static force is proportional to the square of the charge on the nanotube and thus adding one
electron charge results, here, in a detectable shift in the mechanical resonance [19]. The shifts from single
electron tuning can be as large as 0.5 MHz, more than 100 times the line width [20].
Next we focus on the dips in resonance frequency that occur at the Coulomb peaks. The current at the
Coulomb peaks is carried by single electron tunneling, meaning that one electron tunnels off the nanotube
before the next electron can enter the tube. The charge on the nanotube thus fluctuates by exactly one
3
electron charge, e, with a time dynamics than can be accounted for in detail by the theory of Coulomb
blockade [21]. The average rate, Γ, at which an electron moves across the tube can be read off from the
current I = eΓ (1.6 pA corresponds to a 10 MHz rate). Moving the gate voltage off or on a Coulomb peak,
we can tune the rate from the regime Γ ∼ f0 to Γ � f0 and explore the different effects on the mechanical
resonance.
In Figs. 2A,B the Coulomb peak values of ∼ 8 nA yield Γ ∼ 300f0, the regime of many single elec-
tron tunneling events per mechanical oscillation. In addition to the static force and the radio frequency
(RF) oscillating driving force, single electron tunneling now exerts a time-fluctuating, dynamic force on the
mechanical resonator. We observe that this dynamic force causes softening, giving dips in the resonance
frequency. The single electron charge fluctuations do not simply smooth the stepwise transition from the
static single electron tuning shifts. Strikingly, fluctuations instead caused dips in the resonant frequency up
to an order of magnitude greater than the single electron tuning shifts. As shown in [13, 22] and discussed
in detail in the supporting online material [20], the dynamic force modifies the nanotubes spring constant,
k, resulting in a softening of the mechanical resonance. The shape of the frequency dip can be altered by
applying a finite bias, Vsd, across the nanotube. Starting from deep and narrow at small Vsd = 0.5 mV,
the dip becomes shallower and broader with increasing Vsd. This dip-shape largely resembles the broadening
of Coulomb blockade peaks that occurs with increasing Vsd. We thus conclude from Fig. 2 that the single
electron tuning oscillations are a mechanical effect that is a direct consequence of single electron tunneling
oscillations.
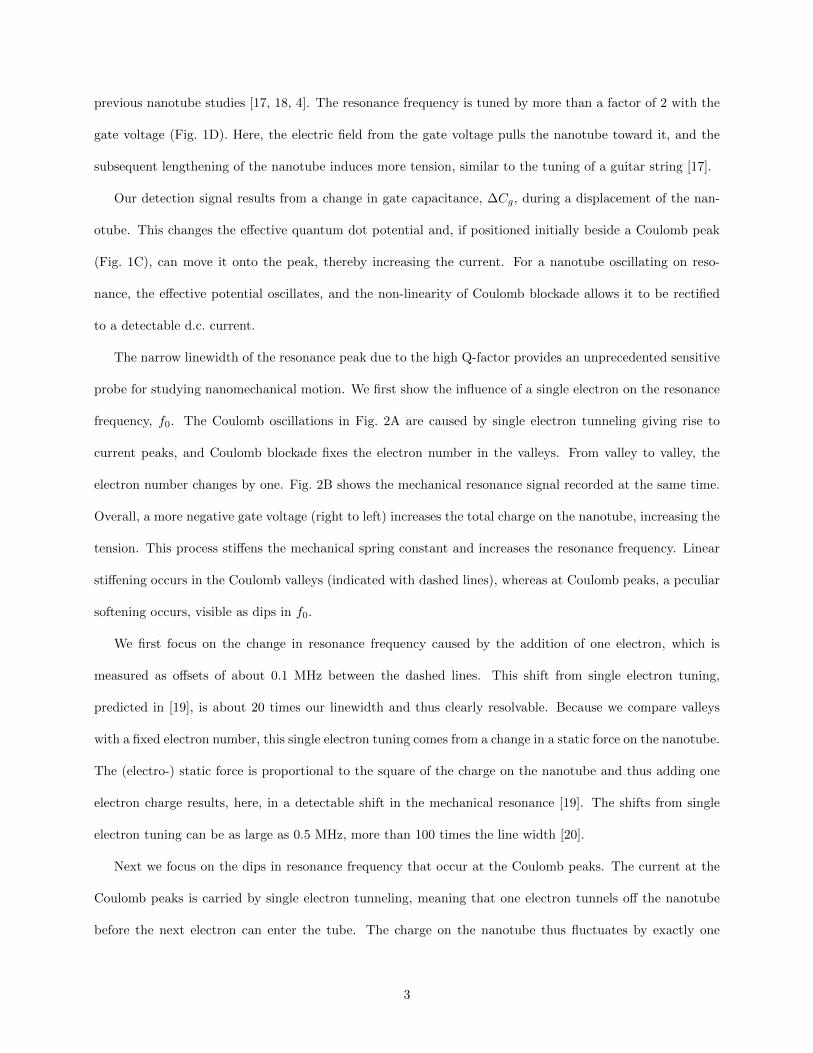
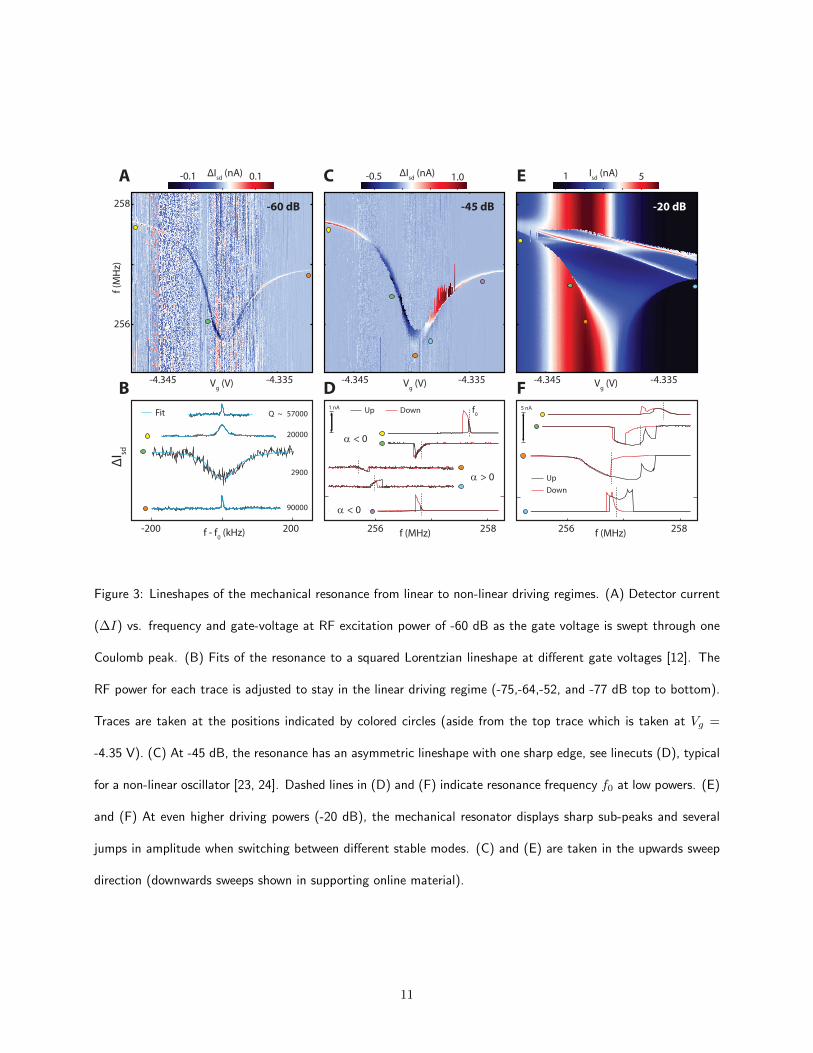
Besides softening, the charge fluctuations also provide a channel for dissipation of mechanical energy. Fig.
3A shows the resonance dip for small RF power with frequency traces in Fig. 3B. In the Coulomb valleys,
tunneling is suppressed (Γ ∼ f0), damping of the mechanical motion is minimized, and we observe the highest
Q-factors. On a Coulomb peak, charge fluctuations are maximal (Γ � f0), and the Q-factor decreases to
a few thousand. These results explicitly show that detector backaction can cause significant mechanical
damping. The underlying mechanism for the damping is an energy transfer occasionally occurring when
a current-carrying electron is pushed up to a higher (electrostatic) energy by the nanotube motion before
tunneling out of the dot. This gain in potential energy is later dissipated in the drain contact.
4
If we drive the system at higher RF powers (Fig. 3C,D) we observe an asymmetric resonance peak, along
with distinct hysteresis between upward and downward frequency sweeps. Theoretically this marks the onset
of non-linear terms in the equation of motion, such as in the well-studied Duffing oscillator [23, 24]. The
spring constant, k, is modified by a large oscillation amplitude, x, which is accounted for by replacing k with
(k + αx2). The time-averaged spring constant increases if α > 0, which is accompanied by a sharp edge at
the high frequency side of the peak; vice versa for α < 0. In addition to the overall softening of k yielding the
frequency dips of Fig. 2, the fluctuating charge on the dot also changes α, giving a softening spring (α < 0)
outside of the frequency dip (Coulomb valleys), and a hardening spring (α > 0) inside the frequency dip
(Coulomb peaks), shown in Fig. 3. The sign of α follows the curvature of f0(Vg) induced by the fluctuating
electron force, giving a change in sign at the inflection point of the frequency dip. Interestingly, non-linearity
from the single electron force in our device dominates, and is much stronger than that from the mechanical
deformation [20].
Figs. 3E,F show the regime of further enhanced RF driving. The non-linearity is now no longer a
perturbation of the spring constant, but instead gives sharp peaks in the lineshape and switching between
several different metastable modes (see further data in supplementary material [20]). At this strong driving,
we observe highly structured nonlinear mechanical behavior that arises from the coupling of the resonator
motion to the quantum dot.
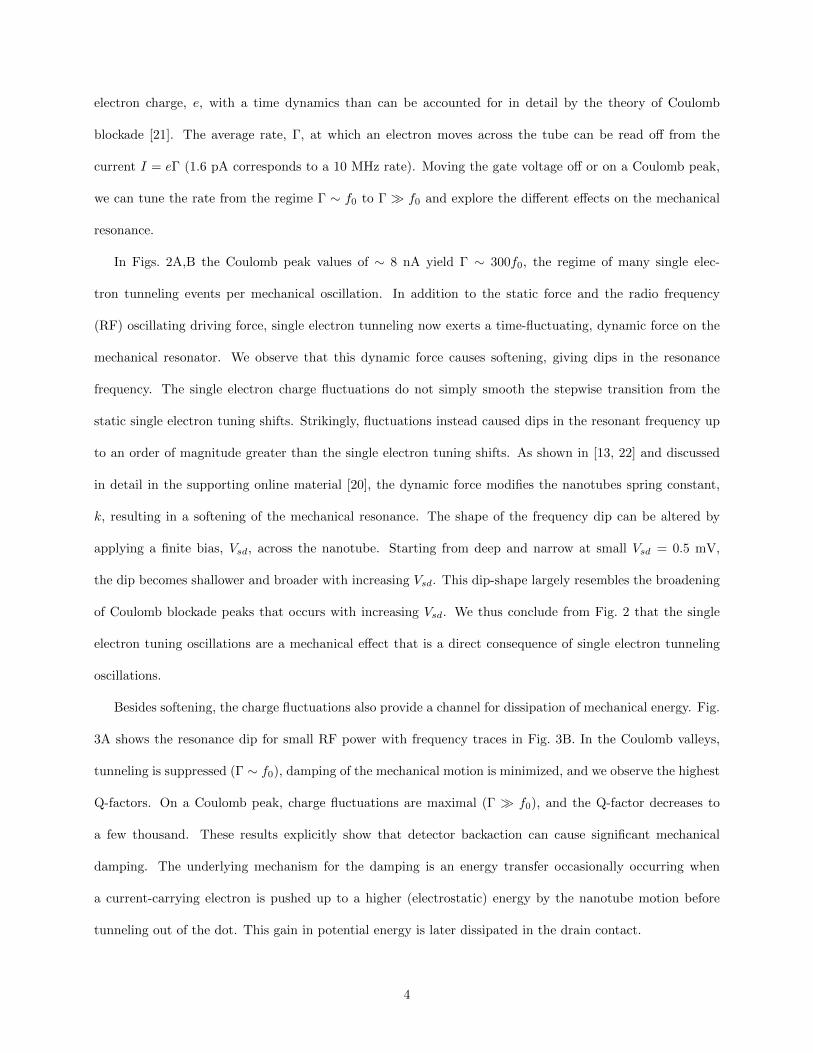
In figure 3, we studied non-linear coupling between the quantum dot and the mechanical resonator by
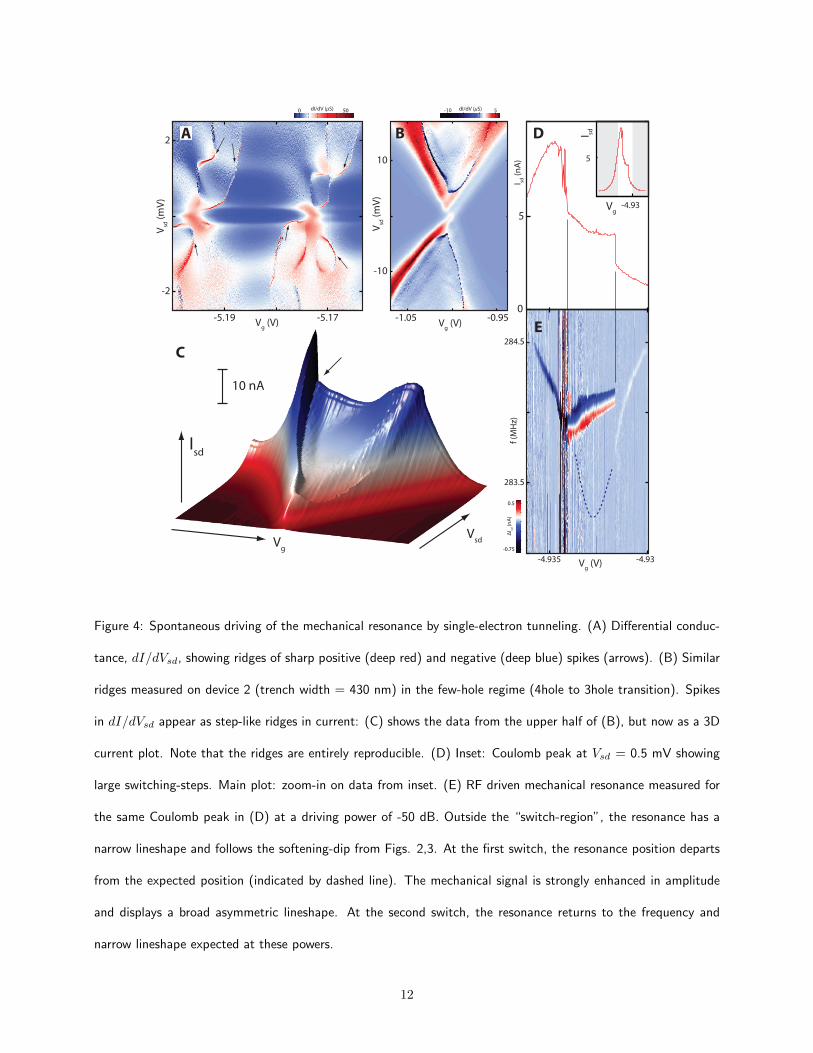
applying a large RF driving force at a small Vsd. In figure 4, we consider a small or absent RF driving
force and now apply a large Vsd across the quantum dot. Fig. 4A shows a standard Coulomb blockade
measurement of the quantum dot. Mechanical effects in Coulomb diamonds have been studied before in
the form of phonon sidebands of electronic transitions [25, 26, 27, 28]. Shown in the data of figure 4 are
reproducible ridges of positive and negative spikes in the differential conductance as indicated by arrows.
This instability has been seen in all 12 measured devices with clean suspended nanotubes and never in
non-suspended devices. Fig. 4B and C shows such ridges in a second device, visible both as spikes in the
differential conductance (Fig. 4B), and as discrete jumps in the current (Fig. 4C). The barriers in device 2
were highly tunable: we found that the switch-ridge could be suppressed by reducing the tunnel coupling to
5
the source-drain leads, thereby decreasing the current. The instability disappears roughly when the tunnel
rate is decreased below the mechanical resonance frequency (see supporting online material)[20].
In a model predicting such instabilities [29], positive feedback from single electron tunneling excites the
mechanical resonator into a large amplitude oscillation. The theory predicts a characteristic shape of the
switch-ridges and the suppression of the ridges for Γ ∼ f0, in striking agreement with our observations.
Such feedback also requires a very high Q, which may explain why it has not been observed in previous
suspended quantum dot devices [26, 28]. If the required positive feedback is present, however, it should
also have a mechanical signature: such a signature is demonstrated in Fig. 4E. The RF-driven mechanical
resonance experiences a dramatic perturbation triggered by the switch-ridge discontinuities in the Coulomb
peak current shown in Fig. 4D. At the position of the switch, the resonance peak shows a sudden departure
from the expected frequency dip (dashed line), and becomes strongly asymmetric and broad, as if driven
by a much higher RF power. This is indeed the case, but the driving power is now provided by an internal
source: because of the strong feedback, the random fluctuating force from single electron tunneling becomes
a driving force coherent with the mechanical oscillation. Remarkably, the d.c. current through the quantum
dot can be used both to detect the high-frequency resonance and, in the case of strong feedback, directly
excite resonant mechanical motion.
References
[1] H. G. Craighead, Science 290, 1532 (2000).
[2] K. L. Ekinci, M. L. Roukes, Rev. Sci. Inst. 76, 061101 (2005).
[3] K. L. Ekinci, X. M. H. Huang, M. L. Roukes, Appl. Phys. Lett. 84, 4469 (2004).
[4] B. Lassagne, D. Garcia-Sanchez, A. Aguasca, A. Bachtold, Nano Lett. 8, 3735 (2008).
[5] H.-Y. Chiu, P. Hung, H. W. Postma, M. Bockrath, Nano Lett. 8, 4342 (2008).
[6] R. G. Knobel, A. N. Cleland, Nature 424, 291 (2003).
[7] M. D. Lahaye, O. Buu, B. Camarota, K. C. Schwab, Science 304, 74 (2004).
6
[8] A. Naik, et al., Nature 443, 193 (2006).
[9] K. C. Schwab, M. L. Roukes, Phys. Today 58, 36 (2005).
[10] C. M. Caves, K. S. Thorne, R. W. Drever, V. D. Sandberg, M. Zimmermann, Rev. Mod. Phys. 52, 341
(1980).
[11] C. A. Regal, J. D. Teufel, K. W. Lehnert, Nature Phys. 4, 555 (2008).
[12] A. K. Huettel, et al., Nano Letters 9, 2547 (2009).
[13] M. T. Woodside, P. L. McEuen, Science 296, 1098 (2002).
[14] J. Zhu, M. Brink, P. L. McEuen, Appl. Phys. Lett. 87 (2005).
[15] R. Stomp, et al., Phys. Rev. Lett. 94, 056802 (2005).
[16] G. A. Steele, G. Gotz, L. P. Kouwenhoven, Nature Nano. 4, 363 (2009).
[17] V. Sazonova, et al., Nature 431, 284 (2004).
[18] B. Witkamp, M. Poot, H. S. J. van der Zant, Nano Lett. 6, 2904 (2006).
[19] S. Sapmaz, Y. Blanter, L. Gurevich, H. S. J. van der Zant, Phys. Rev. B 67, 235414 (2003).
[20] Supporting online material available on Science Online.
[21] C. W. J. Beenakker, Phys. Rev. B 44, 1646 (1991).
[22] M. Brink, thesis, Cornell Univerity (2007).
[23] A. Cleland, Foundations of Nanomechanics (Springer-Verlag, 2002).
[24] A. H. Nayfeh, D. T. Mook, Nonlinear Oscillations (Wiley, 1979).
[25] H. Park, et al., Nature 407, 57 (2000).
[26] S. Sapmaz, J. P. Herrero, Y. M. Blanter, C. Dekker, H. S. J. van der Zant, Phys. Rev. Lett. 96 (2006).
[27] F. A. Zwanenburg, C. E. van Rijmenam, Y. Fang, C. M. Lieber, L. P. Kouwenhoven, Nano Lett. 9, 1071
(2009).
7
[28] R. Leturcq, et al., Nature Phys. 5, 327 (2009).
[29] O. Usmani, Y. M. Blanter, Y. V. Nazarov, Phys. Rev. B 75, 195312 (2007).
Acknowledgments
We thank Y. M. Blanter and Y. V. Nazarov for helpful discussions. This work was supported by the Dutch
Organization for Fundamental Research on Matter (FOM), the Netherlands Organization for Scientific Re-
search (NWO), the Nanotechnology Network Netherlands (NanoNed), and the Japan Science and Technology
Agency International Cooperative Research Project (JST-ICORP).
8
Vg
Vsd
VRF
CNT
A
A
B
C
D
400 nm
100-6 -2V
g (V)
f (M
Hz)
0
0
1
-4.8 -4.6 -4.4 -4.2
I (n
A)
Vg (V)
300
293.58 293.61 f (MHz)
132
134
I (p
A) Q ~ 150000
Figure 1: A high quality-factor nanotube mechanical resonator with an embedded quantum dot. (A) Device layout.
A suspended carbon nanotube is excited into mechanical motion by applying an a.c. voltage to a nearby antenna.
A d.c. current through the nanotube detects the motion. VRF , radio frequency voltage; CNT, carbon nanotube.
(B) SEM image of a typical device. (C) A quantum dot, formed between Schottky barriers at the metal contacts,
displays 4-fold shell filling of holes. (D) (Inset) The mechanical resonance induces a corresponding resonance in
the d.c. current which can have a narrow linewidth with quality-factors up to 150 000. (Main plot) The resonance
frequency can be tuned using a tensioning force from the d.c. voltage on the gate.
9
0
8
I (n
A)
-0.90 -0.84
139.2
140.0
f (M
Hz)
Vg (V)
139.5
140.0
f (M
Hz)
-0.90 -0.88-0.90 -0.88-0.90 -0.88
139.5
140.0
Vg (V)
f (M
Hz)
Vg (V) V
g (V)
Vsd
= 0.5 mV Vsd
= 1.0 mV Vsd
= 1.5 mV
Vsd
= 2.0 mV Vsd
= 2.5 mV Vsd
= 3.0 mV
A
B
C
N
N+1
Figure 2: Single electron tuning. (A) Nanotube current vs. gate voltage showing single electron tunneling at the
peaks and Coulomb blockade in the valleys. This curve is taken from (B) at f = 138.8 MHz. (B) Normalized
resonance signal ∆I/∆Ipeak (see supporting online material) vs. RF frequency and gate voltage (Vsd = 1.5 mV).
The tuned mechanical resonance shows up as the darker curve with dips at the Coulomb peaks. The offsets
between dashed lines indicate the frequency shift due to the addition of one electron to the nanotube. The
resonance frequency also shows dips caused by a softening of the spring constant due to single electron charge
fluctuations. N, number of holes on the quantum dot. (Inset) The expected resonance behavior (see text). (C)
Zoom on one frequency dip for various source-drain voltages (Vsd) showing dip broadening for increasing Vsd.
(Insets) Energy diagrams for small and large Vsd.
10
-4.345 -4.335Vg (V) -4.345 -4.335V
g (V)
1 nA
α < 0
α > 0
α < 0
5 nA
-4.345 -4.335
256
258
f (M
Hz)
Vg (V)
∆I sd
∆Isd
(nA) 0.1-0.1 ∆Isd
(nA) 1.0-0.5 Isd
(nA) 51A
B
C
D
E
F
Up
Down
-60 dB -45 dB -20 dB
256 258 256 258f (MHz) f (MHz)f - f0 (kHz)-200 200
Up Down57000
20000
2900
90000
Q ~ Fit f0
Figure 3: Lineshapes of the mechanical resonance from linear to non-linear driving regimes. (A) Detector current
(∆I) vs. frequency and gate-voltage at RF excitation power of -60 dB as the gate voltage is swept through one
Coulomb peak. (B) Fits of the resonance to a squared Lorentzian lineshape at different gate voltages [12]. The
RF power for each trace is adjusted to stay in the linear driving regime (-75,-64,-52, and -77 dB top to bottom).
Traces are taken at the positions indicated by colored circles (aside from the top trace which is taken at Vg =
-4.35 V). (C) At -45 dB, the resonance has an asymmetric lineshape with one sharp edge, see linecuts (D), typical
for a non-linear oscillator [23, 24]. Dashed lines in (D) and (F) indicate resonance frequency f0 at low powers. (E)
and (F) At even higher driving powers (-20 dB), the mechanical resonator displays sharp sub-peaks and several
jumps in amplitude when switching between different stable modes. (C) and (E) are taken in the upwards sweep
direction (downwards sweeps shown in supporting online material).
11
-5.19 -5.17
-2
2
Vg (V)
Vsd
(m
V)
A
0 50dI/dV (μS)
-4.935 -4.93
283.5
284.5
f (M
Hz)
Vg
Vsd
Isd
5
0
Vg (V)
I sd (
nA
)
C
D
E
Vg
I sd
5
-4.93
-0.75
0.5∆
I sd (
nA
)
-1.05 -0.95
-10
10
Vsd
(m
V)
Vg (V)
B
5-10 dI/dV (μS)
10 nA
Figure 4: Spontaneous driving of the mechanical resonance by single-electron tunneling. (A) Differential conduc-
tance, dI/dVsd, showing ridges of sharp positive (deep red) and negative (deep blue) spikes (arrows). (B) Similar
ridges measured on device 2 (trench width = 430 nm) in the few-hole regime (4hole to 3hole transition). Spikes
in dI/dVsd appear as step-like ridges in current: (C) shows the data from the upper half of (B), but now as a 3D
current plot. Note that the ridges are entirely reproducible. (D) Inset: Coulomb peak at Vsd = 0.5 mV showing
large switching-steps. Main plot: zoom-in on data from inset. (E) RF driven mechanical resonance measured for
the same Coulomb peak in (D) at a driving power of -50 dB. Outside the “switch-region”, the resonance has a
narrow lineshape and follows the softening-dip from Figs. 2,3. At the first switch, the resonance position departs
from the expected position (indicated by dashed line). The mechanical signal is strongly enhanced in amplitude
and displays a broad asymmetric lineshape. At the second switch, the resonance returns to the frequency and
narrow lineshape expected at these powers.
12
Supporting Online Material: Strong coupling between single electron
tunneling and nano-mechanical motion
G. A. Steele1, A. K. Huttel1,∗ , B. Witkamp1, M. Poot1, H. B. Meerwaldt1, L. P. Kouwenhoven1
and H. S. J. van der Zant1
1Kavli Institute of NanoScience, Delft University of Technology, PO Box 5046, 2600 GA, Delft, The
Netherlands.
S1 Materials and Methods
S1.1 Device description
The fabrication is described detail in [1] and [2]: briefly, a trench in a silicon oxide layer is defined by dry
etching, and W/Pt electrodes are deposited to act as source and drain contacts for injecting current. In
device 1, the oxide is then further wet-etched by approximately 100 nm to ensure the nanotube is completely
suspended. The nanotube is grown in the last step of the fabrication to ensure the nanotube is not damaged
by electron beam irradiation or contaminated with residue from chemical processing.
The length of the trench in device 1 is 800 nm. The nanotube in device 1 has a large bandgap of ∼300
mV, estimated from the gate voltage range of depletion of carriers seen in transport measurements, and
a diameter of ∼3 nm, determined from the orbital magnetic moment of the nanotube. The quantum dot
displays a clean four fold shell filling pattern over a wide range of gate voltages corresponding to hundreds
of Coulomb peaks. In device 1, we drive mechanical oscillations of the devices using an electric field from a
nearby antenna consisting of an unterminated coaxial cable placed ∼2 cm from the sample. The mechanical
nature of the resonance is confirmed by tuning the nanotube tension using the gate [2, 3, 4].
In device 2, the dry etch is aligned to the source and contacts, and so a second wet etch is not required.
The nanotube in device 2 has a bandgap of ∼100 mV, determined from the size of the empty dot Coulomb
diamond [1]. The trench in device 2 has a length of 430 nm. For device 2, we did not have a high frequency
coax for exciting the mechanical resonance: however, we estimate the resonance frequency to be in the range
of 100 to 500 MHz, based on the length of the suspended segment.
∗Present address: Institute for Experimental and Applied Physics, University of Regensburg, 93040 Regensburg, Germany
1
arX
iv:1
001.
4372
v1 [
cond
-mat
.mes
-hal
l] 2
5 Ja
n 20
10
We have cooled down ∼12 suspended nanotube devices made using this ultra-clean fabrication technique,
with trenches ranging from 430 nm to 1100 nm. All of these devices displayed the switch-ridges in dI/dV
discussed in Fig. 4 of the main text.
S1.2 Normalization of the resonance signal
As the shift ∆I of the d.c. current from the mechanical resonance is proportional to the curvature of the
Coulomb peak [2], it changes in sign and significantly in magnitude at different gate voltages. In order to
clearly show the position of the resonance in Fig. 2 and Fig. S1 at all gate voltages, we normalize the frequency
sweep at each gate voltage by subtracting the average off-resonant current, taking the absolute value, and
then normalizing to a range of 0 to 1.
S2 Supplementary Text
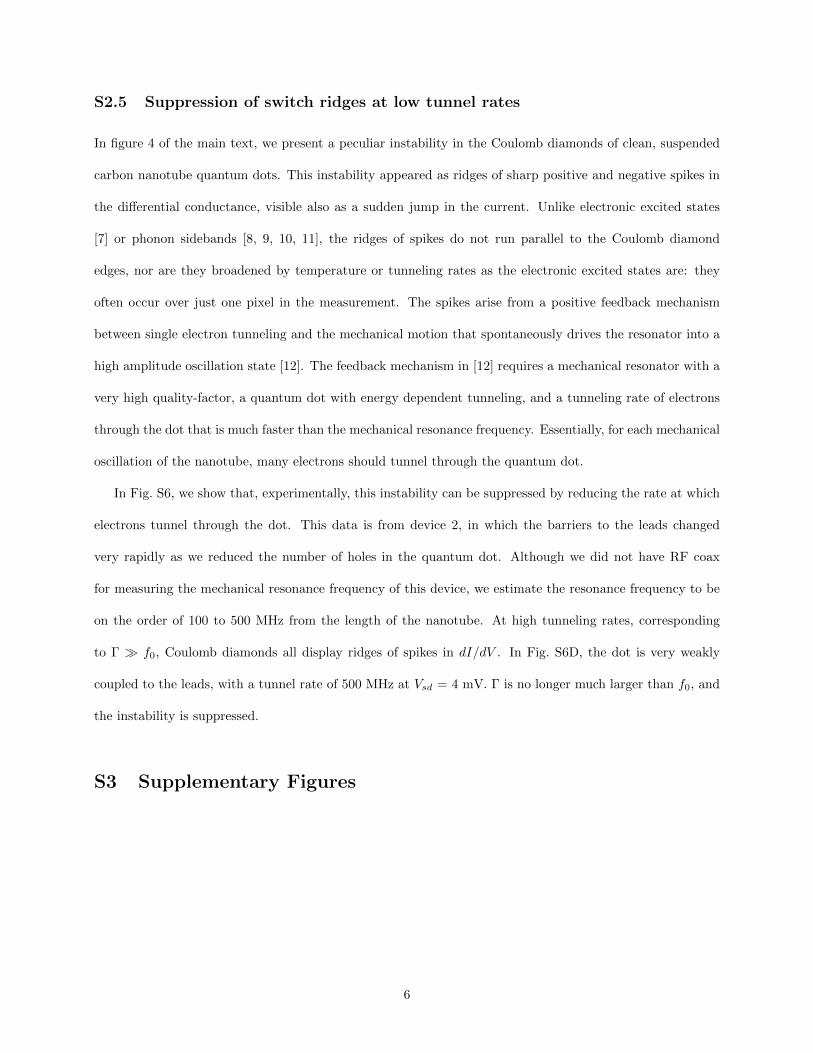
S2.1 Single electron tuning shifts of 0.5 MHz
In Fig. 2 of the main text, we showed offsets of the resonator frequency of 0.1 MHz due to the static charge
of a single electron. The data from Fig. 2 of the text was taken around Vg ∼ −1V. In Fig. S1, we show the
resonance frequency as a function of gate voltage around Vg ∼ −5V. Here, we observe offsets of the resonator
frequency of 0.5 MHz. At larger gate voltages, the frequency tuning curve shown in Fig. 1C of the main text
becomes steeper, and thus the offset in frequency from the single electron charge becomes larger. Although
the nanotube quantum dot charge still increases by only one electron, this electron exerts a larger force on
the nanotube due to its stronger attraction to the larger total charge on the gate.
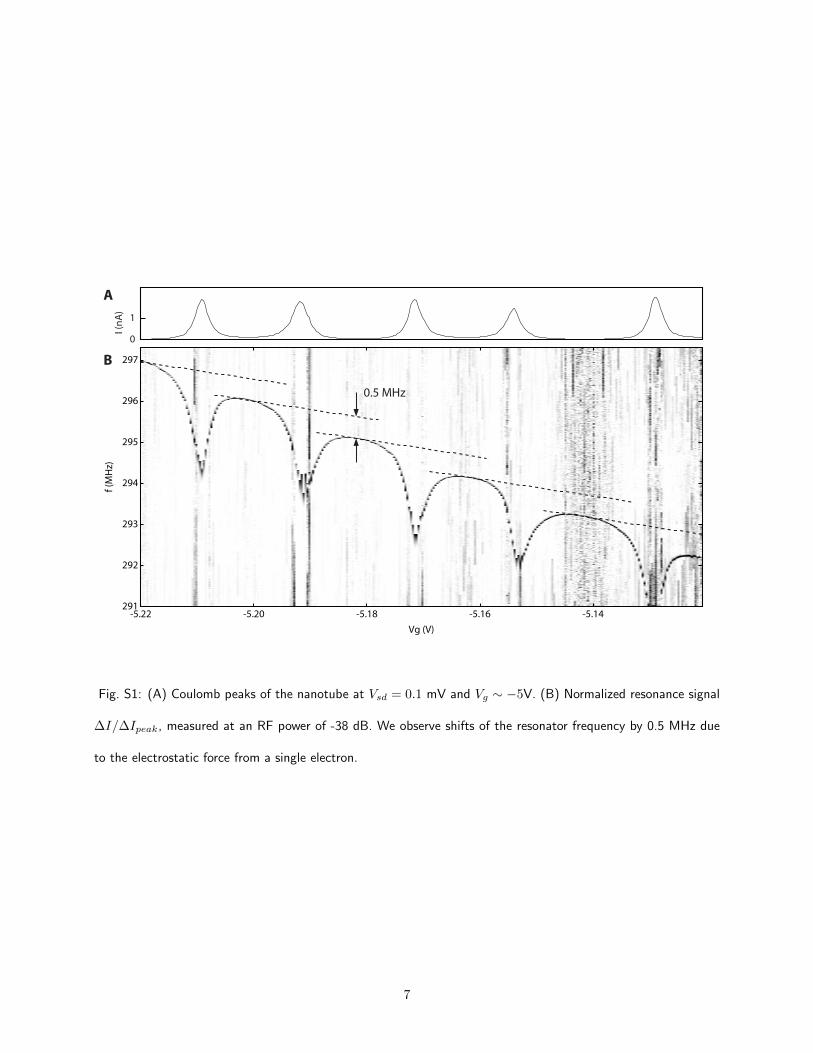
S2.2 Frequency softening by Coulomb blockade
The dips in the frequency of the mechanical oscillator, shown in Figs. 2 and 3 of the main text, arise from
a softening of the electrostatic component of the spring constant of the mechanical motion due to Coulomb
blockade [5]. To calculate this softening, we begin with the electrostatic force between the dot and the gate,
2
given by
Fdot =1
2
dCg
dz(Vg − Vdot)2 (S1)
where Cg is the capacitance of the quantum dot to the gate, Vdot is the electrostatic potential of the quantum
dot, and z is the vertical distance between the nanotube and the quantum dot. Since Vg is fixed and dCg/dz
is slowly varying, changes in this force will be dominated by changes in Vdot. The voltage on the dot is found
from electrostatics:
Vdot =CgVg + qdot
Cdot(S2)
where Cdot is the total capacitance of the quantum dot, and qdot is the charge on the quantum dot. In
Coulomb blockade, the charge on the dot does not increase continuously with gate voltage, but instead
increase in discrete steps of one electron, as illustrated in Fig. S2A. As a result, the electrostatic potential
on the dot will oscillate in a sawtooth pattern with an amplitude of e/Cdot, as shown in Fig. S2A. We write
the charge on the dot as:
qdot = −|e|N(qc) (S3)
where N is the average number of electrons on the quantum dot, and qc = CgVg is the “control charge”. Note
that the control charge is not the charge on the gate: the charge on the gate is given by the voltage difference
from the gate to the dot, qg = Cg(Vg − Vdot). The control charge is a concept we use here to express the
idea that the quantum dot is controlled by both the voltage on the gate Vg and by the (distance dependent)
capacitance to the gate Cg(z). The control charge is the continuous charge that would be on the quantum
dot in the absence of Coulomb blockade (Vdot = 0).
In the ideal limit of zero temperature and opaque tunnel barriers, N would follow a staircase with sharp
steps (Fig. S2A solid line), and the sawtooth oscillation of Vdot would have sharp edges (Fig. S2B solid line).
In practice, however, the electron number near the transition will fluctuate in time due to finite temperature
and tunnel coupling to the leads. The transitions in the average charge 〈N〉 are then smooth, acquiring a
finite width (dashed lines in Fig. S2A and B). The timescale of these fluctuations is set by the tunneling
time Γ−1. If the mechanical motion is much slower than Γ, the resonator will feel a force averaged over these
fluctuations, which can be calculated using the time averaged expression for 〈N(qc)〉. To find correction
to the mechanical spring constant ∆k from this force, we take the derivative of Eq. S1 with respect to the
3

displacement of the nanotube:
∆k = −dFdot
dz= (Vg − Vdot)
dC
dz
dVdotdz
(S4)
(neglecting slowly varying terms d2Cg/dz2). Using Eq. S2 and S3, we obtain:
∆k =Vg(Vg − Vdot)
Cdot
(dCg
dz
)2 (1− |e|d〈N〉
dqc
)(S5)
Note that the second term in the brackets on the right leads to a softening of the spring constant of the
resonator, proportional to how quickly the average quantum dot occupation changes through a charge tran-
sition (i.e. the Coulomb peak). The strong peak in d〈N〉/dqc at the steps of the Coulomb staircase leads to
the large dips in the resonance frequency we observe in Figs. 2 and 3 in the main text. The softening that
arises from the negative sign in front of d〈N〉/dqc in Eq. S5 is very non-intuitive: we expect that increasing
the charge on the nanotube will, in general, pull the nanotube towards the gate, increasing the tension and
stiffening the spring constant. Here, increasing the charge instead softens the spring constant.
Physically, this softening comes from the peculiar screening properties of a Coulomb blockaded quantum
dot, illustrated in Fig. S2c. Between charge transitions, the quantum dot acts like a floating island that does
not screen the gate potential at all (dVdot/dVg > 0). At the charge transition, the quantum dot compensates
by overscreening the gate potential giving a sudden drop in the dot potential (dVdot/dVg < 0). Over many
charge transitions, the net effect is that the average dot potential stays fixed [6], as is the case for full screening
by a metal conductor (dVdot/dVg = 0). It is the overscreening at the negative steps in the dot potential that
leads to the softening of the spring constant.
In Fig. 2C of the main text, we demonstrate that the frequency dip becomes broader and shallower with
increasing bias across the dot. This can be understood from the effect of finite bias on the average dot
occupation 〈N(qc)〉: at large bias, the average occupation of the quantum dot changes more slowly as its
chemical potential moves through the bias window. The derivative d〈N〉/dqc is smaller, and hence the shift of
the spring constant (Eq. S5) is also smaller. It is also interesting to note that for asymmetric tunnel barriers
(ΓL 6= ΓR), the quantum dot occupation at higher bias changes more quickly at one edge of the Coulomb
diamond, whereas the current does not. The peak in d〈N〉/dqc therefore does not have to coincide with the
maximum current of the Coulomb peak. This is also observed in the measurements, and can be seen clearly,
for example, in Fig. S4.
4
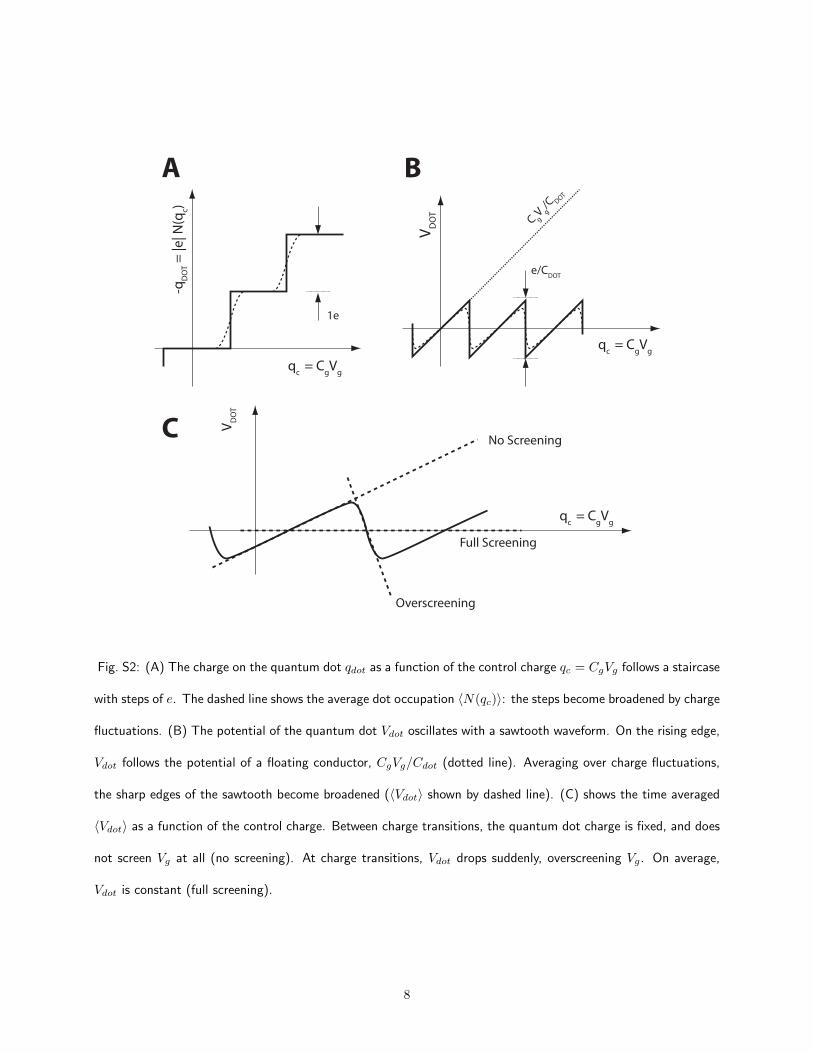
S2.3 Coulomb blockade induced nonlinearity of the resonator
In section S2.2, we calculated the change in the linear spring constant of the mechanical resonator due to the
force on the resonator from the Coulomb blockaded quantum dot. In addition to a correction to the linear
coefficient, there will also be terms higher order in the displacement dz from Eq. S1. The Duffing parameter
α, which determines the initial softening or hardening spring behaviour, can be calculated by taking the third
derivative of the force d3F/dz3. However, as we can read off ∆k(Vg) directly from the measured gate voltage
dependence of the low-power resonance frequency, f0(Vg), we can also predict α from the experimental data:
α = −d3F
dz3=
d2
dz2∆k(qc) = V 2
g
(dC
dz
)2d2(∆k)
dq2c, (S6)
again neglecting terms proportional to d2C/dz2. The sign of α will follow the sign of the curvature of ∆k(Vg),
as determined from the observed f0(Vg). This gives a change in the sign of α at the inflection points of the
frequency dip, as illustrated in figure S3.
From the mechanical deformation of a beam under tension, we would normally expect a hardening spring
behavior, as observed in previous nanotube experiments [3]. (This can also be seen from the overall positive
curvature of the mechanical tuning of the resonance, shown in Fig. 1D of the main text.) The fact that
we observe both softening and hardening behaviour with a small change in gate voltage indicates that
the nonlinear coefficient from the single electron force, αe, is much larger in magnitude than that from
the mechanical deformation, αmech: |αe| � |αmech|. Essentially, the single electron force dominates the
nonlinearity of the resonator.
S2.4 Non-linear behaviour at high driving powers
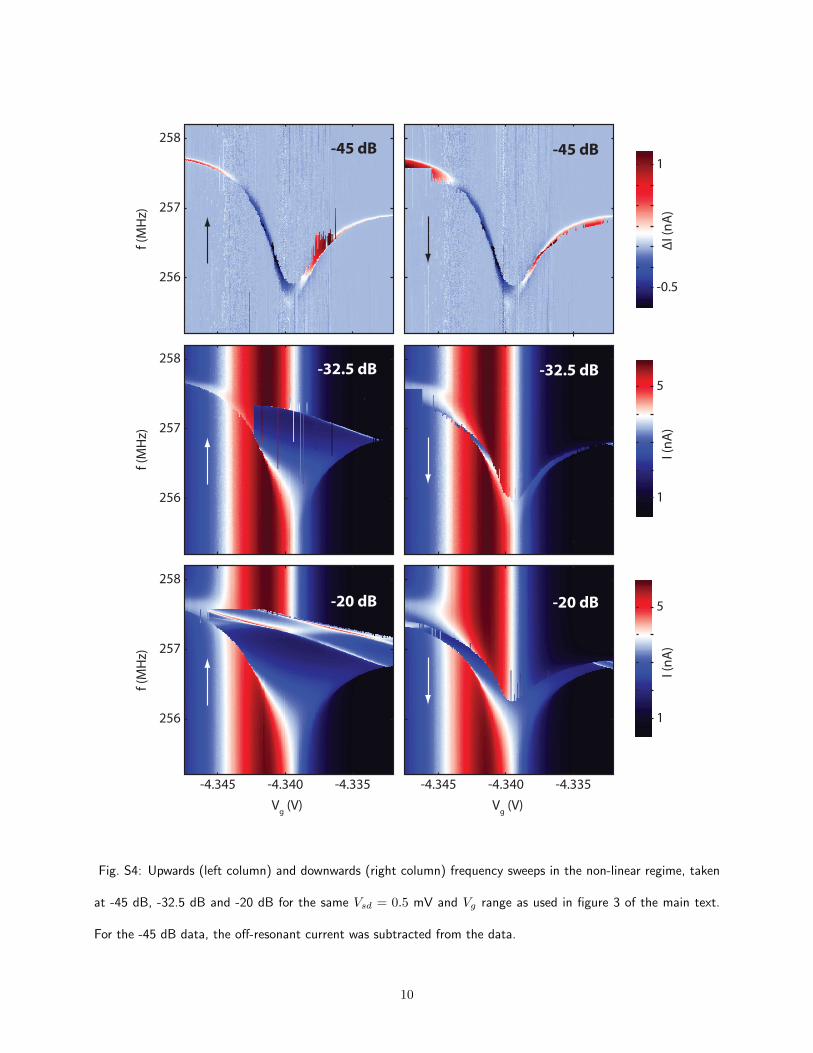
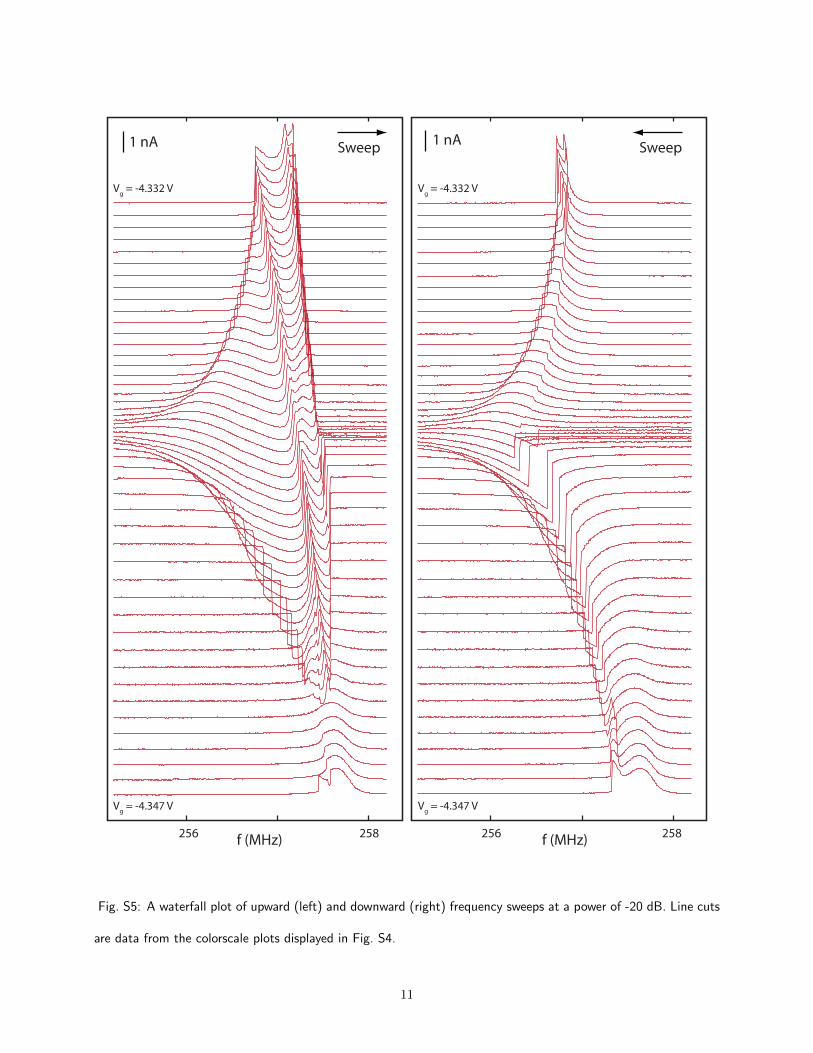
Fig. S4 shows the data from Fig. 3 of the main text in both upwards and downwards frequency sweep
directions, and as well for a power of -32.5 dB. The resonance at the highest powers displays a highly
structured lineshape, particularly around the frequency dip, as can be seen in the waterfall plot (Fig. S5) of
the -20 dB data.
5
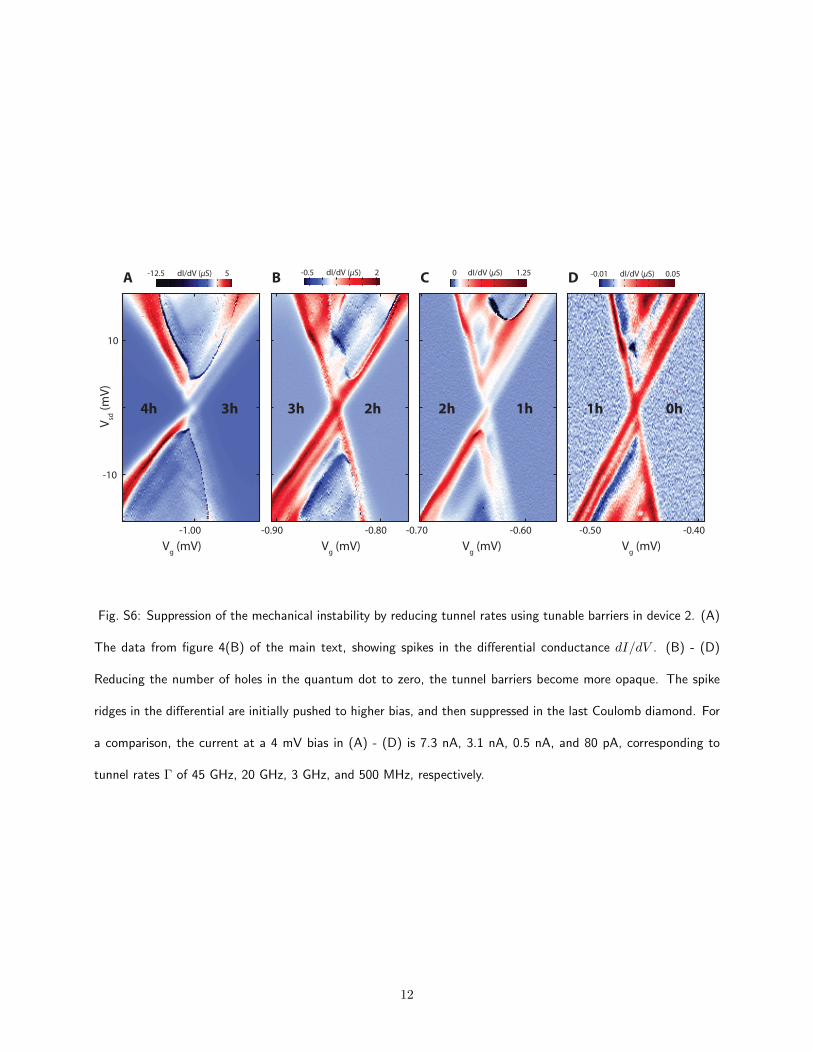
S2.5 Suppression of switch ridges at low tunnel rates
In figure 4 of the main text, we present a peculiar instability in the Coulomb diamonds of clean, suspended
carbon nanotube quantum dots. This instability appeared as ridges of sharp positive and negative spikes in
the differential conductance, visible also as a sudden jump in the current. Unlike electronic excited states
[7] or phonon sidebands [8, 9, 10, 11], the ridges of spikes do not run parallel to the Coulomb diamond
edges, nor are they broadened by temperature or tunneling rates as the electronic excited states are: they
often occur over just one pixel in the measurement. The spikes arise from a positive feedback mechanism
between single electron tunneling and the mechanical motion that spontaneously drives the resonator into a
high amplitude oscillation state [12]. The feedback mechanism in [12] requires a mechanical resonator with a
very high quality-factor, a quantum dot with energy dependent tunneling, and a tunneling rate of electrons
through the dot that is much faster than the mechanical resonance frequency. Essentially, for each mechanical
oscillation of the nanotube, many electrons should tunnel through the quantum dot.
In Fig. S6, we show that, experimentally, this instability can be suppressed by reducing the rate at which
electrons tunnel through the dot. This data is from device 2, in which the barriers to the leads changed
very rapidly as we reduced the number of holes in the quantum dot. Although we did not have RF coax
for measuring the mechanical resonance frequency of this device, we estimate the resonance frequency to be
on the order of 100 to 500 MHz from the length of the nanotube. At high tunneling rates, corresponding
to Γ � f0, Coulomb diamonds all display ridges of spikes in dI/dV . In Fig. S6D, the dot is very weakly
coupled to the leads, with a tunnel rate of 500 MHz at Vsd = 4 mV. Γ is no longer much larger than f0, and
the instability is suppressed.
S3 Supplementary Figures
6
-5.22 -5.20 -5.18 -5.16 -5.14291
292
293
294
295
296
297
f (M
Hz)
Vg (V)
0.5 MHz
1
0
I (n
A)
A
B
Fig. S1: (A) Coulomb peaks of the nanotube at Vsd = 0.1 mV and Vg ∼ −5V. (B) Normalized resonance signal
∆I/∆Ipeak, measured at an RF power of -38 dB. We observe shifts of the resonator frequency by 0.5 MHz due
to the electrostatic force from a single electron.
7
A B
CV
DO
T
C gV g
/C DOT
e/CDOT
qc = C
gV
g
1e
-qD
OT =
|e| N
(qc)
qc = C
gV
g
Full Screening
Overscreening
No Screening
VD
OT
qc = C
gV
g
Fig. S2: (A) The charge on the quantum dot qdot as a function of the control charge qc = CgVg follows a staircase
with steps of e. The dashed line shows the average dot occupation 〈N(qc)〉: the steps become broadened by charge
fluctuations. (B) The potential of the quantum dot Vdot oscillates with a sawtooth waveform. On the rising edge,
Vdot follows the potential of a floating conductor, CgVg/Cdot (dotted line). Averaging over charge fluctuations,
the sharp edges of the sawtooth become broadened (〈Vdot〉 shown by dashed line). (C) shows the time averaged
〈Vdot〉 as a function of the control charge. Between charge transitions, the quantum dot charge is fixed, and does
not screen Vg at all (no screening). At charge transitions, Vdot drops suddenly, overscreening Vg. On average,
Vdot is constant (full screening).
8
Fre
qu
en
cy
Gate Voltage
α < 0
α < 0α > 0
Fig. S3: The sign of the nonlinear Duffing parameter α is determined by the curvature of f0(Vg). The solid line
shows the position of the resonance at low powers, f0. The dashed line shows the sharp edge of the non-linear
resonance lineshape at higher powers (frequency traces illustrated by red lines). For positive curvature (yellow),
we have α > 0, and for negative curvature (blue), we have α < 0.
9
256
257
258f
(MH
z)
256
257
258
f (M
Hz)
-4.345 -4.340 -4.335
256
257
258
f (M
Hz)
Vg (V)
-4.345 -4.340 -4.335
Vg (V)
-0.5
1
∆I (
nA
)
1
5
I (n
A)
1
5
I (n
A)
-45 dB -45 dB
-32.5 dB -32.5 dB
-20 dB -20 dB
Fig. S4: Upwards (left column) and downwards (right column) frequency sweeps in the non-linear regime, taken
at -45 dB, -32.5 dB and -20 dB for the same Vsd = 0.5 mV and Vg range as used in figure 3 of the main text.
For the -45 dB data, the off-resonant current was subtracted from the data.
10
1 nA Sweep1 nA
Sweep
256 258 256 258
Vg = -4.347 V V
g = -4.347 V
Vg = -4.332 V V
g = -4.332 V
f (MHz) f (MHz)
Fig. S5: A waterfall plot of upward (left) and downward (right) frequency sweeps at a power of -20 dB. Line cuts
are data from the colorscale plots displayed in Fig. S4.
11
-0.50 -0.40
dI/dV (μS)-0.01 0.05 dI/dV (μS)0 1.25
-0.90 -0.80
dI/dV (μS)-0.5 2
-1.00
-10
10
Vsd
(m
V)
Vg (mV)
dI/dV (μS)-12.5 5
-0.70 -0.60
Vg (mV) V
g (mV) V
g (mV)
0h 1h 1h 2h 2h 3h 3h 4h
A B C D
Fig. S6: Suppression of the mechanical instability by reducing tunnel rates using tunable barriers in device 2. (A)
The data from figure 4(B) of the main text, showing spikes in the differential conductance dI/dV . (B) - (D)
Reducing the number of holes in the quantum dot to zero, the tunnel barriers become more opaque. The spike
ridges in the differential are initially pushed to higher bias, and then suppressed in the last Coulomb diamond. For
a comparison, the current at a 4 mV bias in (A) - (D) is 7.3 nA, 3.1 nA, 0.5 nA, and 80 pA, corresponding to
tunnel rates Γ of 45 GHz, 20 GHz, 3 GHz, and 500 MHz, respectively.
12
S4 Supplementary References
[1] G. A. Steele, G. Gotz, L. P. Kouwenhoven, Nature Nano. 4, 363 (2009).
[2] A. K. Huettel, et al., Nano Letters 9, 2547 (2009).
[3] V. Sazonova, et al., Nature 431, 284 (2004).
[4] B. Witkamp, M. Poot, H. S. J. van der Zant, Nano Lett. 6, 2904 (2006).
[5] M. Brink, thesis, Cornell Univerity (2007).
[6] Here, we have neglected the energy level spacing in the quantum dot. Including it, the potential will on
average increase with a small slope, but will still display negative steps that give the softening of the
spring constant.
[7] E. B. Foxman, et al., Phys. Rev. B 47, 10020 (1993).
[8] H. Park, et al., Nature 407, 57 (2000).
[9] S. Sapmaz, J. P. Herrero, Y. M. Blanter, C. Dekker, H. S. J. van der Zant, Phys. Rev. Lett. 96 (2006).
[10] F. A. Zwanenburg, C. E. van Rijmenam, Y. Fang, C. M. Lieber, L. P. Kouwenhoven, Nano Lett. 9, 1071
(2009).
[11] R. Leturcq, et al., Nature Phys. 5, 327 (2009).
[12] O. Usmani, Y. M. Blanter, Y. V. Nazarov, Phys. Rev. B 75, 195312 (2007).
13


![NOVEL NANO-ANTENNA SYSTEM DESIGN USING PHOTONIC …An optical Yagi-Uda nano-antenna was proposed in [14] with near-fleld coupling used to feed the element at the resonance frequency](https://img.pdfslide.us/doc/110x75/5f4f21933bde496e35386e55/novel-nano-antenna-system-design-using-photonic-an-optical-yagi-uda-nano-antenna.jpg)