Embed Size (px)
Citation preview
STRESS RESPONSE AND ADAPTATION TO SEAFARING: A STUDY OF THE CORTISOL RESPONSE TO AWAKENING
by Jonathan Liberzon
A thesis submitted in partial fulfillment of the requirements
for the degree of Bachelor of Science
(Program in the Environment) in the University of Michigan
August, 2006
Thesis Committee: James L. Abelson, M.D., Ph.D. Elizabeth Young, M.D. Anthony King, Ph.D. University of Michigan Medical School, department of Psychiatry.

2
3
Table of Contents
Acknowledgements . . . . . . . . . . . . . . . . . . . . . . . Pg. 4
Abstract . . . . . . . . . . . . . . . . . . . . . . . . . . . . Pg. 5
Introduction . . . . . . . . . . . . . . . . . . . . . . . . . . Pg. 6 Background Neurobiology of the HPA axis The Cortisol Response to Awakening Hypothesis Experimental model
Methods . . . . . . . . . . . . . . . . . . . . . . . . . . . Pg. 11 Cohort Demographic and Psychological Measures Neuroendocrine Measures Data Analysis Results . . . . . . . . . . . . . . . . . . . . . . . . . . . Pg. 16 Demographic, Dietary and Psychological Findings Cortisol Response to Awakening Group Differences in Duty
Discussion . . . . . . . . . . . . . . . . . . . . . . . . . . Pg. 33 Stress, CRA and Diet Reduced CRA during work at sea Enhanced CRA in experienced crew Literature Cited . . . . . . . . . . . . . . . . . . . . . . . . Pg. 37
4
Acknowledgements I would like to wholeheartedly thank the students and crew of SEA semester class 195A for
making this study possible. Thanks for waking up an hour early before dawn watch. Thank
you to Dr. Jaroslow at the Sea Education Association for supporting and incorporating this
research into your semester program. Thank you to Drs. Anthony King and James Abelson
for your invaluable mentorship and assistance, and for your remarkable patience. I think that
this one is really the final draft. Thank you to Dr. Elizabeth Young and Dr. Israel Liberzon
for your helpful comments and suggestions. Many thanks also to Bardia Gholami, Yvette
Harding and others at the Ann Arbor VAMC research lab that provided technical assistance
with my assays and data files. Finally, I would like to acknowledge the University of
Michigan School of Natural Resources’ Program in the Environment, for providing the
opportunity to complete this research as part of their Honors Thesis program.
5
Abstract Study of the Hypothalmus-Pituitary-Adrenal (HPA) Axis has allowed for a greater
understanding of the neurobiological systems that control the adaptive hormonal response to
stress. In order to investigate the effect of diet, work, professional experience and sleep on
HPA reactivity in healthy populations, data on the cortisol response to awakening (CRA), an
indicator of HPA reactivity, was collected along with a suite of psychological metrics and
survey instruments. A six-week voyage of work and study aboard an oceangoing sailing
vessel was selected as a model for prolonged stressors, providing opportunities for both
response and adaptation to novel and challenging conditions. Baseline data were collected
on shore prior to boarding. Results confirmed that CRA profiles among all subjects were
altered by the experience of seafaring, and that inexperienced students’ profiles were altered
differently from those of professional crew. Students exhibited larger CRAs on shoreside
working days than on shoreside weekend days. Working days at sea were marked by
intermediate CRAs in the student samples, and CRAs for shore-leave days fell between at-
sea working day and onshore weekend levels. In contrast, professional crew exhibited
increasing CRAs over the course of the voyage. Profiles for experienced scientific staff did
not differ from those of inexperienced students. Also, greater reported meat consumption
predicted smaller weekend CRA and lower subjective stress. This is the first study to
examine CRA, diet and experience in the context of seafaring.
6
1. Introduction 1.1 Background For more than a century, stress has been understood as both a physiological and
psychological process resulting from exposure to adverse or challenging stimulus. Early
research identified reactive “fight or flight” mechanisms important for initial response to
danger (Cannon 1914). These mechanisms respond to perceived threats by preparing the
organism for instantaneous response. Threat recognition in the amygdala is followed by
elevated heart rate and arousal, hyper-alertness and secretion of catecholamines (including
adrenaline) from the adrenal gland. These prepare the organism for the demands of an
aggressive encounter or flight from danger. Also, a second stress response system has been
identified. The Hypothalmus-Pituitary-Adrenal (HPA) Axis is a neuroendocrine chemical
cascade responsible for long-term adaptation to threatening or stressful stimulus (McEwin
and Wingfield 2003). Activation of the HPA axis has been implicated in reallocation of
metabolic resources and facilitation of immune response (Dhabar and McEwen 1999)
following stress and injury, as well as ‘learning’ and retention of novel threat information
(Roozendaal 2000). The HPA-axis has been described as operating in response to allostatic
loading (McEwin and Wingfield 2003), whereby an organism responds to stressors by
shifting energy investment away from non-essential functions in order to maintain
homeostasis and overcome immediate survival challenges. During normal allostasis,
dynamic HPA regulation allows the organism to alter glucose production and boost
immune-system function in response to a stressor, and then return to normal levels when
survival demands are relaxed. In some cases, however, continual allostatic loading can cause
an overloaded HPA-axis to lose the ability to properly regulate adrenocortical hormones.
1.2 Neurobiology of the HPA-axis Initial mounting of the HPA stress response is controlled by the paraventricular nucleus
(PVN) of the hypothalamus. Activation of the PVN appears to follow two main pathways:
Immediate threats to physiological homeostasis, such as hypotension, hypoxia and
hemmorage may activate the PVN through a relatively direct pathway of processing and
catecholamine secretion from the brainstem. Stressor-specific threats that must be assessed
7
in relation to previous experience (e.g. restraint), are recognized in the PVN through
neuronal input from the limbic system (Herman and Cullinan 1997). Threat recognition for
this pathway occurs in the amygdala and bed nucleus of the stria terminalis, a part of the
limbic forebrain. Several other brain regions, such as the locus coerulus, have been
implicated in PVN activation as well, though these remain controversial.
During HPA response, activation of the PVN results in hypothalamic secretion of
corticotropin releasing hormone (CRH), which signals the production of
adrenocorticotropin-releasing hormone (ACTH) in the pituitary. Free circulating ACTH, in
turn, triggers production of the hormone cortisol, the final component of the HPA activation
cascade, in the adrenal cortex. Cortisol has long been established as an end product of HPA
activation, and accordingly as an integral measure of neuroendocrine stress function in
humans. Though cortisol is secreted in high concentrations in response to stress, free cortisol
is constantly maintained at basal levels within the bloodstream. In addition to HPA
activation, HPA inhibition is also necessary for maintenance of basal tone. Gluticorticoid
(e.g. cortisol) receptors in the PVN directly inhibit HPA activation, though generalized
inhibition may also depend on GABAnergic sensitivity in the PVN. Additionally, neuronal
feedback from the hippocampus, pre-frontal cortex and lateral septum has been implicated in
inhibition of stressor-specific (limbic) responses (Herman and Cullinan 1997). Basal cortisol
is regulated on a 24 hr circadian cycle, in which concentrations begin to rise shortly after
midnight and peak in mid-morning, declining thereafter until the next trough is reached near
midnight (Keller et al. 2006). This cycle is maintained independently of bedtime, awakening
time or total hours slept.
As a negative feedback agent within the HPA axis, cortisol is secreted together with
catecholamines in a dose-dependant manner during responses to physical stressors such as
hypoxia or drops in blood pressure (Selye 1976), but may also be secreted independently in
response to stressors requiring higher-order threat processing (e.g. conditioned fear; Herman
and Cullinan 1997). Cortisol response to major stressors has been shown to correlate with
greater psychological response to stressors (Alpers et al. 2003), and altered cortisol function
has been demonstrated in a variety of mental illnesses, including reduced and elevated free
cortisol levels in Post-Traumatic Stress Disorder and Major Depressive Disorder,
respectively (Yehuda 2004). Additionally, a number of other factors have been shown to
8
alter cortisol function in-vivo, including changes in diet and sleep patterns. Among the
salient modifiable environmental factors, free circulating cortisol has been found to decrease
as a result of changing to a lactovegetarian diet from a meat-rich diet (Remer et al. 2004).
1.3 The Cortisol Response to Awakening The cortisol response to awakening (CRA), a relatively simple and non-invasive measure of
HPA activity, is defined as the change in free cortisol measured from the time of wakeup to
some time immediately afterwards (usually between 30 and 90 minutes). The CRA occurs as
part of the cortisol circadian cycle and has been characterized in healthy adults as a 50-160%
rise in salivary free cortisol in the first thirty minutes after awakening (Clow et al. 2004).
After this peak, free cortisol concentrations return to basal levels within 1-2 hours of
waking. More dynamic than overall 24 hr basal cortisol secretion, the morning CRA has
been shown to correlate with daytime HPA-axis activation as stimulated by injection of
ACTH or through experimentally-induced stress (Schmidt-Reinwald et al. 1999). Therefore,
the CRA may be used as a sensitive measure of HPA-axis reactivity and response to stress.
The measure shows high intra-subject stability and is independent of adult age, weight,
smoking status and alcohol consumption (Pruessner et al. 1997). Some studies have found
that CRA depends on time of awakening (Federenko et al. 2004), but others have found no
relationship between CRA and wakeup time, sleep duration or sleep quality (Pruessner et al.
1997). Williams et al. (2004), found that CRA was greater for workers on early shift days
than on late shift days, but this finding was not significant after controlling for subjective
stress and sleep disturbance. More data is therefore necessary to determine the effect of
sleep and awakening time (independent of stress) on the CRA.
Recent studies, however, have supported the sensitivity and reliability of the CRA as
an index for HPA reactivity (Clow et al. 2004). The CRA has been shown to be altered in
some pathologies normally associated with HPA dysregulation, such as Post-Traumatic
Stress Disorder (Wessa et al. 2006) and major depressive disorder (Huber et al. 2004). In
healthy adults, the cortisol response to awakening is also affected by workload and
perceived work overload, socioeconomic status, gender, and recently the CRA was found to
be smaller on weekend days than on working days (Kunz-Ebrecht et al. 2004, Schlotz et al.
2004). Additionally, self-reported perceived chronic stressors such as worry and social stress
9
have been found to predict higher CRAs in healthy subjects (Wüst et al. 2000). Thus, this
measure can be useful for determining relative differences in neurophysiological response to
stress between variable stress periods and between individual subjects.
This study used a six-week voyage onboard an educational sailing vessel as a model
for a long-term social and physical stressor. Subjects were sampled to observe subjective
stress and cortisol response to the rigors of life at sea. The cortisol response to awakening
was used to compare the neurobiological effects of the living/working environment on
cohorts with variable levels of work experience and variable dietary habits. The study was
designed to investigate the effects of diet, sleep, experience and workload on HPA
responsivity to prolonged stressors in a healthy population.
1.4 Hypothesis This study was originally devised as an investigation of the effect of variable meat and
caffeine intake on the cortisol response to awakening. Specifically, we sought to investigate
the effect of vegetarianism on CRA as a measure of HPA reactivity, since free cortisol has
been found to decrease as a result of changing to a lactovegetarian diet from a meat-rich
diet. (Remer et al. 2001). Consequently, we hypothesized that HPA reactivity (as indicated
by the CRA) would be lower in lactovegetarians than in meat-eaters. Unfortunately,
manipulating the diet of the cohort was not possible, and it was determined after recruitment
that there would not be enough variability in subjects’ diet to rigorously analyze the effect of
this variable, however other important variables could be tested. We hypothesized that work
experience, sleep duration and perceived control would correlate negatively with the CRA
and subjective measures of stress and anxiety.
1.5 Experimental Model The sea voyage was selected as a good model for testing stress reactivity because the
experience of seafaring and work at sea presumes a number of stressors that have been
shown to elicit cortisol secretion or elevated HPA activity such as increased risk to life, a
combination of mental and physical labor (Schlotz et al. 2004), workplace stress (Kunz-
Ebrecht et al. 2004), repeated examination and performance evaluations (Martinek et al.
2003, Ng et al. 2003, Lindahl et al. 2005) and social stress, while at the same time
10
controlling variables such as time of awakening, physical activity, work type and frequency
of social contacts. To comply with ship protocols, subjects had to adhere to a 72 hour sleep
rotation on board, and thus no clear diurnal sleep cycle could be established. Subjects were
tested and evaluated based on performance, both on work-related tasks and on oral
presentations. All subjects remained together for the entire course of the voyage, performing
similar types and quantities of labor and sharing the same quarters on board. Subjects did
not have access to outside contacts, and could not contact friends or family during the
voyage. All subjects kept an identical (though offset) work schedule and took their morning
samples at the same time of day for at least three of the six time points in this study (see fig
2.31). These presented excellent conditions for testing the effect of diet on stress response
and habituation.
11
2. Methods 2.1 Cohort Data were collected from 31 subjects enrolled in or instructing class 195A of the Sea
Education Association SEA semester program, based in Woods Hole, MA. The SEA
semester program included six weeks of studying on shore, followed by six weeks of work,
study and research aboard the SSV Corwith Cramer, a brigantine sailing vessel. Subjects
ranged from 18 to 38 years of age. Out of thirty-one, 18 were female and 13 were male.
There were 23 enrolled students participating in the study, along with 4 professional science
staff and 4 professional crew (three ship’s mates and an engineer.) Subjects were recruited
either at the SEA campus in Woods Hole or on board the SSV Corwith Cramer. All subjects
were given written and verbal instructions about the study and all gave informed consent.
The study was approved by the University of Michigan Institutional Review Board for
Behavioral Sciences.
2.2 Demographic and Psychological Measures Prior to departure on the sea voyage, subjects provided demographic data including: age and
gender, height, weight, smoking status, alcohol, caffeine consumption and dietary habits
specific to consumption of meat, fish, eggs and dairy. Subjects also completed a single
round of psychological surveys including: Beck Depression Index (Beck and Steer 1984),
Taylor-Manifest anxiety scale (Hoyt and Magoon 1954), Perceived Stress scale (Cohen et al.
1983), Spielberger Trait Anxiety Index (Spielberger et al. 1969) and Marlow-Crowne scale
of social desirability (Fisher 1967). These surveys were completed prior to the ship’s
departure. Participants were instructed to complete one 7-point Lykert scale of perceived
stress and one of perceived control concomitant with their saliva sampling on each of the six
sampling mornings. Stress was reported based on the prompt “How stressed do I feel?” and
control was reported based on the prompt “How in-control do I feel?” Subjects also recorded
sleep duration and time of awakening preceding each sampling time.
12
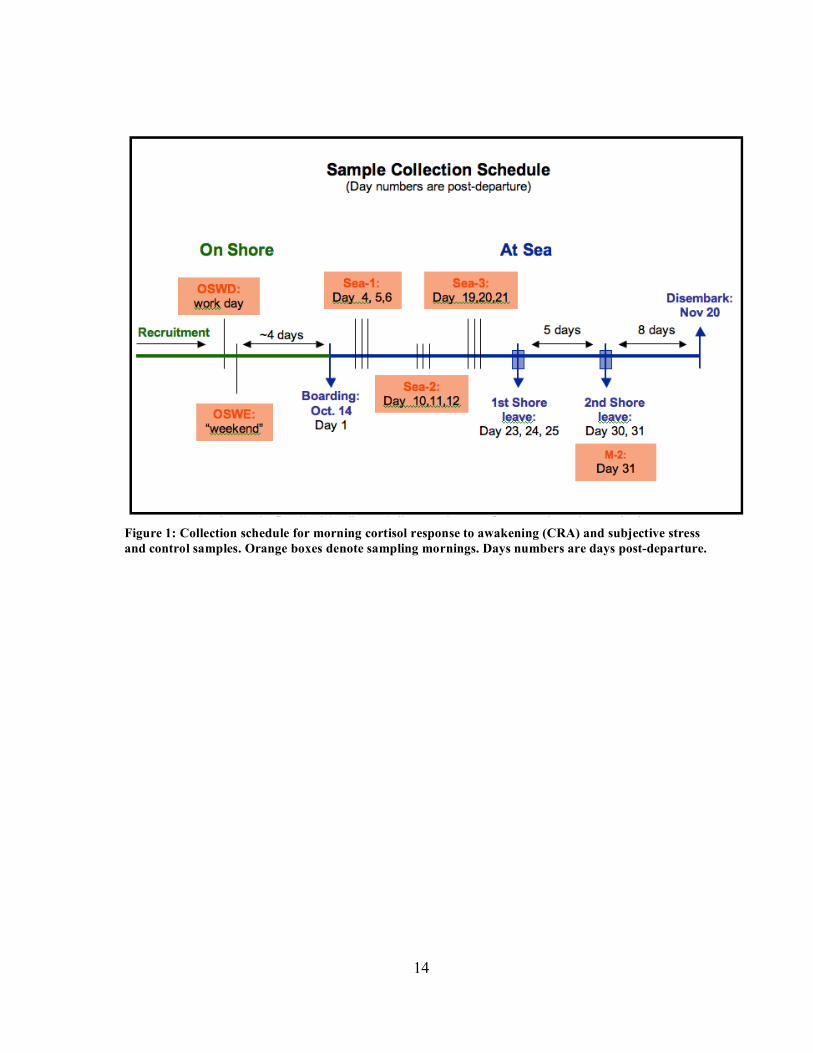
2.3 Neuroendocrine Measures Each subject provided saliva samples on six separate mornings. Each sampling morning
included three saliva samples taken at 0, 30 and 45 minutes after awakening. The sampling
schedule is diagramed below in figure 1. Subjects were instructed not to eat, drink, smoke,
brush teeth or rinse their mouths until after completion of the 45 minute salivary sample.
Two mornings were sampled on shore, prior to boarding the ship. One shore sample was
taken on a working day (OSWD) during a normal school week at the campus of the Sea
Education Association. All subjects were sampled on the same morning for the OSWD
sample. The second shore sample was taken the morning of a pre-boarding break day during
the week prior to departure. The specific date of sampling was not controlled within this
week. This sample (OSWE) was intended to simulate an average weekend morning, since
subjects did not have to work or prepare for exams on the day of their OSWE sample.
Subjects slept off-campus the night of the OSWE sample, and some slept at home. Two
science staff members took the OSWD and OSWE samples, but other science staff members
did not provide OSWD or OSWE samples, and no ship’s crew were sampled on shore.
Prior to boarding, subjects were divided into three groups or “watches” which adhered to
a 72 hour watch rotation. Each group’s work schedule was offset on the time scale in
relation to the preceding “watch” such that one watch would always be on duty (at all hours
of every day on board.) Within each 72 hours, the total amount and the type of shifts
(morning, evening and night shifts) were equal for the three “watches”. As a result, no two
watches would wake up at the same time each day. To control for waking time, the three
watches were sampled on consecutive mornings, always following their 5:30 a.m. wakeup
call. For example, ‘A’ watch was sampled after wakeup calls on day 4, ‘B’ watch was
sampled at the same time on day 5 and ‘C’ watch was sampled at the same time on day 6;
days 4, 5, and 6 were then grouped as the ‘Sea-1’ sample during analysis. Each subject
provided samples on three separate mornings at sea (Sea-1, Sea-2, Sea-3) and one more
sample on a shore-leave day (M-2). The M-2 sample was taken on-board, on the second
morning of a two-day shore leave, the second of two shore leaves during the voyage. This
sampling date was chosen in an attempt to control for the novelty of shore leave, and was
intended to approximate a “weekend” at sea. Subjects were instructed to complete subjective
stress/control rating and sleep data cards while chewing on the first (0 min) salivette. Saliva

13
samples were frozen on-site and assayed using Diagnostic Products Coat-a-Count cortisol
radioimmunoassay kit.
14
Figure 1: Collection schedule for morning cortisol response to awakening (CRA) and subjective stress and control samples. Orange boxes denote sampling mornings. Days numbers are days post-departure.
15
2.4 Data Analysis
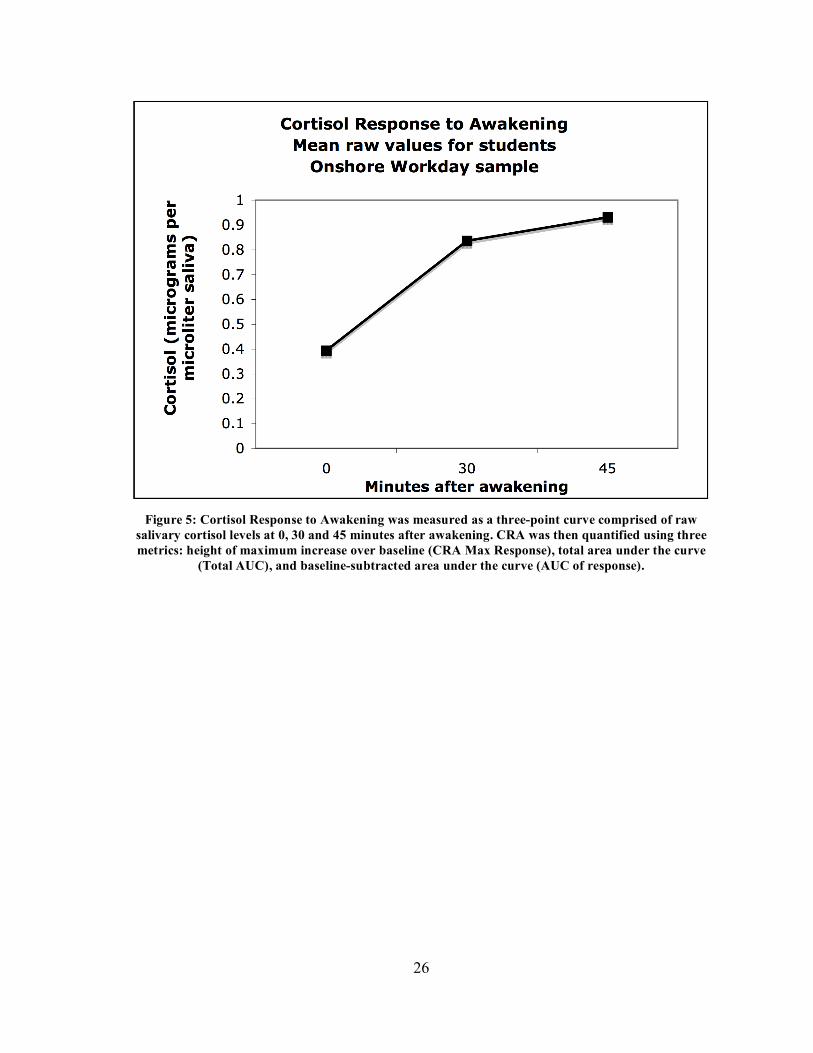
A three-point response curve was generated for each morning sample by grouping
wakeup, 30 min and 45 min data points within subjects (Fig. 5). In order to compare cortisol
response profiles between subjects, three measures were used. Cortisol maximum response
was calculated by subtracting the waking (0 min) cortisol value from either the 30 or 45
minute value, whichever was greater. Area under the curve (AUC) was also calculated, both
as total area and as AUC of response, defined as the area of response above the baseline
waking cortisol level (0 min value). Some AUC values could not be calculated because of
missing data. Missing data points were due to subject non-compliance or sampling error
(insufficient saliva volume). Excel was used for all data manipulations.
Statistical tests were performed using Statview 5.0.1 and SPSS 10.0. Change over
time was tested using repeated measures ANOVA. Fisher post-hoc tests were used to
compare individual time points. Group differences between males and females, and between
students and crew were also examined using these tests. Some subjects were excluded from
repeated measures analyses because of missing AUC data on certain time points. In order to
prevent the exclusion of one ship’s crew member from analyses, cortisol and subjective
stress values were interpolated from the group mean for this subject at timepoint Sea-1. The
Pierson test was used to investigate correlations between cortisol response to awakening and
a number of reported measures, including subjective ratings of stress and control,
psychological survey results, body composition, dietary habits and alcohol and tobacco use.
16
3. Results: 3.1 Demographic, Dietary and Psychological Findings
No differences were found between men and women for any of the variables investigated.
Subjective ratings of perceived stress and control showed a strong and significant negative
correlation across sampling days, meaning that less perceived control predicted more
perceived stress in this cohort. Students reported lower perceived stress during onshore
weekend (OSWE) morning than during onshore workday (OSWD) morning or any at-sea
mornings (Fisher, p<.001), but no significant difference was found in perceived stress
between onshore workday and at-sea workday mornings. Perceived control did not correlate
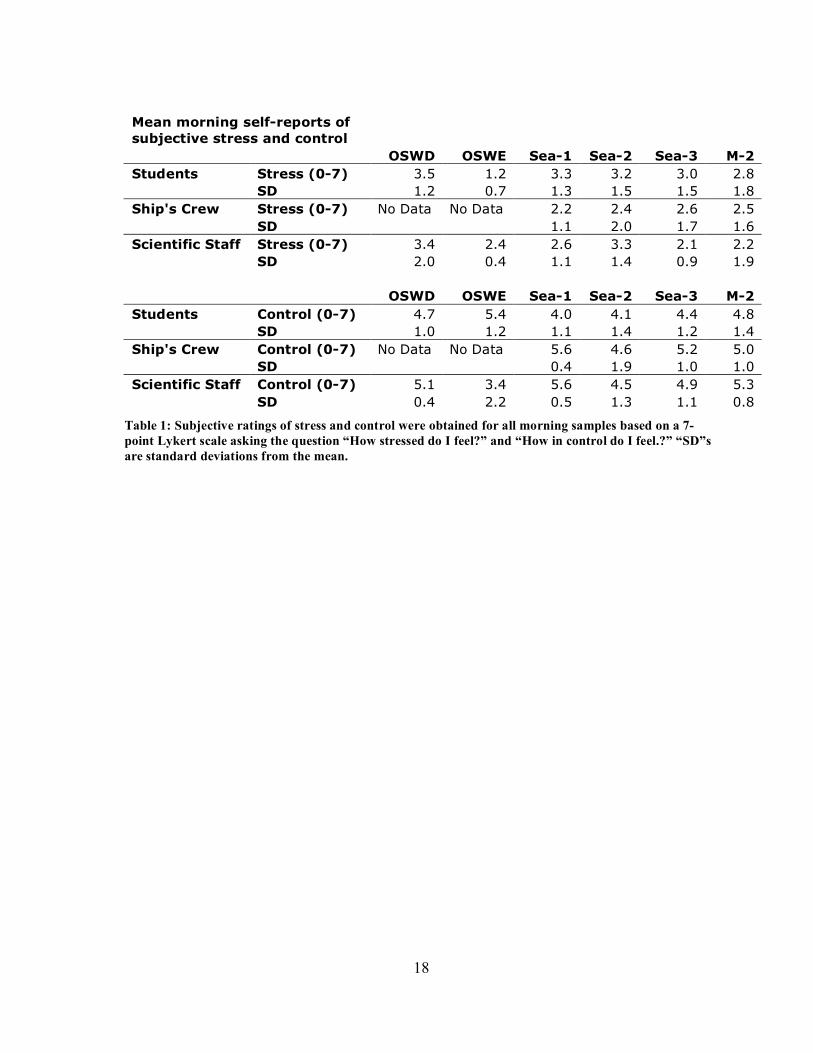
significantly to any other measures. Mean ratings of perceived stress and control are
summarized by duty in table 1. Average reported stress in student and ship’s crew cohorts
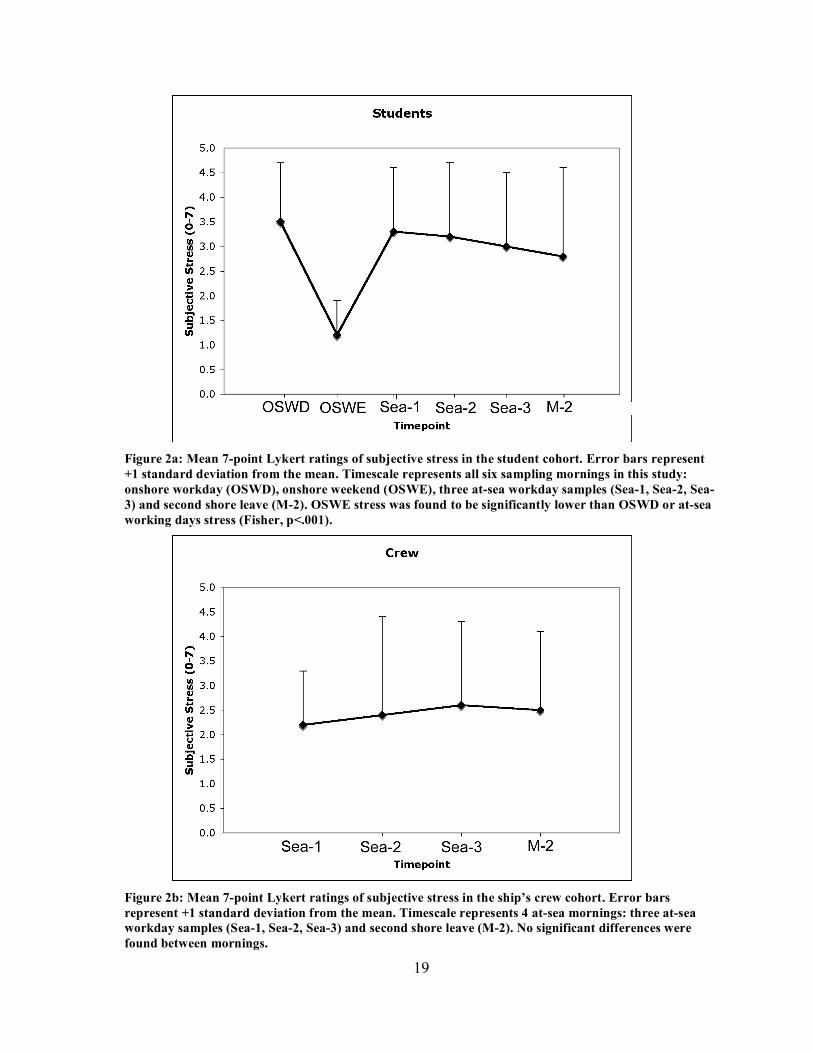
for the duration of the study is displayed in figures 2a and 2b. No correlations were found
between cortisol responses and subjective ratings of stress or control. Also, no group
differences were found between students, ship’s crew and scientific crew in these measures.
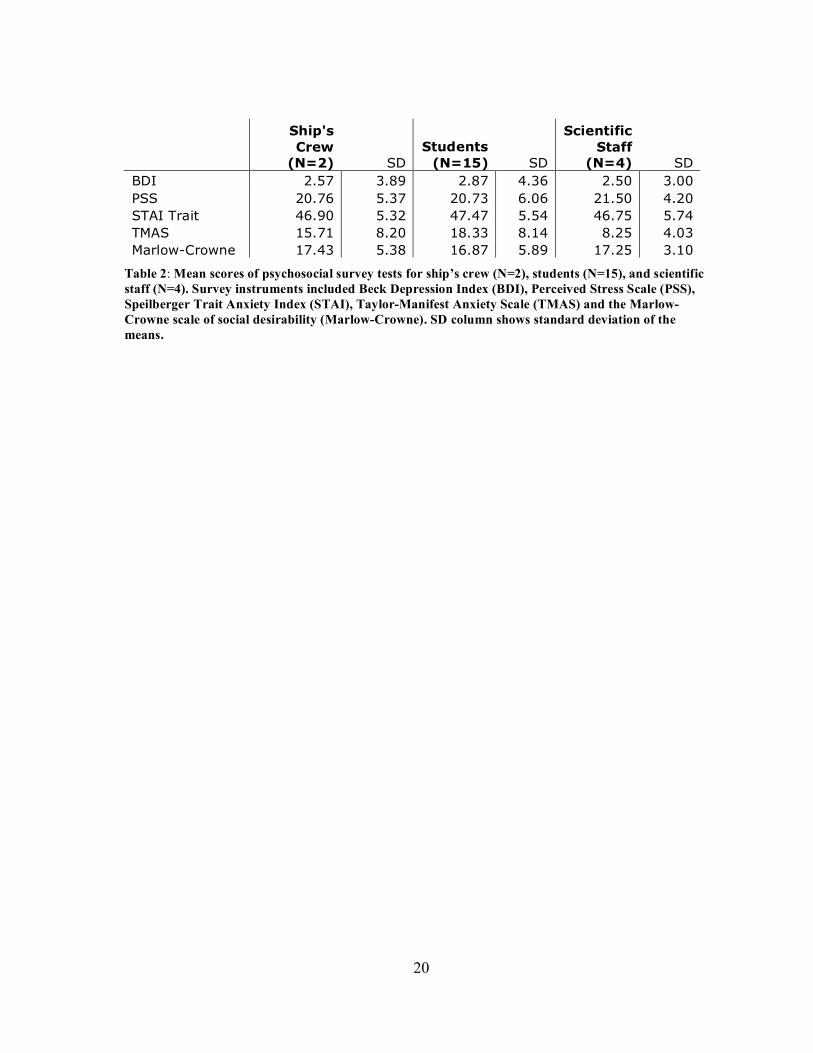
None of the participants scored on psychological battery in ranges indicating
psychiatric disease, though two were taking antidepressants. Table 2 lists mean scores of
psychological survey tests for students, crew and scientific staff. None of the psychological
measures correlated significantly with biological measures collected in this study, though
subjective ratings of stress for the M-2 sample correlated positively with Beck Depression
Index (Pearson, p=.004), Perceived stress scale (Pearson, p=.001) and Taylor Manifest
Anxiety Scale (Pearson, p=.009). Otherwise, reports of perceived stress and control did not
correlate with other psychological measures.
Time of awakening and total sleep time did not correlate with cortisol variables,
except for waking cortisol (0 min) values, which correlated with time of awakening in the
shore leave sample (M-2). This correlation confirms that subjects’ diurnal cortisol
modulation was functioning predictably at the time of sampling and does not provide
information on awakening response. Also, mean perceived stress demonstrated an inverse
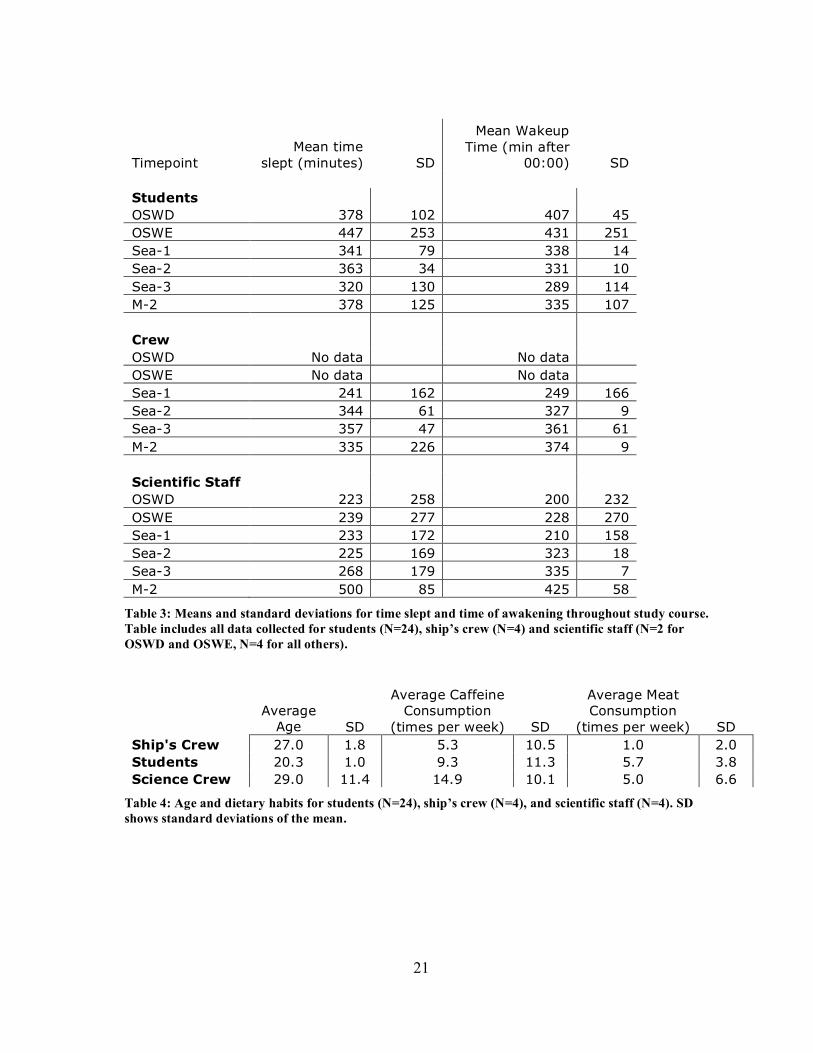
correlation with total sleep time on the workday shore sample. Data on time slept and time
of awakening for the student and ship’s crew cohorts is summarized in table 3.
17
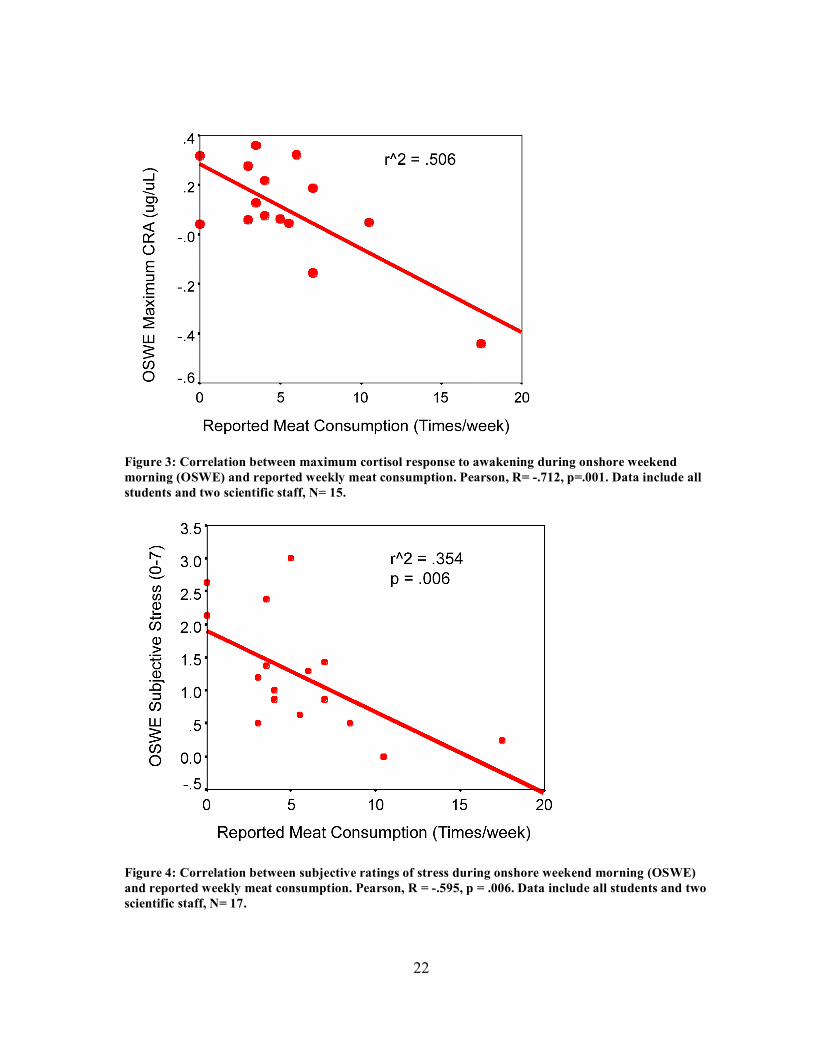
Table 4 shows average meat and caffeine consumption in student and ship’s crew
cohorts. Since variation in diet for this sample was small, we were not able to compare
discreet groups of vegetarians and non-vegetarians as originally planned. By analyzing
reported weekly meat consumption as a continuous variable, however, several trends were
found. Significant correlations between diet and cortisol were found in OSWE maximum
CRA and total AUC of cortisol, which correlated negatively with reported meat
consumption (Pearson, R2= .5064, p= 0.001 and p=.009, Fig. 3). This correlation did not
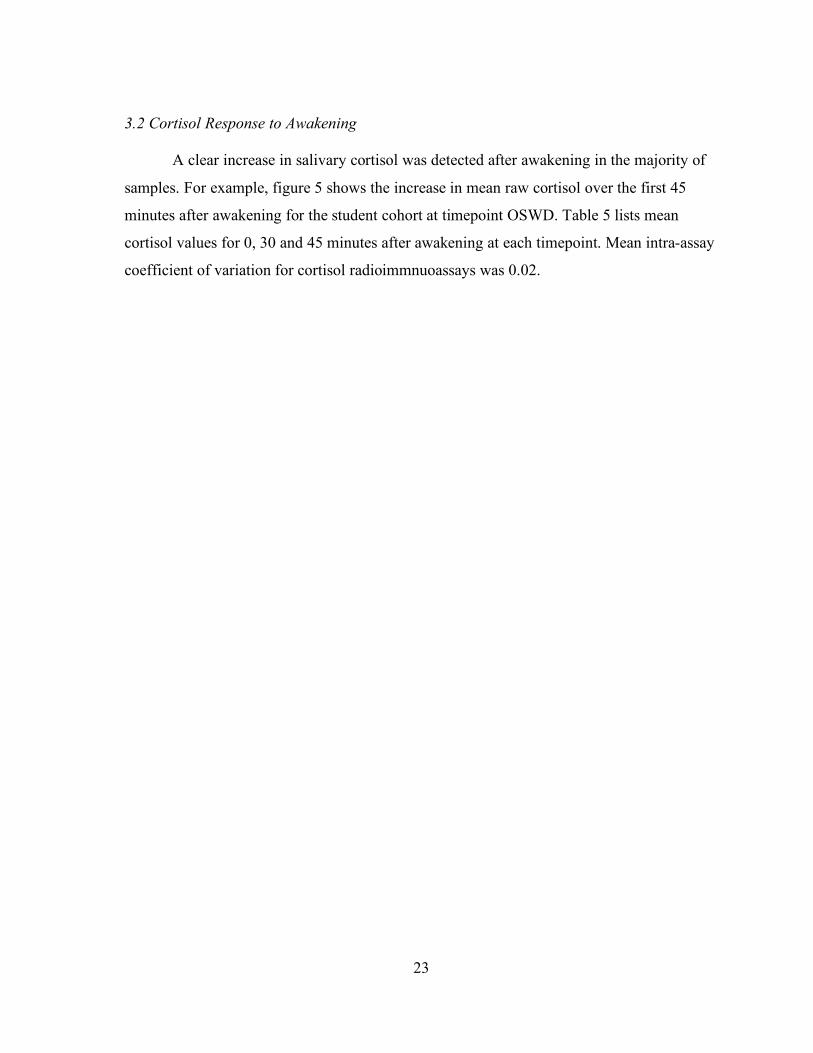
remain significant when testing area under the curve of response. When analyzing subjective
stress and control, a significant negative correlation was found between reported meat
consumption and weekend (OSWE) subjective stress ratings (Pearson, p=.006). 35.4% of the
variance in reported stress on this day could be explained by reported meat consumption. No
other diet-related correlations were found. It is likely that small variance in subjects’ dietary
habits contributed to the paucity of correlations or group differences in these factors.
18
Mean morning self-reports of subjective stress and control OSWD OSWE Sea-1 Sea-2 Sea-3 M-2 Students Stress (0-7) 3.5 1.2 3.3 3.2 3.0 2.8 SD 1.2 0.7 1.3 1.5 1.5 1.8 Ship's Crew Stress (0-7) No Data No Data 2.2 2.4 2.6 2.5 SD 1.1 2.0 1.7 1.6 Scientific Staff Stress (0-7) 3.4 2.4 2.6 3.3 2.1 2.2 SD 2.0 0.4 1.1 1.4 0.9 1.9 OSWD OSWE Sea-1 Sea-2 Sea-3 M-2 Students Control (0-7) 4.7 5.4 4.0 4.1 4.4 4.8 SD 1.0 1.2 1.1 1.4 1.2 1.4 Ship's Crew Control (0-7) No Data No Data 5.6 4.6 5.2 5.0 SD 0.4 1.9 1.0 1.0 Scientific Staff Control (0-7) 5.1 3.4 5.6 4.5 4.9 5.3 SD 0.4 2.2 0.5 1.3 1.1 0.8
Table 1: Subjective ratings of stress and control were obtained for all morning samples based on a 7-point Lykert scale asking the question “How stressed do I feel?” and “How in control do I feel.?” “SD”s are standard deviations from the mean.
19
Figure 2a: Mean 7-point Lykert ratings of subjective stress in the student cohort. Error bars represent +1 standard deviation from the mean. Timescale represents all six sampling mornings in this study: onshore workday (OSWD), onshore weekend (OSWE), three at-sea workday samples (Sea-1, Sea-2, Sea-3) and second shore leave (M-2). OSWE stress was found to be significantly lower than OSWD or at-sea working days stress (Fisher, p<.001).
Figure 2b: Mean 7-point Lykert ratings of subjective stress in the ship’s crew cohort. Error bars represent +1 standard deviation from the mean. Timescale represents 4 at-sea mornings: three at-sea workday samples (Sea-1, Sea-2, Sea-3) and second shore leave (M-2). No significant differences were found between mornings.
20
Ship's Crew
(N=2) SD Students
(N=15) SD
Scientific Staff
(N=4) SD BDI 2.57 3.89 2.87 4.36 2.50 3.00 PSS 20.76 5.37 20.73 6.06 21.50 4.20 STAI Trait 46.90 5.32 47.47 5.54 46.75 5.74 TMAS 15.71 8.20 18.33 8.14 8.25 4.03 Marlow-Crowne 17.43 5.38 16.87 5.89 17.25 3.10
Table 2: Mean scores of psychosocial survey tests for ship’s crew (N=2), students (N=15), and scientific staff (N=4). Survey instruments included Beck Depression Index (BDI), Perceived Stress Scale (PSS), Speilberger Trait Anxiety Index (STAI), Taylor-Manifest Anxiety Scale (TMAS) and the Marlow-Crowne scale of social desirability (Marlow-Crowne). SD column shows standard deviation of the means.
21
Timepoint Mean time
slept (minutes) SD
Mean Wakeup Time (min after
00:00) SD Students OSWD 378 102 407 45 OSWE 447 253 431 251 Sea-1 341 79 338 14 Sea-2 363 34 331 10 Sea-3 320 130 289 114 M-2 378 125 335 107 Crew OSWD No data No data OSWE No data No data Sea-1 241 162 249 166 Sea-2 344 61 327 9 Sea-3 357 47 361 61 M-2 335 226 374 9 Scientific Staff OSWD 223 258 200 232 OSWE 239 277 228 270 Sea-1 233 172 210 158 Sea-2 225 169 323 18 Sea-3 268 179 335 7 M-2 500 85 425 58
Table 3: Means and standard deviations for time slept and time of awakening throughout study course. Table includes all data collected for students (N=24), ship’s crew (N=4) and scientific staff (N=2 for OSWD and OSWE, N=4 for all others).
Average
Age SD
Average Caffeine Consumption
(times per week) SD
Average Meat Consumption
(times per week) SD Ship's Crew 27.0 1.8 5.3 10.5 1.0 2.0 Students 20.3 1.0 9.3 11.3 5.7 3.8 Science Crew 29.0 11.4 14.9 10.1 5.0 6.6
Table 4: Age and dietary habits for students (N=24), ship’s crew (N=4), and scientific staff (N=4). SD shows standard deviations of the mean.
22
Figure 3: Correlation between maximum cortisol response to awakening during onshore weekend morning (OSWE) and reported weekly meat consumption. Pearson, R= -.712, p=.001. Data include all students and two scientific staff, N= 15.
Figure 4: Correlation between subjective ratings of stress during onshore weekend morning (OSWE) and reported weekly meat consumption. Pearson, R = -.595, p = .006. Data include all students and two scientific staff, N= 17.
23
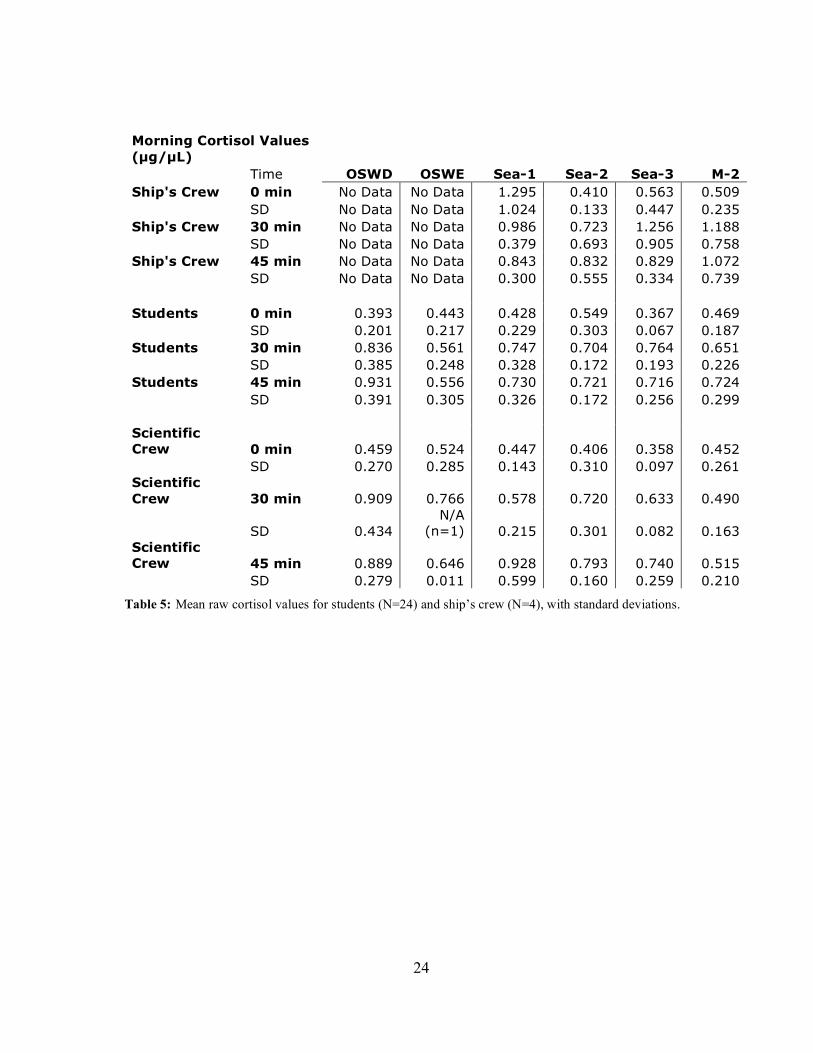
3.2 Cortisol Response to Awakening A clear increase in salivary cortisol was detected after awakening in the majority of
samples. For example, figure 5 shows the increase in mean raw cortisol over the first 45
minutes after awakening for the student cohort at timepoint OSWD. Table 5 lists mean
cortisol values for 0, 30 and 45 minutes after awakening at each timepoint. Mean intra-assay
coefficient of variation for cortisol radioimmnuoassays was 0.02.
24
Morning Cortisol Values (µg/µL) Time OSWD OSWE Sea-1 Sea-2 Sea-3 M-2 Ship's Crew 0 min No Data No Data 1.295 0.410 0.563 0.509 SD No Data No Data 1.024 0.133 0.447 0.235 Ship's Crew 30 min No Data No Data 0.986 0.723 1.256 1.188 SD No Data No Data 0.379 0.693 0.905 0.758 Ship's Crew 45 min No Data No Data 0.843 0.832 0.829 1.072 SD No Data No Data 0.300 0.555 0.334 0.739 Students 0 min 0.393 0.443 0.428 0.549 0.367 0.469 SD 0.201 0.217 0.229 0.303 0.067 0.187 Students 30 min 0.836 0.561 0.747 0.704 0.764 0.651 SD 0.385 0.248 0.328 0.172 0.193 0.226 Students 45 min 0.931 0.556 0.730 0.721 0.716 0.724 SD 0.391 0.305 0.326 0.172 0.256 0.299 Scientific Crew 0 min 0.459 0.524 0.447 0.406 0.358 0.452 SD 0.270 0.285 0.143 0.310 0.097 0.261 Scientific Crew 30 min 0.909 0.766 0.578 0.720 0.633 0.490
SD 0.434 N/A
(n=1) 0.215 0.301 0.082 0.163 Scientific Crew 45 min 0.889 0.646 0.928 0.793 0.740 0.515 SD 0.279 0.011 0.599 0.160 0.259 0.210
Table 5: Mean raw cortisol values for students (N=24) and ship’s crew (N=4), with standard deviations.
25
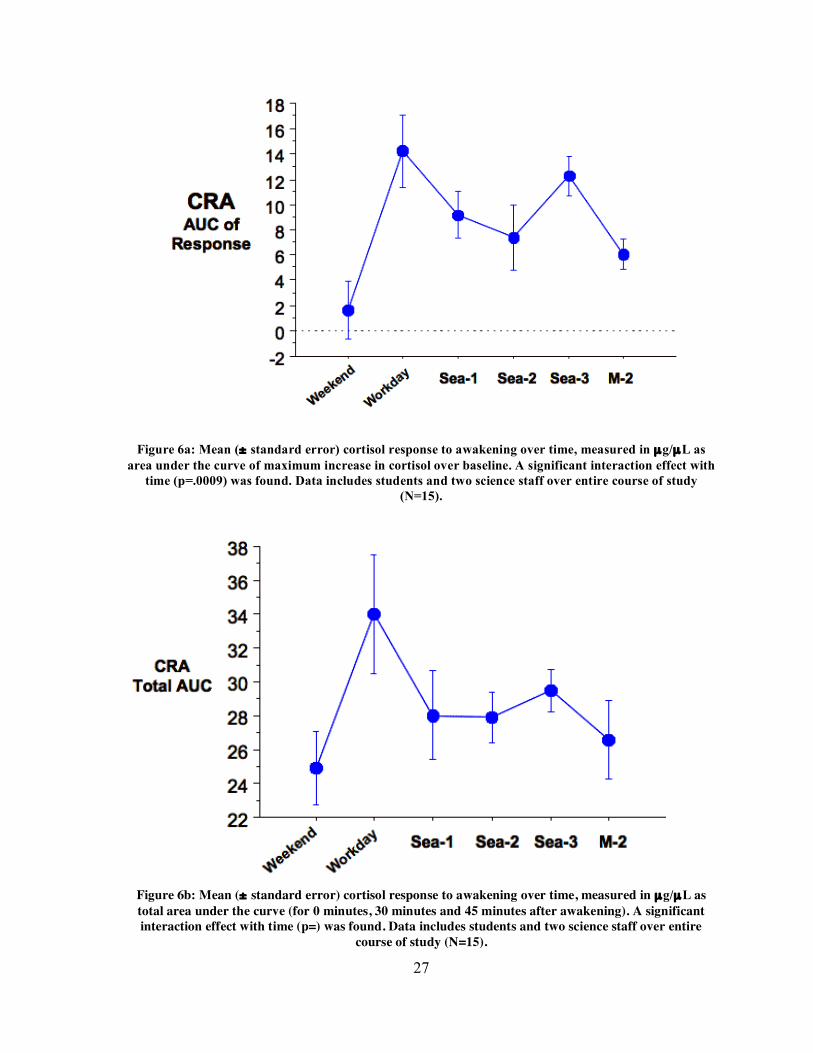
Analysis of area under the curve (AUC) for cortisol response to awakening revealed
an interaction effect with time, indicating that subjects’ CRAs changed over the course of
the study (repeated measures ANOVA, p= .0009, Fig. 6a). This effect remained significant
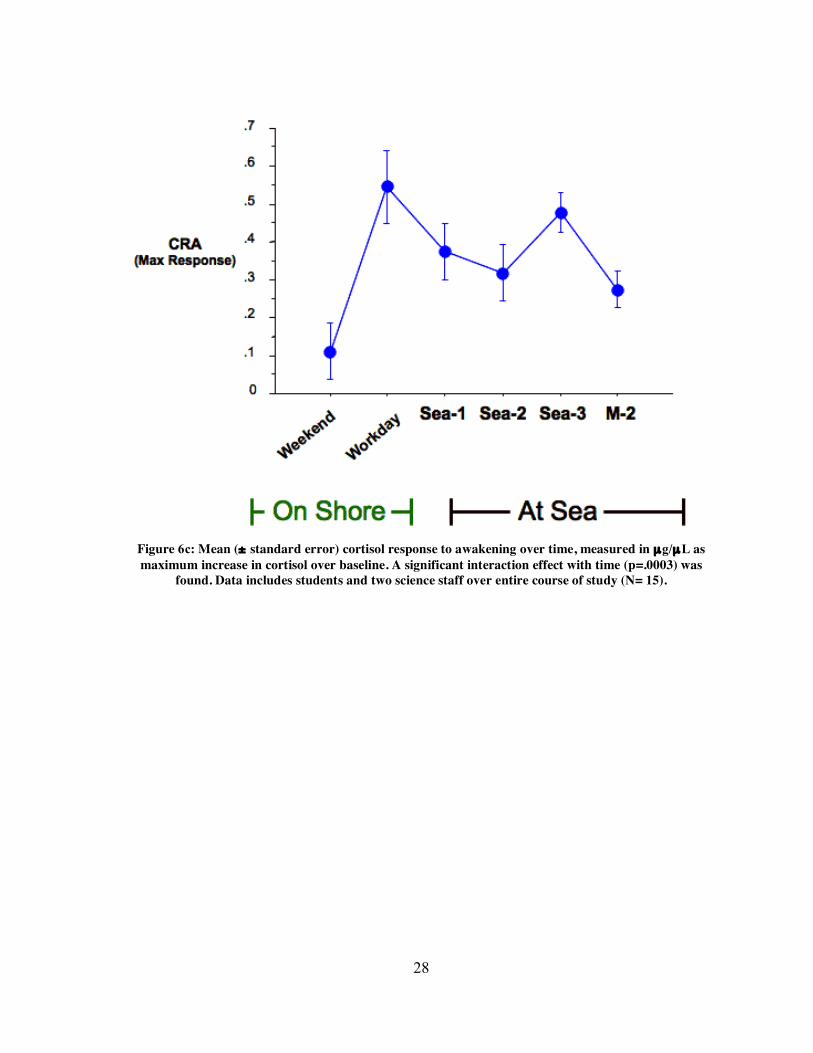
when analyzing total AUC of cortisol (repeated measures ANOVA, p=, Fig. 6b) and cortisol
maximum response (repeated measures ANOVA, p= .0003, Fig. 6c), suggesting that
subjects’ CRAs changed depending on working/living conditions at the time of sampling. In
post-hoc analysis, Fisher tests showed smaller mean AUC of response on the weekend shore
morning compared to the workday shore morning (OSWD) (Fisher, p<.0001), Sea-1
morning (Fisher, p=.0124) and Sea-3 morning (Fisher, p=.0005), suggesting that the
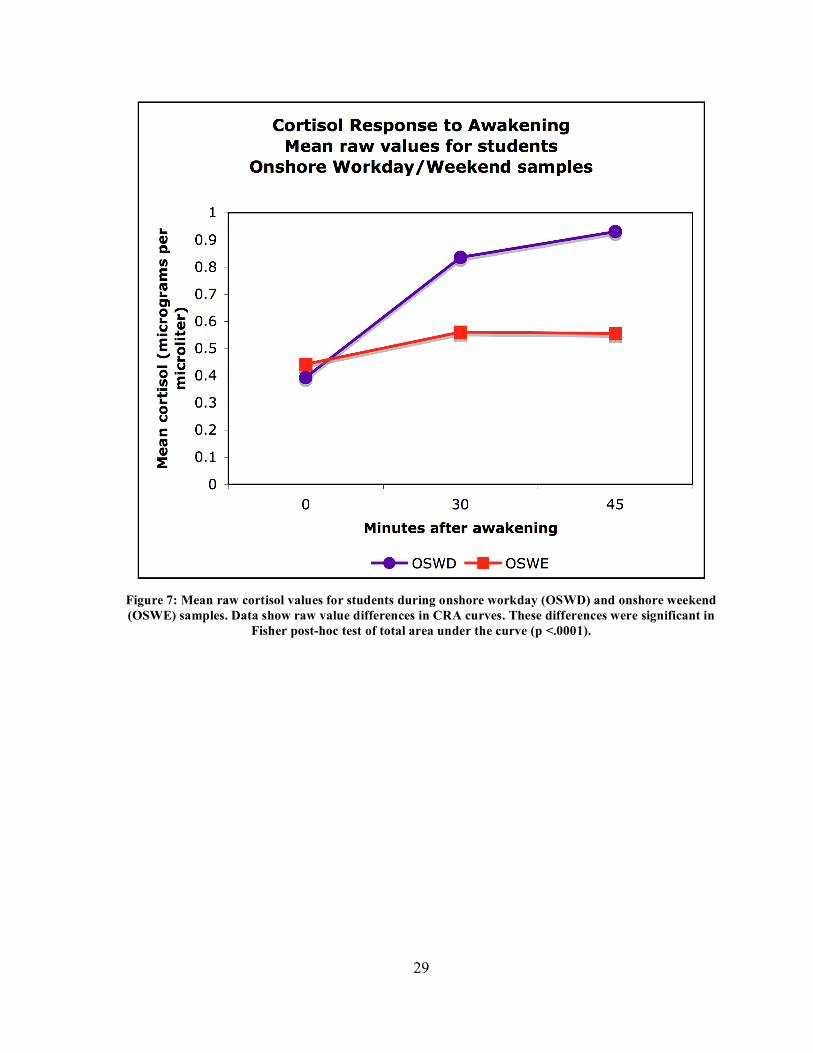
weekend day elicited smaller CRAs than working days on shore or at sea. Figure 7 shows
the difference in mean raw cortisol curves between OSWD and OSWE samples in the
student cohort. At the same time, mean AUC of response was greater on the workday shore
sample compared to the Sea-2 sample (Fisher, p=0.0225) and the shore leave (M-2) sample
(Fisher, p=0.0069), suggesting that CRAs were smaller on some sea mornings (of both
working and break days) than on the morning of a workday on shore. Lastly, mean AUC of
CRA was greater for the Sea-3 sample compared to the M-2 sample (Fisher, p=0.0369),
suggesting that CRAs decreased from the third at-sea working day sampled to the shore
leave day, on which subjects were not scheduled to work.
Analysis of total AUC for cortisol resulted in similar results. Mean total AUC for the
weekend shore sample was lower than mean AUC of workday shore sample (Fisher,
p=0.0032). The workday shore sample also showed a higher mean AUC for cortisol than the
Sea-1 (Fisher, p=0.0485), Sea-2 (Fisher, p=0.0445) and M-2 (Fisher, p=0.0149) samples.
When analyzing the cortisol maximum response, the workday shore sample (OSWD)
showed a significantly greater response than the weekend shore sample (Fisher, p<0.0001)
and the Sea-2 sample (Fisher, p=0.0190). Maximum response measures also revealed a
significantly greater mean response on the Sea-3 sample compared to the M-2 sample
(Fisher, p=0.0348). Significant differences in means are summarized in table 6. A number of
significant correlations were found within subjects between various sampling times.
26
Figure 5: Cortisol Response to Awakening was measured as a three-point curve comprised of raw
salivary cortisol levels at 0, 30 and 45 minutes after awakening. CRA was then quantified using three metrics: height of maximum increase over baseline (CRA Max Response), total area under the curve
(Total AUC), and baseline-subtracted area under the curve (AUC of response).
27
Figure 6a: Mean (± standard error) cortisol response to awakening over time, measured in µg/µL as
area under the curve of maximum increase in cortisol over baseline. A significant interaction effect with time (p=.0009) was found. Data includes students and two science staff over entire course of study
(N=15).
Figure 6b: Mean (± standard error) cortisol response to awakening over time, measured in µg/µL as total area under the curve (for 0 minutes, 30 minutes and 45 minutes after awakening). A significant interaction effect with time (p=) was found. Data includes students and two science staff over entire
course of study (N=15).
28
Figure 6c: Mean (± standard error) cortisol response to awakening over time, measured in µg/µL as maximum increase in cortisol over baseline. A significant interaction effect with time (p=.0003) was
found. Data includes students and two science staff over entire course of study (N= 15).
29
Figure 7: Mean raw cortisol values for students during onshore workday (OSWD) and onshore weekend (OSWE) samples. Data show raw value differences in CRA curves. These differences were significant in
Fisher post-hoc test of total area under the curve (p <.0001).
30
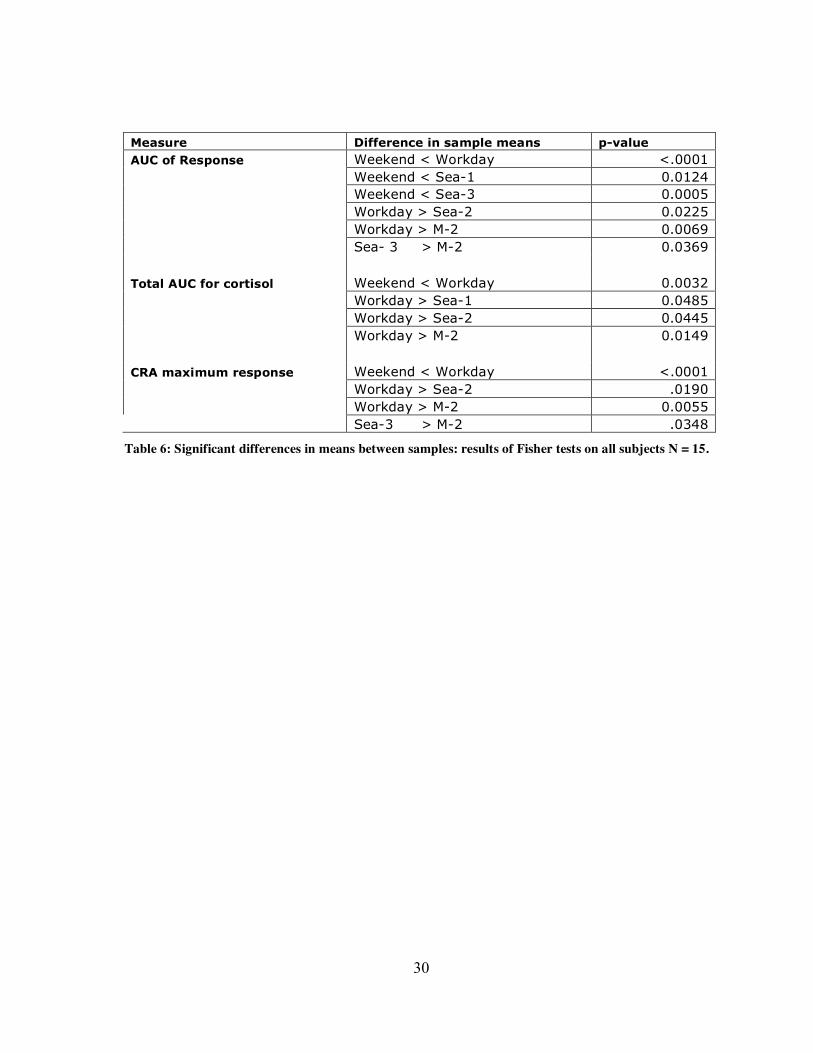
Measure Difference in sample means p-value AUC of Response Weekend < Workday <.0001 Weekend < Sea-1 0.0124 Weekend < Sea-3 0.0005 Workday > Sea-2 0.0225 Workday > M-2 0.0069 Sea- 3 > M-2 0.0369
Total AUC for cortisol Weekend < Workday 0.0032 Workday > Sea-1 0.0485 Workday > Sea-2 0.0445 Workday > M-2 0.0149 CRA maximum response Weekend < Workday <.0001 Workday > Sea-2 .0190 Workday > M-2 0.0055 Sea-3 > M-2 .0348
Table 6: Significant differences in means between samples: results of Fisher tests on all subjects N = 15.
31
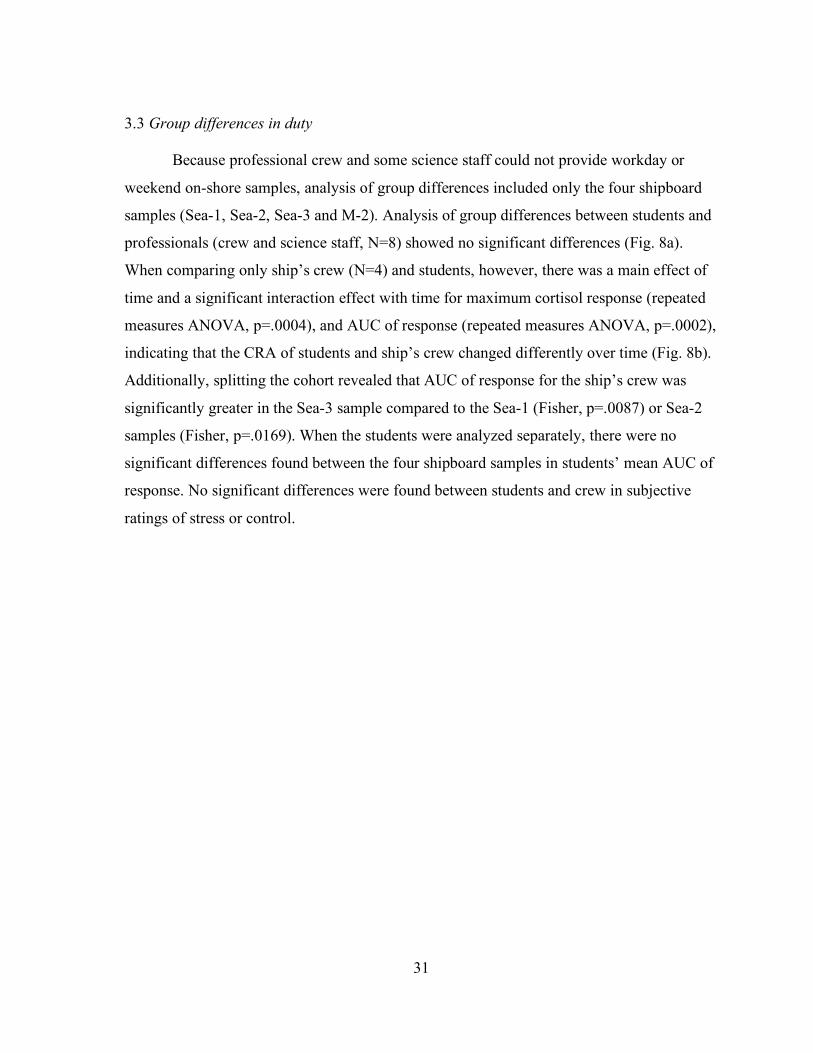
3.3 Group differences in duty Because professional crew and some science staff could not provide workday or
weekend on-shore samples, analysis of group differences included only the four shipboard
samples (Sea-1, Sea-2, Sea-3 and M-2). Analysis of group differences between students and
professionals (crew and science staff, N=8) showed no significant differences (Fig. 8a).
When comparing only ship’s crew (N=4) and students, however, there was a main effect of
time and a significant interaction effect with time for maximum cortisol response (repeated
measures ANOVA, p=.0004), and AUC of response (repeated measures ANOVA, p=.0002),
indicating that the CRA of students and ship’s crew changed differently over time (Fig. 8b).
Additionally, splitting the cohort revealed that AUC of response for the ship’s crew was
significantly greater in the Sea-3 sample compared to the Sea-1 (Fisher, p=.0087) or Sea-2
samples (Fisher, p=.0169). When the students were analyzed separately, there were no
significant differences found between the four shipboard samples in students’ mean AUC of
response. No significant differences were found between students and crew in subjective
ratings of stress or control.
32
Figure 8a: Differences in cortisol response to awakening between students (N= 20) , scientific staff (N=4) and ship’s crew (N=4): At-sea samples. CRA is measured in µg/µL as maximum increase in cortisol over baseline (± standard error). Notice lack of differentiation in CRAs of students and scientific staff. Ship’s crew show significant difference in interaction effect, as well as differences in the means of some timepoints.
Figure 8b: Differences in cortisol response to awakening between students (N= 20) and crew (N=4): At-sea samples. CRA is measured in µg/µL as area under the curve of maximum increase in cortisol over baseline (± standard error).
33
4. Discussion
Results of this study confirmed two major predictions. The cortisol response to
awakening was shown to change depending on study conditions, and students were shown to
respond differently from crew to the experience of seafaring. The considerably larger
cortisol response to awakening on the OSWD versus the OSWE sample is consistent with
other studies (Kunz-Ebrecht et al. 2004, Schlotz et al. 2004) in which CRA was higher on
weekdays than on weekends. This validates our measure, but also establishes a dynamic
onshore baseline for comparisons with samples taken at sea. For instance, the experience of
shore leave (a non-work day of personal time on shore) appears to successfully attenuate the
CRA during seafaring voyages in a manner similar to the normal weekend effect. This
finding may help shed some light on weekday/weekend differences in the CRA, because
while shore leave retains the weekend anticipation of low stress, free time and extra sleep,
frequency and relatedness of social interactions were controlled during shore leave. In this
study, mean time of awakening was somewhat higher for OSWE and M-2 samples than for
the working-day samples, but since individuals’ times of awakening were not found to
correlate with any cortisol measures, late wakeup can be ruled out as a cause of smaller non-
working day CRA. Other sleep measures, including total sleep duration and time of
awakening, did not demonstrate an independent effect on the CRA. This is consistent with
Federenko et al.’s (2004) study, which found no correlation between CRA and either sleep
duration, sleep quality or time of awakening. Furthermore, this study did not find a
relationship between subjective stress ratings and either CRA or awakening time, meaning
that subjects’ CRAs were not affected by waking time-dependant stress as in Williams et al.
(2004).
4.2 Stress, CRA and diet
Since this study could not adequately examine the effect of diet on CRA, future
studies are required to better understand the effect of diet on glutocorticoid regulation.
Though variation in diet for this sample was small, this study’s findings correlating meat
consumption with both subjective stress and CRA should peak the interest of researchers
interested in investigating the role of diet (specifically meat consumption) in modulating
34
cortisol function. Though Remer et al. (1998) found that experimentally reducing meat and
protein consumption in a cohort also reduced 24-hr cortisol secretion, our data suggest that
long-term (lifestyle-scale) reduced meat consumption may predict greater adrenocortical and
psychological response to stressors. More research is necessary to determine the relative
influence of diet on the HPA axis and to establish the mechanism for these interactions.
4.3 Reduced CRA during work at sea
We were surprised to find that despite the taxing, high-pressure conditions of
working onboard a sailing vessel, subjects’ CRAs were smaller onboard the ship relative to
an average workday on shore. After removing the ship’s crew from the analysis, this trend
became even more significant (ship’s crew members showed increasing CRA during the
three on-duty sea samples.) We offer a number of possible explanations for this reduction in
CRA. First, it is possible that the physical experience of seafaring or the oceanic
environment influence CRA through undetermined pathways. To explore this possibility,
further studies would need to manipulate the living environment while controlling other
factors known to influence the CRA. Another potential explanation for diminished responses
at sea involves the anticipation of challenge in a self-selecting cohort of young students. It is
possible that individuals who would choose (in fact, who would pay) to undergo training at
sea may perceive those challenges more positively than the stressors of everyday life. This
challenge-seeking attitude or excitement may be responsible for reducing anticipatory stress
and attenuating the CRA. Lindhal et al. (2005) have found that students who applied the
confidence building procedure "I say to myself: I can solve this task" in a school test
situation showed lower CRA the morning of testing when compared to other students. Also,
Lai et al. (2005) have shown that the CRA is lower in individuals with relatively higher
positive affect and optimism. These findings suggest that a combination of personality traits
such as challenge-seeking self-confidence and positive affect resulting from the holistic
experience of seafaring may have attenuated stress-related effects on the HPA-axis in our
student cohort.
Another possibility is that increasing social bonding over the course of the program
acted to reduce social stress and subsequently buffered or offset reactivity of the HPA-axis.
Perceived social stress and lack of social recognition have been shown to elevate CRA
35
(Wüst et al. 2000) and loneliness was found to correlate positively with CRA (Steptow et al.
2003), therefore the effects of progressive social bonding on the HPA warrant further study.
In past studies, prolonged exposure to stress was found to diminish cortisol response as a
result of allostatic overload (McEwin and Wingfield 2003), but this seems an unlikely
explanation for diminished CRA in the current study, because ship’s crew, who experienced
identical conditions on board, exhibited an increasing trend in CRA while at sea. Also,
subjects did not self-report the high levels of stress that would normally be associated with
allostatic overload. One potential confound was the effect of seasickness on participants.
Klosterhalfen et al. (2005) have found that nausea and vomiting can alter cortisol secretion,
but seasickness could neither be prevented nor controlled in this study, as subjects
demonstrated a wide range of symptoms, and some participants reported no seasickness at
all.
4.4 Enhanced CRA in experienced crew
Along with the surprising lack of increase in CRA at sea, higher CRAs in ship’s
crew than in students or scientific staff were similarly unforeseen; we had originally
hypothesized that experience (i.e. lack of novelty) would attenuate the cortisol response to
seafaring in the same way that repeated exposure has been shown to reduce adrenocortical
response to novel stressors in animals (Hennessey and Levine 1979). Conversely, the highly
experienced crew not only exhibited larger CRAs, but also appeared to follow a trend
towards increasing CRA over the course of the working-day sea samples (Sea-1, Sea-2, Sea-
3). There was no significant difference between the reported subjective stress of ship’s crew
and other subjects, implying that this difference may not reflect perceivably higher stress
among crew. One possible explanation for these findings is that crew CRA may be
responding to a turnover of ship’s duties to students. During training voyages, students begin
with few responsibilities on board, and are provided with increasing duties as they learn new
skills. These duties, once the responsibility of ship’s crew, are taken on by inexperienced
students under supervision. This process requires the crew to relinquish control of some
operations, which may result in greater HPA reactivity or CRA-boosting anticipatory stress.
Analyses of subjective ratings of control did not produce a trend, but variation in the ratings
36
was very low. Also, there may have been a response bias against reporting low perceived
control among the ship’s crew.
In light of this data, new questions have arisen regarding the role of the living and
working environment in HPA function. Further study is required to assess the role of
challenge, landscape and perceived control in HPA reactivity. In conclusion, this study
found that the cortisol response to awakening changed over time in response to the
experience of seafaring, depending on work load, and that the CRAs of students changed
differently from those of experienced crew.
37
Literature Cited Alpers, G.W., Abelson, J.L., Wilhelm, F.H., Roth, W.T. Salivary cortisol responses to exposure treatment in driving phobics. Psychosomatic Medicine. 2003; vol. 65:679-687) Beck, A. T. and R. A. Steer. Internal consistencies of the original and revised Beck Depression Inventory. Journal of Clinical Psychology. 1984; vol. 40(6): 1365-7. Cannon, W.B. Emergency function of adrenal medulla in pain and major emotions. American Journal of Physiology. 1914; vol. 3: 356-372. Clow, A., Thorn, L., Evans, P., Hucklebridge, F. The Awakening Cortisol Response: Methodological Issues and Significance. Stress. 2004; vol. 7(1): 29-37. Cohen, S., Kamarck, T., Mermelstein, R. A global measure of perceived stress. Journal of Health and Social Behavior. 1983; vol. 24(4): 385-96. Dhabhar, F., McEwen, B., Enhancing versus suppressive effects of stress hormones on skin immune function. Proceedings of the National Academy of Sciences. 1999; vol. 96, 1059 –1064. Federenko, I., Wüst, S., Hellhammer, D.H., Dechoux, R., Kumsta, R., Kirschbaum, C. Free cortisol awakening responses are influenced by awakening time. Psychoneuroendocrinology. 2004; vol. 29: 174-184. Fisher, G. Normative and reliability data for the standard and the cross-validated Marlow-Crowne social desirability scale. Psychological Reports. 1967; vol. 20(1): 174. Hennessy, J.W. and Levine, S. Stress, arousal, and the pituitary-adrenal system: a psychoendocrine hypothesis. In: Sprague, J.M. and Epstein, A.N., Editors, 1979. Progress in Psychobiology and Physiological Psychology, Academic Press, New York, pp. 133–178. Herman, J.P. and W.E. Cullinan. Neurocircuitry of stress: central control of the hypothalamo-pituitary-adrenocortical axis. Trends in Neuroscience. 1997; vol. 20(2): 78-84. Hoyt, D.P. and T.M. Magoon. A validation study of the Taylor manifest anxiety scale. Journal of Clinical Psychology. 1954; vol. 10(4) 357-361
38
Huber, T., Issa, K., Schik, G., Wolf, T. The cortisol awakening response is blunted in psychotherapy inpatients suffering from depression. Psychoneuroendocrinology. 2006; vol. 31(7): 900-904. Keller, J., Flores, B., Gomez, R.G., Solvason, H.B., Kenna, H., Williams, G.H., Schatzberg, A.F. Cortisol circadian rhythm alterations in psychotic major depression. Biological Psychiatry. 2006; vol. 60: 275-281. Klosterhalfen, S., Kellermann, S., Stockhorst, U., Wolf, J., Kirschbaum, C., Hall, G., Enck, P. Latent inhibition of rotation chair-induced nausea in healthy male and female volunteers. Psychosomatic Medicine. 2005; vol. 67(2): 335-40. Kunz-Ebrecht, S.R., Kirschbaum, C., Marmot, M., Steptoe, A. Differences in cortisol awakening response on work days and weekends in women and men from the Whitehall II cohort. Psychoneuroendocrinology. 2004; vol. 29: 516-528. Lai, J.C.L., Evans, P.D., Ng, S.H., Chong, A.M.L., Siu, O. T., Chan, C.L.W., Ho, S.M.Y., Ho, R.T.H., Chan, P., Chan, C. C. Optimism, positive affectivity, and salivary cortisol. British Journal of Health Psychology. 2005; vol. 10: 467-484. Lindahl, M., Theorell, T., Lindblad, F. Test performance and self-esteem in relation to experienced stress in Swedish sixth and ninth graders-saliva cortisol levels and psychological reactions to demands. Acta Paediatrica. 2005; vol. 94(4): 489-495. Martinek, L., Oberascher-Holzinger, K., Weishuhn, S., Klimesch, W., Kerschbaum, H.H. Anticipated academic examinations induce distinct cortisol responses in adolescent pupils. Neuro Endocrinology Letters. 2003; vol. 24(6): 449-453. McEwin, B.S., Wingfield, J.C. The concept of allostatis in biology and biomedicine. Hormones and Behavior. 2003; vol. 43: 2-15. Ng, v., Koh, D., Chia, S.E. Examination stress, salivary cortisol, and academic performance. Psychological Reports. 2003; vol. 93(2): 1133-1134. Pruessner, J.C., Wolf, O.T., Hellhammer, D.H., Buske-Kirschbaum, A., von Auer, K., Jobst, S., Kaspers, K., Kirschbaum, C. Free cortisol levels after awakening: A reliable biological marker for the assessment of adrenocortical activity. Life Sciences. 1997; vol. 61(26): 2539-2549.
39
Remer T., Pietrzik, K., Manz, F., Short-Term Impact of a Lactovegetarian Diet on Adrenocortical Activity and Adrenal Androgens. Journal of Clinical Endocrinology and Metabolism. 2001; vol. 83, No. 6. Roozendaal, B. Glucocorticoids and the regulation of memory consolidation. Psychoneuroendocrinology. 2000; vol. 25:213–238. Schmidt-Reinwald, A., Pruessner, J.C., Hellhammer, D.H., Federenko, I., Rohleder, N., Schürmeyer, T.H., Kirschbaum, C. The cortisol response to awakening in relation to different challenge tests and a 12-hour cortsol rhythm. Life Sciences. 1999; vol. 64(18): 1653-1660. Selye, H. The Stress of Life. New York, NY: McGraw-Hill. 1976. Schlotz, W., Hellhammer, J., Schultz, P., Stone, A.A. Perceived Work Overload and Chronic Worrying Predict Weekend–Weekday Differences in the Cortisol Awakening Response. Psychosomatic Medicine. 2004; vol. 66:207–214 Spielberger, C.D., Gorsuch, R.L., Lushene, R.E. STAI Manual for the State-Trait Anxiety Inventory. Palo Alto, Calif: Consulting Psychologists Press. 1969 Steptoe, A., Owen, N., Kunz-Ebrecht, S., Brydon, L. Loneliness and neuroendocrine, cardiovascular, and inflammatory stress responses in middle-aged men and women. Psychoneuroendocrinology. 2004; vol. 29: 593-611. Wessa, M., Rohleder, N., Kirschbaum, C., Flor, H. Altered cortisol awakening response in posttraumatic stress disorder. Psychoneuroendocrinology. 2006; vol. 31: 209-215. Williams, E., Magid, K., Steptoe, A. The impact of time of awakening and concurrent subjective stress on the cortisol response to awakening. Psychoneuroendocrinology. 2005; vol. 30:139-148. Wüst, S., Federenko, I., Hellhammer, D., Kirschbaum, C. Genetic Factors, perceived chronic stress, and the free cortisol response to awakening. Psychoneuroendocrinology. 2000; vol. 25: 707-720.

40
Yehuda, R. Risk and Resilience in Post Traumatic Stress Disorder Journal of Clinical Psychiatry. 2004; vol. 65 Suppl 1:29-36