Embed Size (px)
Citation preview

Stress Birefringence Modeling for Lens Design and Photonics
Keith B. Doyle Optical Research Associates
Westborough, MA
Jeffrey M. Hoffman Optical Research Associates
Tucson, AZ
Victor L. Genberg & Gregory J. Michels Sigmadyne, Inc. Rochester, NY
ABSTRACT
Modeling the effects of stress birefringence is critical for polarization sensitive optical systems. Optical design and optomechanical software tools to model stress birefringence are discussed and illustrated for three examples. The first example compares retardance in calcium fluoride lenses as a function of shape. The second example discusses the modeling of a beam splitter in an LCD projector. Lastly, stress birefringence modeling tools are demonstrated in detail in the design of focusing and collimating lenses for a WDM wavelength selective switch. The wavelength selective switch, operating over the telecom C-band (1530-1561 nm), employs a liquid crystal polarization modulator to select the output fiber for each input channel. Over the operational temperature range, CTE mismatches between the glasses and mounting materials induce stress in the optical elements creating cross-talk between the output optical fibers. Cross-talk is computed as a function of temperature for several potential design concepts. Keywords : stress birefringence, polarization, mechanical stress, finite element analysis, CODE V®, SigFit
1. INTRODUCTION Stress birefringence is an issue for many types of optical systems including systems for optical lithography, data storage, high-energy lasers, LCD projectors, and telecommunications. In the optical lithography industry, residual stress in the projection optics of the exposure equipment may limit the minimum printable feature size. In the magneto-optical data storage field, centripetal forces acting on spinning plastic substrates produce stress birefringence that may reduce storage density. High-energy laser systems subject windows to thermal stresses resulting in performance degradation due to polarization changes. Stress in LCD projector components may cause color changes in the projected image. Telecommunication wavelength division multiplexing (WDM) networks often employ optical polarization techniques, and polarization variations caused by stress birefringence may generate cross-talk between output signals. Birefringence may be generated in optical elements from mechanical loads acting on the optical system during standard operation. Uniform temperature changes produce mechanical stress in optical components due to mismatches in coefficients of thermal expansion between cemented elements and/or mounting materials. Temperature gradients induce stress in single, homogeneous elements. States of stress are also developed in optical elements due to pressure, inertial, and vibratory loads, and residual stresses due to manufacturing and fabrication processes cause birefringence. The effect of stress, whether mechanically-induced or residual, is to change the index of refraction of the optical material. The resulting state of birefringence creates wavefront error and polarization changes in light propagating through the optical system.
2. STRESS BIREFRINGENCE It may be shown using Maxwell's equations that for an optically anisotropic medium that, in general, two plane polarized waves travel along paths with different indices of refraction; this material property is referred to as birefringence. The refractive indices of a given medium are defined by the direction of the wave normal and the second-order tensor known as the dielectric impermeability tensor, Bij:
332313
232212
131211
ΒΒΒΒΒΒΒΒΒ
=Βij . (2.1)
The dielectric impermeability tensor may be expressed in the following form:
,1222 1 3113322321122333
2222
2111 =Β+Β+Β+Β+Β+Β→=Β∑ xxxxxxxxxxx j
ijiij (2.2)
which is the general equation for a second-degree surface or quadric where Bij represent the coefficients of the surface. The quadric representation of the dielectric impermeability tensor completely describes the optical properties and is known as the index ellipsoid (also known as the ellipsoid of wave normals, or optical indicatrix). The index ellipsoid defines all orientations of the second order tensor including the principal axes. The refractive indices are defined by the semi-axes of the index ellipsoid. The application of mechanical stress to an optical substrate modifies the optical properties of a material by modifying the dielectric impermeability tensor. Thus, a homogeneous and isotropic optical material subject to mechanical stress will become optically anisotropic. (Stress also modifies the optical properties of naturally birefringent materials such as crystals.) This phenomenon is known as the photoelastic effect or stress birefringence. The changes in the indices of refraction are due to the effects of stress imparting changes in the dielectric impermeability tensor that alter the size, shape, and orientation of the index ellipsoid. Changes in the dielectric impermeability tensor due to the application of mechanical stress are given by the following fourth rank tensor transformation:
klijklqij ijij σ=Β−Β=∆Β 0 , (2.3)
where q is the stress-optical coefficient matrix, and σ is the stress tensor.
3. MODELING STRESS BIREFRINGENCE Many optical design codes offer the ability to model birefringent materials with homogeneous properties, where the birefringence is the same at every point in the material. The difference in the index between orthogonal axes is specified along with an orientation value. An optical element with a uniform stress distribution may, therefore, be represented using this approach. However, mechanical stress typically varies in three dimensions within an optical element. Thus, the size, shape, and orientation of the index ellipsoid vary at every point along a given direction of the wave normal. The optical design software program CODE V®1 offers an approximate technique to model the effects of a spatially varying stress field using interferogram files. Interferogram files represent perturbations in the optical properties due to stress, which are superimposed upon the nominal isotropic or anisotropic properties of the optical medium.
Stress birefringence interferogram files are based on a linear retarder model and require two sets of data, with each set in a different interferogram file. One data set (or interferogram file) represents the magnitude of birefringence, i.e., the difference in the refractive index between the orthogonal plane wave components, given per unit distance expressed in nm/cm. These data are assumed to be normal to the optical surface and represent the average birefringence though the optical element. The second interferogram file represents the crystal axis orientation. The orientation data lie in the x-y plane of the optical surface. Stress birefringence interferogram files may be assigned to surfaces in the optical model using Zernike polynomials or a uniform rectangular grid. Polarimetry data and/or finite element derived stress data may be represented in the optical model using stress birefringence interferogram files. This may be accomplished by deriving the magnitude of birefringence and orientation value from a Jones or Mueller matrix representation typical of polarimetry software output. These data may then be fit to Zernike polynomials or interpolated to a uniform grid for use as interferogram files in the optical model. Stress birefringence interferogram files may also be generated using stress data computed via finite element analysis. This method is detailed by Doyle 2 and forms the basis of the algorithm used by the optomechanical analysis software package SigFit3. This approach is summarized below. Finite element analysis is used to compute a three-dimensional state of stress for a given refractive optical element. At each node in the finite element model, the changes in the dielectric impermeability tensor are computed using the state of stress and the stress-optical coefficient matrix (i.e., using equation 3.1). Thus, the finite element stress distribution is converted into a ∆B field that represents the changes in the optical properties in the material due to mechanical stress. A grid of rays is then traced through the ∆B distribution. At incremental points along each of the ray paths, the changes in the index of refraction in the two orthogonal directions are computed, ∆n1 and ∆n2, along with the orientations of the axes. For points that do not coincide with a node point, ∆B values are interpolated using finite element shape functions. Jones retarder and rotation matrices are then developed at each increment along a given ray path. These matrices are multiplied together to create a system level Jones matrix that represents the integrated effects of the stress field on the ray. The birefringence magnitude and orientation are then computed from the matrix elements of the system Jones matrix. Several examples are discussed in the following sections regarding modeling of stress birefringence. The first example compares the magnitude of retardance as a function of lens shape. This analysis was performed by computing the system level Jones matrix for a grid of rays passing through each optical element parallel to the optical axis. The retardance magnitude was then computed a function of radial position. The second example discusses the effects of stress in a beam splitter cube for an LCD projector. The specific nature of the beam splitter stress field requires use of multiple surfaces and interferogram files to account for the stress in the optical model. Finally, the use of stress birefringence interferogram files in the design and evaluation of lens elements is discussed for a wavelength selective switch. Here, optical performance is measured in terms of cross-talk as a function of temperature for three potential optical design concepts.
4. RETARDANCE VERSUS LENS SHAPE Typical calcium fluoride lens elements, used for 157 nm optical lithography, align the [111] crystal axis with the optical axis. (This is the orientation that minimizes birefringence and also defines the cleave plane which simplifies the fabrication of the lenses). However, there has been interest in the optical lithography industry to create calcium fluoride lens elements whose optical axis is aligned with the [100] crystal axis. Minimizing the effects of stress birefringence is critical for lenses aligned in this orientation. A comparison study was performed to evaluate the magnitude of retardance as a function of lens shape. Each lens element has the same diameter (6 inches), equal front and rear curvatures, and a uniform radial load applied around the edge. Finite element analysis was used to compute the stress field in each lens element. The load was varied to maintain a maximum stress for each lens configuration at 750 psi. The retardance was then computed as a function of radial posit ion
(units of retardance are given in waves – index difference times the thickness of the lens). In one study, the thickness of the lens element was varied while the curvature was unchanged. In a second study, the curvature of the lens element was varied and the thickness of the lens was held constant. The results for the two studies are shown in Figures 1 and 2.
5. LCD PROJECTOR
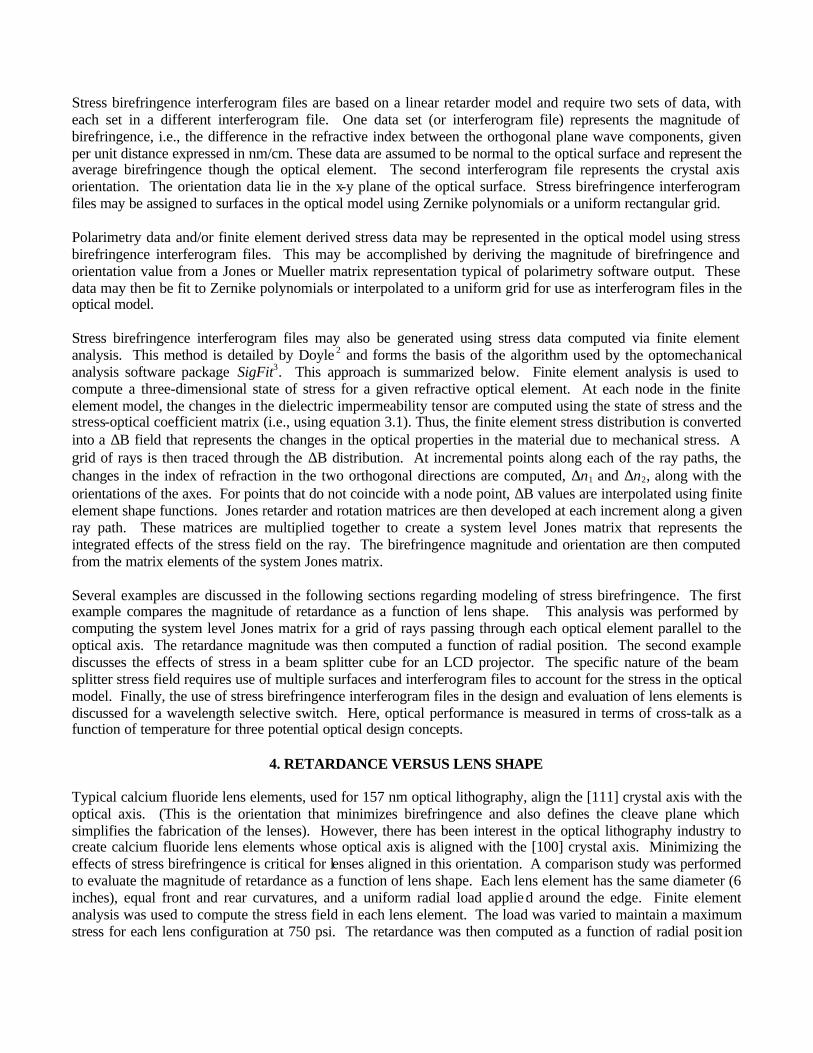
Color LCD (liquid crystal display) projectors project images using high-intensity polychromatic light transmitted or reflected through a liquid crystal pixel array. The pixels of the LCD array modulate the incident polarization state as a function of position. A pixel that is in the 'on' state has no affect on the polarization state. An 'off' state rotates linearly polarized light by 90-degrees, i.e., converts s-polarization to p-polarization and vice versa. A 'partial' state rotates the polarization state between 0 and 90-degrees. For example, if using the blue mode, the 'off'-pixel transmits blue light; the 'on'-pixel transmits a light yellow color. A 'partial'-state produces a color in-between. Along with LCD arrays, these projectors use a variety of optical elements including polarizing beam splitters. The relative high-intensity of light that is transmitted through LCD projectors causes heating in the beam splitter cubes. This in-turn produces stress within the cube, which alters the polarization characteristics of the projector and affects the color of the projected image. As an example, we have used stress birefringence modeling techniques to analyze thermal loading effects on a beam splitter cube used in an LCD projector. The beam splitter cube, measuring 1.1 inches wide by 1.25 inches high, is illuminated by a spatially uniform intensity distribution over a 400 – 700 nm spectral band with a total power of 10 watts. The beam is focused with a half-angle of 8 degrees. Half the energy travels straight through the cube, and the other half is reflected out the side. Using thermal analysis, we predicted that the temperature distribution in the cube ranged from 22.4 to 25.6 °C, and the temperature gradient generated a stress distribution with a maximum value of 160 psi. Rays traced through unstressed and stressed beam splitter cubes are shown in Figure 3. Details of the effects of the stress field on the polarization state of the incident light are omitted. However, this specific example was selected to highlight a method to represent the case where the system Jones matrix is not representative of a linear retarder model. In this case, the ellipticity value derived from the Jones matrix is non-zero, and the more general elliptical retarder model must be used to represent the integrated effects of the stress field. In general, using multiple surfaces to represent a lens element and applying stress birefringence interferogram files to each surface approximate the elliptical retarder. Whereas this is straightforward for a lens element, it is a non-trivial operation to account for both beam paths through a beam splitter cube.
4. WAVELENGTH SELECTIVE SWITCH
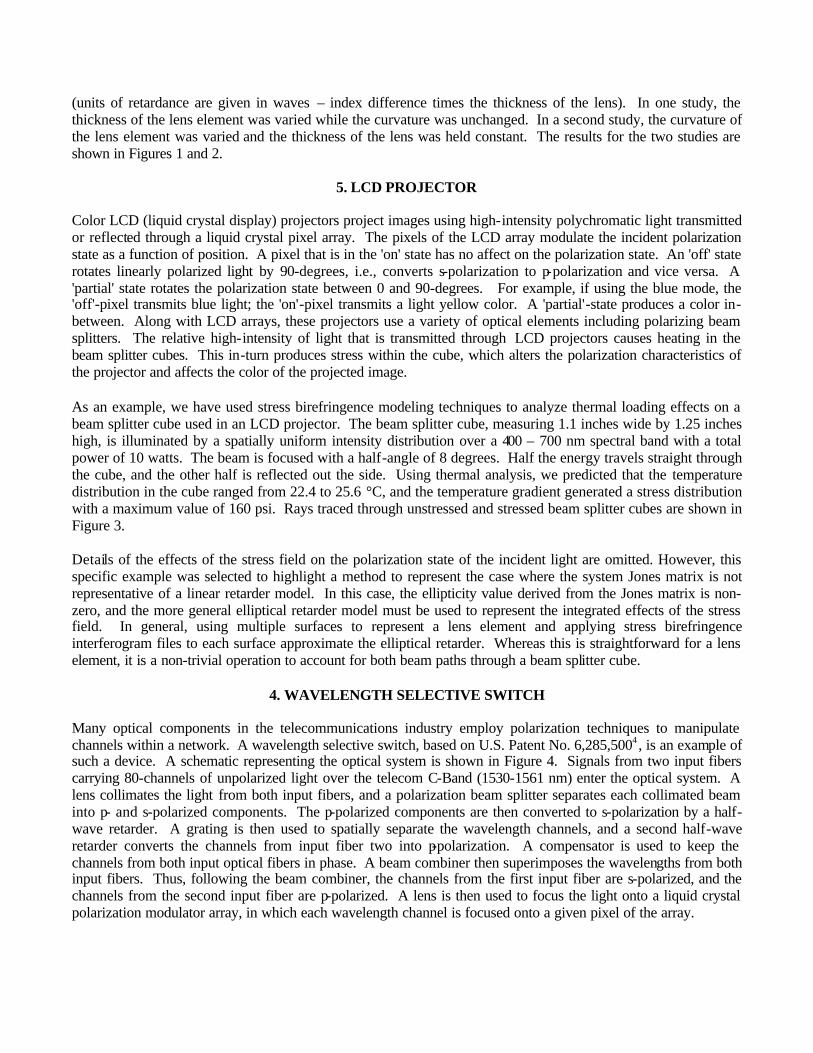
Many optical components in the telecommunications industry employ polarization techniques to manipulate channels within a network. A wavelength selective switch, based on U.S. Patent No. 6,285,5004 , is an example of such a device. A schematic representing the optical system is shown in Figure 4. Signals from two input fibers carrying 80-channels of unpolarized light over the telecom C-Band (1530-1561 nm) enter the optical system. A lens collimates the light from both input fibers, and a polarization beam splitter separates each collimated beam into p- and s-polarized components. The p-polarized components are then converted to s-polarization by a half-wave retarder. A grating is then used to spatially separate the wavelength channels, and a second half-wave retarder converts the channels from input fiber two into p-polarization. A compensator is used to keep the channels from both input optical fibers in phase. A beam combiner then superimposes the wavelengths from both input fibers. Thus, following the beam combiner, the channels from the first input fiber are s-polarized, and the channels from the second input fiber are p-polarized. A lens is then used to focus the light onto a liquid crystal polarization modulator array, in which each wavelength channel is focused onto a given pixel of the array.
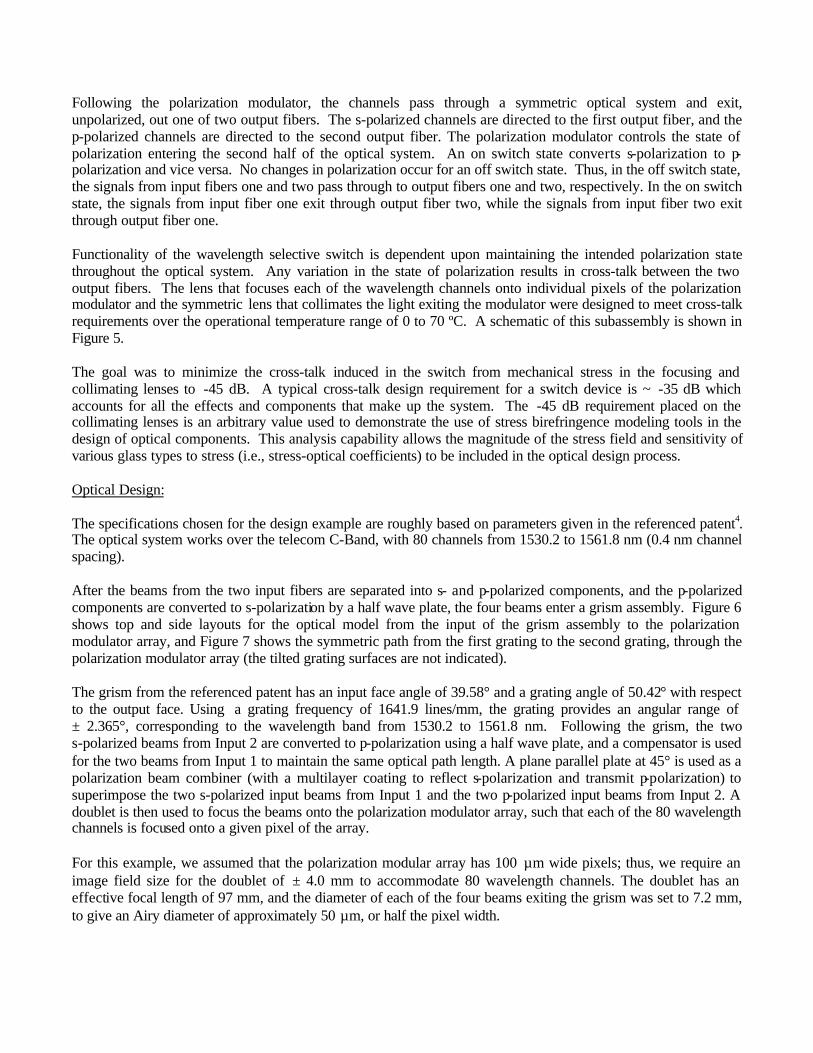
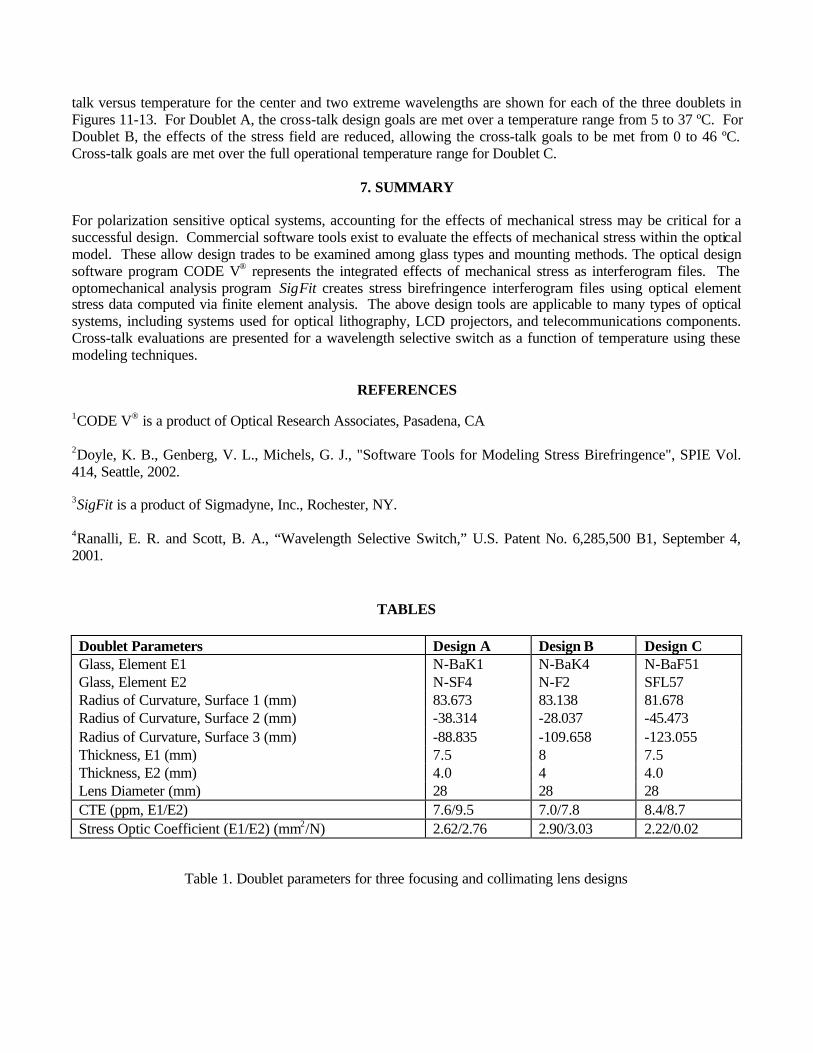
Following the polarization modulator, the channels pass through a symmetric optical system and exit, unpolarized, out one of two output fibers. The s-polarized channels are directed to the first output fiber, and the p-polarized channels are directed to the second output fiber. The polarization modulator controls the state of polarization entering the second half of the optical system. An on switch state converts s-polarization to p-polarization and vice versa. No changes in polarization occur for an off switch state. Thus, in the off switch state, the signals from input fibers one and two pass through to output fibers one and two, respectively. In the on switch state, the signals from input fiber one exit through output fiber two, while the signals from input fiber two exit through output fiber one. Functionality of the wavelength selective switch is dependent upon maintaining the intended polarization state throughout the optical system. Any variation in the state of polarization results in cross-talk between the two output fibers. The lens that focuses each of the wavelength channels onto individual pixels of the polarization modulator and the symmetric lens that collimates the light exiting the modulator were designed to meet cross-talk requirements over the operational temperature range of 0 to 70 ºC. A schematic of this subassembly is shown in Figure 5. The goal was to minimize the cross-talk induced in the switch from mechanical stress in the focusing and collimating lenses to -45 dB. A typical cross-talk design requirement for a switch device is ~ -35 dB which accounts for all the effects and components that make up the system. The -45 dB requirement placed on the collimating lenses is an arbitrary value used to demonstrate the use of stress birefringence modeling tools in the design of optical components. This analysis capability allows the magnitude of the stress field and sensitivity of various glass types to stress (i.e., stress-optical coefficients) to be included in the optical design process. Optical Design: The specifications chosen for the design example are roughly based on parameters given in the referenced patent4. The optical system works over the telecom C-Band, with 80 channels from 1530.2 to 1561.8 nm (0.4 nm channel spacing). After the beams from the two input fibers are separated into s- and p-polarized components, and the p-polarized components are converted to s-polarization by a half wave plate, the four beams enter a grism assembly. Figure 6 shows top and side layouts for the optical model from the input of the grism assembly to the polarization modulator array, and Figure 7 shows the symmetric path from the first grating to the second grating, through the polarization modulator array (the tilted grating surfaces are not indicated). The grism from the referenced patent has an input face angle of 39.58° and a grating angle of 50.42° with respect to the output face. Using a grating frequency of 1641.9 lines/mm, the grating provides an angular range of ± 2.365°, corresponding to the wavelength band from 1530.2 to 1561.8 nm. Following the grism, the two s-polarized beams from Input 2 are converted to p-polarization using a half wave plate, and a compensator is used for the two beams from Input 1 to maintain the same optical path length. A plane parallel plate at 45° is used as a polarization beam combiner (with a multilayer coating to reflect s-polarization and transmit p-polarization) to superimpose the two s-polarized input beams from Input 1 and the two p-polarized input beams from Input 2. A doublet is then used to focus the beams onto the polarization modulator array, such that each of the 80 wavelength channels is focused onto a given pixel of the array. For this example, we assumed that the polarization modular array has 100 µm wide pixels; thus, we require an image field size for the doublet of ± 4.0 mm to accommodate 80 wavelength channels. The doublet has an effective focal length of 97 mm, and the diameter of each of the four beams exiting the grism was set to 7.2 mm, to give an Airy diameter of approximately 50 µm, or half the pixel width.
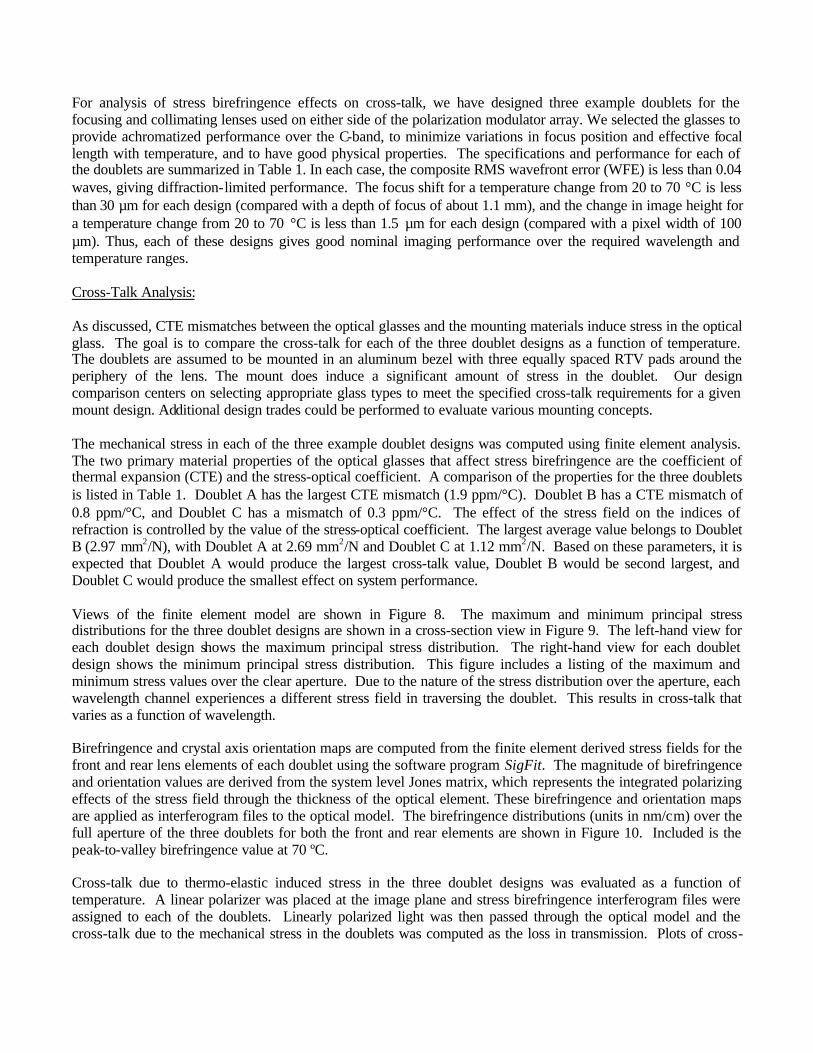
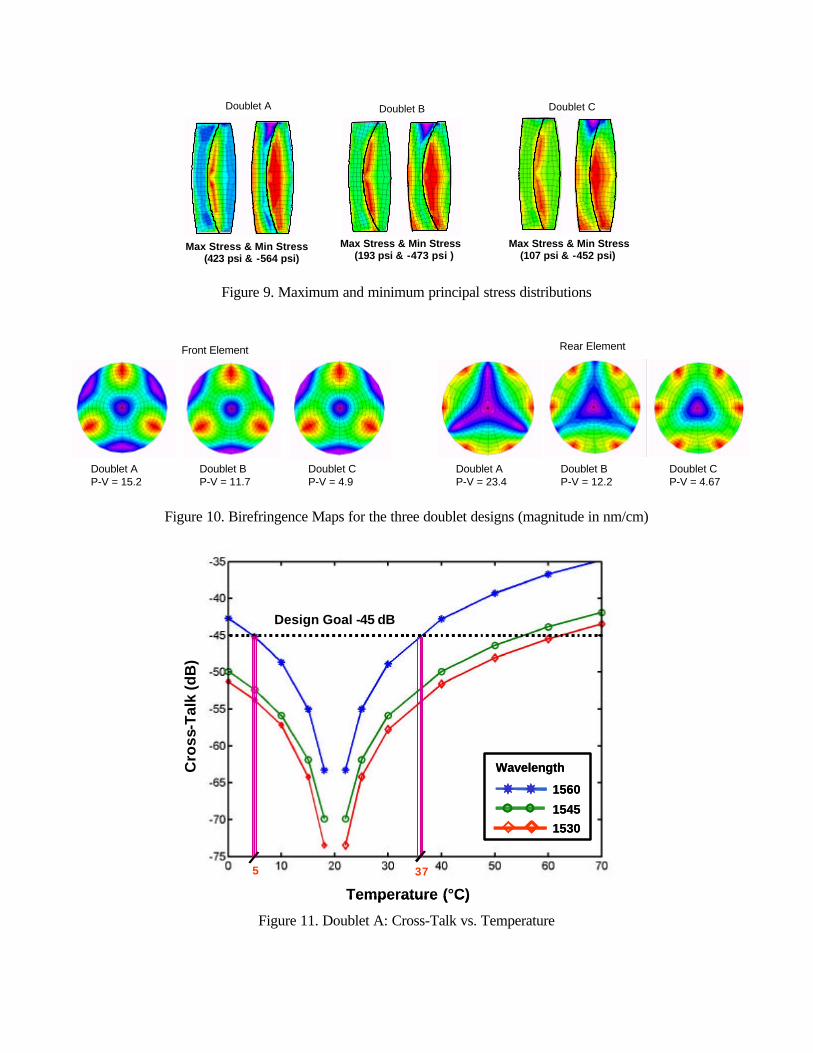
For analysis of stress birefringence effects on cross-talk, we have designed three example doublets for the focusing and collimating lenses used on either side of the polarization modulator array. We selected the glasses to provide achromatized performance over the C-band, to minimize variations in focus position and effective focal length with temperature, and to have good physical properties. The specifications and performance for each of the doublets are summarized in Table 1. In each case, the composite RMS wavefront error (WFE) is less than 0.04 waves, giving diffraction-limited performance. The focus shift for a temperature change from 20 to 70 °C is less than 30 µm for each design (compared with a depth of focus of about 1.1 mm), and the change in image height for a temperature change from 20 to 70 °C is less than 1.5 µm for each design (compared with a pixel width of 100 µm). Thus, each of these designs gives good nominal imaging performance over the required wavelength and temperature ranges. Cross-Talk Analysis: As discussed, CTE mismatches between the optical glasses and the mounting materials induce stress in the optical glass. The goal is to compare the cross-talk for each of the three doublet designs as a function of temperature. The doublets are assumed to be mounted in an aluminum bezel with three equally spaced RTV pads around the periphery of the lens. The mount does induce a significant amount of stress in the doublet. Our design comparison centers on selecting appropriate glass types to meet the specified cross-talk requirements for a given mount design. Additional design trades could be performed to evaluate various mounting concepts. The mechanical stress in each of the three example doublet designs was computed using finite element analysis. The two primary material properties of the optical glasses that affect stress birefringence are the coefficient of thermal expansion (CTE) and the stress-optical coefficient. A comparison of the properties for the three doublets is listed in Table 1. Doublet A has the largest CTE mismatch (1.9 ppm/°C). Doublet B has a CTE mismatch of 0.8 ppm/°C, and Doublet C has a mismatch of 0.3 ppm/°C. The effect of the stress field on the indices of refraction is controlled by the value of the stress-optical coefficient. The largest average value belongs to Doublet B (2.97 mm2/N), with Doublet A at 2.69 mm2/N and Doublet C at 1.12 mm2/N. Based on these parameters, it is expected that Doublet A would produce the largest cross-talk value, Doublet B would be second largest, and Doublet C would produce the smallest effect on system performance. Views of the finite element model are shown in Figure 8. The maximum and minimum principal stress distributions for the three doublet designs are shown in a cross-section view in Figure 9. The left-hand view for each doublet design shows the maximum principal stress distribution. The right-hand view for each doublet design shows the minimum principal stress distribution. This figure includes a listing of the maximum and minimum stress values over the clear aperture. Due to the nature of the stress distribution over the aperture, each wavelength channel experiences a different stress field in traversing the doublet. This results in cross-talk that varies as a function of wavelength. Birefringence and crystal axis orientation maps are computed from the finite element derived stress fields for the front and rear lens elements of each doublet using the software program SigFit. The magnitude of birefringence and orientation values are derived from the system level Jones matrix, which represents the integrated polarizing effects of the stress field through the thickness of the optical element. These birefringence and orientation maps are applied as interferogram files to the optical model. The birefringence distributions (units in nm/cm) over the full aperture of the three doublets for both the front and rear elements are shown in Figure 10. Included is the peak-to-valley birefringence value at 70 ºC. Cross-talk due to thermo-elastic induced stress in the three doublet designs was evaluated as a function of temperature. A linear polarizer was placed at the image plane and stress birefringence interferogram files were assigned to each of the doublets. Linearly polarized light was then passed through the optical model and the cross-talk due to the mechanical stress in the doublets was computed as the loss in transmission. Plots of cross-
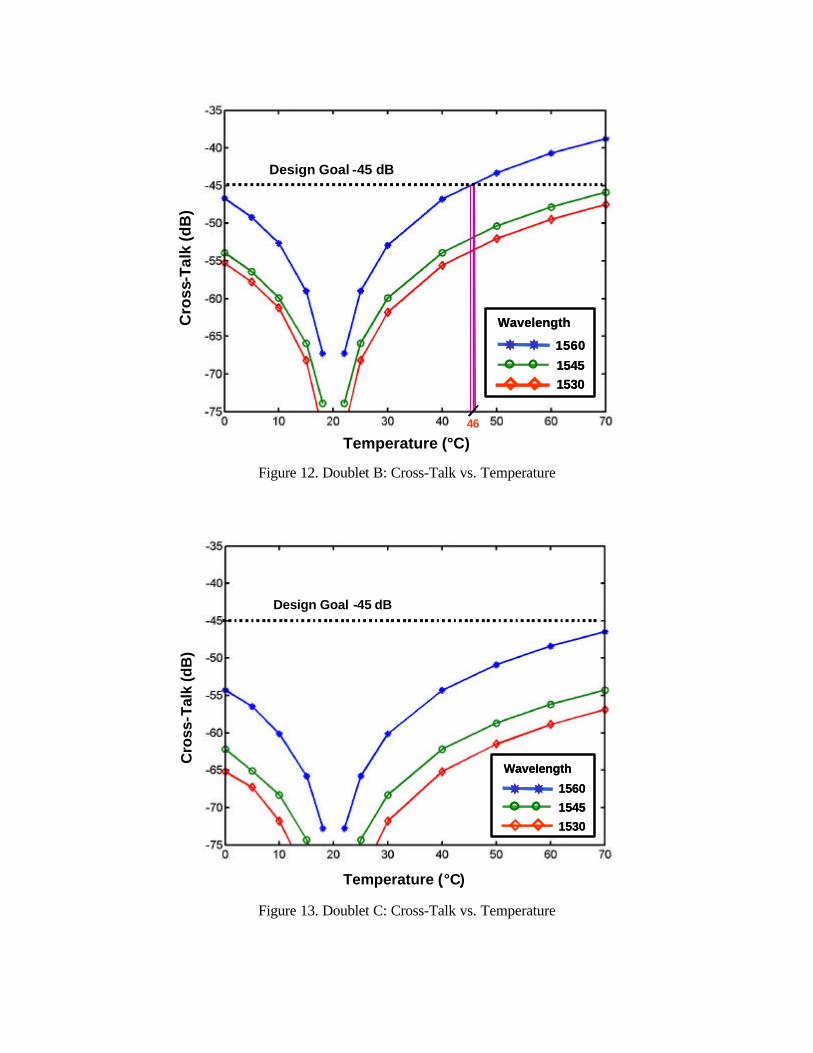
talk versus temperature for the center and two extreme wavelengths are shown for each of the three doublets in Figures 11-13. For Doublet A, the cross-talk design goals are met over a temperature range from 5 to 37 ºC. For Doublet B, the effects of the stress field are reduced, allowing the cross-talk goals to be met from 0 to 46 ºC. Cross-talk goals are met over the full operational temperature range for Doublet C.
7. SUMMARY For polarization sensitive optical systems, accounting for the effects of mechanical stress may be critical for a successful design. Commercial software tools exist to evaluate the effects of mechanical stress within the optical model. These allow design trades to be examined among glass types and mounting methods. The optical design software program CODE V® represents the integrated effects of mechanical stress as interferogram files. The optomechanical analysis program SigFit creates stress birefringence interferogram files using optical element stress data computed via finite element analysis. The above design tools are applicable to many types of optical systems, including systems used for optical lithography, LCD projectors, and telecommunications components. Cross-talk evaluations are presented for a wavelength selective switch as a function of temperature using these modeling techniques.
REFERENCES 1CODE V® is a product of Optical Research Associates, Pasadena, CA 2Doyle, K. B., Genberg, V. L., Michels, G. J., "Software Tools for Modeling Stress Birefringence", SPIE Vol. 414, Seattle, 2002.
3SigFit is a product of Sigmadyne, Inc., Rochester, NY. 4Ranalli, E. R. and Scott, B. A., “Wavelength Selective Switch,” U.S. Patent No. 6,285,500 B1, September 4, 2001.
TABLES Doublet Parameters Design A Design B Design C Glass, Element E1 N-BaK1 N-BaK4 N-BaF51 Glass, Element E2 N-SF4 N-F2 SFL57 Radius of Curvature, Surface 1 (mm) 83.673 83.138 81.678 Radius of Curvature, Surface 2 (mm) -38.314 -28.037 -45.473 Radius of Curvature, Surface 3 (mm) -88.835 -109.658 -123.055 Thickness, E1 (mm) 7.5 8 7.5 Thickness, E2 (mm) 4.0 4 4.0 Lens Diameter (mm) 28 28 28 CTE (ppm, E1/E2) 7.6/9.5 7.0/7.8 8.4/8.7 Stress Optic Coefficient (E1/E2) (mm2/N) 2.62/2.76 2.90/3.03 2.22/0.02
Table 1. Doublet parameters for three focusing and collimating lens designs

FIGURES
R=12’ R=10” R=8” R=6” R=5”
Figure 1. Retardance vs. Lens Shape: Curvature Variation
t=0.25” t=0.38” t=0.5” t=0.75” t=1.0”
Figure 2. Retardance versus Lens Shape: Thickness Variation

Nominal Configuration Stressed Configuration
Figure 3. LCD projector light traversing unstressed and stressed cube
Figure 4. Wavelength Selective Switch
InputFiber 1Data
InputFiber 2Data
...
FocusingLens
λ1λ2λ3λ4
λ80
LCD
λ1λ2λ3λ4
λ80
...
GratingGrating
CollimatingLens
OutputFiber 1Data
OutputFiber 2Data
Figure 5. Focusing, Collimating Lenses, and Gratings
80 Channels
Input Fiber 2
Input Fiber 1 BirefringentOptical System
λ1,λ2,λ3 … λ80
λ/2 RetarderPBS & PBC
BirefringentOptical System
Output Fiber 2
Output Fiber 1
λ/2 RetarderPBS & PBC
80 Channels
Input Fiber 2
Input Fiber 1 BirefringentOptical SystemBirefringentOptical System
λ1,λ2,λ3 … λ80
λ/2 RetarderPBS & PBC
BirefringentOptical SystemBirefringentOptical System
Output Fiber 2
Output Fiber 1
λ/2 RetarderPBS & PBC
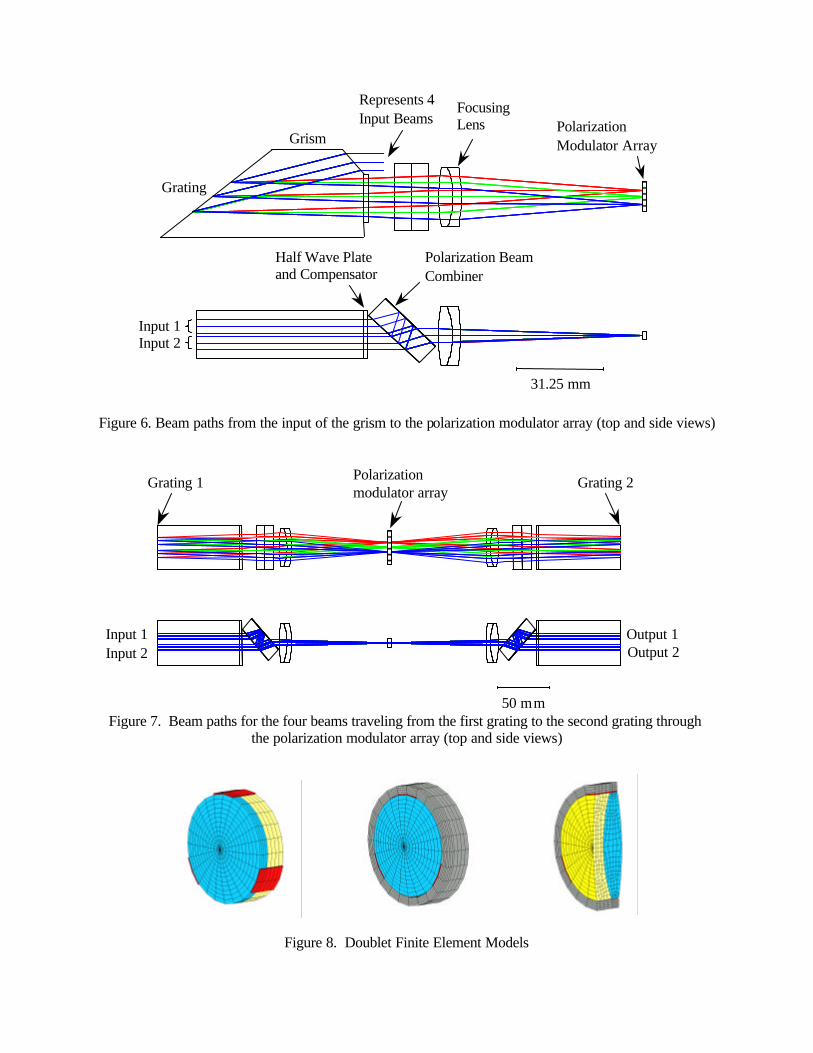
Figure 6. Beam paths from the input of the grism to the polarization modulator array (top and side views)
Figure 7. Beam paths for the four beams traveling from the first grating to the second grating through the polarization modulator array (top and side views)
Figure 8. Doublet Finite Element Models
Represents 4 Input Beams
31.25 mm
Polarization Modulator Array
Focusing Lens
Grating
Half Wave Plate and Compensator
Grism
Input 1
Polarization Beam Combiner
Input 2
50 mm
Polarization modulator array
Input 1 Input 2
Output 1 Output 2
Grating 1 Grating 2
Temperature (°C)
Cro
ss-T
alk
(dB
)
Design Goal -45 dB
5 37
1560
1545
1530
Wavelength
Temperature (°C)
Cro
ss-T
alk
(dB
)
Design Goal -45 dB
5 37
1560
1545
1530
Wavelength
1560
1545
1530
Wavelength
Doublet A
Max Stress & Min Stress (423 psi & -564 psi)
Doublet B
Max Stress & Min Stress (193 psi & -473 psi )
Doublet C
Max Stress & Min Stress (107 psi & -452 psi)
Figure 9. Maximum and minimum principal stress distributions
Rear ElementFront Element
Doublet AP-V = 15.2
Doublet CP-V = 4.9
Doublet BP-V = 11.7
Doublet AP-V = 23.4
Doublet CP-V = 4.67
Doublet BP-V = 12.2
Figure 10. Birefringence Maps for the three doublet designs (magnitude in nm/cm)
Figure 11. Doublet A: Cross-Talk vs. Temperature
Temperature (°C)
Cro
ss-T
alk
(dB
)Design Goal -45 dB
46
1560
15451530
Wavelength
Temperature (°C)
Cro
ss-T
alk
(dB
)Design Goal -45 dB
46
1560
15451530
Wavelength
1560
15451530
Wavelength
Design Goal -45 dB
Cro
ss-T
alk
(dB
)
Temperature (°C)
1560
1545
1530
Wavelength
Design Goal -45 dB
Cro
ss-T
alk
(dB
)
Temperature (°C)
1560
1545
1530
Wavelength
1560
1545
1530
Wavelength
Figure 12. Doublet B: Cross-Talk vs. Temperature
Figure 13. Doublet C: Cross-Talk vs. Temperature