Embed Size (px)
Citation preview
University of Groningen
In-situ birefringence microscopy of uniaxially stretched metal-polymer laminatevan Tijum, R.; de Jong, B. V. C.; Vellinga, W. P.; De Hosson, J. Th. M.
Published in:Surface & Coatings Technology
DOI:10.1016/j.surfcoat.2006.10.002
IMPORTANT NOTE: You are advised to consult the publisher's version (publisher's PDF) if you wish to cite fromit. Please check the document version below.
Document VersionPublisher's PDF, also known as Version of record
Publication date:2007
Link to publication in University of Groningen/UMCG research database
Citation for published version (APA):van Tijum, R., de Jong, B. V. C., Vellinga, W. P., & De Hosson, J. T. M. (2007). In-situ birefringencemicroscopy of uniaxially stretched metal-polymer laminate. Surface & Coatings Technology, 201(8), 4633-4639. https://doi.org/10.1016/j.surfcoat.2006.10.002
CopyrightOther than for strictly personal use, it is not permitted to download or to forward/distribute the text or part of it without the consent of theauthor(s) and/or copyright holder(s), unless the work is under an open content license (like Creative Commons).
The publication may also be distributed here under the terms of Article 25fa of the Dutch Copyright Act, indicated by the “Taverne” license.More information can be found on the University of Groningen website: https://www.rug.nl/library/open-access/self-archiving-pure/taverne-amendment.
Take-down policyIf you believe that this document breaches copyright please contact us providing details, and we will remove access to the work immediatelyand investigate your claim.
Downloaded from the University of Groningen/UMCG research database (Pure): http://www.rug.nl/research/portal. For technical reasons thenumber of authors shown on this cover page is limited to 10 maximum.
Download date: 21-02-2022
201 (2007) 4633–4639www.elsevier.com/locate/surfcoat
Surface & Coatings Technology
In-situ birefringence microscopy of uniaxially stretchedmetal–polymer laminate
R. van Tijum, B.V.C. de Jong, W.P. Vellinga, J.Th.M. De Hosson ⁎
Department of Applied Physics, Materials Science Centre and the Netherlands Institute for Metals Research,University of Groningen, Nijenborgh 4, 9747 AG Groningen, The Netherlands
Received 28 July 2006; accepted in revised form 2 October 2006Available online 27 November 2006
Abstract
This paper concentrates on revealing the local deformation as a function of applied strain in a polymer coating supported by a plasticallydeforming and roughening metal substrate. To this end in-situ birefringence microscopy measurements have been executed. The measurements areperformed in reflection and an alternative unwrapping scheme for the optical path difference is proposed. From the characterization of PET(polyethylene terephthalate) coated stainless steel it is concluded that strain localization appears below the macroscopic strain at yield and that thesurface roughness of the substrate is the driving force of the localization.© 2006 Elsevier B.V. All rights reserved.
Keywords: Metal–polymer coating; In-situ birefiringence microscopy; Shear bands; Interface roughness
1. Introduction
Polymer-coated steels are commonly used in the packagingindustry to protect the content of the can from the steel and viceversa. During the forming process, the coating should remainfunctionally in tact, i.e. it should fully adhere to the steel. Animportant issue during deformation of polymer-coated steels isthe induced roughening of the steel substrate [1,2]. Effects ofroughening on the adhesion at the interface between an amor-phous polymer and steel were studied in Refs. [3–5]. Usingpolarization microscopy it was shown qualitatively thatmicroscopic phenomena of deformation at a certain globalstrain of the thin layer of amorphous polymer differ consider-ably from what is expected in the bulk [5]. As soon as the steelsubstrate deforms plastically, stress concentrations occur in theamorphous polymer layer near the interface that lead to loca-lized shear bands. These shear bands already occur at strainsbelow the yield strain of the bulk PET (polyethylene tereph-thalate). This behavior near the interface continues at higherstresses. Above the yield strain of PET, the deformation of thefilm is highly inhomogeneous with patterns of shear bands at 45
⁎ Corresponding author.E-mail address: [email protected] (J.Th.M. De Hosson).
0257-8972/$ - see front matter © 2006 Elsevier B.V. All rights reserved.doi:10.1016/j.surfcoat.2006.10.002
degrees with respect to the loading direction. Localized neckingperpendicular to the tensile direction occurs only for very thicksamples [6,7].
Calculations performed in Ref. [5] show the evolution of thedeformation in the layer, which is in qualitative agreement withexperiments. Moreover, in these calculations it appears thatalthough the energy release rate G decreases monotonically as afunction of strain, the stresses acting at the interface drop if theglobal strain surpasses the yield strain of the amorphous poly-mer. It is expected that the stresses acting at the interface affectthe rate at which various thermally activated degradationmechanisms (delamination, corrosion) occur [8]. Potentially adecrease in stress level near an interface (even though it occursat a higher deformation) might be favorable in terms of thelifetime of the interface. Therefore, it is relevant to measure thestresses acting in the polymer layer as a function of globalstrain. Recent theoretical advances have shown that full-fieldmicroscopic measurements of the birefringence can be executedafter relatively small modifications to existing optical (trans-mission) microscopes are made [9,10]. Since the birefringenceis related to the state of strain in the layer, such measurementstherefore offer in principle the possibility to relate strains andstresses in the deformed polymer layer to the adhesion ordelamination behavior.
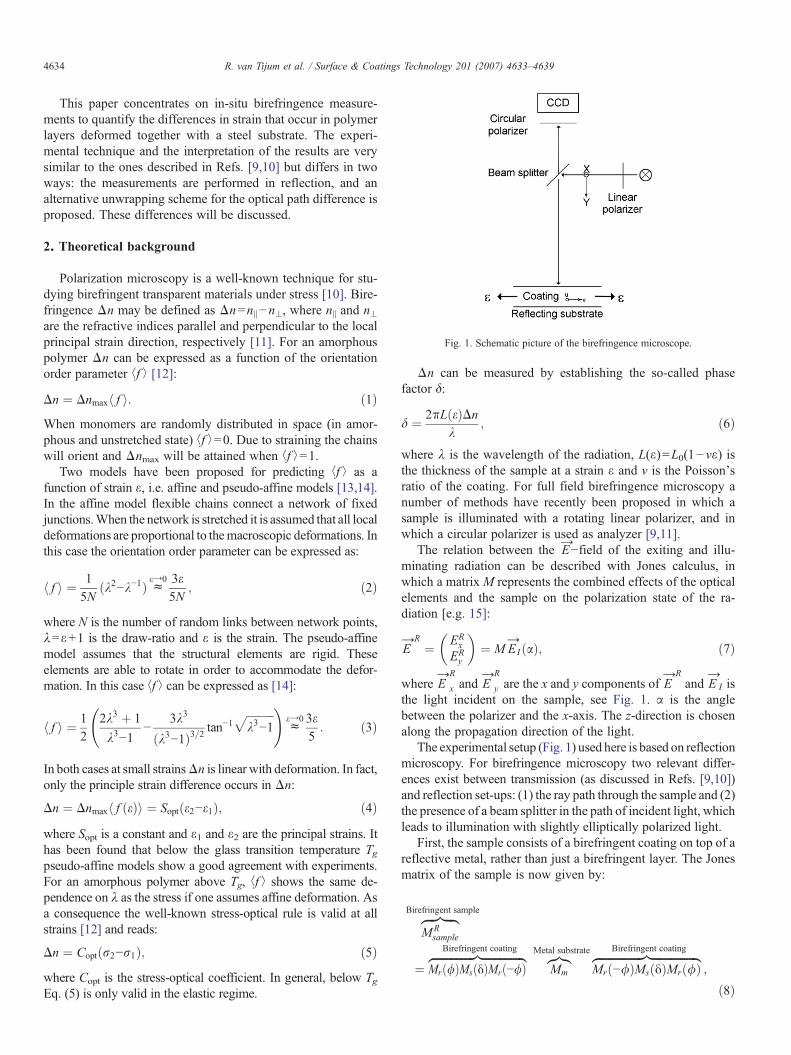
Fig. 1. Schematic picture of the birefringence microscope.
4634 R. van Tijum et al. / Surface & Coatings Technology 201 (2007) 4633–4639
This paper concentrates on in-situ birefringence measure-ments to quantify the differences in strain that occur in polymerlayers deformed together with a steel substrate. The experi-mental technique and the interpretation of the results are verysimilar to the ones described in Refs. [9,10] but differs in twoways: the measurements are performed in reflection, and analternative unwrapping scheme for the optical path difference isproposed. These differences will be discussed.
2. Theoretical background
Polarization microscopy is a well-known technique for stu-dying birefringent transparent materials under stress [10]. Bire-fringence Δn may be defined as Δn=n||−n⊥, where n|| and n⊥are the refractive indices parallel and perpendicular to the localprincipal strain direction, respectively [11]. For an amorphouspolymer Δn can be expressed as a function of the orientationorder parameter ⟨f ⟩ [12]:
Dn ¼ Dnmaxh f i: ð1ÞWhen monomers are randomly distributed in space (in amor-phous and unstretched state) ⟨f ⟩=0. Due to straining the chainswill orient and Δnmax will be attained when ⟨f ⟩=1.
Two models have been proposed for predicting ⟨f ⟩ as afunction of strain ε, i.e. affine and pseudo-affine models [13,14].In the affine model flexible chains connect a network of fixedjunctions.When the network is stretched it is assumed that all localdeformations are proportional to themacroscopic deformations. Inthis case the orientation order parameter can be expressed as:
h f i ¼ 15N
ðk2−k−1Þ ceY0 3e5N
; ð2Þ
where N is the number of random links between network points,λ=ε+1 is the draw-ratio and ε is the strain. The pseudo-affinemodel assumes that the structural elements are rigid. Theseelements are able to rotate in order to accommodate the defor-mation. In this case ⟨f ⟩ can be expressed as [14]:
h f i ¼ 12
2k3 þ 1
k3−1−
3k3
ðk3−1Þ3=2tan−1
ffiffiffiffiffiffiffiffiffiffik3−1
p !ceY0 3e
5: ð3Þ
In both cases at small strainsΔn is linear with deformation. In fact,only the principle strain difference occurs in Δn:
Dn ¼ Dnmaxh f ðeÞi ¼ Soptðe2−e1Þ; ð4Þwhere Sopt is a constant and ε1 and ε2 are the principal strains. Ithas been found that below the glass transition temperature Tgpseudo-affine models show a good agreement with experiments.For an amorphous polymer above Tg, ⟨f ⟩ shows the same de-pendence on λ as the stress if one assumes affine deformation. Asa consequence the well-known stress-optical rule is valid at allstrains [12] and reads:
Dn ¼ Coptðr2−r1Þ; ð5Þwhere Copt is the stress-optical coefficient. In general, below TgEq. (5) is only valid in the elastic regime.
Δn can be measured by establishing the so-called phasefactor δ:
d ¼ 2kLðeÞDnk
; ð6Þ
where λ is the wavelength of the radiation, L(ε)=L0(1−vε) isthe thickness of the sample at a strain ε and v is the Poisson'sratio of the coating. For full field birefringence microscopy anumber of methods have recently been proposed in which asample is illuminated with a rotating linear polarizer, and inwhich a circular polarizer is used as analyzer [9,11].
The relation between the YE−field of the exiting and illu-minating radiation can be described with Jones calculus, inwhich a matrix M represents the combined effects of the opticalelements and the sample on the polarization state of the ra-diation [e.g. 15]:
YE
R¼ ER
xERy
� �¼ M
YEI ðaÞ; ð7Þ
whereYE
R
x andYE
R
y are the x and y components ofYE
Rand
YE I is
the light incident on the sample, see Fig. 1. α is the anglebetween the polarizer and the x-axis. The z-direction is chosenalong the propagation direction of the light.
The experimental setup (Fig. 1) used here is based on reflectionmicroscopy. For birefringence microscopy two relevant differ-ences exist between transmission (as discussed in Refs. [9,10])and reflection set-ups: (1) the ray path through the sample and (2)the presence of a beam splitter in the path of incident light, whichleads to illumination with slightly elliptically polarized light.
First, the sample consists of a birefringent coating on top of areflective metal, rather than just a birefringent layer. The Jonesmatrix of the sample is now given by:
MRsample
zfflfflffl}|fflfflffl{Birefringent sample
¼ Mrð/ÞMsðδÞMrð−/Þzfflfflfflfflfflfflfflfflfflfflfflfflfflfflfflffl}|fflfflfflfflfflfflfflfflfflfflfflfflfflfflfflffl{Birefringent coating
Mm
z}|{Metal substrate
Mrð−/ÞMsðδÞMrð/Þzfflfflfflfflfflfflfflfflfflfflfflfflfflfflfflffl}|fflfflfflfflfflfflfflfflfflfflfflfflfflfflfflffl{Birefringent coating
;
ð8Þ
4635R. van Tijum et al. / Surface & Coatings Technology 201 (2007) 4633–4639
TakingMm to represent a perfect mirror Eq. (8) can be rewrittenas:
MRsample ¼ MmMrð−/ÞMsð2dÞMrð/Þ: ð9Þ
For the intensity IR(α) one finds:
IR ¼ ERx E
R⁎x þ ER
y ER⁎y ¼ II
2ð1−jsin2djsin2ðaþ /ÞÞ; ð10Þ
with II the intensity of the illumination reaching the sample.This is essentially equal to the expression shown in [9,10], themain difference being that 2δ appears because the light travelsthrough the specimen twice.
Secondly, the beam splitter reflects light to the sample andtransmits it to the CCD camera after interaction with the sample.The effect of the beam splitter on the polarization state and onthe resulting intensity can be taken into account by modeling thereflection at the beam splitter as that from an aluminum mirrorwith surface normal at 45° with the propagation direction of thelight, and neglecting transmission since the propagation direc-tion of the rays is unaltered.
For the Jones matrix Mbs of the beam splitter one finds usingFresnel's formulae for reflection
Mbs ¼ Rx 00 Ry
� �¼
n22ffiffiffiffiffiffiffiffiffiffiffiffiffi2n22−1
p−1
n22ffiffiffiffiffiffiffiffiffiffiffiffiffi2n22−1
pþ 1
0
01−
ffiffiffiffiffiffiffiffiffiffiffiffiffi2n22−1
p1þ
ffiffiffiffiffiffiffiffiffiffiffiffiffi2n22−1
p
0BBB@
1CCCA
i1 00 −0:91−0:23i
� �;
ð11Þ
where Rx and Ry are the reflection coefficients (see Fig. 1), n2 isthe refractive index of Al, and where the refractive index of airhas been taken equal to 1. Numerical values are given assumingλ=589.3 nm and n2=1.44+5.23i [16]. Combining Eqs. (7), (8)and (8) results in:
YE s ¼ McpMmMrð−/ÞMsð2dÞMrð/ÞYE I ; ð12Þ
where the incident radiation on the sample is now formulated as:
YE I ¼ Mbs
E0cosaE0sina
� �¼ RxE0cosa
RyE0sina
� �: ð13Þ
Here, E0 is the amplitude of the illumination. Due to the ima-ginary reflection coefficients of the beam splitter the incidentlight becomes slightly elliptically polarized and the intensity ofthe light incident on the sample becomes a function of α:
IðYEI Þ ¼ RxR⁎xE
20cos
2aþ RyR⁎yE
20sin
2a
¼ 0:875E0sin2aþ 1:013E0cos
2a: ð14Þ
The effect of varying illumination intensity and slight el-lipticity on the determination of δ and ϕ was studied in thefollowing way. A numerical experiment was performed in whichthe reflected intensity Is(α) for several test-samples (each with
unique values of δ and ϕ) was calculated, as well as the intensityIr(α), the reflected intensity of a reference sample (a perfectmirror of the substrate material). Subsequently the hypothesiswas tested that the slight ellipticity does not significantlyinterfere with the determination of δ and ϕ and that the intensityIN(α) resulting from a simple normalization of Is(α) by Ir(α):
IN ðaÞ ¼ IsðaÞIrðaÞ ; ð15Þ
can serve as a base to determine δ and ϕ. Using a series ofsimulated Is(α) and Ir(α), I0, δ and ϕ were determined (using theprocedure outlined in [9]) and compared to input values of thesimulation. It was found that this procedure leads to a maximumerror in δ of about 3% and of about 5% in ϕ. In view of otherexperimental uncertainties, these uncertainties are acceptable. Inpractice therefore an experimental reference series Ir(α) wasmeasured with a mirror-like sample of the substrate material inaddition to the series Is(α) of the deformed layer that weredetermined for a number of strain levels. At each strain, thenormalized intensity IN(α) was used to determine I0, δ and ϕ.
3. Experimental
The samples are coated with amorphous PET. The coatingswere obtained by spin coating solutions of 2wt.% and 4wt.%PETin chloroform onpolished dog-bone shaped specimens at 250 rpm,resulting in coating thicknesses of L0=4 μm and L0=8 μm re-spectively. After spin coating any excess of chloroform wasremoved by placing the specimen in a hot-air oven at 60 °C for 2 h.Prior to the measurements, the thickness was determined with aprofilometer after locally removing the coating using a laser [17].
The measurements were performed with an in-situ uniaxialtensile stage at a constant speed of 5 μm/s. At predefined strains,the stage was halted and an image series Is(αi, u, v) was measuredwith αi=0, 15,…, 345° and (u,v) the pixel location. The u directionis defined as the global tensile direction and is expressed as thehorizontal axis in each of the following images. Prior to themeasurements, a reference image series Ir(αi,u,v) (see above) wasobtained from an uncoated polished metal substrate.
The metal used was a stainless steel (19.5Cr1.8Mn8.8NiFe,determined by energy dispersive X-ray spectrometry) with anaverage grain size (determined by Electron Back Scatter Dif-fraction (EBSD)) of d=11.7 μm.
Images of 1376×1032 pixels were taken with a 24-bit CCDcamera. All Is(αi,u,v) are normalized using the reference seriesIr(αi, u, v). The actual determination of |sin2δ(u,v)|, ϕ(u,v) andI0(u,v) from Eq. (10) was performed along the lines set out inRef. [9]. The conversion from |sin2δ(u,v)| to Δn(u,v) was per-formed with Eq. (6).
The green channel of the CCD was used (λ=510 nm).Typical images are shown in Fig. 2.
4. Results and discussion
As mentioned in Section 1 our interest lies with the evolutionof localized strains in the deformed PET layer. The results and
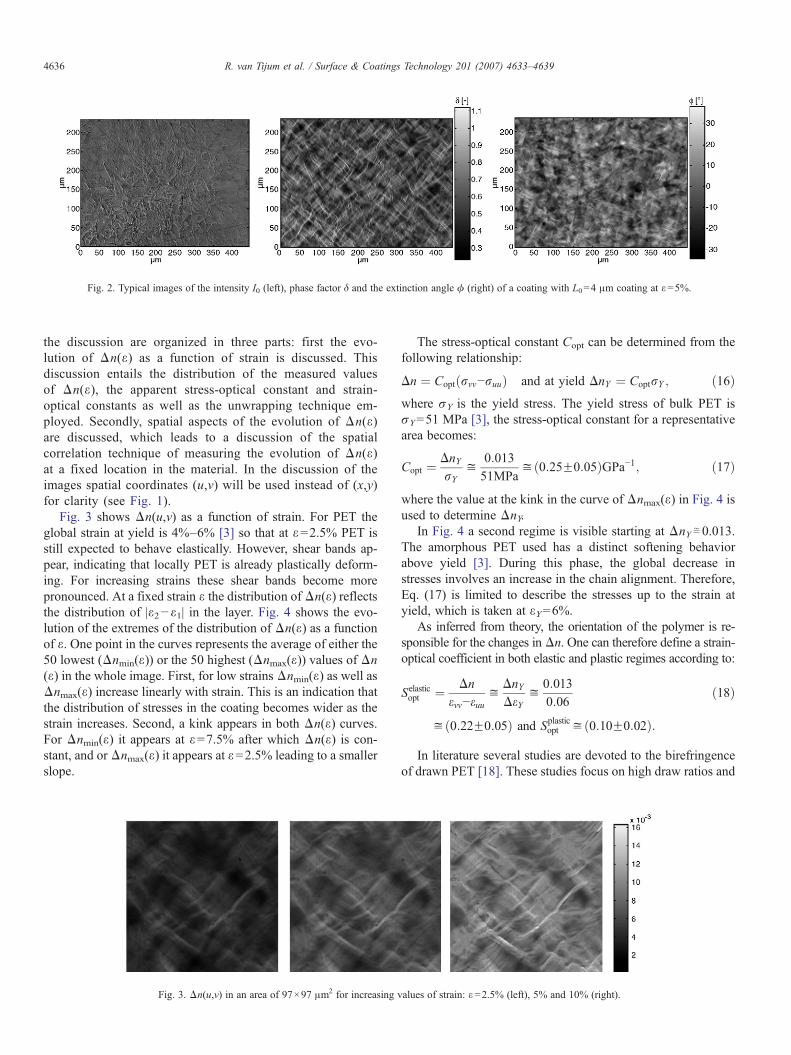
Fig. 2. Typical images of the intensity I0 (left), phase factor δ and the extinction angle ϕ (right) of a coating with L0=4 μm coating at ε=5%.
4636 R. van Tijum et al. / Surface & Coatings Technology 201 (2007) 4633–4639
the discussion are organized in three parts: first the evo-lution of Δn(ε) as a function of strain is discussed. Thisdiscussion entails the distribution of the measured valuesof Δn(ε), the apparent stress-optical constant and strain-optical constants as well as the unwrapping technique em-ployed. Secondly, spatial aspects of the evolution of Δn(ε)are discussed, which leads to a discussion of the spatialcorrelation technique of measuring the evolution of Δn(ε)at a fixed location in the material. In the discussion of theimages spatial coordinates (u,v) will be used instead of (x,y)for clarity (see Fig. 1).
Fig. 3 shows Δn(u,v) as a function of strain. For PET theglobal strain at yield is 4%–6% [3] so that at ε=2.5% PET isstill expected to behave elastically. However, shear bands ap-pear, indicating that locally PET is already plastically deform-ing. For increasing strains these shear bands become morepronounced. At a fixed strain ε the distribution ofΔn(ε) reflectsthe distribution of |ε2−ε1| in the layer. Fig. 4 shows the evo-lution of the extremes of the distribution of Δn(ε) as a functionof ε. One point in the curves represents the average of either the50 lowest (Δnmin(ε)) or the 50 highest (Δnmax(ε)) values of Δn(ε) in the whole image. First, for low strains Δnmin(ε) as well asΔnmax(ε) increase linearly with strain. This is an indication thatthe distribution of stresses in the coating becomes wider as thestrain increases. Second, a kink appears in both Δn(ε) curves.For Δnmin(ε) it appears at ε=7.5% after which Δn(ε) is con-stant, and orΔnmax(ε) it appears at ε=2.5% leading to a smallerslope.
Fig. 3. Δn(u,v) in an area of 97×97 μm2 for increasing v
The stress-optical constant Copt can be determined from thefollowing relationship:
Dn ¼ Coptðrvv−ruuÞ and at yield DnY ¼ CoptrY ; ð16Þwhere σY is the yield stress. The yield stress of bulk PET isσY=51 MPa [3], the stress-optical constant for a representativearea becomes:
Copt ¼ DnYrY
i0:01351MPa
ið0:25F0:05ÞGPa−1; ð17Þ
where the value at the kink in the curve of Δnmax(ε) in Fig. 4 isused to determine ΔnY.
In Fig. 4 a second regime is visible starting at ΔnY≅0.013.The amorphous PET used has a distinct softening behaviorabove yield [3]. During this phase, the global decrease instresses involves an increase in the chain alignment. Therefore,Eq. (17) is limited to describe the stresses up to the strain atyield, which is taken at εY=6%.
As inferred from theory, the orientation of the polymer is re-sponsible for the changes inΔn. One can therefore define a strain-optical coefficient in both elastic and plastic regimes according to:
Selasticopt ¼ Dnevv−euu
iDnYDeY
i0:0130:06
ið0:22F0:05Þ and Splasticopt ið0:10F0:02Þ:
ð18Þ
In literature several studies are devoted to the birefringenceof drawn PET [18]. These studies focus on high draw ratios and
alues of strain: ε=2.5% (left), 5% and 10% (right).
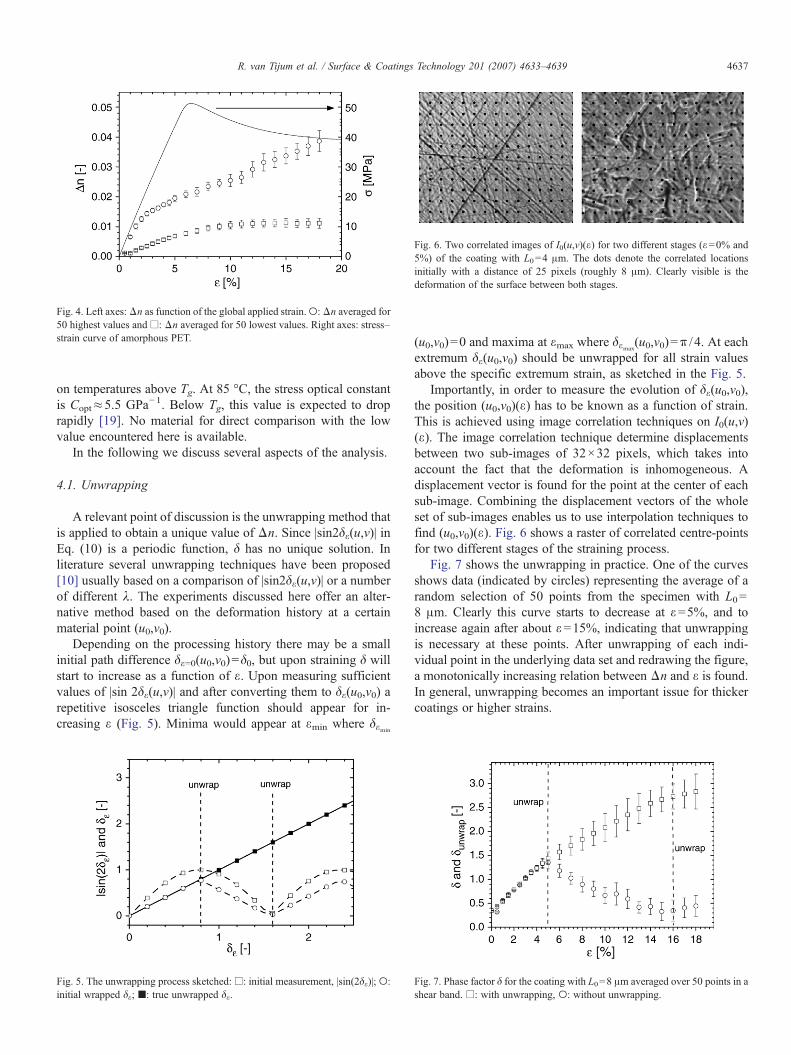
Fig. 4. Left axes:Δn as function of the global applied strain.○:Δn averaged for50 highest values and□: Δn averaged for 50 lowest values. Right axes: stress–strain curve of amorphous PET.
Fig. 6. Two correlated images of I0(u,v)(ε) for two different stages (ε=0% and5%) of the coating with L0=4 μm. The dots denote the correlated locationsinitially with a distance of 25 pixels (roughly 8 μm). Clearly visible is thedeformation of the surface between both stages.
4637R. van Tijum et al. / Surface & Coatings Technology 201 (2007) 4633–4639
on temperatures above Tg. At 85 °C, the stress optical constantis Copt≈5.5 GPa−1. Below Tg, this value is expected to droprapidly [19]. No material for direct comparison with the lowvalue encountered here is available.
In the following we discuss several aspects of the analysis.
4.1. Unwrapping
A relevant point of discussion is the unwrapping method thatis applied to obtain a unique value of Δn. Since |sin2δε(u,v)| inEq. (10) is a periodic function, δ has no unique solution. Inliterature several unwrapping techniques have been proposed[10] usually based on a comparison of |sin2δε(u,v)| or a numberof different λ. The experiments discussed here offer an alter-native method based on the deformation history at a certainmaterial point (u0,v0).
Depending on the processing history there may be a smallinitial path difference δε=0(u0,v0)=δ0, but upon straining δ willstart to increase as a function of ε. Upon measuring sufficientvalues of |sin 2δε(u,v)| and after converting them to δε(u0,v0) arepetitive isosceles triangle function should appear for in-creasing ε (Fig. 5). Minima would appear at εmin where δεmin
Fig. 5. The unwrapping process sketched:□: initial measurement, |sin(2δε)|; ○:initial wrapped δε; ■: true unwrapped δε.
(u0,v0)=0 and maxima at εmax where δεmax(u0,v0)=π / 4. At each
extremum δε(u0,v0) should be unwrapped for all strain valuesabove the specific extremum strain, as sketched in the Fig. 5.
Importantly, in order to measure the evolution of δε(u0,v0),the position (u0,v0)(ε) has to be known as a function of strain.This is achieved using image correlation techniques on I0(u,v)(ε). The image correlation technique determine displacementsbetween two sub-images of 32×32 pixels, which takes intoaccount the fact that the deformation is inhomogeneous. Adisplacement vector is found for the point at the center of eachsub-image. Combining the displacement vectors of the wholeset of sub-images enables us to use interpolation techniques tofind (u0,v0)(ε). Fig. 6 shows a raster of correlated centre-pointsfor two different stages of the straining process.
Fig. 7 shows the unwrapping in practice. One of the curvesshows data (indicated by circles) representing the average of arandom selection of 50 points from the specimen with L0=8 μm. Clearly this curve starts to decrease at ε=5%, and toincrease again after about ε=15%, indicating that unwrappingis necessary at these points. After unwrapping of each indi-vidual point in the underlying data set and redrawing the figure,a monotonically increasing relation between Δn and ε is found.In general, unwrapping becomes an important issue for thickercoatings or higher strains.
Fig. 7. Phase factor δ for the coating with L0=8 μm averaged over 50 points in ashear band. □: with unwrapping, ○: without unwrapping.
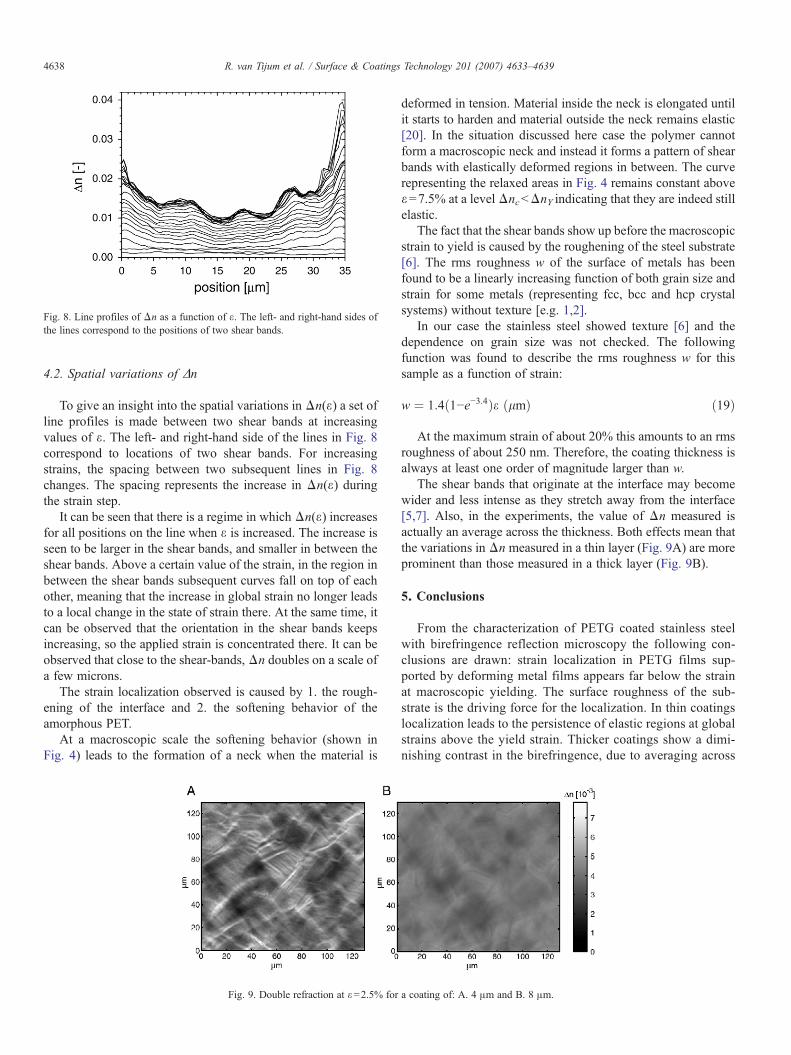
Fig. 8. Line profiles of Δn as a function of ε. The left- and right-hand sides ofthe lines correspond to the positions of two shear bands.
4638 R. van Tijum et al. / Surface & Coatings Technology 201 (2007) 4633–4639
4.2. Spatial variations of Δn
To give an insight into the spatial variations in Δn(ε) a set ofline profiles is made between two shear bands at increasingvalues of ε. The left- and right-hand side of the lines in Fig. 8correspond to locations of two shear bands. For increasingstrains, the spacing between two subsequent lines in Fig. 8changes. The spacing represents the increase in Δn(ε) duringthe strain step.
It can be seen that there is a regime in which Δn(ε) increasesfor all positions on the line when ε is increased. The increase isseen to be larger in the shear bands, and smaller in between theshear bands. Above a certain value of the strain, in the region inbetween the shear bands subsequent curves fall on top of eachother, meaning that the increase in global strain no longer leadsto a local change in the state of strain there. At the same time, itcan be observed that the orientation in the shear bands keepsincreasing, so the applied strain is concentrated there. It can beobserved that close to the shear-bands, Δn doubles on a scale ofa few microns.
The strain localization observed is caused by 1. the rough-ening of the interface and 2. the softening behavior of theamorphous PET.
At a macroscopic scale the softening behavior (shown inFig. 4) leads to the formation of a neck when the material is
Fig. 9. Double refraction at ε=2.5% for
deformed in tension. Material inside the neck is elongated untilit starts to harden and material outside the neck remains elastic[20]. In the situation discussed here case the polymer cannotform a macroscopic neck and instead it forms a pattern of shearbands with elastically deformed regions in between. The curverepresenting the relaxed areas in Fig. 4 remains constant aboveε=7.5% at a level ΔncbΔnY indicating that they are indeed stillelastic.
The fact that the shear bands show up before the macroscopicstrain to yield is caused by the roughening of the steel substrate[6]. The rms roughness w of the surface of metals has beenfound to be a linearly increasing function of both grain size andstrain for some metals (representing fcc, bcc and hcp crystalsystems) without texture [e.g. 1,2].
In our case the stainless steel showed texture [6] and thedependence on grain size was not checked. The followingfunction was found to describe the rms roughness w for thissample as a function of strain:
w ¼ 1:4ð1−e−3:4Þe ðlmÞ ð19Þ
At the maximum strain of about 20% this amounts to an rmsroughness of about 250 nm. Therefore, the coating thickness isalways at least one order of magnitude larger than w.
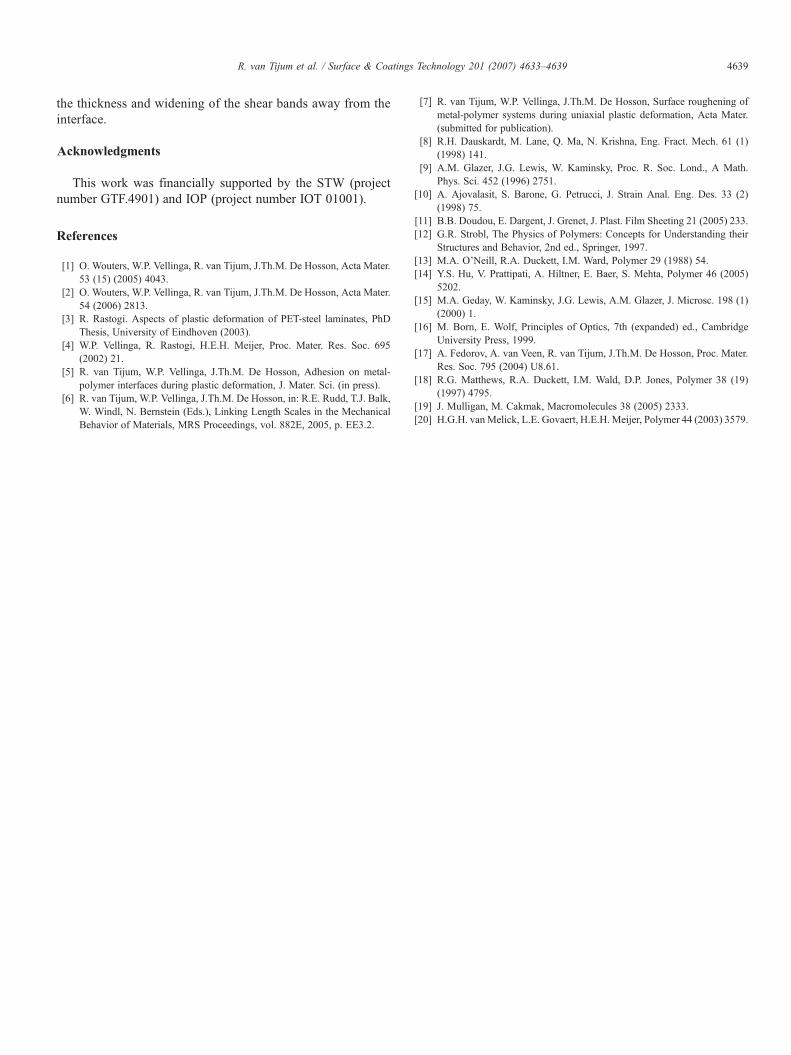
The shear bands that originate at the interface may becomewider and less intense as they stretch away from the interface[5,7]. Also, in the experiments, the value of Δn measured isactually an average across the thickness. Both effects mean thatthe variations in Δn measured in a thin layer (Fig. 9A) are moreprominent than those measured in a thick layer (Fig. 9B).
5. Conclusions
From the characterization of PETG coated stainless steelwith birefringence reflection microscopy the following con-clusions are drawn: strain localization in PETG films sup-ported by deforming metal films appears far below the strainat macroscopic yielding. The surface roughness of the sub-strate is the driving force for the localization. In thin coatingslocalization leads to the persistence of elastic regions at globalstrains above the yield strain. Thicker coatings show a dimi-nishing contrast in the birefringence, due to averaging across
a coating of: A. 4 μm and B. 8 μm.
4639R. van Tijum et al. / Surface & Coatings Technology 201 (2007) 4633–4639
the thickness and widening of the shear bands away from theinterface.
Acknowledgments
This work was financially supported by the STW (projectnumber GTF.4901) and IOP (project number IOT 01001).
References
[1] O. Wouters, W.P. Vellinga, R. van Tijum, J.Th.M. De Hosson, Acta Mater.53 (15) (2005) 4043.
[2] O. Wouters, W.P. Vellinga, R. van Tijum, J.Th.M. De Hosson, Acta Mater.54 (2006) 2813.
[3] R. Rastogi. Aspects of plastic deformation of PET-steel laminates, PhDThesis, University of Eindhoven (2003).
[4] W.P. Vellinga, R. Rastogi, H.E.H. Meijer, Proc. Mater. Res. Soc. 695(2002) 21.
[5] R. van Tijum, W.P. Vellinga, J.Th.M. De Hosson, Adhesion on metal-polymer interfaces during plastic deformation, J. Mater. Sci. (in press).
[6] R. van Tijum, W.P. Vellinga, J.Th.M. De Hosson, in: R.E. Rudd, T.J. Balk,W. Windl, N. Bernstein (Eds.), Linking Length Scales in the MechanicalBehavior of Materials, MRS Proceedings, vol. 882E, 2005, p. EE3.2.
[7] R. van Tijum, W.P. Vellinga, J.Th.M. De Hosson, Surface roughening ofmetal-polymer systems during uniaxial plastic deformation, Acta Mater.(submitted for publication).
[8] R.H. Dauskardt, M. Lane, Q. Ma, N. Krishna, Eng. Fract. Mech. 61 (1)(1998) 141.
[9] A.M. Glazer, J.G. Lewis, W. Kaminsky, Proc. R. Soc. Lond., A Math.Phys. Sci. 452 (1996) 2751.
[10] A. Ajovalasit, S. Barone, G. Petrucci, J. Strain Anal. Eng. Des. 33 (2)(1998) 75.
[11] B.B. Doudou, E. Dargent, J. Grenet, J. Plast. Film Sheeting 21 (2005) 233.[12] G.R. Strobl, The Physics of Polymers: Concepts for Understanding their
Structures and Behavior, 2nd ed., Springer, 1997.[13] M.A. O'Neill, R.A. Duckett, I.M. Ward, Polymer 29 (1988) 54.[14] Y.S. Hu, V. Prattipati, A. Hiltner, E. Baer, S. Mehta, Polymer 46 (2005)
5202.[15] M.A. Geday, W. Kaminsky, J.G. Lewis, A.M. Glazer, J. Microsc. 198 (1)
(2000) 1.[16] M. Born, E. Wolf, Principles of Optics, 7th (expanded) ed., Cambridge
University Press, 1999.[17] A. Fedorov, A. van Veen, R. van Tijum, J.Th.M. De Hosson, Proc. Mater.
Res. Soc. 795 (2004) U8.61.[18] R.G. Matthews, R.A. Duckett, I.M. Wald, D.P. Jones, Polymer 38 (19)
(1997) 4795.[19] J. Mulligan, M. Cakmak, Macromolecules 38 (2005) 2333.[20] H.G.H. vanMelick, L.E. Govaert, H.E.H. Meijer, Polymer 44 (2003) 3579.