Embed Size (px)
Citation preview

Stress- and Temperature-Dependent WidebandFluorescence of a Phosphor Composite for SensingApplications
W. Zhang1,2 & Z. Li1 & G.W. Baxter2 & S.F. Collins2
Received: 7 December 2015 /Accepted: 19 August 2016 /Published online: 25 August 2016# The Author(s) 2016. This article is published with open access at Springerlink.com
Abstract As both stress and temperature can alter the latticeof a solid phosphor in a similar way, the dopant rare-earth ionmay be used as a probe for either parameter using the samesensing mechanism. Here, a wideband phosphor, YAG:Ce isused as a micro stress sensor at very low magnitudes of com-pressive stress. The sensing resolution can be smaller than0.06 N/mm2 in the range of 0 ~ 1.2 N/mm2 with a sensitivityof 11 cm−1/MPa. The sensitivity is about a hundred timeslarger than the coefficient reported under hydrostatic pressure.The barycenter energy of the emission band of a phosphor canbe used to indicate stress and/or temperature change, produc-ing a precision beyond the spectroscopic resolution limit. Thesensing functions obtained from the barycenter shift are supe-rior to those from peak shifts. The stress/temperature depen-dent barycenter shift of the observed fluorescence bands ofYAG:Ce were similar in magnitude. Mechanisms involvingthe nephelauxetic effect, crystal field effect and site symmetryof dopant ions are explored as explanations of the experimen-tal phenomena.
Keywords Stress . Temperature . Sensing . Fluorescence
Introduction
It is well known that certain micro-force sensors make use ofchanges in the fluorescence emitted from specific materials tomeasure both applied pressure [1, 2] and stress [3]. The chang-es in fluorescence are often attributed to a shortened bondlength between atoms in a strengthened crystal field, resultingin a shift in the associated energy levels. For such sensingapplications, a wavelength shift at the intensity maximum ofthe emission peak(s) of a phosphor is normally used as thesensing element. However, because the scale of the shift isalways small, the fluorescence intensity needs to be strongto achieve an acceptable signal-to-noise ratio. Even so, con-sidering that it is desirable that the peak shift should be sig-nificant upon applied pressure or stress, there are not manychoices for the activematerial. Ruby (Al2O3:Cr
3+) is a popularactive material whose sharp emission peak(s) facilitatedistinguishing a slight shift of the peak. The fluorescence ofCr3+ has found wide application in hydrostatic pressure detec-tion in a diamond anvil cell [4] and in residual stress sensing[5]. However, when using the fluorescence method only highpressure or stress (over hundreds MPa) can be retrieved withrelatively high precision.
Some rare-earth doped phosphors have very high quantumefficiency, e.g. the well-known yellow phosphor, YAG:Ce.For this phosphor the parity allowed 5d-4f inter-configuration-al transitions of Ce3+ are highly sensitive to the change ofenvironmental factors because the d-electrons are in the outershell. As a consequence the phosphor is known to exhibitpressure-dependent fluorescence which may be attributed tothe change of the Ce-O bond length [6]. Therefore, the radia-tive transitions of Ce3+-doped phosphors are expected to besensitive to changes in stress and/or temperature which lead tosimilar Ce-O bond changes in the lattice of the matrix materi-al. The emission spectrum of YAG:Ce reveals two highly
* W. [email protected]
1 Jiangxi Engineering Laboratory for Optoelectronics TestingTechnology, Nanchang Hangkong University, Nanchang 330063,China
2 Optical Technology Research Laboratory, Victoria University,P.O. Box 14428, Melbourne, VIC 8001, Australia
Experimental Mechanics (2017) 57:57–63DOI 10.1007/s11340-016-0207-5

overlapping bands. The application of high pressure drives thetwo bands to shift towards a lower energy with almost thesame piezo-spectroscopic coefficient [6, 7]. Determining thepeak position of the resultant broad band is imprecise, and as aconsequence, it is difficult to accurately extract shifts in thepeak position particularly at a low pressure or under smallmagnitudes of applied stress. This may explain whyYAG:Ce has not been used previously as a probe for appliedstrain/stress of low magnitude.
The term Bbarycenter^ is most often used in astronomy todescribe the location of the center-of-mass of a many-bodysystem. However, it has also come to be used to describe aweighted mean position of fluorescence peaks, particularly, asis the case here, where there is a broad spectral featuremasking a number of underlying peaks [8–10]. In this article,it is shown that the barycenter of an emission band functionswell as an alternative to the peak wavelength to indicate thestress change for low magnitudes of stress. An extra advan-tage is that such a sensing method does not require the mea-surement spectrometer to have a high resolution; an importantconsideration in keeping instrumental costs and dimensions toa minimum. In this work YAG:Ce has been used to illustratethe sensing technique. The technique described was also ap-plied to temperature sensing, as the same physical effect isevident in the coordination change of Ce3+ caused by eitherstress or temperature.
Experimental Arrangement
The sample precursor was a mixture of a YAG:Ce phosphorpowder (Keheng™ Y4454) and a silicone resin with a mixingratio of 1:5 by weight. Air bubbles were removed from themixture under vacuum and then cured in air. The resultingcompound was trimmed into a slice (6.0 × 7.0 × 1.5 mm3).During the piezo-spectroscopic analysis, compression was ap-plied along the thickness direction. The sample wassandwiched between a glass slide and a push force gauge, asshown schematically in Fig. 1. The resolution of the gaugewas 0.25 N, and the measurement range was 0–50 N. For thetemperature-dependent test, the phosphor powder was usedunadulterated to avoid any possible influence of the resin ma-terial. In practice, no notable evidence of the resin’s influenceon the phosphor fluorescence was found in this work or hasbeen reported elsewhere, while the silicone material is widelyused in white LEDs as conformal coating on the wavelength-converting phosphor(s).
A diode laser with a peak wavelength of 405 nm was usedas the excitation light source. All emission spectra were mea-sured with anAvaSpec-2048TEC-USB2 fiber-optic spectrom-eter. The finest resolution of the spectrometer is 0.5 nm at thewavelength 500 nm (20 cm−1 at the wavenumber20,000 cm−1). A dye filter, located up beam of the
spectrometer, removed scattered excitation light from the re-corded spectra. The phosphor’s structure has been confirmedon a D8ADVANCE X-ray diffractometer, using a Cu Kα X-ray source.
Results and Discussions
The X-ray diffraction (XRD) pattern of the phosphor powdersample is shown in Fig. 2 and accords with PDF (powderdiffraction file) No. 88–2048, confirming that the phosphorhas a garnet structure. The resulting emission spectra (Fig. 3)show fluorescence typical of Ce3+-doped YAG. No obviousdifference of the spectra features between the powder sampleand the composite sample was found. At very low tempera-ture, a spectrometer with fine resolution may directly distin-guish two peaks at about 536 nm and 567 nm, respectively, inthe emission spectrum of YAG:Ce [11]. Both emission bandsare electron transitions from the lowest 5d level to 4f multi-plets (2F7/2 and
2F5/2) of Ce3+.
The two wide fluorescence emission bands of YAG:Ceoverlap to such an extent that stress-dependent changes arealmost indistinguishable, as is evident in Fig. 3, leading todifficulties in locating precisely any changes to the peak posi-tion of the amalgamated band. For example, to observe apressure-dependent peak shift in the fluorescence emittedfrom the phosphor, a pressure as great as tens of kilobar (sev-eral GPa) is required [7]. Accordingly, a high-resolution spec-trometer would be obligatory for the measurement to be suc-cessful.When a low level stress is applied to the phosphor, it isnot possible to observe any shift in the peak position for theemission spectra, as indicated by the left inset of Fig. 3.Likewise multi-peak fitting cannot be successfully used toreveal a trend in the relationship between the peak wavelengthand the applied stress.
However, there is evidence in the spectra (Fig. 3) corre-sponding to changes in the applied compressive force. Onthe high energy side of the merged emission bands of Ce3+,the band edge is observed to be shifting as shown in the rightinset of Fig. 3 while on the other side of the band, the succes-sive fluorescence curves essentially overlap each other. Thisobserved shift is normally regarded as being in accordancewith the experimental features of the nephelauxetic effectand the change of the crystal field strength [10, 12]. The ex-pected manifestation of the nephelauxetic effect is for thebarycenter energy of a rare-earth ion’s energy levels to shift,characterizing a change in the coordination bond length of theion. In this paper further analysis of the emission spectra isbased on the observation of the barycenter shift of the emis-sion band.
The nephelauxetic effect seeks to describe the size of theelectron cloud around the central ion which increases due tothe transfer of electron density to a bonding molecular orbital.
58 Exp Mech (2017) 57:57–63

Experimentally the effect can be seen as a shift of the absorp-tion or emission bands caused by an environmental changeresulting in changes to the fluorescence spectrum [12].Spectral changes can therefore be linked to the environmentalchange and consequently the potential application as a sensingelement is realized. For example, for the 4fn-4fn transitions ofEu3+, a linear relationship between the barycenter energy andtemperature has been reported [9]. As for YAG:Ce, compres-sion onto the phosphor composite makes the average Ce-Odistance shorter and consequently lower the barycenter energyof the 5d levels. Taking into account that the emission relatesto the transition from the lowest 5d level of Ce3+, a strength-ened crystal field will also contribute to a red shift of theemission band barycenter via increasing the splitting of the5d levels.
Considering that the 4f electrons are shielded by the 5delectron shell, the ground 4f level(s) of Ce3+ is not expectedto be greatly affected by environmental changes. Evidence forthis lies in the fact that the two emission bands stay merged as
one observable band, not separating under normal pressure [6,7] or stress (Fig. 3). In this circumstance the separation widthof the two sub-bands may be equated to the splitting width ofthe 4f ground level, which is determined by the crystal fieldstrength. As mentioned above, multi-peak fitting cannot pro-duce a self-consistent monotonic change of the separationwidth as the applied compressive force is increased, and suchan analysis was not performed in this work. The compression-dependent shift of the Ce3+ emission band barycenter is shownin Fig. 4 and its magnitude is observed to be nearly equal tothe shift of the 5d lowest level of Ce3+. Hence by determiningthe shift in the barycenter of the emission bands, at variouscompression levels, the effect of compression becomes clearlyobservable in contrast to the very small changes to the peakpositions of the twomerged bands of Ce3+ emission. In fact, asshown in Fig. 4 and also in the left inset of Fig. 3, the fluctu-ations in intensity made any shift in the peak position almostindistinguishable, even though the signal-to-noise ratio of thespectra is relatively high at about 700:1 (calculated with thepeak-to-peak baseline noise and the fluorescence peak inten-sity from the real spectra in this study).
Figure 4 suggests a near linear sensing region for part of therange of applied compressive force. The line gives a piezo-spectroscopic coefficient of about 11 cm−1/MPa (compressionover the sample area ~ 42 mm2). This shift coefficient is of theorder of one hundred times larger than the reported hydrostaticpressure coefficient of the YAG:Ce emission peaks [7]. Inaddition the direction of the shift is the reverse of what isexpected. As for the first datum point which is free of externalstress loading, neither the linear nor the polynomial fittingcurve are able to accommodate it, most probably implyingthe existence of residual stress in the composite sample. Themeasured resolution is less than 0.06 N/mm2 (0.06MPa, 2.5 Nover 42 mm2 surface area), with a barycenter energy shift of0.6 cm−1. This is better than the spectrometer resolution
Fig. 1 Schematic of theexperimental setup for measuringstress-dependent fluorescence
80604020
2 (degree)
PDF No.88-2048 for Y3AL
5O
12
0
500
1000
1500
2000
2500
3000
Counts
powder sample under test
Fig. 2 X-ray diffraction pattern of the YAG: Ce phosphor powder
Exp Mech (2017) 57:57–63 59

(20 cm−1 at 500 nm). That is to say, the sensing functionperforms well for applications of stress measurement at a verylow magnitude of stress. Further, the sensing phenomenon iscontrary to the prediction of the nephelauxetic effect and crys-tal field theory which would expect to present a red shift.
For practical applications, it is not essential that the mea-surement be related to the nephelauxetic effect when retriev-ing and/or applying the barycenter of fluorescence peaks/bands. Notwithstanding the physical meaning or any ambigu-ity of the stress sensing mechanism, the above experimentalanalysis of stress-dependent spectra has shown the advantagesof using the barycenter technique. While the method is com-patible with traditional peak-locating operations (as both char-acterize the band position) the resolution of the barycentertechnique was shown to be superior to the resolution limit ofthe spectrometer used in the measurement. Therefore a verysmall stress magnitude is able to be distinguished by using thebarycenter technique. To our best knowledge, it is the firsttime that a low stress (several KPa) has been precisely mea-sured via a fluorescence method. Particularly there have notbeen any similar reports on the stress-dependent properties ofCe3+-doped garnet family of materials.
The unpredicted shift direction remains unexplained.Considering that the lanthanide-ligand distance is bothtemperature- and stress-dependent, an investigation of thetemperature-dependent fluorescence (Fig. 5) was undertakenin an attempt to clarify the piezo-spectroscopic ambiguity.Any change in the barycenter energy caused by different en-vironmental parameters can be considered as having the samecoordination circumstance dependence [9].
Consistent with the unpredicted result with applied stressreported above, Fig. 5 shows temperature related shifts in thepeak position opposite in direction to that expected by re-course to the nephelauxetic effect and crystal field theory. Athermally expanded lattice constant means weaker electroncloud repulsion and also a weakened crystal field. These ef-fects should raise the lowest 5d level of Ce3+, showing a blue-shifted emission band in direction contrast to the experimentalresult.
By way of exploration, there are other operations on thematerial that can vary the lattice constant and consequentlyinfluence the resultant fluorescence phenomena potentially ina way that is comparable with our observations. Such latticeexpansion or shrinkage could be a result of the heat treatmenttemperature on sample phosphors [13, 14] or an effect of thenanoscale sample particle size [15, 16]. Alternatively theremay have been Y3+ substitution by Gd3+ [17–23] or Tb3+
[24] or again Lu3+ [25, 26]; perhaps there was a differentdoping concentration of Ce3+ [27–29]. Even though these ar-ticles reported very similar wavelength shifts of the emissionband maximum, the mechanism of such a lattice effect onCe3+ emission were ambiguously allocated to strengthenedor weakened crystal field in most of the articles. Tanneret al. have pointed out similar conflicts in various publicationswhen they reassigned energy levels of YAG:Ce [30].
There are more conjectures that may be related to the shiftof the emission of YAG:Ce. The garnet structure possessesseveral types of positions for the accommodation of dopantions [31, 32]. Dopant pairs/clusters can possibly produce low-er energy sites in the Lu3Al5O12 matrix and then the emissionspectra show a strong red shift [33]. However, it is common
13000 14000 15000 16000 17000 18000 19000 20000 21000
0.0
0.2
0.4
0.6
0.8
1.0
1.2 0N
2.5N
52.5N
Norm
alize
d in
tensity
Wavenumber(cm-1
)
Barycenter shifts
Fig. 3 Emission spectra of thecomposite sample under varyingmagnitude of compressive force.The spectra have been normalizedto the peak intensity. Selectedportions are magnified in theinsets
0 10 20 30 40 50
17520
17540
17560
17580
17600
17620
17640
Y = 17529.2 + 0.43 X - 0.0031 X2
R = 0.997
Y = 17531.8 + 0.239 X
R = 0.989
Barycenter position
Peak position
Linear fit
Polynomial fit
Ba
nd
po
sitio
n (
cm
-1
)
Compression force (N)
Fig. 4 Barycenter energy of the emission band of the composite sampleunder varying compressive force
60 Exp Mech (2017) 57:57–63
that Ce3+ replaces Y3+ in the YAG material but not in otherpositions if the synthesizing temperature is not too high [30,34]. Moreover, in a certain material with fixed doping concen-tration, the dopant ions are not able to re-distribute reversiblyunder the influence of temperature or stress. Then the abovefindings do not reveal the major mechanism of the observa-tions reported in this work. Neither do other speculations, suchas re-absorption processes [35] or a modified crystal fieldtheory [36]. Considering that the major mechanism of theobserved shifts should be of the coordination circumstanceof the central Ce3+ ion and nothing else, it was determinedthat an altered site symmetry of the central ion should be takeninto account.
Andriessen and co-workers have shown that lattice defor-mation leads to a significant shift in Ce3+ ion fluorescencewavelength [37]. More reports [38–41] suggest that deviationfrom cubic symmetry around the Ce3+ ion results in an in-crease in the maximum emission wavelength, while yttriumaluminum garnet provides a distorted cubic local circum-stance to the dopant [34]. Besides the radius of the dopantion, environmental parameters such as temperature and stresscan produce a similar distortion. Anisotropic thermal expan-sion of the matrix YAG material drives the Ce-O cell micro-structure distortion. On the other hand, stress can shape themicrostructure to achieve a higher or lower symmetry, de-pending on the stress direction and scale. On average, for aphosphor powder-resin composite, compression should slight-ly diminish the difference of Ce-O distances, meaning an in-creasing symmetry. Lower point symmetry of Ce3+ allows asignificant modification of the separation gap between thelowest two 5d levels, namely the two 2E levels of Ce3+ in agarnet structure [38–41]. Both the temperature influence andthe compression effect of YAG:Ce fluorescence can implydifferent distortions of the solid lattice. The distortion influ-ence can be so important that the crystal field effect is morethan being compensated. Only when the change of the coor-dination circumstance around Ce3+ is isotropic, e.g. under ahydrostatic pressure, the coordination symmetry issue is nolonger effective. This consideration can explain why the
observed stress and temperature effects in the present experi-ment are different to those reported in previous publications[6, 7], whilst the phenomena is more complicated than theprediction of the nephelauxetic effect, crystal field theory,and the Jahn-Teller effect, e.g. the remaining problem inmulti-peak fitting.
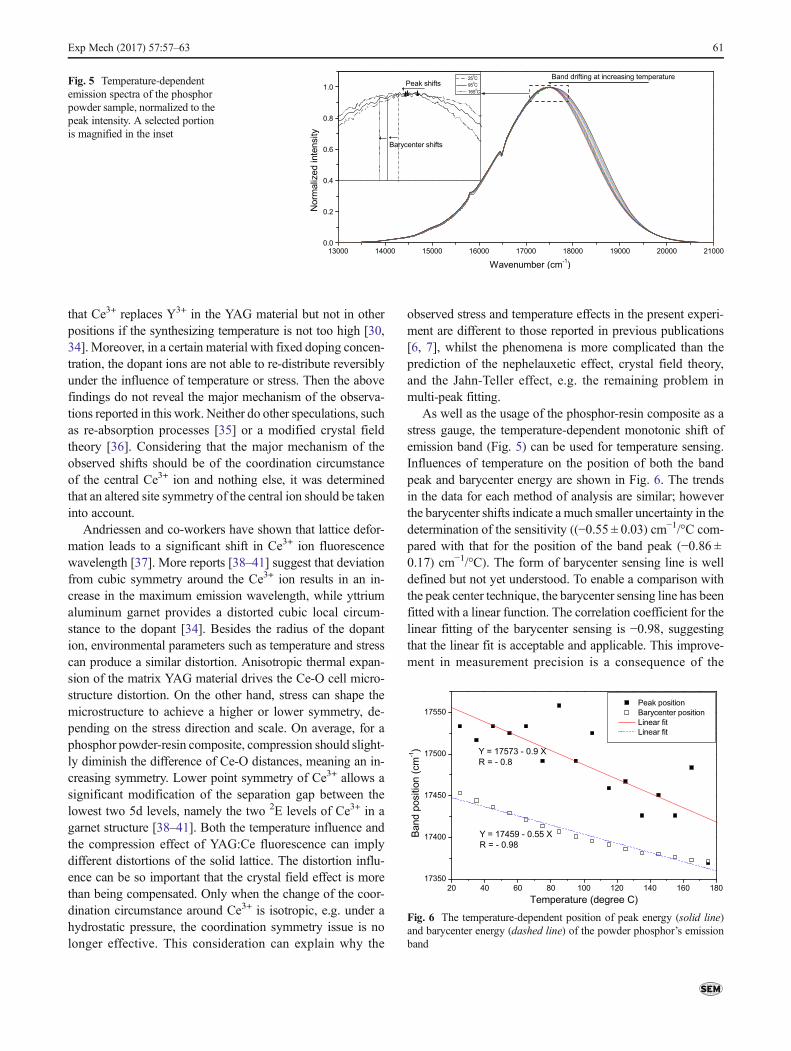
As well as the usage of the phosphor-resin composite as astress gauge, the temperature-dependent monotonic shift ofemission band (Fig. 5) can be used for temperature sensing.Influences of temperature on the position of both the bandpeak and barycenter energy are shown in Fig. 6. The trendsin the data for each method of analysis are similar; howeverthe barycenter shifts indicate a much smaller uncertainty in thedetermination of the sensitivity ((−0.55 ± 0.03) cm−1/°C com-pared with that for the position of the band peak (−0.86 ±0.17) cm−1/°C). The form of barycenter sensing line is welldefined but not yet understood. To enable a comparison withthe peak center technique, the barycenter sensing line has beenfitted with a linear function. The correlation coefficient for thelinear fitting of the barycenter sensing is −0.98, suggestingthat the linear fit is acceptable and applicable. This improve-ment in measurement precision is a consequence of the
13000 14000 15000 16000 17000 18000 19000 20000 21000
0.0
0.2
0.4
0.6
0.8
1.0Peak shifts
Barycenter shifts
250
C
950
C
1650
C
Band drifting at increasing temperature
Norm
alized inte
nsity
Wavenumber (cm-1
)
Fig. 5 Temperature-dependentemission spectra of the phosphorpowder sample, normalized to thepeak intensity. A selected portionis magnified in the inset
20 40 60 80 100 120 140 160 180
17350
17400
17450
17500
17550
Peak position
Barycenter position
Linear fit
Linear fit
Y = 17459 - 0.55 X
R = - 0.98
Y = 17573 - 0.9 X
R = - 0.8
Band p
ositio
n (
cm
-1
)
Temperature (degree C)
Fig. 6 The temperature-dependent position of peak energy (solid line)and barycenter energy (dashed line) of the powder phosphor’s emissionband
Exp Mech (2017) 57:57–63 61

analyzing methodology itself as when determining thebarycenter energy, the total area of the emission band is inte-grated first and then the barycenter position divides the areaequally. In this way the operation of integration eliminates therandom noise of the measurement.
In this article, a shift in the emission band barycenter ofCe3+ indicates more than the change of Ce-O distance, eitherin the stress effect or temperature-dependent spectra.Reasonably, we may look forward to more sensing applica-tions of the barycenter method in other situations with orwithout change of point symmetry at the active ion position.
Conclusions
In conclusion, this article has demonstrated that fluorescentmaterials, in particular YAG:Ce, are available for stress andtemperature sensing by carefully monitoring the position ofthe emission band(s). Sensing functions have been retrievedsuccessfully and beyond the expectation of normal peak anal-ysis when the barycenter energy was employed to characterizethe band position. The barycenter energy of emission band(s)can be used as a sensing signal, while the actual operation of apractical device does not require consideration of the under-lying physical effect. The barycenter energy provides a rela-tively fine resolution and high precision to the sensing meth-od. This result is important for sensing applications at lowpressure/stress levels in contrast to the Bclassic^ peak shiftmethod that has already proven to be successful for relativelyhigher stress amplitudes.
Acknowledgments This work is supported by the National NaturalScience Foundation of China (Grants No. 61167007 and 11162014),the Aeronautical Science Foundation of China (Grant No.2012ZD56007), the China Scholarship Council (File No.201308360026), and the Program for Supporting Young Scientists ofJiangxi Province (Grant No. 20153BCB23037).
Open Access This article is distributed under the terms of theCreative Commons Attribution 4.0 International License (http://creativecommons.org/licenses/by/4.0/), which permits unrestricted use,distribution, and reproduction in any medium, provided you give appropriatecredit to the original author(s) and the source, provide a link to the CreativeCommons license, and indicate if changes were made.
References
1. Wittlin A, Przybylińska H, Berkowski M et al (2015) Ambient andhigh pressure spectroscopy of Ce3+ doped yttrium gallium garnet.Opt Mater Express 5:1868–1880
2. Grinberg M (2011) Excited states dynamics under high pressure inlanthanide-doped solids. J Lumin 131:433–437
3. Lipkin DM, Clarke DR (1996) Measurement of the stress in oxidescales formed by oxidation of alumina-forming alloys. Oxid Met45(3/4):267–280
4. Syassen K (2008) Ruby under pressure. High Pressure Res 28:75–126
5. Ma Q, Clarke DR (1993) Stress measurement in single-crystal andpolycrystalline ceramics using their optical fluorescence. J AmCeram Soc 76:1433–1440
6. Grinberg M (2006) High pressure spectroscopy of rare earth ionsdoped crystals - new results. Opt Mater 28:26–34
7. Barzowska J, Grinberg M, Tsuboi T (2003) High pressure spectros-copy of Ce doped YAG crystal. Radiat Eff Defects Solids 158:39–47
8. Antic-Fidancev E (2000) Simple way to test the validity of 2S+1LJ
barycenters of rare earth ions (e.g. 4f2, 4f3 and 4f6 configurations). JAlloys Compd 300–301:2–10
9. Zhang WW, Yin M, He XD, Gao YQ (2011) Size dependent lumi-nescence of nanocrystalline Y2O3:Eu and connection to tempera-ture stimulus. J Alloys Compd 509(8):3613–3616
10. Burdick GW, Reid MF (2007) 4fn–4fn−15d transitions. In:Gschneidner Jr. KA, Bünzli J-CG, Pecharsky VK (Eds.)Handbook on the Physics and Chemistry of Rare Earths, ElsevierB 37:80
11. Zorenko Y, Voznyak T, Gorbenko V et al (2011) Luminescenceproperties of Y3Al5O12:Ce nanoceramics. J Lumin 131:17–21
12. Görller-Walrand C, Binnemans K (1996) Rationalization of crystal-field parametrization, in: Gschneidner Jr. KA, Eyring L (Eds.)Handbook on the Physics and Chemistry of Rare Earths. ElsevierSci 23:163–164
13. Xia G, Zhou S, Zhang J, Xu J (2005) Structural and optical prop-erties of YAG:Ce3+ phosphors by sol–gel combustion method. JCryst Growth 279:357–362
14. Purwanto A, Wang WN, Ogi T et al (2008) High luminance YAG:Ce nanoparticles fabricated from urea added aqueous precursor byflame process. J Alloys Compd 463:350–357
15. Pazik R, Gluchowski P, Hreniak D et al (2008) Fabrication andluminescence studies of Ce:Y3Al5O12 transparent nanoceramic.Opt Mater 30:714–718
16. ZhangK,HuWB,WuYT, LiuHZ (2008) Synthesis, luminescence,and effect of heat treatment on the properties of Y3Al5O12:Ce phos-phor. Inorg Mater 44:1218–1223
17. Pan Y,WuM, SuQ (2004) Tailored photoluminescence of YAG:Cephosphor through various methods. J Phys Chem Solids 65:845–850
18. Pan YX, Wang W, Liu GK et al (2009) Correlation between struc-ture variation and luminescence red shift in YAG:Ce. J AlloysCompd 488:638–642
19. Shi H, Zhu C, Huang J et al (2014) Luminescence properties ofYAG:Ce, Gd phosphors synthesized under vacuum condition andtheir white LED performances. Opt Mater Express 4:649–655
20. Li X, Li JG, Xiu Z et al (2010) Effects of Gd3+ substitution on thefabrication of transparent (Y1-xGdx)3Al5O12 ceramics. J Am CeramSoc 93:2229–2235
21. Fujita S, Sakamoto A, Tanabe S (2008) Luminescence characteris-tics of YAG glass-ceramic phosphor for white LED. IEEE J Sel TopQuant Electr 14:1387–1391
22. Shao Q, Li H, Dong Y et al (2010) Temperature-dependentphotoluminescence studies on Y2.93−xLnxAl5O12:Ce0.07 (Ln = Gd,La) phosphors for white LEDs application. J Alloys Compd 498:199–202
23. Li K, Shen C (2012) White LED based on nano-YAG:Ce3+/YAG:Ce3+, Gd3+ hybrid phosphors. Optik 123:621–623
24. Dotsenko VP, Berezovskaya IV, Zubar EV et al (2013) Synthesisand luminescent study of Ce3+-doped terbium–yttrium aluminumgarnet. J Alloys Compd 550:159–163
25. Praveena R, Shi L, Jang KH et al (2011) Sol–gel synthesis andthermal stability of luminescence of Lu3Al5O12:Ce
3+ nano-garnet.J Alloys Compd 509:859–863
62 Exp Mech (2017) 57:57–63

26. Yang H, Lee DK, Kim YS (2009) Spectral variations of nano-sizedY3Al5O12:Ce phosphors via codoping/substitution and their whiteLED characteristics. Mater Chem Phys 114:665–669
27. Chung EJ, Masaki T, Song YH et al (2013) Enhancement of ther-mal quenching properties of a yellow-emitting SiO2-coatedY3Al5O12:Ce
3+ phosphor for white light-emitting diode applica-tions. Phys Scr T157:014012
28. Haranath D, Chander H, Sharma P, Singh S (2006) Enhanced lu-minescence of Y3Al5O12:Ce
3+ nanophosphor for white light-emitting diodes. Appl Phys Lett 89:173118
29. Wei N, Lu T, Li F et al (2012) Transparent Ce:Y3Al5O12 ceramicphosphors for white light-emitting diodes. Appl Phys Lett 101:061902
30. Tanner PA, Fu L, Ning L et al (2007) Soft synthesis and vacuumultraviolet spectra of YAG:Ce3+ nanocrystals: reassignment of Ce3+
energy levels. J Phys Condens Matter 19:21621331. Lupei A, Lupei V, Gheorghe C et al (2014) Multicenters in Ce3+
visible emission of YAG ceramics. Opt Mater 37:727–73332. Speghini A, Piccinelli F, Bettinelli M (2011) Synthesis, characteri-
zation and luminescence spectroscopy of oxide nanopowders acti-vated with trivalent lanthanide ions: the garnet family. Opt Mater33:247–257
33. Setlur AA, Srivastava AM (2007) On the relationship betweenemission color and Ce3+ concentration in garnet phosphors. OptMater 29:1647–1652
34. Przybylińska H, Ma CG, Brik MG et al (2013) Electronic structureof Ce3+ multicenters in yttrium aluminum garnets. Appl Phys Lett102:241112
35. Katelnikovas A, Plewa J, Dutczak D et al (2012) Synthesis andoptical properties of green emitting garnet phosphors forphosphor-converted light emitting diodes. Opt Mater 34:1195–1201
36. Kim KM, Ryu JH (2013) Synthesis of Y3Al5O12: Ce3+ colloidal
nanocrystals by pulsed laser ablation and their luminescent proper-ties. J Alloys Compd 576:195–200
37. Andriessen J, van der Kolk E, Dorenbos P (2007) Lattice relaxationstudy of the 4f-5d excitation of Ce3+-doped LaCl3, LaBr3, andNaLaF4: Stokes shift by pseudo Jahn-Teller effect. Phys Rev B76:075124
38. Wu JL, Gundiah G, Cheetham AK (2007) Structure–property cor-relations in Ce-doped garnet phosphors for use in solid state light-ing. Chem Phys Lett 441:250–254
39. Hansel R, Allison S, Walker G (2010) Temperature-dependent lu-minescence of gallium-substituted YAG:Ce. J Mater Sci 45:146–150
40. Birkel A, Denault KA, George NC et al (2012) Rapid microwavepreparation of highly efficient Ce3+-substituted garnet phosphorsfor solid state white lighting. Chem Mater 24:1198–1204
41. Shao Q, Dong Y, Jiang J et al (2011) Temperature-dependentphotoluminescence properties of (Y, Lu)3Al5O12:Ce3+ phosphorsfor white LEDs applications. J Lumin 131:1013–1015
Exp Mech (2017) 57:57–63 63