Embed Size (px)
Citation preview

27
Applied Computer Science, vol. 12, no. 1, pp. 27–39
Submitted: 2015-09-04
Revised: 2015-10-02
Accepted: 2015-10-23
CATIA, construction design, stress analysis, optimization
Gürkan İRSEL*
STRESS ANALYSIS
AND DESIGN OPTIMIZATION WITH CATIA
Abstract Stress analysis obtained from CAE methods is one of the most important
parameter of designing parts, assemblies and constructions. Loads
and stress limits applied on the model should be known also for better
design procedure. Evaluation of all parameters is known as optimization.
Designed model should contain the optimum values of each parameters
such as loads, stresses and weight. Designer creates the model using
optimized values for better products. In this paper, Computer Aided
Engineering Design Optimization process is studied experimentally with
CATIA Product Engineering Optimizer module and optimization
algorithms within limitations are used. Benefits of the optimization pro-
cedure is also evaluated. Optimization process and benefits are presented
in an example of I profile cantilever beam with a length of 2000 mm.
1. INTRODUCTION
The concept of optimization may be expressed simply as making something
better. For a system working properly or a design manufactured with a con-
venient safety factor does not mean that it is designed in the best way.
Optimization techniques are used to suggest the best solution for the work on the
progress or has already been completed. The solution obtained by use of these
techniques is called as the optimum solution.
* Trakya University, Faculty of Engineering, Department of Mechanical Engineering, Edirne,
Turkey, e-mail: [email protected]

28
In order to compare if one design is better than the other, a criteria
is required. This criteria is called as the fitness function. The fitness function
is predefined depending on the design parameters in the aim of obtaining the
optimum solution. In this study, minimum weight is investigated for specific
boundary conditions.
All systems are designed so as to satisfy some constraints such as resources,
strength of material, response of the system and geometrical properties
of the system components. These constraints are defined depending
on the design parameters. If a design satisfies the whole constraints, then
the system is compatible and ready to work, otherwise it is not. In addition,
it is possible to have various designs satisfyingthe same goal. In this case, one
of the conveniet design can be chosen.
Modern CAD systems contain some factors decreasing the operation time
of user against complex functions of complicated mechanical structures
and manufacturing necessitiesOptimization process is the most important factor
among these. The model used in this study is developed by use of Catia V5
Product Engineering Optimizer and Generative Structural Analysis modules.
For the best design, an initial design is built up geometrically and geometrical
properties,varying through specific limits, are defined as design parameters [1, 2].
Firstly, the weight of construction affects the cost depending on the amount
of material. Mountability and transportability are also important. In the design
of a product that would be manufactured for thousands and millions in a mass
production, it should be appreciated that all parameters must be taken into
account carefully. Besides, an optimization will be necessary for the new
system [3].
In this study, rather than optimization of a system, the implementation
and advantages of optimization are emphasized. The implementation of optimi-
zation is carried out by Catia Optimization Module which has wide application
fields in CAE especially in automotive industry [4].
2. OPTIMIZATION PROCESS WITH CATIA
In Figure 1, the cross-section of an I profile beam, used in the optimization
problem is presented. The profile has almost the same dimensions with
a standart NPI-200 profile.
The profile has a length of 2000 mm, clamped at one edge and loaded
with 10 kN on the other edge. During the stress analysis, global sensors of Mass
and Von Mises have been created before mesh arrangements. By use of these
sensors, the stress and weight of the design are observed continuously (Figure 2) [5].

29
Fig. 1. Cross-section of I profile beam [source: own study]
Fig. 2. Sensor definition of I profile beam in a stress analysis [source: own study]
30
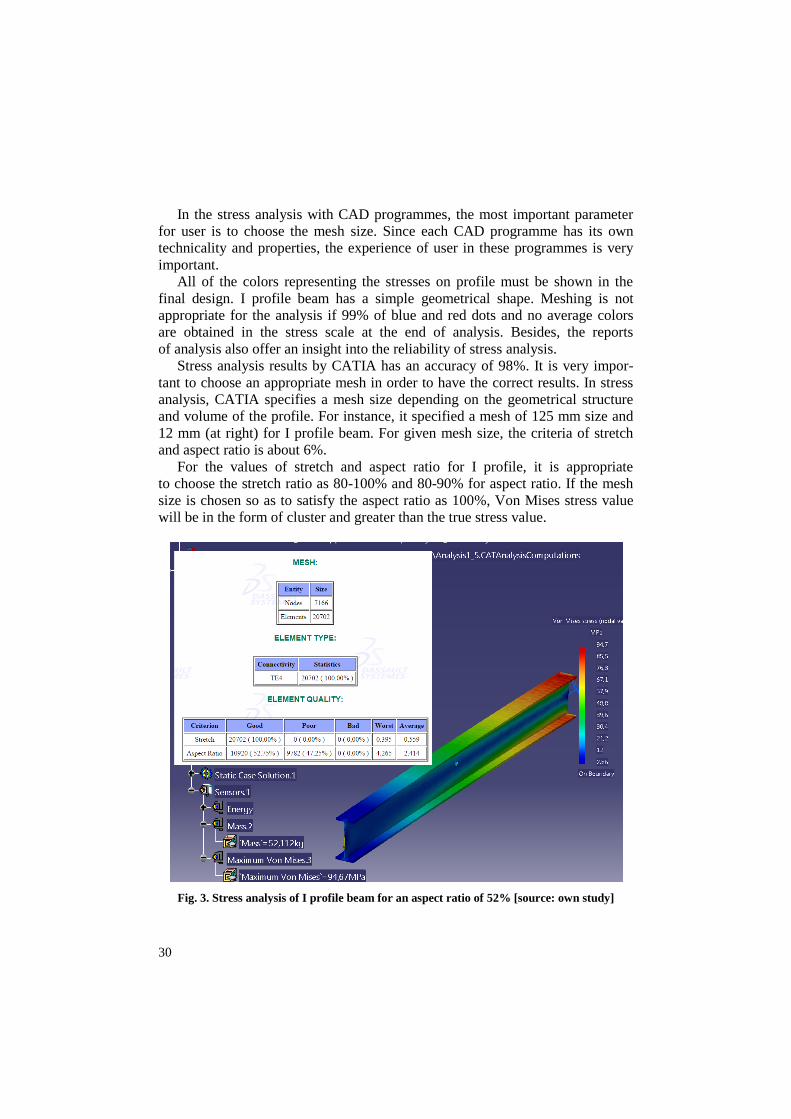
In the stress analysis with CAD programmes, the most important parameter
for user is to choose the mesh size. Since each CAD programme has its own
technicality and properties, the experience of user in these programmes is very
important.
All of the colors representing the stresses on profile must be shown in the
final design. I profile beam has a simple geometrical shape. Meshing is not
appropriate for the analysis if 99% of blue and red dots and no average colors
are obtained in the stress scale at the end of analysis. Besides, the reports
of analysis also offer an insight into the reliability of stress analysis.
Stress analysis results by CATIA has an accuracy of 98%. It is very impor-
tant to choose an appropriate mesh in order to have the correct results. In stress
analysis, CATIA specifies a mesh size depending on the geometrical structure
and volume of the profile. For instance, it specified a mesh of 125 mm size and
12 mm (at right) for I profile beam. For given mesh size, the criteria of stretch
and aspect ratio is about 6%.
For the values of stretch and aspect ratio for I profile, it is appropriate
to choose the stretch ratio as 80-100% and 80-90% for aspect ratio. If the mesh
size is chosen so as to satisfy the aspect ratio as 100%, Von Mises stress value
will be in the form of cluster and greater than the true stress value.
Fig. 3. Stress analysis of I profile beam for an aspect ratio of 52% [source: own study]

31
In the stress analysis of I profile beam, it is possible to see that the selection
of mesh size is relevant not only the volume but also the geometrical structure.
For two beams with I profile and different mesh structures, only 2,1 MPa
of difference is occured for an aspect ratio between 52% and 91% for good case.
In Figure 3 and Figure 4, stress analysis of I profile beam for an aspect ratio
of 52% (94.7 MPa) and 91% (96.8 MPa) are given respectively.
Fig. 4. Stress analysis of I profile beam for an aspect ratio of 91% [source: own study]
In Figure 5, an aspect ratio of 91% in I profile beam is presented. Because
of a simple structure, the mesh size is the same through all structure.
Fig. 5. Mesh structure of an I profile beam [source: own study]

32
When the stress distribution of an I profile beam is examined, major
differences can be seen in through the structure. 90 MPa of stress for 10%
and 10 MPa of stress for 40% of the beam is acceptable for loading.
Additionally, more than 60% of the profile will be exposed to small amount
of stresses. Therefore, it can be mentioned that the beam has more weight than
it can carry or better geometry can be chosen. For the first case, the I profile
beam with a length of 2 m is 52,112 kg.
When the stress distribution of an I profile cantilever beam is examined,
the minimum stress is obtained at the free edge of the beam. It would be wise
to minimize the weight of the beam starting fom this point. Moreover, the blue
region in lateral axis of the beam (Figure 6) is also convenient for minimizing.
For this reason, initially, the optimization of cantilever beam with triangle
and circular holes is performed.
Fig. 6. Stress distribution of an I profile beam [source: own study]
Optimization process is carried out in order to minimize the blue region
and the excessive stress values. So, it can be called as the minimum weight
optimization problem for a significant geometry and maximum stress value.
2.1. Optimization-1: Triangular I Profile Cantilever Beam
The left and right measurements of plate with a thickness of 7,5 mm, are
defined as parameters by not exceeding the height of I profile beam of 200 mm
and considering the top and bottom regions as constant (90 mm x 11 mm).
In Figure 7, the bottom and top limits and step values of parameters are
illustrated. In Figure 8, the mass sensor of the beam is defined.

33
Fig. 7. Definition of the optimization parameters [source: own study]
Fig.8. Definition of the mass in Optimization-1 [source: own study]

34
For an I profile of 200 mm, the plate’s height should not exceed 178 mm.
The optimization process is achieved for a maximum stress value of 100 MPa
(Figure 9). This solution of the analysis is listed as below (Figure 10).
Appropriate ones are chosen and chosen parameters are applied to the model.
Fig. 9. Definition of the constraints in Optimization-1 [source: own study]
Fig. 10. Solution of Optimization-1 and the selection
of appropriate solution [source: own study]

35
As a result of the optimization process, the triangular I profile beam chosen
amongst the others has an allowable stress of 99,9 MPa. The mesh distribution
is convenient and has a weight of 42,023 kg (Figure 11).
Fig. 11. Stress analysis of Optimization-1 for final geometry [source: own study]
2.2. Optimization-2: I Profile Cantilever Beam with Circular Holes
In the optimization process, nine circular holes with a distance of 200 mm
to each other are defined on an I profile beam. In Figure 12, due to the
optimization, the measurements of the circles in final profile are presented.
Fig. 12. The parameter values of Optimization-2 after the optimization
process [source: own study]

36
In Figure 13, the stress analysis and mesh values of the geometry after
optimization process are presented. The weight of the system is 43,561 kg.
Fig. 13. Stress analysis of Optimization-2 [source: own study]
Although the mass of the system is 42,023 kg in Optimization-1, the mini-
mum mass in Optimization-2 is 43,561 kg. In the third step, a triangle hole
is applied to a triangular I profile cantilever beam.
2.3. Optimization-3: Triangular I Profile Cantilever Beam
with a Triangular Hole
The optimization parameters are defined for a triangular hole for a triangular
plate with a thickness of 7,5 mm. In Figure 14, three of the optimization
parameters are presented. The length of 2000 mm is constant and the maximum
height of the profile is determined by the program itself.
Fig. 14. Triangular I Profile Cantilever Beam with a Triangular Hole [source: own study]

37
The aspect ratio value of I profile, obtained in Optimization-3, is 87,25.
When the finite element method (FEM) is used for I profile with the same mesh
size, the aspect ratio is observed as 80,25. In figure 15 and 16, the mesh structure
of both triangular I profile centilever beam with a triangular hole and I profile
are given respectively.
Fig. 15. Triangular I Profile Cantilever Beam with a Triangular Hole
mesh structure [source: own study]
Fig. 16. I profil mesh structure [source: own study]

38
In Figure 17, the stress analysis of the geometry after optimization process
is presented. As it can be seen from the figure, the maximum stress occured
through the beam is 99.7 MPa which is smaller than maximum value and the
mass of the profile is 37.9 kg.
Fig.17. Stress analysis of Optimization-3 [source: own study]
In Table 1, in order to obtain the minimum mass for specific constraints such
as stress values and geometrical properties, optimization processes of three cases
for I profile cantilever beam with 10 kN at one edge are presented. A decrease
of % 27,14 is provided in Optimization-3.
Tab. 1. Optimization Process of the Profiles – Minimizing the Mass [source: own study]
Mass
[kg]
Decrease in Mass
[%]
I Profile 52,112 –
Optimization-1 42,023 20
Optimization-2 43,561 16,41
Optimization-3 37,969 27,14

39
3. CONCLUSION
Optimization process has great importance in the design of machine parts
and constructions. In this study, although I profile beam is a simple structure, for
a beam with a length of 2000 mm and height of 200 mm, 14,143 kg is gained
after the optimization process.
Optimization process has many advantages especially in the design of comp-
licated strctures. The maximum stress value changes depending on the aspect
ratio.
Optimization requires modern computers with hi-tech hardware and latest
software in order to reduce the computing time during the design process.
The analysis in this study are achieved by a work station with the properties
of 2.4 GHz CPU, 1 TB HDD, 48 GB RAM.
Comparing with the other types of analysis, optimization consumes much
evaluating time.
Due to the changing in geometry, mesh structure of the system also changes.
Thus, the analysis reports should be controlled again after the optimization.
If minimum weight is targeted in the optimization by CATIA, the process
should begin with an initial weight heavier than the minimum value.
A stress-weight optimization of a system does not provide a correction in
stress analysis unless the stress analysis is achieved properly. With an inaccurate
stress analysis value, only swapping of two incorrect values will be at stake.
REFERENCES
[1] VALAKOS I. M., NTIPTENI M. S., NIKOLOS I. K.: Structural optimization of a
central Impeller Using Different Evolution in Catia Environment. Operational Research
An International Journal 7 (2), 2007, p. 185–182.
[2] RAJAM V., MURTHY P. V. K., M.V.S. KRISHNA M., RAO G. M. P.: Design Analysis
and Optimization of Piston using CATIA and ANSYS. Internaltional Journal of Innova-
tive Research in Engineering & Science, 2 (1) 2013, ISSN 2319–5665.
[3] FERRIRA R., HERNANDES J.A.: Structural Optimization of Reinforced Panels Using
Catia V5. 19th International Congress of Mechanical Engineering, November 5–9, 2007,
Brasillia.
[4] KONIG O., WINTERMANTEL M.: CAD-based Evolutionary Design Optimization with
CATIA V5. EVEN – Evolutionary Engineering AG, Zurich, Switzerland, Weimarer
Optimierungs – und Stochastiktage 1.0, December 2004.
[5] IRSEL G., ALTINBALIK T., ÇAN Y.: Failure Investigation of the Disc Harrow Pro-
files and Redesigning by CATIA Analysis. Applied Mechanics and Materials 729, 2015,
p. 181–186.