Embed Size (px)
Citation preview
Strengthening Our Learning Journey
Technical Appendix
to the Third Progress Report on
the Implementation of the Ontario
First Nation, Métis, and Inuit
Education Policy Framework
20
18
Indigenous perspectives bring the curriculum to life!
Une publication équivalente est disponible en français sous le titre suivant: Renforcer notre parcours d’apprentissage : Annexe technique au Troisième rapport d’étape sur la mise en œuvre du Cadre d’élaboration des politiques de l’Ontario en éducation des Premières Nations, des Métis et des Inuits, 2018.
This publication is available on the Ministry of Education’s website, at www.ontario.ca/edu.
The Ontario Public Service endeavours to demonstrate leadership with respect to accessibility in Ontario. Our goal is to ensure that Ontario government services, products, and facilities are accessible to all our employees and to all members of the public we serve. This document, or the information that it contains, is available, on request, in alternative formats. Please forward all requests for alternative formats to ServiceOntario at 1-800-668-9938 (TTY: 1-800-268-7095).
Contents
Introduction 3
Technical Appendix to Section 3 of the Third Progress Report – Supporting Students 4
Section 3.1.1 – Student Self-Esteem 4
Provincial-Level Enrolment in Indigenous Language Programs/Courses and First Nations, Métis, and Inuit Studies Courses for All Students 4
Technical Appendix to Section 6 of the Third Progress Report – Using Data to Support Student Achievement 6
Section 6.1 – Voluntary, Confidential Indigenous Student Self-Identification 6
Section 6.2.1 – Student Achievement Results in Reading, Writing, and Mathematics 8
Grade 3 Reading, Writing, and Mathematics Results for English-Language and French-Language Systems 9
Grade 6 Reading, Writing, and Mathematics Results for English-Language and French-Language Systems 18
Grade 9 Academic and Applied Mathematics Results for English-Language and French-Language Systems 27
Grade 10 Ontario Secondary School Literacy Test (OSSLT) Results for English-Language and French-Language Systems 32
Analysing the Reading, Writing, and Mathematics Results 35
Section 6.2.2 – Graduation Rate of First Nation, Métis, and Inuit Students 38
Section 6.2.3 – Credit Accumulation as an Indicator of Student Achievement 42
Conclusion 47

3
Introduction
This technical appendix provides additional information and data on the progress reported in Strengthening Our Learning Journey: Third Progress Report on the Implementation of the Ontario First Nation, Métis, and Inuit Education Policy Framework (the third progress report).
The data presented in this document relates to the achievement and well-being of those students who have voluntarily and confidentially chosen to self-identify as First Nation, Métis, or Inuit. The data is collected by the Ministry of Education, school boards, and schools with the sole and express purpose of supporting student achievement and well-being by informing improvement planning, supporting account-ability, informing the development of programs and services, informing policy and funding decisions, and helping to measure progress. Student achievement and well-being have been examined through different sets of data lenses to better understand and assess the progress achieved and to determine next steps that will support student success.
The data and information contained in this technical appendix can sup-port the collective and collaborative efforts of the Ministry of Education, school boards, schools, Indigenous partners, and other education partners committed to working in partnership to help improve First Nation, Métis, and Inuit student achievement and well-being. This document provides quantitative data relating to the performance measures that pertain to student achievement in terms of EQAO province-wide assess-ments, graduation rates, and credit accumulation (numbers 1, 3, and 4 in the Framework), as well as some supporting information relating to other performance measures.
To make it easy to cross-reference the information in this document with the information in the third progress report, the section numbers used here reflect the section numbers in the third progress report.
4
Stre
ngth
enin
g O
ur L
earn
ing
Jour
ney:
Tec
hnic
al A
pp
end
ix
Technical Appendix to Section 3 of the Third Progress Report – Supporting Students
Section 3.1.1 – Student Self-Esteem
Provincial-Level Enrolment in Indigenous Language Programs/Courses and First Nations, Métis, and Inuit Studies Courses for All Students
Explanation of the Enrolment Data
• Indigenous language1 program/course enrolment data includes elementary students enrolled in Indigenous language programs and secondary students enrolled in Indigenous language courses.
• Secondary students enrolled in more than one Indigenous language course or First Nations, Métis, and Inuit studies2 course are counted multiple times.
• Note: Since the publication of the second progress report, the Ministry of Education has updated reporting practices for calculating secondary school course enrolment and second-language program enrolment. As a result, enrolment figures given in the second progress report are not comparable to those reported here.
1. The discipline name was “Native languages” at the time of data collection. The current name, “Indigenous languages”, is used throughout this document.
2. The discipline name was “Native studies”, at the time of data collection. The current name, “First Nations, Métis, and Inuit studies”, is used throughout this document.
5
Student Self-Esteem
Indigenous Language Program/Course Enrolment
• From 2006–07 to 2015–16, Indigenous language program and course enrolment increased from 4,302 student enrolments to 7,795 student enrolments.
• The increase is largely due to the higher number of elementary student enrolments in Indigenous language programs since 2011–12.
First Nations, Métis, and Inuit Studies Course Enrolment
• From 2006–07 to 2015–16, First Nations, Métis, and Inuit studies course enrolment increased from 1,134 course enrolments to 22,195 course enrolments.
• First Nations, Métis, and Inuit studies course enrolment has increased incrementally each year since 2011–12.
6
Stre
ngth
enin
g O
ur L
earn
ing
Jour
ney:
Tec
hnic
al A
pp
end
ix
Technical Appendix to Section 6 of the Third Progress Report – Using Data to Support Student Achievement
Section 6.1 – Voluntary, Confidential Indigenous Student Self-Identification
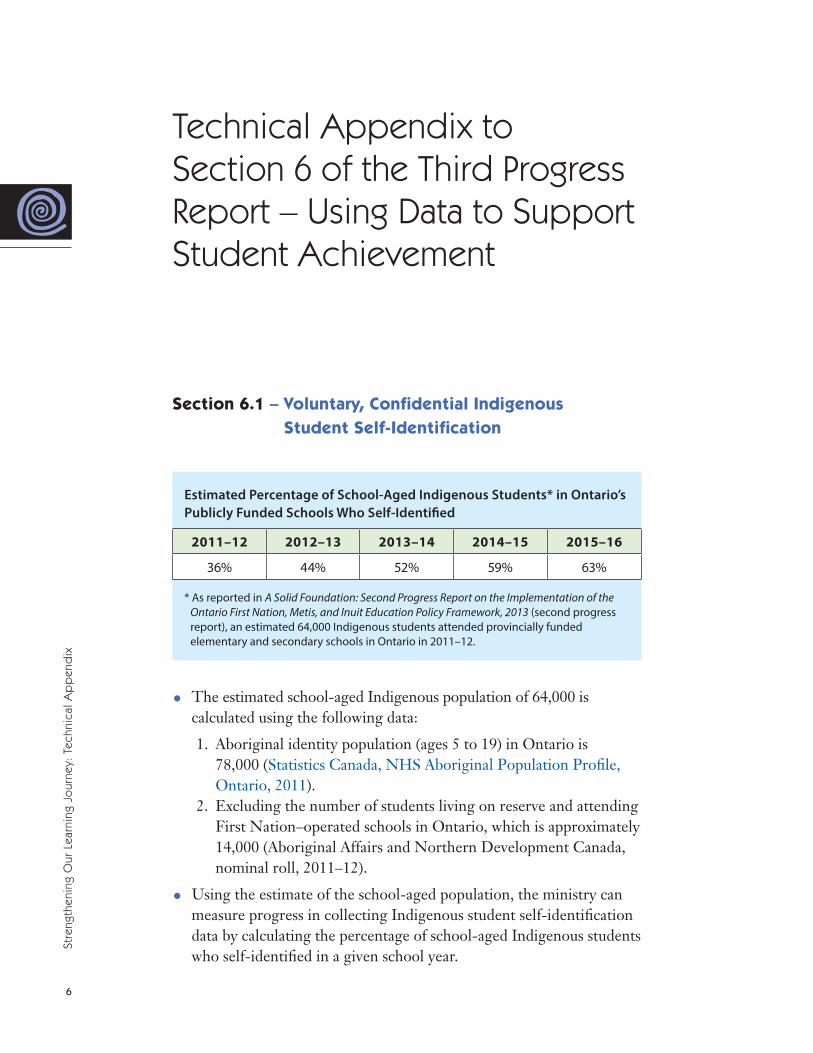
Estimated Percentage of School-Aged Indigenous Students* in Ontario’s Publicly Funded Schools Who Self-Identified
2011–12 2012–13 2013–14 2014–15 2015–16
36% 44% 52% 59% 63%
* As reported in A Solid Foundation: Second Progress Report on the Implementation of the Ontario First Nation, Metis, and Inuit Education Policy Framework, 2013 (second progress report), an estimated 64,000 Indigenous students attended provincially funded elementary and secondary schools in Ontario in 2011–12.
• The estimated school-aged Indigenous population of 64,000 is calculated using the following data:
1. Aboriginal identity population (ages 5 to 19) in Ontario is 78,000 (Statistics Canada, NHS Aboriginal Population Profile, Ontario, 2011).
2. Excluding the number of students living on reserve and attending First Nation–operated schools in Ontario, which is approximately 14,000 (Aboriginal Affairs and Northern Development Canada, nominal roll, 2011–12).
• Using the estimate of the school-aged population, the ministry can measure progress in collecting Indigenous student self-identification data by calculating the percentage of school-aged Indigenous students who self-identified in a given school year.
7
Student Self-Id
entification
• The ministry has used the same estimated school-aged Indigenous population as the basis to measure progress in self-identification from 2011–12 to 2015–16. A new estimate of the school-aged Indigenous population will be calculated on the basis of 2016 Census data to measure progress for 2016–17 and future years.
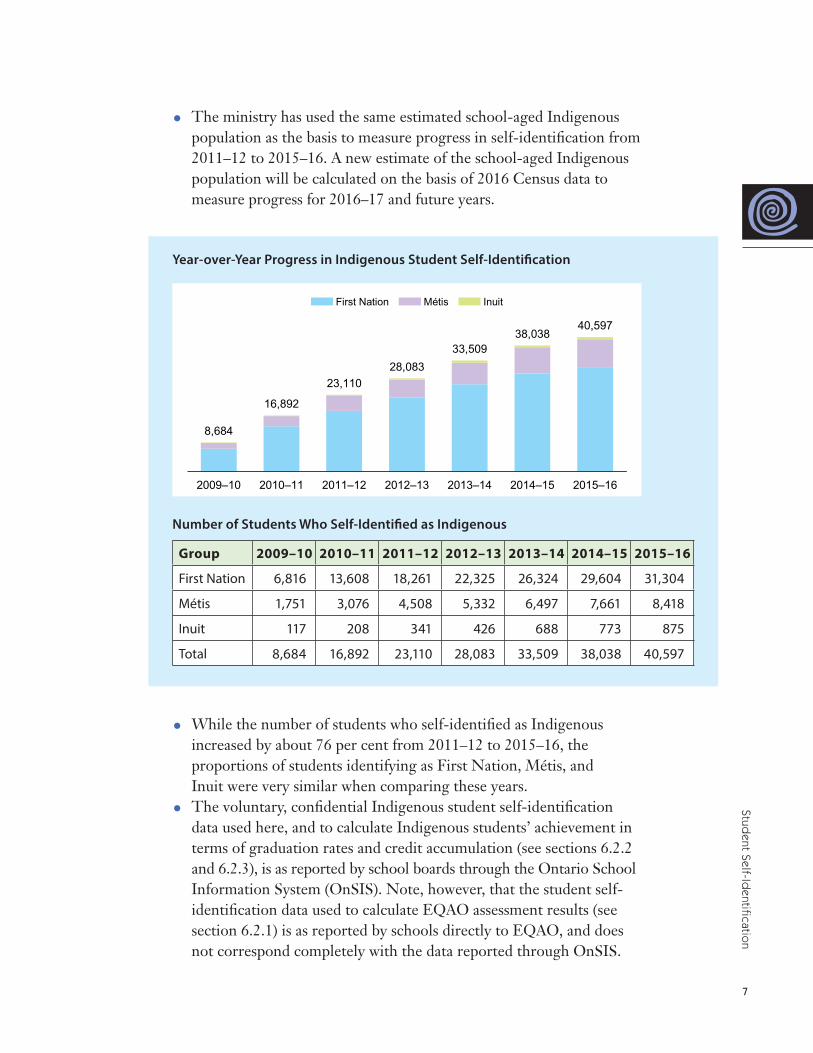
Year-over-Year Progress in Indigenous Student Self-Identification
Number of Students Who Self-Identified as Indigenous
Group 2009–10 2010–11 2011–12 2012–13 2013–14 2014–15 2015–16
First Nation 6,816 13,608 18,261 22,325 26,324 29,604 31,304
Métis 1,751 3,076 4,508 5,332 6,497 7,661 8,418
Inuit 117 208 341 426 688 773 875
Total 8,684 16,892 23,110 28,083 33,509 38,038 40,597
• While the number of students who self-identified as Indigenous increased by about 76 per cent from 2011–12 to 2015–16, the proportions of students identifying as First Nation, Métis, and Inuit were very similar when comparing these years.
• The voluntary, confidential Indigenous student self-identification data used here, and to calculate Indigenous students’ achievement in terms of graduation rates and credit accumulation (see sections 6.2.2 and 6.2.3), is as reported by school boards through the Ontario School Information System (OnSIS). Note, however, that the student self- identification data used to calculate EQAO assessment results (see section 6.2.1) is as reported by schools directly to EQAO, and does not correspond completely with the data reported through OnSIS.
8
Stre
ngth
enin
g O
ur L
earn
ing
Jour
ney:
Tec
hnic
al A
pp
end
ix
Section 6.2.1 – Student Achievement Results in Reading, Writing, and Mathematics
Performance Measures
• Significant increase in the percentage of First Nation, Métis, and Inuit students meeting provincial standards on province-wide assessments in reading, writing, and mathematics
• Significant increase in the graduation rate of First Nation, Métis, and Inuit students
• Significant improvement in First Nation, Métis, and Inuit student achievement
In Strengthening Our Learning Journey, the ministry is reporting the results of the following EQAO (Education Quality and Accountability Office) assessments for the years 2011–12 to 2015–16 for the English- and French-language systems:
• Grade 3 – Reading, Writing, and Mathematics• Grade 6 – Reading, Writing, and Mathematics• Grade 9 – Academic and Applied Mathematics• Grade 10 – Ontario Secondary School Literacy Test (OSSLT)
Notes about the data tables:
• EQAO assessment data is provided to the ministry by the Education Quality and Accountability Office in student-level files, and is not available in the aggregate. The results reported here for “all students” may therefore vary from the EQAO’s published provincial results.
• Grade 3, 6, and 9 assessment results are not included for the English- language system for 2014–15, because, due to labour disruptions, not all schools participated in the assessments that year. Where results are not available for this reason, “EC”, for “exceptional circumstances”, is indicated.
• To protect individual privacy and ensure indicator reliability, the ministry applied its standard data-suppression rules. Any value representing fewer than 10 students, or a value that can be used to derive another cell with fewer than 10 students – for example, a total or percentage – is suppressed (indicated by “SP”). Where a cell in a table is blank, no student results were reported for the self-identified student group for the given indicator/category.
9
GRADE 3 READING
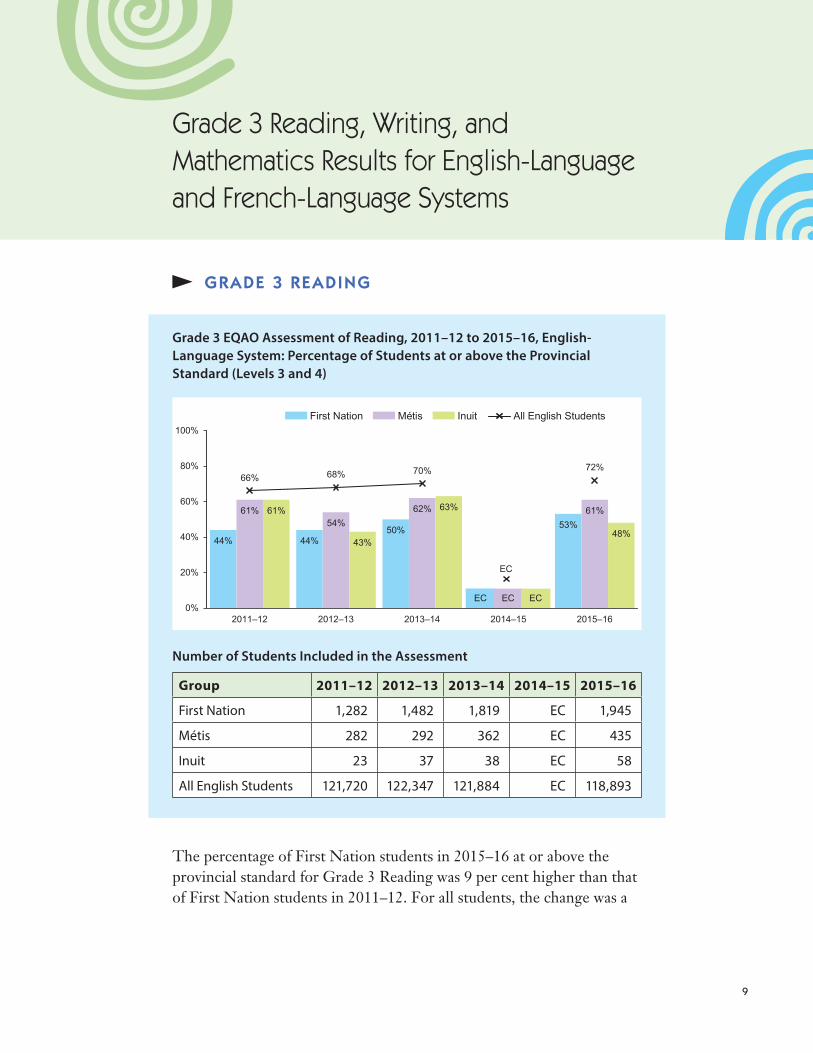
Grade 3 EQAO Assessment of Reading, 2011–12 to 2015–16, English-Language System: Percentage of Students at or above the Provincial Standard (Levels 3 and 4)
Number of Students Included in the Assessment
Group 2011–12 2012–13 2013–14 2014–15 2015–16
First Nation 1,282 1,482 1,819 EC 1,945
Métis 282 292 362 EC 435
Inuit 23 37 38 EC 58
All English Students 121,720 122,347 121,884 EC 118,893
The percentage of First Nation students in 2015–16 at or above the provincial standard for Grade 3 Reading was 9 per cent higher than that of First Nation students in 2011–12. For all students, the change was a
Grade 3 Reading, Writing, and Mathematics Results for English-Language and French-Language Systems
10
Stre
ngth
enin
g O
ur L
earn
ing
Jour
ney:
Tec
hnic
al A
pp
end
ix
6-per-cent increase. As a result, the achievement gap between First Nation students and all students has narrowed by 3 per cent as of 2015–16.
The percentage of Métis students in 2015–16 at or above the provincial standard for Grade 3 Reading was the same as that of Métis students in 2011–12. For all students, the change was a 6-per-cent increase. As a result, the achievement gap between Métis students and all students has widened by 6 per cent as of 2015–16.
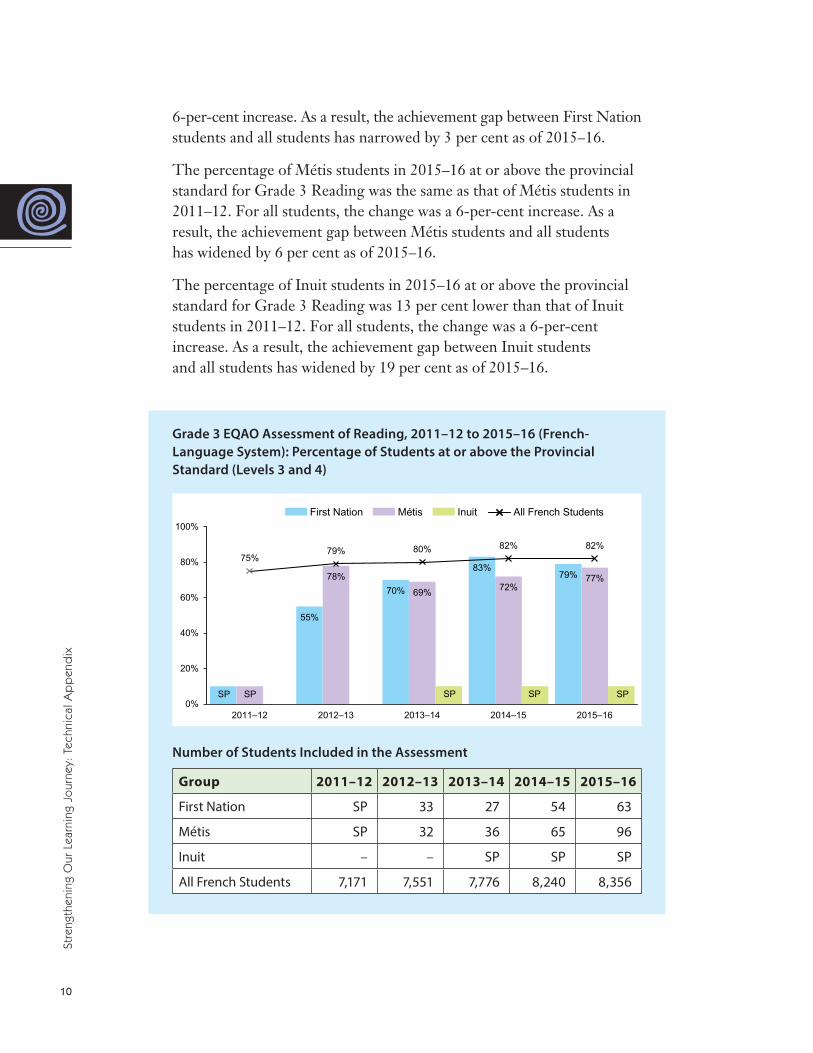
The percentage of Inuit students in 2015–16 at or above the provincial standard for Grade 3 Reading was 13 per cent lower than that of Inuit students in 2011–12. For all students, the change was a 6-per-cent increase. As a result, the achievement gap between Inuit students and all students has widened by 19 per cent as of 2015–16.
Grade 3 EQAO Assessment of Reading, 2011–12 to 2015–16 (French-Language System): Percentage of Students at or above the Provincial Standard (Levels 3 and 4)
Number of Students Included in the Assessment
Group 2011–12 2012–13 2013–14 2014–15 2015–16
First Nation SP 33 27 54 63
Métis SP 32 36 65 96
Inuit – – SP SP SP
All French Students 7,171 7,551 7,776 8,240 8,356

11
Grad
e 3 Reading
The percentage of First Nation students in 2015–16 at or above the provincial standard for Grade 3 Reading was 24 per cent higher than that of First Nation students in 2012–13. For all students, the change was a 3-per-cent increase over the same period. As a result, the achieve-ment gap between First Nation students and all students has narrowed by 21 per cent as of 2015–16.
The percentage of Métis students in 2015–16 at or above the provincial standard for Grade 3 Reading was 1 per cent lower than that of Métis students in 2012–13. For all students, the change was a 3-per-cent increase over the same period. As a result, the achievement gap between Métis students and all students has widened by 4 per cent as of 2015–16.
Results of the Grade 3 Reading assessments from 2013–14, 2014–15, and 2015–16 for Inuit students (French-language system) have been suppressed.
12
Stre
ngth
enin
g O
ur L
earn
ing
Jour
ney:
Tec
hnic
al A
pp
end
ix
GRADE 3 WRITING
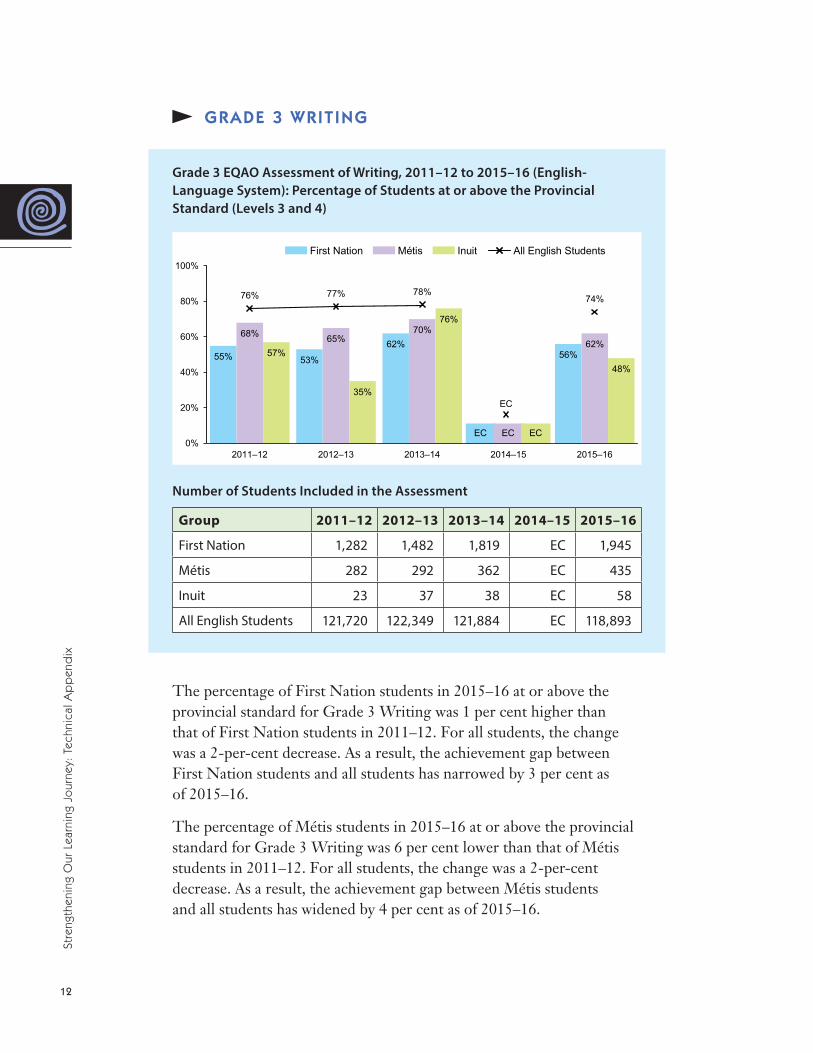
Grade 3 EQAO Assessment of Writing, 2011–12 to 2015–16 (English-Language System): Percentage of Students at or above the Provincial Standard (Levels 3 and 4)
Number of Students Included in the Assessment
Group 2011–12 2012–13 2013–14 2014–15 2015–16
First Nation 1,282 1,482 1,819 EC 1,945
Métis 282 292 362 EC 435
Inuit 23 37 38 EC 58
All English Students 121,720 122,349 121,884 EC 118,893
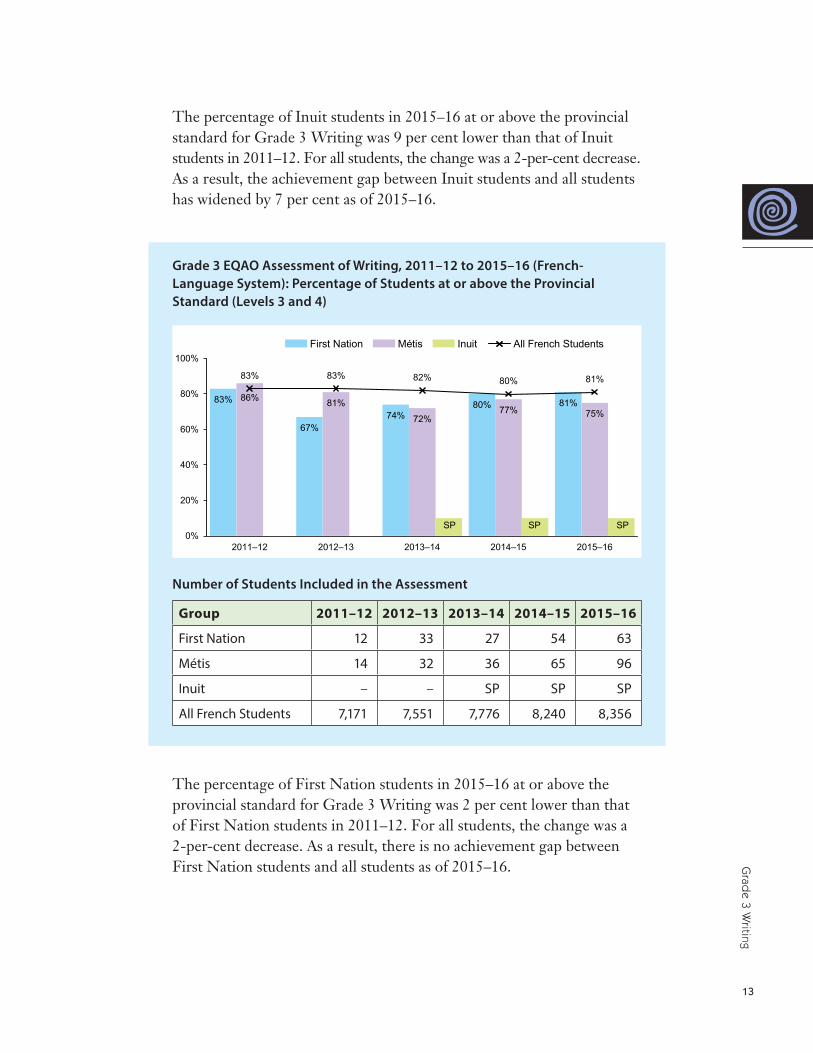
The percentage of First Nation students in 2015–16 at or above the provincial standard for Grade 3 Writing was 1 per cent higher than that of First Nation students in 2011–12. For all students, the change was a 2-per-cent decrease. As a result, the achievement gap between First Nation students and all students has narrowed by 3 per cent as of 2015–16.
The percentage of Métis students in 2015–16 at or above the provincial standard for Grade 3 Writing was 6 per cent lower than that of Métis students in 2011–12. For all students, the change was a 2-per-cent decrease. As a result, the achievement gap between Métis students and all students has widened by 4 per cent as of 2015–16.
13
Grad
e 3 Writing
The percentage of Inuit students in 2015–16 at or above the provincial standard for Grade 3 Writing was 9 per cent lower than that of Inuit students in 2011–12. For all students, the change was a 2-per-cent decrease. As a result, the achievement gap between Inuit students and all students has widened by 7 per cent as of 2015–16.
Grade 3 EQAO Assessment of Writing, 2011–12 to 2015–16 (French-Language System): Percentage of Students at or above the Provincial Standard (Levels 3 and 4)
Number of Students Included in the Assessment
Group 2011–12 2012–13 2013–14 2014–15 2015–16
First Nation 12 33 27 54 63
Métis 14 32 36 65 96
Inuit – – SP SP SP
All French Students 7,171 7,551 7,776 8,240 8,356
The percentage of First Nation students in 2015–16 at or above the provincial standard for Grade 3 Writing was 2 per cent lower than that of First Nation students in 2011–12. For all students, the change was a 2-per-cent decrease. As a result, there is no achievement gap between First Nation students and all students as of 2015–16.
14
Stre
ngth
enin
g O
ur L
earn
ing
Jour
ney:
Tec
hnic
al A
pp
end
ix
The percentage of Métis students in 2015–16 at or above the provincial standard for Grade 3 Writing was 11 per cent lower than that of Métis students in 2011–12. For all students, the change was a 2-per-cent decrease. As a result, the achievement gap between Métis students and all students has widened by 9 per cent as of 2015–16.
Results of the Grade 3 Writing assessments from 2013–14, 2014–15, and 2015–16 for Inuit students (French-language system) have been suppressed.
15
Grad
e 3 Mathem
atics
GRADE 3 MATHEMATICS
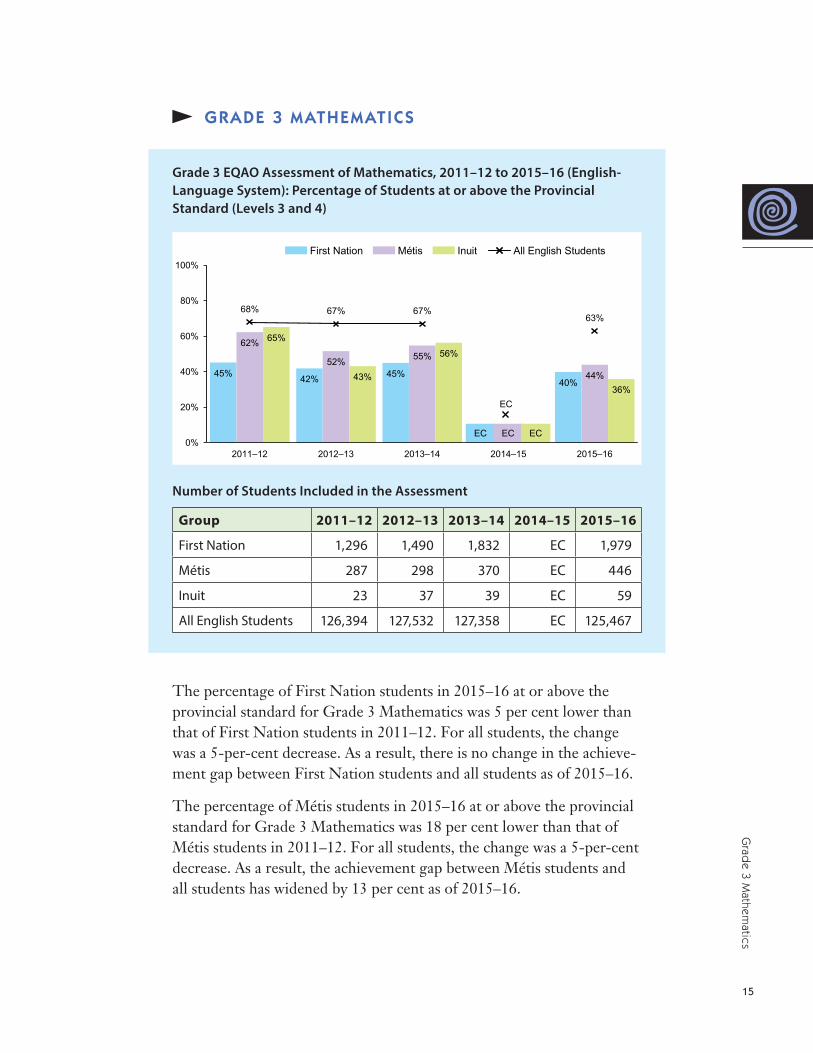
Grade 3 EQAO Assessment of Mathematics, 2011–12 to 2015–16 (English-Language System): Percentage of Students at or above the Provincial Standard (Levels 3 and 4)
Number of Students Included in the Assessment
Group 2011–12 2012–13 2013–14 2014–15 2015–16
First Nation 1,296 1,490 1,832 EC 1,979
Métis 287 298 370 EC 446
Inuit 23 37 39 EC 59
All English Students 126,394 127,532 127,358 EC 125,467
The percentage of First Nation students in 2015–16 at or above the provincial standard for Grade 3 Mathematics was 5 per cent lower than that of First Nation students in 2011–12. For all students, the change was a 5-per-cent decrease. As a result, there is no change in the achieve-ment gap between First Nation students and all students as of 2015–16.
The percentage of Métis students in 2015–16 at or above the provincial standard for Grade 3 Mathematics was 18 per cent lower than that of Métis students in 2011–12. For all students, the change was a 5-per-cent decrease. As a result, the achievement gap between Métis students and all students has widened by 13 per cent as of 2015–16.
16
Stre
ngth
enin
g O
ur L
earn
ing
Jour
ney:
Tec
hnic
al A
pp
end
ix
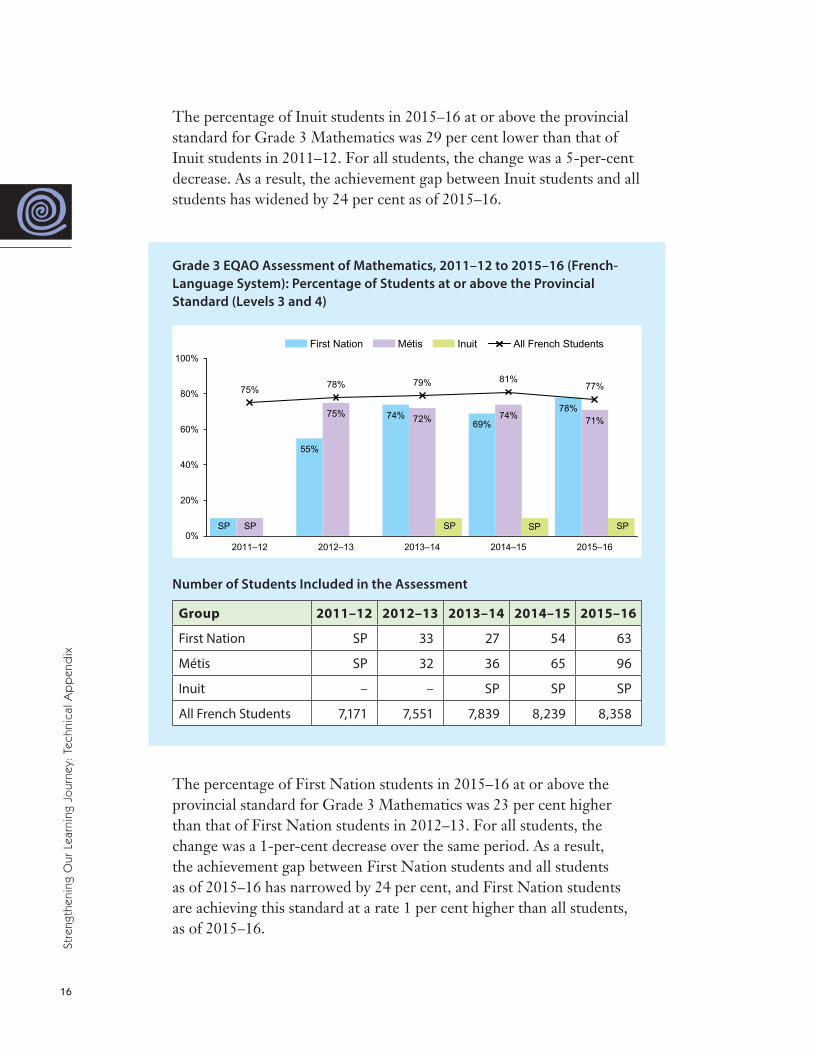
The percentage of Inuit students in 2015–16 at or above the provincial standard for Grade 3 Mathematics was 29 per cent lower than that of Inuit students in 2011–12. For all students, the change was a 5-per-cent decrease. As a result, the achievement gap between Inuit students and all students has widened by 24 per cent as of 2015–16.
Grade 3 EQAO Assessment of Mathematics, 2011–12 to 2015–16 (French-Language System): Percentage of Students at or above the Provincial Standard (Levels 3 and 4)
Number of Students Included in the Assessment
Group 2011–12 2012–13 2013–14 2014–15 2015–16
First Nation SP 33 27 54 63
Métis SP 32 36 65 96
Inuit – – SP SP SP
All French Students 7,171 7,551 7,839 8,239 8,358
The percentage of First Nation students in 2015–16 at or above the provincial standard for Grade 3 Mathematics was 23 per cent higher than that of First Nation students in 2012–13. For all students, the change was a 1-per-cent decrease over the same period. As a result, the achievement gap between First Nation students and all students as of 2015–16 has narrowed by 24 per cent, and First Nation students are achieving this standard at a rate 1 per cent higher than all students, as of 2015–16.
17
Grad
e 3 Mathem
atics
The percentage of Métis students in 2015–16 at or above the provincial standard for Grade 3 Mathematics was 4 per cent lower than that of Métis students in 2012–13. For all students, the change was a 1-per-cent decrease over the same period. As a result, the achievement gap between Métis students and all students has widened by 3 per cent as of 2015–16.
Results of the Grade 3 Mathematics assessments from 2013–14, 2014–15, and 2015–16 for Inuit students have been suppressed.
18
GRADE 6 READING
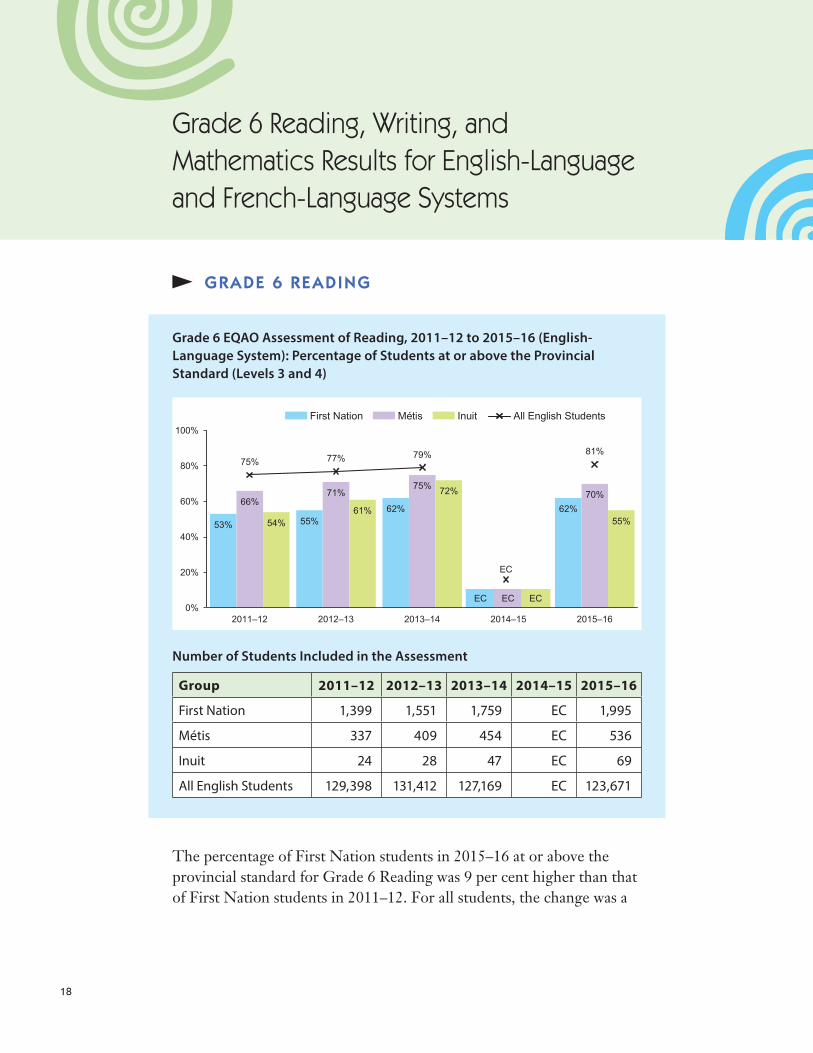
Grade 6 EQAO Assessment of Reading, 2011–12 to 2015–16 (English-Language System): Percentage of Students at or above the Provincial Standard (Levels 3 and 4)
Number of Students Included in the Assessment
Group 2011–12 2012–13 2013–14 2014–15 2015–16
First Nation 1,399 1,551 1,759 EC 1,995
Métis 337 409 454 EC 536
Inuit 24 28 47 EC 69
All English Students 129,398 131,412 127,169 EC 123,671
The percentage of First Nation students in 2015–16 at or above the provincial standard for Grade 6 Reading was 9 per cent higher than that of First Nation students in 2011–12. For all students, the change was a
Grade 6 Reading, Writing, and Mathematics Results for English-Language and French-Language Systems
19
Grad
e 6 Reading
6-per-cent increase. As a result, the achievement gap between First Nation students and all students has narrowed by 3 per cent as of 2015–16.
The percentage of Métis students in 2015–16 at or above the provincial standard for Grade 6 Reading was 4 per cent higher than that of Métis students in 2011–12. For all students, the change was a 6-per-cent increase. As a result, the achievement gap between Métis students and all students has widened by 2 per cent as of 2015–16.
The percentage of Inuit students in 2015–16 at or above the provincial standard for Grade 6 Reading was 1 per cent higher than that of Inuit students in 2011–12. For all students, the change was a 6-per-cent increase. As a result, the achievement gap between Inuit students and all students has widened by 5 per cent as of 2015–16.
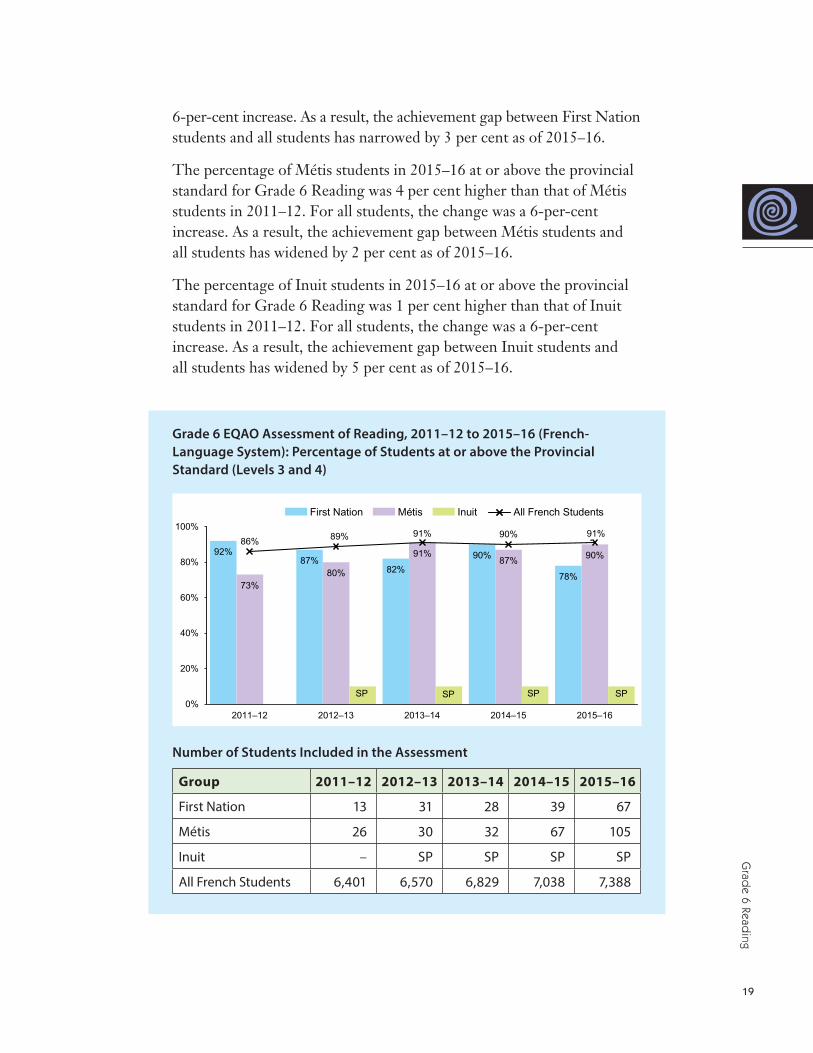
Grade 6 EQAO Assessment of Reading, 2011–12 to 2015–16 (French-Language System): Percentage of Students at or above the Provincial Standard (Levels 3 and 4)
Number of Students Included in the Assessment
Group 2011–12 2012–13 2013–14 2014–15 2015–16
First Nation 13 31 28 39 67
Métis 26 30 32 67 105
Inuit – SP SP SP SP
All French Students 6,401 6,570 6,829 7,038 7,388
20
Stre
ngth
enin
g O
ur L
earn
ing
Jour
ney:
Tec
hnic
al A
pp
end
ix
The percentage of First Nation students in 2015–16 at or above the provincial standard for Grade 6 Reading was 14 per cent lower than that of First Nation students in 2011–12. For all students, the change was a 5-per-cent increase. As a result, the achievement gap between First Nation students and all students has widened by 19 per cent as of 2015–16.
The percentage of Métis students in 2015–16 at or above the provincial standard for Grade 6 Reading was 17 per cent higher than that of Métis students in 2011–12. For all students, the change was a 5-per-cent increase. As a result, the achievement gap between Métis students and all students has narrowed by 12 per cent as of 2015–16.
Results of the Grade 6 Reading assessments from 2012–13, 2013–14, 2014–15, and 2015–16 for Inuit students have been suppressed.
21
Grad
e 6 Writing
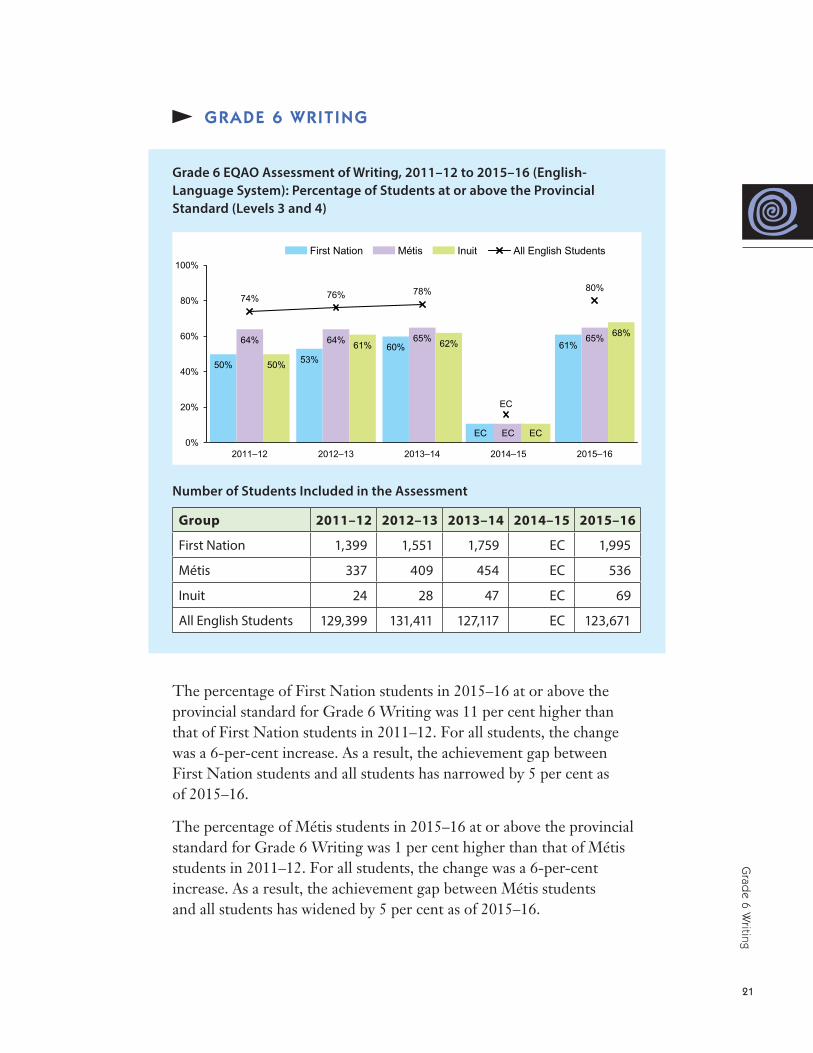
GRADE 6 WRITING
Grade 6 EQAO Assessment of Writing, 2011–12 to 2015–16 (English-Language System): Percentage of Students at or above the Provincial Standard (Levels 3 and 4)
Number of Students Included in the Assessment
Group 2011–12 2012–13 2013–14 2014–15 2015–16
First Nation 1,399 1,551 1,759 EC 1,995
Métis 337 409 454 EC 536
Inuit 24 28 47 EC 69
All English Students 129,399 131,411 127,117 EC 123,671
The percentage of First Nation students in 2015–16 at or above the provincial standard for Grade 6 Writing was 11 per cent higher than that of First Nation students in 2011–12. For all students, the change was a 6-per-cent increase. As a result, the achievement gap between First Nation students and all students has narrowed by 5 per cent as of 2015–16.
The percentage of Métis students in 2015–16 at or above the provincial standard for Grade 6 Writing was 1 per cent higher than that of Métis students in 2011–12. For all students, the change was a 6-per-cent increase. As a result, the achievement gap between Métis students and all students has widened by 5 per cent as of 2015–16.
22
Stre
ngth
enin
g O
ur L
earn
ing
Jour
ney:
Tec
hnic
al A
pp
end
ix
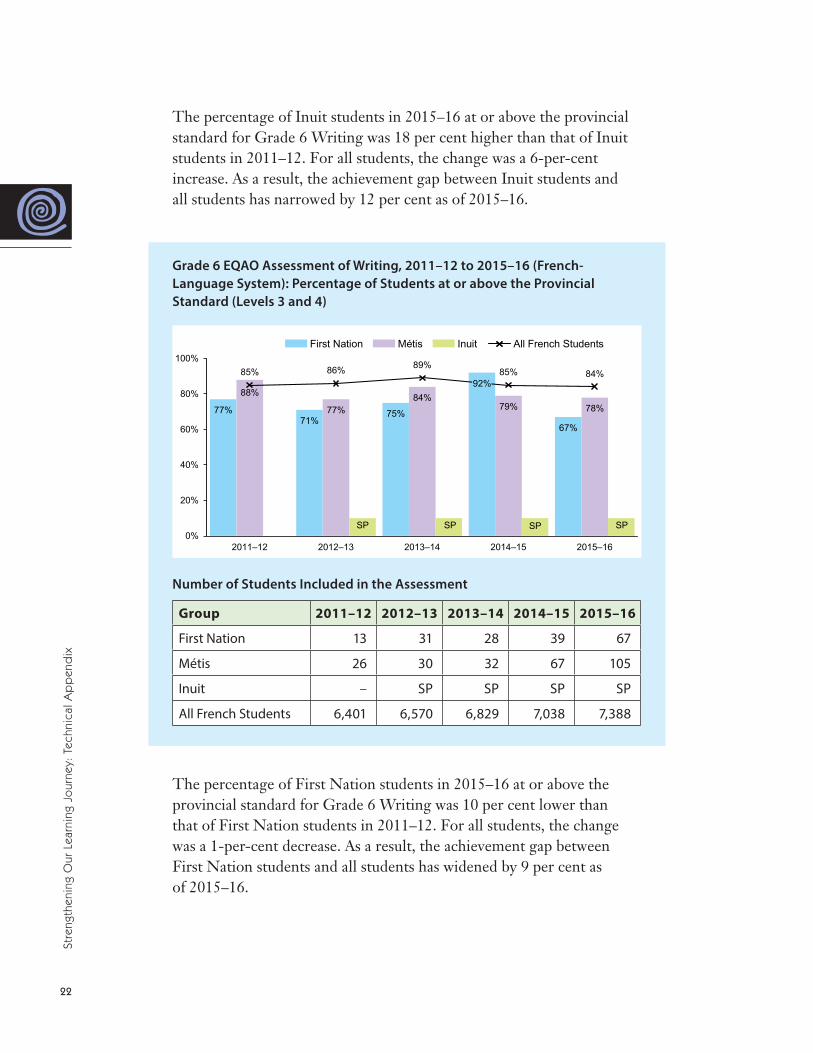
The percentage of Inuit students in 2015–16 at or above the provincial standard for Grade 6 Writing was 18 per cent higher than that of Inuit students in 2011–12. For all students, the change was a 6-per-cent increase. As a result, the achievement gap between Inuit students and all students has narrowed by 12 per cent as of 2015–16.
Grade 6 EQAO Assessment of Writing, 2011–12 to 2015–16 (French-Language System): Percentage of Students at or above the Provincial Standard (Levels 3 and 4)
Number of Students Included in the Assessment
Group 2011–12 2012–13 2013–14 2014–15 2015–16
First Nation 13 31 28 39 67
Métis 26 30 32 67 105
Inuit – SP SP SP SP
All French Students 6,401 6,570 6,829 7,038 7,388
The percentage of First Nation students in 2015–16 at or above the provincial standard for Grade 6 Writing was 10 per cent lower than that of First Nation students in 2011–12. For all students, the change was a 1-per-cent decrease. As a result, the achievement gap between First Nation students and all students has widened by 9 per cent as of 2015–16.
23
Grad
e 6 Writing
The percentage of Métis students in 2015–16 at or above the provincial standard for Grade 6 Writing was 10 per cent lower than that of Métis students in 2011–12. For all students, the change was a 1-per-cent decrease. As a result, the achievement gap between Métis students and all students has widened by 9 per cent as of 2015–16.
Results of the Grade 6 Writing assessments from 2012–13, 2013–14, 2014–15, and 2015–16 for Inuit students have been suppressed.

24
Stre
ngth
enin
g O
ur L
earn
ing
Jour
ney:
Tec
hnic
al A
pp
end
ix
GRADE 6 MATHEMATICS
Grade 6 EQAO Assessment of Mathematics, 2011–12 to 2015–16 (English-Language System): Percentage of Students at or above the Provincial Standard (Levels 3 and 4)
Number of Students Included in the Assessment
Group 2011–12 2012–13 2013–14 2014–15 2015–16
First Nation 1,399 1,549 1,760 EC 1,994
Métis 337 409 454 EC 536
Inuit SP SP 47 EC 69
All English Students 129,348 131,439 127,156 EC 123,645
The percentage of First Nation students in 2015–16 at or above the provincial standard for Grade 6 Mathematics was 8 per cent lower than that of First Nation students in 2011–12. For all students, the change was an 8-per-cent decrease. As a result, there is no change in the achievement gap between First Nation students and all students as of 2015–16.
The percentage of Métis students in 2015–16 at or above the provincial standard for Grade 6 Mathematics was 10 per cent lower than that of Métis students in 2011–12. For all students, the change was an 8-per-cent decrease. As a result, the achievement gap between Métis students and all students has widened by 2 per cent as of 2015–16.
25
Grad
e 6 Mathem
atics
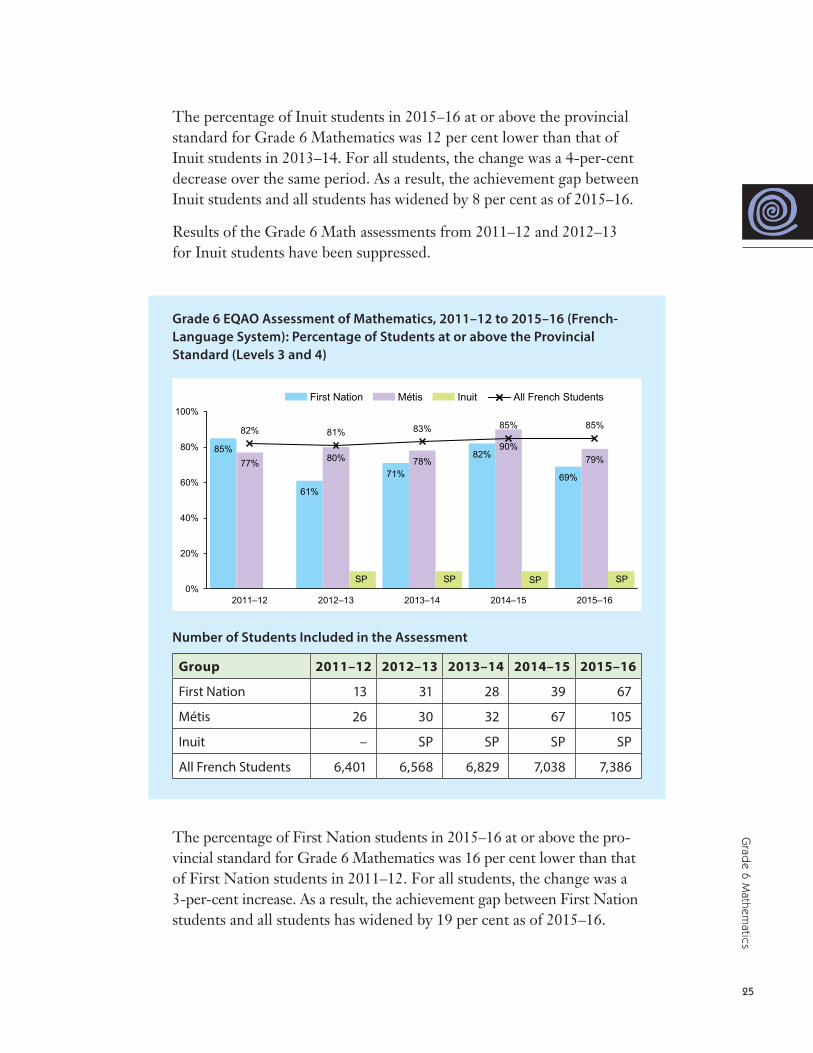
The percentage of Inuit students in 2015–16 at or above the provincial standard for Grade 6 Mathematics was 12 per cent lower than that of Inuit students in 2013–14. For all students, the change was a 4-per-cent decrease over the same period. As a result, the achievement gap between Inuit students and all students has widened by 8 per cent as of 2015–16.
Results of the Grade 6 Math assessments from 2011–12 and 2012–13 for Inuit students have been suppressed.
Grade 6 EQAO Assessment of Mathematics, 2011–12 to 2015–16 (French-Language System): Percentage of Students at or above the Provincial Standard (Levels 3 and 4)
Number of Students Included in the Assessment
Group 2011–12 2012–13 2013–14 2014–15 2015–16
First Nation 13 31 28 39 67
Métis 26 30 32 67 105
Inuit – SP SP SP SP
All French Students 6,401 6,568 6,829 7,038 7,386
The percentage of First Nation students in 2015–16 at or above the pro-vincial standard for Grade 6 Mathematics was 16 per cent lower than that of First Nation students in 2011–12. For all students, the change was a 3-per-cent increase. As a result, the achievement gap between First Nation students and all students has widened by 19 per cent as of 2015–16.
26
Stre
ngth
enin
g O
ur L
earn
ing
Jour
ney:
Tec
hnic
al A
pp
end
ix
The percentage of Métis students in 2015–16 at or above the provincial standard for Grade 6 Mathematics was 2 per cent higher than that of Métis students in 2011–12. For all students, the change was a 3-per-cent increase. As a result, the achievement gap between Métis students and all students has widened by 1 per cent as of 2015–16.
Results of the Grade 6 Math assessments from 2012–13, 2013–14, 2014–15, and 2015–16 for Inuit students have been suppressed.
27
GRADE 9 ACADEMIC MATHEMATICS
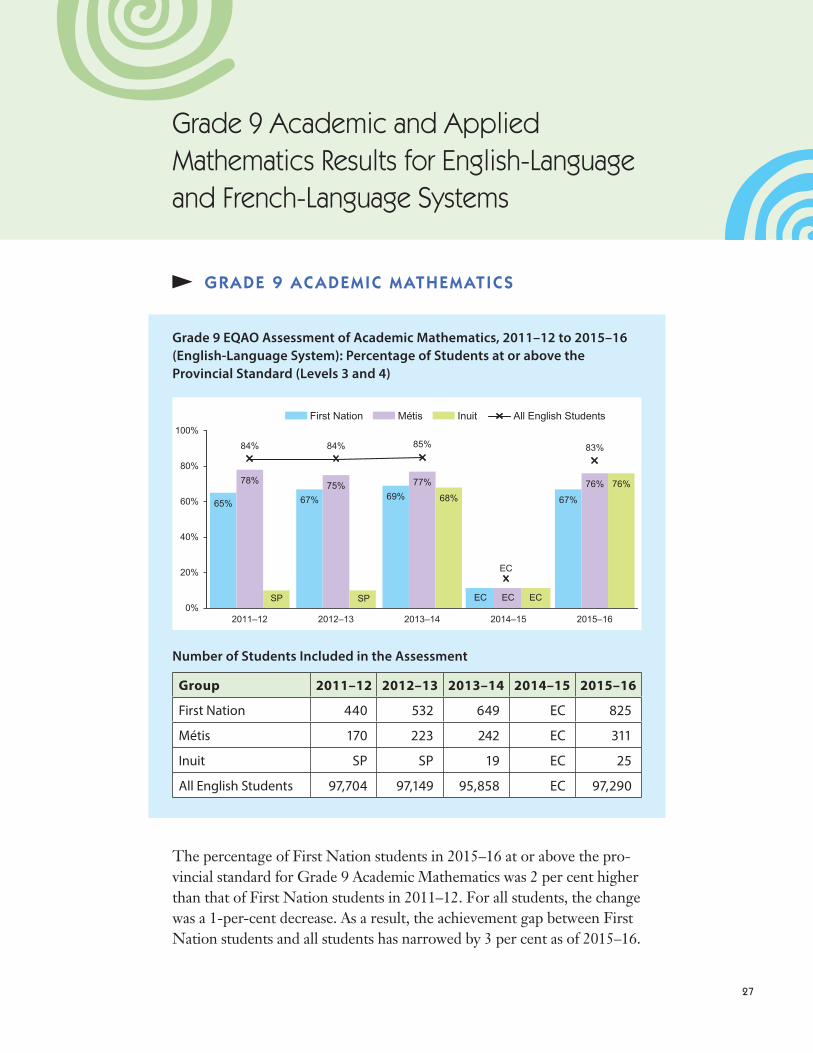
Grade 9 EQAO Assessment of Academic Mathematics, 2011–12 to 2015–16 (English-Language System): Percentage of Students at or above the Provincial Standard (Levels 3 and 4)
Number of Students Included in the Assessment
Group 2011–12 2012–13 2013–14 2014–15 2015–16
First Nation 440 532 649 EC 825
Métis 170 223 242 EC 311
Inuit SP SP 19 EC 25
All English Students 97,704 97,149 95,858 EC 97,290
The percentage of First Nation students in 2015–16 at or above the pro-vincial standard for Grade 9 Academic Mathematics was 2 per cent higher than that of First Nation students in 2011–12. For all students, the change was a 1-per-cent decrease. As a result, the achievement gap between First Nation students and all students has narrowed by 3 per cent as of 2015–16.
Grade 9 Academic and Applied Mathematics Results for English-Language and French-Language Systems
28
Stre
ngth
enin
g O
ur L
earn
ing
Jour
ney:
Tec
hnic
al A
pp
end
ix
The percentage of Métis students in 2015–16 at or above the provincial standard for Grade 9 Academic Mathematics was 2 per cent lower than Métis students in 2011–12. For all students, the change was a 1-per-cent decrease. As a result, the achievement gap between Métis students and all students has widened by 1 per cent as of 2015–16.
The percentage of Inuit students in 2015–16 at or above the provincial standard for Grade 9 Academic Mathematics was 8 per cent higher than that of Inuit students in 2013–14. For all students, the change was a 2-per-cent decrease over the same period. As a result, the achievement gap between Inuit students and all students has narrowed by 10 per cent as of 2015–16.
Results of the Grade 9 Academic Mathematics assessments from 2011–12 and 2012–13 for Inuit students have been suppressed.
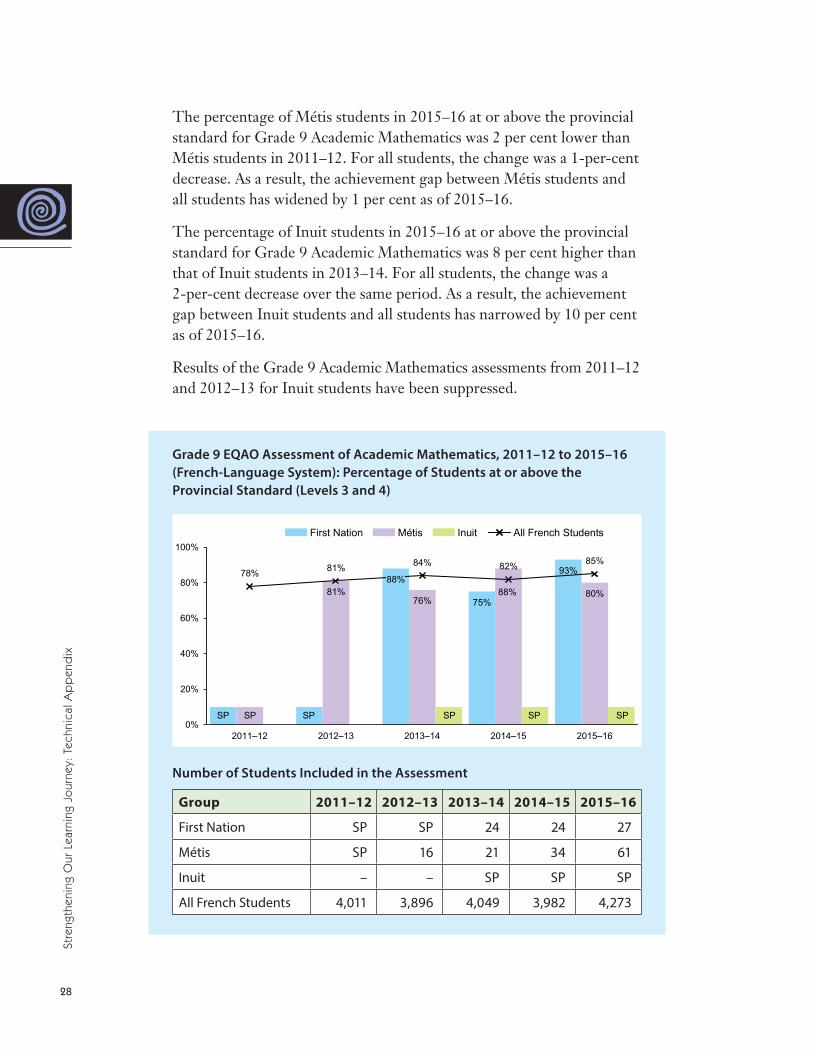
Grade 9 EQAO Assessment of Academic Mathematics, 2011–12 to 2015–16 (French-Language System): Percentage of Students at or above the Provincial Standard (Levels 3 and 4)
Number of Students Included in the Assessment
Group 2011–12 2012–13 2013–14 2014–15 2015–16
First Nation SP SP 24 24 27
Métis SP 16 21 34 61
Inuit – – SP SP SP
All French Students 4,011 3,896 4,049 3,982 4,273
29
Grad
e 9 Acad
emic M
athematics
The percentage of First Nation students in 2015–16 at or above the provincial standard for Grade 9 Academic Mathematics was 5 per cent higher than that of First Nation students in 2013–14. For all students, the change was a 1-per-cent increase over the same period. As a result, the achievement gap between First Nation students and all students has narrowed by 4 per cent as of 2015–16.
The percentage of Métis students in 2015–16 at or above the provincial standard for Grade 9 Academic Mathematics was 1 per cent lower than that of Métis students in 2012–13. For all students, the change was a 4-per-cent increase over the same period. As a result, the achievement gap between Métis students and all students has widened by 5 per cent as of 2015–16.
Results of the Grade 9 Academic Mathematics assessments from 2013–14, 2014–15, and 2015–16 for Inuit students have been suppressed.
30
Stre
ngth
enin
g O
ur L
earn
ing
Jour
ney:
Tec
hnic
al A
pp
end
ix
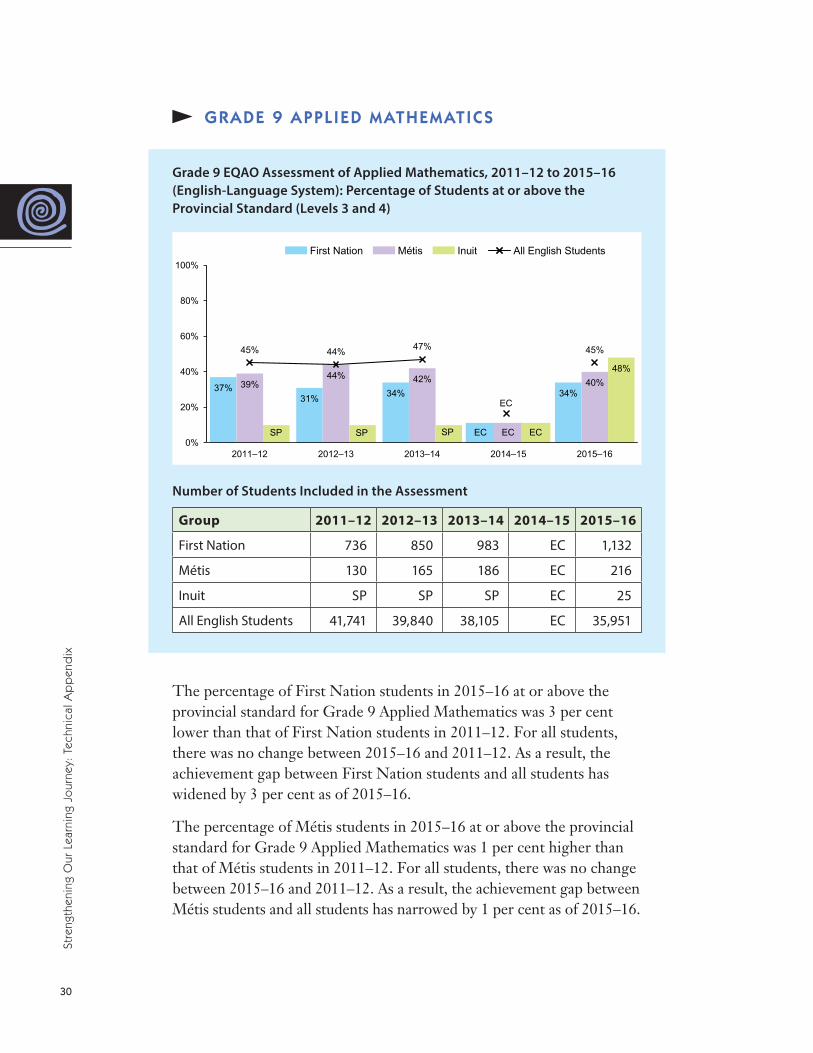
GRADE 9 APPLIED MATHEMATICS
Grade 9 EQAO Assessment of Applied Mathematics, 2011–12 to 2015–16 (English-Language System): Percentage of Students at or above the Provincial Standard (Levels 3 and 4)
Number of Students Included in the Assessment
Group 2011–12 2012–13 2013–14 2014–15 2015–16
First Nation 736 850 983 EC 1,132
Métis 130 165 186 EC 216
Inuit SP SP SP EC 25
All English Students 41,741 39,840 38,105 EC 35,951
The percentage of First Nation students in 2015–16 at or above the provincial standard for Grade 9 Applied Mathematics was 3 per cent lower than that of First Nation students in 2011–12. For all students, there was no change between 2015–16 and 2011–12. As a result, the achievement gap between First Nation students and all students has widened by 3 per cent as of 2015–16.
The percentage of Métis students in 2015–16 at or above the provincial standard for Grade 9 Applied Mathematics was 1 per cent higher than that of Métis students in 2011–12. For all students, there was no change between 2015–16 and 2011–12. As a result, the achievement gap between Métis students and all students has narrowed by 1 per cent as of 2015–16.
31
Grad
e 9 Ap
plied
Mathem
atics
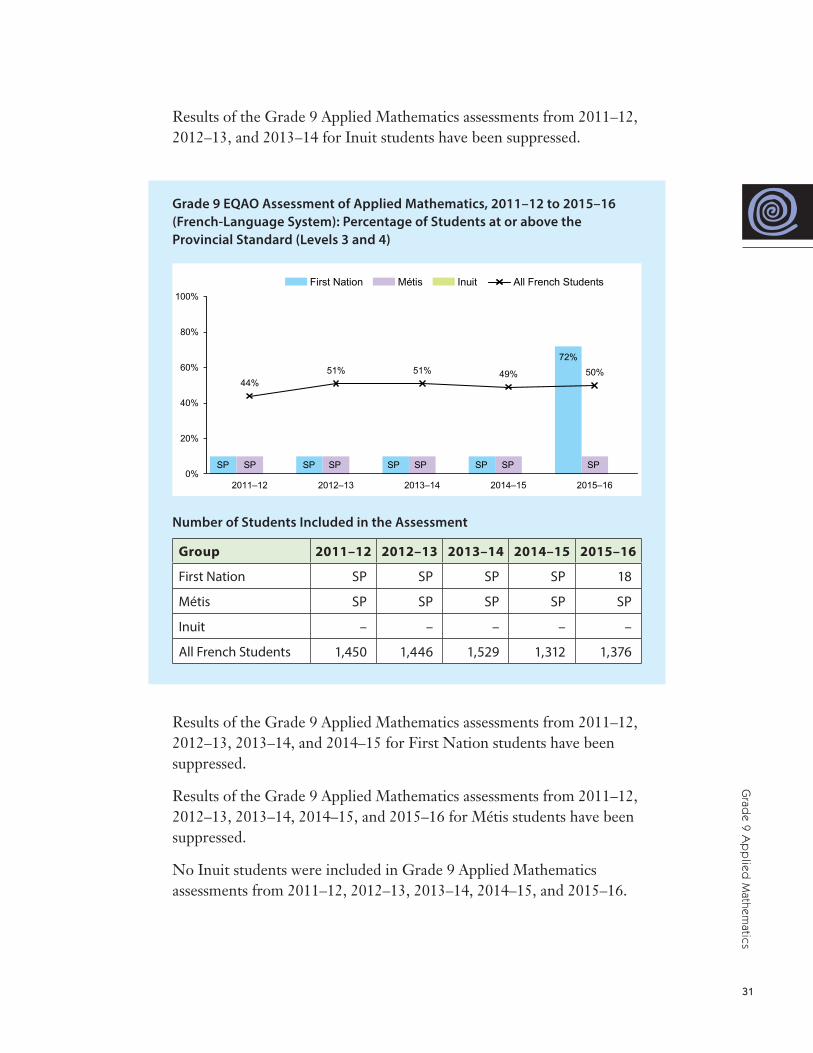
Results of the Grade 9 Applied Mathematics assessments from 2011–12, 2012–13, and 2013–14 for Inuit students have been suppressed.
Grade 9 EQAO Assessment of Applied Mathematics, 2011–12 to 2015–16 (French-Language System): Percentage of Students at or above the Provincial Standard (Levels 3 and 4)
Number of Students Included in the Assessment
Group 2011–12 2012–13 2013–14 2014–15 2015–16
First Nation SP SP SP SP 18
Métis SP SP SP SP SP
Inuit – – – – –
All French Students 1,450 1,446 1,529 1,312 1,376
Results of the Grade 9 Applied Mathematics assessments from 2011–12, 2012–13, 2013–14, and 2014–15 for First Nation students have been suppressed.
Results of the Grade 9 Applied Mathematics assessments from 2011–12, 2012–13, 2013–14, 2014–15, and 2015–16 for Métis students have been suppressed.
No Inuit students were included in Grade 9 Applied Mathematics assessments from 2011–12, 2012–13, 2013–14, 2014–15, and 2015–16.
32
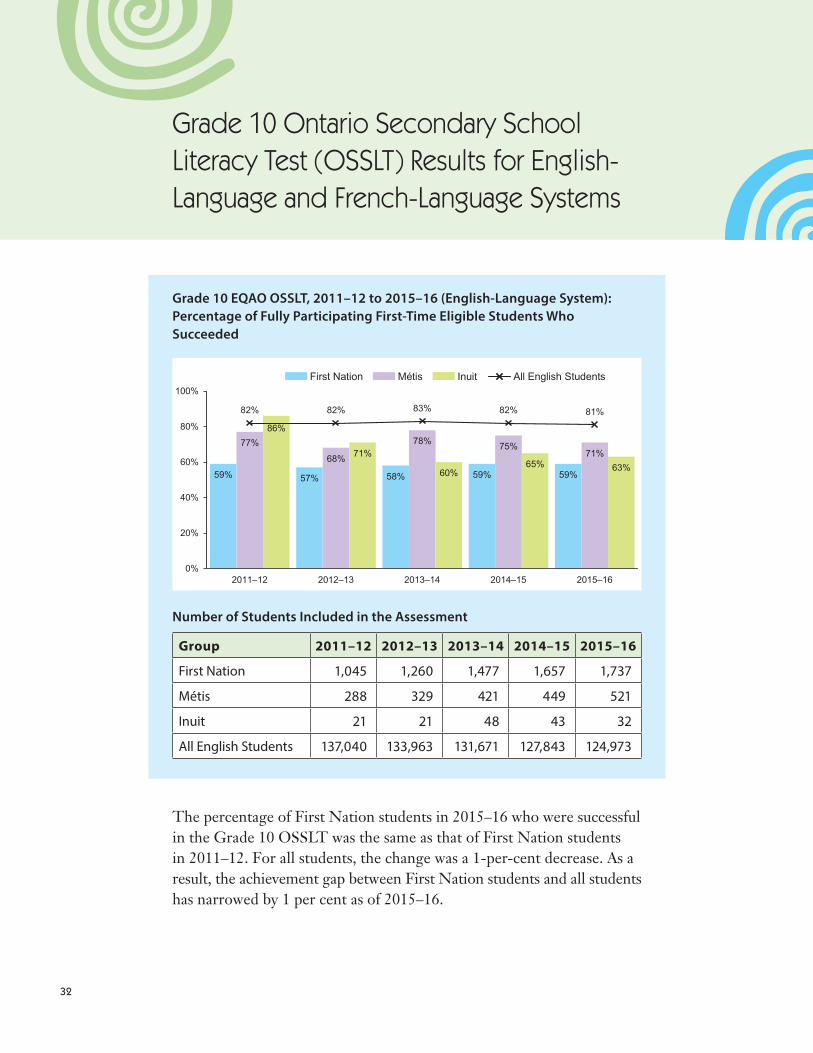
Grade 10 EQAO OSSLT, 2011–12 to 2015–16 (English-Language System): Percentage of Fully Participating First-Time Eligible Students Who Succeeded
Number of Students Included in the Assessment
Group 2011–12 2012–13 2013–14 2014–15 2015–16
First Nation 1,045 1,260 1,477 1,657 1,737
Métis 288 329 421 449 521
Inuit 21 21 48 43 32
All English Students 137,040 133,963 131,671 127,843 124,973
The percentage of First Nation students in 2015–16 who were successful in the Grade 10 OSSLT was the same as that of First Nation students in 2011–12. For all students, the change was a 1-per-cent decrease. As a result, the achievement gap between First Nation students and all students has narrowed by 1 per cent as of 2015–16.
Grade 10 Ontario Secondary School Literacy Test (OSSLT) Results for English- Language and French-Language Systems
33
Grad
e 10 OSSLT
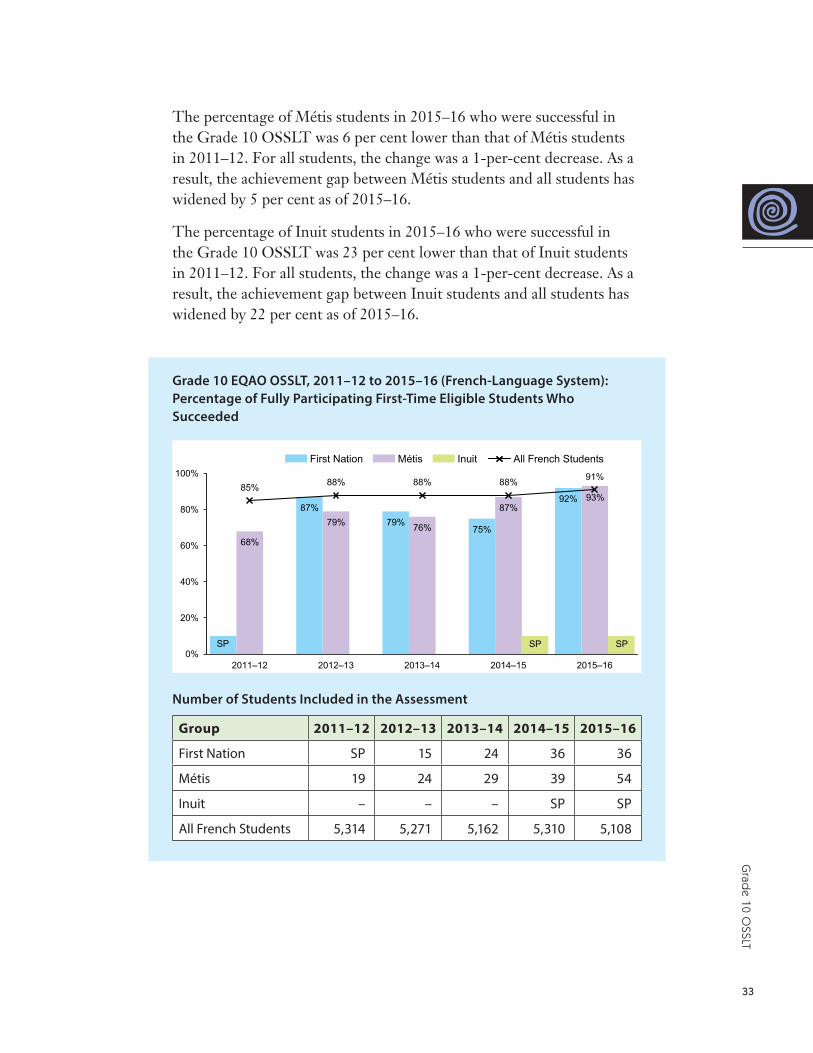
The percentage of Métis students in 2015–16 who were successful in the Grade 10 OSSLT was 6 per cent lower than that of Métis students in 2011–12. For all students, the change was a 1-per-cent decrease. As a result, the achievement gap between Métis students and all students has widened by 5 per cent as of 2015–16.
The percentage of Inuit students in 2015–16 who were successful in the Grade 10 OSSLT was 23 per cent lower than that of Inuit students in 2011–12. For all students, the change was a 1-per-cent decrease. As a result, the achievement gap between Inuit students and all students has widened by 22 per cent as of 2015–16.
Grade 10 EQAO OSSLT, 2011–12 to 2015–16 (French-Language System): Percentage of Fully Participating First-Time Eligible Students Who Succeeded
Number of Students Included in the Assessment
Group 2011–12 2012–13 2013–14 2014–15 2015–16
First Nation SP 15 24 36 36
Métis 19 24 29 39 54
Inuit – – – SP SP
All French Students 5,314 5,271 5,162 5,310 5,108
34
Stre
ngth
enin
g O
ur L
earn
ing
Jour
ney:
Tec
hnic
al A
pp
end
ix
The percentage of First Nation students in 2015–16 who were successful in the Grade 10 OSSLT was 5 per cent higher than that of First Nation students in 2012–13. For all students, the change was a 3-per-cent increase over the same period. As a result, the achievement gap between First Nation students and all students has narrowed by 2 per cent, and First Nation students are achieving OSSLT success at a 1-per-cent higher rate than all students as of 2015–16.
The percentage of Métis students in 2015–16 who were successful in the Grade 10 OSSLT was 25 per cent higher than that of Métis students in 2011–12. For all students, the change was a 6-per-cent increase. As a result, the achievement gap between Métis students and all students has narrowed by 19 per cent, and Métis students are achieving OSSLT success at a 2-per-cent higher rate than all students as of 2015–16.
Results of the Grade 10 OSSLT from 2014–15 and 2015–16 for Inuit students have been suppressed. No Inuit students were included in the Grade 10 OSSLT assessments in 2011–12, 2012–13, and 2013–14.
35
Analysing the Read
ing, Writing, and
Mathem
atics Results
Analysing the Reading, Writing, and Mathematics Results
Grade 6 Reading and Writing results have improved for First Nation, Métis, and Inuit students, and for all students in the English-language system, since the 2011–12 baseline year.
Generally, year over year, EQAO results for First Nation and Métis students were higher in the French-language system than in the English- language system. This is consistent with the trends comparing results for all English students and all French students.
For a few assessments, the achievement gaps between First Nation, Métis, or Inuit students and all students have narrowed, or in some instances even closed, as of the 2015–16 assessment. However, the achievement gaps for other assessments have widened in 2015–16 when compared to the 2011–12 baseline year (or the earliest year for which results are available). It is important to keep in mind, however, that from 2011–12 to 2015–16 there has also been a large increase in the number of Indigenous students who have self-identified. This context must be taken into account when interpreting achievement trends over time. Higher levels of student self-identification provide a more accurate picture of achievement results for Indigenous students, and a better basis for comparison going forward.
A comparison of results from 2011–12 (or from the earliest year for which results are available)3 and from 2015–16 reveals the following changes over time:
• For self-identified First Nation students, nine assessments (five in the English-language system, four in the French-language system) showed improvement;
• For self-identified Métis students, six assessments (three in the English-language system, three in the French-language system) showed improvement;
• For self-identified Inuit students, three assessments (in the English-language system) showed improvement.
3. For Inuit students in the English-language system and First Nation, Métis, and Inuit students in the French-language system, many assessment results were not available in 2011–12 and in some subsequent years (e.g., because of suppression or the absence of student results). The summaries of change in assessment results over time given above are based on com-parisons using the earliest year for which results were available for each assessment.
36
Stre
ngth
enin
g O
ur L
earn
ing
Jour
ney:
Tec
hnic
al A
pp
end
ix
EQAO Cohort Study
Data Used
• The data includes EQAO results for:• Grade 6 assessments in reading and writing;• the Grade 10 Ontario Secondary School Literacy Test (OSSLT).
• Results exclude cases where students wrote the Grade 6 and Grade 10 assessments in different languages. For example, a student who wrote the Grade 6 reading and writing assessments at an English-language board, but wrote the Grade 10 OSSLT assessment at a French- language board, would not be included.
• For cohort study results, only students who self-identified for the OSSLT assessment are included in the Grade 10 OSSLT results for First Nation, Métis, and Inuit students.
Results
• Generally, when tracking the 2011–12 baseline cohort’s achievement in literacy from Grade 6 to Grade 10, similar patterns appeared whether Grade 6 reading assessment results or Grade 6 writing assessment results were compared to later Grade 10 OSSLT success.
• In English-language boards, the proportions of students who did not meet the standard in Grade 6 and also did not succeed in Grade 10 were much higher for self-identified First Nation students (26 per cent for reading and 25 per cent for writing) than they were for all students (12 per cent for reading and 11 per cent for writing). Results for self-identified Métis students also show an achievement gap compared to all students – 18 per cent of Métis students who did not meet the standard in Grade 6 also failed to succeed in Grade 10 (the percentage was the same for reading and writing).
• In French-language boards, self-identified First Nation and Métis students had high levels of success in the reading and OSSLT assessments. Eighty-five per cent of First Nation students and 87 per cent of Métis students met the standard on the Grade 6 reading assessment and were successful on the Grade 10 OSSLT. These rates are equal to or higher than the rate for all students in French-language boards, which was 85 per cent. It should be noted
37
Analysing the Read
ing, Writing, and
Mathem
atics Results
that the results for Indigenous students in French-language boards reflect small groups of students – fewer than 100 self-identified Indigenous students were included in the French-language system comparison of Grade 6 Reading and Grade 10 OSSLT.
• In French-language boards, self-identified First Nation and Métis students had high levels of success in the writing and OSSLT assess-ments. Eighty-two per cent of First Nation students and 72 per cent of Métis students met the standard on the Grade 6 writing assess-ment and were successful on the Grade 10 OSSLT. Eighty-two per cent of all students in French-language boards met the standard on the Grade 6 writing assessment and were successful on the Grade 10 OSSLT. Again, it should be noted that the results for Indigenous students in French-language boards reflect small groups of students – fewer than 100 self-identified Indigenous students were included in the French-language system comparison of Grade 6 Writing and Grade 10 OSSLT.
• In most cases, results for self-identified Inuit students cannot be reported, because of the small number of self-identified Inuit students included in the study.
38
Stre
ngth
enin
g O
ur L
earn
ing
Jour
ney:
Tec
hnic
al A
pp
end
ix
Section 6.2.2 – Graduation Rate of First Nation, Métis, and Inuit Students
Performance Measure
• Significant increase in the graduation rate of First Nation, Métis, and Inuit students
In this third progress report, the Ministry of Education is, for the first time, releasing four-year and five-year graduation rates for self-identified Indigenous students, as it committed to do in A Solid Foundation: Second Progress Report on the Implementation of the Ontario First Nation, Métis, and Inuit Education Policy Framework, 2013.
Ontario calculates the graduation rate based on each group of students (or cohort) that enters Grade 9 in Ontario in a given year. The percent-age of the original Grade 9 cohort to receive a diploma within four years is the reported four-year graduation rate, and the percentage of the orig-inal Grade 9 cohort to receive a diploma within five years is the reported five-year graduation rate.
The general formula for the cohort graduation rate is:
4-Year Graduation Rate = Number of Graduates from Grade 9 Cohort within 4 years
Number of Students in Grade 9 Cohort
5-Year Graduation Rate = Number of Graduates from Grade 9 Cohort within 5 years
Number of Students in Grade 9 Cohort
39
Grad
uation Rate
To be included in the graduation cohort, students must be:
• 13, 14, or 15 years old as of December 31;• in Grade 9;• in their first year of registration at a secondary school in Ontario;• enrolled any time during the academic year;• enrolled in a publicly funded day school;• enrolled in a public or Roman Catholic district school board.
The graduation rates for First Nation, Métis, and Inuit students have been calculated and reported separately, consistent with reporting of progress related to other student achievement measures.
In keeping with the principles of voluntary self-identification, and to ensure data quality and coverage, the ministry established a cohort of self-identified First Nation, Métis, and Inuit students, using the 2011–12 Grade 9 cohort, in order to calculate provincial four-year and five-year graduation rates for 2015–16. (This approach also aligns with setting 2011–12 as the baseline year.)
To calculate the four-year and five-year graduation rates for First Nation, Métis, and Inuit students, the ministry used the following criteria:
• Grade 9 cohort of 2011–12; any cohort students who are deceased or who left Ontario within four or five years of Grade 9 are excluded from the calculations
• four-year rate – percentage of students earning a diploma within four years, by the end of the 2014–15 school year
• five-year rate – percentage of students earning a diploma within five years, by the end of the 2015–16 school year
• students who self-identified as First Nation, Métis, or Inuit, as reported by school boards through the Ontario School Information System (OnSIS), including students who self-identified in their final enrolment record for secondary school (i.e., October, March, or June OnSIS data submission) up to the 2015–16 school year
• the students described above are a subset of Ontario’s graduation-rate cohort for all students
40
Stre
ngth
enin
g O
ur L
earn
ing
Jour
ney:
Tec
hnic
al A
pp
end
ix
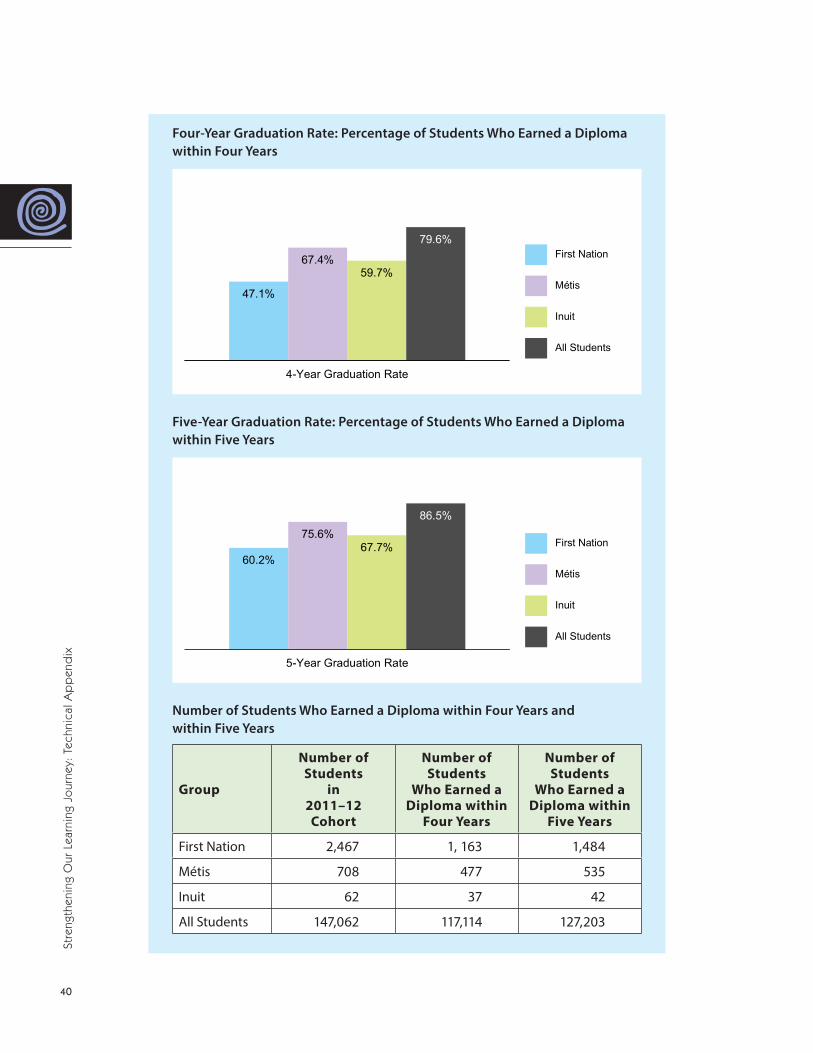
Four-Year Graduation Rate: Percentage of Students Who Earned a Diploma within Four Years
Five-Year Graduation Rate: Percentage of Students Who Earned a Diploma within Five Years
Number of Students Who Earned a Diploma within Four Years and within Five Years
Group
Number of Students
in 2011–12 Cohort
Number of Students
Who Earned a Diploma within
Four Years
Number of Students
Who Earned a Diploma within
Five Years
First Nation 2,467 1, 163 1,484
Métis 708 477 535
Inuit 62 37 42
All Students 147,062 117,114 127,203
41
Grad
uation Rate
The four-year (47.1 per cent) and five-year (60.2 per cent) graduation rates for First Nation students have the widest achievement gap in com-parison to the provincial four-year (79.6 per cent) and five-year (86.5 per cent) rates for all students. The four-year graduation rate achievement gap for First Nation students is 32.5 per cent, while the five-year gradu-ation rate achievement gap is 26.3 per cent.
The four-year (67.4 per cent) and five-year (75.6 per cent) graduation rates for Métis students have the narrowest achievement gap in compar-ison to the provincial four-year (79.6 per cent) and five-year (86.5 per cent) rates for all students. The four-year graduation rate achievement gap for Métis students is 12.2 per cent, while the five-year graduation rate achievement gap is 10.9 per cent.
The four-year (59.7 per cent) and five-year (67.7 per cent) graduation rates for Inuit students also represent an achievement gap in comparison to the provincial four-year (79.6 per cent) and five-year (86.5 per cent) rates for all students. The four-year graduation rate achievement gap for Inuit students is 19.9 per cent, while the five-year graduation rate achievement gap is 18.8 per cent. As for all student achievement indica-tors, the self-identified Inuit student population within the graduation cohort is very small. For the 2011–12 baseline graduation-rate cohort, a total of 62 students self-identified as Inuit. It is important to use caution in interpreting results that represent small groups of students.
42
Stre
ngth
enin
g O
ur L
earn
ing
Jour
ney:
Tec
hnic
al A
pp
end
ix
Section 6.2.3 – Credit Accumulation as an Indicator of Student Achievement
Performance Measure
• Significant improvement in First Nation, Métis, and Inuit student achievement
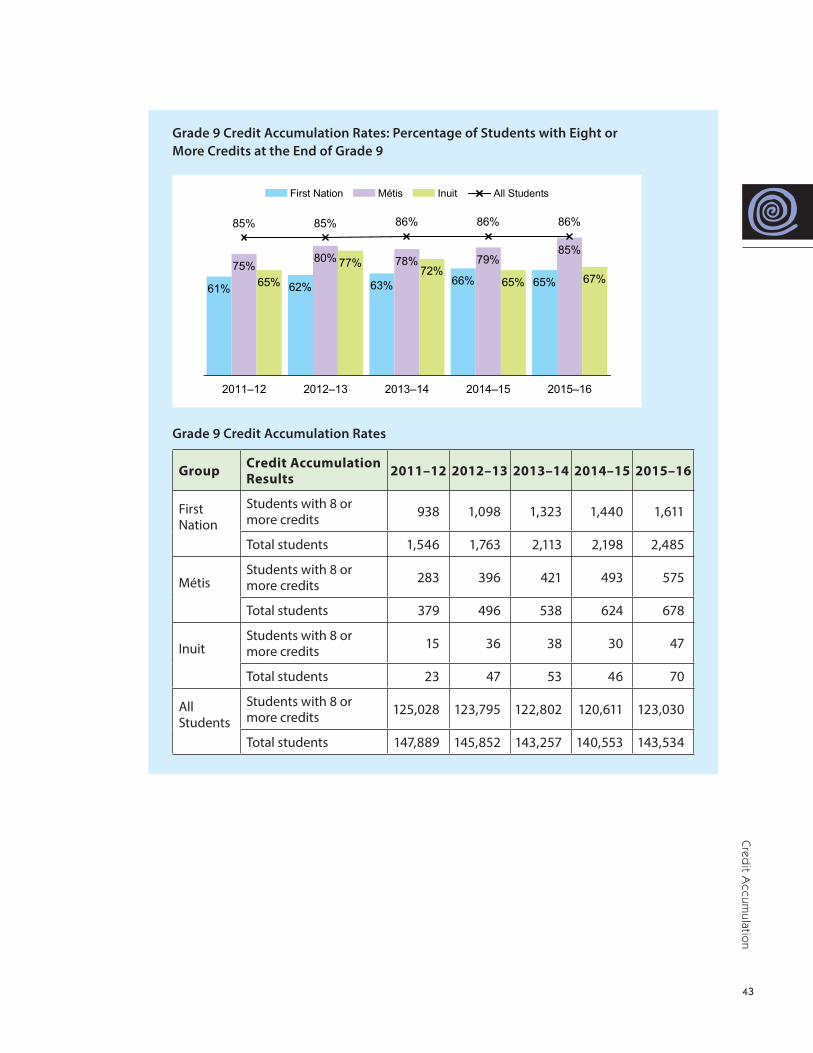
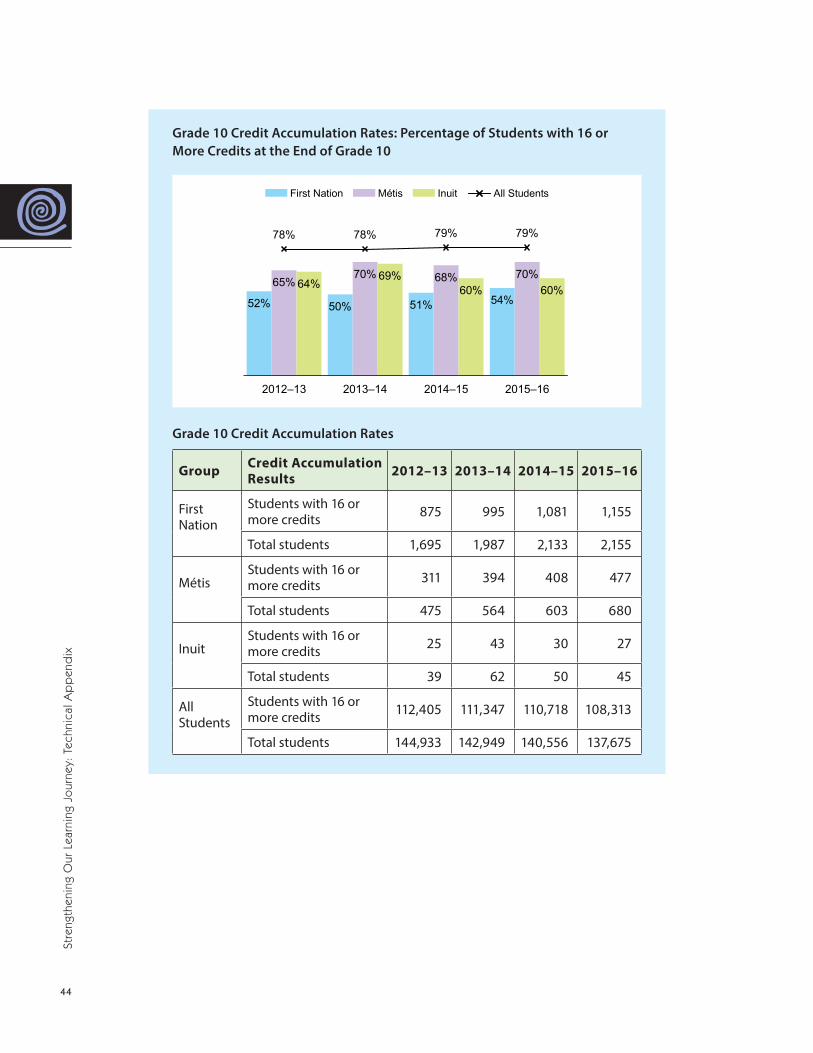
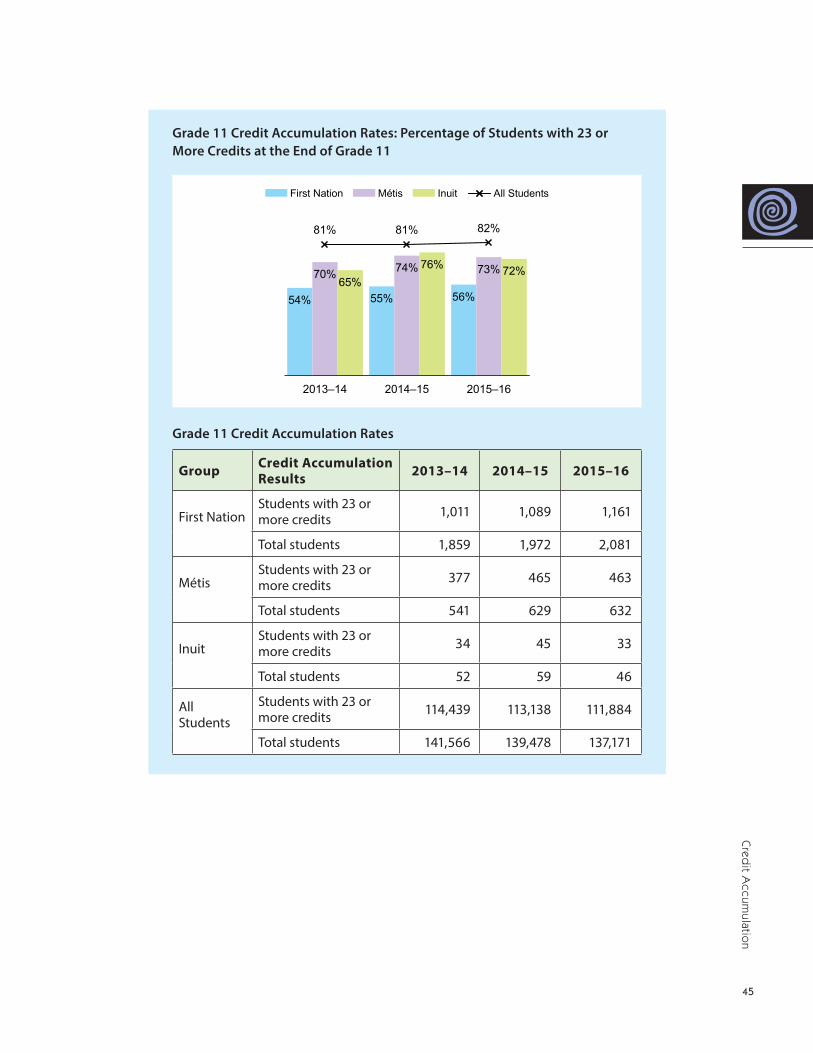
Earning 8 or more credits by the end of Grade 9, 16 or more by the end of Grade 10, and 23 or more by the end of Grade 11 are indicators that a student is on track to graduate with her or his peers.
Credit accumulation rates are reported here for academic years 2011–12, 2012–13, 2013–14, 2014–15, and 2015–16, starting from the 2011–12 baseline group of Grade 9 students:
• Grade 9 – percentage of self-identified First Nation, Métis, and Inuit students and of all students with 8 or more credits
• Grade 10 – percentage of self-identified First Nation, Métis, and Inuit students, and of all students with 16 or more credits
• Grade 11 – percentage of self-identified First Nation, Métis, and Inuit students and of all students with 23 or more credits
Notes about the data tables:
• The voluntary, confidential Indigenous student self-identification data used here is as reported by school boards through the Ontario School Information System (OnSIS) as of June for the given school year.
• Credits are counted if they are part of the student’s transcript at the end of June. Courses that conclude after June 30 or that are taken at summer school are counted for the following year.
43
Cred
it Accum
ulation
Grade 9 Credit Accumulation Rates: Percentage of Students with Eight or More Credits at the End of Grade 9
Grade 9 Credit Accumulation Rates
Group Credit Accumulation Results 2011–12 2012–13 2013–14 2014–15 2015–16
First Nation
Students with 8 or more credits 938 1,098 1,323 1,440 1,611
First Nation Total students 1,546 1,763 2,113 2,198 2,485
MétisStudents with 8 or more credits 283 396 421 493 575
Métis Total students 379 496 538 624 678
InuitStudents with 8 or more credits 15 36 38 30 47
Inuit Total students 23 47 53 46 70
All Students
Students with 8 or more credits 125,028 123,795 122,802 120,611 123,030
All Students Total students 147,889 145,852 143,257 140,553 143,534
44
Stre
ngth
enin
g O
ur L
earn
ing
Jour
ney:
Tec
hnic
al A
pp
end
ix
Grade 10 Credit Accumulation Rates: Percentage of Students with 16 or More Credits at the End of Grade 10
Grade 10 Credit Accumulation Rates
Group Credit Accumulation Results 2012–13 2013–14 2014–15 2015–16
First Nation
Students with 16 or more credits 875 995 1,081 1,155
First Nation Total students 1,695 1,987 2,133 2,155
MétisStudents with 16 or more credits 311 394 408 477
Métis Total students 475 564 603 680
InuitStudents with 16 or more credits 25 43 30 27
Inuit Total students 39 62 50 45
All Students
Students with 16 or more credits 112,405 111,347 110,718 108,313
All Students Total students 144,933 142,949 140,556 137,675
45
Cred
it Accum
ulation
Grade 11 Credit Accumulation Rates: Percentage of Students with 23 or More Credits at the End of Grade 11
Grade 11 Credit Accumulation Rates
Group Credit Accumulation Results 2013–14 2014–15 2015–16
First NationStudents with 23 or more credits 1,011 1,089 1,161
First Nation Total students 1,859 1,972 2,081
MétisStudents with 23 or more credits 377 465 463
Métis Total students 541 629 632
InuitStudents with 23 or more credits 34 45 33
Inuit Total students 52 59 46
All Students
Students with 23 or more credits 114,439 113,138 111,884
All Students Total students 141,566 139,478 137,171
46
Stre
ngth
enin
g O
ur L
earn
ing
Jour
ney:
Tec
hnic
al A
pp
end
ix
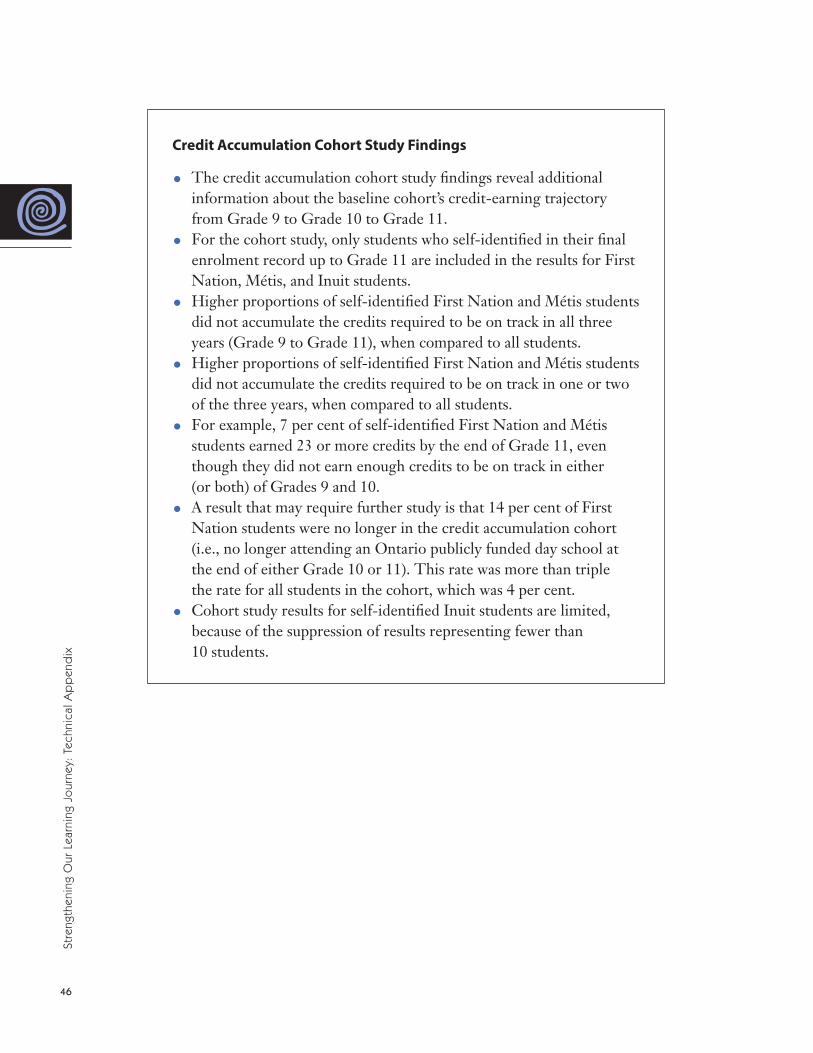
Credit Accumulation Cohort Study Findings
• The credit accumulation cohort study findings reveal additional information about the baseline cohort’s credit-earning trajectory from Grade 9 to Grade 10 to Grade 11.
• For the cohort study, only students who self-identified in their final enrolment record up to Grade 11 are included in the results for First Nation, Métis, and Inuit students.
• Higher proportions of self-identified First Nation and Métis students did not accumulate the credits required to be on track in all three years (Grade 9 to Grade 11), when compared to all students.
• Higher proportions of self-identified First Nation and Métis students did not accumulate the credits required to be on track in one or two of the three years, when compared to all students.
• For example, 7 per cent of self-identified First Nation and Métis students earned 23 or more credits by the end of Grade 11, even though they did not earn enough credits to be on track in either (or both) of Grades 9 and 10.
• A result that may require further study is that 14 per cent of First Nation students were no longer in the credit accumulation cohort (i.e., no longer attending an Ontario publicly funded day school at the end of either Grade 10 or 11). This rate was more than triple the rate for all students in the cohort, which was 4 per cent.
• Cohort study results for self-identified Inuit students are limited, because of the suppression of results representing fewer than 10 students.
47
Conclusion
The information and data presented in this technical appendix can assist education partners in continuing to build capacity for effective teaching. As school boards, schools, and Indigenous partners deepen and broaden their analysis of student achievement results, they can identify programs, services, and teaching approaches that are most effective in improving the learning experiences of all students. This is particularly helpful in determining next steps, as all partners continue to deepen their under-standing of the most effective practices and make positive changes to improve the achievement and well-being of Indigenous students.
Printed on recycled paper
17-043
ISBN 978-1-4868-1526-5 (Print)ISBN 978-1-4868-1527-2 (PDF)
© Queen’s Printer for Ontario, 2018