Embed Size (px)
Citation preview

See discussions, stats, and author profiles for this publication at: https://www.researchgate.net/publication/353380624
Munyua, M (2021, May) - Effect of Carbon Fibre Reinforced Polymer
Strengthening on the Axial Capacity and Ductility of Non-slender Square
Concrete Columns [Master's Thesis]
Thesis · May 2021
DOI: 10.6084/m9.figshare.15043686.v1
CITATIONS
0READS
32
1 author:
Some of the authors of this publication are also working on these related projects:
Developing the Kenya Annexes to the Eurocodes View project
Effect of Carbon Fibre Reinforced Polymer Strengthening on the Axial Capacity and Ductility on Non-slender Square Concrete Columns View project
Muthomi Munyua
University of Nairobi
5 PUBLICATIONS 0 CITATIONS
SEE PROFILE
All content following this page was uploaded by Muthomi Munyua on 23 July 2021.
The user has requested enhancement of the downloaded file.

UNIVERSITY OF NAIROBI
SCHOOL OF ENGINEERING
DEPARTMENT OF CIVIL & CONSTRUCTION ENGINEERING
Effect of Carbon Fibre Reinforced Polymer Strengthening on the Axial
Capacity and Ductility of Non-slender Square Concrete Columns
MUTHOMI MUNYUA
Dip (Strathmore), BSc (Nairobi)
F56/7509/2017
A thesis submitted in partial fulfilment for the Degree of Master of Science in Civil
Engineering (Structural Engineering) at the Department of Civil & Construction
Engineering, University of Nairobi
MAY 2021

i
UNIVERSITY OF NAIROBI
DECLARATION OF ORIGINALITY
Student Name: Muthomi Munyua
Registration Number: F56/7509/2017
College: College of Architecture & Engineering
Faculty/School/Institute: School of Engineering
Department: Department of Civil & Construction Engineering
Course Name: Master of Science in Civil Engineering (Structural Engineering)
Title of Work: Effect of Carbon Fibre Reinforced Polymer Strengthening on the
Axial Capacity and Ductility of Non-slender Square Concrete
Columns
1. I understand what plagiarism is, and I am aware of the university policy in this regard.
2. I declare that this thesis is my original work and has not been submitted elsewhere for
examination, the award of a degree or publication. Where other works or my own work
has been used, this has properly been acknowledged and referenced in accordance with
the University of Nairobi’s requirements.
3. I have not sought or used the services of any professional agencies to produce this work.
4. I have not allowed and shall not allow anyone to copy my work to pass it off as his/her
work.
5. I understand that any false claim in respect of this work shall result in disciplinary action
in accordance with University of Nairobi anti-plagiarism policy.
Signature: …………………………... Date: ………………………...

ii
DECLARATION
This thesis is my original work. I also affirm that to the best of my knowledge; this has not
been presented for a degree in any other university.
Name: Muthomi Munyua Registration Number: F56/7509/2017
Signature: ……………………………………… Date: ………………………………
This thesis has been submitted for examination with our approval and knowledge as
university supervisors:
Dr. Siphila W. Mumenya
Signature: ……………………………………… Date: ………………………………
Dr. John N. Mwero
Signature: ……………………………………… Date: ………………………………
Chairman
Dr. Simpson N. Osano
Signature: ……………………………………… Date: ………………………………

iii
DEDICATION
To my parents: Mr. Munyua Mutuaruchiu & Dr. Jennifer K. Munyua and my siblings:
Mugambi and Naitore, for their endless support and encouragement.

iv
ACKNOWLEDGEMENT
Gratitude to Dr. S. W. Mumenya and Dr. J. N. Mwero for their patience and advice in the
conceptualisation and development of this thesis. CGP Consulting Engineers Ltd. is also
appreciated for donating the materials used in this research. Without their kind donation, this
research would not have been possible.
I would like to acknowledge the efforts and influence of Prof. S. K. Mwea in securing the
funding necessary to conduct this research. G. Kyalo and K. Chachi, employees of CGP
Consulting Engineers Ltd., are appreciated for taking their time to assist me with the
preparation and testing of the specimens. Dr. S. O. Dulo was instrumental in motivating me to
begin this research. I would like to acknowledge the assistance of Mr. J. Muchina & Mr. M.
Mburu, the lab technicians for the concrete and highways laboratories respectively, at the
University of Nairobi. Mr. J. Muchina and Mr. M. Mburu went to great lengths in assisting me
to operate the machinery at the laboratories. They ensured the machinery was always well-
serviced throughout this study. Mr. S. Oloo, based at the Timber laboratory, University of
Nairobi, was instrumental in the fabrication of timber moulds for casting the specimen required
in the experimental investigation.
I acknowledge Dr. J. Munyua of the Catholic University of Eastern Africa for reading and
correcting several manuscripts of this thesis and ensuring it was understandable to specialists
as well as laypeople. Special thanks to Ms. S. Nkirote, who helped in the analysis and
presentation of the data using Microsoft Excel.
To all these kind souls; may God bless you.

v
ABSTRACT
This research investigated the effect of Carbon Fibre Reinforced Polymer (CFRP)
strengthening on the axial capacity and ductility of non-slender square concrete columns. There
is a problem of buildings collapsing in Kenya. Retrofitting of the buildings vulnerable to
collapse is of great importance to ensure the safety of the occupants and to address the housing
deficit in the country. An experimental research programme was conducted on 95 non-slender
square concrete columns to find out the gain in axial capacity and ductility of the columns
strengthened by CFRP. The specimens (150mm x 150mm x 350mm) were made of plain and
reinforced concrete. Three different concrete grades: C8/10, C12/15 and C16/20 were used.
The specimen had varying configurations of CFRP wrap: partial and full confinement in one
and two layers. Four parameters are investigated in this study: concrete grade, steel
reinforcement, degree of confinement and the number of layers of CFRP wrap. The specimens
were subjected to uniaxial compression up to failure, and the stress-strain curves were plotted.
This study found that the weakest concrete grade experiences the highest effect due to CFRP
strengthening. Concrete C8/10 was 5.42 times more affected than Concrete C16/20 in terms of
axial capacity (542%) but the effect was comparable in terms of ductility. Plain concrete
specimens experienced higher effect in both axial capacity (114%) and ductility (145%) than
reinforced concrete specimens. Full confinement was more effective in both the axial capacity
(383%) and ductility (275%). Similarly, two layers was more effective in both axial capacity
(435%) and ductility (292%). Experimental design optimisation showed that, partial CFRP
confinement offers better material efficiency as compared to full CFRP confinement. These
findings are instrumental in developing a rationale and a design method for retrofitting existing
columns with CFRP wrap.
Keywords: Carbon Fibre Reinforced Polymer Wrap, Non-slender columns, retrofitting,
axial capacity, ductility, CFRP, confinement, square concrete columns

vi
TABLE OF CONTENTS
DECLARATION OF ORIGINALITY ....................................................................................... i
DECLARATION ....................................................................................................................... ii
DEDICATION ..........................................................................................................................iii
ACKNOWLEDGEMENT ........................................................................................................ iv
ABSTRACT ............................................................................................................................... v
LIST OF TABLES .................................................................................................................... xi
LIST OF FIGURES ................................................................................................................xiii
ABBREVIATIONS ................................................................................................................ xvi
LIST OF SYMBOLS ............................................................................................................. xvii
CHAPTER 1: INTRODUCTION ........................................................................................ 1
1.1 Background of the Study ............................................................................................. 1
1.2 Problem Statement ...................................................................................................... 6
1.3 Research Objectives .................................................................................................... 6
1.3.1 Overall Objective ................................................................................................. 6
1.3.2 Specific objectives ............................................................................................... 6
1.4 Research Questions ..................................................................................................... 7
1.5 Hypotheses .................................................................................................................. 7
1.6 Justification of the Study ............................................................................................. 9
1.7 Significance of the Study ............................................................................................ 9
1.8 Assumptions .............................................................................................................. 10
1.9 Scope and Delimitations of the Study ....................................................................... 10
1.10 Definition of terms .................................................................................................... 11
CHAPTER 2: LITERATURE REVIEW ........................................................................... 13
2.1 Introduction ............................................................................................................... 13
2.2 Reinforced Concrete Columns .................................................................................. 13
2.3 Theory of Confinement ............................................................................................. 14
2.3.1 Strengthening Procedures .................................................................................. 15
2.3.2 Advantages of CFRP.......................................................................................... 16
2.3.3 Disadvantages of CFRP ..................................................................................... 17
2.4 CFRP Properties ........................................................................................................ 18
2.4.1 Performance of CFRP ........................................................................................ 18
2.5 Fibre Type ................................................................................................................. 19

vii
2.6 Stress-Strain Relationships for Confined Concrete ................................................... 19
2.6.1 Anomalies in the Equations ............................................................................... 22
2.6.2 Local Design Process ......................................................................................... 22
2.7 Concrete Grade .......................................................................................................... 24
2.8 Reinforcement ........................................................................................................... 24
2.9 Degree of CFRP Confinement .................................................................................. 25
2.10 CFRP Thickness ........................................................................................................ 26
2.11 Column shape ............................................................................................................ 27
2.12 Size of the Columns .................................................................................................. 28
2.13 Theories of Failure .................................................................................................... 28
2.13.1 Maximum Principal Stress Theory .................................................................... 29
2.13.2 Maximum Shear Stress or Stress Difference Theory ......................................... 30
2.13.3 Strain Energy Theory ......................................................................................... 30
2.13.4 Shear Strain Energy Theory ............................................................................... 30
2.13.5 Maximum Principal Strain Theory .................................................................... 31
2.13.6 Mohr-Coulomb Theory ...................................................................................... 31
2.14 Expressions................................................................................................................ 32
2.15 Contentions with Previous Studies on CFRP Confined Concrete............................. 32
2.16 Failure Modes of Columns Under Compression ....................................................... 33
2.17 Literature Gap ........................................................................................................... 35
2.18 Experimental Design ................................................................................................. 35
2.19 Statistical Tests .......................................................................................................... 36
2.19.1 Z-Score ............................................................................................................... 36
2.19.2 T-Test ................................................................................................................. 36
2.19.3 Analysis of Variance Test (ANOVA) ................................................................ 38
2.19.4 Post hoc tests after ANOVA .............................................................................. 38
2.19.5 Level of Confidence ........................................................................................... 39
2.19.6 Level of Significance ......................................................................................... 39
2.19.7 Type I and Type II errors ................................................................................... 39
2.20 Theoretical Framework ............................................................................................. 40
2.21 Conceptual Framework ............................................................................................. 40
CHAPTER 3: MATERIALS AND METHODS ............................................................... 42
3.1 Introduction ............................................................................................................... 42
3.2 Research Design ........................................................................................................ 42

viii
3.3 Experimental Investigation ....................................................................................... 43
3.3.1 Independent variables of the study .................................................................... 43
3.3.2 Dependent variables of the Study ...................................................................... 45
3.4 Specimen Dimensions ............................................................................................... 46
3.4.1 Non-dimensional Slenderness ............................................................................ 46
3.4.2 Dimensions of the Sample Manufactured .......................................................... 48
3.4.3 Slenderness Check of the Specimen .................................................................. 48
3.5 CFRP Configuration .................................................................................................. 52
3.6 Concrete preparation ................................................................................................. 53
3.7 Casting ....................................................................................................................... 54
3.8 Curing ........................................................................................................................ 54
3.9 Specimen Details ....................................................................................................... 56
3.10 CFRP wrap preparation ............................................................................................. 60
3.11 Epoxy ....................................................................................................................... 61
3.11.1 Description of Epoxy ......................................................................................... 61
3.11.2 Mixing ................................................................................................................ 62
3.12 CFRP Application ..................................................................................................... 62
3.13 Prepared specimen..................................................................................................... 63
3.14 Testing ...................................................................................................................... 63
3.15 Test Statistics............................................................................................................. 65
3.15.1 T-test .................................................................................................................. 65
3.15.2 ANOVA ............................................................................................................. 66
CHAPTER 4: RESULTS AND DISCUSSION ................................................................. 67
4.1 Stress-strain curves .................................................................................................... 67
4.2 Concrete Mix Design ................................................................................................ 68
4.3 Mechanical Properties of the Columns ..................................................................... 69
4.3.1 Axial Capacity of the Specimens ....................................................................... 71
4.3.2 Ductility of Specimens ....................................................................................... 96
4.4 Summary of Experimental Results ......................................................................... 119
4.4.1 Impact of Concrete Grade, Rebar, Degree of Confinement and Number of
Layers on Axial Capacity of Non-slender Square Concrete Columns ........................... 120
4.4.2 Impact of Concrete Grade, Rebar, Degree of Confinement and Number of
Layers on Ductility of Non-slender Square Concrete Columns ..................................... 121
4.4.3 Comparison of Effectiveness within the Variables .......................................... 122

ix
4.5 Failure of the Specimen Under Axial Loading ....................................................... 123
4.5.1 Theory of Failure ............................................................................................. 123
4.5.2 Modes of failure ............................................................................................... 123
4.6 Summary of Hypothesis Testing ............................................................................. 130
4.7 Findings of the Effect of Concrete Grade, Rebar, Degree of Confinement and Number
of Layers on Axial Capacity and Ductility ........................................................................ 131
4.8 Material Efficiency of Partial CFRP Confinement ................................................. 132
4.9 Contribution to Knowledge ..................................................................................... 135
4.10 Challenges Experienced in the Study ...................................................................... 136
4.11 Verification of the Experimental Methodology ...................................................... 138
CHAPTER 5: CONCLUSIONS AND RECOMMENDATIONS ................................... 139
5.1 Conclusions ............................................................................................................. 139
5.2 Recommendations ................................................................................................... 139
5.2.1 Recommendations from this study................................................................... 139
5.2.2 Recommendations for further research ............................................................ 140
REFERENCES ...................................................................................................................... 141
APPENDICES ....................................................................................................................... 150
Mould Fabrication Drawings .................................................................... 150
Specimen Drawings and Quantities .......................................................... 152
Axial Capacity Results ............................................................................. 154
C.1 Failure Stresses of Samples ..................................................................................... 154
C.2 Average Failure Stresses .......................................................................................... 155
C.3 Effect of concrete grade on axial capacity ............................................................... 155
C.4 Effect of rebar on axial capacity .............................................................................. 155
C.5 Effect of partial and CFRP confinement on axial capacity ...................................... 156
C.6 Effect of layers on axial capacity ............................................................................. 156
Ductility Results ....................................................................................... 157
D.1 Failure Strains of Samples ....................................................................................... 157
D.2 Average Ductility..................................................................................................... 158
D.3 Effect of concrete grade on ductility ....................................................................... 158
D.4 Effect of rebar on ductility ....................................................................................... 158
D.5 Effect of partial and full CFRP confinement on ductility........................................ 159
D.6 Effect of layers on ductility ..................................................................................... 159
x
Average Effect of the Variables ............................................................... 160
Design Proposal Procedure ....................................................................... 162
F.1 Surface preparation................................................................................................... 162
F.2 Setting Out ................................................................................................................ 162
F.3 Apply primer ............................................................................................................ 163
F.4 Levelling of the concrete .......................................................................................... 163
F.5 Fabric Cutting ........................................................................................................... 163
F.6 Preparing the impregnation adhesive. ...................................................................... 163
F.7 Applying Impregnation Adhesive ............................................................................ 163
F.8 Apply carbon fibre fabric ......................................................................................... 163
F.9 Removal of Air Bubbles ........................................................................................... 163
F.10 Worker Safety......................................................................................................... 163
Stress-Strain Graphs ................................................................................. 164
Correspondence Details ............................................................................ 174
INDEX ................................................................................................................................... 175

xi
LIST OF TABLES
Table 2.1: Summary of expressions for confined concrete properties in literature. ................ 32
Table 3.1: Characteristic strength of grades of concrete.......................................................... 44
Table 3.2: End conditions and k values of columns under compression. ................................ 47
Table 3.3: Physical properties of CFRP wrap. ......................................................................... 53
Table 3.4: Prescribed ratios for various grades of concrete. .................................................... 53
Table 3.5: Composition matrix of column specimens to manufactured. ................................. 56
Table 4.1: Compressive stresses of test cubes for the grades of concrete manufactured. ....... 68
Table 4.2: Descriptive statistics of axial capacity of samples of different concrete grades. ... 74
Table 4.3: ANOVA table of axial capacity between groups of different concrete grades. ..... 74
Table 4.4: Post hoc testing of axial capacity of groups of different concrete grades. ............. 75
Table 4.5: Descriptive statistics of axial capacity of samples with rebar absent or present. ... 78
Table 4.6: T-test for axial capacity of groups with rebar absent and present. ......................... 78
Table 4.7: Comparison of samples to determine the effect of rebar on axial capacity. ........... 80
Table 4.8: Comparison of the combined effect of rebar and CFRP on axial capacity. ........... 87
Table 4.9: Descriptive statistics of axial capacity of samples with different degrees of
confinement.............................................................................................................................. 88
Table 4.10: ANOVA table of axial capacity between groups with different degrees of
confinement.............................................................................................................................. 88
Table 4.11: Post hoc testing of axial capacity of groups with different degrees of confinement.
.................................................................................................................................................. 88
Table 4.12: Descriptive statistics of axial capacity of samples with different number of layers.
.................................................................................................................................................. 91
Table 4.13: ANOVA table of axial capacity between groups with different number of layers.
.................................................................................................................................................. 92
Table 4.14: Post hoc testing of axial capacity of groups with different number of layers. ..... 92
Table 4.15: Descriptive statistics of ductility of samples of different concrete grades. .......... 99
Table 4.16: ANOVA table of ductility between groups of different concrete grades. ............ 99
Table 4.17: Post hoc testing of ductility of groups of different concrete grades. .................. 100
Table 4.18: Descriptive statistics of ductility of samples with rebar absent or present. ........ 103
Table 4.19: T-test for ductility of groups with rebar absent and present. .............................. 103
Table 4.20: Comparison of the specimens to determine the effect of rebar on ductility. ...... 105
Table 4.21: Comparison of the combined effect of rebar and CFRP on ductility. ................ 112

xii
Table 4.22: Descriptive statistics of ductility of sample of with different degrees of
confinement............................................................................................................................ 112
Table 4.23: ANOVA table of ductility between groups with different degrees of confinement.
................................................................................................................................................ 113
Table 4.24: Post hoc testing of ductility of groups with different degrees of confinement. .. 113
Table 4.25: Descriptive statistics of ductility of samples with different number of layers. .. 115
Table 4.26: ANOVA table of ductility of samples with different number of layers. ............ 116
Table 4.27: Post hoc testing of ductility of groups with different number of layers. ............ 116
Table 4.28: Comparison of effectiveness within the variables. ............................................. 122
Table 4.29: Summary of decisions for the hypotheses tested. ............................................... 130 Table C.1: Recorded failure stresses of the samples. ............................................................. 154
Table C.2: Average failure stresses of the specimen. ............................................................ 155
Table C.3: Average percentage gain of axial capacity classified by concrete grade. ............ 155
Table C.4: Average percentage gain in axial capacity due to rebar....................................... 155
Table C.5: Average axial capacity gain classified by the presence of rebar. ......................... 156
Table C.6: Average percentage gain in axial capacity classified by the degree of confinement.
................................................................................................................................................ 156
Table C.7: Average percentage gain in axial capacity classified by number of layers. ........ 156 Table D.1: Recorded failure stresses of the samples. ............................................................ 157
Table D.2: Average ductility of the samples. ........................................................................ 158
Table D.3: Average percentage gain in ductility classified by concrete grade. ..................... 158
Table D.4: Average percentage gain in ductility due to rebar. .............................................. 158
Table D.5: Average percentage gain in ductility classified by the presence of rebar. ........... 159
Table D.6: Average percentage gain in ductility classified by the degree of confinement. .. 159
Table D.7: Average percentage gain in ductility classified by the number of layers. ........... 159 Table E.1: Effect of the independent variables on axial capacity and ductility. .................... 160 Table F.1: Recommended CFRP confinement required. ....................................................... 162

xiii
LIST OF FIGURES
Figure 1.1: Graphic summary of Nairobi City Building Audit Report on buildings. ............... 3
Figure 2.1: Illustration of Poisson’s effect ............................................................................... 14
Figure 2.2: Stress-strain relationship for confined concrete. .................................................. 23
Figure 2.3: Partial CFRP confinement of a column. ................................................................ 25
Figure 2.4: Increased confined areas for increased rounding radiuses. ................................... 28
Figure 2.5: Satisfactory failure of specimens. ......................................................................... 34
Figure 2.6: Unsatisfactory failure of specimens. ..................................................................... 34
Figure 2.7: Conceptual model of the investigation. ................................................................. 41
Figure 3.1: The Euler Buckling curve...................................................................................... 47
Figure 3.2: Maximum clearance of the compression machine. ............................................... 48
Figure 3.3: Plain concrete specimen details. ............................................................................ 51
Figure 3.4: Reinforced concrete specimen details ................................................................... 51
Figure 3.5: Setup for the manufacture of plain concrete specimen. ........................................ 52
Figure 3.6: Setup for the manufacture of reinforced concrete specimen. ................................ 52
Figure 3.7: A riffle sample divider. ......................................................................................... 54
Figure 3.8: A quartered batch of fresh concrete. ..................................................................... 54
Figure 3.9: Samples after removal from the water bath. .......................................................... 55
Figure 3.10: Samples after air drying for 24 hours. ................................................................. 55
Figure 3.11: Curing process for the concrete columns and epoxy done simultaneously. ........ 55
Figure 3.12: Graphical representation of manufactured specimens......................................... 57
Figure 3.13: Carbon fibre wrap and epoxy adhesive. .............................................................. 60
Figure 3.14: A pair of scissors was used to cut the CFRP to the required sizes. ..................... 61
Figure 3.15: Weighing the epoxy adhesive on a mass balance................................................ 62
Figure 3.16: Mixing of the epoxy set with the ratio of 2:1. ..................................................... 62
Figure 3.17: Specimen without CFRP strengthening. ............................................................. 63
Figure 3.18: Specimen with partial CFRP strengthening. ....................................................... 63
Figure 3.19: Specimen with full CFRP strengthening. ............................................................ 63
Figure 3.20: Dial gauge in position to measure the deflection. ............................................... 64
Figure 3.21: Set up of the compression test machine. ............................................................. 64
Figure 4.1: Typical stress-strain graphs three samples of the same CFRP configuration. ...... 67
Figure 4.2: Average axial capacity of Concrete C8/10 specimens. ......................................... 71
Figure 4.3: Average axial capacity of Concrete C12/15 specimens. ....................................... 72

xiv
Figure 4.4: Average axial capacity of Concrete C16/20 specimens. ....................................... 73
Figure 4.5: Change in axial capacity against specimens of different concrete grades. ........... 76
Figure 4.6: Summary of the effect of concrete grade on the axial capacity of CFRP strengthened
samples. .................................................................................................................................... 77
Figure 4.7: Change in axial capacity due to rebar on specimens without CFRP strengthening.
.................................................................................................................................................. 79
Figure 4.8: Change in axial capacity due to rebar in CFRP strengthened columns................. 81
Figure 4.9: Change in axial capacity due to CFRP strengthening on plain concrete............... 82
Figure 4.10: Change in axial capacity due to CFRP strengthening of reinforced concrete. .... 83
Figure 4.11: Comparison of change in axial capacity between plain and reinforced CFRP
strengthened concrete specimens. ............................................................................................ 84
Figure 4.12: Combined effect of rebar and CFRP strengthening on the axial capacity. ......... 85
Figure 4.13: Summary of the effect of rebar and CFRP on the axial capacity of CFRP
strengthened samples. .............................................................................................................. 87
Figure 4.14: Effect of CFRP confinement on axial capacity. .................................................. 90
Figure 4.15: Summary of the effect of degree of CFRP confinement on axial capacity of CFRP
strengthened samples. .............................................................................................................. 91
Figure 4.16: Effect of the number of CFRP layers on axial capacity. ..................................... 94
Figure 4.17: Summary of the effect of the number of CFRP layers on the axial capacity of
CFRP strengthened samples. ................................................................................................... 95
Figure 4.18: Average ductility of Concrete C8/10 specimens. ................................................ 96
Figure 4.19: Average ductility of Concrete C12/15 specimens. .............................................. 97
Figure 4.20: Average ductility of Concrete C16/20 specimens. .............................................. 98
Figure 4.21: Change in ductility against specimens of different concrete grades. ................ 101
Figure 4.22: Summary of the effect of concrete grade on the ductility of CFRP strengthened
samples. .................................................................................................................................. 102
Figure 4.23: Ductility gain due to rebar. ................................................................................ 104
Figure 4.24: Effect of rebar on the ductility of specimens strengthened with CFRP. ........... 106
Figure 4.25: Effect of CFRP strengthening on the ductility of plain concrete columns. ....... 107
Figure 4.26: Effect of CFRP strengthening on the ductility of reinforced concrete columns.
................................................................................................................................................ 108
Figure 4.27: Comparison of change in ductility between plain and reinforced CFRP
strengthened concrete specimens. .......................................................................................... 109
Figure 4.28: Combined effect of rebar and CFRP strengthening on ductility. ...................... 110
xv
Figure 4.29: Summary of the effect of rebar and CFRP on the ductility of CFRP strengthened
samples. .................................................................................................................................. 111
Figure 4.30: Effect of degree of CFRP confinement on ductility. ......................................... 114
Figure 4.31: Summary of the effect of degree of CFRP confinement on the ductility of CFRP
strengthened samples. ............................................................................................................ 115
Figure 4.32: Effect of CFRP layers on ductility. ................................................................... 118
Figure 4.33: Summary of the effect of the number of CFRP layers on the ductility of CFRP
strengthened samples. ............................................................................................................ 119
Figure 4.34: Radar chart showing average percentage effect of the variables on axial capacity.
................................................................................................................................................ 120
Figure 4.35: A treemap showing the effect of variables on axial capacity. ........................... 120
Figure 4.36: Radar chart showing average percentage effect of the variables on ductility. .. 121
Figure 4.37: Treemap showing the effect of variables studied on ductility........................... 121
Figure 4.38: Failure was characterised by rupture at the corners. ......................................... 124
Figure 4.39: Typical failure modes of the specimens. ........................................................... 126
Figure 4.40: Material saving of double confinement over single full confinement. .............. 133
Figure 4.41: Comparison of axial capacity gain between one layer of full CFRP confinement
and two layers of partial CFRP confinement. ........................................................................ 134
Figure 4.42: Comparison of ductility gain between one layer of full CFRP confinement and
two layers of partial CFRP confinement. ............................................................................... 135
Figure 4.43: Specimen with correct fibre orientation. ........................................................... 137
Figure 4.44: Specimen with skewed fibre orientation. .......................................................... 137 Figure A.1: A drawing of 150mm x 150mm x 150mm timber mould. ................................. 150
Figure A.2: Mould drawing for the specimen. ....................................................................... 151 Figure B.1: Drawings for specimen specifications – 1 layer. ................................................ 152
Figure B.2: Drawings for specimen specifications - 2 layers. ............................................... 153 Figure E.1: A treemap showing the effect of the variables on the axial capacity.................. 161
Figure E.2: A treemap show effect of the variables on the ductility. .................................... 161

xvi
ABBREVIATIONS
Acronym Meaning
BS British Standard
BSI British Standards Institute
CEN European Committee for Standardisation
CFRP Carbon Fibre Reinforced Polymer
EAS East African Standard
EC Eurocode
EN European Standard
FRP Fibre Reinforced Polymer
KEBS Kenya Bureau of Standards
KS Kenya Standards
LVDT Linear variable differential transformers
NCA National Construction Authority
NCAPD National Coordinating Agency for Population & Development
NDT Non-Destructive Test
RC Reinforced Concrete
SLS Serviceability Limit State
ULS Ultimate Limit State

xvii
LIST OF SYMBOLS
Greek Symbols
Symbol Meaning
𝜀𝑐2 Strain in concrete
𝜀𝑐2,𝑐 Strain in confined concrete.
𝜀𝑐𝑢2 Ultimate strain in concrete
𝜀𝑐𝑢2,𝑐 Ultimate strain in confined concrete.
𝜀𝑓𝑢 Design ultimate tensile strain of CFRP.
𝜎 Working stress.
𝜎1 Maximum principal stress in complex system.
𝜎2 Stress in the lateral direction.
𝜎3 Stress in the lateral direction (typically =σ2)
𝜎𝑒𝑐 Maximum stress at elastic limit in compression.
𝜎𝑒𝑡 Maximum stress at elastic limit in tension.
𝜏𝑚𝑎𝑥 Maximum shear stress.
𝜈𝑐 Poisson’s ratio for concrete
Latin Symbols
Symbol Meaning
ANOVA Analysis of Variance
𝐷 Diameter
df Degrees of freedom
𝐸0 Secant modulus of plain concrete
𝐸𝑖 Initial tangent modulus of concrete strain
𝐸𝑝 Post-crushing tangent modulus
𝑓0 The intercept of post-crushing tangent modulus with the stress axis
𝑓𝑐𝑘 Characteristic strength of concrete
𝑓𝑐𝑘,𝑐 Characteristic strength of confined concrete
𝑓𝑡𝑑 Ultimate design tensile strength of CFRP
MPa Megapascals – N/mm2
𝑛 Empirical factor
𝑅 Radius of column

1
CHAPTER 1: INTRODUCTION
1.1 Background of the Study
Reinforced concrete (RC) columns are composed of concrete and steel reinforcement. Concrete
is the material that bears most of the compressive stresses while steel reinforcement bears most
of the tensile stresses in the column (McKenzie, 2013). The manufacture of concrete is
influenced by numerous factors that lead to significant variability in its strength. RC columns
may not attain the target strength when manufactured on site. Failure to attain the target strength
may lead to difficulties such as higher deflections than estimated, cracking or even complete
failure by crushing or buckling.
To determine the strength of the cast-in-place concrete, sample cubes are usually made and
tested by the cube crushing method according to BS EN 12390-2:2009 (BSI, 2009). Non-
destructive tests may also be used to determine the strength of cast-in-place concrete members.
These non-destructive tests depend on the fact that specific physical properties of concrete are
related to strength. Such properties include hardness, resistance to penetration by projectiles,
rebound capacity and ability to transmit ultrasonic pulses, X-rays, and Y-rays. If columns do
not attain the target strength, then the column may be demolished and recast. Demolitions are
usually the last-ditch solution as they are usually quite expensive: financially, politically, time-
wise and to the environment (The Constructor, 2019).
Alternative options to avoid demolition of the condemned columns is the use of steel angles or
the use of Carbon Fibre Reinforced Polymer (CFRP) wrap to strengthen the weak columns.
CFRP is a composite material which relies on the carbon fibre to offer strength and stiffness
while the polymer provides a cohesive matrix to protect and hold the fibres together. CFRPs
are frequently used wherever high strength-to-weight ratio and rigidity are required, such as in
aerospace engineering, ships, automotive industry, civil engineering structures, sports
equipment, and several consumer and technical applications (Fekete & Hall, 2017). The use of
2
steel angles is the method commonly adopted in Kenya. Steel angles usually have the additional
difficulty of having to damage the existing weak RC column by hacking in order to interface
the concrete with the additional steel angles for composite action to take place. CFRP
strengthening does not have this difficulty (The Concrete Society, 2000). However, CFRP wrap
is not extensively used in Kenya. Its use is considered cutting-edge locally. This study shed
light on the use of CFRP in strengthening columns.
Globally, the use of CFRP is not new and has been implemented in several other countries. In
the United States of America, CFRP has been used to strengthen old infrastructure such as
bridges. In Japan and other earthquake-prone countries, CFRP is used in seismic retrofitting
(Bank, 2006).
Some of the advantages of using CFRP are its high strength, light weight, corrosion resistance,
ease of use and speed of application. Its disadvantages include susceptibility to mechanical
damage and poor response to fire (Khaled et al., 2018). Despite its advantages and relatively
few disadvantages, retrofitting of columns with CFRP is still rare in Kenya.
The construction industry has experienced an upsurge in the requirement to reinstate,
rejuvenate, strengthen and upgrade existing concrete structures. These requirements are in
place to mitigate problems such as poor construction practices, design inadequacies, irregular
maintenance, increase in loads and seismic conditions (Horse Construction, 2019; Jaya &
Mathai, 2012). Since 1996, Kenya has experienced approximately two building collapses per
year. Between 2006 and 2014, 17 buildings collapsed in Kenya, causing 84 deaths and more
than 290 injuries (Kibet, 2016). In 2018, an audit report by the Nairobi City County revealed
the following: out of the 1,572 buildings inspected, 884 were considered safe for human
occupation, 471 were deemed unfit for occupancy, and 217 needed to be demolished as they
were dangerous for human occupation (Omullo, 2018).

3
Source: Omullo, 2018
Figure 1.1: Graphic summary of Nairobi City Building Audit Report on buildings.
This audit showed that approximately 44% of buildings were unsafe. There is a need to
strengthen some of these existing buildings to make them safe. Retrofitting existing columns
to make them stronger may be one method of improving the structural soundness of these
buildings.
In addition to that, the National Coordinating Agency for Population & Development
(NCAPD) recommended that there was a need to plan land use more effectively in response to
the increasing rural-urban migration (NCAPD, 2009). One of the methods of planning land use
more effectively is to increase the capacity of existing buildings. This additional capacity
would cater to the increasing population. Densifying the population by using taller buildings is
an effective way of reducing the housing demand. This research intended that the use of CFRP
to increase the axial capacity of columns would enable engineers to add the amount of
occupiable space of existing buildings by the safe addition of new floors.
In this study, CFRP was used as a wrap in different configurations to strengthen concrete
columns. Columns are structural members which are designed to carry predominantly
compressive stresses in structures. The primary purpose of columns is to transfer loads to the
foundation. Depending on the mode of failure, columns can either be classified as either slender
Safe for habitation
56%Unfit for
occupation
30%
Dangerous for
occupation
14%

4
or non-slender. Slender columns primarily fail by buckling, while non-slender columns fail by
crushing (McKenzie, 2013). This study conducted tests on non-slender columns only. This is
due to the fact that non-slender columns fail by crushing after the maximum axial capacity has
been attained; unlike slender columns which fail by buckling before attaining the maximum
axial load. The axial capacity of the columns was one of the variables to be investigated.
Aesthetic, functional and structural requirements dictate the geometry of columns. Based on
these requirements, columns can have different shapes: circular, triangular, square or
rectangular. Square columns were selected for this study because they are widely used in
construction for their aesthetic value since they are easily concealed within walls (Guo & Zeng,
2019). Moreover, square columns are also preferred over other shapes because of their
symmetry along both axes.
Kenya has experienced several building collapses (Associated Press, 2019). In 2015, the
National Construction Authority (NCA) found that 58% of buildings in Nairobi were unfit for
habitation. That NCA building audit reported that eight buildings collapsed and killed 15
people in that year (NCA, 2015). This statistic is comparable to an audit report three years later
by Nairobi City County that showed that 44% of buildings were unsafe (Omullo, 2018).
Following such audits and reports, NCA and the various local governments restricted access to
these unsafe buildings or condemned them for demolition. Evacuation and demolitions are
expensive measures that contribute to the existing problem of high demand for housing (Obuya,
2012). Retrofitting some of these unsafe buildings is a viable solution to ensuring the safety of
the buildings’ users. Retrofitting is a better alternative than evacuation and demolition.
Nevertheless, there is limited knowledge and guidance for conducting such retrofits with
regards to CFRP (The Concrete Society, 2000). The lack of guidance or design codes has led
to a reluctance to adopt CFRP strengthening by engineers and owners. The absence of these
design codes is due to the fact that CFRP is fairly novel and is only used in the maintenance of

5
old buildings and infrastructure. CFRP has therefore not found wide application in several
countries. This research addressed this problem by investigating four variables to improve the
understanding of CFRP strengthening in columns.
Literature implies that change in behaviour of CFRP strengthened columns is caused due to
full confinement. Most research conducted (Jaya & Mathai, 2012; Khaled et al., 2018;
Mirmiran & Shahawy, 1997; Mohamed Saafi, 1999; Nanni & Bradford, 1995; Parvin & Wang,
2001; Rahai et al., 2008; Rochette & Labossière, 2000; Shehata et al., 2002; Shrive et al., 2003;
The Concrete Society, 2000; Toutanji et al., 2007) studied the effect of full confinement of
columns. However, some CFRP manufacturers claim that partial confinement offers similar
benefits with less material being used (Horse Construction, 2019). A study by Guo et al. (2018)
states that the confinement mechanism of columns partially wrapped by CFRP is less
understood compared to partial confinement. That study supported the manufacturer’s claim as
it concluded that partial CFRP confinement was a promising and economical alternative to the
fully CFRP strengthening technique. This research aimed at investigating this manufacturer’s
claim.
The behaviour of square columns strengthened by CFRP is not widely studied as CFRP wraps
are recommended for circular columns (The Concrete Society, 2000). Square columns usually
lead to stress concentrations at the edges resulting in premature failure before the maximum
capacity of the retrofitted columns is attained. Nonetheless, square columns are preferred in
construction because of architectural and constructability considerations (Guo & Zeng, 2019).
This research provided additional data and knowledge on square columns strengthened by
CFRP.
The NCA Building Report shows that building collapses have become more frequent, and the
trend is likely to progress unless remedial measures are undertaken (NCA, 2015). Use of CFRP

6
strengthening is one such remedial measure that may help curb this problem (Abadi et al.,
2019).
It is against this background that the experimental study was conducted to investigate the effect
of CFRP strengthening on the axial capacity and ductility of non-slender square concrete
columns.
1.2 Problem Statement
Kenya experiences several building collapses. There is an urgent need to solve the problem of
collapsing buildings by retrofitting condemned buildings with CFRP. The influence of the
parameters required in retrofitting is not well understood and requires further research. Those
parameters are the grade of concrete, the presence of steel reinforcement and the number of the
confining layers. Secondly, there is a claim that partial CFRP confinement is as effective as
full CFRP confinement. This claim has not yet proven to be true. The lack of design codes for
CFRP retrofitting necessitates the need to investigate this claim.
Due to the absence of design codes for CFRP retrofitting, this study set out to find out how
four parameters affected CFRP strengthening using an evidence-based approach. In this
approach, samples would be tested to a failure and the data recorded. The data was then
analysed and interpreted. The interpretation from the data would be used to justify any
engineering decisions to be made with regards to the procedure of retrofitting RC columns.
1.3 Research Objectives
1.3.1 Overall Objective
The overall objective of this study was to investigate the effect of CFRP strengthening on the
axial capacity and ductility of non-slender square concrete columns.
1.3.2 Specific objectives
To achieve the overall objective, the study pursued the following specific objectives:

7
1. To compare the increase in axial capacity and ductility due to CFRP strengthening on
three different grades of concrete.
2. To compare the increase in axial capacity and ductility due to CFRP strengthening on
plain and reinforced concrete.
3. To compare the increase in axial capacity and ductility between partial CFRP
confinement and full CFRP confinement.
4. To find out the increase in axial capacity and ductility due to additional layers of CFRP
strengthening.
1.4 Research Questions
These research questions guided the study:
1. What is the contribution of CFRP strengthening on three different concrete grades to
the axial capacity and ductility of non-slender square columns?
2. What is the difference of CFRP strengthening on plain and reinforced non-slender
square concrete columns?
3. What is the difference between partial CFRP confinement and full CFRP confinement
on axial capacity and ductility of non-slender square concrete columns?
4. What is the effect of additional layers of CFRP wrap on axial capacity and ductility of
non-slender square concrete columns?
1.5 Hypotheses
This study tested four hypotheses. These hypotheses were stated in the null and alternative
forms:
H0: There is no relationship between concrete grades and the change in axial capacity and
ductility of CFRP strengthened columns.
𝜇𝐶8/10 = 𝜇𝐶12/15 = 𝜇𝐶16/20

8
HA: There is a relationship between concrete grades and the change in axial capacity and
ductility of CFRP strengthened columns.
𝜇𝐶8/10 ≠ 𝜇𝐶12/15 ≠ 𝜇𝐶16/20
H0: There is no significant difference between CFRP strengthening on plain and
reinforced concrete in terms of axial capacity and ductility of non-slender square
columns.
𝜇𝑎𝑏𝑠𝑒𝑛𝑡 = 𝜇𝑝𝑟𝑒𝑠𝑒𝑛𝑡
HA: There is a significant difference between CFRP strengthening on plain and reinforced
concrete in terms of axial capacity and ductility of non-slender square columns.
𝜇𝑎𝑏𝑠𝑒𝑛𝑡 ≠ 𝜇𝑝𝑟𝑒𝑠𝑒𝑛𝑡
H0: There is no significant difference between partial CFRP confinement and full CFRP
confinement on axial capacity and ductility of non-slender square concrete columns.
𝜇𝑏𝑎𝑟𝑒 = 𝜇𝑝𝑎𝑟𝑡𝑖𝑎𝑙 = 𝜇𝑓𝑢𝑙𝑙
HA: There is a significant difference between partial CFRP confinement and full CFRP
confinement on axial capacity and ductility of non-slender square concrete columns.
𝜇𝑏𝑎𝑟𝑒 ≠ 𝜇𝑝𝑎𝑟𝑡𝑖𝑎𝑙 ≠ 𝜇𝑓𝑢𝑙𝑙
H0: There is a significant difference between single layer CFRP confinement and double
layer CFRP confinement on axial capacity and ductility of non-slender square
concrete columns.
𝜇𝑛𝑜𝑛𝑒 = 𝜇𝑠𝑖𝑛𝑔𝑙𝑒 = 𝜇𝑑𝑜𝑢𝑏𝑙𝑒
HA: Additional layers of CFRP wrap have a relationship with the increment on axial
capacity and ductility of non-slender square concrete columns.
𝜇𝑛𝑜𝑛𝑒 ≠ 𝜇𝑠𝑖𝑛𝑔𝑙𝑒 ≠ 𝜇𝑑𝑜𝑢𝑏𝑙𝑒

9
1.6 Justification of the Study
This study was a multi-variable investigation of the parameters required when determining
strengthening procedures of columns using CFRP wrap. The results and findings of this study
shed light on four parameters when developing a design method for such procedures.
Understanding these parameters would bridge the gap that exists due to the absence of design
codes for retrofitting columns with CFRP.
Construction projects encounter challenges during the execution phase. Some problems that
are of great significance are quality assurance difficulties such as when material provided does
not meet the specifications. RC buildings have the additional complication in that tests on
concrete take seven to 28 days to establish whether the concrete delivered to the site was up to
standard. This lengthy testing procedure affects the project schedule in case the tests indicate
that the material delivered was not satisfactory. Demolitions are typically the next course of
action but are quite expensive. It is crucial to provide alternative solutions when such problems
occur. The use of CFRP wrap may be viable when such issues arise since it is a solution that
can be implemented rapidly on site ultimately resulting in the reduction of the project duration.
The high population pressure and the high cost of land in urban areas may necessitate the need
for increasing buildings’ capacity to cater for the increased housing demand. Use of CFRP
strengthening may be adopted to increase the amount of occupiable space of existing buildings
safely thus reducing the housing demand of existing housing.
1.7 Significance of the Study
This study is essential as it may provide the necessary guidance to structural engineers when
using CFRP strengthening:
1. To increase the load-bearing capacity of a structure, for example, the addition of new
floors or change of use from residential to commercial.

10
2. To add reinforcement to a structure that is already under-designed or wrongly
constructed.
3. To develop a better understanding and consequently to leverage this understanding to
fine-tune the parameters in the structural design process.
1.8 Assumptions
It was assumed that CFRP wraps increase the axial capacity and ductility of columns because
of the confining effect CFRP will have on the concrete columns (Rahai et al., 2008).
Concrete mix design was not performed; the study assumed that the prescribed ratios of cement,
fine and coarse aggregate for the manufacture of concrete would result in the target strength of
concrete required (IQSK, 2019).
1.9 Scope and Delimitations of the Study
The axial capacity and ductility of columns were the only dependent variables to be
investigated. The scope of the study was restricted to non-slender concrete columns under
concentric loading. The loading had no eccentricity; therefore, failure would only occur once
the maximum axial capacity of the columns was attained. The specimen height was also limited
by the maximum clearance of the compression test machine, which consequently governed the
cross-section dimensions to ensure the column would be categorised as non-slender.
The maximum number of layers to be used was two to minimise the cost of the experimental
programme. The grades of concrete chosen: C8/10, C12/15 and C16/20 were the grades below
the concrete commonly used for structural purposes. That typical concrete grade used for
structural purposes is C20/25 (IQSK, 2019).
This experimental study is relevant to the construction industry. The findings of this study are
relevant in retrofitting buildings wrongly constructed or designed. The results of the study
present an opportunity to incorporate these findings in the repair and strengthening of existing

11
columns. Repair, retrofitting and strengthening of columns is an area that needs to be explored
further.
1.10 Definition of terms
Axial capacity refers to the maximum stress that the column can withstand (McKenzie, 2013).
In this study, axial capacity was one of the dependent variables and was measured by subjecting
the different specimen to axial compression until failure by using a compression test machine.
The failure load was divided by the specimen cross-sectional area to calculate the axial capacity
of the column.
Carbon fibres are fibres produced by the pyrolysis of organic precursor fibres such as rayon,
polyacrylonitrile or pitch in an inert atmosphere. Carbon fibres are similar to graphite fibres
but differ in the carbon content and the temperature at which the fibres are made and heat-
treated (Fekete & Hall, 2017).
Carbon Fibre Reinforced Polymer (CFRP) are composite materials which rely on the carbon
fibre to provide strength and stiffness. The polymer or plastic provides a cohesive matrix to
protect and hold the fibres together (Fekete & Hall, 2017). In this study, CFRP was in the form
of a wrap provided by a CFRP manufacturer.
Concrete grade refers to the different strength classes of concrete based on the failure stress
when tested in a compression machine, and the mix ratio of cement, fine aggregate and coarse
aggregate among other factors.
Concrete nomenclature is based on the designation adopted by the Eurocode to indicate a
specific strength class Cfck/fck,cube. For instance, C20/25 represents standard concrete ‘C’ with
a 28-day compressive cylinder strength of 20MPa and a corresponding cube strength of 25MPa.
C20/25 would be designated as Class 25 concrete according to British Standards (McKenzie,
2013).

12
Ductility is a measure of the ability of a material to undergo significant plastic deformation
before failure. This ability may be expressed as percent elongation. In this study, the ductility
was quantified as the final deformation in a structural member as it was progressively loaded
divided by its original length. The deformation was measured using a dial gauge.
Full confinement refers to external confinement by CFRP wrap by completely wrapping the
specimen.
Non-slender columns refer to structural members which sustain predominantly compressive
stresses. The failure mode of non-slender columns is by crushing. This terminology was
previously known as short columns according to the BS 8110 designation (McKenzie, 2013).
Partial confinement refers to external confinement by CFRP wrap in the form of 50mm bands
with 50mm spacing between the bands.
Polymer is a typically organic material, composed of molecules characterised by the repetition
of one or more monomeric units (The Concrete Society, 2000).
Resin is an epoxy adhesive commonly used by the application on concrete. It is typically a
solvent-free, two-pack material that cures at ambient temperature (The Concrete Society,
2000).
Slender columns refer to structural members which sustain predominantly compressive
stresses and considerable flexural stresses. Because of the significant flexural stresses, slender
columns experience first-order and second-order moments. The failure mode of slender
columns is by buckling (CEN, 2004).
Steel reinforcement are the steel bars that are installed when placing fresh concrete to make
it reinforced concrete. It is also known as rebar.

13
CHAPTER 2: LITERATURE REVIEW
2.1 Introduction
Fibre composites such as CFRP have been applied in other disciplines of engineering such as
automotive and aerospace. In structural engineering, fibre composites have been used in
aggressive environments such as factories to offer protection against chemical attack (The
Concrete Society, 2000; Wei et al., 2020). This study did not look into such applications; it
focused on the strengthening of concrete structures using CFRP bonded to the surface of the
columns.
There are scenarios in which the axial capacity of a structure may need to be increased. Such
scenarios include: the change of use of a building, where substandard materials were used, or
where the structure was damaged. Steel plates or CFRP may be used to achieve this. According
to The Concrete Society (2000), the techniques developed about that time for CFRP
strengthening used similar principles as for steel plate bonding. CFRP is advantageous to steel
plates in this application; in that they can be used in circumstances where it would be
impractical to use steel. For example, CFRP is very flexible and can be formed into complicated
shapes, unlike steel. CFRP is very light as compared to steel, and last of all is that CFRP is
easily cut to length on site (Abadi et al., 2019).
2.2 Reinforced Concrete Columns
CFRP wrap is used in the strengthening of columns and takes advantage of the Poisson’s effect
in improving concrete strength by confinement. RC columns have steel reinforcement
embedded. Steel reinforcement broadly falls into two categories: longitudinal and transverse.
Longitudinal reinforcement caters for the tension in the columns due to flexure caused by
eccentricity in the resultant load, and part of the compression. The concrete bears most of the
compression. Transverse reinforcement, which is commonly known as stirrups, provides

14
confinement of the concrete core as columns typically experience compression (McKenzie,
2013).
2.3 Theory of Confinement
When a vertical concrete column is subjected to uniaxial compression, the concrete deforms
by a contraction in the longitudinal direction as it expands in the transverse direction. This
phenomenon is known as Poisson’s effect.
Adapted from: Par, 2010
Figure 2.1: Illustration of Poisson’s effect
The lateral expansion results in tension in the column. Concrete has low tensile strength
capacity; hence the tension developed leads to failure of the column. When CFRP resists this
lateral expansion, the concrete is changed to a three-dimensional compressive stress state. In
this state, the performance of the concrete column is significantly influenced by the
confinement pressure (Rahai et al., 2008). CFRP strengthening works by providing external
confinement to the column, thus limiting the lateral expansion. The column is now in a three-
dimensional state with no tension being experienced in the column and thus achieving higher
stress before failure occurs.
Confinement, therefore, affects the stress-strain behaviour of standard concrete. Other factors
influencing the stress-strain curve of confined concrete are concrete column characteristics

15
which are attributed to the modulus of elasticity, strength and Poisson’s ratio. The modulus of
elasticity is the slope of the stress-strain curve within the range of elasticity. It is represented
as change in stress over the change in strain as shown in Equation 2.1.
𝑀𝑜𝑑𝑢𝑙𝑢𝑠 𝑜𝑓 𝑒𝑙𝑎𝑠𝑡𝑖𝑐𝑖𝑡𝑦 =𝐶ℎ𝑎𝑛𝑔𝑒 𝑖𝑛 𝑠𝑡𝑟𝑒𝑠𝑠
𝐶ℎ𝑎𝑛𝑔𝑒 𝑖𝑛 𝑠𝑡𝑟𝑎𝑖𝑛 Equation 2.1
CFRP confinement works by reducing the amount of strain at a particular stress and therefore
alters the modulus of elasticity of the material confined. The strength of the material is
correlated with the stress while the Poison’s ratio determines how much the material deforms
under stress and is related to the strain. These three parameters: modulus of elasticity, strength
and Poisson’s ratio, affect the confinement pressure generated in the confined column under
axial compression. Secondly, the CFRP characteristics such as the CFRP modulus of elasticity
and strength of the composite also affect the stress-strain behaviour. Finally, the cross-section
characteristics, for instance, the geometry and shape, that is, circular, square or rectangular;
play a significant role.
2.3.1 Strengthening Procedures
A Concrete Bridge Development Group (2000) reviewed four forms of strengthening RC
structures. The first technique was to increase the reinforced concrete cross-section. This
solution was readily acceptable by engineers because of its proven track record and is the most
popular rehabilitation technique (Mohammed et al., 2020). It was reported that its most
considerable disadvantage was that loading restrictions have to be imposed as the concrete
cured to the required strength. This technique had negative implications on project schedules
or disruptions, for example, in bridge closures.
The second option reviewed was the use of prestressing to relieve the dead load. Since
prestressing had been used successfully and extensively in the past, engineers were very likely
to recommend this option as well. However, because of the expensive equipment required in

16
applying prestressing forces, this solution may not be technically viable where such equipment
is not readily available.
The third option highlighted was to use steel plate and steel angle bonding to enhance the tensile
reinforcement of the structural elements to be retrofitted. The disadvantages of this procedure
were that: steel has difficult handling and fabrication; steel has the requirement of corrosion
protection, and anchoring of the steel to the concrete section while avoiding significant damage
to the existing member.
The final solution outlined was to add material around the existing structural element to provide
confinement in compression members. Confinement could be achieved by installing in situ
reinforced concrete. Jacketing also had the disadvantage of having to impose loading
restrictions as the concrete cured and attained the desired strength. This solution significantly
increases the overall structural self-weight that affects the foundation and attracts more forces
in seismic events (Mohammed et al., 2020). In situations where space requirements would not
allow a significant increase in cross-section, such as in parking facilities, or where installation
time was critical, the use of CFRP was a viable solution (The Concrete Society, 2000).
2.3.2 Advantages of CFRP
CFRPs have higher ultimate strength and lower density than steel. These two properties, in
combination, lead to fibre composites having the strength to weight ratio higher than the steel
plate (Shrive et al., 2003). CFRPs have a yield stress and a tensile modulus of 4840MPa and
230GPa, respectively; while steel has 275MPa and 210GPa respectively. The density of CFRP
is 2000kg/m3 as compared to steel with 7850kg/m3 (Gulgunje et al., 2015). The lower weight
makes handling and installation considerably easier than steel especially when installing the
material in cramped locations.
Works on soffits to repair slabs or beams may be carried out from human-access platforms
rather than full scaffolding. Steel plates require heavy lifting gear and must be held in place

17
while the adhesive gains strength. On the other hand, once CFRP has been rolled on carefully
to remove entrapped air and excess adhesive, it may be left unsupported. Moreover, since there
is no requirement to drill into the column to fix bolts, there is no risk of damaging the existing
reinforcement.
CFRPs are available in very long lengths while steel plates are generally limited to six metres.
CFRP is durable if correctly specified, and requires little maintenance. If damage occurs in
service, it is relatively simple to repair them by adding another CFRP layer (Khaled et al.,
2018).
The use of CFRP does not significantly increase the weight of the structure or the dimensions
of the member. This property of CFRP is essential in the repair of bridges and other structures
with limited headroom. CFRP has high economic benefits by minimising the time the structure
is off-service (Mohammed et al., 2020). CFRPs are used in the maintenance of infrastructure
located in marine environments not only to offer structural strengthening but also to offer
cathodic protection (Wei et al., 2020).
In terms of environmental impact and sustainability, studies have shown that the amount of
energy required to produce CFRP is less than that for conventional materials. CFRP has a
minimal environmental impact (The Concrete Society, 2000).
2.3.3 Disadvantages of CFRP
The main disadvantage of using CFRP is the risk of fire or mechanical damage. Mechanical
damage can be caused by vandalism or accidental damage unless the strengthening is protected.
Studies and experience of the long-term durability of CFRP are scarce (The Concrete Society,
2000).

18
The lack of adequate knowledge is a disadvantage for structures for which a very long design
life is required, but this can be overcome by appropriate monitoring. A perceived disadvantage
of using CFRP is the relatively high cost of the materials.
The last significant disadvantage of using CFRP is the lack of accepted design standards on
CFRP strengthening. This study attempted to address that challenge by developing a rationale
in which the axial strength and ductility of strengthened columns can be determined based on
scientific principles.
2.4 CFRP Properties
Some mechanical properties of the carbon fibre that are essential for the design of CFRP
strengthening are the tensile strength, tensile modulus and elongation at break.
2.4.1 Performance of CFRP
Carbon fibre is resistant to most forms of chemical attack, which increases its utility in
structural engineering applications. Nonetheless, there is evidence to suggest that in the
presence of salts, fracture of the carbon fibres can occur due to the formation of angular crystals
(The Concrete Society, 2000).
Carbon fibres can be used for exterior retrofits as the fibres are not affected by ultraviolet light.
However, direct exposure to sunlight usually embrittles the resins, and protective paint is
recommended if direct exposure to the elements is likely (The Concrete Society, 2000).
Carbon fibres have some electrical conductivity, and therefore, in Japan, CFRP strengthening
material in railway application close to power lines must be electrically isolated from any steel
reinforcement. With regards to stiffness, the elastic modulus value of carbon fibre varies from
that of steel (210GPa) to significantly higher than that. (230GPa – 500GPa) (Gulgunje et al.,
2015). When exposed to fire, carbon fibres oxidise in air above 650°C, but in this case, the
resin polymer behaviour usually dominates performance and usually generates toxic smoke.
All fibres, carbon fibre included, present a risk to human health in regular use. Proper care

19
should be taken when cutting and machining all CFRP materials because fine fibre particles
may irritate skin, eyes and mucous membrane. In addition to that, protective attire must be
worn when handling the resin polymer. Carbon fibres cause an insignificant effect on the
environment. Carbon fibres are non-toxic, inert and are not considered as hazardous waste.
Furthermore, approaches have been developed to recycle composites (The Concrete Society,
2000).
2.5 Fibre Type
The fibre type determines the amount of confinement pressure that can be generated in the
column. There are three main types of fibres utilised in FRP strengthening: glass, aramid and
carbon fibre. Glass fibres are more cost-effective than carbon fibres. However, carbon fibres
have superior characteristics in terms of strength. Aramid fibres have lower tensile load
capacities compared to the other fibre types (Mohammed et al., 2020).
2.6 Stress-Strain Relationships for Confined Concrete
The design of CFRP strengthening systems is based on limit state principles. The aim of the
limit state design is the achievement of an acceptable probability that the structure being
strengthened will perform satisfactorily during its design life. Design involves checking that
the structure does not reach a limit state during its intended life which may render it unfit for
use. Limit states can either be ultimate or serviceability. Ultimate limit states typically
encompass mechanisms that cause the partial or complete collapse of the structure. In contrast,
serviceability limit states correspond to states which principally affect the appearance or proper
performance of the structure. This study investigated compression strength at the ultimate limit
state and the deflection at the serviceability limit state.
Several researchers (Saafi et al., 1999; Toutanji et al., 2007) proposed models that attempt to
predict the compressive stress-strain behaviour of confined concrete. A large body of work
relates to steel rather than CFRP confined concrete. The first studies to be conducted with

20
regards to confined concrete were performed by Richart et al. (1928) and established Equation
2.2 (The Concrete Society, 2000).
𝑓𝑐𝑘,𝑐 = 𝑓𝑐𝑘 + 4.1𝜎2
𝑓𝑐𝑘 Equation 2.2
where 𝑓𝑐𝑘 = unconfined compressive strength
𝑓𝑐𝑘,𝑐 = confined compressive strength
𝜎2 = confinement pressure
Other researchers interested in the effect of steel confined concrete confirmed the validity of
Equation 2.2. The confirmation was surprising considering the difference between the two
modes of confinement applied. In the experimental programme conducted by Richart et al.
(1928), the test specimens were subjected to active confinement due to hydrostatic pressure;
hence the confinement pressure remained constant throughout the test. The other studies used
steel reinforcement which offers passive confinement since the confining stress is neither
uniform nor constant. Further research done on CFRP confirmed the applicability of Equation
2.2 to confined concrete. Comparison of the predicted and actual experimental results showed
that, whereas the proposed models were sufficiently accurate concerning strength prediction,
they grossly underestimated the ultimate strain. Consequently, significant discrepancies in the
actual and predicted stress-strain responses existed (The Concrete Society, 2000). Following
that realisation, Lilliston and Jolly (2000) conducted further research and showed that the strain
response of FRP confined concrete could be predicted using Equation 2.3.
𝑓𝑐𝑘,𝑐 = 0.67
𝛾𝑚𝑐×
(𝐸𝑖 − 𝐸𝑝)𝜀𝑐2,𝑐
1 + [𝜀𝑐2,𝑐(𝐸𝑖 − 𝐸𝑝)𝑓0] Equation 2.3
where 𝜀𝑐2,𝑐 = axial confined concrete strain
𝐸𝑖 = initial tangent modulus of concrete strain given as:
𝐸𝑖 = 21500 [(0.8𝑓𝑐𝑘 + 8)
10]
13
Equation 2.4

21
𝐸𝑝 = post-crushing tangent modulus
𝐸𝑝 = 1.282 (2𝑡𝑓
𝐷) 𝐸𝑓𝑑 Equation 2.5
𝐷 = diameter of the column
𝑓0 = intercept of post-crushing tangent modulus with the stress axis given by:
𝑓0 = 0.8𝑓𝑐𝑘(𝐸𝑖 − 𝐸𝑝)
(𝐸𝑡 − 𝐸𝑖) Equation 2.6
𝐸0 = secant modulus of plain concrete
𝐸0 = (0.8𝑓𝑐𝑘 + 8)𝜀𝑐𝑢2 Equation 2.7
𝜀𝑐𝑢2 = ultimate strain on plain unconfined concrete.
Equation 2.3 is similar to Equation 2.8 for CFRP confined concrete by Arduini et al. (1999).
Equation 2.8 was based on the experimental work of Miyauchi et al. (1997).
𝑓𝑐𝑘,𝑐 = 0.67
𝛾𝑚𝑐×
(𝐸𝑖 − 𝐸𝑝)𝜀𝑐2,𝑐
1 + [𝜀𝑐2,𝑐(𝐸𝑖 − 𝐸𝑝)𝑓0] Equation 2.8
where 𝐸0 = secant modulus of concrete strain given by:
𝐸0 = 9.5 (𝑓𝑐𝑘 + 8)1
3 [𝐸0 in kN/mm2; 𝑓𝑐𝑘in MPa] Equation 2.9
𝜀𝑐2,𝑐 = axial confined concrete strain
𝑛 = empirical factor = 8
𝐸𝑝 = post crushing tangent modulus
𝐸𝑝 = (𝑓𝑐𝑘,𝑐 − 𝑓𝑐𝑘)
𝜀𝑐2,𝑐 Equation 2.10
𝑓𝑐𝑘,𝑐 = characteristic strength of confined concrete
𝑓𝑐𝑘,𝑐 = 𝑓𝑐𝑘 + 4 × 0.85𝑓𝑡𝑑𝑡𝑓
𝑅 Equation 2.11
𝜀𝑐𝑢2,𝑐 = ultimate axial strain of confined concrete
𝜀𝑐𝑢2,𝑐 = 𝜀𝑓𝑢
𝜈𝑐(1 + √
𝑓𝑐𝑘𝑅
𝑓𝑡𝑑𝑡𝑓) Equation 2.12
𝑓𝑡𝑑 = ultimate design tensile strength of CFRP
𝜀𝑓𝑢 = design ultimate tensile strain of CFRP

22
𝑅 = radius of column
𝜈𝑐 = Poisson’s ratio for concrete = 0.2
Comparisons of predicted results as proposed by Arduini et al. (1999) and that by Lilliston and
Jolly (2000) exhibited similarities and accuracy with regards to confined strain. Likewise,
further comparison of predicted values and experiment results from other studies (Saafi et al.,
1999; Toutanji et al., 2007), showed good agreement between the empirical and the calculated
values (The Concrete Society, 2000).
2.6.1 Anomalies in the Equations
A check of the equations in the publication by The Concrete Society (2000), reproduced here
as Equation 2.2 all the way to Equation 2.12 shows that the equations may not be entirely
accurate. Looking at Equation 2.2, the first term 𝑓𝑐𝑘, would have the units in Megapascals
(MPa) while the second term 𝜎2
𝑓𝑐𝑘, would be dimensionless because the units of the numerator
(MPa) would cancel out with the units of the denominator. This error is replicated in all the
equations from Equation 2.2 to Equation 2.12. The anomalies in these expression underpin the
importance of conducting confirmatory studies on these equations.
2.6.2 Local Design Process
Kenya adopted the Eurocodes which provides some guidance with regards to confined concrete
(Republic of Kenya, 2014). In the specific Eurocode standard EN 1992-1-1:2004; clause 3.1.9
(1) states that confining concrete results in an adjustment of the effective stress-strain
relationship whereby higher strength and higher critical strains may be achieved. For design
purposes, other essential material characteristics may be considered as unaffected (CEN, 2004).
EN 1992-1-1:2004 gives a design procedure where the characteristic strength of the concrete
may be increased according to Equation (3.24) and Equation (3.25) reproduced as Equation
2.13 and Equation 2.14 respectively.

23
EN 1992-1 (3.24) 𝑓𝑐𝑘,𝑐 = 𝑓𝑐𝑘 (1.000 + 5.0𝜎2
𝑓𝑐𝑘) 𝑓𝑜𝑟 𝜎2 ≤ 0.05𝑓𝑐𝑘 Equation 2.13
EN 1992-1 (3.25) 𝑓𝑐𝑘,𝑐 = 𝑓𝑐𝑘 (1.125 + 2.5𝜎2
𝑓𝑐𝑘) 𝑓𝑜𝑟 𝜎2 > 0.05𝑓𝑐𝑘 Equation 2.14
According to EN 1992-1-1:2004, we may also get additional strains as given in equation (3.26)
and equation (3.27):
EN 1992-1 (3.26) 𝜀𝑐2,𝑐 = 𝜀𝑐2 (𝑓𝑐𝑘,𝑐
𝑓𝑐𝑘)
2
Equation 2.15
EN 1992-1 (3.27) 𝜀𝑐𝑢2,𝑐 = 𝜀𝑐𝑢2 + 0.2𝜎2
𝑓𝑐𝑘 Equation 2.16
Where 𝜎2 (= 𝜎3) is the effective lateral compressive stress at the ULS due to confinement and
𝜀𝑐2 = 0.002 and 𝜀𝑐𝑢2 = 0.0035. Figure 3.6 of EN 1992-1-1, reproduced here as Figure 2.2
shows the stress-strain curve for confined concrete (CEN, 2004). The units of the expressions
given in EN 1992-1-1 by CEN (2004) are consistent and do not have the challenges of Equation
2.2 to Equation 2.12 given by The Concrete Society (2000).
Source: CEN, 2004
Figure 2.2: Stress-strain relationship for confined concrete.
It is, however, beneficial to note that since CFRP is typically applied after loading has been
applied, there is little confinement pressure caused by the CFRP wrap. The confinement

24
pressure only comes into play once deformation has occurred in the column as it is loaded. This
kind of confinement is passive (Arduini et al., 1999). The effective lateral compressive stress
𝜎2 and 𝜎3, is therefore unknown and requires further research to establish its value. As the
confinement pressure increases, the more the deformation in the concrete column (Shrive et
al., 2003).
Several studies have been conducted investigating CFRP strengthening on columns. Some of
the findings are presented in the following sections categorised by the independent variables
of this study.
2.7 Concrete Grade
Shrive et al. (2003) used a simple analysis of circular columns, performed finite element
analysis of a chamfered column and concluded that the confining effect of the wrap was not
engaged until the concrete started failing and dilating. The strain readings analysed confirmed
the conclusion arrived at; columns composed of weaker strength grades fail at lower axial stress
and dilate more than columns of stronger concrete grades. This higher dilation will cause higher
lateral pressures and more confining effect on the weaker columns resulting in an increased
axial capacity gain. It was found that strength gains can be expected to reduce with increasing
strength of the concrete. The finding showed that there is an inverse relationship between
concrete strength grade and an increase in gain in strength.
2.8 Reinforcement
Shrive et al. (2003) investigated reinforced and prestressed concrete columns with one or two
layers of CFRP wrap to failure in axial compression. This study found the predictions of two
proposed design methods consistently underestimated actual failure loads and that the design
procedure was thus conservative. That study did not investigate strengthening on plain
concrete.
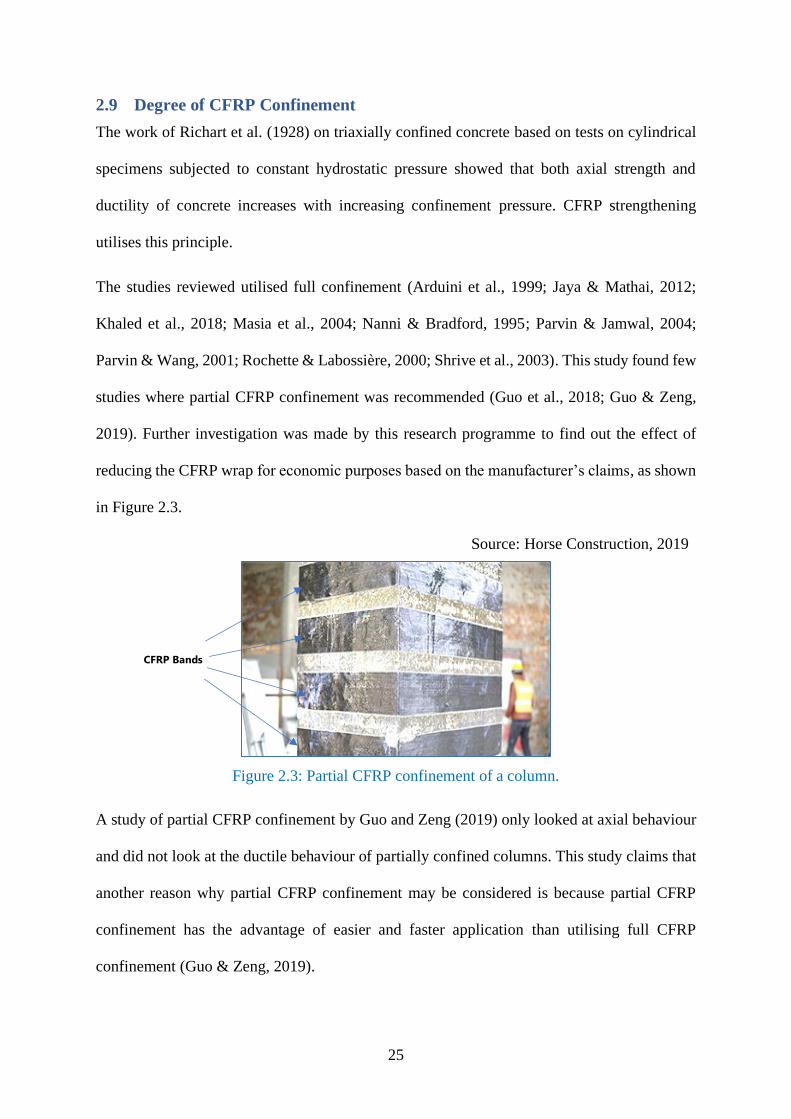
25
2.9 Degree of CFRP Confinement
The work of Richart et al. (1928) on triaxially confined concrete based on tests on cylindrical
specimens subjected to constant hydrostatic pressure showed that both axial strength and
ductility of concrete increases with increasing confinement pressure. CFRP strengthening
utilises this principle.
The studies reviewed utilised full confinement (Arduini et al., 1999; Jaya & Mathai, 2012;
Khaled et al., 2018; Masia et al., 2004; Nanni & Bradford, 1995; Parvin & Jamwal, 2004;
Parvin & Wang, 2001; Rochette & Labossière, 2000; Shrive et al., 2003). This study found few
studies where partial CFRP confinement was recommended (Guo et al., 2018; Guo & Zeng,
2019). Further investigation was made by this research programme to find out the effect of
reducing the CFRP wrap for economic purposes based on the manufacturer’s claims, as shown
in Figure 2.3.
Source: Horse Construction, 2019
Figure 2.3: Partial CFRP confinement of a column.
A study of partial CFRP confinement by Guo and Zeng (2019) only looked at axial behaviour
and did not look at the ductile behaviour of partially confined columns. This study claims that
another reason why partial CFRP confinement may be considered is because partial CFRP
confinement has the advantage of easier and faster application than utilising full CFRP
confinement (Guo & Zeng, 2019).
CFRP Bands

26
2.10 CFRP Thickness
CFRP thickness has substantial effects on the strength and ductility of repaired columns
(Mohammed et al., 2020). Thickness was directly related to the exerted confinement pressure
of the FRP jacket as the confinement effectiveness increases with the higher thickness
(Ozbakkaloglu, 2013).
Saafi et al. (1999) tested non-slender concrete columns confined with FRP tubes under uniaxial
compressive load to investigate the effects of FRP jacket thickness in addition to fibre type and
concrete strength. It was reported that FRP jacket thickness has a direct relationship with the
increase in axial capacity and ductility of the columns. Rochette and Labossière (2000) axially
tested the effect of wrap thickness and cross-section shape of non-slender columns on its
strength and also came to similar conclusions; CFRP thickness increases axial capacity and
ductility.
Parvin and Wang (2001) performed an experimental and numerical analysis of FRP jacketed
square concrete columns under eccentric loading. Later, Parvin and Jamwal (2004)
investigated small-scale FRP wrapped concrete cylinders under uniaxial compressive loading
through nonlinear finite element analysis. This subsequent investigation found that an increase
in wrap thickness had a positive change on axial strength and ductility of the concrete cylinders.
The results from the two separate studies thus showed that the strength and ductility of concrete
columns could significantly increase due to CFRP strengthening (Parvin & Jamwal, 2004;
Parvin & Wang, 2001).
Shehata et al. (2002) conducted an experimental research programme that included tests on 54
non-slender columns to find out the gain in axial capacity and ductility of concrete columns
externally confined by CFRP wrap. The variables studied in the programme were column
cross-section shape and the amount of confinement expressed in the number of CFRP sheets
applied to the specimen. The number of layers was limited to a maximum of two. Shrive et al.

27
(2003) investigated the effect of wrap thickness and showed that whereas strength gain is
directly related to CFRP wrap thickness, the relationship is not linear.
2.11 Column shape
Most of the available studies on the behaviour of FRP confined concrete columns have focused
on circular columns, while relatively few studies have looked into rectangular columns
(Toutanji et al., 2007). The column given in Figure 3.6 of the Eurocode, EN 1992-1-1:2004, is
that of a cylindrical specimen with a circular cross-section. The bias on circular columns is
somewhat because a square section is not uniformly confined, and the compressive pressure is
unevenly distributed.
Nanni and Bradford (1995) test specimens consisted of 150 x 300 mm high cylinders to verify
existing analytical models. Their experimental results indicated that the FRP jackets increased
the ductility and strength significantly. Mirmiran et al. (1997) also used cylinders which had
FRP jackets and found that there was a significant increase in axial capacity and ductility. Their
findings indicated that, as the jacket thickness increased, the strength and ductility increased as
well.
In square and rectangular cross-sections, the stress-strain curve is affected by the radius to
which the corners of the sections are rounded off in order to avoid the breakage of fibres.
Rounding of corners leads to a reduction in cross-section area leads to a corresponding decrease
in axial capacity. This reduction in strength may lead to catastrophe for buildings already
vulnerable to collapse. This research programme did not round the corners of the square
columns. Failure to round the corners of square columns would have the effect of reduced
confined area (Masia et al., 2004).

28
Source: Masia et al., 2004
Figure 2.4: Increased confined areas for increased rounding radiuses.
Despite the effectiveness of CFRP confinement in circular columns, square columns are usually
preferred because of ease in the fabrication of formworks, constructability and architectural
reasons (Guo et al., 2018; Guo & Zeng, 2019).
2.12 Size of the Columns
Masia et al. (2004) investigated the size effects of square columns. That study found significant
effects in axial capacity and ductility were achieved by wrapping. The effectiveness of the
wrap, as measured by the percentage increases in strength and peak axial strain, reduced with
increasing cross-sectional size. The bigger the column cross-section, the less the effect of CFRP
strengthening.
2.13 Theories of Failure
Theories of failure are the criteria use to predict the failure of a material under multi-axial
stress. Failure is defined as the point at which the material can no longer perform its design
function. Failure occurs due to complete failure characterised by brittle fracture or by excessive
deformation characterised by ductile failure. Under axial loading, the stress-strain curve can be
used to represent the response until failure. Under multi-axial stress, failure theories are needed
for representing the material behaviour based on plasticity or yielding and fracture. Certain
theories have been advanced to explain the cause of failure and many of theories have received
considerable experimental investigation. No great uniformity of opinion has been reached, and
there is still room for a great deal of further experimental investigation.
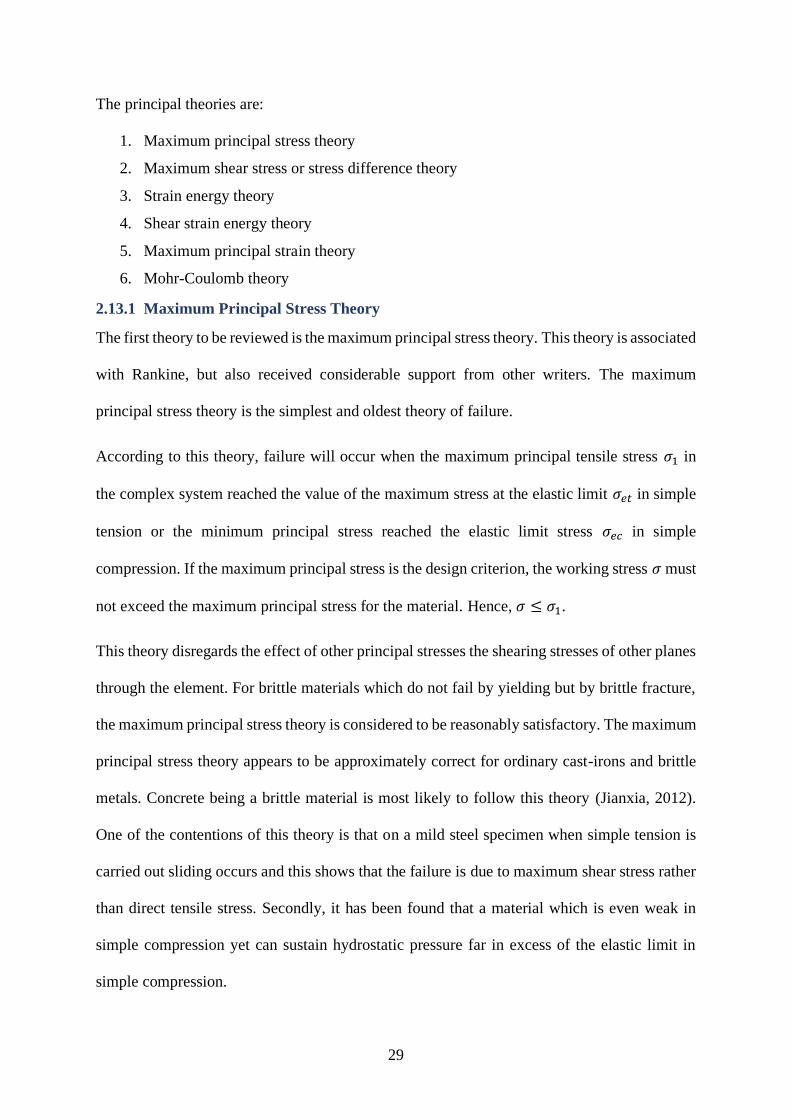
29
The principal theories are:
1. Maximum principal stress theory
2. Maximum shear stress or stress difference theory
3. Strain energy theory
4. Shear strain energy theory
5. Maximum principal strain theory
6. Mohr-Coulomb theory
2.13.1 Maximum Principal Stress Theory
The first theory to be reviewed is the maximum principal stress theory. This theory is associated
with Rankine, but also received considerable support from other writers. The maximum
principal stress theory is the simplest and oldest theory of failure.
According to this theory, failure will occur when the maximum principal tensile stress 𝜎1 in
the complex system reached the value of the maximum stress at the elastic limit 𝜎𝑒𝑡 in simple
tension or the minimum principal stress reached the elastic limit stress 𝜎𝑒𝑐 in simple
compression. If the maximum principal stress is the design criterion, the working stress 𝜎 must
not exceed the maximum principal stress for the material. Hence, 𝜎 ≤ 𝜎1.
This theory disregards the effect of other principal stresses the shearing stresses of other planes
through the element. For brittle materials which do not fail by yielding but by brittle fracture,
the maximum principal stress theory is considered to be reasonably satisfactory. The maximum
principal stress theory appears to be approximately correct for ordinary cast-irons and brittle
metals. Concrete being a brittle material is most likely to follow this theory (Jianxia, 2012).
One of the contentions of this theory is that on a mild steel specimen when simple tension is
carried out sliding occurs and this shows that the failure is due to maximum shear stress rather
than direct tensile stress. Secondly, it has been found that a material which is even weak in
simple compression yet can sustain hydrostatic pressure far in excess of the elastic limit in
simple compression.

30
2.13.2 Maximum Shear Stress or Stress Difference Theory
The second theory is the maximum shear stress theory and is also known as stress difference
theory. This theory is also called Guest’s or Tresca’s theory. This theory implies that failure
will occur when the maximum shear stress 𝜏𝑚𝑎𝑥 in the complex system reaches the value of
the maximum shear stress in simple tension at the elastic limit. This theory gives good
correlation with results of experiments on ductile materials. This theory has been found to give
quite satisfactory results for ductile materials. The demerits of this theory are that: it does not
give accurate results for the state of stress or pure shear in which the maximum amount of shear
is developed such as in a torsion test. The theory is not applicable in the case where the state
of stress consists of triaxial tensile stresses of nearly equal magnitude reducing the shearing
stress to a small magnitude so that failure would be by brittle fracture than by yielding. Lastly,
the theory does not give as close results as found by experiment on ductile materials. However,
it gives safe results.
2.13.3 Strain Energy Theory
This theory which has a thermodynamic analogy and a logical basis is due to Haigh. This theory
states that the failure of a material occurs when the total strain energy in the material reaches
the total strain energy of the material at the elastic limit in simple tension. However, the results
of this theory are not similar to experimental results for ductile materials. This theory does not
apply to materials for which maximum elastic tensile stress is quite different from elastic
compressive stress. This theory does not give results exactly equal to the experimental results
even for ductile materials, even though the results are close to the experimental.
2.13.4 Shear Strain Energy Theory
This theory is also called ‘Distortion energy theory’ or ‘Mises-Henky theory’. According to
this theory, the elastic failure occurs where the shear strain energy per unit volume in the

31
stressed material reaches a value equal to the shear strain energy per unit volume at the elastic
limit point in the simple tension test.
The contentions of this theory are that it does not agree with experimental results for the
material for which maximum elastic tensile stress is quite different from maximum elastic
compressive stress. Secondly, the theory gives 𝜎𝑒𝑡 = 0 for hydrostatic pressure or tension,
which means the material will never fail under any hydrostatic pressure or tension and this is
obviously not correct. Actually, when three equal tensions are applied in three principal
directions, brittle fracture occurs and as such maximum principal stress theory will give reliable
results in this case. Lastly, this theory is regarded as one to which conform most of the ductile
materials under the action of various types of loading.
2.13.5 Maximum Principal Strain Theory
This theory is associated with Saint Venant. The theory states that the failure of a material
occurs when the principal tensile strain in the material reaches the strain at the elastic limit in
simple tension or when the minimum principal strain, that is, the maximum principal
compressive strain reaches the elastic limit in simple compression (CEN, 2004).
The disadvantage of this theory is that it overestimates the behaviour of ductile materials and
the theory does not fit well with the experimental results except for brittle materials for biaxial
tension, for which it is sometimes recommended, and is not much used in practice.
2.13.6 Mohr-Coulomb Theory
Mohr–Coulomb theory is a mathematical model describing the response of brittle materials
such as concrete, soils, or rubble piles, to shear stress as well as normal stress. Most of the
classical engineering materials somehow follow this rule in at least a portion of their shear
failure envelope. Generally, the theory applies to materials for which the compressive strength
far exceeds the tensile strength (Juvinall & Marshek, 2019).

32
2.14 Expressions
Some of the expressions, found in the literature, for estimating the confined concrete strength
and the axial strain at failure are summarised in Table 2.1.
Table 2.1: Summary of expressions for confined concrete properties in literature.
Author Type of Confinement Strength 𝒇𝒄𝒌,𝒄 Ultimate Axial Strain 𝜺𝒄𝒖,𝒄
Saafi et al.
(1999)
CFRP and CFRP encased
concrete 𝑓𝑐𝑘 [1 + 2.2 (
𝑓𝑡
𝑓𝑐𝑘)
0.84
] 𝜀𝑐𝑢 [1 + (537𝜀𝑓 + 2.6) (𝑓𝑐𝑐
𝑓𝑐𝑘− 1)]
Toutanji et
al. (2007)
CFRP and GFRP wrapped
concrete 𝑓𝑐𝑘 [1 + 3.5 (
𝑓𝑡
𝑓𝑐𝑘)
0.85
] 𝜀𝑐𝑢 [1 + (310.57𝜀𝑓 + 1.9) (𝑓𝑐𝑐
𝑓𝑐𝑘− 1)]
Spoelstra
& Monti
(1999)
CFRP and GFRP wrapped
encased concrete 𝑓𝑐𝑘 [0.2 + 3 (
𝑓𝑡
𝑓𝑐𝑘)
0.5
] 𝜀𝑐𝑢 [2 + 1.25𝐸𝑐
𝑓𝑐𝑘𝜀𝑓 (
𝑓𝑓
𝑓𝑐𝑘)
0.5
]
Eurocode
EC2 (2004)
Any
𝑓𝑜𝑟 𝜎2 ≤ 0.05𝑓𝑐𝑘
𝑓𝑐𝑘 [1.000 + 5.0𝜎2
𝑓𝑐𝑘] 𝜀𝑐2,𝑐 = 𝜀𝑐2 [
𝑓𝑐𝑘,𝑐
𝑓𝑐𝑘]
2
Any
𝑓𝑜𝑟 𝜎2 > 0.05𝑓𝑐𝑘
𝑓𝑐𝑘 [1.125 + 2.5𝜎2
𝑓𝑐𝑘] 𝜀𝑐𝑢2,𝑐 = 𝜀𝑐𝑢2 + 0.2
𝜎2
𝑓𝑐𝑘
The main challenge of using these expressions is that they have parameters which are not
known. For example, the expressions from Eurocode 2 have the parameter 𝜎2, which denotes
the confinement pressure. The confinement pressure 𝜎2, is however not known and varies with
the pressure applied (Shrive et al., 2003). The lack of knowledge on these parameters
necessitates the need to conduct further research on confined concrete.
2.15 Contentions with Previous Studies on CFRP Confined Concrete
Several studies (Khaled et al., 2018; Mirmiran & Shahawy, 1997; Nanni & Bradford, 1995)
used circular cylinders, whereas this research used square columns. Previous research has a
bias to circular columns which have a higher degree of confinement than in square columns as
evidenced in the study by Masia et al. (2004).
The design procedure advocated by Eurocode 2 (EN 1992-1-1) assumes that the lateral pressure
is known and constant however other literature shows that the confining effects of the wrap are
not engaged until the concrete fails and dilates causing confinement pressure that varies with
the deformation experienced in the concrete (Shrive et al., 2003).

33
The equations highlighted in Table 2.1 do not have a variable to cater for the effect of thickness
of the CFRP wrap or the confining material and the design methods use the simple extension
of the models developed for conventional reinforced concrete columns (Mirmiran & Shahawy,
1997).
2.16 Failure Modes of Columns Under Compression
The degree of platen restraint on the concrete section depends on the friction developed at the
interface of the concrete specimen and steel platen, and on the distance from the end surfaces
of the concrete. Consequently, in addition to the imposed uniaxial compression, there is a
lateral shearing stress, the effect of which is to increase the apparent compressive strength of
the concrete. The influence of platen restraint can be seen from the typical failure modes of test
cubes, shown in Figure 2.5. The effect of shear is always present. That effect decreases towards
the centre of the cube, so that the sides of the cube have near-vertical cracks, or completely
disintegrate to leave a relatively undamaged central core (a) and (b) of Figure 2.5. This type of
failure happens when testing in a rigid testing machine, but a less rigid machine can store more
energy so that an explosive failure is possible as shown in Figure 2.5 (c); one face touching the
platen cracks and disintegrates to leave a pyramid or a cone. Types of failure, for instance,
those shown in Figure 2.6, are regarded as unsatisfactory and indicate a probable fault in the
testing apparatus (Neville & Brooks, 2010).
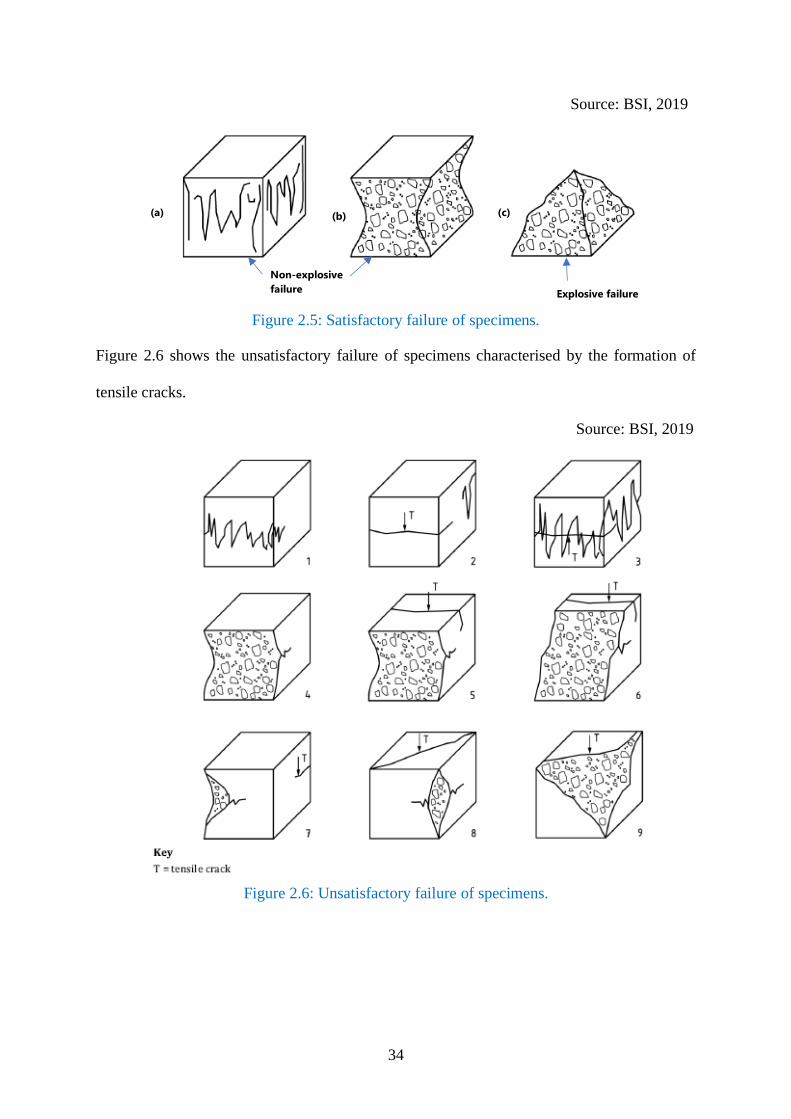
34
Source: BSI, 2019
Figure 2.5: Satisfactory failure of specimens.
Figure 2.6 shows the unsatisfactory failure of specimens characterised by the formation of
tensile cracks.
Source: BSI, 2019
Figure 2.6: Unsatisfactory failure of specimens.
Explosive failure
Non-explosive
failure
(a) (b) (c)

35
2.17 Literature Gap
An accurate prediction of the stress-strain curve of composite confined concrete is rather
complex to obtain due to the high number of variables that affect the model (Shehata et al.,
2002). With this realisation and despite extensive work on CFRP on concrete columns, there
is little research with regards to the effect of CFRP on non-slender columns when comparing:
1. Concrete strength grades.
2. Plain and reinforced concrete.
3. Partial and full confinement.
An experimental programme is necessary to find out the effect of these parameters.
2.18 Experimental Design
An experimental design is helpful when carrying out an investigation where there are several
variables to be investigated so that a conclusion could be drawn regarding a hypothesis
statement. The intention is to establish the effect that a factor or an independent variable has
on a dependent variable. The experimental design is used to test and validate the relationship
between and among experimental variables (Bell, 2009). Experimental design is a procedure
in the creation of a detailed experimental plan that allows the maximum amount of information
specific to the objectives to be obtained (McIntosh & Pontius, 2017). This procedure enables
the research to maintain control over other factors that affect the result of an experiment.
Optimisation of an experimental design refers to the process whereby maximum amount of
useful information is obtained with the minimum number of experiments (Poole & Poole,
2012). One factor can be varied at a time to find out the effect of that factor. The procedure of
varying one factor at a time requires that several controls with different treatment to be set up.
To find out the combined effect of all the factors, the tested samples can be compared against
the different controls. To make this comparisons, and to draw conclusions from the data;
statistical tests are usually conducted (Bell, 2009).

36
2.19 Statistical Tests
At times random variations can make it difficult to know if there are true differences or whether
it is just random. Test statistics are calculated from sample data and allow us to quantify how
close; things are to our expectation or theories. Test statistics allow us to add mathematical
rigour to the test process to facilitate decision-making. The amount of variance in a group is
really important in judging a difference (Brangard, 2018b). In order to test the significance and
the trends in the data, three main statistical analysis methods are considered. The tests are the
z-score, t-test and the Analysis of Variance (ANOVA).
2.19.1 Z-Score
The z-score also called the z-statistic or z-test tells us how many standard errors away from
the sampling distribution is from our group mean is. The z-statistic of around 1 or -1 tells us
that the typical distance we would expect a typical sample mean to be from the mean of the
null hypothesis is one standard deviation (Molugaram & Rao, 2017). We can use z-tests to do
hypothesis tests about means, differences between means, proportions, or even differences
between proportions. Critical value is a value of our test statistic that marks the limits of our
extreme values. A test statistic that is more extreme than these critical values that is towards
the tails causes the rejection of the null hypothesis. The critical value is calculated by finding
out which test-statistic value corresponds to the top 0.5%, 1% or 5% most extreme values. For
a z-test with 𝛼 = 0.05, the critical values are 1.96 and -1.96. If the z-statistic is more extreme
than the critical value, it is statistically significant. The z-test is used where there is the
population standard deviation (Brangard, 2018a). In some situations, a z-test does not apply,
and when that happens, we use the t-distribution and corresponding t-statistic to conduct a
hypothesis test.
2.19.2 T-Test
The t-test is similar to the z-test. It uses the same general formula for its t-statistic. We use a t-
test if we do not know the true population standard deviation (Brangard, 2018c). The t-statistic

37
is similar to the z-statistic, except that we are using our sample standard deviation instead of
the population standard deviation in the denominator. The t-distribution looks like the z-
distribution, but with thicker tails. Estimation adds a little more uncertainty which means
thicker tails, since extreme values are a little more common. But as we get more and more data,
the t-distribution converges to the z-distribution. This implies that, with really large samples,
the z-test and t-test should give us similar p-values. The tails are thicker because we are
estimating the true population standard deviation. In situation where the population standard
deviation is available, a z-test is most favourable. A t-test is favourable when the population
standard deviation is not available. T-tests are good for testing the difference between two
groups.
For the z-test and the t-test, two methods are used to decide whether something was significant:
Critical values and p-values. These two methods are equivalent. Large test statistics and small
p-values both refer to samples that are extreme. A test statistic that is bigger than the critical
value allows us to reject the null hypothesis. A test statistic that is larger than the critical value
will have p-value less than 0.05. So, the two methods lead us to the same conclusion. But we
often use the p-values instead of critical values because each test-statistic, like the z-statistic or
t-statistic, have different critical values, but a p-value of less than 0.05 means that your sample
is in the top 5% of extreme samples regardless of the test-statistic method such as the f-test or
chi-square. Test statistics form the basis of how we can test if things are actually different or
what we are seeing is just normal variation. They help us know how likely it is that our results
are normal, or if something interesting is going on (Brangard, 2018b). T-distributions are used
when the number of samples is less than 30.
Alternatively, another statistical method called ANOVA could be used to compare the three
groups. This study had more than the 30 samples and thus ANOVA would be used.

38
2.19.3 Analysis of Variance Test (ANOVA)
The analysis of variance test is also known as ANOVA. Unlike the t-test which measures the
variations between two groups, ANOVA is used to test the difference between multiple groups
(Brangard, 2018d). It is used whenever there is a measurement of more than two groups. It uses
the general linear model framework.
2.19.4 Post hoc tests after ANOVA
The ANOVA tests if there is a difference between multiple groups. The ANOVA test will
however not tell which group is different from which. Post hoc tests are necessary to do
comparisons between multiple groups that have already been done using ANOVA. Post hoc
tests are pairwise comparisons that are often made after conducting a variety of inferential
statistical procedures such as ANOVA. Some post hoc tests and their characteristics are given
a brief highlight. Post hoc tests do not run if there are only two levels of independent variables
(Grande, 2015). Post hoc tests are omnibus tests. Omnibus tests are tests that contain many
items or groups (Brangard, 2018d).
There are several post hoc tests. The researcher selects the best possible method for analysis.
Types of post hoc tests in the software used for analysis are discussed (Grande, 2015). Least
significant difference (LSD) test is not ideal as it does not control for type I error inflation so
the LSD is considered a liberal post hoc test since the probability of a type I error is high as
compared to a conservative test where the probability of a type I error is low.
The Bonferonni method is a good post hoc test for controlling for type I error and it has good
statistical power when the number of comparisons is low (IBM Corp., 2021). The term
statistical power means the ability to detect a difference that is really there. If you want a control
for the type I error but you have a large number of comparisons the Tukey post hoc test is a
popular method. The REGWQ is good for controlling Type I errors and has good statistical
power (IBM Corp., 2021). The REGWQ is not good when group sizes are different.
39
Two post hoc test that are good when comparing group sizes are different are Hotchberg’s GT2
and Gabriel. If the group sizes are slightly different, the Gabriel method is the better. When the
group sizes are greater, the Hotchberg’s GT2 is a better choice (Grande, 2015).
Regardless of the post hoc test method used, the conclusions that could be drawn from using
these tests are identical. Only the significance values may be different depending on the post
hoc test used. Usually one post hoc method is selected based on the characteristics of the
research design, the design data and group sizes (Grande, 2015).
2.19.5 Level of Confidence
The level of confidence shows how confident the study is in its decision (Brangard, 2018b).
This has the abbreviation of c.
2.19.6 Level of Significance
The level of significance is denoted by 𝛼 and is the complement of the level of confidence. The
𝛼-level is arbitrary but 0.05 is typically used in several other studies. The value of 0.05 means
that only 5% of tests done on groups with no real difference will incorrectly reject the null
hypothesis resulting in a type I error (Brangard, 2018c).
𝛼 = 1 − 𝑐 Equation 2.17
where 𝛼 = level of significance.
𝑐 = level of confidence.
2.19.7 Type I and Type II errors
There are two possible outcomes when performing a hypothesis test. A correct decision or an
error may be made. An error is made when a true hypothesis is rejected or when a false
hypothesis is accepted. A Type I error is made when a true hypothesis is rejected while a Type
II error is made when a false hypothesis is accepted. Increasing the level of significance 𝛼,
increases the likelihood of committing a Type I error. Increasing the mean, increases the
likelihood of committing a Type II error. To decrease the likelihood of committing Type I or
Type II errors, the sample size is usually increased.

40
2.20 Theoretical Framework
The theory of Poisson’s effect guided this research. It is assumed that most of the increase in
axial capacity and ductility of the concrete column was provided due to the confining effect of
the CFRP wrap. EN 1992-1-1 states that the confinement may be generated by adequately
closed links or cross-ties, which reach the plastic condition due to the lateral extension of the
concrete (CEN, 2004).
First, the study established the influence of concrete grade on CFRP strengthened columns.
Secondly, it determined the contribution of each of the confining materials, the steel
reinforcement bars and CFRP wrap. The third objective was to differentiate the effect of degree
of confinement on the axial capacity and ductility. Lastly, it investigated the effect of the
number of layers on axial capacity and ductility of CFRP strengthened concrete columns.
2.21 Conceptual Framework
The independent variables for this study were:
1. Concrete Strength Grade – The study performed tests on the specimen manufactured
with the three concrete grades: Concrete C8/10, Concrete C12/15 and Concrete C16/20.
The three different concrete grades had 30 specimens each.
2. Presence or absence of reinforcement – Specimen were either plain concrete or
reinforced concrete. Half of the specimens manufactured had no steel reinforcement,
and the remaining half had steel reinforcement.
3. Degree of CFRP confinement – Eighteen specimens had no CFRP confinement, CFRP
fabric bands partially wrapped 36 specimens, and 36 specimens were fully covered by
the CFRP fabric wrap.
4. The number of CFRP wrap layers – The specimen to be confined by CFRP wrap either
had one or two layers. Thirty-six specimens had one layer of CFRP wrap, and 36
specimens had two layers of CFRP wrap.
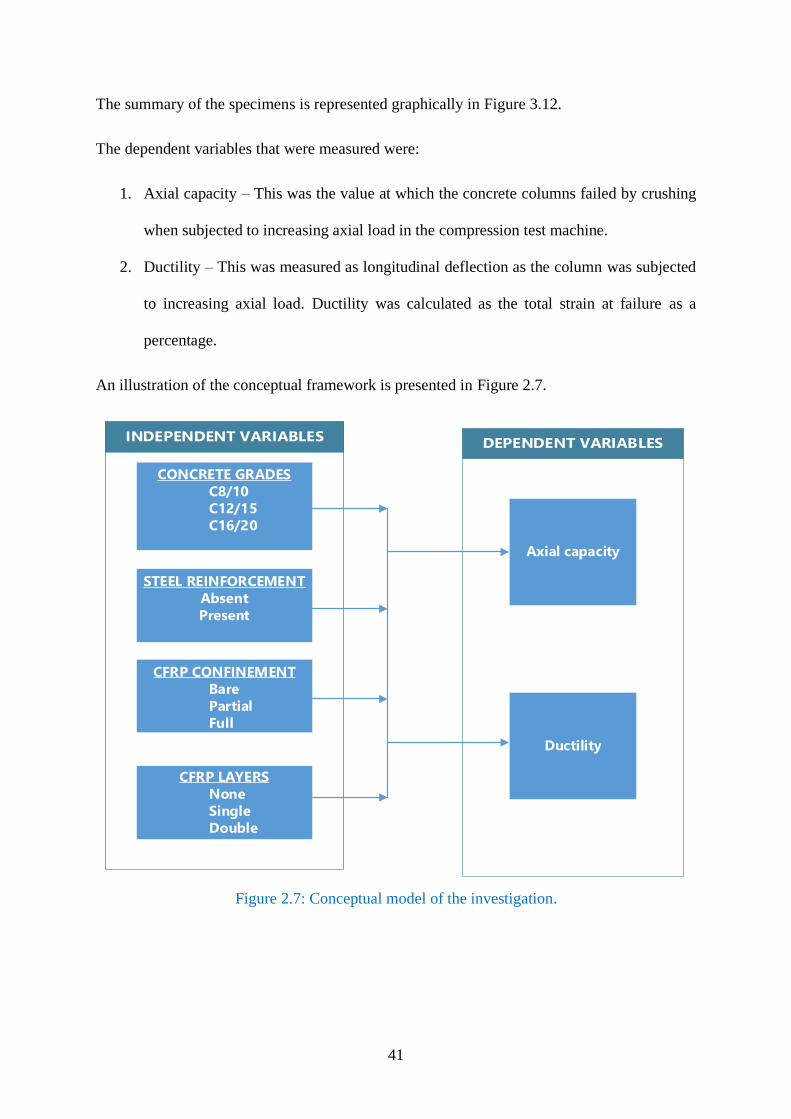
41
The summary of the specimens is represented graphically in Figure 3.12.
The dependent variables that were measured were:
1. Axial capacity – This was the value at which the concrete columns failed by crushing
when subjected to increasing axial load in the compression test machine.
2. Ductility – This was measured as longitudinal deflection as the column was subjected
to increasing axial load. Ductility was calculated as the total strain at failure as a
percentage.
An illustration of the conceptual framework is presented in Figure 2.7.
STEEL REINFORCEMENT
Absent
Present
CFRP CONFINEMENT
Bare
Partial
Full
CONCRETE GRADES
C8/10
C12/15
C16/20
CFRP LAYERS
None
Single
Double
Axial capacity
Ductility
Figure 2.7: Conceptual model of the investigation.

42
CHAPTER 3: MATERIALS AND METHODS
3.1 Introduction
The study took an empirical based approach to generate the data necessary to help answer the
research questions. Samples of non-slender concrete columns were manufactured and
subjected to uniaxial compression until failure occurred.
3.2 Research Design
The plan for the research began with determining the number of samples to be manufactured.
The research plan was guided by the conceptual framework diagram in Figure 2.7. The study
was a comparative investigation of the effect of CFRP strengthening on columns and therefore
the specimens manufactured were either control specimen or test specimen. For the following
explanation of the number of samples cast, the term ‘specimen’ refers to a non-slender column
with a particular treatment while the term ‘sample’ refers to one instance of the specimen with
the same treatment.
Three concrete grades were to be used. Therefore, the study needed three specimens to act as
control specimens and three other test specimens that resulted in a total of six specimens to be
manufactured. To answer the second research question, plain concrete specimens had to be
compared with reinforced concrete specimens resulting in doubling of all the concrete
specimens required from six to 12; six control specimens and six test specimens. To compare
partial and full CFRP confinement, the test specimens were doubled from six to 12 since six
specimens had partial CFRP confinement and six specimens had full CFRP confinement. The
result of this addition was a total of 18 specimens. Finally, for the last research question, the
test specimens were also doubled from 12 to 24 since some had one layer of CFRP while others
had two layers of CFRP resulting in a total of 30 specimens; six control specimens and 24 test
specimens. Three samples were made for each specimen according to the testing procedure of
BS 12390-2:2019 that requires a minimum number of three samples of any concrete property

43
being tested. As a result, 90 samples were required in this experimental investigation. Samples
that had a high deviation from the mean were recast to confirm if they were outliers. In the end,
a total of 95 samples were cast.
The research plan adopted ensured that the data generated from this research would answer all
the four research questions validly, objectively and economically.
3.3 Experimental Investigation
Ninety-five column samples were manufactured and tested to investigate the effects of concrete
grade, steel reinforcement, degree of confinement and number of CFRP layers. Thirty unique
column specimens were required to investigate the four variables stated. Three samples of each
unique specimen were then manufactured to result in a total of 90 column samples. Five
additional samples were manufactured and tested as a quality assurance procedure. The number
of samples for each specimen was chosen in line with BS 12390-3:2019 (BSI, 2019).
Comprehensive details of the specimen are discussed in the subsections that follow and
summarised in Figure 3.12. These subsections have been arranged as per the specific objectives
of this investigation.
3.3.1 Independent variables of the study
3.3.1.1 Concrete grades used in the study
This experimental programme used three strength grades of concrete C8/10, C12/15 and
C16/20 for the specimens as per the first research question. The concrete grade was an intrinsic
variable. There were 30 specimens for each grade of concrete. Three samples were made for
each specimen. The concrete strength grades chosen for these tests were as shown in Table 3.1.
These concrete grades were selected because of their lower characteristic strength than
Concrete C20/25. Concrete C20/25 is usually the target strength for cast-in-place concrete for
many construction projects in Kenya (IQSK, 2019). Any retrofits in this experiment attempted
to attain the characteristic strength of concrete C20/25.

44
Table 3.1: Characteristic strength of grades of concrete.
Concrete Grade 𝒇𝒄𝒌 (MPa) 𝒇𝒄𝒌,𝒄𝒖𝒃𝒆 (MPa) BS Designation
Concrete C8/10 8 10 Class 10
Concrete C12/15 12 15 Class 15
Concrete C16/20 16 20 Class 20
Concrete C20/25 20 25 Class 25
3.3.1.2 Presence of Steel Reinforcement
Of the 90 specimens, 45 had no steel reinforcement while the remaining 45 had steel
reinforcement. The presence or absence of steel reinforcement in the column was an intrinsic
variable of the column. The criteria in the design of the specimen would assist in achieving the
second specific objective of this study that attempted to quantify the effect of steel
reinforcement on CFRP strengthened samples.
3.3.1.3 Degree of confinement
With regards to the various configurations of CFRP confinement, 36 specimens with partial
CFRP confinement and 36 specimens with full CFRP confinement were manufactured.
Eighteen specimens did not receive any application of CFRP. The degree of confinement was
an extrinsic variable. The 18 specimens without CFRP treatment were used as the control for
this comparative study. The choice of these configurations was as per the third specific
objective, which was to compare partial and full confinement.
3.3.1.4 Number of layers
To find out the effect of the number of layers, 18 of the 36 specimens with partial CFRP
confinement had one layer of the CFRP wrap, and the remaining 18 had two layers of CFRP
wrap. Eighteen of 36 specimens with full confinement had one layer of CFRP wrap, and the
remaining had two layers of CFRP wrap. The 18 specimens without CFRP wrap were used as
the control. Comparisons were drawn from testing these samples. The number of layers was an
extrinsic variable.

45
3.3.2 Dependent variables of the Study
A compression test machine axially loaded the specimen to failure. The failure load and
deflections were recorded and were used to calculate the axial capacity and ductility of the
column specimens.
3.3.2.1 Determination of the axial capacity of the columns
The axial capacity was measured as the maximum load the column could withstand before the
failure occurred. The maximum load was divided by the cross-section area to determine the
axial capacity. The calculation is shown in Equation 3.1.
𝐴𝑥𝑖𝑎𝑙 𝑐𝑎𝑝𝑎𝑐𝑖𝑡𝑦 =𝐿𝑜𝑎𝑑 𝑎𝑡 𝑓𝑎𝑖𝑙𝑢𝑟𝑒
𝐴𝑟𝑒𝑎 𝑜𝑓 𝑐𝑜𝑙𝑢𝑚 𝑐𝑟𝑜𝑠𝑠 − 𝑠𝑒𝑐𝑡𝑖𝑜𝑛 Equation 3.1
3.3.2.2 Determination of the ductility of the columns
As the specimen was loaded, the longitudinal deflections were measured using a dial gauge.
The deflections with the corresponding loads that caused those deflections were recorded. The
values of the deflections were utilised in determining the ductility of the column specimen.
Ductility was calculated as the final longitudinal deformation expressed as a percentage, as
expressed by Equation 3.2.
𝐷𝑢𝑐𝑡𝑖𝑙𝑖𝑡𝑦 =𝐷𝑒𝑓𝑙𝑒𝑐𝑡𝑖𝑜𝑛 𝑎𝑡 𝑓𝑎𝑖𝑙𝑢𝑟𝑒
𝐼𝑛𝑖𝑡𝑖𝑎𝑙 𝑙𝑒𝑛𝑔𝑡ℎ 𝑜𝑓 𝑐𝑜𝑙𝑢𝑚𝑛× 100% Equation 3.2
The lateral deformation at the middle position such as the hoop strain is a better measure of
ductility since it is correlated to the passive confinement pressure experienced by the column
being loaded (Arduini et al., 1999). However, the equipment necessary to measure the lateral
deformation was not available. Therefore, there was no data for lateral or horizontal
deformation that was recorded.

46
3.4 Specimen Dimensions
3.4.1 Non-dimensional Slenderness
Columns can either be slender or non-slender as per the Eurocode classification (CEN, 2004).
Non-dimensional slenderness is a factor of the length and cross-section dimensions of the
specimen. Slender columns fail by buckling while non-slender columns fail by crushing. This
study investigated non-slender columns. The choice of non-slender columns necessitates the
need for limiting the column height. The Euler critical load is affected by the following factors:
material properties, the effective length of the columns, cross-section geometry, and end
conditions. The nature of the compression test machine was such that the end conditions of the
column while being loaded had pinned supports at both the top and bottom. This setup did not
affect the effective length; the actual column length was the same as the effective column
length.
The column was loaded concentrically to ensure that there was no eccentricity. Eccentricity
leads to the development of significant flexural stresses that could affect the determination of
the axial capacity of the columns. The Euler buckling load is the compressive axial force
required to cause lateral instability of a vertical, weightless column (Patillo, 2018). The formula
for the Euler buckling load is expressed in Equation 3.3.
𝑁𝑐𝑟𝑖𝑡 = −𝑘𝜋2𝐸𝐼
𝐿2 Equation 3.3
where 𝑁𝑐𝑟𝑖𝑡 = Euler buckling load
𝐸 = Young’s modulus
𝐼 = Moment of inertia of the column cross-section
L = Column length
k =The value of k varies with the end conditions

47
Table 3.2: End conditions and k values of columns under compression.
Top constraint Bottom constraint k
Fixed Fixed 4
Fixed Free 0.25
Pinned Fixed 2.046
Pinned Pinned 1
Source: Patillo, 2018
In an ideal scenario, the column could either buckle or crush at the Euler buckling load.
However, because of geometrical imperfections of the column and eccentricities in load
application, slender members under compression will fail by buckling before the Euler
buckling load is attained. For non-slender columns, the parameters of the column should be
below the Euler buckling curve, as shown in Figure 3.1. Non-slender columns do not have the
additional requirement of calculating second-order effects (CEN, 2004).
Adapted from: Osofero, 2012
Figure 3.1: The Euler Buckling curve.
There should be no restraints from the platens of the testing machine. In practice; however,
some lateral compression is introduced because of the friction generated between the steel
platen and the concrete. In an ordinary testing machine, it is difficult to eliminate this friction.
However, its effect can be minimised by using a specimen whose length to width ratio is greater
than two so that the central position of the specimen is free from platen restraint (Neville &
Brooks, 2010).

48
3.4.2 Dimensions of the Sample Manufactured
The specimen dimensions were based on the conditions of Euler critical load and the clearance
height of the compression test machine at the Materials Testing Laboratory, University of
Nairobi. The clearance height was 380mm, as shown in Figure 3.2. This study adopted 350mm
as the height of the concrete column specimen. The 30mm clearance was necessary for moving
the columns to the appropriate position before clamping down on the sample.
Figure 3.2: Maximum clearance of the compression machine.
The cross-sectional dimensions were 150mm x 150mm. A smaller cross-section size would
pose challenges when fabricating and installing the rebar cage while a bigger cross-section
would make the sample heavier and difficult to handle. Reducing the cross-section size has the
effect of increasing the steel to concrete ratio of the cross-sectional area, and thus, the
contribution of rebar would be higher. Bigger cross-sections would also mean higher costs.
Furthermore, bigger cross-sections would lead to higher axial capacity that would exceed the
maximum capacity of the compression test machine available. The dimensions chosen ensured
that the specimen was non-slender as per the standard EN 1992-1-1 (CEN, 2004).
3.4.3 Slenderness Check of the Specimen
The slenderness 𝜆, is a key component in the design of vertical elements that support
compression loads (The Structural Engineer, 2013). Slenderness was calculated as shown in
Equation 3.4.
350mm high
specimen
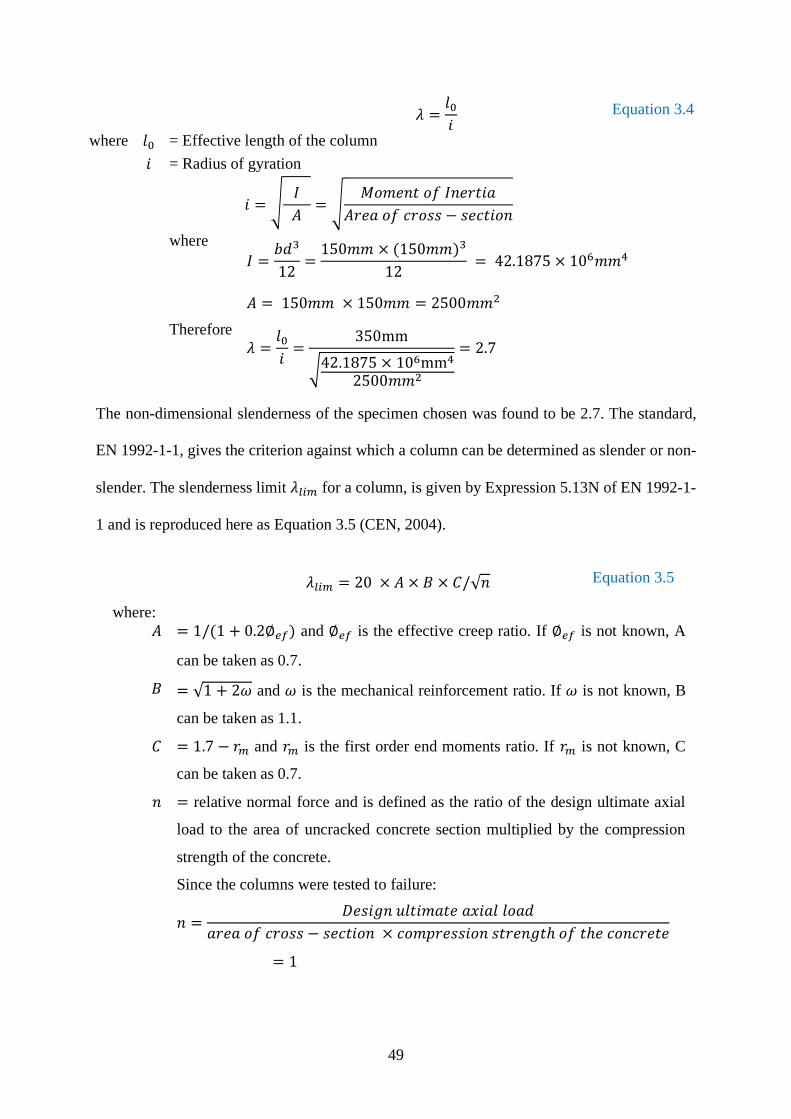
49
𝜆 =𝑙0
𝑖 Equation 3.4
where 𝑙0 = Effective length of the column
𝑖 = Radius of gyration
𝑖 = √ 𝐼
𝐴= √
𝑀𝑜𝑚𝑒𝑛𝑡 𝑜𝑓 𝐼𝑛𝑒𝑟𝑡𝑖𝑎
𝐴𝑟𝑒𝑎 𝑜𝑓 𝑐𝑟𝑜𝑠𝑠 − 𝑠𝑒𝑐𝑡𝑖𝑜𝑛
where
𝐼 =𝑏𝑑3
12=
150𝑚𝑚 × (150𝑚𝑚)3
12 = 42.1875 × 10⁶𝑚𝑚4
𝐴 = 150𝑚𝑚 × 150𝑚𝑚 = 2500𝑚𝑚2
Therefore
𝜆 =𝑙0
𝑖=
350mm
√42.1875 × 106mm4
2500𝑚𝑚2
= 2.7
The non-dimensional slenderness of the specimen chosen was found to be 2.7. The standard,
EN 1992-1-1, gives the criterion against which a column can be determined as slender or non-
slender. The slenderness limit 𝜆𝑙𝑖𝑚 for a column, is given by Expression 5.13N of EN 1992-1-
1 and is reproduced here as Equation 3.5 (CEN, 2004).
𝜆𝑙𝑖𝑚 = 20 × 𝐴 × 𝐵 × 𝐶/√𝑛 Equation 3.5
where:
𝐴 = 1/(1 + 0.2∅𝑒𝑓) and ∅𝑒𝑓 is the effective creep ratio. If ∅𝑒𝑓 is not known, A
can be taken as 0.7.
𝐵 = √1 + 2𝜔 and 𝜔 is the mechanical reinforcement ratio. If 𝜔 is not known, B
can be taken as 1.1.
𝐶 = 1.7 − 𝑟𝑚 and 𝑟𝑚 is the first order end moments ratio. If 𝑟𝑚 is not known, C
can be taken as 0.7.
𝑛 = relative normal force and is defined as the ratio of the design ultimate axial
load to the area of uncracked concrete section multiplied by the compression
strength of the concrete.
Since the columns were tested to failure:
𝑛 =𝐷𝑒𝑠𝑖𝑔𝑛 𝑢𝑙𝑡𝑖𝑚𝑎𝑡𝑒 𝑎𝑥𝑖𝑎𝑙 𝑙𝑜𝑎𝑑
𝑎𝑟𝑒𝑎 𝑜𝑓 𝑐𝑟𝑜𝑠𝑠 − 𝑠𝑒𝑐𝑡𝑖𝑜𝑛 × 𝑐𝑜𝑚𝑝𝑟𝑒𝑠𝑠𝑖𝑜𝑛 𝑠𝑡𝑟𝑒𝑛𝑔𝑡ℎ 𝑜𝑓 𝑡ℎ𝑒 𝑐𝑜𝑛𝑐𝑟𝑒𝑡𝑒
= 1
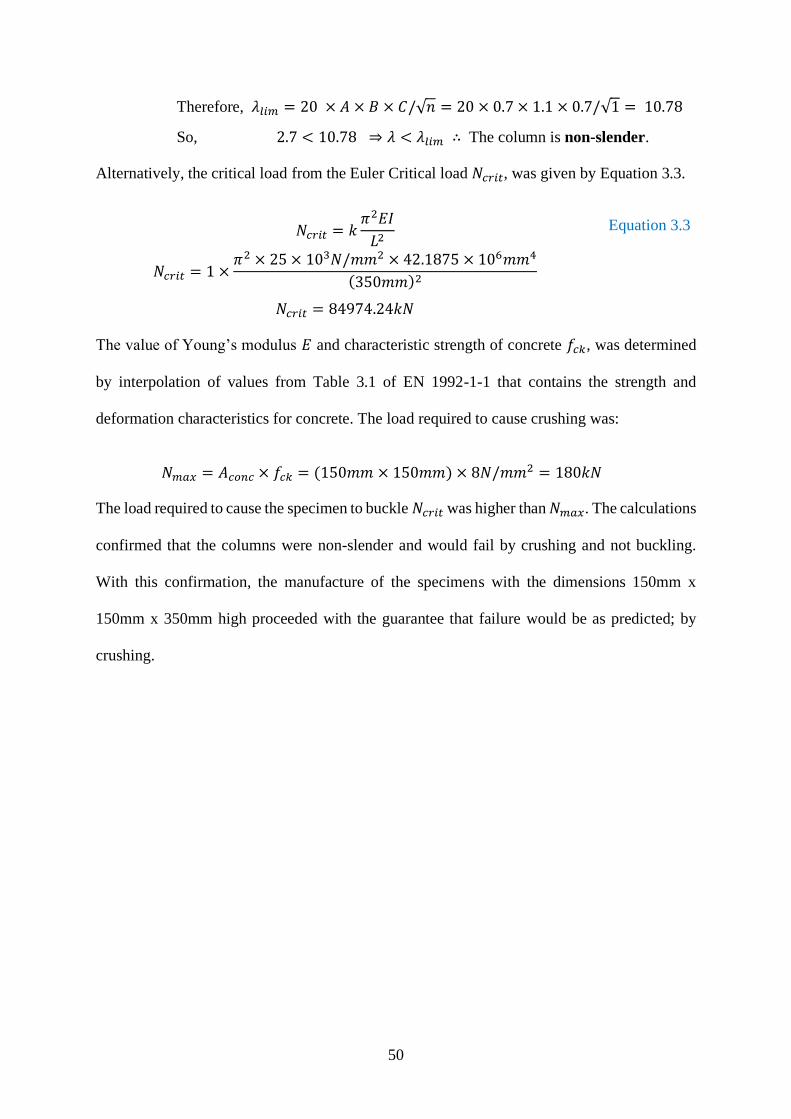
50
Therefore, 𝜆𝑙𝑖𝑚 = 20 × 𝐴 × 𝐵 × 𝐶/√𝑛 = 20 × 0.7 × 1.1 × 0.7/√1 = 10.78
So, 2.7 < 10.78 ⇒ 𝜆 < 𝜆𝑙𝑖𝑚 ∴ The column is non-slender.
Alternatively, the critical load from the Euler Critical load 𝑁𝑐𝑟𝑖𝑡, was given by Equation 3.3.
𝑁𝑐𝑟𝑖𝑡 = 𝑘𝜋2𝐸𝐼
𝐿2 Equation 3.3
𝑁𝑐𝑟𝑖𝑡 = 1 ×𝜋2 × 25 × 103𝑁/𝑚𝑚2 × 42.1875 × 106𝑚𝑚4
(350𝑚𝑚)2
𝑁𝑐𝑟𝑖𝑡 = 84974.24𝑘𝑁
The value of Young’s modulus 𝐸 and characteristic strength of concrete 𝑓𝑐𝑘, was determined
by interpolation of values from Table 3.1 of EN 1992-1-1 that contains the strength and
deformation characteristics for concrete. The load required to cause crushing was:
𝑁𝑚𝑎𝑥 = 𝐴𝑐𝑜𝑛𝑐 × 𝑓𝑐𝑘 = (150𝑚𝑚 × 150𝑚𝑚) × 8𝑁/𝑚𝑚2 = 180𝑘𝑁
The load required to cause the specimen to buckle 𝑁𝑐𝑟𝑖𝑡 was higher than 𝑁𝑚𝑎𝑥. The calculations
confirmed that the columns were non-slender and would fail by crushing and not buckling.
With this confirmation, the manufacture of the specimens with the dimensions 150mm x
150mm x 350mm high proceeded with the guarantee that failure would be as predicted; by
crushing.

51
The plain concrete specimen details were as shown in Figure 3.3.
Section dimensions of the specimen.
Three-dimensional representation of the
specimen.
Elevation dimensions of the specimen.
Figure 3.3: Plain concrete specimen details.
The details for the reinforced specimen were as shown in Figure 3.4.
Section dimensions of the specimen.
Three-dimensional representation of the
specimen.
Elevation dimensions of the specimen.
Figure 3.4: Reinforced concrete specimen details
Steel reinforcement used was mild round steel bars with 6mm and 8mm diameters with a yield
strength of 250MPa. Mild steel reinforcement with the diameters selected, 6mm and 8mm, is
easier to bend and place in moulds. There was a need to ensure that the length to width ratio

52
was greater than two to reduce the effect of platen restraint at the centre of the specimen
(Neville & Brooks, 2010). The ratio of the length to the width of the specimen used was 2.33.
Nine concrete cubes were cast to determine the characteristic strength of concrete
manufactured as per BS EN 12390-2:2009 (BSI, 2009). Timber moulds were fabricated with
the specifications made in BS EN 12390-1:2012 (BSI, 2012). The fabrication drawings of these
standard moulds are in Figure A.1. Fabrication drawings of the moulds for casting the 90
column specimens are in Figure A.2. Used engine oil was applied as on the inner side of the
mould. The oil acted as the shutter release agent for the concrete specimen and the timber
moulds when demoulding.
Figure 3.5: Setup for the manufacture of
plain concrete specimen.
Figure 3.6: Setup for the manufacture of
reinforced concrete specimen.
For the CFRP wrap, either one or two layers of CFRP were used as recommended by suppliers.
Carbon fibre is an expensive material, and use of the material to more than two layers would
make CFRP retrofitting uneconomical. Apart from the fiscal constraints, prior studies also
underpinned this limitation of two layers (Shehata et al., 2002; Shrive et al., 2003).
3.5 CFRP Configuration
To provide partial confinement, 50mm bands were used. CFRP wrap is manufactured in
standard widths which are in multiples of 50mm, that is 50mm, 100mm, 150mm and 200mm
Rebar cages
Timber
moulds
Timber
moulds

53
bands. Only one brand of CFRP wrap was used. The mechanical properties of the CFRP wrap
that are typically available are shown in Table 3.3. The tests for the CFRP wrap were obtained
from the manufacturer’s datasheet (Horse Construction, 2019). The tests were reported to be
in accordance with the standard ASTM D3039 / D3039M-17 (ASTM, 2017).
Table 3.3: Physical properties of CFRP wrap.
Physical Property Value
Tensile Strength 4 840 MPa
Tensile Modulus 230 GPa
Elongation at Break 1.95%
3.6 Concrete preparation
The test used three grades of concrete: C8/10, C12/15 and C16/20, with target strengths, as
indicated in Table 3.1. Batching was done by mass and manufactured in a lab electric pan
concrete mixer in batches. The concrete was based on prescribed ratios (IQSK, 2019). The
materials used in the manufacture of concrete were: 20mm crushed granites for the coarse
aggregate, river sand for the fine aggregate and potable water. These prescribed ratios and the
corresponding water-cement ratios are as indicated in Table 3.4.
Table 3.4: Prescribed ratios for various grades of concrete.
Concrete
Grade
Prescribed
ratios
Cement Fine
aggregate
Coarse
aggregate
C8/10 1:4:8 1 4 8
C12/15 1:3:6 1 3 6
C16/20 1:2:4 1 2 4
Nine 150mm x 150mm x 150mm test cubes (three test cubes for each concrete grade) were cast
and tested to establish the strength of the concrete at 28 days to determine the structural
properties of the concrete used to manufacture the test specimen as per BS EN 12390-1 (BSI,
2012). Even though grading of the aggregate assists in the workability of concrete, grading was
not performed as it would not affect the effectiveness of the CFRP strengthening. Grading
would not affect the accuracy of the results since the comparative analysis was based on control
samples that had undergone the same process of manufacture as the test samples.

54
3.7 Casting
The concrete was cast using the prescribed ratios described in Table 3.4. Concrete was
manufactured in batches to reduce the formwork requirements. The material was sourced from
one location to reduce variability. Other quality control measures such as quartering and using
a riffle sample divider were employed. A riffle sample divider is a mechanical device made up
of a metal box that has a series of vertical slats through which granular material is poured and
randomly divided into two samples; this process was performed severally to obtain a
small representative sample of the bulk material.
Source: Indiamart, 2020
Figure 3.7: A riffle sample divider.
Figure 3.8: A quartered batch of fresh
concrete.
3.8 Curing
The samples were labelled and wholly submerged in a water bath and cured for 21 days. The
samples were removed from the water bath and were washed off with a pressurised hose pipe
to get rid of sediment following which the specimens were air-dried for 24 hours and labelled
at the top surface.
Vertical slats
Sample 1
Sample 2
One quarter

55
Figure 3.9: Samples after removal from the
water bath.
Figure 3.10: Samples after air drying for 24
hours.
Labelling was done on the top face since some of the labels on the sides would be obscured
once the CFRP wrap was applied. The specimens were visually inspected for any dirt. Any
mounds of dust or mud were cleaned off with a wire-brush before CFRP wrap was applied.
The CFRP wrap was then cured for seven more days before testing. At the time of testing, the
concrete specimen had cured for 28 days; 21 days in a water bath and seven days in the open.
Figure 3.11 shows how the curing durations for both the concrete and CFRP was achieved by
curing the epoxy and the concrete simultaneously.
Figure 3.11: Curing process for the concrete columns and epoxy done simultaneously.
Labels
Labels at
the top
face after
curing
Air dried
samples

56
3.9 Specimen Details
Ten types of specimen were chosen to test the effect of various parameters required in CFRP
strengthening. Each specimen was manufactured by the three concrete grades in Table 3.4. For
this qualitative experiment, three samples were manufactured for each configuration to
demonstrate a definite pattern of the effect of the four parameters. The three identical
components were manufactured to produce credible data. Details of the different types of
specimens are shown Figure B.1 and Figure B.2.
The specimens are listed in order of increasing confinement by rebar and CFRP wrap then by
the number of CFRP layers. All the specimens with CFRP wrap had a 150mm overlap to
prevent lap joint failure due to debonding (The Concrete Society, 2000).
Table 3.5 presents the specimen composition in a matrix format.
Table 3.5: Composition matrix of column specimens to manufactured.
Specimen
Type
No of
samples
Rebar Partial CPRF Full CFRP CFRP
Layers
A 3 ✖ ✖ ✖ 0
B 3 ✔ ✖ ✖ 0
C 3 ✖ ✔ ✖ 1
D 3 ✔ ✔ ✖ 1
E 3 ✖ ✖ ✔ 1
F 3 ✔ ✖ ✔ 1
G 3 ✖ ✔ ✖ 2
H 3 ✔ ✔ ✖ 2
I 3 ✖ ✖ ✔ 2
J 3 ✔ ✖ ✔ 2
This composition matrix of manufactured specimens is presented graphically in Figure 3.12.

57
PLAIN CONCRETE REINFORCED CONCRETE
B
A
R
E
A B
1
L
A
Y
E
R
C D
E F
2
L
A
Y
E
R
S
G H
I J
Figure 3.12: Graphical representation of manufactured specimens.

58
Specimen A was used to determine the axial capacity of the concrete column without steel
rebar. It had no CFRP strengthening. The axial capacity was determined purely from the
strength of concrete. Specimen A was the control for the other specimens that did not have
rebar.
Specimen B had steel rebar and no CFRP wrap. It replicated how most square columns are
constructed on site. Results from this test specimen were used to determine the axial capacity
of the column when steel rebar was present. The data was instrumental in determining the
contribution of steel rebar in concrete columns as per the second objective of this study.
Comparing the results with Specimen A established the contribution of steel reinforcement to
the axial capacity and ductility of the column without CFRP strengthening. This specimen was
the control for the other specimens with both rebar and CFRP strengthening.
Specimen C had no steel rebar and had partial CFRP wrap. Specimen C was used to determine
the axial capacity of the column when partially wrapped with one layer of CFRP wrap. Partial
confinement was achieved by wrapping 50mm bands of CFRP at 50mm intervals between each
strip. Comparing the results with that from Specimen A established the increase in axial
capacity and ductility of the column due to partial confinement of one layer of CFRP wrap.
This method was typically proposed as a cost-cutting measure by suppliers (Horse
Construction, 2019).
Specimen D had steel rebar present and 50mm CFRP bands in one layer to offer partial
confinement. It was used to determine the increase in axial capacity and ductility of Specimen
B when CFRP strengthening was applied in 50mm bands. Partial confinement was achieved
by using bands as opposed to completely covering the column. Testing Specimen D was
justified by claims made by some CFRP manufacturers that partial confinement was an
effective method of rehabilitating columns in austerity. Specimen B mirrors the construction
of columns on site. Comparison of test results with Specimen B determined the individual

59
strength contribution of the CFRP bands. Comparison of the test results with Specimen C
determined the individual contribution of the CFRP rebar. Comparison of Specimen D with
Specimen A would determine the combined effect of both CFRP and rebar on the columns.
Specimen E had no steel rebar but had 50mm full CFRP wrap in one layer. The test data was
used to determine the axial capacity of the column when fully wrapped with one layer of CFRP
wrap. Comparing the results with that from Specimen A established the increase in axial
capacity and ductility of the column due to full confinement of CFRP wrap. Care was taken to
ensure that there was a band at the middle section of all the specimens with partial CFRP
confinement. It is as the middle where the effect of platen restraint is least (Neville & Brooks,
2010).
Specimen F had steel rebar present and one full layer of CFRP wrap. It was used to determine
the increase in axial capacity and ductility of Specimen B. Specimen F mirrored prescribed
methods of rehabilitating columns in engineering practice (The Concrete Society, 2000). The
comparison of test results from Specimen B and Specimen E determined the individual strength
contribution of the CFRP wrap and the individual contribution of the rebar, respectively. When
compared with Specimen A, the combined effect of rebar and CFRP wrap was determined.
This specimen facilitated the realisation of the second objective, which was to find out the
individual contribution of steel reinforcement and CFRP strengthening.
Specimen G had no steel rebar and had two layers of 50mm CFRP bands offering partial
confinement. Data from Specimens A, E and G, was used to determine the effect of an
additional CFRP layer on plain concrete.
Specimen H had steel rebar and two layers of 50mm CFRP bands. Data from conducting tests
on this specimen was used to find out the effect of an additional CFRP layer on the reinforced

60
concrete specimen when compared against Specimen F. Comparison of the data with Specimen
G would determine the effect of rebar on axial capacity and ductility of strengthened columns.
Specimen I had no steel rebar but had two layers of CFRP offering full confinement.
Comparing data of this specimen against Specimens A and E were used to determine the effect
of additional layers of CFRP wrap. This specimen facilitated the realisation of the fourth
objective.
Specimen J had steel rebar and two layers of CFRP offering full confinement. This specimen
was used to determine the effect of an additional CFRP layer acting in combination with steel
reinforcement when compared with Specimen F. Comparing the data of this specimen with
Specimen I would calculate the contribution of rebar to the axial capacity and ductility of CFRP
strengthened columns.
3.10 CFRP wrap preparation
The CFRP wrap was supplied in 100-metre rolls of 200mm width with the epoxy adhesive set,
as shown in Figure 3.13.
Figure 3.13: Carbon fibre wrap and epoxy adhesive.
A pair of ordinary scissors was used to cut the CFRP to the required sizes to attain the
configurations illustrated in Figure 3.12. CFRP was relatively easy to cut (Abadi et al., 2019).
For the full CFRP confinement, the cut width sizes made were of 200mm and 150mm widths.
Epoxy
set
100-metre roll
of 200mm wide
CFRP wrap
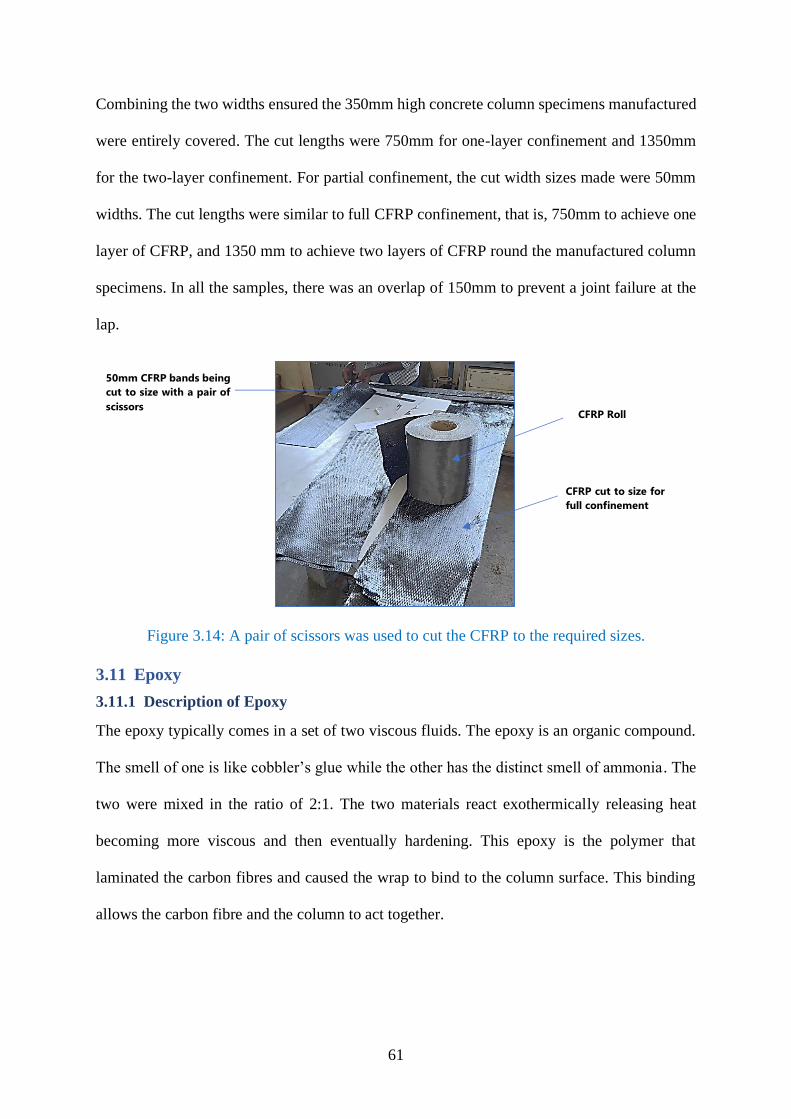
61
Combining the two widths ensured the 350mm high concrete column specimens manufactured
were entirely covered. The cut lengths were 750mm for one-layer confinement and 1350mm
for the two-layer confinement. For partial confinement, the cut width sizes made were 50mm
widths. The cut lengths were similar to full CFRP confinement, that is, 750mm to achieve one
layer of CFRP, and 1350 mm to achieve two layers of CFRP round the manufactured column
specimens. In all the samples, there was an overlap of 150mm to prevent a joint failure at the
lap.
Figure 3.14: A pair of scissors was used to cut the CFRP to the required sizes.
3.11 Epoxy
3.11.1 Description of Epoxy
The epoxy typically comes in a set of two viscous fluids. The epoxy is an organic compound.
The smell of one is like cobbler’s glue while the other has the distinct smell of ammonia. The
two were mixed in the ratio of 2:1. The two materials react exothermically releasing heat
becoming more viscous and then eventually hardening. This epoxy is the polymer that
laminated the carbon fibres and caused the wrap to bind to the column surface. This binding
allows the carbon fibre and the column to act together.
CFRP Roll
CFRP cut to size for
full confinement
50mm CFRP bands being
cut to size with a pair of
scissors
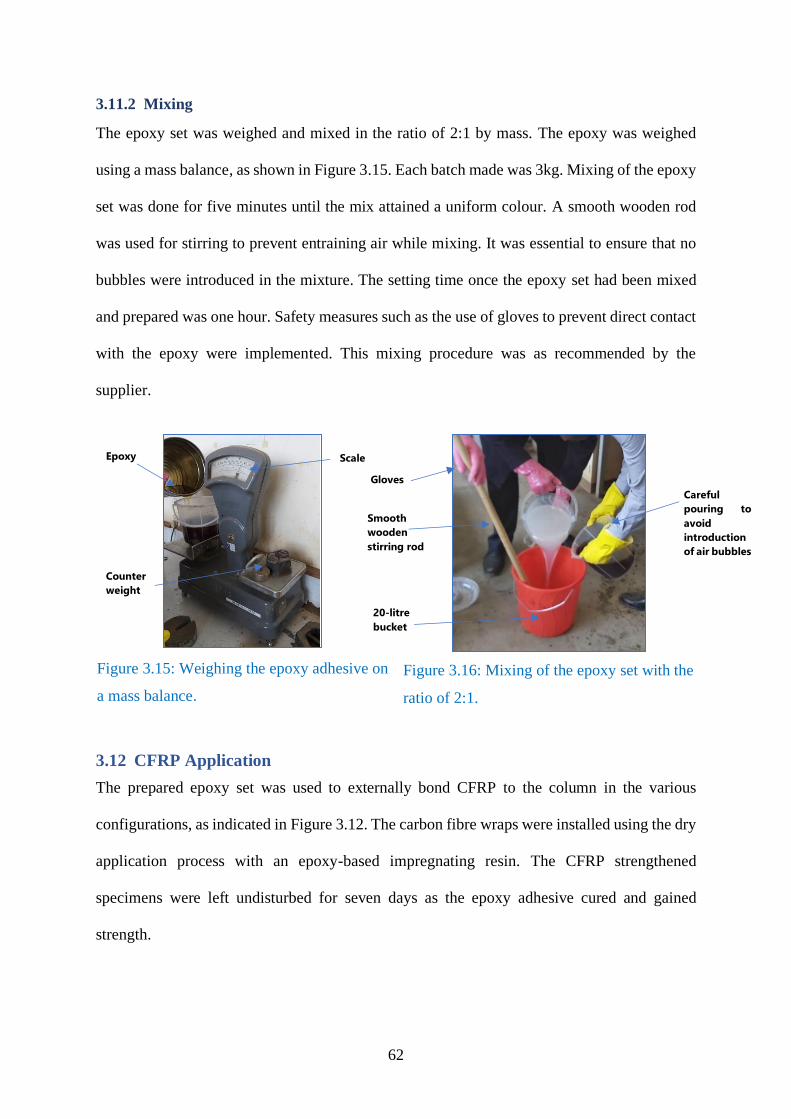
62
3.11.2 Mixing
The epoxy set was weighed and mixed in the ratio of 2:1 by mass. The epoxy was weighed
using a mass balance, as shown in Figure 3.15. Each batch made was 3kg. Mixing of the epoxy
set was done for five minutes until the mix attained a uniform colour. A smooth wooden rod
was used for stirring to prevent entraining air while mixing. It was essential to ensure that no
bubbles were introduced in the mixture. The setting time once the epoxy set had been mixed
and prepared was one hour. Safety measures such as the use of gloves to prevent direct contact
with the epoxy were implemented. This mixing procedure was as recommended by the
supplier.
Figure 3.15: Weighing the epoxy adhesive on
a mass balance.
Figure 3.16: Mixing of the epoxy set with the
ratio of 2:1.
3.12 CFRP Application
The prepared epoxy set was used to externally bond CFRP to the column in the various
configurations, as indicated in Figure 3.12. The carbon fibre wraps were installed using the dry
application process with an epoxy-based impregnating resin. The CFRP strengthened
specimens were left undisturbed for seven days as the epoxy adhesive cured and gained
strength.
Scale
Counter
weight
Smooth
wooden
stirring rod
Careful
pouring to
avoid
introduction
of air bubbles
Epoxy
20-litre
bucket
Gloves
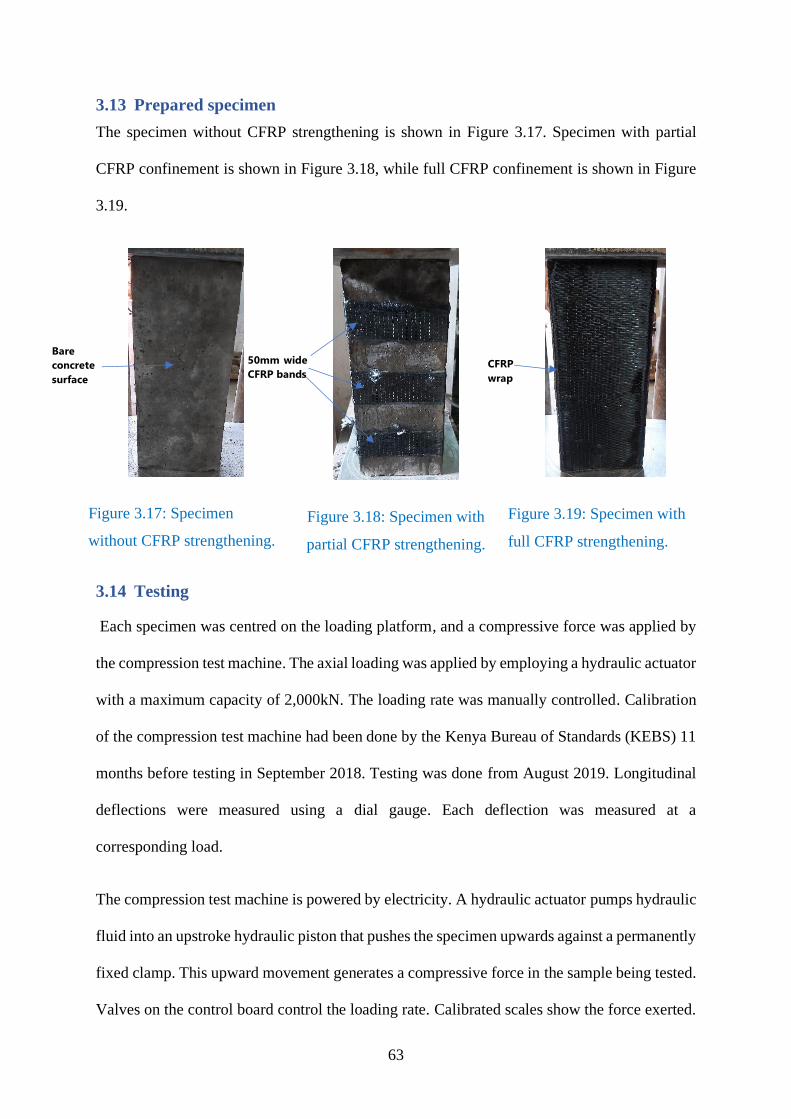
63
3.13 Prepared specimen
The specimen without CFRP strengthening is shown in Figure 3.17. Specimen with partial
CFRP confinement is shown in Figure 3.18, while full CFRP confinement is shown in Figure
3.19.
Figure 3.17: Specimen
without CFRP strengthening.
Figure 3.18: Specimen with
partial CFRP strengthening.
Figure 3.19: Specimen with
full CFRP strengthening.
3.14 Testing
Each specimen was centred on the loading platform, and a compressive force was applied by
the compression test machine. The axial loading was applied by employing a hydraulic actuator
with a maximum capacity of 2,000kN. The loading rate was manually controlled. Calibration
of the compression test machine had been done by the Kenya Bureau of Standards (KEBS) 11
months before testing in September 2018. Testing was done from August 2019. Longitudinal
deflections were measured using a dial gauge. Each deflection was measured at a
corresponding load.
The compression test machine is powered by electricity. A hydraulic actuator pumps hydraulic
fluid into an upstroke hydraulic piston that pushes the specimen upwards against a permanently
fixed clamp. This upward movement generates a compressive force in the sample being tested.
Valves on the control board control the loading rate. Calibrated scales show the force exerted.
50mm wide
CFRP bands CFRP
wrap
Bare
concrete
surface

64
The dial gauge in contact with the bottom platen of the testing machine measures the vertical
displacement of the hydraulic piston. Figure 3.20 and Figure 3.21 shows the setup of the testing
equipment.
Figure 3.20: Dial gauge in position to
measure the deflection.
Figure 3.21: Set up of the compression test
machine.
Instrumentation such as linear variable differential transformers and displacement transducers
to measure deflection would have been ideal; however, these sensors were unavailable and thus
a procedure to get the required values was improvised for this study. The loads and longitudinal
deflections values were acquired by observers reading off the scales of the compression test
machine and the dial gauge. One person read the axial load from the scale on the compression
test machine while another person read the corresponding value of the deflection from the dial
gauge. A third individual tabled the values on a pre-printed sheet of paper. The loading rate
was not constant but was manually controlled as per the procedure described in BS EN 12390-
3: 2019 (BSI, 2019). The speed of loading was adjusted accordingly to allow the convenient
Concealed
hydraulic actuator
Clamp Scales
Control Board
Specimen
position
Upstroke
hydraulic piston
Electric
outlet Sample after
testing
Dial gauge
(deflectometer)
Close-up of the
dial gauge
Top steel
platen
Bottom steel
platen
65
reading of the values from the dial gauges of the compression test machine and the dial gauge
measuring deflection. From the recorded loads and deflections, the respective stresses and
strains were calculated. The stress-strain curves were then plotted. The curves were presented
in Appendix G. The experimental stress-strain curves were terminated at the point where:
1. The CFRP wrap rupture occurred in specimens with full CFRP confinement.
2. The concrete core failed in specimens without CFRP wrap and those with partial CFRP
confinement.
The results obtained were then subjected to statistical tests to find out if the difference of the
data between and among groups was statistically significant at the 95% level of confidence.
3.15 Test Statistics
In test statistics, there were controls which received no CFRP strengthening. Controls played
a huge role in this experimental programme. Controls assisted in dividing up the changes we
observed due to CFRP strengthening and changes that are due to other factors such as
variability in the concrete mix. The test statistics were calculated from sample data and was
used for hypothesis testing. The level of confidence for the experimental investigation was
chosen as 95% which implies that 𝑐 = 0.95 and 𝛼 = 1 − 0.95 = 0.05. The 𝛼-value of 0.05 is
commonly used in other scientific studies and was adopted in this experimental programme as
well (Brangard, 2018b). For this study, since the hypothesis was testing the equality of two
groups then two-tailed tests were performed.
3.15.1 T-test
T-tests are good for testing the difference between two groups (Brangard, 2018b). A t-test can
be employed to test the difference between plain concrete specimens and reinforced concrete
specimens. It can also be used to test the difference between partial and full CFRP confinement
and finally between the one layer and two layers of CFRP wrap. For the first research question,

66
the t-test could be applied thrice between Concrete C8/10 and Concrete C12/15, between
Concrete C8/10 and C16/20 and finally between Concrete C12/15 and Concrete C16/20.
However, multiple t-tests are not ideal because of they have the tendency of increasing the type
I error. A type I error occurs when a true hypothesis is rejected. Doing the test sequentially
would result in introduction of more errors in the analysis.
T-tests were performed between only two groups. In this study, the t-test was done only to test
the second null hypothesis which compares samples with rebar present and those without.
Specifically, a two-sample t-test was conducted. The two-sample t-test is also known as the
independent t-test or unpaired t-test (Brangard, 2018c). The remaining three hypotheses were
tested using ANOVA.
3.15.2 ANOVA
ANOVA tells us if the means of the various groups are different. ANOVA is suitable when
testing among three or more groups. Post hoc testing after the ANOVA is performed can further
reveal the difference between two difference groups. Post hoc testing is less likely to introduce
Type I errors compared to performing multiple t-tests. ANOVA was used to test the three
hypotheses relating to concrete grade, degree of confinement and number of layers. Testing
these three hypotheses involved testing three sets of data as highlighted in the conceptual
framework in Figure 2.7. The Gabriel method in the SPSS statistical analysis package was
preferred for post hoc testing because of the difference in sample sizes (Grande, 2015).
The results obtained were analysed, presented and discussed in the following chapter.

67
CHAPTER 4: RESULTS AND DISCUSSION
4.1 Stress-strain curves
The plotted charts for the stress-strain curves for all the specimens are presented in Appendix
G. For quality control and to verify the experimental data, some specimens were manufactured
again and retested. An additional five samples were retested hence the total number of
specimens cast increased from 90 as proposed earlier, to 95. The results for all the 95 specimens
are presented in Table C.1 for axial capacity and Table D.1 for ductility. The results were
recorded and the analysis was performed using a software package called Microsoft Office
Excel Version 2019. Microsoft Office Excel 2019 is a data visualisation and analysis tool
(Microsoft Excel, 2019). The stresses were plotted with their corresponding strains to come up
with stress-strain curves for the samples. The stress-strain graphs for all the samples tested in
this experimental study are in Appendix G. The typical stress-strain graphs for a specimen with
three samples is presented in Figure 4.1.
Figure 4.1: Typical stress-strain graphs three samples of the same CFRP configuration.
Figure 4.1 is similar to Figure 3.6 of EN 1992-1-1, reproduced here as Figure 2.2. The graph
illustrates the stress-strain relationship of confined concrete.
0
5
10
15
20
25
30
0 0.02 0.04 0.06 0.08 0.1 0.12 0.14
Str
ess
(MP
a)
Strain
Stress-strain curve for typical specimen (Concrete Grade)
Sample 1
Sample 2
Sample 3
Elastic Plastic

68
The curves can be described in two main parts; the elastic phase and the plastic phase. The
elastic phase occurs before cracks developed, and the stress varies almost linearly with the
strain up to the point where cracks start to develop. The point where hairline cracks appeared
indicate the beginning of the plastic phase. Deflections happened rapidly. In the plastic phase,
the concrete had yielded, and failure occurred immediately after large visible cracks develop
on the concrete specimens. By inspection of the graphs in Appendix G, the area under the
stress-strain curves was significantly increased by CFRP strengthening. The area under the
stress-strain curve is a measure of energy absorption (Masia et al., 2004). This energy
absorption is important and is the reason why CFRP strengthening is used for seismic
retrofitting (Bank, 2006).
4.2 Concrete Mix Design
The mix design was not performed as it was one of the assumptions of the investigation. Table
4.1 shows the target strengths against the actual strengths of the cubes tested.
Table 4.1: Compressive stresses of test cubes for the grades of concrete manufactured.
Designation Prescribed
ratios
Water:
cement ratio
Target cube
Strength
Actual cube
Strength
Percentage
difference
C8/10 1:4:8 0.7 10.0MPa 10.2MPa +2%
C12/15 1:3:6 0.65 15.0MPa 14.7MPa -2%
C16/20 1:2:4 0.6 20.0MPa 15.6MPa -22%
This study found the prescribed ratios used in the Building Construction Handbook 2018/2019
(2019) did not attain the required design strength for Concrete C16/20 when the compressive
test was done as per BS EN 12390-2:2009 (BSI, 2009). The failure of this ratio to attain the
concrete design strength may be one reason that buildings may be considered as unsafe as had
been revealed by building audits in Nairobi City County (NCA, 2015; Omullo, 2018). The
failure of the prescribed ratios to attain the design strengths in this particular study is attributed
to the fact that a pozzolanic cement IV/B was used. The cement was manufactured as per
standard KS EAS 18-1:2017 (KEBS, 2017).

69
Pozzolanic types of cement attain full strength slowly and may attain strength after 28 days
(Okumu et al., 2017). The use of prescribed ratios may only be applicable when using Ordinary
Portland cement CEM I (Joel & Mbapuun, 2016). The tests in this study were done after 28
days of curing concrete. This finding implies that engineers should pay particular attention to
the mix design, if not, only ordinary Portland cement should be used when using the prescribed
ratios. The finding that the prescribed ratios would not meet the target design strength was
anticipated based on a study in Nigeria that found the ratios did not attain the required strength
(Adewole et al., 2015).
Nonetheless, several studies have proven that the prescribed ratios work. A thorough analysis
of studies done shows that the failure to attain the design strengths might have been because of
the high water to cement ratio used.
This anticipation that concrete manufactured using the prescribed ratios would fail necessitated
the requirement to do a comparative test, not based on the target strengths, but on control
specimens. This finding justifies the need for having Specimen A and Specimen B, which were
used as the control specimens in this research. Therefore, the failure to attain the desired
strength does not affect the validity of this experimental investigation.
4.3 Mechanical Properties of the Columns
The mechanical properties of the columns are the physical properties that the columns exhibited
after the testing. The physical properties of the column analysed were the axial capacity and
ductility. The data from the testing process was recorded and analysed. Statistical analysis and
tests were done using IBM SPSS Statistics Software (IBM Corp., 2021). The results were
presented in the form of bar graphs using Microsoft Excel (Microsoft Excel, 2019). The results
were discussed in subsections of axial capacity and ductility. In the respective subsections, the
first bar graphs show the average value of the axial capacity and ductility for each concrete
grade from Specimen A to Specimen J. After that, Specimens C, D, E, F, G, H, I and J were

70
compared with the control specimens A and B to determine the effect of CFRP strengthening.
The effect of CFRP strengthening was quantified as a percentage change. The comparisons
were then reorganised to find out the impact of the four variables under investigation. The
analysis is first organised by concrete grade, then by rebar, followed by the degree of
confinement and finally by the number of layers. This reorganisation of the results facilitated
the identification and visualisation of trends.
The average values of the various configurations were presented in radar charts and treemaps
to find out the impact of the variables on axial capacity and ductility. The calculations for the
determination of these effects are in Appendix D and Appendix E. The typical failure modes
are then presented before the final discussion, and a summary of findings is made.
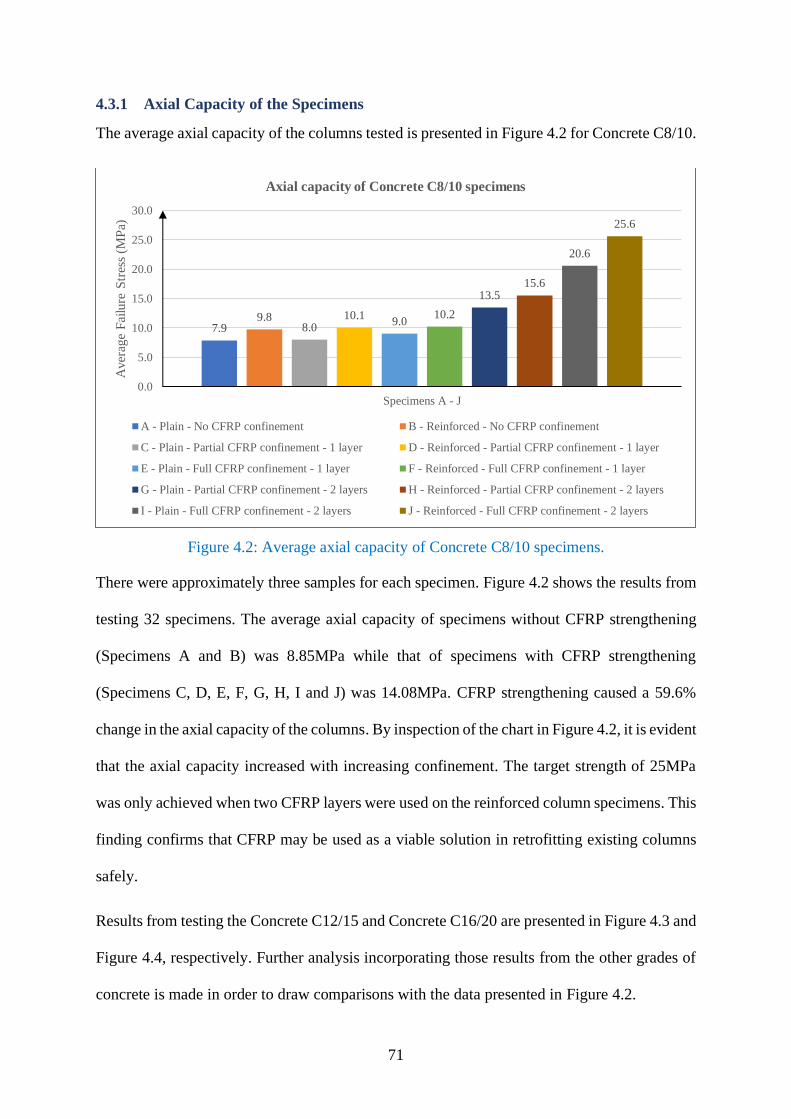
71
4.3.1 Axial Capacity of the Specimens
The average axial capacity of the columns tested is presented in Figure 4.2 for Concrete C8/10.
Figure 4.2: Average axial capacity of Concrete C8/10 specimens.
There were approximately three samples for each specimen. Figure 4.2 shows the results from
testing 32 specimens. The average axial capacity of specimens without CFRP strengthening
(Specimens A and B) was 8.85MPa while that of specimens with CFRP strengthening
(Specimens C, D, E, F, G, H, I and J) was 14.08MPa. CFRP strengthening caused a 59.6%
change in the axial capacity of the columns. By inspection of the chart in Figure 4.2, it is evident
that the axial capacity increased with increasing confinement. The target strength of 25MPa
was only achieved when two CFRP layers were used on the reinforced column specimens. This
finding confirms that CFRP may be used as a viable solution in retrofitting existing columns
safely.
Results from testing the Concrete C12/15 and Concrete C16/20 are presented in Figure 4.3 and
Figure 4.4, respectively. Further analysis incorporating those results from the other grades of
concrete is made in order to draw comparisons with the data presented in Figure 4.2.
7.99.8
8.010.1
9.010.2
13.515.6
20.6
25.6
0.0
5.0
10.0
15.0
20.0
25.0
30.0
Specimens A - J
Aver
age
Fai
lure
Str
ess
(MP
a)
Axial capacity of Concrete C8/10 specimens
A - Plain - No CFRP confinement B - Reinforced - No CFRP confinement
C - Plain - Partial CFRP confinement - 1 layer D - Reinforced - Partial CFRP confinement - 1 layer
E - Plain - Full CFRP confinement - 1 layer F - Reinforced - Full CFRP confinement - 1 layer
G - Plain - Partial CFRP confinement - 2 layers H - Reinforced - Partial CFRP confinement - 2 layers
I - Plain - Full CFRP confinement - 2 layers J - Reinforced - Full CFRP confinement - 2 layers

72
Figure 4.3 shows the average axial failure stress of the specimen cast for Concrete C12/15.
Figure 4.3: Average axial capacity of Concrete C12/15 specimens.
Figure 4.3 is a bar graph of the average values of 32 specimens. The average axial capacity of
specimens without CFRP strengthening (Specimens A and B) was 14MPa. In contrast, that of
specimens with CFRP strengthening (Specimens C, D, E, F, G, H, I and J) was 17.3MPa. On
average, CFRP confinement caused a positive change in the axial capacity of 23.5%. There
was less effect of CFRP confinement on Concrete C12/15 as compared to Concrete C8/10. By
observation, there was a slight change in the axial capacity as the level of confinement
increased from Specimen A towards Specimen J. Results in this chart seem to indicate that
using two layers of full CFRP confinement had a higher effect on the axial capacity of the
concrete columns. Further inspection reveals reinforced concrete Specimens B, D, F, H and J
had higher axial capacity than plain concrete Specimens A, C, E, G and I. A more in-depth
analysis incorporating data from Concrete C16/20 specimens would reveal trends identified
here only by mere observation.
13.214.8
16.418.7
14.7
18.7
14.5 15.1
18.4
21.8
0.0
5.0
10.0
15.0
20.0
25.0
30.0
Specimens A - J
Aver
age
Fai
lure
Str
ess
(MP
a)
Axial capacity of Concrete C12/15 specimens
A - Plain - No CFRP confinement B - Reinforced - No CFRP confinement
C - Plain - Partial CFRP confinement - 1 layer D - Reinforced - Partial CFRP confinement - 1 layer
E - Plain - Full CFRP confinement - 1 layer F - Reinforced - Full CFRP confinement - 1 layer
G - Plain - Partial CFRP confinement - 2 layers H - Reinforced - Partial CFRP confinement - 2 layers
I - Plain - Full CFRP confinement - 2 layers J - Reinforced - Full CFRP confinement - 2 layers
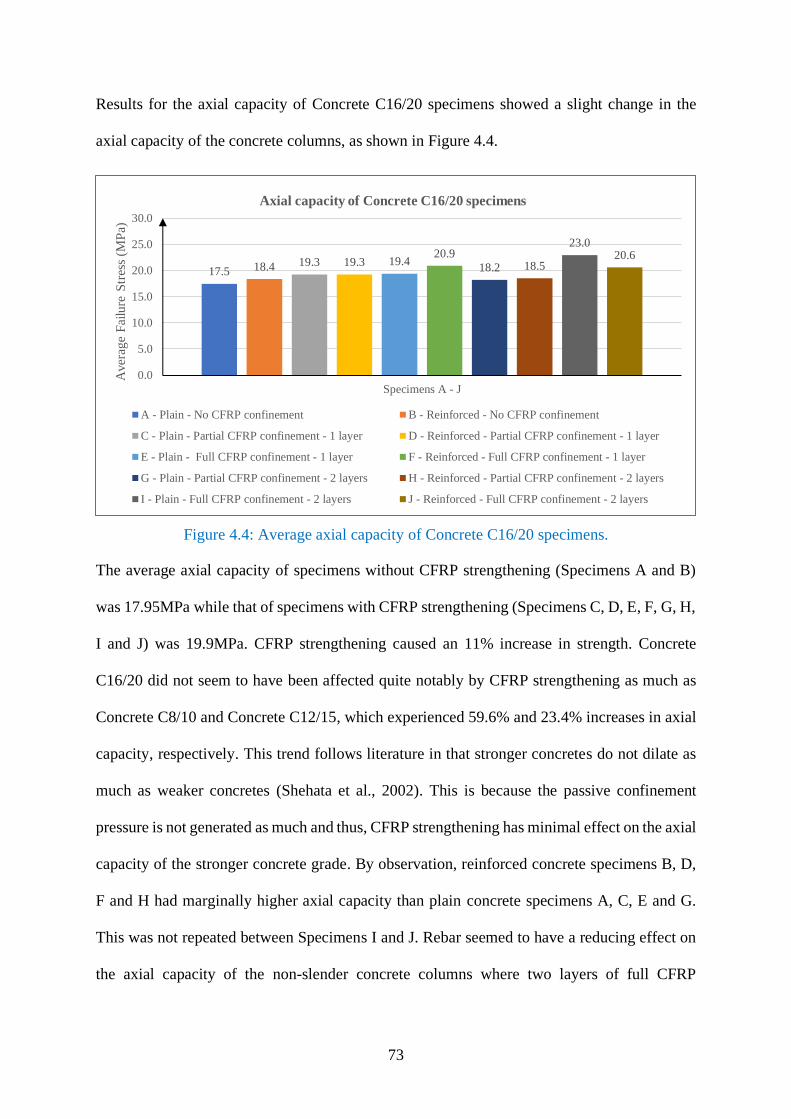
73
Results for the axial capacity of Concrete C16/20 specimens showed a slight change in the
axial capacity of the concrete columns, as shown in Figure 4.4.
Figure 4.4: Average axial capacity of Concrete C16/20 specimens.
The average axial capacity of specimens without CFRP strengthening (Specimens A and B)
was 17.95MPa while that of specimens with CFRP strengthening (Specimens C, D, E, F, G, H,
I and J) was 19.9MPa. CFRP strengthening caused an 11% increase in strength. Concrete
C16/20 did not seem to have been affected quite notably by CFRP strengthening as much as
Concrete C8/10 and Concrete C12/15, which experienced 59.6% and 23.4% increases in axial
capacity, respectively. This trend follows literature in that stronger concretes do not dilate as
much as weaker concretes (Shehata et al., 2002). This is because the passive confinement
pressure is not generated as much and thus, CFRP strengthening has minimal effect on the axial
capacity of the stronger concrete grade. By observation, reinforced concrete specimens B, D,
F and H had marginally higher axial capacity than plain concrete specimens A, C, E and G.
This was not repeated between Specimens I and J. Rebar seemed to have a reducing effect on
the axial capacity of the non-slender concrete columns where two layers of full CFRP
17.5 18.4 19.3 19.3 19.420.9
18.2 18.5
23.020.6
0.0
5.0
10.0
15.0
20.0
25.0
30.0
Specimens A - J
Aver
age
Fai
lure
Str
ess
(MP
a)
Axial capacity of Concrete C16/20 specimens
A - Plain - No CFRP confinement B - Reinforced - No CFRP confinement
C - Plain - Partial CFRP confinement - 1 layer D - Reinforced - Partial CFRP confinement - 1 layer
E - Plain - Full CFRP confinement - 1 layer F - Reinforced - Full CFRP confinement - 1 layer
G - Plain - Partial CFRP confinement - 2 layers H - Reinforced - Partial CFRP confinement - 2 layers
I - Plain - Full CFRP confinement - 2 layers J - Reinforced - Full CFRP confinement - 2 layers
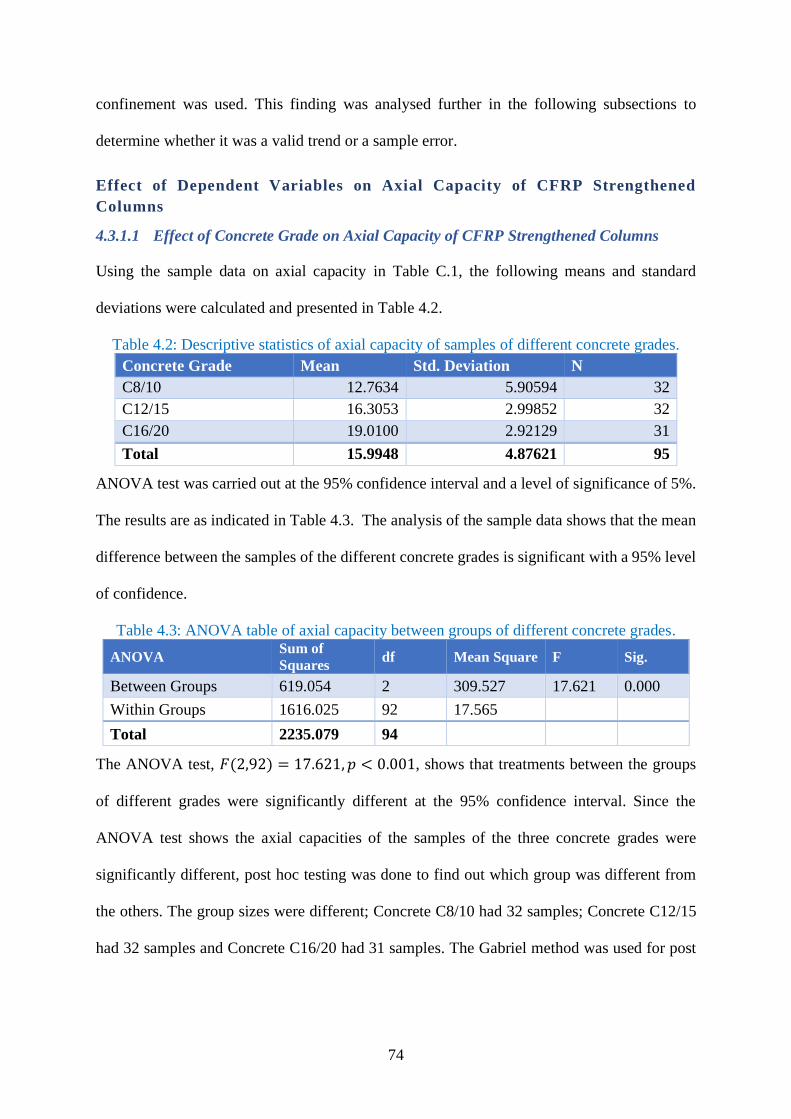
74
confinement was used. This finding was analysed further in the following subsections to
determine whether it was a valid trend or a sample error.
Effect of Dependent Variables on Axial Capacity of CFRP Strengthened
Columns
4.3.1.1 Effect of Concrete Grade on Axial Capacity of CFRP Strengthened Columns
Using the sample data on axial capacity in Table C.1, the following means and standard
deviations were calculated and presented in Table 4.2.
Table 4.2: Descriptive statistics of axial capacity of samples of different concrete grades.
Concrete Grade Mean Std. Deviation N
C8/10 12.7634 5.90594 32
C12/15 16.3053 2.99852 32
C16/20 19.0100 2.92129 31
Total 15.9948 4.87621 95
ANOVA test was carried out at the 95% confidence interval and a level of significance of 5%.
The results are as indicated in Table 4.3. The analysis of the sample data shows that the mean
difference between the samples of the different concrete grades is significant with a 95% level
of confidence.
Table 4.3: ANOVA table of axial capacity between groups of different concrete grades.
ANOVA Sum of
Squares df Mean Square F Sig.
Between Groups 619.054 2 309.527 17.621 0.000
Within Groups 1616.025 92 17.565
Total 2235.079 94
The ANOVA test, 𝐹(2,92) = 17.621, 𝑝 < 0.001, shows that treatments between the groups
of different grades were significantly different at the 95% confidence interval. Since the
ANOVA test shows the axial capacities of the samples of the three concrete grades were
significantly different, post hoc testing was done to find out which group was different from
the others. The group sizes were different; Concrete C8/10 had 32 samples; Concrete C12/15
had 32 samples and Concrete C16/20 had 31 samples. The Gabriel method was used for post
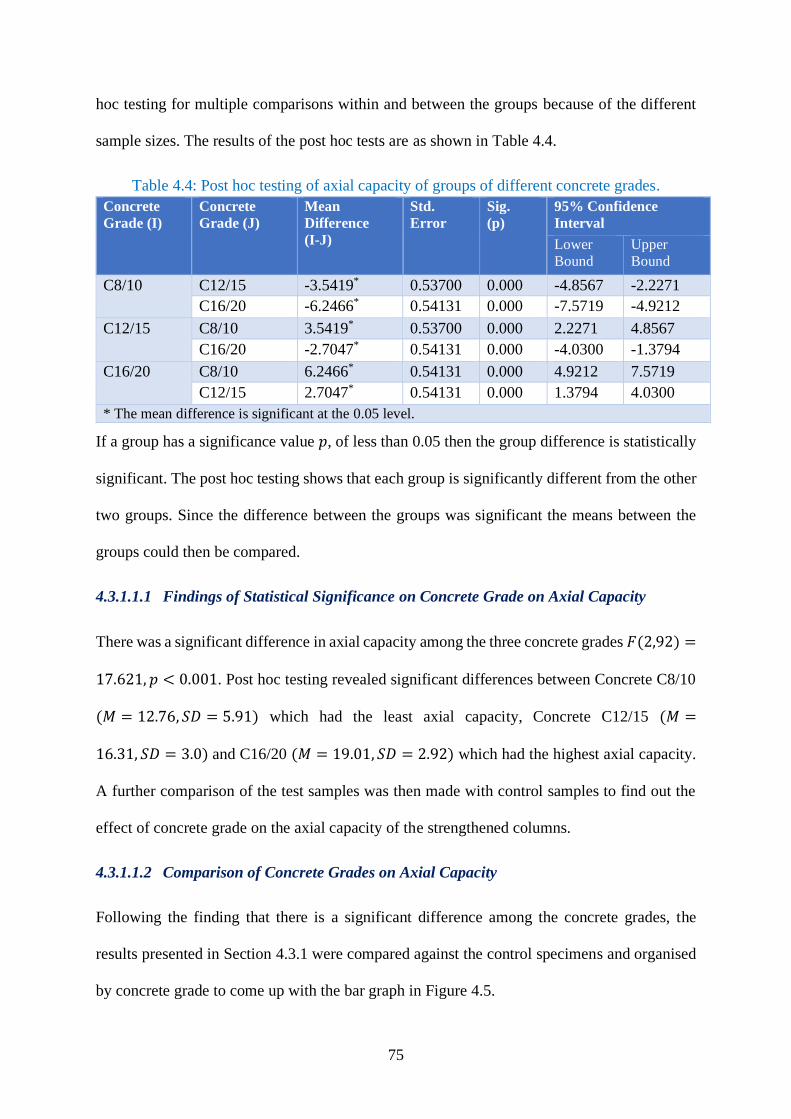
75
hoc testing for multiple comparisons within and between the groups because of the different
sample sizes. The results of the post hoc tests are as shown in Table 4.4.
Table 4.4: Post hoc testing of axial capacity of groups of different concrete grades.
Concrete
Grade (I)
Concrete
Grade (J)
Mean
Difference
(I-J)
Std.
Error
Sig.
(p)
95% Confidence
Interval
Lower
Bound
Upper
Bound
C8/10 C12/15 -3.5419* 0.53700 0.000 -4.8567 -2.2271
C16/20 -6.2466* 0.54131 0.000 -7.5719 -4.9212
C12/15 C8/10 3.5419* 0.53700 0.000 2.2271 4.8567
C16/20 -2.7047* 0.54131 0.000 -4.0300 -1.3794
C16/20 C8/10 6.2466* 0.54131 0.000 4.9212 7.5719
C12/15 2.7047* 0.54131 0.000 1.3794 4.0300
* The mean difference is significant at the 0.05 level.
If a group has a significance value 𝑝, of less than 0.05 then the group difference is statistically
significant. The post hoc testing shows that each group is significantly different from the other
two groups. Since the difference between the groups was significant the means between the
groups could then be compared.
4.3.1.1.1 Findings of Statistical Significance on Concrete Grade on Axial Capacity
There was a significant difference in axial capacity among the three concrete grades 𝐹(2,92) =
17.621, 𝑝 < 0.001. Post hoc testing revealed significant differences between Concrete C8/10
(𝑀 = 12.76, 𝑆𝐷 = 5.91) which had the least axial capacity, Concrete C12/15 (𝑀 =
16.31, 𝑆𝐷 = 3.0) and C16/20 (𝑀 = 19.01, 𝑆𝐷 = 2.92) which had the highest axial capacity.
A further comparison of the test samples was then made with control samples to find out the
effect of concrete grade on the axial capacity of the strengthened columns.
4.3.1.1.2 Comparison of Concrete Grades on Axial Capacity
Following the finding that there is a significant difference among the concrete grades, the
results presented in Section 4.3.1 were compared against the control specimens and organised
by concrete grade to come up with the bar graph in Figure 4.5.
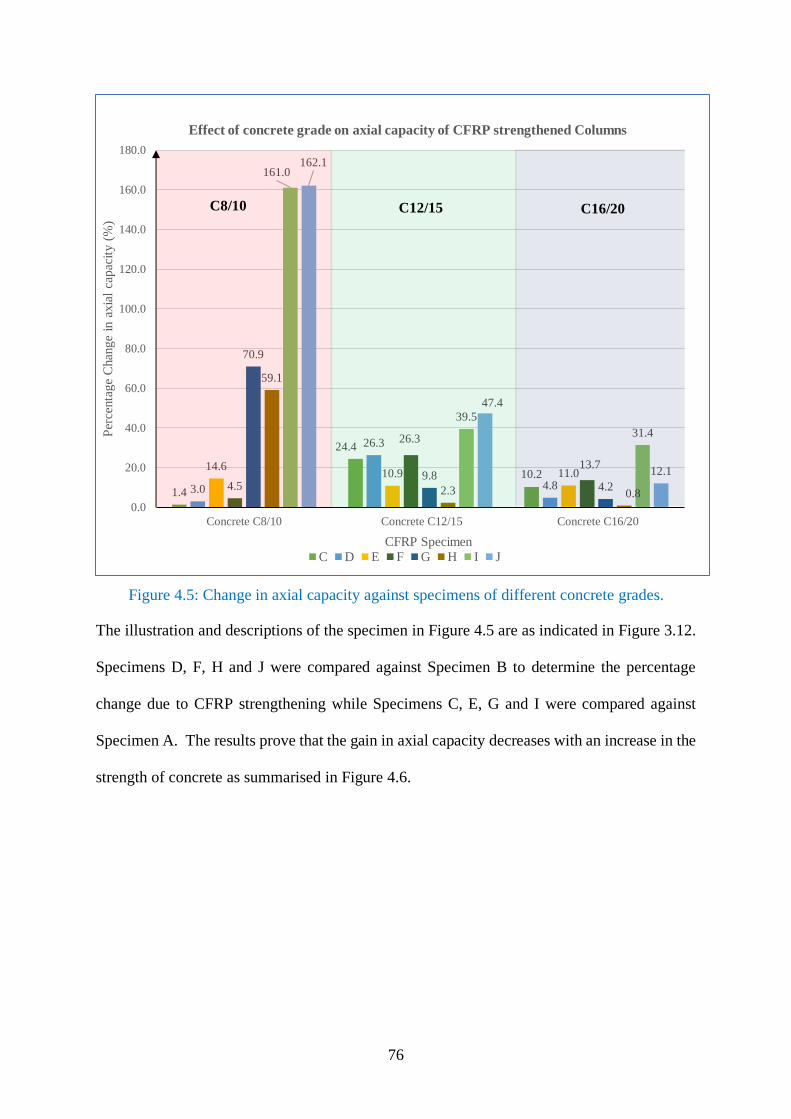
76
Figure 4.5: Change in axial capacity against specimens of different concrete grades.
The illustration and descriptions of the specimen in Figure 4.5 are as indicated in Figure 3.12.
Specimens D, F, H and J were compared against Specimen B to determine the percentage
change due to CFRP strengthening while Specimens C, E, G and I were compared against
Specimen A. The results prove that the gain in axial capacity decreases with an increase in the
strength of concrete as summarised in Figure 4.6.
1.4
24.4
10.2
3.0
26.3
4.8
14.610.9 11.0
4.5
26.3
13.7
70.9
9.84.2
59.1
2.3 0.8
161.0
39.5
31.4
162.1
47.4
12.1
0.0
20.0
40.0
60.0
80.0
100.0
120.0
140.0
160.0
180.0
Concrete C8/10 Concrete C12/15 Concrete C16/20
Per
centa
ge
Chan
ge
in a
xia
l ca
pac
ity (
%)
CFRP Specimen
Effect of concrete grade on axial capacity of CFRP strengthened Columns
C D E F G H I J
C8/10 C12/15 C16/20

77
4.3.1.1.3 Summary of the Effect of Concrete Grade on Axial Capacity of CFRP
strengthened columns
Figure 4.6 shows a bar graph that illustrates the change in means of the axial capacity of the
three concrete grades.
Figure 4.6: Summary of the effect of concrete grade on the axial capacity of CFRP strengthened
samples.
The chart shows that with all the other variables not taken into consideration, Concrete C8/10
experienced the highest effect when CFRP wrap was installed. The experimental investigation
found that concrete grade affected the gain in axial capacity. This analysis, therefore, confirms
the findings by Shehata et al. (2002) that weaker grades of concrete develop the most
tremendous change in axial capacity when strengthened by CFRP. The higher change
experienced in Concrete C8/10 is because when the weak concrete is subjected to axial
compression, it dilates more and results in higher confinement pressures and thus higher
increments in axial capacity in the weaker concrete grades.
59.6%
23.4%
11.0%
0.0%
10.0%
20.0%
30.0%
40.0%
50.0%
60.0%
70.0%
Concrete grades
Per
centa
ge
gai
n i
n a
xia
l ca
pac
ity (
%)
Axial capacity gain of CFRP strengthened samples of different concrete grades
Concrete C8/10 Concrete C12/15 Concrete C16/20

78
4.3.1.2 Effect of Rebar on Axial Capacity of CFRP Strengthened Columns
The means and standard deviation for ductility of groups with rebar present and with rebar
absent were calculated and presented in Table 4.5.
Table 4.5: Descriptive statistics of axial capacity of samples with rebar absent or present.
Rebar Mean Std. Deviation N
Absent 15.0273 4.84211 48
Present 16.9830 4.76009 47
A Levene’s test for equality of variances was performed for the t-test for equality of means and
is indicated in Table 4.6.
Table 4.6: T-test for axial capacity of groups with rebar absent and present.
Levene’s test for
equality of
variances
F Sig.
(p) t df
Sig.
(2-
tld)
Mean
Differe
nce
Std.
Error
Differe
nce
95% Confidence
Interval of the
Difference
Lower Upper
Equal variances
assumed 0.077 0.782 -1.985 93 0.05 -1.9556 0.9853 -3.912 0.0010
Equal variances
not assumed -1.985 92.9 0.05 -1.9556 0.9851 -3.912 0.0006
A t-test was conducted to find out if the effect of rebar was significant. The number of samples
was 95 and the critical value of the t-test was calculated as 1.986. A Microsoft Excel workbook
template was used to perform this calculation (Daniel & Kostic, 2019). Levene’s test checks
whether variances are equal. If Levene’s test is not significant, then equal variances are
assumed. In this case, the f-value is 0.077 and the p-value is 0.782. The p-value is greater than
0.05 and therefore the Levene’s test is significant and therefore equal variances are assumed.
The t-value of -1.985 does not exceed the critical value of 1.986 and the significance value is
0.782 which is greater than the significance value p, of 0.05 and therefore the difference
between the two groups is not statistically significant. Also, the 95% confidence interval for
the difference between sample means, shows there is a lower bound value of -0.3.912 and an
upper bound value of 0.0010 and therefore crosses zero; this means that the difference between
the two groups is not statistically significant. This finding was contrary to expectation since it

79
was expected that the steel reinforcement would cause a statistically significant increase in
axial capacity (Sayed & Diab, 2019). Further analysis was therefore performed to determine
whether the other various components of the study affected the effect of CFRP strengthening.
4.3.1.2.1 Individual Effect of Rebar on Axial Capacity of Columns without CFRP
Strengthening
The three grades of plain concrete specimens were compared with the reinforced concrete
specimens. The effect of rebar of the three grades of concrete was calculated, as shown by
Equation 4.1.
𝑃𝑒𝑟𝑐𝑒𝑛𝑡𝑎𝑔𝑒 𝑔𝑎𝑖𝑛 𝑖𝑛 𝑠𝑡𝑟𝑒𝑛𝑔𝑡ℎ = 𝑆𝑝𝑒𝑐𝑖𝑚𝑒𝑛 𝐵 − 𝑆𝑝𝑒𝑐𝑖𝑚𝑒𝑛 𝐴
𝑆𝑝𝑒𝑐𝑖𝑚𝑒𝑛 𝐴× 100%
Equation 4.1
Figure 4.7 highlights this difference which shows the trend that the weaker the concrete is, the
higher the effect of steel rebar on the axial capacity of the column.
Figure 4.7: Change in axial capacity due to rebar on specimens without CFRP strengthening.
The investigation conducted indicated that specimens with steel reinforcement had higher
failure stresses on average than specimens without steel reinforcement of the concrete grades
used in this study. This difference may be attributed to the higher yield stresses of steel
23.94
11.28
5.08
0.00
5.00
10.00
15.00
20.00
25.00
30.00
Concrete Grades
Per
centa
ge
gai
n i
n a
xia
l ca
pac
ity(%
)
Axial capacity gain due to rebar on specimens without CFRP Strengthening
Concrete C8/10 Concrete C12/15 Concrete C16/20
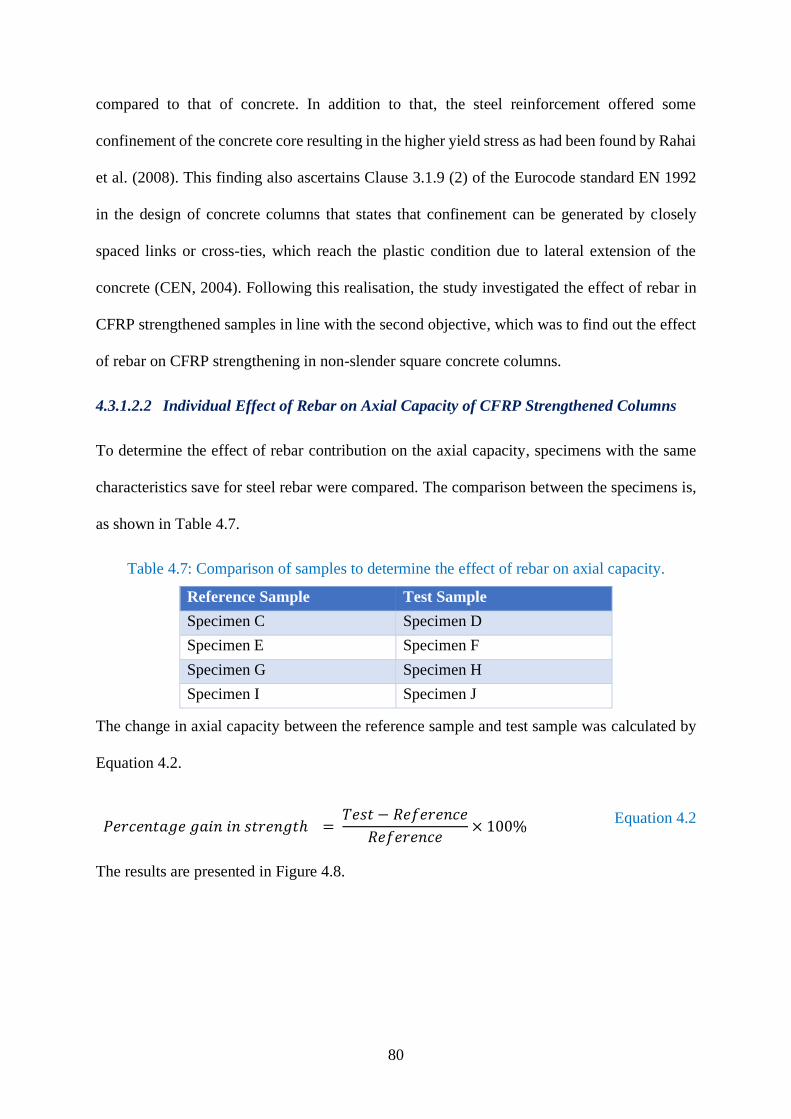
80
compared to that of concrete. In addition to that, the steel reinforcement offered some
confinement of the concrete core resulting in the higher yield stress as had been found by Rahai
et al. (2008). This finding also ascertains Clause 3.1.9 (2) of the Eurocode standard EN 1992
in the design of concrete columns that states that confinement can be generated by closely
spaced links or cross-ties, which reach the plastic condition due to lateral extension of the
concrete (CEN, 2004). Following this realisation, the study investigated the effect of rebar in
CFRP strengthened samples in line with the second objective, which was to find out the effect
of rebar on CFRP strengthening in non-slender square concrete columns.
4.3.1.2.2 Individual Effect of Rebar on Axial Capacity of CFRP Strengthened Columns
To determine the effect of rebar contribution on the axial capacity, specimens with the same
characteristics save for steel rebar were compared. The comparison between the specimens is,
as shown in Table 4.7.
Table 4.7: Comparison of samples to determine the effect of rebar on axial capacity.
Reference Sample Test Sample
Specimen C Specimen D
Specimen E Specimen F
Specimen G Specimen H
Specimen I Specimen J
The change in axial capacity between the reference sample and test sample was calculated by
Equation 4.2.
𝑃𝑒𝑟𝑐𝑒𝑛𝑡𝑎𝑔𝑒 𝑔𝑎𝑖𝑛 𝑖𝑛 𝑠𝑡𝑟𝑒𝑛𝑔𝑡ℎ = 𝑇𝑒𝑠𝑡 − 𝑅𝑒𝑓𝑒𝑟𝑒𝑛𝑐𝑒
𝑅𝑒𝑓𝑒𝑟𝑒𝑛𝑐𝑒× 100%
Equation 4.2
The results are presented in Figure 4.8.

81
Figure 4.8: Change in axial capacity due to rebar in CFRP strengthened columns.
Figure 4.8 shows the change in the axial capacity of CFRP strengthened samples with rebar
present compared with similar corresponding specimen with rebar absent. In the chart,
specimens were classified based on the concrete grade, which was highlighted by the different
colours in the background and by the number of layers. Samples D and F have one layer of
CFRP confinement, while Samples H and J have two layers of CFRP confinement. On average,
specimens with rebar (Specimens D, F, H and J) had an 11.73% higher axial capacity than
specimens without rebar (Specimens C, E, G and I). Based on this data, we can state that rebar
caused an increase in the axial capacity of the column specimens. There was a decrease in axial
capacity of concrete columns of Concrete C16/20 when two layers of CFRP were used with
rebar present. This decrement may be attributed to the fact that rebar may have reduced the
lateral expansion of the concrete column resulting in less passive confinement generated hence
the lower axial capacity of the reinforced specimen. In addition to that, Concrete C16/20 is
more brittle than the other grades of concrete used in this experiment, and when coupled with
rebar, it did not dilate as much as the other specimens tested.
25.93
13.11 13.51
27.27
0.00
7.63
15.38
24.46
4.08
18.07
1.63
-10.32
-15.00
-10.00
-5.00
0.00
5.00
10.00
15.00
20.00
25.00
30.00
D F D F D F H J H J H J
Per
centa
ge
chan
ge
in a
xia
l ca
pac
ity (
%)
Effect of rebar on axial capacity on CFRP Strengthened columns
Specimen
C8/10C8/10C12/15 C16/20 C12/15 C16/20
1 LAYER 2 LAYERS

82
Whereas the analysis presented shows that rebar increased the axial capacity of CFRP
strengthened samples, it does not show how it affects the CFRP strengthening in itself. To find
the effect of rebar on CFRP strengthening and not on the CFRP strengthened columns; the
individual effect of CFRP strengthening on axial capacity of plain and reinforced concrete was
compared.
4.3.1.2.3 Individual Effect of CFRP Strengthening on Axial Capacity of Plain Concrete
The plain concrete specimens C, E, G and I were compared with Specimen A of the
corresponding concrete grades. The effect of CFRP strengthening on plain concrete was thus
determined. The data was separated based on concrete grade and the number of CFRP layers
to end up with the chart shown in Figure 4.9.
Figure 4.9: Change in axial capacity due to CFRP strengthening on plain concrete.
Figure 4.9 shows that CFRP strengthening caused an increase in axial capacity of the plain
concrete specimen regardless of the different configurations of CFRP used. The study found
that CFRP increased the axial capacity of the plain concrete specimens on average by 33.13%.
This increase is anticipated because of the confinement mechanism of the CFRP wrap
1.41
14.5524.37
10.92 10.1719.49
70.89
161.03
9.80
39.50
4.24
31.36
0.00
20.00
40.00
60.00
80.00
100.00
120.00
140.00
160.00
180.00
C E C E C E G I G I G I
Per
centa
ge
chan
ge
in a
xia
l ca
pac
ity (
%)
Effect of CFRP strengthening on axial capacity of plain concrete
Specimen
1 LAYER 2 LAYERS
C8/10 C12/15 C16/20 C8/10 C12/15 C16/20

83
externally bonded to the specimen that causes a modification in the stress-strain behaviour of
concrete (CEN, 2004).
4.3.1.2.4 Individual Effect of CFRP Strengthening on Axial Capacity of Reinforced
Concrete
In the attempt to find out how rebar affects CFRP strengthening, the axial capacities of
reinforced concrete specimens D, F, H and J were compared with Specimen B of the
corresponding concrete grades. Specimen B was the control sample with rebar present. The
effect of CFRP strengthening on reinforced concrete was thus determined. The effect was
presented as the percentage change, as shown in Figure 4.10.
Figure 4.10: Change in axial capacity due to CFRP strengthening of reinforced concrete.
Averaging the values indicated in the chart, the study found that CFRP increased the axial
capacity of the reinforced concrete specimens on average by 29%. This change is different
from the effect of CFRP strengthening on plain concrete, as shown previously in Figure 4.10.
The increase in axial capacity can be explained by the confinement mechanism of CFRP wrap
(Abadi et al., 2019; CEN, 2004; Guo et al., 2018). However, the slight changes in the effect of
3.03 4.55
26.32 26.32
4.84-0.81
59.09
162.12
2.26
47.37
0.81
12.10
-20.00
0.00
20.00
40.00
60.00
80.00
100.00
120.00
140.00
160.00
180.00
D F D F D F H J H J H J
Per
centa
ge
chan
ge
in a
xia
l ca
pac
ity (
%)
Effect of CFRP strengthening on axial capacity of reinforced concrete
Specimen
1 LAYER 2 LAYERS
C8/10 C12/15 C16/20 C8/10 C12/15 C16/20

84
CFRP on axial capacity between plain concrete specimens, and reinforced concrete specimens
would be investigated further.
Comparison of the effect of CFRP strengthening on axial capacity between
plain concrete and reinforced concrete
To find out the difference between CFRP strengthening between plain concrete and reinforced
concrete, the values in Figure 4.9 and Figure 4.10 were compared side to side resulting in
Figure 4.11.
Figure 4.11: Comparison of change in axial capacity between plain and reinforced CFRP
strengthened concrete specimens.
The comparison in Figure 4.11 shows that the various CFRP configurations cause a similar
change in axial capacity regardless of the initial conditions of the concrete columns prior to the
addition of CFRP strengthening. It confirms that CFRP strengthening causes a similar
increment in the axial capacity, despite the presence or absence of steel reinforcement. This
finding negates the second research hypothesis in Section 1.5 that stated there is a significant
difference between CFRP strengthening on the plain and reinforced concrete specimen on the
axial capacity of non-slender concrete columns. Figure 4.11 shows that the presence of rebar
1.41
14.5524.37
10.92
10.17
19.49
70.89
161.03
9.80
39.50
4.24
31.36
3.03
4.55
26.32
26.32
4.84 -0.81
59.09
162.12
2.26
47.37
0.81
12.10
-20.00
0.00
20.00
40.00
60.00
80.00
100.00
120.00
140.00
160.00
180.00
C D E F C D E F C D E F G H I J G H I J G H I J
Per
centa
ge
chan
ge
in a
xia
l ca
pac
ity (
%)
Comparison of CFRP strengthening on plain and reinforced concrete
Plain concrete specimen Reinforced concrete specimen
1 LAYER 2 LAYERS
C8/10 C12/15 C16/20 C8/10 C12/15 C16/20

85
does not seem to affect the effect of CFRP strengthening on axial capacity. This apparent
behaviour was inspected further when comparing the combined effect of both CFRP and rebar.
4.3.1.2.5 Combined Effect of Rebar and CFRP Strengthening on Axial Capacity of
Columns
To find out the combined effect of rebar and CFRP strengthening on axial capacity, Specimen
D, F, H and J were compared with Specimen A. Specimens D, F, H and J had both CFRP
strengthening and rebar. At the same time, Specimen A was plain concrete specimen without
CFRP strengthening. The combined effect was compared with the sum of the individual effects
of both rebar and CFRP strengthening.
Figure 4.12: Combined effect of rebar and CFRP strengthening on the axial capacity.
Averaging the values indicated in Figure 4.12, the sum of the gain in axial capacity due to the
individual effect of rebar and the individual effect of CFRP was 44.88%. From the chart again,
the average gain in axial capacity due to the combined effect of both rebar and CFRP
strengthening was 49.51%. The calculations of the averages were as shown:
27.3 27.737.9 38.2
10.2
27.1
86.3
185.5
13.9
57.6
5.9
21.0
27.729.6
41.2 41.2
10.219.5
97.2
224.9
14.3
64.7
5.917.8
-25.0
25.0
75.0
125.0
175.0
225.0
D F D F D F H J H J H J
Per
centa
ge
chan
ge
in a
xia
l ca
pac
ity (
%)
Combined effect of rebar and CFRP strengthening on axial capacity
CFRP only Combined Effect Rebar only
1 LAYER 2 LAYERS
C8/10 C12/15 C16/20 C8/10 C12/15 C16/20

86
Individual effect of rebar + Individual effect of CFRP
𝐴𝑣𝑒𝑟𝑎𝑔𝑒 = 27.3 + 27.7 + 37.9 + 38.2 + 10.2 + 27.1 + 86.3 + 185.5 + 13.9 + 57.6 + 5.9 + 21.0
12
= 44.88%
Combined effect of rebar and CFRP 𝐴𝑣𝑒𝑟𝑎𝑔𝑒
= 27.7 + 29.6 + 41.2 + 41.2 + 10.2 + 19.5 + 97.2 + 224.9 + 14.3 + 64.7 + 5.9 + 17.8
12
=49.51%
Comparison of the final calculated values and from the inspection of Figure 4.12, it is evident
that the combined effect of CFRP strengthening and rebar on axial capacity is comparable to
the sum of the individual effect of rebar and the individual effect of CFRP strengthening. This
realisation is vital as it provides a rationale to which engineers can determine the combined
effect of CFRP strengthening and rebar on the axial capacity of RC columns.
4.3.1.2.6 Summary of the Effect of Rebar on Axial Capacity of CFRP Strengthened
Columns
Figure 4.13 provides a summary of the individual and combined effects of both rebar and CFRP
strengthening on the axial capacity of CFRP strengthened columns.
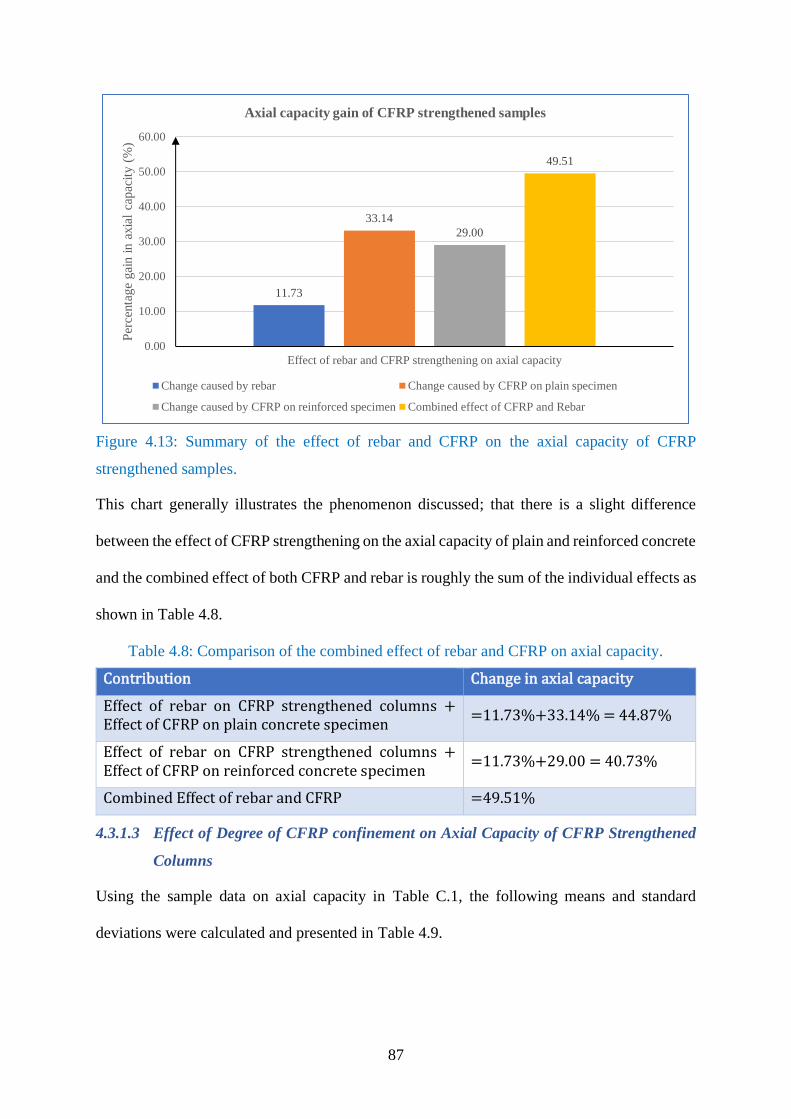
87
Figure 4.13: Summary of the effect of rebar and CFRP on the axial capacity of CFRP
strengthened samples.
This chart generally illustrates the phenomenon discussed; that there is a slight difference
between the effect of CFRP strengthening on the axial capacity of plain and reinforced concrete
and the combined effect of both CFRP and rebar is roughly the sum of the individual effects as
shown in Table 4.8.
Table 4.8: Comparison of the combined effect of rebar and CFRP on axial capacity.
Contribution Change in axial capacity
Effect of rebar on CFRP strengthened columns + Effect of CFRP on plain concrete specimen
=11.73%+33.14% = 44.87%
Effect of rebar on CFRP strengthened columns + Effect of CFRP on reinforced concrete specimen
=11.73%+29.00 = 40.73%
Combined Effect of rebar and CFRP =49.51%
4.3.1.3 Effect of Degree of CFRP confinement on Axial Capacity of CFRP Strengthened
Columns
Using the sample data on axial capacity in Table C.1, the following means and standard
deviations were calculated and presented in Table 4.9.
11.73
33.14
29.00
49.51
0.00
10.00
20.00
30.00
40.00
50.00
60.00
Effect of rebar and CFRP strengthening on axial capacity
Per
centa
ge
gai
n i
n a
xia
l ca
pac
ity (
%)
Axial capacity gain of CFRP strengthened samples
Change caused by rebar Change caused by CFRP on plain specimen
Change caused by CFRP on reinforced specimen Combined effect of CFRP and Rebar
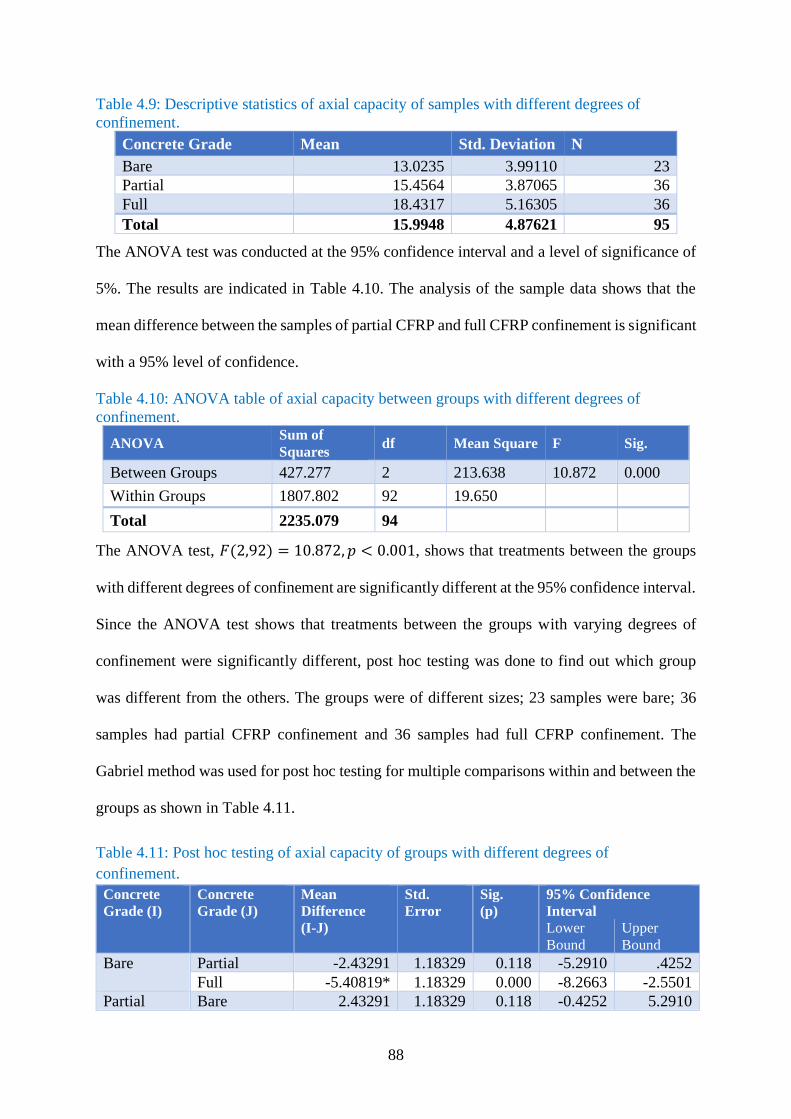
88
Table 4.9: Descriptive statistics of axial capacity of samples with different degrees of
confinement.
Concrete Grade Mean Std. Deviation N
Bare 13.0235 3.99110 23
Partial 15.4564 3.87065 36
Full 18.4317 5.16305 36
Total 15.9948 4.87621 95
The ANOVA test was conducted at the 95% confidence interval and a level of significance of
5%. The results are indicated in Table 4.10. The analysis of the sample data shows that the
mean difference between the samples of partial CFRP and full CFRP confinement is significant
with a 95% level of confidence.
Table 4.10: ANOVA table of axial capacity between groups with different degrees of
confinement.
ANOVA Sum of
Squares df Mean Square F Sig.
Between Groups 427.277 2 213.638 10.872 0.000
Within Groups 1807.802 92 19.650
Total 2235.079 94
The ANOVA test, 𝐹(2,92) = 10.872, 𝑝 < 0.001, shows that treatments between the groups
with different degrees of confinement are significantly different at the 95% confidence interval.
Since the ANOVA test shows that treatments between the groups with varying degrees of
confinement were significantly different, post hoc testing was done to find out which group
was different from the others. The groups were of different sizes; 23 samples were bare; 36
samples had partial CFRP confinement and 36 samples had full CFRP confinement. The
Gabriel method was used for post hoc testing for multiple comparisons within and between the
groups as shown in Table 4.11.
Table 4.11: Post hoc testing of axial capacity of groups with different degrees of
confinement.
Concrete
Grade (I)
Concrete
Grade (J)
Mean
Difference
(I-J)
Std.
Error
Sig.
(p)
95% Confidence
Interval
Lower
Bound
Upper
Bound
Bare
Partial -2.43291 1.18329 0.118 -5.2910 .4252
Full -5.40819* 1.18329 0.000 -8.2663 -2.5501
Partial Bare 2.43291 1.18329 0.118 -0.4252 5.2910

89
Concrete
Grade (I)
Concrete
Grade (J)
Mean
Difference
(I-J)
Std.
Error
Sig.
(p)
95% Confidence
Interval
Lower
Bound
Upper
Bound
Full -2.97528* 1.04483 0.016 -5.5146 -0.4360
Full
Bare 5.40819* 1.18329 0.000 2.5501 8.2663
Partial 2.97528* 1.04483 0.016 0.4360 5.5146
* The mean difference is significant at the 0.05 level.
If a group has a significance value 𝑝, of less than 0.05 then the group difference is statistically
significant. The post hoc testing shows that each group is different from each other significantly
except for the comparison between no confinement and partial CFRP confinement. Post hoc
testing reveals that at the 5% level of significance, the axial capacity of columns with partial
CFRP confinement is not statistically significantly different from columns without any CFRP
strengthening. Post hoc testing also reveals that at the 5% level of significance, the axial
capacity of columns with full CFRP confinement is statistically significantly different from
both the columns with partial CFRP confinement and columns with no CFRP strengthening.
Since the difference between the groups was statistically significant, the means between the
groups could then be compared.
4.3.1.3.1 Findings of Statistical Significance on Degree of Confinement on Axial Capacity
There was a significant difference among the three concrete grades 𝐹(2,92) = 10.872, 𝑝 <
0.001. Post hoc testing revealed significant differences between the groups with different
treatment: bare columns (𝑀 = 13.02, 𝑆𝐷 = 3.99) which had the least axial capacity, Partial
CFRP confinement (𝑀 = 15.46, 𝑆𝐷 = 3.87) and Full CFRP confinement (𝑀 = 18.43, 𝑆𝐷 =
5.16) which had the highest axial capacity.
4.3.1.3.2 Comparison of Partial CFRP and Full CFRP Confinement
The results were rearranged and categorised to compare the effect of partial CFRP confinement
versus full CFRP confinement, as shown in Figure 4.14.

90
Figure 4.14: Effect of CFRP confinement on axial capacity.
The analysis in Figure 4.14 thus shows that full CFRP confinement causes a higher increment
in axial capacity than partial CFRP confinement except for the comparison of Specimens C
and E of Concrete C12/15. There seems to be no rational explanation for this occurrence apart
from assuming that it was a sample variance. Whereas Figure 4.14 confirms that partial CFRP
confinement increases the axial capacity of square columns, it disproves claims made by some
CFRP manufacturers that partial and full CFRP confinement have the same effect in terms of
the axial capacity of concrete columns (Horse Construction, 2019).
4.3.1.3.3 Summary of the effect of degree of CFRP confinement on axial capacity of CFRP
strengthened samples.
Figure 4.15 shows the comparison between partial CFRP confinement and full CFRP
confinement.
1.4 3.0
24.4 26.3
10.2 4.8
70.9
59.1
9.82.3 4.2 0.8
14.6 4.510.9
26.311.0 13.7
161.0162.1
39.547.4
25.0 12.1
0.0
20.0
40.0
60.0
80.0
100.0
120.0
140.0
160.0
180.0
C E D F C E D F C E D F G I H J G I H J G I H J
Per
centa
ge
chan
ge
in a
xia
l ca
pac
ity (
%)
Effect of Degree of CFRP confinement on axial capacity
Partial CFRP confinement Full CFRP confinement
1 LAYER 1 LAYER 2 LAYERS
C8/10 C8/10C12/15 C16/20 C16/20C12/15
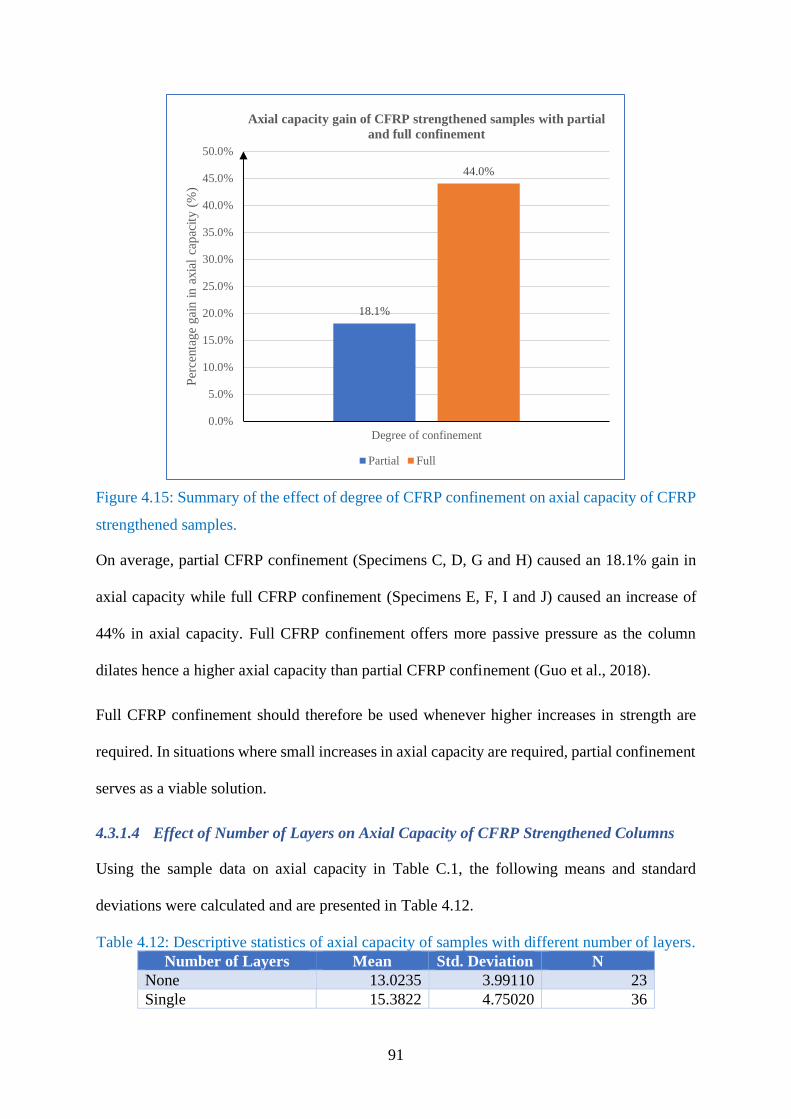
91
Figure 4.15: Summary of the effect of degree of CFRP confinement on axial capacity of CFRP
strengthened samples.
On average, partial CFRP confinement (Specimens C, D, G and H) caused an 18.1% gain in
axial capacity while full CFRP confinement (Specimens E, F, I and J) caused an increase of
44% in axial capacity. Full CFRP confinement offers more passive pressure as the column
dilates hence a higher axial capacity than partial CFRP confinement (Guo et al., 2018).
Full CFRP confinement should therefore be used whenever higher increases in strength are
required. In situations where small increases in axial capacity are required, partial confinement
serves as a viable solution.
4.3.1.4 Effect of Number of Layers on Axial Capacity of CFRP Strengthened Columns
Using the sample data on axial capacity in Table C.1, the following means and standard
deviations were calculated and are presented in Table 4.12.
Table 4.12: Descriptive statistics of axial capacity of samples with different number of layers.
Number of Layers Mean Std. Deviation N
None 13.0235 3.99110 23
Single 15.3822 4.75020 36
18.1%
44.0%
0.0%
5.0%
10.0%
15.0%
20.0%
25.0%
30.0%
35.0%
40.0%
45.0%
50.0%
Degree of confinement
Per
centa
ge
gai
n i
n a
xia
l ca
pac
ity (
%)
Axial capacity gain of CFRP strengthened samples with partial
and full confinement
Partial Full

92
Number of Layers Mean Std. Deviation N
Double 18.5058 4.31386 36
Total 15.9948 4.87621 95
ANOVA was carried out at the 95% confidence interval and the results are as indicated in Table
4.13. The analysis of the sample data shows that the mean difference between the samples of
partial CFRP and full CFRP confinement is significant with a 95% level of confidence.
Table 4.13: ANOVA table of axial capacity between groups with different number of layers.
ANOVA Sum of
Squares df Mean Square F Sig.
Between Groups 443.561 2 221.780 11.389 0.000
Within Groups 1791.518 92 19.473
Total 2235.079 94
The ANOVA test, 𝐹(2,92) = 11.389, 𝑝 < 0.001, shows that treatments between the groups
with the different number of layers are significantly different at the 95% confidence interval.
Since the ANOVA test shows that treatments between the groups were statistically
significantly different, post hoc testing was done to find out which group was different from
the others. The groups were of different sizes; no layer: 23 samples, single layer: 36 samples
and double layers: 36 samples; the Gabriel method was used for post hoc testing for multiple
comparisons within and between the groups as shown in Table 4.14.
Table 4.14: Post hoc testing of axial capacity of groups with different number of layers.
Concrete
Grade (I)
Concrete
Grade (J)
Mean
Difference
(I-J)
Std.
Error
Sig.
(p)
95% Confidence
Interval
Lower
Bound
Upper
Bound
None
Single -2.35874 1.17795 0.133 -5.2040 0.4865
Double -5.48236* 1.17795 0.000 -8.3276 -2.6371
Single
None 2.35874 1.17795 0.133 -0.4865 5.2040
Double -3.12361* 1.04011 0.010 -5.6515 -0.5958
Double
None 5.48236* 1.17795 0.000 2.6371 8.3276
Single 3.12361* 1.04011 0.010 .5958 5.6515 * The mean difference is significant at the 0.05 level.
If a group has a significance value 𝑝, of less than 0.05 then the group difference is statistically
significant. The post hoc testing shows that double layer CFRP confinement is statistically
significantly different from the columns with single layer confinement and no confinement.
93
4.3.1.4.1 Findings of Statistical Significance on Number of Layers on Axial Capacity
There was a significant difference among the CFRP layers 𝐹(2,92) = 11.389, 𝑝 < 0.001. Post
hoc testing revealed significant differences between the groups with different treatment: bare
columns (𝑀 = 13.02, 𝑆𝐷 = 3.99) which had the least axial capacity, followed by single CFRP
layer confinement (𝑀 = 15.38, 𝑆𝐷 = 4.75) and finally full CFRP confinement (𝑀 =
18.51, 𝑆𝐷 = 4.31) which had the highest axial capacity. Since the difference between the
single and double layers was significant, the means between the groups could then be
compared.
4.3.1.4.2 Comparison of Single and Double CFRP Layers on Axial Capacity
The results were sorted and organised to find the effect of the number of CFRP layers on the
axial capacity of the concrete columns. This analysis resulted in Figure 4.16 that shows the
change caused by one layer versus two layers side by side.

94
Figure 4.16: Effect of the number of CFRP layers on axial capacity.
By observation of the chart, two layers of CFRP had the highest effect in the axial capacity of
the weakest grade of concrete. In Concrete C8/10, two layers of CFRP strengthening was
consistently higher than one layer of CFRP strengthening. This trend; however, does not apply
to Concrete C12/15, as shown in Figure 4.16. Surprisingly, one layer of partial CFRP
confinement had a higher effect than two layers of partial CFRP confinement in two grades of
concrete: C12/15 and C16/20. Concrete C16/20 samples show a slight change between the
number of layers and the gain in axial capacity. This trend goes against the findings in literature
(Shehata et al., 2002; Shrive et al., 2003) and is attributed to sample variance.
There was no trend visualised in this chart for Concrete C12/15 and Concrete C16/20. The lack
of a definite pattern found no scientific explanation. This necessitated the need to calculate the
average effect to bring out the differences.
4.3.1.4.3 Summary of the Effect of the Number of Layers on Axial Capacity of CFRP
Strengthened Columns
The comparison of the number of layers is shown in Figure 4.17.
1.4 3.0
14.64.5
24.4 26.3
10.9 13.7 10.24.8
11.0 13.7
70.9
59.1
161.0 162.1
9.82.3
39.547.4
4.2 0.8
31.4
12.1
0.0
20.0
40.0
60.0
80.0
100.0
120.0
140.0
160.0
180.0
C G D H E I F J C G D H E I F J C G D H E I F J
Per
centa
ge
chan
ge
in a
xia
l ca
pac
ity (
%)
Specimens
Effect of Number of Layers on axial capacity
1 layer 2 layers
C8/10 C12/15 C16/20

95
Figure 4.17: Summary of the effect of the number of CFRP layers on the axial capacity of
CFRP strengthened samples.
The difference between one layer and two layers of CFRP confinement was evident. On
average, one layer of CFRP confinement (Specimens C, D, E and F) caused an 11.5% gain in
axial capacity while two layers of CFRP confinement (Specimens G, H, I and J) caused a 50%
gain in axial capacity. The number of layers increases the thickness of the CFRP confinement
and seems to have the highest effect on the axial capacity of the four parameters investigated
(Mohammed et al., 2020).
Two layers of CFRP confinement should be used when greater changes in axial capacity are
required. For example, in a building being retrofitted, lower storeys that bear higher loads may
have two layers of CFRP installed. In the upper storeys, where the loads are less, one layer of
CFRP may be used. This optimisation of resources ensures maximum benefit at the least cost.
11.5%
50.0%
0.0%
10.0%
20.0%
30.0%
40.0%
50.0%
60.0%
Number of layers
Per
centa
ge
gai
n i
n a
xia
l ca
pac
ity (
%)
Axial capacity gain of CFRP strengthened samples with one and
two layers
1 layer 2 layers

96
4.3.2 Ductility of Specimens
The organisation of this section is as that presented in the analysis of axial capacity of
specimens. To analyse the effect of CFRP strengthening, the results of ductility of the
specimens are first presented. After that, comparisons with the control samples are made in
order to find out the effect of concrete grade, rebar, degree of confinement and number of CFRP
layers on ductility.
The ductility of the column specimens was measured and calculated as percentage deformation
at failure. The deformation was measured along the longitudinal axis. There was difficulty in
obtaining the equipment necessary to measure the transverse deformation. Transverse
deformations, that is, hoop strains have been left out of this study.
The average values of ductility for specimens with Concrete C8/10 are presented in Figure
4.18.
Figure 4.18: Average ductility of Concrete C8/10 specimens.
Figure 4.18 shows the results of 32 concrete specimens. The average ductility of specimens
without CFRP strengthening (Specimens A and B) was 0.45% whereas the average ductility of
0.20.7
1.72.4
3.94.6
0.91.5
4.6
6.6
0.0
2.0
4.0
6.0
8.0
10.0
12.0
Specimen A - J
Per
centa
ge
def
orm
atio
n (
%)
Ductility of Concrete C8/10 specimens
A - Plain - No CFRP confinement B - Reinforced - No CFRP confinement
C - Plain - Partial CFRP confinement - 1 layer D - Reinforced - Partial CFRP confinement - 1 layer
E - Plain - Full CFRP confinement - 1 layer F - Reinforced - Full CFRP confinement - 1 layer
G - Plain - Partial CFRP confinement - 2 layers H - Reinforced - Partial CFRP confinement - 2 layers
I - Plain - Full CFRP confinement - 2 layers J - Reinforced - Full CFRP confinement - 2 layers

97
specimens with CFRP strengthening (Specimens C, D, E, F, G, H, I and J) was 3.3%. CFRP
strengthening caused an average change in ductility of 633.3%. The plain concrete specimen
with no CFRP strengthening had the least ductility while the reinforced concrete specimen with
two layers of full CFRP confinement had the highest ductility. These results show that CFRP
strengthening increases the ductility of columns. Further analysis and discussions will be made
after the results of ductility of Concrete C12/15 and C16/20 are presented.
For Concrete C12/15, the trend for ductility evident in Concrete C8/10 is not as clear.
Figure 4.19: Average ductility of Concrete C12/15 specimens.
The average ductility of specimens without CFRP strengthening (Specimens A and B) is 0.4%.
In contrast, the average ductility of specimens with CFRP strengthening (Specimens C, D, E,
F, G, H, I and J) is 3.1%. The percentage change in ductility was 718%. The chart in Figure
4.19 shows that there is an effect on the increase in ductility caused by the different
configurations of CFRP. It is worth noting that there is a conspicuous change in ductility when
two layers of CFRP are used as evidenced by the values of specimens G, H, I and J which had
0.5 0.31.0 0.7
1.20.7
2.62.9
8.7
7.1
0.0
2.0
4.0
6.0
8.0
10.0
12.0
Specimen A - J
Per
centa
ge
Def
orm
atio
n (
%)
Ductility of Concrete C12/15 specimens
A - Plain - No CFRP confinement B - Reinforced - No CFRP confinement
C - Plain - Partial CFRP confinement - 1 layer D - Reinforced - Partial CFRP confinement - 1 layer
E - Plain - Full CFRP confinement - 1 layer F - Reinforced - Full CFRP confinement - 1 layer
G - Plain - Partial CFRP confinement - 2 layers H - Reinforced - Partial CFRP confinement - 2 layers
I - Plain - Full CFRP confinement - 2 layers J - Full CFRP confinement - 2 layers

98
two layers of CFRP wrap. By inspection of the chart, specimens with rebar (Specimens B, D,
F, H and J) seemed to have less ductility than specimens without rebar (Specimens A, C, E, G
and I). This behaviour seems to go against findings in the literature reviewed since rebar should
improve the ductility of columns (Hou et al., 2019). Further analysis in the subsequent sections
was done to identify the trend.
This trend of ductility in Concrete C12/15 specimens was repeated in columns made of
Concrete C16/20 specimens, as shown in Figure 4.20.
Figure 4.20: Average ductility of Concrete C16/20 specimens.
The ductility of specimens without CFRP strengthening (Specimens A and B) was 0.3% while
that of specimens with CFRP strengthening (Specimens C, D, E, F, G, H, I and J) was 3.8%.
The percentage change in ductility from 0.3% to 3.8% was 1166.7%. CFRP strengthening
increases the ductility of the column specimens. There is a slight increase in ductility when one
layer of CFRP is used as shown by results of specimens C, D, E and F. A higher change in
ductility was reported when two layers of CFRP were used as evidenced by the results of
specimens G, H, I and J. This observed trend was analysed further to determine how the
0.3 0.31.3
0.9
2.3
0.5
3.7 4.1
10.6
7.0
0.0
2.0
4.0
6.0
8.0
10.0
12.0
Specimen A - J
Per
centa
ge
Def
orm
atio
n (
%)
Ductility of Concrete C16/20 specimens
A - Plain - No CFRP confinement B - Reinforced - No CFRP confinement
C - Plain - Partial CFRP confinement - 1 layer D - Reinforced - Partial CFRP confinement - 1 layer
E - Plain - Full CFRP confinement - 1 layer F - Reinforced - Full CFRP confinement - 1 layer
G - Plain - Partial CFRP confinement - 2 layers H - Reinforced - Partial CFRP confinement - 2 layers
I - Plain - Full CFRP confinement - 2 layers J - Reinforced - Full CFRP confinement - 2 layers

99
concrete grade, steel rebar, degree of confinement and number of CFRP layers affected the
ductility.
Effect of Dependent Variables on Ductility of CFRP Strengthened Columns
4.3.2.1 Effect of Concrete Grade on Ductility of CFRP Strengthened Columns
Using the sample data on axial capacity in Table D.1, the following means and standard
deviations were calculated and presented in Table 4.15.
Table 4.15: Descriptive statistics of ductility of samples of different concrete grades.
Concrete Grade Mean Std. Deviation N
C8/10 0.025688018 0.0237435394 32
C12/15 0.024234321 0.0305740525 32
C16/20 0.030284525 0.0344117035 31
Total 0.026698265 0.0296441609 95
ANOVA was carried out at the 95% confidence interval and a level of significance of 5%. The
results are as indicated in Table 4.16. The analysis of the sample data shows that the mean
difference of ductility between the samples of the different concrete grade is not significant at
the 95% level of confidence.
Table 4.16: ANOVA table of ductility between groups of different concrete grades.
ANOVA Sum of
Squares df Mean Square F Sig.
Between Groups 0.001 2 0.000 0.351 0.705
Within Groups 0.082 92 0.001
Total 0.083 94
The ANOVA test, 𝐹(2,92) = 0.351, 𝑝 < 0.705, shows that treatments between the groups of
different grades were not significantly different at the 95% confidence interval. Post hoc testing
was done to find out if there was an individual group that was different from the others. The
group sizes were different; Concrete C8/10 had 32 samples; Concrete C12/15 had 32 samples
and Concrete C16/20 had 31 samples; therefore, the Gabriel method was used for post hoc
testing for multiple comparisons within and between the groups as shown in Table 4.4.

100
Table 4.17: Post hoc testing of ductility of groups of different concrete grades.
Concrete
Grade (I)
Concrete
Grade (J)
Mean
Difference
(I-J)
Std.
Error
Sig.
(p)
95% Confidence
Interval
Lower
Bound
Upper
Bound
C8/10 C12/15 0.00145 0.00746 0.996 -0.01668 0.01959
C16/20 -0.00459 0.00752 0.903 -0.02287 0.01368
C12/15 C8/10 -0.00145 0.00746 0.996 -0.01959 0.01668
C16/20 -0.00605 0.00752 0.806 -0.02433 0.01223
C16/20 C8/10 0.00459 0.00752 0.903 -0.01368 0.02287
C12/15 0.00605 0.00752 0.806 -0.01223 0.02433
If a group has a significance value 𝑝, of greater than 0.05 then the group difference is not
statistically significant. The post hoc testing shows that each group is not different from each
other significantly.
4.3.2.1.1 Findings of Statistical Significance on Concrete Grade on Ductility
There was no significant difference in ductility among the three concrete grades 𝐹(2,92) =
0.351, 𝑝 < 0.705. Post hoc testing revealed no significant differences between Concrete C8/10
(𝑀 = 0.0257, 𝑆𝐷 = 0.0237), Concrete C12/15 (𝑀 = 0.0242, 𝑆𝐷 = 0.0306) which had the
least ductility and C16/20 (𝑀 = 0.0303, 𝑆𝐷 = 0.0344) which had the highest ductility. Even
though the difference between the groups was not significant, further investigation was done
to discover any trend that may be evident.
4.3.2.1.2 Comparison of Concrete Grades on Ductility
The percentage change in ductility of the three grades of concrete was compared against the
control specimens, and the result is presented in Figure 4.21.

101
Figure 4.21: Change in ductility against specimens of different concrete grades.
From the changes between the values of ductility of the concrete, it is evident that concrete
grade affects the ductility of non-slender square concrete columns. This finding confirms the
first hypothesis that stated concrete grade affects the ductility of non-slender square concrete
columns; however, there was no apparent pattern observed from one concrete grade to another
in the chart. To visualise any trend, the average effect of CFRP strengthening for all concrete
grades was performed, as presented in Figure 4.22.
4.3.2.1.3 Summary of the Effect of Concrete Grade on the Ductility of CFRP Strengthened
Columns
Figure 4.22 shows a bar graph illustrating the change in means of the ductility of the three
concrete grades.
1029.4
88.0
295.1235.4
126.4
155.2
2425.5
135.6
617.1
543.1130.6
50.3
464.7404.1
1057.8
108.8
914.7
1095.8
2896.1
1596.1
3186.6
815.8
2348.6
1918.2
0.0
500.0
1000.0
1500.0
2000.0
2500.0
3000.0
3500.0
Concrete C8/10 Concrete C12/15 Concrete C16/20
Per
centa
ge
chan
ge
in d
uct
ilit
y (
%)
CFRP Specimen
Effect of concrete grades on ductility of CFRP strengthened columns
C D E F G H I J
C8/10 C12/15 C16/20

102
Figure 4.22: Summary of the effect of concrete grade on the ductility of CFRP strengthened
samples.
There seems to be no direct relationship between concrete grades and the ductility of the
reinforced concrete columns; however, on average; Concrete C8/10 experienced a 1064.8%
change in ductility, Concrete C12/15 experienced 718% change while Concrete C16/20 had
1047% change. Whereas these changes seem relatively high, these changes are consistent with
a study by Wang et al. (2019) that had a 500% increase in ductility for Concrete C25/30. That
study had sophisticated sensors to measure deflections and was verified using Finite Element
Analysis (Wang et al., 2019). Masia et al. (2004) also found increases in ductility of 522% for
specimens of similar dimensions (125mm x 125mm x 375mm) to the one used in this study
(150mm x 150mm x 350mm). Concrete C8/10 had the most considerable change in ductility
caused by CFRP strengthening. This finding confirms the observations of studies by Shehata
et al. (2002) and Shrive et al. (2003).
1064.8%
718.0%
1047.0%
0.0%
200.0%
400.0%
600.0%
800.0%
1000.0%
1200.0%
Concrete grades
Per
centa
ge
gai
n i
n d
uct
ilit
y (
%)
Ductility gain of CFRP strengthened samples of different concrete grades
Concrete C8/10 Concrete C12/15 Concrete C16/20
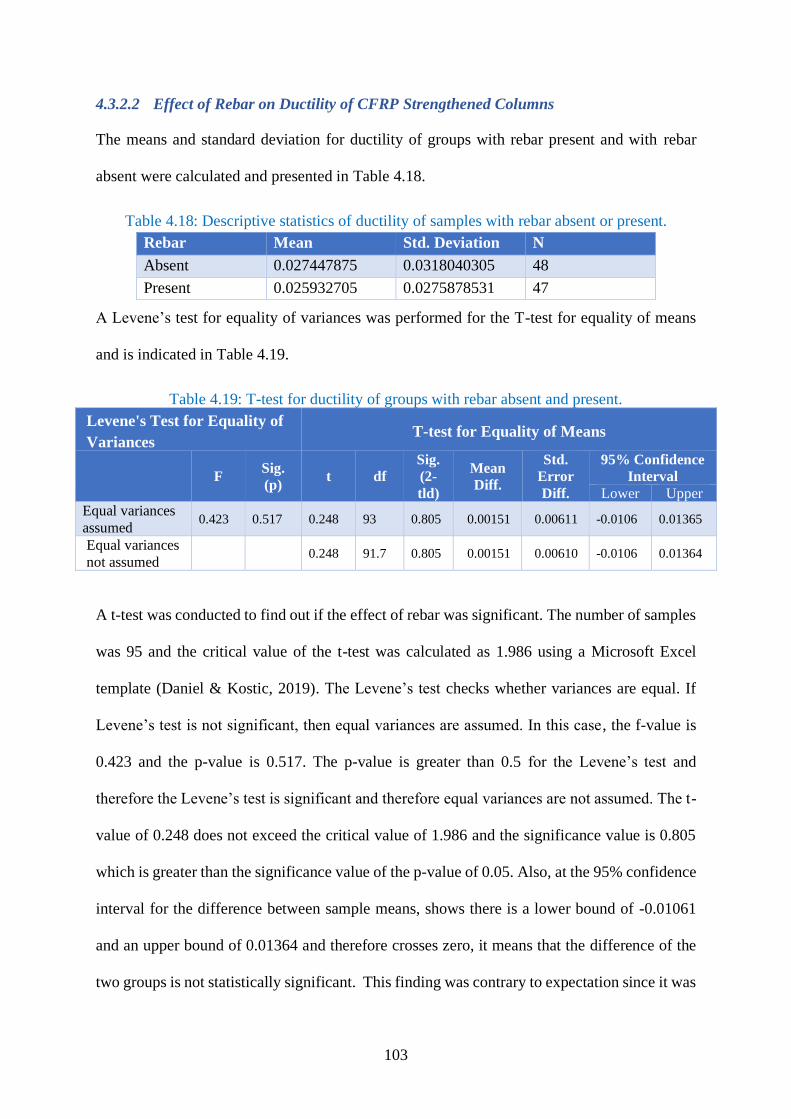
103
4.3.2.2 Effect of Rebar on Ductility of CFRP Strengthened Columns
The means and standard deviation for ductility of groups with rebar present and with rebar
absent were calculated and presented in Table 4.18.
Table 4.18: Descriptive statistics of ductility of samples with rebar absent or present.
Rebar Mean Std. Deviation N
Absent 0.027447875 0.0318040305 48
Present 0.025932705 0.0275878531 47
A Levene’s test for equality of variances was performed for the T-test for equality of means
and is indicated in Table 4.19.
Table 4.19: T-test for ductility of groups with rebar absent and present.
Levene's Test for Equality of
Variances T-test for Equality of Means
F Sig.
(p) t df
Sig.
(2-
tld)
Mean
Diff.
Std.
Error
Diff.
95% Confidence
Interval
Lower Upper
Equal variances
assumed 0.423 0.517 0.248 93 0.805 0.00151 0.00611 -0.0106 0.01365
Equal variances
not assumed 0.248 91.7 0.805 0.00151 0.00610 -0.0106 0.01364
A t-test was conducted to find out if the effect of rebar was significant. The number of samples
was 95 and the critical value of the t-test was calculated as 1.986 using a Microsoft Excel
template (Daniel & Kostic, 2019). The Levene’s test checks whether variances are equal. If
Levene’s test is not significant, then equal variances are assumed. In this case, the f-value is
0.423 and the p-value is 0.517. The p-value is greater than 0.5 for the Levene’s test and
therefore the Levene’s test is significant and therefore equal variances are not assumed. The t-
value of 0.248 does not exceed the critical value of 1.986 and the significance value is 0.805
which is greater than the significance value of the p-value of 0.05. Also, at the 95% confidence
interval for the difference between sample means, shows there is a lower bound of -0.01061
and an upper bound of 0.01364 and therefore crosses zero, it means that the difference of the
two groups is not statistically significant. This finding was contrary to expectation since it was

104
expected that the steel reinforcement would cause a statistically significant increase in ductility
(Sayed & Diab, 2019) . The study went ahead to find out how other parameters affected the
change in ductility in relation to the presence of steel reinforcement.
4.3.2.2.1 Individual effect of rebar on Ductility of columns without CFRP Strengthening
This experimental investigation sought to find out the effect of steel reinforcement on the
ductility of reinforced concrete specimen. The difference in ductility of the plain concrete
specimens was calculated by Equation 4.3.
𝑃𝑒𝑟𝑐𝑒𝑛𝑡𝑎𝑔𝑒 𝑔𝑎𝑖𝑛 𝑖𝑛 𝑑𝑢𝑐𝑡𝑖𝑙𝑖𝑡𝑦
=
𝑆𝑝𝑒𝑐𝑖𝑚𝑒𝑛 𝐵 − 𝑆𝑝𝑒𝑐𝑖𝑚𝑒𝑛 𝐴
𝑆𝑝𝑒𝑐𝑖𝑚𝑒𝑛 𝐴× 100%
Equation 4.3
Figure 4.23 shows the difference.
Figure 4.23: Ductility gain due to rebar.
The results show that rebar causes quite a notable increase in the ductility of concrete columns.
There is an inverse relationship between rebar contribution on ductility and the concrete grade.
The weaker the concrete, the more the contribution of rebar on ductility. The stronger the
365.88
234.59
6.82
0.00
50.00
100.00
150.00
200.00
250.00
300.00
350.00
400.00
Concrete Grades
Per
centa
ge
gai
n i
n d
uct
ilit
y (
%)
Ductility gain due to rebar on specimens without CFRP strengthening
Concrete C8/10 Concrete C12/15 Concrete C16/20

105
concrete, the less the steel reinforcement contributes to the ductility of the column. This finding
was consistent with the findings of axial capacity discussed in the preceding sections. Rebar
plays a significant role in the ductility of columns.
4.3.2.2.2 Individual Effect of Rebar on Ductility of CFRP Strengthened Columns
To determine the effect of rebar on the ductility of samples with the same CFRP configuration
and the same concrete characteristics except for rebar, the comparison in Table 4.20 was made.
Table 4.20: Comparison of the specimens to determine the effect of rebar on ductility.
Control Test
Specimen C Specimen D
Specimen E Specimen F
Specimen G Specimen H
Specimen I Specimen J
The change in ductility between the reference sample and test sample, as indicated in Table
4.20 was calculated by Equation 4.4.
𝑃𝑒𝑟𝑐𝑒𝑛𝑡𝑎𝑔𝑒 𝑐ℎ𝑎𝑛𝑔𝑒 𝑖𝑛 𝑑𝑢𝑐𝑡𝑖𝑙𝑖𝑡𝑦 = 𝑇𝑒𝑠𝑡 − 𝑅𝑒𝑓𝑒𝑟𝑒𝑛𝑐𝑒
𝑅𝑒𝑓𝑒𝑟𝑒𝑛𝑐𝑒× 100%
Equation 4.4
The difference in ductility of the reinforced concrete specimens compared with the plain
concrete specimens is presented in a bar graph, as shown in Figure 4.24.
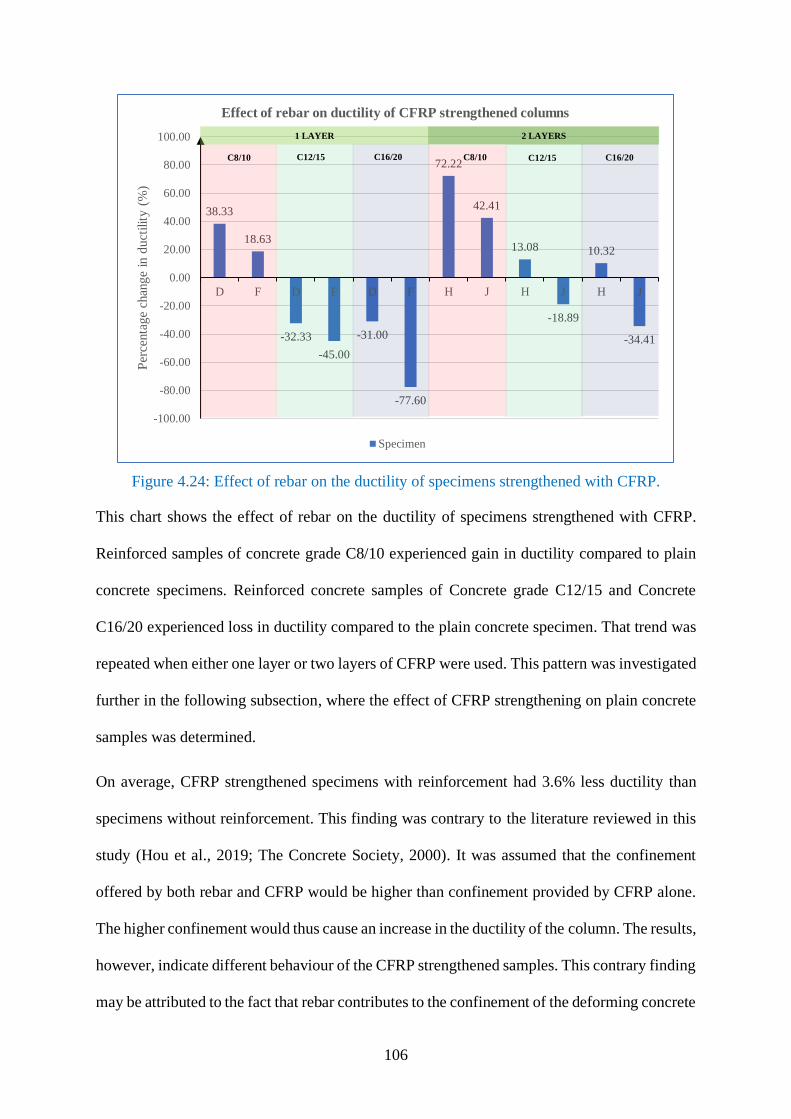
106
Figure 4.24: Effect of rebar on the ductility of specimens strengthened with CFRP.
This chart shows the effect of rebar on the ductility of specimens strengthened with CFRP.
Reinforced samples of concrete grade C8/10 experienced gain in ductility compared to plain
concrete specimens. Reinforced concrete samples of Concrete grade C12/15 and Concrete
C16/20 experienced loss in ductility compared to the plain concrete specimen. That trend was
repeated when either one layer or two layers of CFRP were used. This pattern was investigated
further in the following subsection, where the effect of CFRP strengthening on plain concrete
samples was determined.
On average, CFRP strengthened specimens with reinforcement had 3.6% less ductility than
specimens without reinforcement. This finding was contrary to the literature reviewed in this
study (Hou et al., 2019; The Concrete Society, 2000). It was assumed that the confinement
offered by both rebar and CFRP would be higher than confinement provided by CFRP alone.
The higher confinement would thus cause an increase in the ductility of the column. The results,
however, indicate different behaviour of the CFRP strengthened samples. This contrary finding
may be attributed to the fact that rebar contributes to the confinement of the deforming concrete
38.33
18.63
-32.33
-45.00
-31.00
-77.60
72.22
42.41
13.08
-18.89
10.32
-34.41
-100.00
-80.00
-60.00
-40.00
-20.00
0.00
20.00
40.00
60.00
80.00
100.00
D F D F D F H J H J H J
Per
centa
ge
chan
ge
in d
uct
ilit
y (
%)
Effect of rebar on ductility of CFRP strengthened columns
Specimen
C8/10 C8/10C12/15 C16/20 C12/15 C16/20
1 LAYER 2 LAYERS
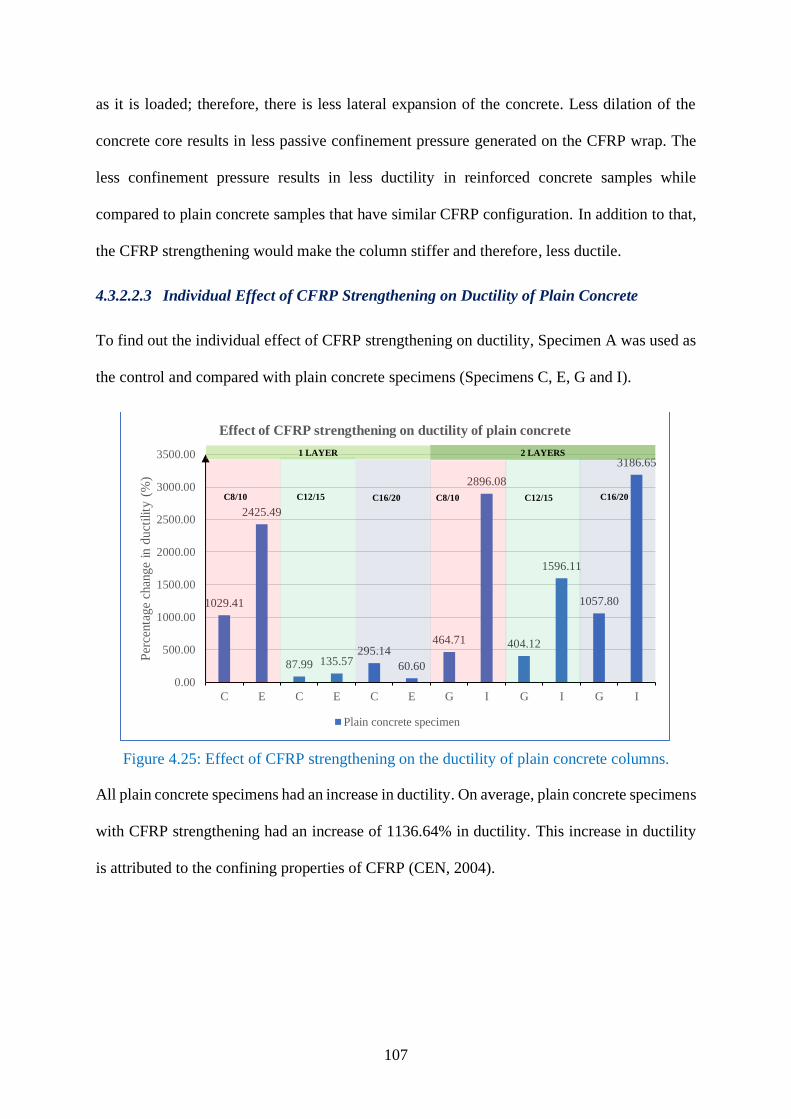
107
as it is loaded; therefore, there is less lateral expansion of the concrete. Less dilation of the
concrete core results in less passive confinement pressure generated on the CFRP wrap. The
less confinement pressure results in less ductility in reinforced concrete samples while
compared to plain concrete samples that have similar CFRP configuration. In addition to that,
the CFRP strengthening would make the column stiffer and therefore, less ductile.
4.3.2.2.3 Individual Effect of CFRP Strengthening on Ductility of Plain Concrete
To find out the individual effect of CFRP strengthening on ductility, Specimen A was used as
the control and compared with plain concrete specimens (Specimens C, E, G and I).
Figure 4.25: Effect of CFRP strengthening on the ductility of plain concrete columns.
All plain concrete specimens had an increase in ductility. On average, plain concrete specimens
with CFRP strengthening had an increase of 1136.64% in ductility. This increase in ductility
is attributed to the confining properties of CFRP (CEN, 2004).
1029.41
2425.49
87.99 135.57295.14
60.60
464.71
2896.08
404.12
1596.11
1057.80
3186.65
0.00
500.00
1000.00
1500.00
2000.00
2500.00
3000.00
3500.00
C E C E C E G I G I G I
Per
centa
ge
chan
ge
in d
uct
ilit
y (
%)
Effect of CFRP strengthening on ductility of plain concrete
Plain concrete specimen
1 LAYER 2 LAYERS
C8/10 C12/15 C16/20 C8/10 C12/15 C16/20

108
4.3.2.2.4 Individual Effect of CFRP Strengthening on Ductility of Reinforced Concrete
Similarly, as in the earlier section, Specimen B was the control specimen compared to the
reinforced concrete specimen (Specimens D, F, H and J) to find out the individual effect of
CFRP strengthening on the ductility of reinforced concrete.
Figure 4.26: Effect of CFRP strengthening on the ductility of reinforced concrete columns.
It is evident again that CFRP caused an increase in ductility of the reinforced column
specimens. On average, reinforced concrete samples had an increase of 718% in ductility. This
change may be attributed to the fact that CFRP increased the confinement in concrete columns.
Higher strengths and higher critical strains are obtained in confined concrete (CEN, 2004).
Comparison of the Effect of CFRP Strengthening on ductility between Plain
Concrete and Reinforced Concrete
Figure 4.25 and Figure 4.26 were combined to visualise the effect of CFRP strengthening on
plain concrete specimens and reinforced concrete as per the second research question that
investigated the difference in CFRP strengthening between plain concrete specimens and
reinforced concrete specimens. The outcome of the combination of the two charts was the chart
shown in Figure 4.27.
235.35
543.10
126.42 130.61 155.24
983.92
108.75
815.82914.68
2348.64
1095.80
1918.18
0.00
500.00
1000.00
1500.00
2000.00
2500.00
D F D F D F H J H J H J
Per
centa
ge
chan
ge
in d
uct
ilit
y (
%)
Effect of CFRP strengthening on ductility of reinforced concrete
Reinforced concrete specimen
1 LAYER 2 LAYERS
C8/10 C12/15 C16/20 C8/10 C12/15 C16/20

109
Figure 4.27: Comparison of change in ductility between plain and reinforced CFRP
strengthened concrete specimens.
Mostly, the plain concrete specimens had higher ductility than the reinforced concrete samples.
The less ductility in reinforced concrete samples can be attributed to the fact that rebar made
the columns stiffer and therefore less ductile. Figure 4.27 shows that plain concrete specimens
had higher increases in ductility; however, the gain in ductility between some plain and
reinforced concrete samples with similar CFRP configuration, such as Specimens C, D, E and
F of Concrete C12/15 with one CFRP layer was negligible. These differences may be attributed
to material variability and human factors. Further analysis was done in the following subsection
by comparing the reinforced specimens with CFRP strengthening against plain concrete
specimens.
On site, it would be essential to find out the ductility of a column with both rebar and CFRP
strengthening. This necessitates finding out how the two materials act together to affect the
ductility of the columns.
1029.41
2425.49
87.99 135.57
295.14
60.60
464.71
2896.08
404.12
1596.11
1057.80
3186.65
235.35
543.10 126.42130.61
155.24
983.92
108.75
815.82914.68
2348.64
1095.80
1918.18
0.00
500.00
1000.00
1500.00
2000.00
2500.00
3000.00
3500.00
C D E F C D E F C D E F G H I J G H I J G H I J
Per
centa
ge
chan
ge
in d
uct
ilit
y (
%)
Comparison of CFRP strengthening plain and reinforced concrete
Plain concrete specimen Reinforced concrete specimen
1 LAYER 2 LAYERS
C8/10 C12/15 C16/20 C8/10 C12/15 C16/20

110
4.3.2.2.5 Combined Effect of Rebar and CFRP Strengthening on Ductility of Columns
To determine the combined effect of both CFRP and rebar specimens, reinforced specimens
with CFRP strengthening were compared with plain concrete specimen with no CFRP
strengthening and no rebar, Specimen A. The comparison was made with Specimen A of the
respective concrete grades and shown in Figure 4.28. The results were rearranged to analyse
the trends of the column ductility based on rebar.
Figure 4.28: Combined effect of rebar and CFRP strengthening on ductility.
The side-by-side comparison shows that the two bar graphs follow a similar pattern. Averaging
the values of the sum of gain in ductility due to individual effect of CFRP and the individual
effect of rebar was 1132.95% while the average gain in ductility due to the combined effect of
both rebar and CFRP strengthening was 1222.21%. The calculation of the values was as shown:
1067.7
2444.1
55.790.6 264.1
-17.0
536.9
2938.5
417.2
1577.2
1068.1
3152.2
1462.4
2896.1
27.229.6
172.6 60.6
872.5
4166.7
470.1
1275.7
1177.3
2055.7
-500.0
0.0
500.0
1000.0
1500.0
2000.0
2500.0
3000.0
3500.0
4000.0
4500.0
D F D F D F H J H J H J
Per
centa
ge
chan
ge
in d
uct
ilit
y (
%)
Combined effect of rebar and CFRP strengthening on ductility
CFRP only Combined effect Rebar only
1 LAYER 2 LAYERS
C8/10 C12/15 C16/20 C8/10 C12/15 C16/20

111
Individual effect of rebar on ductility + Individual effect of CFRP on ductility
𝐴𝑣𝑒𝑟𝑎𝑔𝑒 = 1067.7 + 2441.1 + 55.7 + 90.6 + 264.1 − 17.0 + 536.9 + 2938.5 + 417.2 + 1577.2 + 1068.1 + 3152.2
12
= 1132.95%
Combined effect of rebar and CFRP on ductility 𝐴𝑣𝑒𝑟𝑎𝑔𝑒
= 1462.4 + 2896.1 + 27.2 + 29.6 + 172.6 + 60.6 + 872.5 + 4166.7 + 470.1 + 1275.7 + 1177.3 + 2055.7
12
=1222.21%
From Figure 4.28, it is evident that the contribution of rebar to ductility is considerably less
than the contribution of CFRP to ductility.
4.3.2.2.6 Summary of the Effect of Rebar on Ductility of CFRP Strengthened Columns
To further illustrate the effect of rebar on ductility in comparison with CFRP strengthening,
the average gains in ductility are presented in Figure 4.29. Rebar causes a reduction in the
effect of CFRP strengthening to increase ductility since it increases the stiffness of columns
and therefore makes the columns less ductile.
Figure 4.29: Summary of the effect of rebar and CFRP on the ductility of CFRP strengthened
samples.
-3.69
1136.64
781.38
1222.21
-200.00
0.00
200.00
400.00
600.00
800.00
1000.00
1200.00
1400.00
Effect of rebar and CFRP strengthening on ductility
Per
centa
ge
gai
n (
%)
Ductility gain of CFRP strengthened samples
Change caused by rebar Change caused by CFRP on plain specimen
Change caused by CFRP on reinforced specimen Combined effect of CFRP and Rebar

112
Basing our analysis on the results of the ductility shown in Figure 4.29, this study assumes that
there is a difference between the effect of CFRP strengthening on plain concrete and reinforced
concrete specimens. This finding is crucial as it is a rationale to determine the ductility of an
existing reinforced column that has been retrofitted with CFRP. Finding out the amount of
existing reinforcement would also be important.
The combined effect of CFRP and rebar was roughly comparable to the sum of the individual
effect of rebar and the individual effect of CFRP strengthening.
Table 4.21: Comparison of the combined effect of rebar and CFRP on ductility.
Contribution Change in ductility
Effect of rebar on CFRP strengthened columns + Effect of CFRP on plain concrete specimen
=-3.69+1136.64 = 1132.95%
Effect of rebar on CFRP strengthened columns + Effect of CFRP on reinforced concrete specimen
=-3.69+781.38 = 727.69%
Combined Effect of rebar and CFRP =1222.21%
4.3.2.3 Effect of Degree of CFRP confinement on Ductility of CFRP Strengthened
Columns
Using the sample data on ductility in Table D.1, the following means and standard deviations
were calculated and are presented in Table 4.22.
Table 4.22: Descriptive statistics of ductility of sample of with different degrees of
confinement.
Concrete Grade Mean Std. Deviation N
Bare 0.003926745 0.0032238820 23
Partial 0.019753540 0.0129044841 36
Full 0.048191460 0.0363533166 36
Total 0.026698265 0.0296441609 95
ANOVA was carried out at the 95% confidence interval and a level of significance of 5%. The
results are indicated in Table 4.23. The analysis of the sample data shows that the mean
difference between the samples of partial CFRP and full CFRP confinement is significant at
the 95% level of confidence.

113
Table 4.23: ANOVA table of ductility between groups with different degrees of confinement.
ANOVA Sum of
Squares df Mean Square F Sig.
Between Groups 0.030 2 0.015 26.638 0.000
Within Groups 0.052 92 0.001
Total 0.083 94
The ANOVA test 𝐹(2,92) = 26.638, 𝑝 < 0.001, shows that treatments between the groups
with different degrees of confinement are significantly different at the 95% confidence interval.
Since the ANOVA test shows that treatments between the groups with varying degrees of
confinement were significantly different, post hoc testing was done to find out which group
was different from the others. The groups were of different sizes; 23 samples were bare; 36
samples had partial CFRP confinement and 36 samples had full CFRP confinement. The
Gabriel method was used for post hoc testing for multiple comparisons within and between the
groups as shown in Table 4.24.
Table 4.24: Post hoc testing of ductility of groups with different degrees of confinement.
Concrete
Grade (I)
Concrete
Grade (J)
Mean
Difference
(I-J)
Std.
Error
Sig.
(p)
95% Confidence
Interval
Lower
Bound
Upper
Bound
Bare
Partial -0.01582* 0.00636 0.042 -0.03120 -0.00045
Full -0.04426* 0.00636 0.000 -0.05963 -0.02889
Partial
Bare 0.01582* 0.00636 0.042 0.00045 0.03120
Full -0.02843* 0.00562 0.000 -0.04209 -0.01477
Full
Bare 0.04426* 0.00636 .0000 0.02889 0.05963
Partial 0.02843* 0.00562 0.000 0.01477 0.04209
* The mean difference is significant at the 0.05 level.
If a group has a significance value of 𝑝, of less than 0.05 then the group difference is statically
significant. The post hoc testing shows that each group is different from each other
significantly.
4.3.2.3.1 Findings of Statistical Significance on Number of Layers on Ductility
There was a statistically significant difference among the CFRP layers 𝐹(2,92) = 26.638, 𝑝 <
0.001. Post hoc testing revealed significant differences between the groups with different
treatment: bare columns (𝑀 = 0.00393, 𝑆𝐷 = 0.00322) which had the least ductility,

114
followed by partial CFRP confinement (𝑀 = 0.01975, 𝑆𝐷 = 0.0129) and finally full CFRP
confinement (𝑀 = 0.04819, 𝑆𝐷 = 0.03635) which had the highest ductility. Since the
difference between the groups was significant the means between the groups could then be
compared.
4.3.2.3.2 Comparison of Single and Double CFRP Layers on Ductility
The results were rearranged and categorised to compare the effect of degree of CFRP
confinement on the ductility of specimens as presented in Figure 4.30.
Figure 4.30: Effect of degree of CFRP confinement on ductility.
The results show that full CFRP confinement has a significant incremental change in the
ductility of columns than partial CFRP confinement. It is only in Specimen F of Concrete
C16/20 where partial CFRP confinement had a higher effect on ductility than full CFRP
confinement. This result was attributed to a sample error. Since the sample size of this
experimental study was small, taking the average of the various samples would assist in the
visualisation of any trend.
1029.4
235.488.0
126.4
295.1155.2 464.7
108.8
404.1
914.71057.8 1095.8
2425.5
543.1 135.6
130.6
617.1
50.3
2896.1
815.8
1596.1
2348.6
2976.9
1918.2
0.0
500.0
1000.0
1500.0
2000.0
2500.0
3000.0
3500.0
C E D F C E D F C E D F G I H J G I H J G I H J
Per
centa
ge
chan
ge
in d
uct
ilit
y (
%)
Effect of degree of confinement on ductility
Partial CFRP confinement Full CFRP confinement
1 LAYER 1 LAYER 2 LAYERS
C8/10 C8/10C12/15 C16/20 C16/20C12/15

115
4.3.2.3.3 Summary of the Effect of Degree of Confinement on Ductility of CFRP
Strengthened Columns
The average was calculated and the results presented in the chart shown in Figure 4.31.
Figure 4.31: Summary of the effect of degree of CFRP confinement on the ductility of CFRP
strengthened samples.
Specimens with partial CFRP confinement (Specimens C, D, G and H) had an average increase
of 498% in ductility. In contrast, specimens with full CFRP confinement (Specimens E, F, I
and J) had an average increase of 1371.2% in ductility. This finding disproves the claim that
partial CFRP confinement has the same effect as full CFRP confinement in terms of ductility.
4.3.2.4 Effect of Number of layers on Ductility of CFRP Strengthened Columns
Using the sample data on ductility in Table D.1, the following means and standard deviations
were calculated and presented in Table 4.25.
Table 4.25: Descriptive statistics of ductility of samples with different number of layers.
Number of Layers Mean Std. Deviation N
None 0.003926745 0.0032238820 23
Single 0.017636873 0.0173092602 36
Double 0.050308127 0.0324874660 36
Total 0.026698265 0.0296441609 95
498.0%
1371.2%
0.0%
200.0%
400.0%
600.0%
800.0%
1000.0%
1200.0%
1400.0%
1600.0%
Degree of confinement
Per
centa
ge
gai
n i
n d
uct
ilit
y (
%)
Ductility gain of CFRP strengthened samples with full and partial
confinement
Partial Full
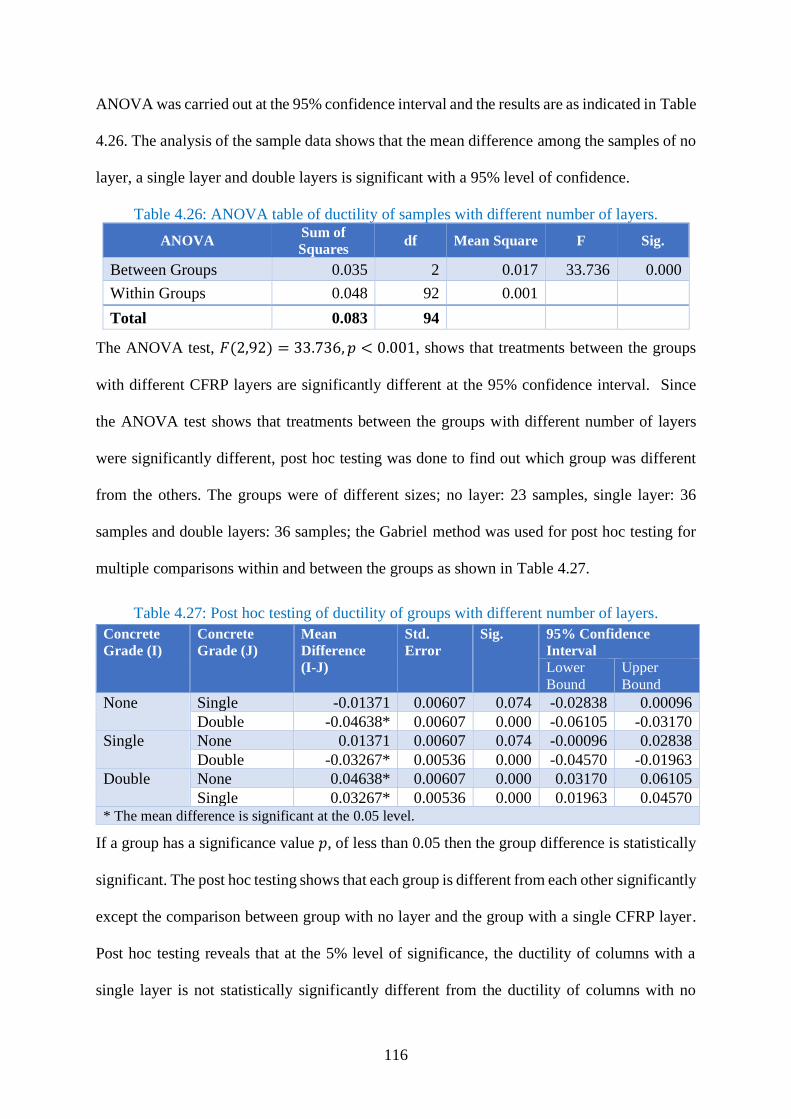
116
ANOVA was carried out at the 95% confidence interval and the results are as indicated in Table
4.26. The analysis of the sample data shows that the mean difference among the samples of no
layer, a single layer and double layers is significant with a 95% level of confidence.
Table 4.26: ANOVA table of ductility of samples with different number of layers.
ANOVA Sum of
Squares df Mean Square F Sig.
Between Groups 0.035 2 0.017 33.736 0.000
Within Groups 0.048 92 0.001
Total 0.083 94
The ANOVA test, 𝐹(2,92) = 33.736, 𝑝 < 0.001, shows that treatments between the groups
with different CFRP layers are significantly different at the 95% confidence interval. Since
the ANOVA test shows that treatments between the groups with different number of layers
were significantly different, post hoc testing was done to find out which group was different
from the others. The groups were of different sizes; no layer: 23 samples, single layer: 36
samples and double layers: 36 samples; the Gabriel method was used for post hoc testing for
multiple comparisons within and between the groups as shown in Table 4.27.
Table 4.27: Post hoc testing of ductility of groups with different number of layers.
Concrete
Grade (I)
Concrete
Grade (J)
Mean
Difference
(I-J)
Std.
Error
Sig. 95% Confidence
Interval
Lower
Bound
Upper
Bound
None
Single -0.01371 0.00607 0.074 -0.02838 0.00096
Double -0.04638* 0.00607 0.000 -0.06105 -0.03170
Single
None 0.01371 0.00607 0.074 -0.00096 0.02838
Double -0.03267* 0.00536 0.000 -0.04570 -0.01963
Double
None 0.04638* 0.00607 0.000 0.03170 0.06105
Single 0.03267* 0.00536 0.000 0.01963 0.04570 * The mean difference is significant at the 0.05 level.
If a group has a significance value 𝑝, of less than 0.05 then the group difference is statistically
significant. The post hoc testing shows that each group is different from each other significantly
except the comparison between group with no layer and the group with a single CFRP layer.
Post hoc testing reveals that at the 5% level of significance, the ductility of columns with a
single layer is not statistically significantly different from the ductility of columns with no

117
CFRP layer. Post hoc testing also reveals that at the 5% level of significance, the ductility of
columns with two layers of CFRP is statistically significantly different from the ductility of
columns with a single layer of CFRP and the ductility of columns with no CFRP strengthening.
4.3.2.4.1 Findings of Statistical Significance on Number of Layers on Ductility
There was a significant difference among the CFRP layers 𝐹(2,92) = 33.736, 𝑝 < 0.001. Post
hoc testing revealed statistically significant differences between the groups with different
treatment: bare columns (𝑀 = 0.003927, 𝑆𝐷 = 0.003224) which had the least ductility,
followed by single CFRP layer (𝑀 = 0.17637, 𝑆𝐷 = 0.017309) and finally full CFRP
confinement (𝑀 = 0.050308, 𝑆𝐷 = 0.032487) which had the highest ductility. Since the
difference between the groups was significant the means between the groups could then be
compared.
4.3.2.4.2 Comparison of Single and Double CFRP Layers on Ductility
The ductility of Specimen C, E, G and I were compared with Specimen A while that of
Specimen D, F, H and J were compared with Specimen B. The results are thus presented in
Figure 4.32.

118
Figure 4.32: Effect of CFRP layers on ductility.
Figure 4.32 shows that the number of layers is directly proportional to the increase in ductility.
The number of layers has a significant effect on ductility. The higher the number of layers
increases the confining properties of the wraps and thus a higher modification of the stress-
strain behaviour of the confined concrete (CEN, 2004).
4.3.2.4.3 Summary of the Effect of the Number of CFRP layers on the Ductility of CFRP
strengthened Columns.
Figure 4.33 shows the comparison of single CFRP confinement and Double CFRP
confinement.
1029.4
235.4
2425.5
543.1
88.0 126.4 135.650.3
295.1155.2
617.1
50.3
464.7
108.8
2896.1
815.8
404.1
914.7
1596.1
2348.6
1057.8 1095.8
3186.6
1918.2
0.0
500.0
1000.0
1500.0
2000.0
2500.0
3000.0
3500.0
C G D H E I F J C G D H E I F J C G D H E I F J
Per
centa
ge
chan
ge
in d
uct
ilit
y (
%)
Specimens
Effect of number of CFRP layers on ductility
1 layer 2 layers
C8/10 C12/15 C16/20

119
Figure 4.33: Summary of the effect of the number of CFRP layers on the ductility of CFRP
strengthened samples.
On average, Specimens G, H, I and J which had two layers of CFRP confinement had a higher
change in ductility (1400.6%) than Specimens C, D, E and F which had one layer of CFRP
confinement (479.3%). This finding proves our fourth research hypothesis that stated that
additional layers of CFRP wrap have a direct relationship with increment in the ductility of
non-slender square concrete columns.
4.4 Summary of Experimental Results
The experimental results were summarised in the form of radar charts and treemaps. A radar
chart is a graphical technique of visualising multivariate data in the form of a two-dimensional
chart of three or more variables represented on axes starting from a single point in a radial
manner. The angle and relative position of the axes is uninformative (Porter, 2018). In this
case, for instance, the four independent variables are on the same radar chart, the line
connecting the values in each axis does not mean that the effect varies linearly between the
two. The radar chart has only been employed to reveal distinct correlations and differences. A
treemap represents several data values as the area of rectangles. It is useful for visualising and
representing hierarchical information (Microsoft Excel, 2019).
479.3%
1400.6%
0.0%
200.0%
400.0%
600.0%
800.0%
1000.0%
1200.0%
1400.0%
1600.0%
Number of layers
Per
centa
ge
gai
n i
n d
uct
ilit
y (
%)
Ductility gain of CFRP strengthened samples with one and two
layers
1 layer 2 layers
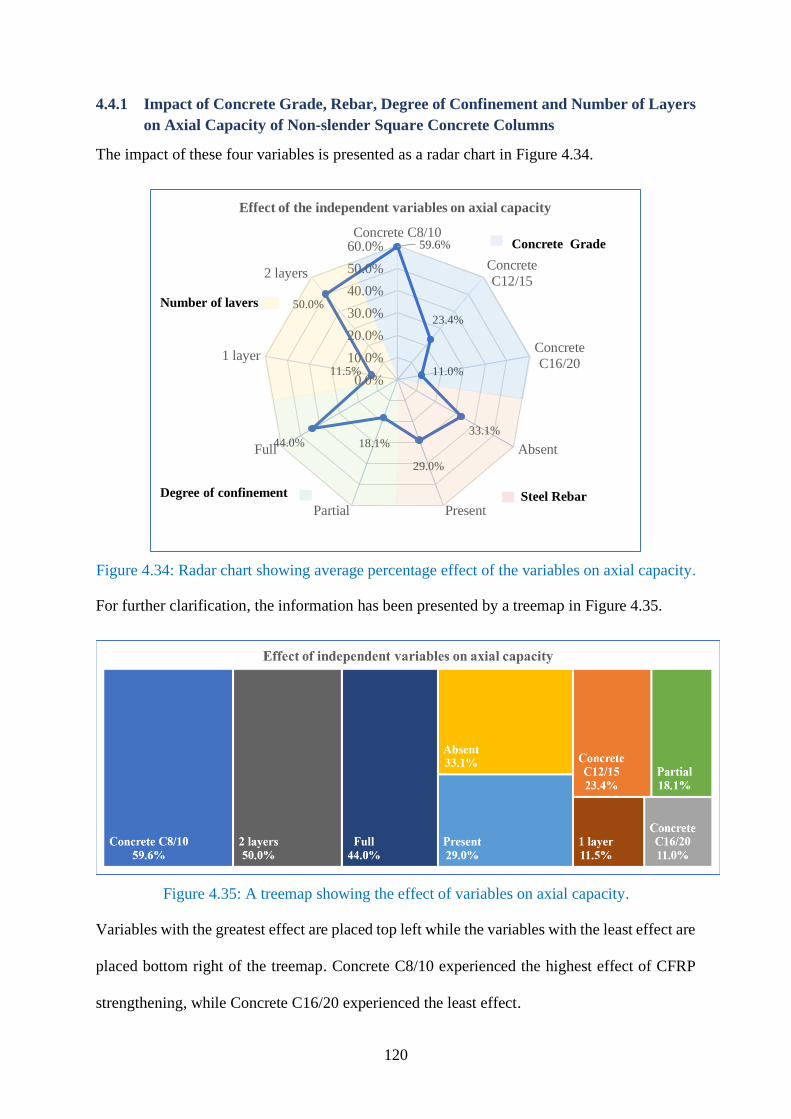
120
4.4.1 Impact of Concrete Grade, Rebar, Degree of Confinement and Number of Layers
on Axial Capacity of Non-slender Square Concrete Columns
The impact of these four variables is presented as a radar chart in Figure 4.34.
Figure 4.34: Radar chart showing average percentage effect of the variables on axial capacity.
For further clarification, the information has been presented by a treemap in Figure 4.35.
Figure 4.35: A treemap showing the effect of variables on axial capacity.
Variables with the greatest effect are placed top left while the variables with the least effect are
placed bottom right of the treemap. Concrete C8/10 experienced the highest effect of CFRP
strengthening, while Concrete C16/20 experienced the least effect.
59.6%
23.4%
11.0%
33.1%
29.0%
18.1%44.0%
11.5%
50.0%
0.0%
10.0%
20.0%
30.0%
40.0%
50.0%
60.0%Concrete C8/10
Concrete
C12/15
Concrete
C16/20
Absent
PresentPartial
Full
1 layer
2 layers
Effect of the independent variables on axial capacity
Concrete Grade
Steel RebarDegree of confinement
Number of layers

121
4.4.2 Impact of Concrete Grade, Rebar, Degree of Confinement and Number of Layers
on Ductility of Non-slender Square Concrete Columns
A radar chart was also presented to determine each of the variable’s contribution to change in
ductility.
Figure 4.36: Radar chart showing average percentage effect of the variables on ductility.
Once again, the results are presented in a treemap for a more straightforward interpretation.
Figure 4.37: Treemap showing the effect of variables studied on ductility.
1064.8%
718.0%
1047.0%
1136…
781.4%
498.0%1371.2%
479.3%
1400.6%
0.0%
250.0%
500.0%
750.0%
1000.0%
1250.0%
1500.0%Concrete C8/10
Concrete
C12/15
Concrete
C16/20
Absent
PresentPartial
Full
1 layer
2 layers
Effect of independent variables on ductility
Concrete Grade
Steel RebarDegree of
confinement
Number of
layers

122
Having two layers of CFRP confinement had the greatest effect while having one layer of
CFRP strengthening had the least effect of CFRP strengthening on average.
4.4.3 Comparison of Effectiveness within the Variables
There was a need to compare the effectiveness of the parameters of the four independent
variables. The columns that had the least change in axial capacity and ductility were used as
the benchmarks. For instance, to find out the difference in effectiveness between one layer
(11.5%) and two layers (50%) in axial capacity, the following calculation was made:
𝐶ℎ𝑎𝑛𝑔𝑒 𝑖𝑛 𝑒𝑓𝑓𝑒𝑐𝑡𝑖𝑣𝑒𝑛𝑒𝑠𝑠 = 𝑉𝑎𝑙𝑢𝑒 𝑜𝑓 𝑝𝑎𝑟𝑎𝑚𝑒𝑡𝑒𝑟
𝐿𝑒𝑎𝑠𝑡 𝑣𝑎𝑙𝑢𝑒 𝑜𝑓 𝑝𝑎𝑟𝑎𝑚𝑒𝑡𝑒𝑟
Equation 4.5
𝐶ℎ𝑎𝑛𝑔𝑒 𝑖𝑛 𝑒𝑓𝑓𝑒𝑐𝑡𝑖𝑣𝑒𝑛𝑒𝑠𝑠 = 50%
11.5%= 4.35
Following this calculation, it can be stated that using two layers of CFRP is 4.35 times more
effective than using one layer. Equation 4.5 was then used to compute the change in
effectiveness and the results are presented in Table 4.28.
Table 4.28: Comparison of effectiveness within the variables.
Independent variables Axial
capacity Effectiveness Ductility Effectiveness
Grade of
concrete
C8/10 59.6% 5.42 1064.8% 1.48
C12/15 23.4% 2.13 718.0% 1.00
C16/20 11.0% 1.00 1047.0% 1.46
Steel Rebar Absent 33.1% 1.14 1136.6% 1.45
Present 29.0% 1.00 781.4% 1.00
Degree of
confinement
Partial 18.1% 1.00 498.0% 1.00
Fully 44.0% 3.83 1371.2% 2.75
Number of
layers
1 layer 11.5% 1.00 479.3% 1.00
2 layers 50.0% 4.35 1400.6% 2.92
Following the calculation in Table 4.28, the following comparisons could be drawn: Concrete
C8/10 was 5.42 times more affected than Concrete C16/20 in terms of axial capacity (542%)
but the effect was comparable in terms of ductility. Plain concrete specimens experienced a
higher effect in both axial capacity (114%) and ductility (145%) than reinforced concrete

123
specimens. Full confinement was more effective in both the axial capacity (383%) and ductility
(275%). Similarly, using two layers was more effective in both axial capacity (435%) and
ductility (292%) than one layer.
4.5 Failure of the Specimen Under Axial Loading
4.5.1 Theory of Failure
The use of different failure criterion is usually appropriate for different materials. For example,
the maximum principal stress/strain theory is appropriate for brittle materials like cast iron or
glass. On the other hand, the failure of ductile materials such as steel is best represented by the
Von-Mises criteria. The Mohr-Coulomb criterion would work well for material such as
concrete or soil. The CFRP wrap facilitated the concrete column to be subjected to a three-
dimensional state of stress and therefore affected the mode of failure and seemed to follow the
Mohr-Coulomb criterion of failure.
4.5.2 Modes of failure
All the columns failed by crushing as predicted by the calculations. The failure occurred slowly
with the development of vertical cracks before the column gave way. The failure of the columns
strengthened by CFRP was characterised by sudden and explosive fracture as the CFRP wrap
failed. The more the number of layers, the more explosive the failure. The concrete grade had
little effect on the type of failure mode. All specimens with similar rebar and CFRP
configuration but of different concrete grades exhibited similar failure modes. Damage on the
CFRP strengthening was typically localised at the corners.

124
Figure 4.38: Failure was characterised by rupture at the corners.
Stress-raisers are sharp corners, grooves, notches or acute changes of the section that cause
stress concentrations under typical loadings (Matthew, 1998). They can be found on both
rotating and static components. The stress concentration factors of sharp corners and grooves
are high and difficult to determine accurately. Components that have failed predominantly by
a fatigue mechanism are nearly always found to exhibit a crack initiation point – a sharp feature
at which the crack has started and then progressed to failure. It was expected that failure would
occur at this point due to stress concentrations (Rochette & Labossière, 2000). This informs
the decision to reduce stress raisers by use of rounding the edges and smoothening the surface
(Campbell, 2015). Engineers should strive to ensure that sharp edges are rounded before the
application of CFRP wrap.
Specimens with CFRP strengthening tended to have cracks develop later than columns without
CFRP wrap. Fewer cracks are attributed to the fact that the CFRP wrap held the concrete core
together, thus reducing the lateral expansion due to Poisson’s effect. This is an important
observation as visible cracks imply a serviceability limit state has been reached. In addition to
that, cracks reduce the effective cross-sectional area of a column. Limiting the development of
cracks, thus conserves the effective cross-sectional area.

125
The failure was mostly located at the centre as expected. The literature reviewed (BSI, 2019;
Neville & Brooks, 2010) showed that the centre of the specimen had the least effect of platen
restraint of the compression test machine. The platen restraint occurs when there is some lateral
compression caused by friction between the steel platen and the specimen being tested. This
has the effect of increasing the compression capacity of the material in contact with the steel
platen. Figure 4.39 shows typical failure patterns of the specimens tested.
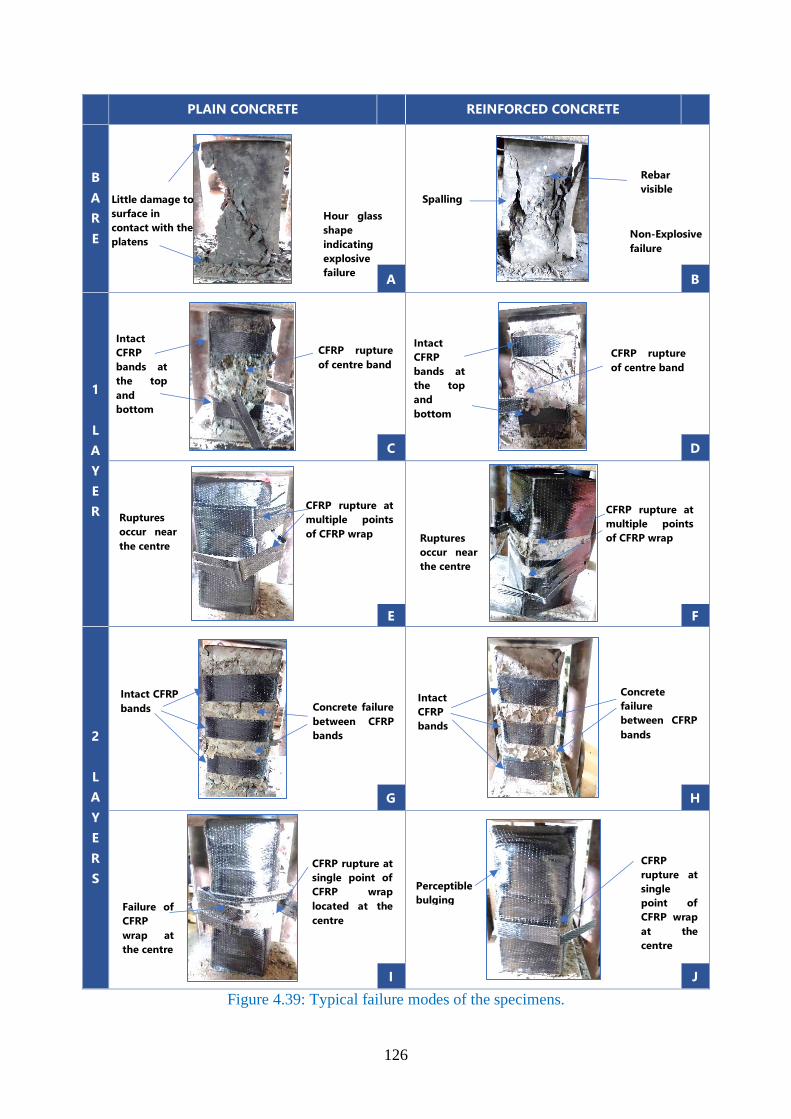
126
PLAIN CONCRETE REINFORCED CONCRETE
B
A
R
E
A B
1
L
A
Y
E
R
C D
E F
2
L
A
Y
E
R
S
G H
I J
Figure 4.39: Typical failure modes of the specimens.
Hour glass
shape
indicating
explosive
failure
Non-Explosive
failure
CFRP rupture
of centre band
Concrete failure
between CFRP
bands
CFRP
rupture at
single
point of
CFRP wrap
at the
centre
Rebar
visible
CFRP rupture
of centre band
CFRP rupture at
multiple points
of CFRP wrap
CFRP rupture at
multiple points
of CFRP wrap
Intact CFRP
bands
Concrete
failure
between CFRP
bands
Intact
CFRP
bands
CFRP rupture at
single point of
CFRP wrap
located at the
centre
Perceptible
bulging Failure of
CFRP
wrap at
the centre
Intact
CFRP
bands at
the top
and
bottom
Intact
CFRP
bands at
the top
and
bottom
Little damage to
surface in
contact with the
platens
Spalling
Ruptures
occur near
the centre Ruptures
occur near
the centre
127
Specimen A had no rebar and failure occurred immediately after visible cracks appeared on
the surface of the column. The failure of this specimen was explosive. It was characterised by
large chunks of concrete falling off the column core. There was little damage on the surface in
contact with the platens. This was because of the platen restrain (Neville & Brooks, 2010).
Specimen B had rebar, and thus as the failure occurred, the rebar retained the shape of the
column, unlike Specimen A where rebar was absent. The failure was non-explosive. The rebar
provided some confinement that prevented the column from crumbling. The failure of this
specimen was characterised by the concrete cover surrounding the rebar cage spalling off. The
effect of rebar on plain concrete is that failure occurs more gradually. This phenomenon is one
of the reasons nominal reinforcement is provided in all engineered concrete buildings
(McKenzie, 2013).
Specimen C with partial confinement and one layer of CFRP configuration. The failure
occurred as visible vertical cracks appeared between the bands followed by the sudden rupture
of the middle CFRP band. The vertical cracks indicate the failure of the concrete core once the
axial capacity of the concrete was reached. However, because the CFRP bands held the
concrete core in place, the column retained shape as the uniaxial load was increased until the
middle band gave way. The failure of the middle band is because that is the position that
experienced the largest lateral expansion, coupled with the least platen restraint (Neville &
Brooks, 2010). This finding is important in that engineers should inspect the centre of
retrofitted columns to ensure it is correctly installed since it is the most likely position where
failure occurs.
Specimen D had rebar and one layer of partial CFRP confinement. Effect of CFRP
strengthening on this sample was compared with Specimen B to determine the effect of the
CFRP. Failure was characterised by the sudden rupture of the middle CFRP bands. The cracks
visible between the bands where the concrete surface was still visible were smaller than in
128
Specimen C. The smaller cracks can be attributed to the steel reinforcement resisting the tensile
forces developing in the column as the columns expand laterally. This finding is crucial;
engineers should find out the existing rebar in columns when retrofitting columns with CFRP.
Specimen E had one layer of full CFRP confinement and no rebar. Failure was characterised
by rupture of the CFRP wrap. Failures occurred at multiple points along the wrap near the
centre of the column. The location of the failure is explained by the fact that the middle part of
the specimen experiences the least platen restraint hence most susceptible to failure (Neville &
Brooks, 2010).
Specimen F has one layer of full CFRP confinement and rebar. Failure was characterised by
large ruptures or tears of CFRP wrap similar to Specimen E or small ruptures at multiple points
on the corners of the specimens. Since Specimens E and F were entirely obscured by the CFRP
wrap, the development of cracks as the specimens were loaded to failure could not be observed.
The failure of the specimen at the corners was due to stress concentrations at the corners of the
samples (Campbell, 2015).
Specimen G had two layers of partial CFRP confinement with two layers and without rebar.
Failure was characterised by the failure of the concrete between the CFRP bands. Continuous
loading to achieve the failure of the CFRP bands was not possible as it was clear that the
concrete had already failed; chunks of concrete fell off from the space between the bands.
Reason being that the lateral expansion of the concrete between the bands was unconfined,
resulting in the development of tension in the concrete and the eventual failure of the specimen.
In addition to that, the weak grades of concrete: Concrete C8/10, Concrete C12/15 and
Concrete C16/20 used in this experimental programme was another reason the concrete gave
way before the CFRP. The CFRP bands remained intact unlike Specimens C and D; the
intactness of the bands is attributed to the additional layer of CFRP.
129
Specimen H was reinforced and had two layers of partial CFRP confinement. Failure
characterisation was similar to that of Specimen G. The CFRP bands remained intact after the
test. This was attributed to the additional layer of CFRP when compared with Specimens C and
D, where the CFRP bands failed. The concrete core developed cracks and failed. This failure
mode where the concrete between the bands falls off might be another disadvantage of using
partial CFRP confinement that had not been discussed in previous studies (Abadi et al., 2019;
Guo et al., 2018; Guo & Zeng, 2019; The Concrete Society, 2000). Engineers should leverage
this knowledge when retrofitting columns to ensure the serviceability limit is not exceeded.
Specimen I consisted of plain concrete with two layers of full CFRP confinement. Failure was
characterised by explosive rupture of the CFRP at a localised point, typically near the middle
region. The failure occurred at the middle because it experiences the least platen restraint
(Neville & Brooks, 2010). There was visible bulging of the specimen, indicating a
serviceability failure before the ultimate failure occurred. The bulging also indicates that the
concrete is no longer a continuous body; it has disintegrated, and it is only held by the CFRP
wrap.
Specimen J had steel reinforcement and two layers of full CFRP confinement. The failure
occurred explosively with a distinct pop sound. Comparison of failure with Specimen F that
had rebar and similar CFRP configuration apart from the number of layers was that failure was
localised at a point, unlike Specimen F that had ruptured at multiple points. The localised
failure occurred at the corners of the specimen and is attributed to the formation of a stress
raiser (Campbell, 2015). There was visible bulging similar to Specimen I indicating a
serviceability failure preceding the rupture of the CFRP wrap.

130
4.6 Summary of Hypothesis Testing
The research hypotheses were tested before further comparisons between the groups were
drawn in the preceding sections. The summary of the hypothesis tests for both the axial capacity
and ductility performed earlier are summarised in Table 4.29.
Table 4.29: Summary of decisions for the hypotheses tested.
Null Hypothesis Decision
There is no relationship between concrete grades and the
change in axial capacity and ductility of CFRP strengthened
columns.
𝐇𝟎: 𝝁𝑪𝟖/𝟏𝟎 = 𝝁𝑪𝟏𝟐/𝟏𝟓 = 𝝁𝑪𝟏𝟔/𝟐𝟎
Reject H0 for axial
capacity.
Failed to reject for
ductility.
There is no significant difference between CFRP strengthening
on plain and reinforced concrete in terms of axial capacity and
ductility of non-slender square columns.
𝐇𝟎: 𝝁𝒂𝒃𝒔𝒆𝒏𝒕 = 𝝁𝒑𝒓𝒆𝒔𝒆𝒏𝒕
Failed to reject H0 for
axial capacity.
Failed to reject H0 for
ductility.
There is no significant difference between partial CFRP
confinement and full CFRP confinement on axial capacity and
ductility of non-slender square concrete columns.
𝐇𝟎: 𝝁𝒃𝒂𝒓𝒆 = 𝝁𝒑𝒂𝒓𝒕𝒊𝒂𝒍 = 𝝁𝒇𝒖𝒍𝒍
Reject H0 for axial
capacity.
Reject H0 for ductility.
There is no significant difference between single layer CFRP
confinement and double layer CFRP confinement on axial
capacity and ductility of non-slender square concrete columns.
𝐇𝟎: 𝝁𝒏𝒐𝒏𝒆 = 𝝁𝒔𝒊𝒏𝒈𝒍𝒆 = 𝝁𝒅𝒐𝒖𝒃𝒍𝒆
Reject H0 for axial
capacity.
Reject H0 for ductility.
From the hypothesis tests and the experimental investigations, the study found:
1. There is an inverse relationship between concrete grades and the change in axial
capacity of CFRP strengthened columns.
2. There is no significant difference between CFRP strengthening on plain and reinforced
concrete in terms of axial capacity and ductility of non-slender square columns.
3. There is a significant difference between partial CFRP confinement and full CFRP
confinement on axial capacity and ductility of non-slender square concrete columns.

131
4. Additional layers of CFRP wrap have a direct relationship with the increment on axial
capacity and ductility of non-slender square concrete columns.
4.7 Findings of the Effect of Concrete Grade, Rebar, Degree of Confinement and
Number of Layers on Axial Capacity and Ductility
Concrete C16/20 experienced the least effect. Stronger concretes are brittle; hence they do not
dilate as much as weaker concretes. Less dilation contributes to less confinement pressure that
increases the axial capacity and ductility of the square concrete columns. The weaker the
concrete grade, the greater the lateral expansion of the concrete. This lateral expansion
increases the confinement pressure. The higher the confinement pressure, the higher the effect
of CFRP strengthening on axial capacity and ductility. The first research hypothesis that stated
that there is an inverse relationship between concrete grades and the change in axial capacity
and ductility of the columns strengthened by CFRP was accepted.
The effect of the different configurations of CFRP strengthening was approximately equal in
both plain concrete specimen and reinforced concrete specimens. Steel reinforcement adds to
the confining effects of the column by making the column more robust. It was found that the
presence of steel reinforcement contributes to an increase in axial capacity and ductility of
columns, especially in weaker concretes. However, steel reinforcement reduces the
effectiveness of CFRP strengthening. When reinforced concrete specimens were compared
with plain concrete specimens, the presence of steel reinforcement had a negative outcome on
the effect of CFRP strengthening on the axial capacity and ductility. The study attributes the
confining effect of rebar to the loss of CFRP effectiveness in increasing the axial capacity. In
terms of ductility, steel rebar increases the stiffness of columns, thus causing making the
columns less ductile than columns without rebar. The paradox in this is that steel increases the
axial capacity and ductility of columns, whereas steel negatively affects the performance of
CFRP in increasing the axial capacity and ductility of columns. The effect of the similar
132
configurations of CFRP strengthening was approximately equal in both plain concrete
specimen and reinforced concrete specimens hence the detrimental effect of steel rebar to
CFRP strengthening is not large. The second hypothesis that stated there is a significant
difference between CFRP strengthening on plain and reinforced concrete in terms of axial
capacity and ductility of non-slender square concrete columns failed to be accepted.
Partial CFRP confinement offers an increase in axial capacity and ductility, although not as
much as full CFRP confinement. Partial confinement and full confinement all offered increases
in both axial capacity and ductility. The implied claim by the manufacturer that partial
confinement is equivalent to full confinement has thus been disproved by the findings of this
study (Horse Construction, 2019). The third hypothesis that stated there is a significant
difference between partial CFRP confinement and full CFRP confinement on axial capacity
and ductility of non-slender square concrete columns was accepted.
The number of CFRP layers has the effect of increasing the change in axial capacity and
ductility of non-slender concrete columns. This phenomenon was consistent throughout the
study. This is due to the fact that an increase in the number of layers increases the amount of
confining properties of CFRP. More CFRP material can withstand the deformation of the
columns as the columns are loaded. The fourth hypothesis that stated, additional layers of
CFRP wrap have a direct relationship with the increment on axial capacity and ductility of non-
slender square concrete columns was accepted.
4.8 Material Efficiency of Partial CFRP Confinement
Based on observation of the treemaps in Figure 4.35 and Figure 4.37, the number of layers was
the extrinsic variable that had the greatest impact on both the axial capacity and ductility while
the degree of confinement was the extrinsic variable with the least impact. With this finding,
the need to compare single layer full confinement and double layer partial layer confinement
arose. The experimental design was thereby optimised in order to find more information from

133
the same number of tests already conducted (Poole & Poole, 2012). It was interesting to note
that when the same number of layers were used, partial CFRP confinement configuration used
in this experimental programme used 57.2% less material than full CFRP confinement. From
the summary of the experimental results, it has been shown that the number of layers has more
impact than the degree of confinement. With this realisation, the study compared the specimens
with two layers of partial CFRP confinement against specimens with one layer of full CFRP
confinement, as shown in Figure 4.40.
SINGLE LAYER FULL CONFINEMENT DOUBLE LAYER PARTIAL CONFINEMENT
B
Figure 4.40: Material saving of double confinement over single full confinement.
When two layers of partial CFRP confinement is compared with one layer of full CFRP
confinement, there is a material saving of about 14.3%. The axial capacity and ductility were
compared in Figure 4.41 and Figure 4.42 respectively.

134
Figure 4.41: Comparison of axial capacity gain between one layer of full CFRP confinement
and two layers of partial CFRP confinement.
Specimens with two layers of partial CFRP confinement had an average increase in axial
capacity of 24.5% while specimens with one layer of full CFRP confinement had an average
increase of 11.4%. This represents a 114.9% difference in effectiveness. The increase in
effectiveness is attributed to the fact that two layers of CFRP wrap could resist more lateral
deformation resulting in a higher axial capacity.
A similar comparison for ductility was performed and the results presented in Figure 4.42.
11.4
24.5
0.0
5.0
10.0
15.0
20.0
25.0
30.0
CFRP Configuration
Per
centa
ge
gai
n i
n a
xia
l ca
pac
ity (
%)
Comparison of axial capacity gain between CFRP
configurations
Single Full Double Partial

135
Figure 4.42: Comparison of ductility gain between one layer of full CFRP confinement and
two layers of partial CFRP confinement.
Single full CFRP confinement had a 637% increase in ductility on average while double partial
CFRP configuration had 674.3% increase in ductility. This represented a 5.8% change. This
finding is important as engineers know that it is more effective to use two layers of CFRP in
partial confinement than one layer of full confinement. With this argument, the claim by the
manufacturer, as shown in Figure 2.3, that partial confinement offers similar benefits to full
confinement can thus be said to have some basis (Horse Construction, 2019).
4.9 Contribution to Knowledge
The behaviour of composite confined concrete is difficult to predict because of the high number
of variables affecting confined concrete (Shehata et al., 2002). This study had found that there
was little research with regards to the concrete strength grades, presence of steel reinforcement
and the degree of confinement. This study has contributed to new findings that assist in
determining the relationship of four parameters that affect confined concrete.
The study has confirmed the effect of concrete grade on the performance of CFRP
strengthening. CFRP strengthening is very effective in weaker concrete grades both in axial
637.0
674.3
610.0
620.0
630.0
640.0
650.0
660.0
670.0
680.0
CFRP Configuration
Per
centa
ge
gai
n i
n d
uct
ilit
y (
%)
Comparison of ductility gain between CFRP configurations
Single Full Double Partial
136
capacity and ductility. However, the effectiveness of CFRP strengthening in terms of axial
capacity alone reduces with higher strength concrete grades. This study has found that even
when dealing with high strength concretes the gains in ductility are still very high. CFRP could
thus be used in seismic retrofitting even for stronger concrete grades since it is the ductility that
is necessary in the energy dissipation that occurs during a seismic event such as an earthquake.
The study does not recommend the use of CFRP wrap when dealing with high strength concrete
grades and where significant increases in axial capacity are required.
Previous research had established as a fact that CFRP thickness is correlated to the increase in
the effectiveness of CFRP strengthening (Guo et al., 2018; Parvin & Jamwal, 2004; Parvin &
Wang, 2001; Saafi et al., 1999; Shrive et al., 2003). The study has also found that of the four
variables investigated, the number of layers of CFRP has the highest impact on the strength
and ductility of the strengthened columns. The degree of confinement did not have such a high
impact on the performance of CFRP strengthening when compared with the number of layers.
Combining this new knowledge with known facts and thus using partial CFRP confinement
with two layers offers better material efficiency and economy as compared to full CFRP
confinement with one layer.
4.10 Challenges Experienced in the Study
Some of the challenges experienced in this investigation that could have affected the reliability
of the study are:
1. The hoop strain would be a better measure of ductility as it would have been more
accurate in determining the passive confinement pressure experienced by the column
being loaded. Unfortunately, the instrumentation necessary to measure hoop strain were
unavailable.
2. CFRP in this investigation was applied before the columns were loaded. However, if
CFRP strengthening were to be used to retrofit buildings, then the column would

137
already have been loaded and undergone some deformation before CFRP was installed.
Applying the CFRP to columns after this deformation has occurred results in less
confinement pressure generated on the CFRP and thus less effectiveness of the CFRP
strengthening as compared to this study (Arduini et al., 1999).
3. Human factors such as fatigue when manufacturing the specimen could have affected
the uniformity of the samples. For example, when wrapping the specimen with CFRP
bands, the orientation of the fibres may not be completely horizontal in some bands.
The skewed orientation of the fibres in some specimen might have affected the accuracy
of the results.
Figure 4.43: Specimen with correct
fibre orientation.
Figure 4.44: Specimen with skewed
fibre orientation.
4. It was impossible to monitor the development of cracks in the specimens with full
CFRP confinement since the CFRP wrap obscured the surface of the concrete.
5. Due to the large number of samples and the size of the specimens, the manufacture of
concrete had to be done in different batches and on different days. Quality assurance
and control measures utilised were: sourcing material from one location; using a riffle
sample divider to select coarse aggregate, and quartering to select the concrete. Even
though these quality control procedures were employed, it is assumed that some batches
had differences that affected the homogeneity of the different samples cast.
Horizontal fibre
orientation
Horizontal fibre
orientation
Horizontal fibre
orientation
Horizontal fibre
orientation
Horizontal fibre
orientation
138
6. The manual method of collecting data that relied on three individuals affected the
accuracy of the data since instruments such as linear variable differential transformers
would have made plotting the stress-strain graphs more accurate. This challenge was
solved by conducting test statistics to ensure the difference is not due to random
variation between the means of the groups. The level of significance 𝛼 was set at 0.05.
The precise data from this equipment would also facilitate generation of models that
predict the failure mechanisms.
4.11 Verification of the Experimental Methodology
To verify the results of this experimental programme, the stress-strain graphs obtained in this
study were compared with other stress-strain curves in literature. It was found that the graphs
of the curves of with full CFRP confinement were similar to other stress-strain curves in
literature reviewed (CEN, 2004). The results were also compared with the results of other
studies. The findings made in this investigation are consistent with similar studies (Guo et al.,
2018; Wang et al., 2019).
In addition to that, random samples were manufactured at a later date, tested, and the values
plotted on charts. The stress-strain graphs of the random specimens tested had a high similarity
with the initial specimens tested shown in Appendix G.
The data used in this study is reliable since the equipment used had been calibrated within a
year of doing the tests. Furthermore, the use of control samples improved the validity of this
experimental procedure as it was a comparative study. The failure modes of the specimens,
shown in Figure 4.39, indicate satisfactory failure as described in BS EN 12390-3:2019. This
phenomenon eliminates the existence of a probable fault in the testing equipment (BSI, 2019;
Neville & Brooks, 2010).
From the analysis and discussions; and with the experimental methodology verified, this
investigation drew several conclusions presented in the next chapter.

139
CHAPTER 5: CONCLUSIONS AND RECOMMENDATIONS
5.1 Conclusions
Ninety-five column samples with varying configurations were tested to failure, and it was
found that CFRP strengthening increased the axial capacity and ductility of non-slender square
concrete columns. Based on the experimental evidence, the findings of the effect of the
variables investigated on CFRP strengthened columns are as follows:
1. The grade of concrete has an inverse effect on CFRP strengthening in terms of axial
capacity and ductility.
2. Steel reinforcement decreases the effect of CFRP strengthening on the axial capacity
and ductility of non-slender concrete columns.
3. Partial CFRP confinement offers an increase in axial capacity and ductility, although to
a lesser extent than full CFRP confinement.
4. Additional number of layers increases the effect of CFRP strengthening on axial
capacity and ductility.
5.2 Recommendations
This study makes the following recommendations:
5.2.1 Recommendations from this study
1. The combined effect of rebar and CFRP on the axial capacity and ductility can be
approximated as the sum of the individual effect of rebar and the individual effect of
CFRP strengthening, as shown by Equation 5.1.
The combined effect of
rebar and CFRP
= (Individual effect of Rebar +
Individual effect of CFRP) Equation 5.1
2. Partial CFRP confinement has greater material efficiency than full CFRP confinement.
Using two layers of partial CFRP confinement is more effective than using one layer
140
of full CFRP confinement in terms of material and the gain in axial capacity and
ductility.
3. A design proposal is recommended in Appendix F.
5.2.2 Recommendations for further research
1. Further research should be performed to determine the effect of different widths of the
bands and at different spacings.
2. This study recommends that further studies should adopt the use of smaller specimens
to reduce the cost of the experimental programme.
3. Tests should be performed on multiple specimens, approximately 1000 specimen to
increase the accuracy of models developed.
4. A numerical analysis should be performed to determine the effect of CFRP accurately.
Using computers will minimise human factors that affect the performance of CFRP.
Such human factors include the incorrect placement of the orientation of the CFRP
fibres.

141
REFERENCES
Abadi, H. A., Paton-Cole, V., & Thai, H.-T. (2019). Axial strength and elastic stiffness
behaviour of partially confined concrete columns. Construction and Building
Materials, 196, 727–741. https://doi.org/10.1016/j.conbuildmat.2018.11.104
Adewole, K. K., Ajagbe, W. O., & Arasi, I. A. (2015). Determination of appropriate mix ratios
for concrete grades using Nigerian Portland-limestone grades 32.5 and 42.5. Leonardo
Electronic Journal of Practices and Technologies, 26, 79–88.
Arduini, M., Tommaso, A. D., Manfroni, O., Ferrari, S., & Romagnolo, M. (1999). The passive
confinement of elements compressed in concrete with sheets of composite material. The
Italian Cement Industry, 69(748), 836–841.
Associated Press. (2019, December 6). Building collapses in Kenya, unknown number trapped
in debris. South China Morning Post.
https://www.scmp.com/news/world/africa/article/3040999/six-floor-building-
collapses-nairobi-kenya-unknown-number-trapped
ASTM. (2017). ASTM D3039/D3039M17—Standard Test Method for Tensile Properties of
Polymer Matrix Composite Materials. ASTM International. www.astm.org
Bank, L. C. (2006). Application of FRP Composites to Bridges in the USA. International
Colloquium on Application of FRP to Bridges, 9–16.
https://www.researchgate.net/publication/234094998_Application_of_FRP_Composit
es_to_Bridges_in_the_USA
Bell, S. (2009). International Encyclopedia of Human Geography.
https://doi.org/10.1016/B978-008044910-4.00431-4
Brangard, B. (2018a, May 31). Z-Scores and Percentiles: Crash Course Statistics #18. Chad
& Stacey Emigholz Studio. https://www.youtube.com/watch?v=uAxyI_XfqXk

142
Brangard, B. (2018b, August 9). Test Statistics: CrashCourse #26. Chad & Stacey Emigholz
Studio. https://www.youtube.com/watch?v=QZ7kgmhdIwA
Brangard, B. (2018c, August 16). T-Tests: A Matched Pair Made in Heaven: Crash Course
Statistics #27. Chad & Stacey Emigholz Studio.
https://www.youtube.com/watch?v=AGh66ZPpOSQ&t=16s
Brangard, B. (2018d, October 11). ANOVA: Crash Course Statistics #33. Chad & Stacey
Emigholz Studio. https://www.youtube.com/watch?v=oOuu8IBd-yo
BSI. (2009). BS EN 12390-2:2009—Testing Hardened Concrete. British Standards Institute.
BSI. (2012). BS EN 12390-1:2012—Testing Hardened Concrete. Shape, dimensions and other
requirements for specimens and moulds. British Standards Institute.
BSI. (2019). BS EN 12390-3:2019 Testing hardened concrete Part 3: Compressive strength of
test specimens. British Standards Institute.
Campbell, J. (2015). Complete Casting Handbook—Metal Casting Processes, Metallurgy,
Techniques and Design (2nd ed.). Butterworth-Heinemann.
https://doi.org/10.1016/C2014-0-01548-1
CEN. (2004). EN 1992-1-1:2004—Eurocode 2: Design of concrete structures—Part 1-1:
General rules and rules for buildings. European Committee for Standardization.
CEN. (2012). EN 12504-2:2012—Testing Concrete in Structures Part 2: Non-destructive
tests—Determination of rebound number. British Standards Institute.
Daniel, T., & Kostic, B. (2019). Effect Size Calculator for T tests (Statistics for the Flipped
Classroom) [Excel Workbook]. Research by Design.
e=download&authuser=0&nonce=c7gpgealvvmca&user=12875081642630761836&h
ash=br3n7c5ie6pr3ubtq527kfq9lfoapfeb

143
Fekete, J. R., & Hall, J. N. (2017). Design of auto body: Materials perspective. In Automotive
Steels (pp. 1–18).
Grande, T. (2015, May 16). Selecting a Post Hoc Test after ANOVA in SPSS. YouTube.
Gulgunje, P. V., Newcomb, B. A., Gupta, K., Chae, H. G., Tsotsis, T. K., & Kumar, S. (2015).
Low-density and high-modulus carbon fibres from polyacrylonitrile with honeycomb
structure. Carbon, 95, 710–714.
Guo, Y.-C., Xiao, S.-H., Luo, J.-W., Ye, L.-Y., & Zeng, J.-J. (2018). Confined Concrete in
Fibre-Reinforced Polymer Partially Wrapped Square Columns: Axial Compressive
Behavior and Strain Distributions by a Particle Image Velocimetry Sensing Technique.
Sensors, 18(4118). https://doi.org/10.3390/s18124118
Guo, Y.-C., & Zeng, J.-J. (2019). Behavior of Partially and Fully FRP-Confined Circularized
Square Columns (CSCs) Under Axial Compression. In E. E. Gdoutos (Ed.),
Proceedings of the First International Conference on Theoretical, Applied and
Experimental Mechanics (Vol. 5, pp. 44–49). Springer, Cham.
https://doi.org/10.1007/978-3-319-91989-8_8
Horse Construction. (2019, December 23). Carbon Fibre Wrap for Concrete Columns
Strengthening. https://www.horseen.com/index/solution/content/id/498
Hou, Y., Cao, S., Ni, X., & Li, Y. (2019). Research on Concrete Columns Reinforced with
New Developed High-Strength Steel under Eccentric Loading. Materials, 12(2139), 1–
16. https://doi.org/doi:10.3390/ma12132139
IBM Corp. (2021). IBM SPSS Statistics for Windows (27.0) [Microsoft Windows]. IBM Corp.
https://mp.s81c.com/yp-cos-spss-
dal05/Subscription/20201106/SPSSStatisticsSub_Setup_x64.exe
144
Indiamart. (2020). Image of riffle sample divider. Indiamart.Com.
https://www.indiamart.com/proddetail/riffle-sample-divider-9927535830.html
IQSK. (2019). Building Construction Cost Handbook—2018/2019 (Handbook No.
2018/2019). Institute of Quantity Surveyors of Kenya.
Jaya, K. P., & Mathai, J. (2012). Strengthening of RC Column using GFRP and CFRP. 1 of 38.
http://toc.proceedings.com/24574webtoc.pdf
Jianxia, S. (2012). Comprehensive Renewable Energy. Elsevier.
Joel, M., & Mbapuun, I. D. (2016). Comparative Analysis of the Properties of Concrete
produced with Portland Limestone Cement (PLC) grade 32.5N and 42.5R for Use in
Rigid Pavement Work. Global Journal of Engineering Research V, 15, 17–25.
https://dx.doi.org/10.4314/gjer.v15i1.3
Juvinall, R. C., & Marshek, K. (2019). Fundamentals of machine component design (7th ed.).
https://www.wiley.com/en-
us/Fundamentals+of+Machine+Component+Design%2C+7th+Edition-p-
9781119475682
KEBS. (2017). KS EAS 18-1:2017—Cement-Part 1: Composition, specification and
conformity criteria for common cements. (25). Kenya Bureau of Standards.
Khaled, A. A., Muhammed, K. R., Mohammed, A. A.-O., & Al-Gadhib, A. A. H. (2018). Finite
Element Modelling of CFRP-Strengthened Low-Strength Concrete Short Columns.
International Congress on Polymers in Concrete, 729–734.
https://doi.org/10.1007/978-3-319-78175-4_93
Kibet, R. (2016, May 2). Kenya’s long history of housing disasters [News Article]. The New
Humanitarian. https://www.thenewhumanitarian.org/news/2016/05/02/kenya-s-long-
history-housing-disasters

145
Lilliston, D., & Jolly, C. K. (2000). An innovative form of reinforcement for concrete columns
using advanced composites. The Structural Engineer, 78, 20–29.
Masia, M. J., Gale, T. N., & Shrive, N. G. (2004). Size effects in axially loaded square-section
concrete prisms strengthened using carbon fibre reinforced polymer wrapping.
Matthew, C. (1998). Case Studies in Engineering Design (1st ed.). Butterworth-Heinemann.
McIntosh, A., & Pontius, J. (2017). Chapter 1—Tools and Skills. In Science and the Global
Environment—Case Studies Integrating Science Global Environment (pp. 1–112).
Elsevier. https://doi.org/10.1016/B978-0-12-801712-8.00001-9
McKenzie, W. M. C. (2013). Design of Structural Elements to Eurocodes (2nd ed.). Palgrave
Macmillan.
Microsoft Excel. (2019). Microsoft Office Excel (Version 2019) [Microsoft Windows 10].
Microsoft Corporation.
Mirmiran, A., & Shahawy, M. (1997). Behaviour of Concrete Columns Confined by Fibre
Composites. Journal of Structural Engineering, 123(5), 583–590.
https://doi.org/10.1061/(ASCE)0733-9445(1997)123:5(583)
Miyauchi, K., Nishibayashi, S., & Inoue, S. (1997). Estimation of Strengthening Effects with
Carbon Fiber Sheet for Concrete Column. 1, 217–224.
Mohammed, A. A., Manalo, A. C., Ferdous, W., Zhuge, Y., Vijay, P. V., & Alkinani, A. Q.
(2020). State-of-the-art of prefabricated FRP composite jackets for structural repair.
State-of-the-Art of Prefabricated FRP Composite Jackets for Structural Repair.
https://doi.org/10.1016/j.jestch.2020.02.006
146
Molugaram, K., & Rao, G. S. (2017). Chapter 4—Random Variables. In Statistical Techniques
for Transportation Engineering (pp. 113–279). Butterworth-Heinemann.
https://doi.org/10.1016/B978-0-12-811555-8.00004-0
Nanni, A., & Bradford, N. M. (1995). FRP jacketed concrete under uniaxial compression.
Construction and Building Materials, 0(2), 115–124. https://doi.org/10.1016/0950-
0618(95)00004-Y
NCA. (2015). Building Audit Report. National Construction Authority (NCA).
NCAPD. (2009). Migration, Urbanization and Environment in Kenya. National Coordinating
Agency for Population & Development. http://www.ncpd.go.ke/wp-
content/uploads/2016/11/Policy-Brief-4-Migration-Urbanization-and-Environment-in-
Kenya-1.pdf
Neville, A. M., & Brooks, J. J. (2010). Concrete Technology (2nd ed.). Pearson Education
Limited.
Obuya, V. M. (2012). Causes of Collapse of Buildings in Mombasa County: A case of
Mombasa Island, Kenya [Master’s Thesis, University of Nairobi].
http://erepository.uonbi.ac.ke:8080/xmlui/handle/123456789/6648
Okumu, V. A., Shitote, S. M., & Oyawa, W. O. (2017). Determination of Appropriate Mix
Proportions for the Kenyan Blended Portland Cement Concrete Production. American
Scientific Research Journal for Engineering, Technology, and Sciences, 31(1), 265–
286.
Omullo, C. (2018, March 22). City Hall plans to demolish over 200 ‘unsafe’ buildings. The
Daily Nation. https://www.nation.co.ke/counties/nairobi/Plans-to-demolish-unsafe-
buildings-Nairobi/1954174-4352714-9o66w3/index.html

147
Osofero, A. I. (2012). Behaviour and Design of Prestressed Stayed Steel Columns [Doctoral
Dissertation, Imperial College London].
https://www.researchgate.net/publication/265519524_Behaviour_and_Design_of_Pre
stressed_Stayed_Steel_Columns
Ozbakkaloglu, T. (2013). Compressive behavior of concrete-filled FRP tube columns
Assessment of critical column parameters. Engineering Structures, 51, 188–199.
http://dx.doi.org/10.1016/j.engstruct.2013.01.017
Par. (2010). Diagram of an isotropic linear elastic material with Poisson’s ratio of 0.5 subject
to axial forces along the x-axis only. In Poisson’s ratio.
https://commons.wikimedia.org/wiki/File:PoissonRatio.svg
Parvin, A., & Jamwal, A. S. (2004). Effects of wrap thickness and ply configuration on
composite-confined concrete cylinders. Composite Structures, 437–442.
https://doi.org/10.1016/j.compstruct.2004.02.002
Parvin, A., & Wang, W. (2001). Behaviour of FRP Jacketed Concrete Columns under Eccentric
Loading. Journal of Composites for Construction, 5(3), 146–152.
Patillo, P. D. (2018). Elements of Oil and Gas Well Tubular Design. Gulf Professional
Publishing.
Poole, C. F., & Poole, S. K. (2012). Theory of Extraction Techniques. In Comprehensive
Sampling and Sample Preparation—Analytical Techniques for Scientists (Vol. 2, pp.
273–297). Elsevier. https://doi.org/10.1016/B978-0-12-381373-2.00041-7
Porter, M. M. (2018). Multidimensional mechanics: Performance mapping of natural biological
systems using permutated radar charts. Plos One, 13(9).
https://doi.org/10.1371/journal.pone.0204309

148
Rahai, A. R., Sadeghian, P., & Ehsani, M. R. (2008). Experimental Behaviour of Concrete
Cylinders Confined with CFRP Composites. 14 WCEE, 14WCEE.
Republic of Kenya. (2014, September 14). Gazette Notice No. 13048. The Kenya Gazette,
3417–3418.
Richart, F. E., Brandtzæg, A., & Brown, R. L. (1928). A study of the failure of concrete under
combined compressive stresses (University of Illinois Bulletin) [Technical Report].
University of Illinois, Urbana, USA. http://hdl.handle.net/2142/4277
Rochette, P., & Labossière, P. (2000). Axial Testing of Rectangular Column Models confined
with Composites. Journal of Composites for Construction, 4(3), 129–136.
https://doi.org/10.1061/(ASCE)1090-0268(2000)4:3(129)
Saafi, M., Toutanji, H., & Li, Z. (1999). Behaviour of Concrete Columns Confined with Fibre
Reinforced Polymer Tubes. ACI Materials Journal, 96(4). https://doi.org/10.14359/652
Sayed, A., & Diab, H. (2019). Modeling of the Axial Load Capacity of RC Columns
Strengthened with Steel Jacketing under Preloading Based on FE Simulation.
Modelling and Simulation in Engineering, 2019. https://doi.org/10.1155/2019/8653247
Shehata, I. A. E. M., Carneiro, L. A. V., & Shehata, L. C. D. (2002). Strength of short concrete
columns confined with CFRP sheets. Materials and Structures, 35, 50–58.
https://doi.org/10.1007%2FBF02482090
Shrive, P. L., Azarnejad, A., Tadros, G., McWhinnie, C., & Shrive, N. G. (2003). Strengthening
of concrete columns with carbon fibre reinforced polymer wrap. Canadian Journal of
Civil Engineering, 30(3), 543–554. https://doi.org/10.1139/l03-007
Spoelstra, M. R., & Monti, G. (1999). FRP-Confined Concrete Model. Journal of Composites
for Construction, 3(3), 143–150. https://doi.org/10.1061/(ASCE)1090-
0268(1999)3:3(143)

149
The Concrete Society. (2000). Design guidance for strengthening concrete structures using
fibre composite materials (Technical Report No. 55). The Concrete Society.
The Constructor. (2019, December 31). Non-Destructive Tests on Concrete—Methods, Uses.
The Constructor - Civil Engineering Home. https://theconstructor.org/practical-
guide/non-destructive-testing-of-concrete/5553/
The Structural Engineer. (2013). Designing a concrete column [Technical Guidance Note -
Note 5 Level 2].
Toutanji, H. A., Han, M., & Matthys, S. (2007, July 16). Axial load behaviour of rectangular
concrete columns confined with FRP composites. FRPRCS-8: 8th International
Symposium on Fibre Reinforced Polymer Reinforcement for Reinforced Concrete
Structures, Patras, Greece. https://biblio.ugent.be/publication/425411/file/448689
Wang, X., Qi, Y., Sun, Y., Xie, Z., & Liu, W. (2019). Compressive Behaviour of Composite
Concrete Columns with Encased FRP Confined Concrete Cores. Sensors, 1792, 1–16.
https://doi.org/10.3390/s19081792
Wei, L., Ji-Hua, Z., Dong, Z., Liu, J., Su, M., & Xing, F. (2020). Anodic and Mechanical
Behavior of Carbon Fiber Reinforced Polymer as a Dual-Functional Material in
Chloride-Contaminated Concrete. Materials, 13(222).
https://doi.org/10.3390/ma13010222
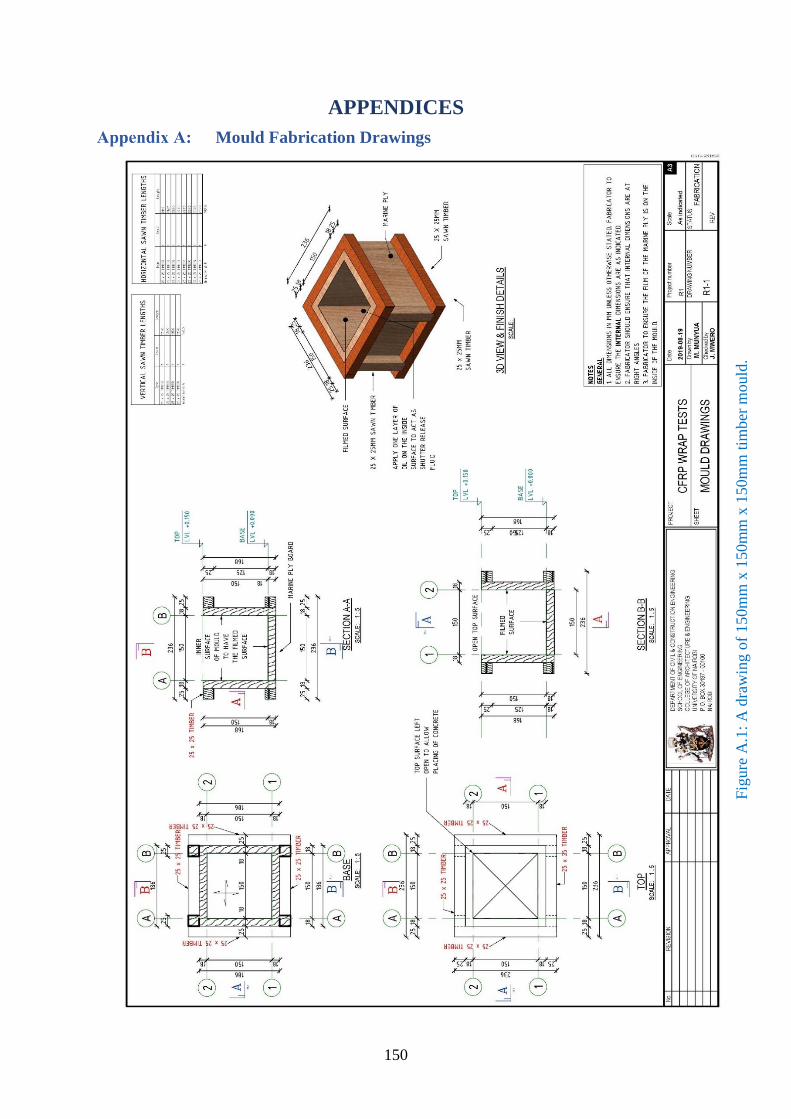
150
APPENDICES
Mould Fabrication Drawings
Fig
ure
A.1
: A
dra
win
g o
f 150m
m x
150m
m x
150m
m t
imber
mould
.
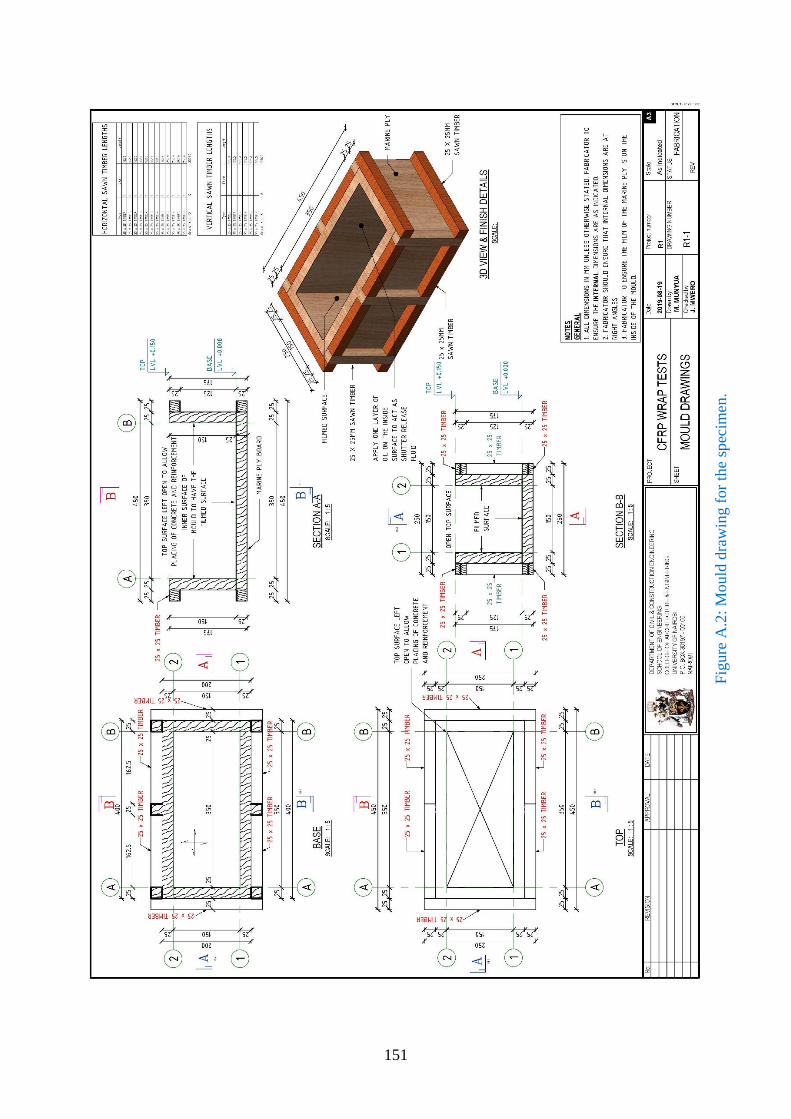
151
Fig
ure
A.2
: M
ould
dra
win
g f
or
the
spec
imen
.

152
Specimen Drawings and Quantities
Fig
ure
B.1
: D
raw
ings
for
spec
imen
spec
ific
atio
ns
– 1
lay
er.

153
Fig
ure
B.2
: D
raw
ings
for
spec
imen
spec
ific
atio
ns
- 2 l
ayer
s.

154
Axial Capacity Results
C.1 Failure Stresses of Samples
Table C.1: Recorded failure stresses of the samples.
Serial Failure stress
(MPa)
A.10.1 7.11
A.10.2 9.78
A.10.3 8.00
A.10.4 6.67
A.15.1 12.44
A.15.2 12.89
A.15.3 16.00
A.15.4 11.56
A.20.1 17.33
A.20.2 16.89
A.20.3 18.22
A.20.4 9.33
B.10.1 10.22
B.10.2 9.78
B.10.3 10.67
B.10.4 8.44
B.15.1 15.11
B.15.2 15.56
B.15.3 15.11
B.15.4 13.33
B.20.1 20.44
B.20.2 18.22
B.20.3 16.44
C.10.1 8.00
C.10.2 8.00
C.10.3 8.00
C.15.1 16.00
C.15.2 17.33
C.15.3 16.00
C.20.1 18.22
C.20.2 20.44
C.20.3 19.11
Serial Failure stress
(MPa)
D.10.1 9.33
D.10.2 10.67
D.10.3 10.22
D.15.1 16.00
D.15.2 20.89
D.15.3 19.11
D.20.1 17.33
D.20.2 19.56
D.20.3 20.89
E.10.1 9.33
E.10.2 8.89
E.10.3 8.89
E.15.1 15.56
E.15.2 13.33
E.15.3 15.11
E.20.1 18.22
E.20.2 18.67
E.20.3 21.33
F.10.1 9.33
F.10.2 10.67
F.10.3 10.67
F.15.1 17.33
F.15.2 17.78
F.15.3 20.89
F.20.1 20.44
F.20.2 21.78
F.20.3 20.44
G.10.1 13.33
G.10.2 18.22
G.10.3 8.89
G.15.1 15.56
G.15.2 13.78
Serial Failure stress
(MPa)
G.15.3 14.22
G.20.1 13.33
G.20.2 18.67
G.20.3 17.78
H.10.1 12.44
H.10.2 16.44
H.10.3 17.78
H.15.1 16.44
H.15.2 14.22
H.15.3 14.67
H.20.1 18.67
H.20.2 18.67
H.20.3 18.22
I.10.1 20.44
I.10.2 24.00
I.10.3 17.33
I.15.1 17.78
I.15.2 19.11
I.15.3 13.33
I.20.1 20.00
I.20.2 22.22
I.20.3 26.67
J.10.1 26.67
J.10.2 25.78
J.10.3 24.44
J.15.1 25.78
J.15.2 20.44
J .15.3 19.11
J.20.1 18.67
J.20.2 21.33
J.20.3 21.78

155
C.2 Average Failure Stresses
Table C.2: Average failure stresses of the specimen.
Failure Stress (MPa)
Specimen Rebar CFRP Layers C8/10 C12/15 C16/20
A. Unreinforced No wrap None 7.9 13.2 17.5
B. Reinforced No wrap None 9.8 14.8 18.4
C. Unreinforced Partially 1 layer 8.0 16.4 19.3
D. Reinforced Partially 1 layer 10.1 18.7 19.3
E. Unreinforced Fully 1 layer 9.0 14.7 19.4
F. Reinforced Fully 1 layer 10.2 18.7 20.9
G. Unreinforced Partially 2 layers 13.5 14.5 18.2
H. Reinforced Partially 2 layers 15.6 15.1 18.5
I. Unreinforced Fully 2 layers 20.6 18.4 23.0
J. Reinforced Fully 2 layers 25.6 21.8 20.6
C.3 Effect of concrete grade on axial capacity
Table C.3: Average percentage gain of axial capacity classified by concrete grade.
1 LAYER 2 LAYERS
Partial CFRP Full CFRP Partial CFRP Full CFRP
Rebar
Absent
Rebar
Present
Rebar
Absent
Rebar
Present
Rebar
Absent
Rebar
Present
Rebar
Absent
Rebar
Present
C8/10 1.4 3.0 14.6 4.5 70.9 59.1 161.0 162.1
C12/15 24.4 26.3 10.9 26.3 9.8 2.3 39.5 47.4
C16/20 10.2 4.8 11.0 13.7 4.2 0.8 31.4 12.1
C.4 Effect of rebar on axial capacity
Comparison with axial capacity of plain concrete and reinforced concrete.
Table C.4: Average percentage gain in axial capacity due to rebar.
Grade of concrete Percentage gain
C8/10 23.94
C12/15 11.28
C16/20 5.08

156
Table C.5: Average axial capacity gain classified by the presence of rebar.
1 LAYER 2 LAYERS
C8/10 C12/15 C16/20 C8/10 C12/15 C16/20
Partial
CFRP
Full
CFRP
Partial
CFRP
Full
CFRP
Partial
CFRP
Full
CFRP
Partial
CFRP
Full
CFRP
Partial
CFRP
Full
CFRP
Partial
CFRP
Full
CFRP
Change caused by rebar 25.93 13.11 13.51 27.27 0.00 7.63 15.38 24.46 4.08 18.07 1.63 -10.32
Change caused by CFRP on
plain specimen
1.41 14.55 24.37 10.92 10.17 19.49 70.89 161.03 9.80 39.50 4.24 31.36
Change caused by CFRP on
reinforced specimen
3.03 4.55 26.32 26.32 4.84 -0.81 59.09 162.12 2.26 47.37 0.81 12.10
Effect of CFRP and Rebar
compositely
27.70 29.58 41.18 41.18 10.17 19.49 97.18 224.88 14.29 64.71 5.93 17.80
C.5 Effect of partial and CFRP confinement on axial capacity
Table C.6: Average percentage gain in axial capacity classified by the degree of confinement.
1 LAYER 2 LAYERS
C8/10 C12/15 C16/20 C8/10 C12/15 C16/20
Rebar
absent
Rebar
present
Rebar
absent
Rebar
Present
Rebar
absent
Rebar
present
Rebar
absent
Rebar
present
Rebar
absent
Rebar
present
Rebar
absent
Rebar
present
Partial 1.4 3.0 24.4 26.3 10.2 4.8 70.9 59.1 9.8 2.3 4.2 0.8
Full 14.6 4.5 10.9 26.3 11.0 13.7 161.0 162.1 39.5 47.4 25.0 12.1
C.6 Effect of layers on axial capacity
Table C.7: Average percentage gain in axial capacity classified by number of layers.
C8/10 C12/15 C16/20
Partial CFRP Full CFRP Partial CFRP Full CFRP Partial CFRP Full CFRP
Rebar
absent
Rebar
present
Rebar
absent
Rebar
present
Rebar
absent
Rebar
present
Rebar
absent
Rebar
present
Rebar
absent
Rebar
present
Rebar
absent
Rebar
present
Single 1.4 3.0 14.6 4.5 24.4 26.3 10.9 13.7 10.2 4.8 11.0 13.7
Double 70.9 59.1 161.0 162.1 9.8 2.3 39.5 47.4 4.2 0.8 31.4 12.1

157
Ductility Results
D.1 Failure Strains of Samples
Table D.1: Recorded failure stresses of the samples.
Serial Failure
Strains
A.10.1 0.000362857
A.10.2 0.000943429
A.10.3 0.002322286
A.10.4 0.00254
A.15.1 0.001088571
A.15.2 0.007257143
A.15.3 0.002032
A.15.4 0.01016
A.20.1 0.004535714
A.20.2 0.003265714
A.20.3 0.002685143
A.20.4 0.002467429
B.10.1 0.009071429
B.10.2 0.002249714
B.10.3 0.004281714
B.10.4 0.013135429
B.15.1 0.001451429
B.15.2 0.003265714
B.15.3 0.002902857
B.15.4 0.003918857
B.20.1 0.006458857
B.20.2 0.001451429
B.20.3 0.002467429
C.10.1 0.018868571
C.10.2 0.024674286
C.10.3 0.008708571
C.15.1 0.013788571
C.15.2 0.007257143
C.15.3 0.007910286
C.20.1 0.006531429
C.20.2 0.002830286
C.20.3 0.029028571
Serial Failure
Strains
D.10.1 0.019594286
D.10.2 0.032657143
D.10.3 0.020029714
D.15.1 0.006531429
D.15.2 0.008708571
D.15.3 0.004354286
D.20.1 0.00508
D.20.2 0.01778
D.20.3 0.003628571
E.10.1 0.039188571
E.10.2 0.036285714
E.10.3 0.041365714
E.15.1 0.007257143
E.15.2 0.0254
E.15.3 0.003628571
E.20.1 0.006531429
E.20.2 0.056605714
E.20.3 0.006531429
F.10.1 0.079828571
F.10.2 0.019594286
F.10.3 0.039188571
F.15.1 0.007982857
F.15.2 0.00254
F.15.3 0.009434286
F.20.1 0.004354286
F.20.2 0.006894286
F.20.3 0.004354286
G.10.1 0.007257143
G.10.2 0.014514286
G.10.3 0.004354286
G.15.1 0.0254
G.15.2 0.015965714
Serial Failure
Strains
G.15.3 0.036285714
G.20.1 0.038462857
G.20.2 0.043542857
G.20.3 0.03048
H.10.1 0.014514286
H.10.2 0.02032
H.10.3 0.01016
H.15.1 0.034108571
H.15.2 0.029028571
H.15.3 0.024674286
H.20.1 0.042091429
H.20.2 0.043542857
H.20.3 0.038462857
I.10.1 0.0508
I.10.2 0.070394286
I.10.3 0.017417143
I.15.1 0.116114286
I.15.2 0.072571429
I.15.3 0.072571429
I.20.1 0.108857143
I.20.2 0.1016
I.20.3 0.108857143
J.10.1 0.073297143
J.10.2 0.079828571
J.10.3 0.044268571
J.15.1 0.087085714
J.15.2 0.094342857
J .15.3 0.03048
J.20.1 0.087085714
J.20.2 0.079828571
J.20.3 0.042526857

158
D.2 Average Ductility
Table D.2: Average ductility of the samples.
Ductility (%)
Specimen Rebar CFRP Layers C8/10 C12/15 C16/20
A. Unreinforced No wrap None 0.2 0.5 0.3
B. Reinforced No wrap None 0.7 0.3 0.3
C. Unreinforced Partially 1 layer 1.7 1.0 1.3
D. Reinforced Partially 1 layer 2.4 0.7 0.9
E. Unreinforced Fully 1 layer 3.9 1.2 2.3
F. Reinforced Fully 1 layer 4.6 0.7 0.5
G. Unreinforced Partially 2 layers 0.9 2.6 3.7
H. Reinforced Partially 2 layers 1.5 2.9 4.1
I. Unreinforced Fully 2 layers 4.6 8.7 10.6
J. Reinforced Fully 2 layers 6.6 7.1 7.0
D.3 Effect of concrete grade on ductility
Table D.3: Average percentage gain in ductility classified by concrete grade.
1 LAYER 2 LAYERS
Partial CFRP Full CFRP Partial CFRP Full CFRP
Rebar
Absent
Rebar
Present
Rebar
Absent
Rebar
Present
Rebar
Absent
Rebar
Present
Rebar
Absent
Rebar
Present
C8/10 1029.4 235.4 2425.5 543.1 464.7 108.8 2896.1 815.8
C12/15 88.0 126.4 135.6 130.6 404.1 914.7 1596.1 2348.6
C16/20 295.1 155.2 617.1 50.3 1057.8 1095.8 3186.6 1918.2
D.4 Effect of rebar on ductility
Comparison with the ductility of plain concrete and reinforced concrete.
Table D.4: Average percentage gain in ductility due to rebar.
Grade of concrete Percentage gain
C8/10 365.88
C12/15 234.59
C16/20 6.82

159
Table D.5: Average percentage gain in ductility classified by the presence of rebar.
1 LAYER 2 LAYERS
C8/10 C12/15 C16/20 C8/10 C12/15 C16/20
Partial
CFRP
Full
CFRP
Partial
CFRP
Full
CFRP
Partial
CFRP
Full
CFRP
Partial
CFRP
Full
CFRP
Partial
CFRP
Full
CFRP
Partial
CFRP
Full
CFRP
Change caused by rebar 38.33 18.63 -32.33 -45.00 -31.00 -77.60 72.22 42.41 13.08 -18.89 10.32 -34.41
Change caused by CFRP on
plain specimen
1029.41 2425.49 87.99 135.57 295.14 60.60 464.71 2896.08 404.12 1596.11 1057.80 3186.65
Change caused by CFRP on
reinforced specimen
235.35 543.10 126.42 130.61 155.24 983.92 108.75 815.82 914.68 2348.64 1095.80 1918.18
Effect of CFRP and Rebar
compositely
1462.35 2896.08 27.21 29.56 172.64 60.60 872.55 4166.67 470.08 1275.74 1177.31 2055.74
D.5 Effect of partial and full CFRP confinement on ductility
Table D.6: Average percentage gain in ductility classified by the degree of confinement.
1 LAYER 2 LAYERS
C8/10 C12/15 C16/20 C8/10 C12/15 C16/20
Rebar
absent
Rebar
present
Rebar
absent
Rebar
Present
Rebar
absent
Rebar
present
Rebar
absent
Rebar
present
Rebar
absent
Rebar
present
Rebar
absent
Rebar
present
Partial 1029.4 235.4 88.0 126.4 295.1 155.2 464.7 108.8 404.1 914.7 1057.8 1095.8
Full 2425.5 543.1 135.6 130.6 617.1 50.3 2896.1 815.8 1596.1 2348.6 2976.9 1918.2
D.6 Effect of layers on ductility
Table D.7: Average percentage gain in ductility classified by the number of layers.
C8/10 C12/15 C16/20
Partial CFRP Full CFRP Partial CFRP Full CFRP Partial CFRP Full CFRP
Rebar
absent
Rebar
present
Rebar
absent
Rebar
present
Rebar
absent
Rebar
present
Rebar
absent
Rebar
present
Rebar
absent
Rebar
present
Rebar
absent
Rebar
present
Single 1029.4 235.4 2425.5 543.1 88.0 126.4 135.6 50.3 295.1 155.2 617.1 50.3
Double 464.7 108.8 2896.1 815.8 404.1 914.7 1596.1 2348.6 1057.8 1095.8 3186.6 1918.2

160
Average Effect of the Variables Table E.1: Effect of the independent variables on axial capacity and ductility.
Independent variables Axial capacity Ductility
Grade of concrete C8/10 59.6% 1064.8%
C12/15 23.4% 718.0%
C16/20 11.0% 1047.0%
Steel Rebar Absent 33.1% 1136.6%
Present 29.0% 781.4%
Degree of confinement Partial 18.1% 498.0%
Fully 44.0% 1371.2%
Number of layers 1 layer 11.5% 479.3.6%
2 layers 50.0% 1400.6%
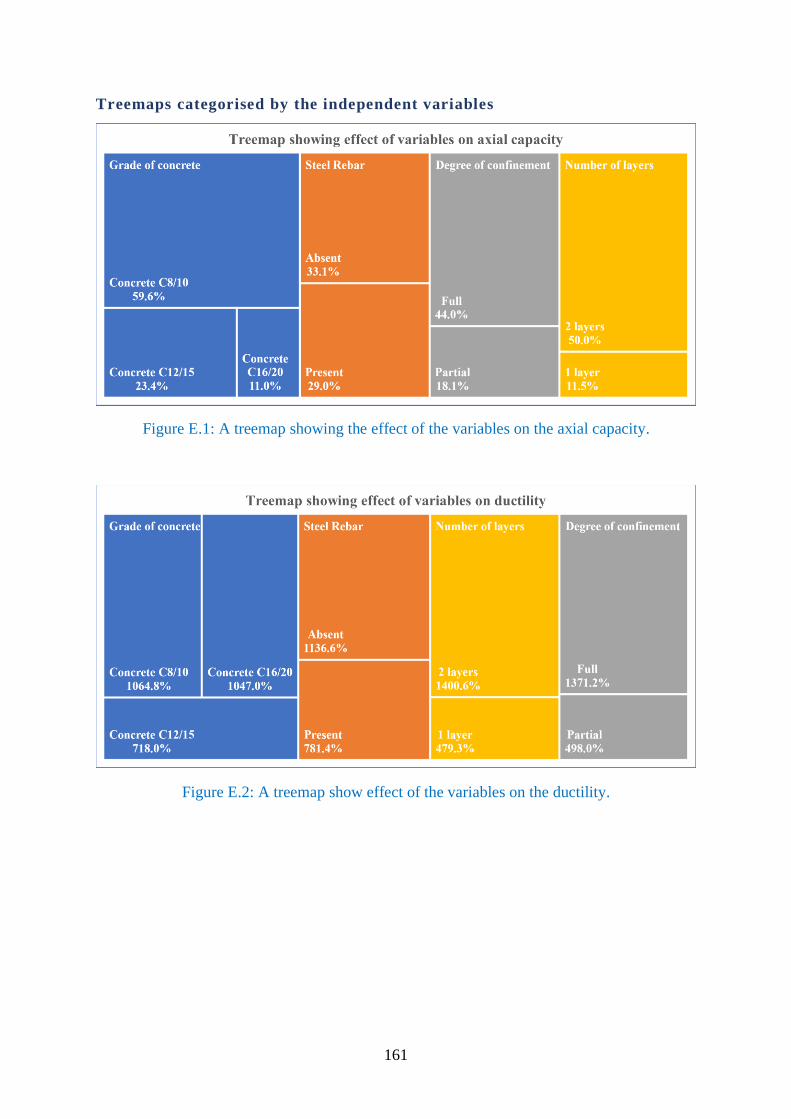
161
Treemaps categorised by the independent variables
Figure E.1: A treemap showing the effect of the variables on the axial capacity.
Figure E.2: A treemap show effect of the variables on the ductility.

162
Design Proposal Procedure 1. Determine the columns to be strengthened. Test the columns with a Schmidt Hammer.
The recommended procedure is per EN 12504-2:2012 (CEN, 2012). Other Non-destructive
tests may be used to determine the strength of the columns. The Rebound Values from the
Schmidt Hammer will be used in determining the strength of concrete.
2. Determine the tensile strength of the CFRP wrap as per the standard ASTM D3039 /
D3039M-17 (ASTM, 2017).
3. Find out the target strength as per the requirements of the design engineer.
4. Compare the actual strength against the target strength as a percentage.
5. Use the table to determine the number of layers required.
Table F.1: Recommended CFRP confinement required.
Percentage Change Number of Layers
<10% One layer partial confinement
10-30% One layer full confinement
30-50% Two layers partial confinement
>50% Two layers full confinement
After the determination of the percentage change required, the procedure to apply the CFRP
can follow the process outlined by the manufacturer (Horse Construction, 2019).
F.1 Surface preparation
The corners of the column should be rounded to a minimum radius of 25mm. Care should be
exercised to prevent exposing the steel reinforcement to the elements.
All rough edges and protrusions should be smoothened. Cavities should also be filled with
putty or any other structural filler materials such as epoxy fillers.
About 24hrs to the application, the column surfaces should be washed to get rid of dust and
other fine particles that can necessitate the need to use a higher amount of the epoxy. (Fine
particles have a high surface area to volume ratio.
F.2 Setting Out
The concrete surface should be left clean and kept dry.

163
F.3 Apply primer
Apply a primer adhesive onto the surface to aid bonding between the existing concrete and
putty that will smoothen the surface.
F.4 Levelling of the concrete
Putty should be applied for repairing and levelling if need be.
F.5 Fabric Cutting
The carbon fibre should be cut to the sizes as designed.
F.6 Preparing the impregnation adhesive.
Weigh and mix the adhesive according to ratio and stir until the colour mixture is even. Care
should be taken to avoid introducing air bubbles.
F.7 Applying Impregnation Adhesive
Apply impregnation adhesive when primer adhesive is touch dry.
F.8 Apply carbon fibre fabric
Apply carbon fibre fabric onto the concrete surface as designed. Levelling the surface from one
end to end
F.9 Removal of Air Bubbles
Apply impregnation carbon fibre adhesive again. Make sure the adhesive impregnates fully
into the fabric: the surface should be flat and with no air bubbles. The process should be
repeated when applying two or more layers.
F.10 Worker Safety
1. The construction workers should take protective measures such as wearing masks,
gloves and goggles, among other protective equipment.
2. Fire prevention procedures should be undertaken and maintain proper ventilation on
site.
3. Carbon fibres have electrical conductivity properties, and care should be taken when
handling electrical equipment with carbon fibre.

164
Stress-Strain Graphs
0
5
10
15
20
25
30
0 0.001 0.002 0.003 0.004 0.005 0.006 0.007 0.008
Str
ess
(MP
a)
Strain
Specimen A (Concrete C8/10)
A.10.1
A.10.2
A.10.3
A.10.4
0
5
10
15
20
25
30
0 0.002 0.004 0.006 0.008 0.01 0.012
Str
ess
(MP
a)
Strain
Specimen A (Concrete C12/15)
A.15.1
A.15.2
A.15.3
A.15.4
0
5
10
15
20
25
30
0 0.001 0.002 0.003 0.004 0.005 0.006 0.007 0.008
Str
ess
(MP
a)
Strain
Specimen A (Concrete C16/20)
A.20.1
A.20.2
A.20.3
A.20.4

165
0
5
10
15
20
25
30
0 0.002 0.004 0.006 0.008 0.01 0.012 0.014 0.016
Str
ess
(MP
a)
Strain
Specimen B (Concrete C8/10)
B.10.1
B.10.2
B.10.3
B.10.4
0
5
10
15
20
25
30
0 0.005 0.01 0.015 0.02 0.025 0.03 0.035 0.04
Str
ess
(MP
a)
Strain
Specimen B (Concrete C12/15)
B.15.1
B.15.2
B.15.3
B.15.4
0
5
10
15
20
25
30
0 0.002 0.004 0.006 0.008 0.01 0.012
Str
ess
(MP
a)
Strain
Specimen B (Concrete C16/20)
B.20.1
B.20.2
B.20.3

166
0
5
10
15
20
25
30
0 0.005 0.01 0.015 0.02 0.025 0.03 0.035
Str
ess
(MP
a)
Strain
Specimen C (Concrete C8/10)
C.10.1
C.10.2
C.10.3
0
5
10
15
20
25
30
0 0.005 0.01 0.015 0.02 0.025 0.03
Str
ess
(MP
a)
Strain
Specimen C (Concrete C12/15)
C.15.1
C.15.2
C.15.3
0
5
10
15
20
25
30
0 0.005 0.01 0.015 0.02 0.025 0.03 0.035
Str
ess
(MP
a)
Strain
Specimen C (Concrete C16/20)
C.20.1
C.20.2
C.20.3

167
0
5
10
15
20
25
30
0 0.005 0.01 0.015 0.02 0.025 0.03 0.035
Str
ess
(MP
a)
Strain
Specimen D (Concrete C8/10)
D.10.1
D.10.2
D.10.3
0
5
10
15
20
25
30
0 0.005 0.01 0.015 0.02 0.025 0.03 0.035
Str
ess
(MP
a)
Strain
Specimen D (Concrete C12/15)
D.15.1
D.15.2
D.15.3
0
5
10
15
20
25
30
0 0.005 0.01 0.015 0.02 0.025 0.03 0.035
Str
ess
(MP
a)
Strain
Specimen D (Concrete C16/20)
D.20.1
D.20.2
D.20.3

168
0
5
10
15
20
25
30
0 0.005 0.01 0.015 0.02 0.025 0.03 0.035 0.04 0.045 0.05
Str
ess
(MP
a)
Strain
Specimen E (Concrete C8/10)
E.10.1
E.10.2
E.10.3
0
5
10
15
20
25
30
0 0.005 0.01 0.015 0.02 0.025 0.03 0.035 0.04
Str
ess
(MP
a)
Strain
Specimen E (Concrete C12/15)
E.15.1
E.15.2
E.15.3
0
5
10
15
20
25
30
0 0.01 0.02 0.03 0.04 0.05 0.06
Str
ess
(MP
a)
Strain
Specimen E (Concrete C16/20)
E.20.1
E.20.2
E.20.3

169
0
5
10
15
20
25
30
0 0.01 0.02 0.03 0.04 0.05 0.06 0.07 0.08 0.09
Str
ess
(MP
a)
Strain
Specimen F (Concrete C8/10)
F.10.1
F.10.2
F.10.3
0
5
10
15
20
25
30
0 0.01 0.02 0.03 0.04 0.05 0.06 0.07 0.08 0.09
Str
ess
(MP
a)
Strain
Specimen F (Concrete C12/15)
F.15.1
F.15.2
F.15.3
0
5
10
15
20
25
30
0 0.005 0.01 0.015 0.02 0.025
Str
ess
(MP
a)
Strain
Specimen F (Concrete C16/20)
F.20.1
F.20.2
F.20.3

170
0
5
10
15
20
25
30
0 0.002 0.004 0.006 0.008 0.01 0.012 0.014 0.016 0.018 0.02
Str
ess
(MP
a)
Strain
Specimen G (Concrete C8/10)
G.10.1
G.10.2
G.10.3
0
5
10
15
20
25
30
0 0.005 0.01 0.015 0.02 0.025 0.03 0.035 0.04
Str
ess
(MP
a)
Strain
Specimen G (Concrete C12/15)
G.15.1
G.15.2
G.15.3
0
5
10
15
20
25
30
0 0.005 0.01 0.015 0.02 0.025 0.03 0.035 0.04 0.045 0.05
Str
ess
(MP
a)
Strain
Specimen G (Concrete C16/20)
G.20.1
G.20.2
G.20.3

171
0
5
10
15
20
25
30
0 0.005 0.01 0.015 0.02 0.025 0.03 0.035
Str
ess
(MP
a)
Strain
Specimen H (Concrete C8/10)
H.10.1
H.10.2
H.10.3
0
5
10
15
20
25
30
0 0.005 0.01 0.015 0.02 0.025 0.03 0.035 0.04 0.045 0.05
Str
ess
(MP
a)
Strain
Specimen H (Concrete C12/15)
H.15.1
H.15.2
H.15.3
0
5
10
15
20
25
30
0 0.005 0.01 0.015 0.02 0.025 0.03 0.035 0.04 0.045 0.05
Str
ess
(MP
a)
Strain
Specimen H (Concrete C16/20)
H.20.1
H.20.2
H.20.3

172
0
5
10
15
20
25
30
0 0.01 0.02 0.03 0.04 0.05 0.06 0.07 0.08
Str
ess
(MP
a)
Strain
Specimen I (Concrete C8/10)
I.10.1
I.10.2
I.10.3
0
5
10
15
20
25
30
0 0.02 0.04 0.06 0.08 0.1 0.12 0.14
Str
ess
(MP
a)
Strain
Specimen I (Concrete C12/15)
I.15.1
I.15.2
I.15.3
0
5
10
15
20
25
30
0 0.02 0.04 0.06 0.08 0.1 0.12
Str
ess
(MP
a)
Strain
Specimen I (Concrete C16/20)
I.20.1
I.20.2
I.20.3
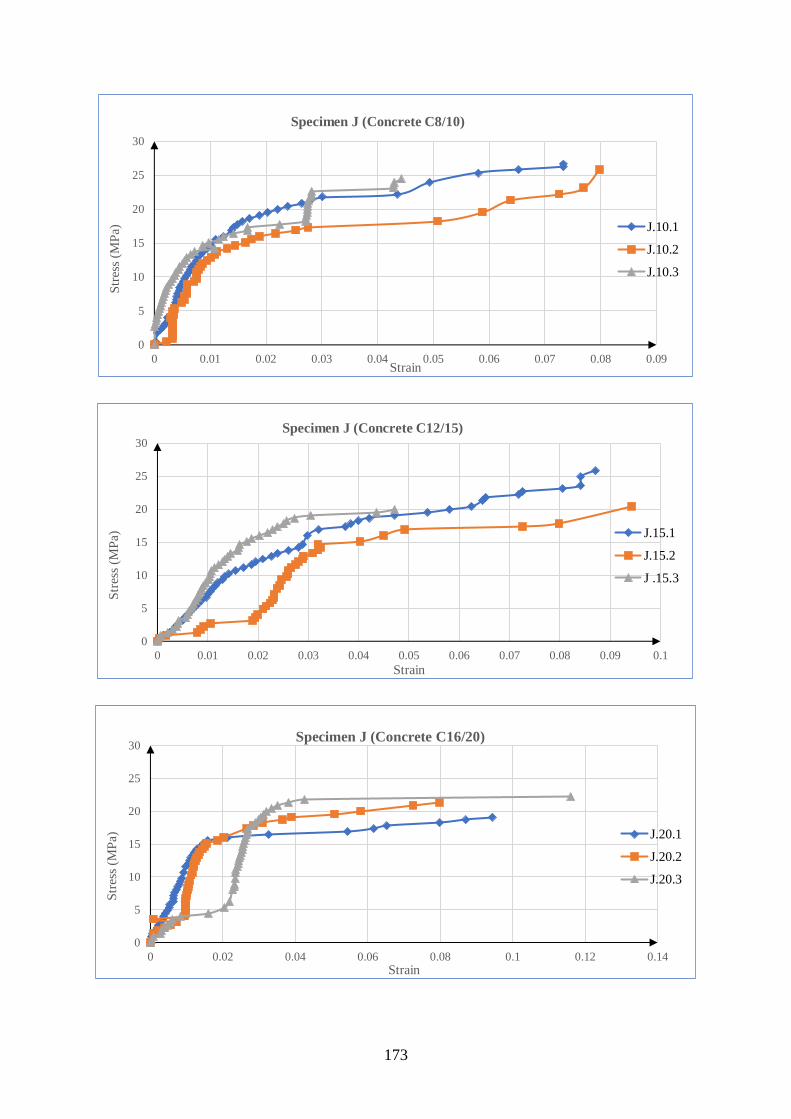
173
0
5
10
15
20
25
30
0 0.01 0.02 0.03 0.04 0.05 0.06 0.07 0.08 0.09
Str
ess
(MP
a)
Strain
Specimen J (Concrete C8/10)
J.10.1
J.10.2
J.10.3
0
5
10
15
20
25
30
0 0.01 0.02 0.03 0.04 0.05 0.06 0.07 0.08 0.09 0.1
Str
ess
(MP
a)
Strain
Specimen J (Concrete C12/15)
J.15.1
J.15.2
J .15.3
0
5
10
15
20
25
30
0 0.02 0.04 0.06 0.08 0.1 0.12 0.14
Str
ess
(MP
a)
Strain
Specimen J (Concrete C16/20)
J.20.1
J.20.2
J.20.3

174
Correspondence Details
Name: Muthomi M’Mbogori Munyua
Phone: +254 724 789 168
Postal Address:
Department of Civil & Construction Engineering
University of Nairobi
P.O. Box 30197 – 00100
Nairobi, Kenya.
Personal Email: [email protected]
Work email: [email protected]
ORCID: 0000-0002-5786-4032
Scan QR Code for ORCID Profile

175
INDEX
A
actuator, 63
ANOVA, xvii, 36, 37, 38, 66, 74, 88, 92,
99, 112, 113, 116
axial capacity, v, 3, 4, 6, 7, 8, 10, 11, 13,
24, 26, 27, 40, 45, 46, 48, 58, 59, 60, 69,
70, 71, 72, 73, 76, 77, 79, 80, 81, 82, 83,
84, 85, 90, 91, 93, 94, 95, 105, 120, 130,
131, 132, 139, 155, 156, 160, 161
B
Building Construction Handbook, 68
C
carbon fibre, 1, 11, 18, 19, 62, 163
cement, 10, 11, 53, 68, 69
CFRP, v, xvi, xvii, 1, 2, 3, 4, 5, 6, 7, 8, 9,
10, 11, 12, 13, 14, 15, 16, 17, 18, 19, 20,
21, 23, 24, 25, 26, 27, 28, 32, 33, 35, 40,
43, 44, 52, 53, 55, 56, 58, 59, 60, 61, 62,
63, 65, 67, 70, 71, 72, 73, 74, 76, 77, 78,
79, 80, 81, 82, 83, 84, 85, 87, 89, 90, 91,
94, 95, 96, 97, 98, 99, 102, 103, 104,
105, 106, 107, 108, 109, 110, 111, 112,
114, 115, 118, 119, 120, 122, 123, 124,
127, 128, 129, 130, 131, 132, 133, 136,
138, 139, 140, 155, 156, 158, 159, 162
CFRP wrap, v, 2, 7, 9, 12, 13, 23, 24, 25,
26, 27, 33, 40, 44, 52, 53, 55, 56, 58, 59,
60, 65, 77, 98, 107, 119, 123, 124, 128,
129, 131, 132, 162
columns, v, 1, 2, 3, 5, 6, 7, 8, 9, 10, 12, 13,
24, 25, 26, 27, 28, 32, 33, 35, 40, 41, 45,
46, 47, 48, 49, 50, 55, 58, 59, 60, 69, 71,
72, 73, 80, 81, 84, 90, 93, 98, 102, 104,
107, 108, 114, 119, 123, 124, 128, 130,
131, 132, 136, 139, 162
compression, v, 10, 11, 13, 14, 16, 19, 24,
41, 45, 46, 47, 48, 49, 63, 64
concrete, iv, v, xvii, 1, 2, 3, 6, 7, 8, 9, 10,
11, 12, 13, 14, 15, 16, 19, 20, 21, 22, 23,
24, 25, 26, 27, 32, 33, 35, 40, 41, 43, 44,
48, 51, 52, 53, 54, 55, 56, 58, 59, 60, 61,
65, 67, 68, 69, 71, 72, 73, 75, 76, 77, 79,
81, 82, 83, 84, 85, 90, 93, 94, 100, 102,
104, 105, 106, 107, 108, 109, 110, 119,
122, 127, 128, 129, 130, 131, 132, 135,
137, 139, 155, 158, 160, 162, 163
concrete grade, v, 40, 43, 53, 69, 75, 77,
81, 82, 101, 104, 106, 131, 155, 158
confinement, v, 5, 7, 8, 12, 13, 14, 16, 19,
20, 23, 25, 26, 28, 32, 35, 40, 43, 44, 52,
56, 58, 59, 60, 63, 65, 70, 71, 72, 73, 80,
81, 87, 89, 90, 91, 95, 106, 108, 112,
114, 115, 119, 122, 127, 128, 129, 130,
131, 132, 133, 136, 137, 138, 139, 156,
159, 160, 162
construction, 2, 4, 5, 43, 58, 163
D
degree of confinement, v, 133
design, v, xvii, 2, 4, 9, 10, 18, 19, 21, 22,
24, 32, 33, 44, 68, 69, 80, 140, 162
ductility, v, 6, 7, 8, 10, 12, 18, 25, 26, 27,
40, 45, 58, 59, 60, 69, 70, 96, 97, 98,
100, 101, 102, 104, 105, 106, 107, 108,
109, 110, 111, 115, 118, 121, 130, 131,
132, 136, 139, 158, 159, 160, 161
E
epoxy, 12, 55, 60, 61, 62, 162
Excel, iv, 67, 69, 78, 103, 119
F
failure, v, 1, 3, 5, 10, 11, 12, 14, 24, 32,
33, 34, 41, 45, 49, 50, 56, 61, 68, 69, 70,
72, 79, 123, 124, 125, 126, 127, 128,
129, 138, 155
friction, 33, 47, 125
full CFRP confinement, v, 7, 8, 44, 63, 72,
74, 89, 91, 115, 130, 132, 133, 139
J
Japan, 2, 18

176
K
Kenya, v, xvi, 2, 4, 22, 43, 63, 174
L
lateral compression, 47, 125
layer, 17, 40, 44, 58, 59, 60, 61, 81, 93, 95,
98, 106, 119, 122, 127, 128, 133, 152,
155, 158, 160, 162
limit states, 19
M
material efficiency, v, 139
moulds, iv, 51, 52
N
Nairobi, i, iv, 2, 3, 4, 48, 68, 174
Nigeria, 69
non-slender, v, 4, 6, 7, 8, 10, 12, 26, 35,
46, 47, 48, 49, 50, 73, 80, 84, 101, 119,
130, 131, 132, 139
number of layers, v, 10, 26, 40, 70, 81, 82,
93, 94, 118, 123, 132, 133, 139, 156,
159, 162
O
optimisation, 95
P
Partial, 12, 25, 35, 56, 58, 122, 132, 139,
155, 156, 158, 159, 160
partial CFRP confinement, 5, 44, 90, 114,
133
physical properties, 1, 69
platen, 33, 47, 52, 64, 125, 127, 128
Poisson, xvii, 13, 14, 15, 22, 40, 124
Post hoc, 38, 66, 75, 89, 92, 93, 99, 100,
113, 116, 117
R
radar, 70, 119, 120, 121
rebar, 12, 48, 56, 58, 59, 60, 70, 79, 80, 81,
84, 85, 98, 104, 105, 106, 110, 111, 127,
128, 139, 155, 156, 158, 159
reinforcement, v, 1, 10, 12, 13, 16, 17, 18,
20, 40, 43, 44, 49, 51, 58, 59, 60, 79, 84,
104, 105, 106, 129, 131, 139, 162
restraint, 33, 47, 52, 125, 127
S
safe, 2, 3
sample error, 74
slender, i, v, 3, 10, 12, 26, 46, 47, 49, 101
slenderness, 46, 48, 49
square, v, 4, 5, 6, 7, 8, 15, 26, 27, 28, 32,
58, 80, 90, 101, 119, 130, 131, 132, 139
stress concentrations, 5, 124, 128
stress-strain, v, 14, 19, 20, 22, 27, 35, 65,
67, 138
T
Test Statistics, 65
treemap, 119, 120, 121, 161
t-test, 36, 37, 38, 65, 66, 78, 103
U
United States of America, 2