Embed Size (px)
Citation preview

Accepted Manuscript
Strengthening of RC beams using bottom and side NSM reinforcement
Cristian Sabau, Cosmin Popescu, Gabriel Sas, Jacob W. Schmidt, ThomasBlanksvärd, Björn Täljsten
PII: S1359-8368(18)30587-0
DOI: 10.1016/j.compositesb.2018.05.011
Reference: JCOMB 5681
To appear in: Composites Part B
Received Date: 22 February 2018
Revised Date: 24 April 2018
Accepted Date: 9 May 2018
Please cite this article as: Sabau C, Popescu C, Sas G, Schmidt JW, Blanksvärd T, Täljsten Bjö,Strengthening of RC beams using bottom and side NSM reinforcement, Composites Part B (2018), doi:10.1016/j.compositesb.2018.05.011.
This is a PDF file of an unedited manuscript that has been accepted for publication. As a service toour customers we are providing this early version of the manuscript. The manuscript will undergocopyediting, typesetting, and review of the resulting proof before it is published in its final form. Pleasenote that during the production process errors may be discovered which could affect the content, and alllegal disclaimers that apply to the journal pertain.

MANUSCRIP
T
ACCEPTED
ACCEPTED MANUSCRIPT
1
Strengthening of RC beams using bottom and side NSM reinforcement 1
Cristian Sabaua,*; Cosmin Popescub; Gabriel Sasa; Jacob W. Schmidtc; Thomas Blanksvärda 2
and Björn Täljstena 3
* corresponding author: Cristian Sabau: [email protected] 4
a Luleå Univ. of Technology, Dept. of Civil, Environmental and Natural Resources 5
Engineering, SE-97187, Luleå, Sweden 6
b Northern Research Institute – NORUT, Rombaksveien E6-47, N-8517 Narvik, Norway 7
c Technical Univ. of Denmark, Dept. of Civil Engineering, Building 118, DK-2800 Kgs. 8
Lyngby, Denmark 9
Abstract 10
The allowable strain in fibre reinforced polymers reinforcement is limited by design codes to 11
avoid debonding. The near-surface mounted (NSM) reinforcement technique has been proven to 12
produce better anchorage behaviour compared to externally bonded reinforcement solutions. 13
However, NSM solutions do not always eliminate debonding issues, with concrete cover 14
detachment (CCD) typically occurring in RC beams strengthened for flexure. This experimental 15
study investigated the efficiency of side mounted (S) compared to bottom mounted (B) NSM bars 16
to prevent CCD. The experimental results were compared to models available in the literature that 17
predict the observed failure modes and the crack spacing in the NSM anchorage zone. Compared 18
to B-NSM, the S-NSM solution was successful in avoiding brittle CCD failure and showed 19
increased rotational capacity and energy dissipation at failure. Existing CCD debonding models 20
were found to be conservative. 21
22
Keywords: debonding; concrete cover detachment; crack spacing; non-contact optical 23
measurements; strain analysis; CFRP; NSM 24

MANUSCRIP
T
ACCEPTED
ACCEPTED MANUSCRIPT
2
1. Introduction 25
Repair and strengthening with fibre-reinforced polymers (FRPs) is a well-established 26
rehabilitation method in the construction industry, with numerous design guidelines available 27
worldwide (e.g. ACI 440.2R [1], CSA S806 [2], CNR-DT200R1 [3], Fib Bulletin 14 [4], [5]) and 28
others soon to be introduced, such as [6]. 29
Flexurally-designed reinforced concrete (RC) beams can fail because of yielding of the tension 30
reinforcement, concrete crushing, or shear flexure. Two of the most common flexural 31
strengthening methods are externally bonded reinforcement (EBR) and near-surface mounted 32
reinforcement (NSM). In both cases, the FRP reinforcement is bonded to the tension side of the 33
element. With the EBR technique, fabrics or laminates, are adhesively bonded directly to the 34
concrete surface whereas, with the NSM technique, FRP bars or lamella are inserted into grooves 35
cut in the element’s concrete cover. When RC members are strengthened with FRP, additional 36
failure modes are possible, namely: (a) concrete cover detachment (CCD), (b) end interfacial 37
debonding, or (c) intermediate crack debonding (ICD) [7]. Sudden debonding failure modes were 38
observed in experimental investigations when EBR strengthening was used [8, 9]. This 39
phenomenon usually happens before reaching the tensile strength of the fibres, thus hindering the 40
utilisation of the FRP to the maximum capacity. 41
The NSM technique was, to the authors’ knowledge, first applied in the mid 90-ties for 42
strengthening of a RC cable stayed bridge in Uddevalla, Sweden. Considerable research on NSM 43
strengthening solutions [8-19] has since been carried out. Compared to EBR, the NSM technique 44
provides increased interfacial stress capacity [8-10], due to a larger bond surface and confinement 45
provided by the surrounding concrete [9, 19]. Although the FRP utilisation is increased, 46
debonding failure modes are not avoided. 47
Current design codes provide special requirements regarding CCD. For example, ACI 440.2R 48
[1] specifies that transversal anchors should be provided at the FRP bar cut-off section if the shear 49
force in the section is more than 67% of the shear strength of the concrete section. Similarly, 50
MANUSCRIP
T
ACCEPTED
ACCEPTED MANUSCRIPT
3
CNR-DT200R1 [3] recommends the use of anchorage devices such as FRP U-wraps [20] or NSM 51
strips [21]. However, for use in practice, the performance of such solutions needs to be 52
determined experimentally. 53
In bottom mounted NSM (B-NSM) strengthened beams, CCD is likely to occur if the NSM is 54
terminated at a distance (∆l) from the support. For example, CCD was reported for relatively large 55
cut-off lengths (∆l=200mm) [11, 13] but also for small cut-off lengths (∆l=50 mm) [12]. 56
To the authors’ knowledge, only one study was carried out on RC beams strengthened with 57
side mounted NSM (S-NSM), reported in Hosen et al. [22] and Shukri et al. [23], and showed that 58
the S-NSM technique is effective for strengthening RC beams in flexure, in terms of serviceability 59
and ultimate load. The beams were strengthened with steel and carbon FRP (CFRP) rods of 8, 10, 60
and 12 mm diameter. The S-NSM technique produced a significant increase in flexural capacity 61
and cracking load with respect to the reference beams. However, beams strengthened with 12 mm 62
diameter steel and CFRP bars failed due to concrete cover detachment. Shukri et al. [23] further 63
investigated the influence of existing cracks on the performance of CFRP strengthened beams. It 64
was found that pre-cracking slightly decreased the beams’ ultimate strength and increased beams’ 65
rigidity, however, failure modes remained unchanged. 66
Often, access to the soffit of RC beams in need of strengthening is limited. Examples of such 67
cases are: a) beams part of a road crossing bridge; b) beams part of a building’s structure directly 68
above industrial equipment; and c) beams or spandrels created by cutout openings in RC walls. In 69
such cases, when: a) the road is to remain open; b) the industrial equipment is to remain 70
operational; and c) strengthening of the beam is desired before cutting out the opening; the [more 71
usual] B-NSM technique becomes problematic to apply and the S-NSM technique could be used 72
in instead. 73
Despite the above-mentioned advantages of S-NSM over B-NSM, the efficiency of S-NSM 74
can be limited by the shorter lever arm in comparison to the B-NSM technique and the limited 75
amount of additional reinforcement that can be provided to the sides of the beams. However, 76

MANUSCRIP
T
ACCEPTED
ACCEPTED MANUSCRIPT
4
currently no direct comparison has been reported within the available literature. Moreover, the 77
bond behaviour of S-NSM strengthen RC beams is largely unexplored, and, as suggested in 78
Shukri et al. [23], investigations are required to evaluate the effect the bonded length on the 79
effectiveness of the S-NSM technique. 80
The experimental study, presented in this paper, investigated the efficiency of the S-NSM 81
technique compared to B-NSM, with varied bonded lengths, in terms of ultimate capacity, crack 82
distribution, stiffness, and failure modes. In this study, a 3D optical deformation measurement 83
system Aramis 5M [24], that utilises the digital image correlation (DIC) technique, was used to 84
measure deformations and identify cracks in the NSM anchorage area. The experimentally 85
obtained crack spacing was compared to predictions using existing analytical formulas, and was 86
used to evaluate the performance of existing debonding models. 87
2. Experimental programme 88
The experimental programme consisted of seven RC beams, each with a length of 4000 mm 89
and a 200 × 300 mm rectangular cross section (Fig. 1). One beam was tested as a reference 90
specimen; the other six beams were strengthened using different FRP configurations. The 91
longitudinal reinforcement consisted of two 16 mm diameter deformed steel bars, which were 92
placed at both the top and bottom part of the cross section, see Fig. 1. Shear reinforcement 93
consisted of steel stirrups made of deformed steel bars with a nominal diameter of 10 mm, 94
uniformly spaced at 75 mm. 95
The primary test variable was the placement of NSM (S-NSM vs B-NSM). In all cases, two 96
CFRP bars were used to strengthen the specimens. To produce a CCD, the CFRP bars ended at a 97
distance ∆l from the beam’s support. 98
B-NSM beams are denoted B300, B250 and B200 which corresponds to cut-off lengths (∆l) 99
300, 250 and 200 mm, respectively. S-NSM beams are denoted S300, S250 and S200 which 100
corresponds to values of ∆l 300, 250 and 200 mm, respectively. ∆l was varied only at one end, 101
north (see Fig. 1), to facilitate CCD failure only in one end, thus making it possible to monitor the 102

MANUSCRIP
T
ACCEPTED
ACCEPTED MANUSCRIPT
5
area expected to fail. At the other end of the beam, the CFRP bars were extended over the support 103
up to the beam’s end. 104
The NSM groove size was 1.5 times the bar’s size, as per ACI 440.2R [1]. For B-NSM 105
strengthened beams, the distance between grooves (i.e. 80 mm) was larger than twice the depth of 106
the groove (i.e. 30 mm). The clear edge distance was 15 mm for all strengthened beams, which 107
was smaller than recommended by ACI 440.2R [1]. However, this was chosen to minimise the 108
difference in effective depth between the B-NSM and S-NSM strengthened beams. 109
2.1 Material properties 110
The concrete compressive strength was determined from six cubes with standard sizes 111
according to the procedure described in [25]. The average cube compressive strength (f’ c) was 112
62.6 MPa equivalent to 50 MPa concrete cylinder compression strength (fc), according to EC 2 113
[6]. The average yielding strength (fy) and yielding strain (εy) of the longitudinal reinforcement 114
were 578 MPa, and 2.79‰, respectively, determined according to SS-EN ISO 6892-1 [26]. 115
Rectangular (10 x 10 mm) CFRP bars (StoFRP Bar IM 10 C) and epoxy-based adhesive 116
(StoPox SK 41) were used. The CFRP bars had 3300 MPa nominal tensile strength and 210 GPa 117
modulus of elasticity. The adhesive had 12 MPa shear strength and 2GPa modulus of elasticity. 118
CFRP and adhesive material properties were taken according to the manufacturer’s specifications. 119
2.2 Test set-up and instrumentation 120
The beams were loaded in a four-point bending set-up (see Fig. 1) with a span L0 of 3600 mm, 121
using displacement control at a loading rate of 0.6 mm/min up to failure. Load (P), midspan 122
deflection (δ), steel strain (εs), and CFRP strain (εf) were measured during the loading. Two 123
displacement transducers were used to monitor δ, one at each lateral side of the beam. The strains 124
in the flexural steel and CFRP reinforcement were recorded with strain gauges placed at the 125
midspan, one on each reinforcement bar. 126
DIC was used to measure full field deformations and identify cracks in the anchorage zone on 127
the north side of the beam. DIC is a technique that uses digital camera images to measure shape 128

MANUSCRIP
T
ACCEPTED
ACCEPTED MANUSCRIPT
6
and displacement, and requires a contrast pattern to be able to determine the displacement of 129
subsets of the analysed images from the initial undeformed stage to the subsequent deformed 130
stages [27]. The images were acquired with two cameras having 2448 x 2050 pixel resolution and 131
equipped with 12 mm focal length lenses. 132
The positioning of the two cameras relative to the measured surface and to each other is shown 133
in Fig. 2. The cameras were mounted on a rigid crossbar at a 25° angle and spaced 600 mm apart. 134
The crossbar was placed on a tripod positioned one metre from the measured surface. For the S-135
NSM beams, the cameras were placed next to the beam, perpendicular to the monitored area while 136
for B-NSM beams, the cameras were placed below the level of the soffit of the tested beams. 137
They were not placed directly under the beam, to avoid damage when the beam failed. This 138
resulted in a 60° angle between the direction of the cameras and the measured surface. Images 139
were acquired at a rate of one a second, and the applied load was recorded for each set of images. 140
3. Test results 141
The overall behaviour of the tested specimens was measured in terms of load-deflection 142
response, failure mode, steel and CFRP reinforcement response, and bending stiffness. In 143
addition, CCD of the NSM was investigated through a strain analysis by means of DIC 144
measurements. Table 1 shows a summary of the test results for all specimens. 145
To compare the performance of B-NSM and S-NSM strengthening, the following load levels 146
were identified from experimental tests and are shown in Table 1: (1) first crack Pcr, (2) steel 147
yielding load, Py, and (3) ultimate load, Pu, for which the corresponding deflection, δu and 148
maximum strain in the CFRP bars, εfu, are indicated. It should be noted that Pcr was determined 149
based on slope changes in the P-δ responses and Py was determined based on strain gauge 150
measurements. Table 1 also shows the energy dissipation at failure, Ed, computed as the area 151
under the P-δ graph for each beam, and the bending stiffness of the beam before the yielding of 152
the steel reinforcement K, computed as the slope of the P-δ curve between the cracking (Pcr) and 153
yielding (Py) loads, respectively. 154

MANUSCRIP
T
ACCEPTED
ACCEPTED MANUSCRIPT
7
3.1 Reference beam 155
A typical trilinear response was observed for the reference beam from which the concrete 156
cracking, and steel yielding points could be identified (see Fig. 3). The beam failed by yielding of 157
the bottom steel reinforcement followed by concrete crushing of the top of the cross section. 158
3.2 Beams strengthened with B-NSM 159
Compared to the reference beam, the B-NSM strengthened beams exhibited a significant 160
increase in the yielding load (117 – 128% increase) and ultimate load (122 – 136% increase), see 161
Table 1. Fig. 3 shows the P-δ response of B-NSM strengthened beams compared to the reference 162
beam. Up to Pcr, the stiffness of B-NSM strengthened beams was identical to that of the reference. 163
Between Pcr and Py, the stiffness of the strengthened beams was 65 – 76% higher. After Py, the P-164
δ became nonlinear, with the bending stiffness slowly decreasing up to failure (Fig. 3). 165
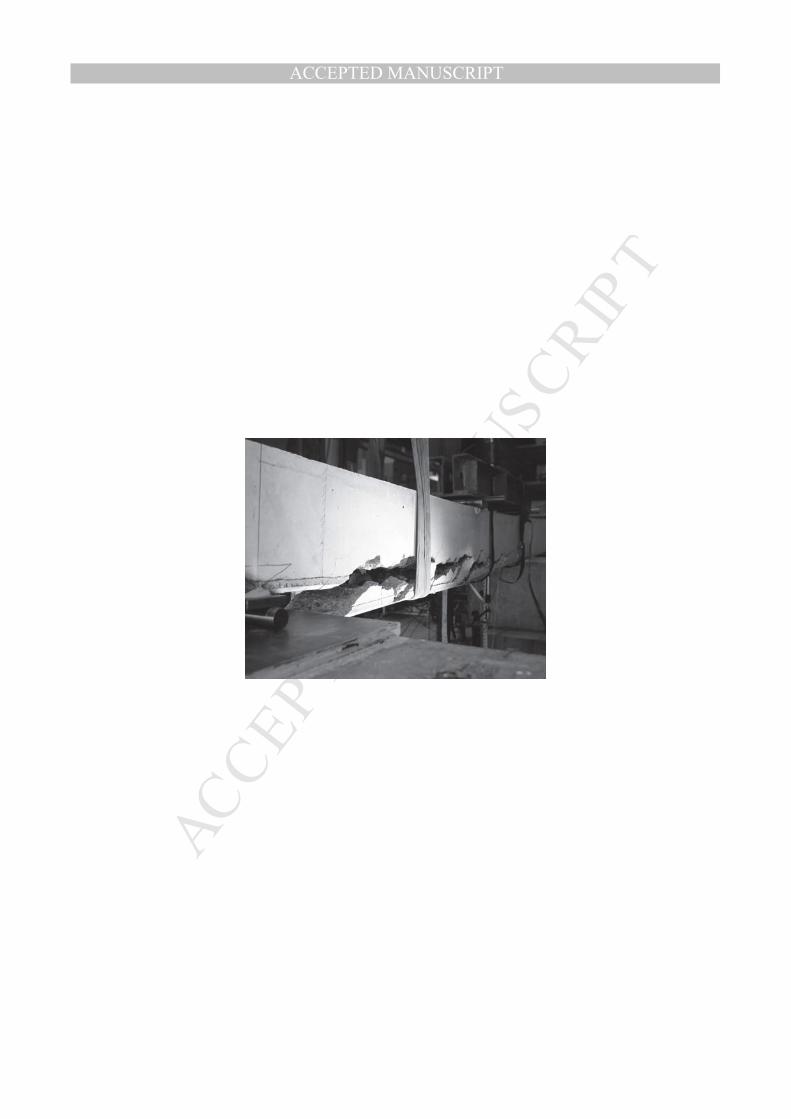
Thinner flexural cracks were observed compared to the reference beam. However, due to stress 166
concentrations, inclined cracks appeared from the NSM cut-off point. The cracks continued to 167
open until the concrete cover was detached together with the CFRP bars (see Fig. 4). Failure 168
occurred by CCD at the level of the steel reinforcement starting from the CFRP bars’ cut-off 169
point, on the northern side, see Fig. 4. The observation was identical for all B-NSM beams, 170
regardless of their cut-off length. A slight increase in the maximum load was observed with a 171
decrease of ∆l (see Table 1). The energy dissipation at failure was 41 – 73% higher than that of 172
the reference beam. The maximum strain in the CFRP bars was between 45% and 47% of εfu. 173
3.3 Beams strengthened with S-NSM 174
Compared to the reference beam, S-NSM strengthened beams exhibited a significant increase 175
in the yielding load (83 – 98% increase) and ultimate load (122 – 127% increase), see Table 1. 176
Fig. 5 shows the load-deflection (P-δ) response of S-NSM beams compared to the reference 177
beam. The cracking load, Pcr, of specimen S300 was not recorded. Due to a malfunction in the 178
data acquisition system, the test was stopped at a load level of 85 kN. The beam was then 179
unloaded and reloaded, thus the initial part of the response differs to the other strengthened 180

MANUSCRIP
T
ACCEPTED
ACCEPTED MANUSCRIPT
8
beams. Up to Pcr, the stiffness of S-NSM strengthened beams was identical to that of the 181
reference. Between Pcr and Py, the stiffness of the strengthened beams was 46 – 76% higher. After 182
Py, the bending stiffness decreased up to failure. Failure occurred due to concrete crushing at the 183
top side of the beam, close to the south load application point (as shown in Fig. 6). ICD of the 184
CFRP bars occurred only after the maximum load was reached, while the compressed concrete 185
was still crushing. This debonding started at a flexural-shear crack with approximately 45° 186
inclination. The debonding process ended when the CFRP slipped within the concrete groove (see 187
Fig. 6). This behaviour was identical for all S-NSM strengthened beams. The maximum strain in 188
the CFRP bars was between 51% and 54% of their εfu, as shown in Table 1. 189
4. Performance comparison between B-NSM and S-NSM 190
4.1 Loads and failure mode 191
Fig. 7 shows the comparison of the load-deflection response of B-NSM and S-NSM 192
strengthened beams having the same ∆l. In general, compared to S-NSM beams, B-NSM beams 193
showed higher cracking loads (13%), bending stiffness (14%) and yielding loads (23%). These 194
differences are due to the location of the CFRP bars, specifically the larger effective depth for B-195
NSM beams compared to S-NSM beams. 196
B-NSM strengthened beams exhibited a brittle CCD at the north anchorage side, whereas the 197
S-NSM strengthened beams showed a more ductile failure by concrete crushing followed by ICD 198
at the south end of the beam. The reason S-NSM beams did not fail by CCD at the north 199
anchorage side can be attributed to the location of the CFRP bars relative to the flexural steel 200
reinforcement (see Fig. 8). The concrete between the steel reinforcement and the NSM is 201
subjected to tensile and shear stresses induced by the force transferred from the NSM to the end 202
anchorage zone (Ff) [28]. Tensile stresses result from the moment �� = �� ∙ ��, see Fig. 8. The 203
distance lc is defined as the distance between the NSM and the possible failure plane. For B-NSM, 204
the failure plane is located at the lower level of the flexural steel reinforcement, whereas for S-205
NSM, a possible failure plane is located above the level of the internal reinforcement (see Fig. 8); 206
MANUSCRIP
T
ACCEPTED
ACCEPTED MANUSCRIPT
9
this aspect is further discussed in Section 4.2.3 End anchorage crack pattern. For B-NSM, lc 207
promotes CCD, whereas for S-NSM, lc leads to considerably lower tensile stresses. This would 208
suggest that CCD is not likely to occur in S-NSM strengthened beams. However, the experiments 209
reported in [22, 23] prove the opposite. 210
While similar ultimate loads were obtained for B-NSM and S-NSM strengthened beams with 211
the same ∆l, the deflection at failure was 31 – 46% higher for S-NSM strengthened beams. 212
Comparing energy dissipation at failure, beams S300, S250 and S200 had 125%, 77%, and 62% 213
higher Ed than beams B300, B250, B200, respectively. Thus, B-NSM strengthened beams have a 214
higher bending stiffness overall while S-NSM strengthened beams have a higher ductility and 215
rotational capacity. 216
4.2 Strain analysis 217
4.2.1 Load-strain response 218
Compared to B-NSM beams, S-NSM beams’ steel and CFRP reinforcement strains (Fig. 9s 219
and Fig. 9b, respectively) were initially slightly higher and lower, respectively. This is expected 220
due the difference between the effective depth of the CFRP reinforcement for the two systems. 221
After Py however, the CFRP strain for S-NSM beams was higher. For beam S200, the steel strain 222
gauges malfunctioned at approximately 125 kN applied load. 223
The maximum CFRP strain in the S-NSM beams was 11 – 18% higher compared to B-NSM 224
beams. Thus, the CFRP reinforcement had a higher utilisation ratio (0.50 to 0.54 εfu) in the S-225
NSM beam configuration compared to the B-NSM beam configuration (0.43 to 0.46 εfu ). 226
4.2.2 End anchorage longitudinal crack spacing 227
The distribution of major principal strains in the monitored areas preceding failure is shown in 228
Fig. 10. For B-NSM beams, only the soffit of the beam was monitored while for S-NSM beams, 229
only the side of the beam was monitored. According to the coordinate system shown in Fig. 2, the 230
strain maps in Fig. 10 are given relative to the planes xy and xz for B-NSM and S-NSM beams, 231
respectively. In all cases, x represents the longitudinal axis of the beam with zero being the 232

MANUSCRIP
T
ACCEPTED
ACCEPTED MANUSCRIPT
10
location of the north support. Axis y represents the thickness of the beams, with zero being the 233
side of the beam. Axis z represents the height of the beam, with zero being the soffit of the beam. 234
It should be noted that the strains shown in Fig. 10 greatly exceed the realistic tensile strains 235
expected in the concrete. However, the presented strain distribution is useful for evaluating crack 236
initiations, paths, distribution and spacing. The scale representation of deformation in this case 237
was chosen such that red areas indicate fully formed cracks. For both B-NSM and S-NSM 238
strengthened beams, crack spacing was measured at the bottom face of the beam. 239
The minimum distance between two consecutive cracks (i.e. minimum crack spacing) observed 240
for B-NSM beams was approximately 50 – 60 mm. The maximum distances between two 241
consecutive cracks (i.e. the maximum crack spacing) of 80, 100, and 110 mm were observed for 242
B300, B250 and B200, respectively, closest to the cut-off point. The maximum crack spacing in 243
this case was observed to be approximately twice the minimum spacing. Moreover, Fig. 10 244
indicates that the cut-off length ∆l possibly influences the crack spacing, a parameter currently not 245
accounted for by existing equations for predicting crack spacing in B-NSM beams [29-31]. 246
Larger crack spacing was observed for S-NSM than for B-NSRM beams, being 185, 180 and 247
170 mm for S300, S250 and S200, respectively. This suggests that the location of the NSM 248
(bottom or side) influences the stress distribution in the anchorage zone and consequently the 249
crack patterns. 250
4.2.3 End anchorage crack pattern 251
In S-NSM strengthened beams, horizontal cracks were observed above the NSM (see Fig. 10), 252
also above the flexural steel reinforcement (see Fig. 8). Cracks start as flexural-shear cracks and 253
propagate towards the cut-off point, indicative of CCD. This differs from previous reported 254
observations for S-NSM strengthened beams [22] and B-NSM strengthened beams [11-13], where 255
the CCD was initiated as a vertical crack at the CFRP cut-off point, propagating below the level of 256
the flexural steel reinforcement towards the middle of the beam. 257

MANUSCRIP
T
ACCEPTED
ACCEPTED MANUSCRIPT
11
In S-NSM beams, the possible debonding plane was located above the flexural steel 258
reinforcement (see Fig. 8) and, assuming it propagates as the same level over the thickness of the 259
beam (as in the case of B-NSM [11-13]), the shear reinforcement intersected by the failure plane 260
prevented CCD. Therefore, in the tested S-NSM strengthened beams, the failure plane was not 261
fully established. 262
5. Comparison of experimental and analytical results 263
The simplified analytical model proposed by An et al. [32] for rectangular beams was used to 264
calculate sectional stresses and deformations. The model is based on the following assumptions: 265
(1) linear strain distribution through the full depth of the beam; (2) small deformations; (3) the 266
concrete does not carry tensile stresses after cracking; (4) shear deformations are not considered 267
and (5) there is a perfect bond between the internal steel reinforcement and concrete, and NSM 268
and the concrete. The stress-strain relationship for CFRP reinforcement is linear elastic. The 269
stress-strain relationship for internal steel reinforcement is assumed elastic-perfectly plastic. 270
Hognestad’s [33] parabola of an idealised stress-strain curve was used for concrete in 271
compression. 272
The strain and stresses in the FRP bars and steel reinforcement, as well as curvature at 273
midspan, were calculated using an incremental deformation technique, in which the strain in the 274
extreme concrete fibre is increased from 0 to 3000µε, considered the ultimate useful concrete 275
strain. The strain in the steel and FRP reinforcement was calculated for each increment from a 276
cross sectional analysis to satisfy the force equilibrium and deformation compatibility conditions. 277
The moment and curvature were computed using the moment-curvature relationship, starting from 278
the strain in the extreme concrete fibre. Finally, the load-deflection response was derived. An 279
automated calculation procedure was developed to carry out the calculations. A good agreement 280
can be seen in terms of applied load-midspan displacement between the model and the 281
experimental tests (Fig. 11). 282
MANUSCRIP
T
ACCEPTED
ACCEPTED MANUSCRIPT
12
The bond between internal and NSM reinforcement and concrete was not modelled explicitly. 283
Instead, for CCD, the models proposed by Al-Mahmoud et al. [28] and Teng et al. [34] were used 284
to predict the failure load of strengthened specimens. According to a recent assessment of current 285
guidelines [1-3], current formulations for NSM interfacial debonding provide conservative results 286
with limited accuracy [35]. Instead, in this study, the model proposed by Mohamed Ali et al. [36] 287
was used to predict the interfacial debonding failure load. 288
5.1 Interfacial debonding model 289
Mohamed Ali et al. [36] proposed two models for the debonding of NSM, using linear and 290
bilinear interfacial bond characteristics, respectively. Both models were shown to have good 291
accuracy compared to experimental data obtained from pull-out tests, especially for predicting the 292
debonding load [36]. The simplified linear model is a closed-form solution, applicable to ICD. 293
The maximum interfacial shear stress and slip are obtained from: 294
�� = 0.54 ��ℎ��.����.� (1) 295
�� = 0.78 ����.�����.� � (2) 296
where fc is the concrete compressive strength, hf and bf are the height and width of the FRP 297
reinforcement, respectively, and bg is the groove size. 298
For cases where the anchorage length is longer than the effective bond length, the NSM 299
debonding strength is: 300
� !�"#$ = %&'()*+ (3) 301
where ,-!. is the total perimeter of the FRP-concrete interface at the end of ,! and / is a 302
constant: 303
/ = 0 %&'()*1&2&3& (4) 304
where Ef and Af are the Young modulus and the total cross sectional area of the FRP 305
reinforcement, respectively. 306
The FRP strain associated to � !�"#$ can be determined as: 307
MANUSCRIP
T
ACCEPTED
ACCEPTED MANUSCRIPT
13
4�"#$ = 56)789:3&2& (5) 308
The moment in the cracked section �;<�.= where debonding is initiated can be determined 309
from the cross section analysis starting from 4�"#$. 310
5.2 Concrete cover detachment model 311
Teng et al. [34] proposed a strength model for predicting the strain in the FRP at the critical 312
cracked section when CCD occurs: 313
4�##$ = 10� ∙ ?�@?32?�A ��B!C. �� (6) 314
?�@ = D �.EF��.�
− B�F�H DF�
I��− 0.1H (7) 315
?32 = IJ3&2&K�.L (8) 316
?�A = D��M)N*$O H�.I (9) 317
where PQ is the sum of the diameter of all tension steel reinforcement bars placed closest to the 318
NSM, and ��B!C. = � − PQ, the clear width of the beam. In Eq. 6, ?�@ accounts for the combined 319
effect of �� and S�; ?32 accounts for the influence of the FRP axial rigidity and ?�A accounts for 320
the effect of reinforcement size and number. Starting from 4�##$, the moment in the critical 321
cracked section can be determined from cross section analysis. According to Teng et al. [34], the 322
model gives better predictions compared to the other available models suggested by [28, 37]. For 323
the sake of brevity, the models proposed by [28, 37] are not shown here. 324
5.3 Evaluation of crack spacing 325
The crack spacing in the anchorage zone is of great importance for predictions based on the 326
concrete tooth model. All available CCD debonding models [28, 34, 37] were developed using 327
crack spacing values obtained from experimental observations [28] or from finite element analysis 328
[34]. According to De Lorenzis and Nanni [31], the minimum crack spacing in NSM strengthened 329
beams can be calculated by: 330
T�UVW = 3)��OXY∑[Y\%&∑[& (10) 331
MANUSCRIP
T
ACCEPTED
ACCEPTED MANUSCRIPT
14
where ]! is the area of concrete in tension, ^@ = 0.28 �′� and is the local bond strength of the 332
steel reinforcement, �� is the bond strength of the NSM, ∑a@ is the total perimeter of the internal 333
steel reinforcement, and ∑a� is the total perimeter of NSM. Zhang et al. [30] proposed a similar 334
equation for T�UVW, however ̂ � = 0.28 �′� and the total NSM groove perimeter are used instead 335
of �� and ∑a�, respectively. Other equations for predicting the crack spacing of NSM 336
strengthened beams have been proposed by Piyasena et al. [29]. For the sake of brevity, they are 337
not shown here. 338
Table 2 shows a summary of the observed minimum crack spacing (S�UVW) in the anchorage 339
zone using DIC (see Fig. 10) and the values obtained using the three mentioned models. It should 340
be noted that all models were developed based only on B-NSM strengthened beams and neither of 341
them explicitly accounted for the influence of df or ∆l. 342
Models by Zhang et al. [30] and De Lorenzis and Nanni [31] yielded results that were in better 343
agreement with the minimum crack spacing observed for B-NSM beams, albeit the latter slightly 344
overestimated, while values provided from the model by Piyasena et al. [29] were comparable 345
with the ones observed for S-NSM beams. Perhaps the crack spacing of S-NSM beams can be 346
evaluated using the same equation as that for internally reinforced beams, adapted to account for 347
the mechanical and bond properties of NSM. 348
5.4 Comparison with test results 349
For four-point bending, the moment at the critical crack location ;<�.= can be obtained as: 350
�;<�.= = � b�*Cc (11) 351
where � is the moment in the maximum moment region (i.e. between the load application 352
point) and de is the shear span of the beam. From static equilibrium conditions, it follows that the 353
associated total force in the actuator is: 354
f = 2 ghi'� = 2�;<�.= I
b�* (12) 355

MANUSCRIP
T
ACCEPTED
ACCEPTED MANUSCRIPT
15
where, for CCD debonding, <�. can be estimated as Δ� + S� and for ICD can be considered as 356
being de − l�/2. 357
Table 3 shows a summary of the experimentally and analytically determined maximum loads 358
associated with CCD and ICD debonding failure. The predicted ICD debonding loads for B-NSM 359
beams were higher than the observed maximum load, which is in good agreement with the 360
observed failure modes, as B-NSM beams failed by CCD. The predicted CCD debonding loads 361
for B-NSM (calculated using [34]) and ICD debonding loads for S-NSM (calculated using [36]) 362
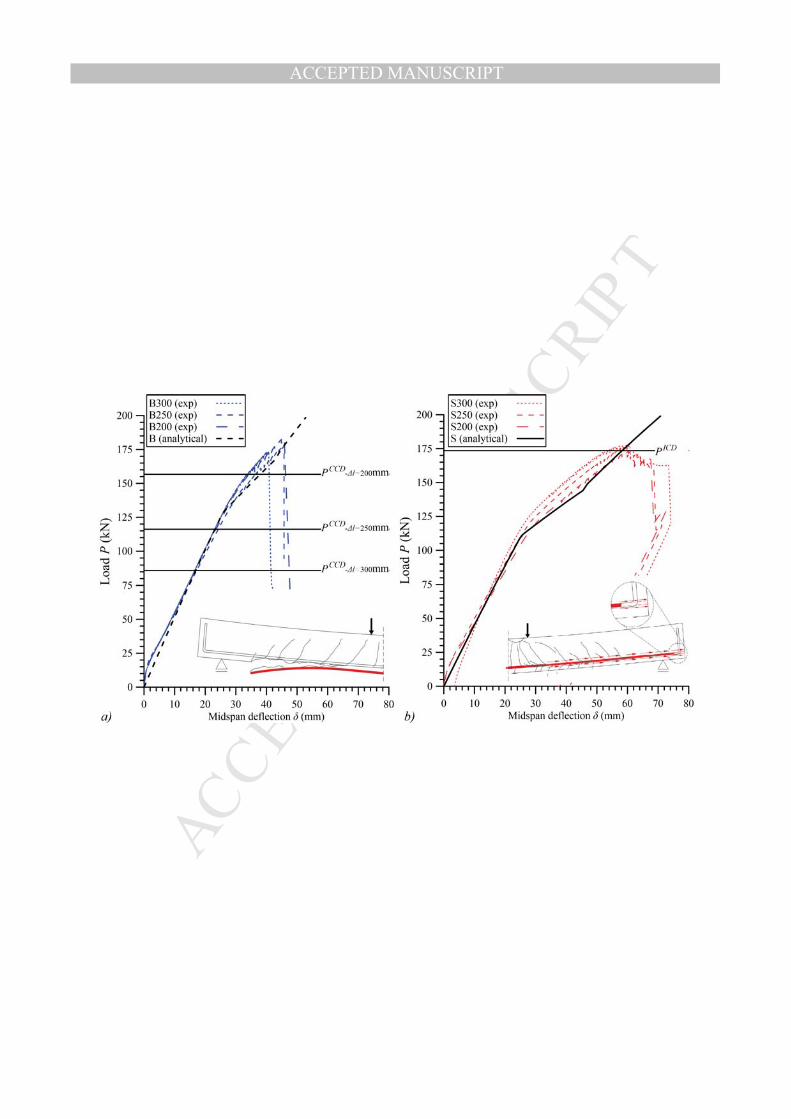
are shown in Fig. 12, respectively, together with the experimental and theoretical load-deflection 363
responses. 364
Based on the experimental results for B-NSM beams, the models by Teng et al. [34] and 365
Hassan and Rizkalla [37] show similar performances, having average predicted-to-tested ratios of 366
0.67 and 0.66, respectively, whereas the model by Al-Mahmoud et al. [28] was the most 367
conservative, having an average predicted-to-tested ratio of 0.52. The model by [37] was found to 368
have the lowest coefficient of variation (COV), 0.03, whereas those by Teng et al. [34] and Al-369
Mahmoud et al. [28] had 0.20 and 0.3 COV, respectively. In all cases, the experimentally 370
determined crack spacing for each beam was used as an input parameter. This indicates that the 371
former two models have a high sensitivity to the parameter ∆l in the range investigated in this 372
study. 373
The ICD model proposed by Mohamed Ali et al. [36] predicted the capacity of S-NSM beams 374
with good accuracy, having an average of predicted-to-tested ratio of 1.01 and with 0.01 COV 375
(see Fig. 12b and Table 3). 376
For S-NSM beams, the models by Teng et al. [34] and Hassan and Rizkalla [37] provided 377
average predicted-to-tested ratios of 1.01 and 0.55, with 0.19 and 0.07 COV, respectively. While 378
CCD debonding did not occur, results suggest that models by both Teng et al. [34] and Hassan 379
and Rizkalla [37] provided conservative predictions. However, experimental tests where the CCD 380
failure mode for S-NSM beams occurs are necessary to determine the influence of shear 381

MANUSCRIP
T
ACCEPTED
ACCEPTED MANUSCRIPT
16
reinforcement, crack spacing in the anchorage zone, and NSM cut-off distance on the debonding 382
capacity. 383
6. Conclusions 384
This paper describes the results of experimental tests carried out on six RC concrete beams 385
strengthened with NSM CFRP reinforcement at different locations. The NSM were placed at the 386
bottom of the beam (B-NSM) and at the side of the beam (S-NSM). The NSM was provided with 387
different anchorage lengths. Strains and crack patterns in the anchorage zone were recorded using 388
a 3D-DIC deformation measurement system. These observations provided insight into the 389
concrete cover detachment failure mode. The performances of analytical models used to predict 390
the crack spacing in the anchorage zone and the maximum capacity of the strengthened beams 391
were investigated. Based on the findings of this study, the following conclusions can be drawn. 392
An S-NSM strengthening system, when compared to a B-NSM system: 393
� Provided a similar ultimate load carrying capacity 394
� Was successful in avoiding concrete cover detachment 395
� Increased the CFRP strain at failure by 11 to 18% 396
� Increased the energy dissipation at failure by 1.6 to 2.3 times 397
� Increased the maximum deflection at failure by 31 to 46% 398
Moreover, by comparing experimental tests with models, the following conclusions can be drawn: 399
� The interfacial debonding model by Mohamed Ali et al. [36] predicted, with good accuracy, 400
the intermediate crack debonding failure load of S-NSM strengthened beams 401
� The crack spacing in the anchorage zone of B-NSM and S-NSM strengthened beams was 402
best predicted with models by Zhang et al. [30] and Piyasena et al. [29], respectively 403
� Existing CCD debonding models for B-NSM strengthen beams were found to be 404
conservative, and future CCD debonding for S-NSM strengthened beams should consider 405
the influence of the beam’s internal shear reinforcement 406

MANUSCRIP
T
ACCEPTED
ACCEPTED MANUSCRIPT
17
Further experimental tests are needed to study concrete cover detachment failure modes in S-407
NSM strengthened beams. The influence of parameters such as concrete cover thickness, flexural 408
and shear reinforcement ratio, NSM location, and support conditions should be addressed in 409
future studies. 410
Acknowledgements 411
The authors wish to thank Mr Oskar Seth and MSc Rewan Eredini for their help in the 412
experimental programme. This work was supported by the European Commission (Contract 413
number MC-ITN-2013-607851) and the Structural Engineering Department of Luleå University 414
of Technology (LTU) through internal funds. 415
References 416
[1] ACI 440.2R. Guide for the Design and Construction of Externally Bonded FRP Systems for Strengthening 417
Concrete Structures. Farmington Hills, Michigan, USA: American Concrete Institute; 2017. p. 116. 418
[2] CSA S806. CSA S806. Design of concrete structures. Toronto, Canada: Canadian Standards Association; 419
2012. 420
[3] CNR-DT200R1. Guide for the design and construction of externally bonded FRP systems for strengthening 421
existing structures. Rome, Italy: National Research Council (CNR); 2013. 422
[4] Fib Bulletin 14. Externally bonded FRP reinforcement for RC structures. Lausanne, Switzerland: Federation 423
for Structural Concrete (fib); 2001. 424
[5] Täljsten B, Blanksvärd T, Sas G. Handbok för dimensionering i samband med förstärkning av 425
betongkonstruktioner med pålimmade fiberkompositer [Design Guideline for FRP Strengthening of Existing 426
Concrete Structures. In Swedish]. Div. of Structural Engineering, Luleå University of Technology2011. 427
[6] EC 2. Eurocode 2: Design of concrete structures. Brussels, B-1050, Belgium: European Committee for 428
Standardization (CEN); 2005. 429
[7] Grace C, Yang Y, Sneed L. Fracture Mechanics Approaches to Debonding Behavior of Reinforced Concrete 430
Members with Externally-bonded Fiber Reinforced Polymer Laminates. ACI Special Publication. 2012;286. 431
[8] Bilotta A, Ceroni F, Di Ludovico M, Nigro E, Pecce M, Manfredi G. Bond Efficiency of EBR and NSM FRP 432
Systems for Strengthening Concrete Members. Journal of Composites for Construction. 2011;15(5):757-72. 433
[9] Bilotta A, Ceroni F, Nigro E, Pecce M. Efficiency of CFRP NSM strips and EBR plates for flexural 434
strengthening of RC beams and loading pattern influence. Composite Structures. 2015;124:163-75. 435
[10] Lundqvist J, Nordin H, Täljsten B, Olofsson T. Numerical analysis of concrete beams strengthened with 436
CFRP : a study of anchorage lengths. In: Proceedings of International Symposium on Bond Behaviour of FRP in 437
Structures : 2005. Conference 2005, Conference 2005. p. 239-46. 438
[11] Sharaky IA, Torres L, Comas J, Barris C. Flexural response of reinforced concrete (RC) beams strengthened 439
with near surface mounted (NSM) fibre reinforced polymer (FRP) bars. Composite Structures. 2014;109:8-22. 440

MANUSCRIP
T
ACCEPTED
ACCEPTED MANUSCRIPT
18
[12] Barros JAO, Fortes AS. Flexural strengthening of concrete beams with CFRP laminates bonded into slits. 441
Cement and Concrete Composites. 2005;27(4):471-80. 442
[13] Al-Mahmoud F, Castel A, François R, Tourneur C. Strengthening of RC members with near-surface 443
mounted CFRP rods. Composite Structures. 2009;91(2):138-47. 444
[14] Sas G, Dăescu C, Popescu C, Nagy-György T. Numerical optimization of strengthening disturbed regions of 445
dapped-end beams using NSM and EBR CFRP. Composites Part B: Engineering. 2014;67:381-90. 446
[15] Bennitz A, Täljsten B, Danielsson G. CFRP strengthening of a railway concrete trough bridge – a case 447
study. Structure and Infrastructure Engineering. 2012;8(9):801-16. 448
[16] Nordin H, Täljsten B. Concrete Beams Strengthened with Prestressed Near Surface Mounted CFRP. Journal 449
of Composites for Construction. 2006;10(1):60-8. 450
[17] Täljsten B, Carolin A, Nordin H. Concrete Structures Strengthened with Near Surface Mounted 451
Reinforcement of CFRP. Advances in Structural Engineering. 2003;6(3):201-13. 452
[18] Enochsson O, Lundqvist J, Täljsten B, Rusinowski P, Olofsson T. CFRP strengthened openings in two-way 453
concrete slabs – An experimental and numerical study. Construction and Building Materials. 2007;21(4):810-26. 454
[19] Mostakhdemin Hosseini MR, Dias SJE, Barros JAO. Flexural strengthening of reinforced low strength 455
concrete slabs using prestressed NSM CFRP laminates. Composites Part B: Engineering. 2016;90:14-29. 456
[20] Gonzalez-Libreros JH, Sneed LH, D'Antino T, Pellegrino C. Behavior of RC beams strengthened in shear 457
with FRP and FRCM composites. Engineering Structures. 2017;150:830-42. 458
[21] Bianco V, Barros JA, Monti G. Bond Model of NSM-FRP Strips in the Context of the Shear Strengthening 459
of RC Beams. Journal of Structural Engineering. 2009;135(6):619-31. 460
[22] Hosen MA, Jumaat MZ, Islam ABMS. Side Near Surface Mounted (SNSM) technique for flexural 461
enhancement of RC beams. Materials & Design. 2015;83:587-97. 462
[23] Shukri AA, Hosen MA, Muhamad R, Jumaat MZ. Behaviour of precracked RC beams strengthened using 463
the side-NSM technique. Construction and Building Materials. 2016;123:617-26. 464
[24] GOM mbH. ARAMIS - Optical 3D Deformation Analysis. 6.3 ed. Braunschweig Germany: GOM mbH; 465
2008. 466
[25] EN ISO 12390-3. Testing hardened concrete – Part 3: Compressive strength of test specimens. Brussels, B-467
1000, Belgium: European Committee for Standardization (CEN); 2009. 468
[26] SS-EN ISO 6892-1. Metallic materials – Tensile testing – Part 1: Method of test at room temperature. 469
Stockholm, Sweden: Swedish Standards Institute (SIS); 2009. 470
[27] Reu P. Introduction to Digital Image Correlation: Best Practices and Applications. Exp Tech. 2012;36(1):3-471
4. 472
[28] Al-Mahmoud F, Castel A, François R, Tourneur C. RC beams strengthened with NSM CFRP rods and 473
modeling of peeling-off failure. Composite Structures. 2010;92(8):1920-30. 474
[29] Piyasena R, Loo YC, Fragomeni S. Determination of crack spacing and crack width in reinforced concrete 475
beams. Structural Engineering and Mechanics. 2003;15(2):159-80. 476
[30] Zhang J, Raoof M, Wood LA. Prediction of peeling failure of reinforced concrete beams with externally 477
bonded steel plates. Proceedings of the Institution of Civil Engineers - Structures and Buildings. 478
1995;110(3):257-68. 479

MANUSCRIP
T
ACCEPTED
ACCEPTED MANUSCRIPT
19
[31] De Lorenzis L, Nanni A. Design procedure of NSM FRP reinforcement for strengthening of RC beams. 480
Fibre-Reinforced Polymer Reinforcement for Concrete Structures: World Scientific Publishing Company; 2012. 481
p. 1455-64. 482
[32] An W, Saadatmanesh H, Ehsani MR. RC Beams Strengthened with FRP Plates. II: Analysis and Parametric 483
Study. Journal of Structural Engineering. 1991;117(11):3434-55. 484
[33] E. H. A study of combined bending and axial load in reinforced concrete members. University of Illinois 485
Engineering Experiment Station; 1951. p. 128. 486
[34] Teng JG, Zhang SS, Chen JF. Strength model for end cover separation failure in RC beams strengthened 487
with near-surface mounted (NSM) FRP strips. Engineering Structures. 2016;110(Supplement C):222-32. 488
[35] D'Antino T, Limonta A, Pisani MA. Assessment of current guideline formulations for flexural strengthening 489
of reinforced concrete beams using NSM reinforcement. In: Proceedings of 8th International Conference on FRP 490
Composites in Civil Engineering. Hong Kong, China, Conference, Conference 2016. 491
[36] Mohamed Ali MS, Oehlers DJ, Griffith MC, Seracino R. Interfacial stress transfer of near surface-mounted 492
FRP-to-concrete joints. Engineering Structures. 2008;30(7):1861-8. 493
[37] Hassan T, Rizkalla S. Investigation of Bond in Concrete Structures Strengthened with Near Surface 494
Mounted Carbon Fiber Reinforced Polymer Strips. Journal of Composites for Construction. 2003;7(3):248-57. 495
496
497

MANUSCRIP
T
ACCEPTED
ACCEPTED MANUSCRIPT
20
Figure captions 498
Fig. 1. Test specimen details (units in mm) 499
Fig. 2. Test setup and location of DIC monitored area with respect to the defined coordinate 500
system 501
Fig. 3. Load-midspan deflection response of B-NSM beams 502
Fig. 4. CCD debonding of B-NSM strengthened beams 503
Fig. 5. Load-midspan deflection response of S-NSM beams 504
Fig. 6. S-NSM strenghtend beams after failure (concrete crushing and ICD) 505
Fig. 7 Comparison of load-midspan displacement responses: (a) ∆l=300 mm; (b) ∆l=250 mm; (c) 506
∆l= 200 mm 507
Fig. 8 Isolated concrete tooth between the last two adjacent cracks for B-NSM and S-NSM 508
strengthening system 509
Fig. 9 Load-strain response for (a) steel reinforcement: (b) CFRP bars 510
Fig. 10 Principal tensile strain distribution on the surface of the north anchorage zone, bottom 511
view for B-NSM (left) and side view for S-NSM (right), relative to the coordinate system 512
(units in mm) 513
Fig. 11 Comparison between the theoretical and experimentally obtained Load-midspan deflection 514
response 515
Fig. 12 Experimental and analytical comparison of debonding loads for a) B-NSM (CCD [34]) 516
and b) S-NSM (ICD [36]) 517
518

MANUSCRIP
T
ACCEPTED
ACCEPTED MANUSCRIPT
21
Tables 519
Table 1 Test results 520
Specimen
Cracking load
Yielding load
Ultimate load
Max. deflection
Bending stiffness
Energy dissipation
Max. CFRP strain
Pcr Py Pu δu K Ed εf (kN) (kN) (kN) (mm) (N/mm) (kNm) (µm/m)
Ref 10.0 54 78 51.0 2643 2.79 - B300 12.4
(24%) 118
(119%) 173
(122%) 40.6 4644
(76%) 3.94
(41%) 6390 (0.46εfu)
B250 16.0 (60%)
117 (117%)
178 (128%)
45.7 4355 (65%)
4.69 (68%)
6118 (0.44εfu)
B200 15.7 (57%)
123 (128%)
184 (136%)
45.7 4555 (72%)
4.82 (72%)
6526 (0.47εfu)
S300 n.a.
107 (98%)
177 (127%)
59.5 n.a.
n.a.
7114 (0.51εfu)
S250 14.6 (46%)
99 (83%)
177 (127%)
60.0 3978 (51%)
8.28 (198%)
7244 (0.52εfu)
S200 13.6 (36%)
102 (89%)
173 (122%)
60.5 3860 (46%)
7.83 (181%)
7568 (0.54εfu)
n.a. - data not available; Note: increase relative to reference beam given in parenthesis.
521
Table 2 Minimum crack spacing in the CFRP anchorage zone 522
Specimen T�UVW
a)S�UVW Piyasena et al. [29]
Zhang et al. [30]
De Lorenzis and Nanni [31]
(mm) (mm) B300
137 54 78
50 B250 50 B200 60 S300 b)- S250 120 S200 100 a)Values from tests b)The stabilised crack region was outside the DIC measured area
523
Table 3 Experimental and analytical loads of strengthened beams 524
Specimen Failure mode fUCb!b-
f##$ f"#$ f##$/f!b- f"#$/fUCb!b-
[34] [37] [28] [36] [34] [37] [28] [36]
(kN) (kN) (kN) (kN) (kN) B300 CCD 173 86 110 56
189 0.50 0.64 0.32 0.92
B250 CCD 178 116 120 95 0.65 0.67 0.53 0.94 B200 CCD 184 157 125 129 0.85 0.68 0.70 0.97
S300 ICD 177 135 90 174
0.76 0.51 1.02 S250 ICD 177 186 96 1.05 0.54 1.02 S200 ICD 173 210 104 1.21 0.60 1.00 CCD Models: Teng et al. [34]; Hassan and Rizkalla [37]; Al-Mahmoud et al. [28]; ICD Model: Mohamed Ali et al. [36] 525 526

MANUSCRIP
T
ACCEPTED
ACCEPTED MANUSCRIPT

MANUSCRIP
T
ACCEPTED
ACCEPTED MANUSCRIPT

MANUSCRIP
T
ACCEPTED
ACCEPTED MANUSCRIPT
MANUSCRIP
T
ACCEPTED
ACCEPTED MANUSCRIPT

MANUSCRIP
T
ACCEPTED
ACCEPTED MANUSCRIPT

MANUSCRIP
T
ACCEPTED
ACCEPTED MANUSCRIPT
MANUSCRIP
T
ACCEPTED
ACCEPTED MANUSCRIPT

MANUSCRIP
T
ACCEPTED
ACCEPTED MANUSCRIPT

MANUSCRIP
T
ACCEPTED
ACCEPTED MANUSCRIPT

MANUSCRIP
T
ACCEPTED
ACCEPTED MANUSCRIPT

MANUSCRIP
T
ACCEPTED
ACCEPTED MANUSCRIPT

MANUSCRIP
T
ACCEPTED
ACCEPTED MANUSCRIPT