Embed Size (px)
Citation preview
IEDC Technical Assistance Final Report – Pawtucket, Rhode Island 1
Strengthening Downtown
Pawtucket, Rhode Island
Technical Assistance Report
May 2015
734 15th Street NW, Suite 900
Washington, DC 20005
202.223.7800
IEDC Technical Assistance Final Report – Pawtucket, Rhode Island 2
International Economic Development Council The International Economic Development Council (IEDC) is the world’s largest membership organization serving the economic development profession with over 4,600 members and a network of over 25,000 economic development professionals and allies. From public to private, rural to urban and local to international, our members represent the entire range of economic development experience. Through a range of services including conferences, training courses, webinars, publications, research, and technical assistance efforts we strive to provide practical economic development advice and solutions to the economic development community and its stakeholders. For more information about IEDC, please visit www.iedconline.org.
IEDC Leadership
JoAnn Crary, CEcD President Saginaw Future Inc. IEDC Board Chair Jeffrey A. Finkle, CEcD President and CEO International Economic Development Council
Acknowledgements This technical assistance project was funded through a grant from the U.S. Economic Development Administration (EDA), Economic Adjustment Assistance Project No. 08-79-04593. The grant is focused on long-term economic recovery of FY2011 disaster-impacted communities and regions in the EDA Philadelphia office region. The statements, findings, conclusions, recommendations, and other data in this report are solely those of IEDC and do not necessarily reflect the views of the U.S. Economic Development Administration (EDA). IEDC would like to acknowledge Southwest Airlines, a community partner, for flying team members to the site visit. IEDC would also like to acknowledge StateBook International and Economic Modeling Specialists International (EMSI) for their donation of software.
IEDC Technical Assistance Final Report – Pawtucket, Rhode Island 3
Technical Assistance Team
IEDC greatly appreciates input and assistance received from its members and staff whom participated on this project, and would like to acknowledge and thank the project’s advisory team (listed below) for its time and contributions.
Christine Butterfield Senior Management Advisor Management Partners, Inc. San Jose, CA Jane Jenkins President & CEO Downtown Oklahoma City, Inc. Oklahoma City, OK Catherine Timko Principal The Riddle Company Washington, D.C. Richard Ward Principal Ward Development Counsel, LLC Saint Louis, MO Sarah Garcia, AICP Economic Development Advisor, TIA Products, LLC IEDC Technical Assistance Lead Washington, DC Scott Annis Economic Development Specialist IEDC, Washington, DC
IEDC Technical Assistance Final Report – Pawtucket, Rhode Island 4
Table of Contents Introduction ................................................................................................................................................................5
Project Overview ....................................................................................................................................................5
IEDC Technical Assistance Process .........................................................................................................................6
Background .............................................................................................................................................................7
Strengths & Challenges ..........................................................................................................................................8
Recommendations ......................................................................................................................................................9
Develop an Economic Strategy ............................................................................................................................ 11
Rethink Downtown .............................................................................................................................................. 15
Enhance Marketing: Tell Your Story .................................................................................................................... 24
Define Roles, Develop Partnerships .................................................................................................................... 28
Activate Tools and Techniques ............................................................................................................................ 33
Signal the Change ................................................................................................................................................ 38
Appendix A Background Data .................................................................................................................................. 39
Geographic Overview .......................................................................................................................................... 39
Demographic Trends ........................................................................................................................................... 40
Economic Trends & Data ..................................................................................................................................... 45
Public Safety ........................................................................................................................................................ 53
Appendix B- Recent Plans that are informing Downtown Development ................................................................ 54
Appendix C - The Team ............................................................................................................................................ 55
IEDC Technical Assistance Final Report – Pawtucket, Rhode Island 5
Introduction
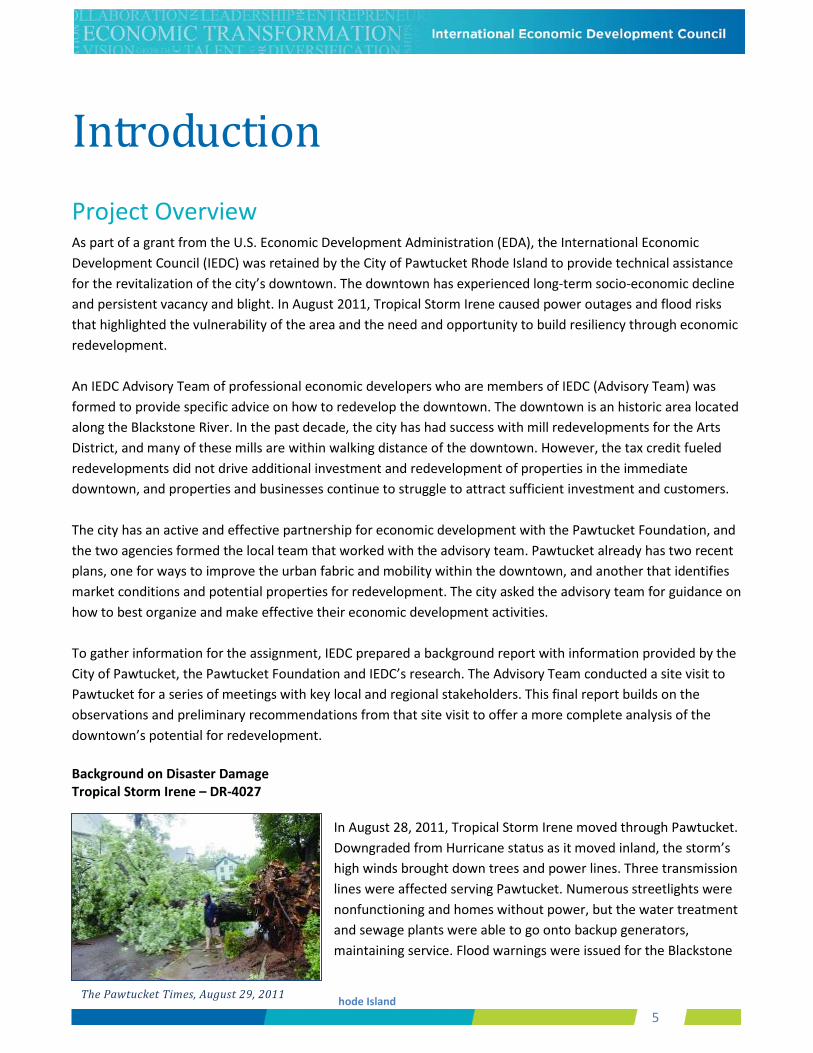
Project Overview As part of a grant from the U.S. Economic Development Administration (EDA), the International Economic Development Council (IEDC) was retained by the City of Pawtucket Rhode Island to provide technical assistance for the revitalization of the city’s downtown. The downtown has experienced long-term socio-economic decline and persistent vacancy and blight. In August 2011, Tropical Storm Irene caused power outages and flood risks that highlighted the vulnerability of the area and the need and opportunity to build resiliency through economic redevelopment. An IEDC Advisory Team of professional economic developers who are members of IEDC (Advisory Team) was formed to provide specific advice on how to redevelop the downtown. The downtown is an historic area located along the Blackstone River. In the past decade, the city has had success with mill redevelopments for the Arts District, and many of these mills are within walking distance of the downtown. However, the tax credit fueled redevelopments did not drive additional investment and redevelopment of properties in the immediate downtown, and properties and businesses continue to struggle to attract sufficient investment and customers. The city has an active and effective partnership for economic development with the Pawtucket Foundation, and the two agencies formed the local team that worked with the advisory team. Pawtucket already has two recent plans, one for ways to improve the urban fabric and mobility within the downtown, and another that identifies market conditions and potential properties for redevelopment. The city asked the advisory team for guidance on how to best organize and make effective their economic development activities. To gather information for the assignment, IEDC prepared a background report with information provided by the City of Pawtucket, the Pawtucket Foundation and IEDC’s research. The Advisory Team conducted a site visit to Pawtucket for a series of meetings with key local and regional stakeholders. This final report builds on the observations and preliminary recommendations from that site visit to offer a more complete analysis of the downtown’s potential for redevelopment. Background on Disaster Damage Tropical Storm Irene – DR-4027
In August 28, 2011, Tropical Storm Irene moved through Pawtucket. Downgraded from Hurricane status as it moved inland, the storm’s high winds brought down trees and power lines. Three transmission lines were affected serving Pawtucket. Numerous streetlights were nonfunctioning and homes without power, but the water treatment and sewage plants were able to go onto backup generators, maintaining service. Flood warnings were issued for the Blackstone
The Pawtucket Times, August 29, 2011
IEDC Technical Assistance Final Report – Pawtucket, Rhode Island 6
River, but damage came primarily from the high winds in the storm. Natural disaster resistance and resiliency planning in the State of Rhode Island is supported by economic development guidelines for the comprehensive plan that prioritize the stabilization and redevelopment of central business districts. The City of Pawtucket has a state approved 2011 Comprehensive Plan, and an approved 2012 amendment designating downtown Pawtucket a State Growth Center district. The Downtown continues to have difficulty attracting investment and redevelopment, containing significant vacant and underutilized structures. These buildings need reinvestment to bring them up to current building and fire codes. The downtown has experienced a five percent population loss over the past decade, the average age is 49, and the median household income in the quarter mile radius is just $12,279. The advisory team focused on strategies and initiatives for downtown investment and revitalization.
IEDC Technical Assistance Process The IEDC Advisory Team was formed to participate in a three-day project site visit from February 25-27, 2015. Members were chosen for their expertise and experience in economic development, downtown revitalization, vacancy and blight, and business retention, expansion, and resiliency. The Advisory Team included Christine Butterfield, a private consultant with Management Partners from San Jose, CA; Jane Jenkins, Executive Director of Downtown Oklahoma City, OK; Catherine Timko, Principal, The Riddle Company, Washington, DC; and Richard Ward of Ward Development Counsel, St. Louis, MO. To prepare for the site visit, IEDC staff members compiled a detailed background report for the Advisory Team that reviewed the assets within the downtown, provided a brief on current and recent planning efforts, and analyzed demographic, socio-economic, and real estate market trends and information. While in Pawtucket, the Advisory Team met with over 50 local and regional stakeholders including city department heads, real estate brokers active in the neighborhoods, local business and property owners, developers in the area, state officials, public safety officials, neighborhood resident leaders, and other local stakeholders. At the conclusion of the site visit, the Advisory Team presented its preliminary findings to key stakeholders from the City of Pawtucket and the Pawtucket Foundation. Final Report Structure and format This final report builds off of the observations and preliminary recommendations from the IEDC Advisory Team’s site visit to Pawtucket. The report also includes additional research conducted by IEDC staff both before and after the site visit. The report is structured as follows.
SECTION I: INTRODUCTION, BACKGROUND, STRENGTHS & CHALLENGES— Section I provides the overview of the report, reviews the context of the downtown, recent developments, and the strengths and challenges facing the city.
SECTION II: RECOMMENDATIONS — Section II offers recommendations from the IEDC Advisory Team for downtown revitalization. The team took a comprehensive approach when identifying key actions for downtown transformation. The downtown requires a clear vision and an economic strategy directly supportive of that
IEDC Technical Assistance Final Report – Pawtucket, Rhode Island 7
vision. The advisory team identifies the components of a successful economic strategy, and lays out the steps the local team can take to put this strategy into action.
APPENDIX — The Appendix includes background data, reference documents, and team bios.
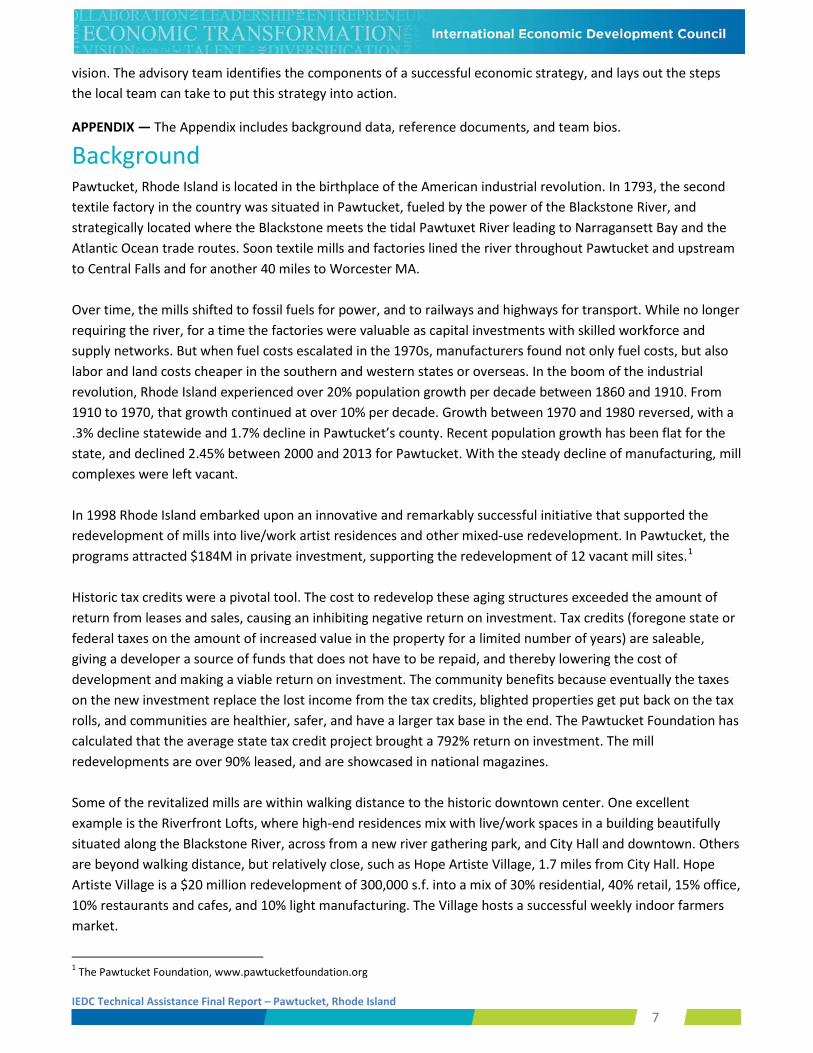
Background Pawtucket, Rhode Island is located in the birthplace of the American industrial revolution. In 1793, the second textile factory in the country was situated in Pawtucket, fueled by the power of the Blackstone River, and strategically located where the Blackstone meets the tidal Pawtuxet River leading to Narragansett Bay and the Atlantic Ocean trade routes. Soon textile mills and factories lined the river throughout Pawtucket and upstream to Central Falls and for another 40 miles to Worcester MA. Over time, the mills shifted to fossil fuels for power, and to railways and highways for transport. While no longer requiring the river, for a time the factories were valuable as capital investments with skilled workforce and supply networks. But when fuel costs escalated in the 1970s, manufacturers found not only fuel costs, but also labor and land costs cheaper in the southern and western states or overseas. In the boom of the industrial revolution, Rhode Island experienced over 20% population growth per decade between 1860 and 1910. From 1910 to 1970, that growth continued at over 10% per decade. Growth between 1970 and 1980 reversed, with a .3% decline statewide and 1.7% decline in Pawtucket’s county. Recent population growth has been flat for the state, and declined 2.45% between 2000 and 2013 for Pawtucket. With the steady decline of manufacturing, mill complexes were left vacant. In 1998 Rhode Island embarked upon an innovative and remarkably successful initiative that supported the redevelopment of mills into live/work artist residences and other mixed-use redevelopment. In Pawtucket, the programs attracted $184M in private investment, supporting the redevelopment of 12 vacant mill sites.1 Historic tax credits were a pivotal tool. The cost to redevelop these aging structures exceeded the amount of return from leases and sales, causing an inhibiting negative return on investment. Tax credits (foregone state or federal taxes on the amount of increased value in the property for a limited number of years) are saleable, giving a developer a source of funds that does not have to be repaid, and thereby lowering the cost of development and making a viable return on investment. The community benefits because eventually the taxes on the new investment replace the lost income from the tax credits, blighted properties get put back on the tax rolls, and communities are healthier, safer, and have a larger tax base in the end. The Pawtucket Foundation has calculated that the average state tax credit project brought a 792% return on investment. The mill redevelopments are over 90% leased, and are showcased in national magazines. Some of the revitalized mills are within walking distance to the historic downtown center. One excellent example is the Riverfront Lofts, where high-end residences mix with live/work spaces in a building beautifully situated along the Blackstone River, across from a new river gathering park, and City Hall and downtown. Others are beyond walking distance, but relatively close, such as Hope Artiste Village, 1.7 miles from City Hall. Hope Artiste Village is a $20 million redevelopment of 300,000 s.f. into a mix of 30% residential, 40% retail, 15% office, 10% restaurants and cafes, and 10% light manufacturing. The Village hosts a successful weekly indoor farmers market.
1 The Pawtucket Foundation, www.pawtucketfoundation.org
IEDC Technical Assistance Final Report – Pawtucket, Rhode Island 8
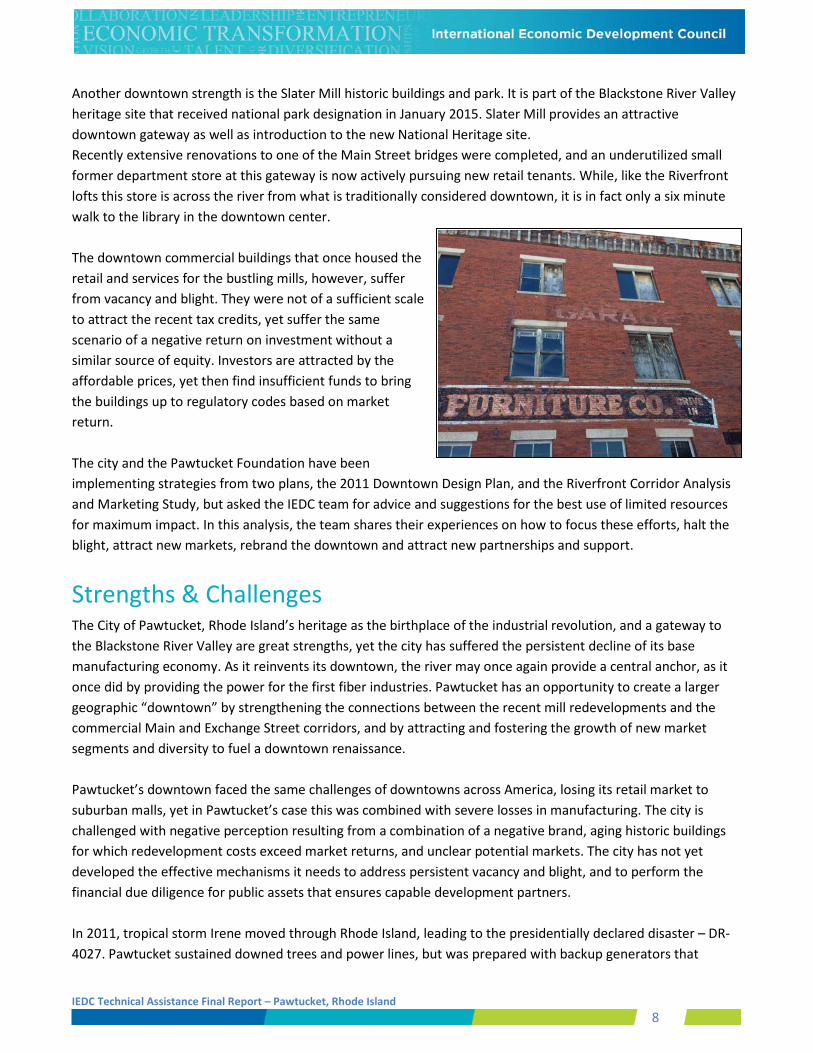
Another downtown strength is the Slater Mill historic buildings and park. It is part of the Blackstone River Valley heritage site that received national park designation in January 2015. Slater Mill provides an attractive downtown gateway as well as introduction to the new National Heritage site. Recently extensive renovations to one of the Main Street bridges were completed, and an underutilized small former department store at this gateway is now actively pursuing new retail tenants. While, like the Riverfront lofts this store is across the river from what is traditionally considered downtown, it is in fact only a six minute walk to the library in the downtown center. The downtown commercial buildings that once housed the retail and services for the bustling mills, however, suffer from vacancy and blight. They were not of a sufficient scale to attract the recent tax credits, yet suffer the same scenario of a negative return on investment without a similar source of equity. Investors are attracted by the affordable prices, yet then find insufficient funds to bring the buildings up to regulatory codes based on market return. The city and the Pawtucket Foundation have been implementing strategies from two plans, the 2011 Downtown Design Plan, and the Riverfront Corridor Analysis and Marketing Study, but asked the IEDC team for advice and suggestions for the best use of limited resources for maximum impact. In this analysis, the team shares their experiences on how to focus these efforts, halt the blight, attract new markets, rebrand the downtown and attract new partnerships and support.
Strengths & Challenges The City of Pawtucket, Rhode Island’s heritage as the birthplace of the industrial revolution, and a gateway to the Blackstone River Valley are great strengths, yet the city has suffered the persistent decline of its base manufacturing economy. As it reinvents its downtown, the river may once again provide a central anchor, as it once did by providing the power for the first fiber industries. Pawtucket has an opportunity to create a larger geographic “downtown” by strengthening the connections between the recent mill redevelopments and the commercial Main and Exchange Street corridors, and by attracting and fostering the growth of new market segments and diversity to fuel a downtown renaissance. Pawtucket’s downtown faced the same challenges of downtowns across America, losing its retail market to suburban malls, yet in Pawtucket’s case this was combined with severe losses in manufacturing. The city is challenged with negative perception resulting from a combination of a negative brand, aging historic buildings for which redevelopment costs exceed market returns, and unclear potential markets. The city has not yet developed the effective mechanisms it needs to address persistent vacancy and blight, and to perform the financial due diligence for public assets that ensures capable development partners. In 2011, tropical storm Irene moved through Rhode Island, leading to the presidentially declared disaster – DR-4027. Pawtucket sustained downed trees and power lines, but was prepared with backup generators that
IEDC Technical Assistance Final Report – Pawtucket, Rhode Island 9
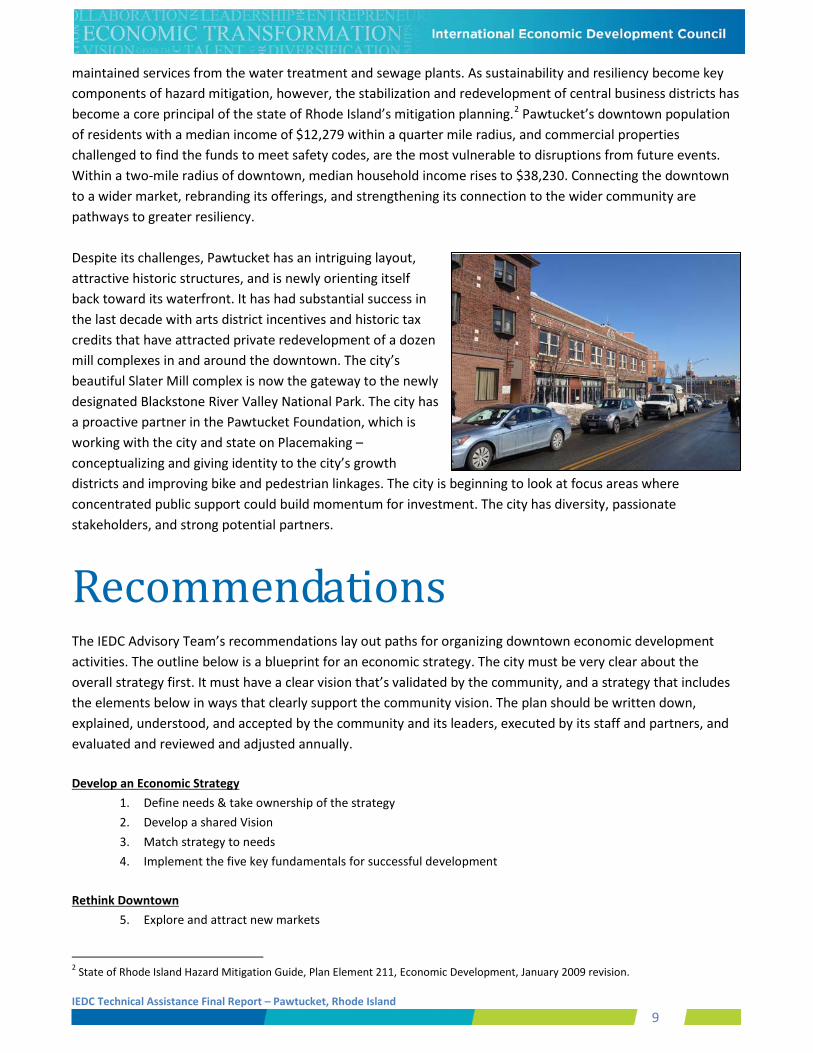
maintained services from the water treatment and sewage plants. As sustainability and resiliency become key components of hazard mitigation, however, the stabilization and redevelopment of central business districts has become a core principal of the state of Rhode Island’s mitigation planning.2 Pawtucket’s downtown population of residents with a median income of $12,279 within a quarter mile radius, and commercial properties challenged to find the funds to meet safety codes, are the most vulnerable to disruptions from future events. Within a two-mile radius of downtown, median household income rises to $38,230. Connecting the downtown to a wider market, rebranding its offerings, and strengthening its connection to the wider community are pathways to greater resiliency. Despite its challenges, Pawtucket has an intriguing layout, attractive historic structures, and is newly orienting itself back toward its waterfront. It has had substantial success in the last decade with arts district incentives and historic tax credits that have attracted private redevelopment of a dozen mill complexes in and around the downtown. The city’s beautiful Slater Mill complex is now the gateway to the newly designated Blackstone River Valley National Park. The city has a proactive partner in the Pawtucket Foundation, which is working with the city and state on Placemaking – conceptualizing and giving identity to the city’s growth districts and improving bike and pedestrian linkages. The city is beginning to look at focus areas where concentrated public support could build momentum for investment. The city has diversity, passionate stakeholders, and strong potential partners.
Recommendations The IEDC Advisory Team’s recommendations lay out paths for organizing downtown economic development activities. The outline below is a blueprint for an economic strategy. The city must be very clear about the overall strategy first. It must have a clear vision that’s validated by the community, and a strategy that includes the elements below in ways that clearly support the community vision. The plan should be written down, explained, understood, and accepted by the community and its leaders, executed by its staff and partners, and evaluated and reviewed and adjusted annually.
Develop an Economic Strategy
1. Define needs & take ownership of the strategy 2. Develop a shared Vision 3. Match strategy to needs 4. Implement the five key fundamentals for successful development
Rethink Downtown
5. Explore and attract new markets
2 State of Rhode Island Hazard Mitigation Guide, Plan Element 211, Economic Development, January 2009 revision.
IEDC Technical Assistance Final Report – Pawtucket, Rhode Island 10
a. Divide into manageable geographic areas/subdistricts b. Develop a brand identity
6. Organize resources a. Create a steering committee b. Develop 3-5 major strategies c. Embrace the Main Street Four Point Approach d. Designate (or hire) a downtown advocate
7. Strategically Activate a. Expand marketing of and participation in the Arts Festival b. Consider association with the International Fringe Festival c. Utilize tactical urbanism d. Re-energize arts district incentives
Enhance Marketing: Tell Your Story
8. Be proactive and deliberate with marketing and PR 9. Enhance communications and pro-actively promote the downtown and community
efine Roles, Develop Partnerships
10. Clearly define roles and responsibilities 11. Strengthen existing partnerships 12. Build relationships with new partners
a. Work with the business community b. Partnerships with LISC and the banks c. Media d. State and Federal agencies
13. Build support for code compliance Activate Tools and Techniques
14. Target and prioritize action areas 15. Put fiscal incentives to work - TIF, Historic Tax Credits, New Market Tax Credits 16. Link code enforcement to occupancy permit 17. Establish a common/public parking system 18. Enforce zoning and building codes 19. Develop a targeted capital improvement program-CIP
Signal the Change
20. Fix the parking garage!
IEDC Technical Assistance Final Report – Pawtucket, Rhode Island 11
Develop an Economic Strategy Pawtucket has had several recent plans that provide detailed analysis of aspects of the downtown: its physical layout, its markets, and potential development sites. The city has been implementing pieces of these plans, but expresses a need to focus, as there are not the resources to be pursuing all directions. Developing an economic strategy is a way to establish consensus for the actions the city and its partners take. It also provides clarity about capacity and how to focus resources to get a visible result. It is important that all partners in the community share this vision, and as developments come down the road, they are clearly linked back to how they support the community vision and strategy. An economic development strategy defines the community’s needs, expresses its shared vision, identifies the strategies that are matched to its needs, and pursues successful developments that further the vision and address the needs.
1. Define Needs. Take Ownership of Strategy The city has been in the process of doing this with recent planning documents and follow-up on the actions in them. Many times communities sit back to see what the state or federal agencies will deliver. Given that this is the fourth largest community in Rhode Island, the city can make requests to the state, letting the state know what the city’s needs are and how the state can support it.
The better the city can identify and define its needs, the more persuasive it can be. An example of this would be data collection on vacant and underutilized buildings, and analysis on the reported unmet gap for a positive return on investment. With a clear understanding of the gap between the city’s resources and what is needed to address the problem and confidence in public support for the solution, the city will have power behind its request to the state.
Necessity is the mother of invention. It is an opportunity to innovate and to do something new. The city already has a history of this concept with artist mill districts. However, the overall strategy has to be deliberative, cohesive and long-term.
The part of the process that can be challenging is persistence in doing the work of owning the strategy and pushing the Pawtucket strategy forward on a long-term basis. Are there state agencies that the city should be reaching out to on a regular basis? The more the city can demonstrate progress, the more confidence it will inspire in its partners. Communicating what the city is doing on an ongoing basis is necessary to build confidence. Use newsletters and community meetings to demonstrate transparency and let people know about progress.
This is a problem-solving system. Each problem solved leads to a new handful of problems. So the city must be creating a problem-solving system that facilitates and strengthens its ability to get things done.
2. Develop a Shared Vision There is a need for the big picture vision. As the city goes into block redevelopment, it must be diligent, open and engaged, allowing neighborhoods to be involved so that they can see their needs articulated in that
IEDC Technical Assistance Final Report – Pawtucket, Rhode Island 12
development. For example, in a recent mixed-use development the neighborhood was very concerned about a curb cut for the underground parking near a school. Letting the neighborhood modify the project is an essential component of public support. Good practice is to start slow, finish fast. By the time an elected body needs to take action on a development proposal, all the work has been done. There should have been many discussions and the project worked out with full public support. The development agreement, the financial supports, the public benefits and consistency with community needs should all be understood prior to entering the permitting stage.
3. Match strategy to needs. Throughout this report, needs for the downtown are identified and tools to address those needs are given. The city’s overall economic strategy for downtown knits together these strategies for overall improvement. Public support for economic development comes from clear understanding of the needs that the strategies are addressing.
Downtown Pawtucket is home to many vacant and declining buildings that bring down the value of surrounding properties. The advisory team heard that costs to bring some buildings into code compliance exceed their rehabilitated value. Vacancies detract from the perception of success and a quality of life component, discouraging public foot traffic that is critical to the success of retail activity.
The city must take actions to reverse vacancy and blight. Key tools that communities have successfully used to combat vacancy and blight are:
• Data – Data sets are powerful tools when properly collected, analyzed, distributed and maintained. Data and technology help identify properties and track progress. Fundamentally, it gives the city an understanding of the scope of the problem, and improves its ability to ask for policy or funding help to fix it.
Best Practice: Data-Driven Strategies - New Orleans, LA According to the 2013 Annual Blight Reduction Strategy Report from the City of New Orleans, data-driven decision-making is a priority in order to ensure more effective, efficient services and to promote accountability and transparency. The City launched the following initiatives to improve the availability, quality, and utility of data: BlightSTAT: Launched in November 2010, BlightSTAT is a management program that allows New Orleans’ city leaders to review performance results related to the blight reduction strategy. Managers use data from BlightSTAT to identify solutions, make adjustments, and improve overall performance in the blight-reduction process.
Citizens are invited to monthly public meetings to ask questions and to provide input on how the City’s blight reduction programs can be improved. The BlightSTAT process helps to prioritize properties whose remediation have significant potential to stabilize a neighborhood. This is also facilitated from public stakeholders and local police precincts feedback during the monthly meetings.
Data and analyses are reported in the meetings by a variety of municipal entities, including the Department of Code Enforcement, Office of Community Development, Office of Information Technology and Innovation, Law Enforcement Department, and the New Orleans Redevelopment Authority.
New Land and Asset Management (LAMA) Information Technology System: In 2010, the City’s information technology systems were in disarray. Data on blighted properties were stored as paper records across multiple agencies. This lack of centralized data hindered the City from expediently alerting owners as to quality and zoning issues with their properties -- or from requesting owners to simply demolish them.
In order to improve efficiency, the City implemented a new information technology system called LAMA that allowed officials across all city departments to track, view, and update the steps taken on properties. In addition, the system allowed official to track all code enforcement and permit-issuance activities. Since the software’s implementation, blight reduction activities have proceeded with heightened efficiency1.
IEDC Technical Assistance Final Report – Pawtucket, Rhode Island 13
• Altering Local and State Policy to hold property owners accountable for ordinance violations or to facilitate sale or demolition of blighted property. Washington, DC implemented a blight tax in the late 1990s to address perpetually vacant and dilapidated buildings that landlords were ignoring or postponing redevelopment in light of potential speculative windfalls.
• Reverting To Green Spaces and Urban Agriculture • Land Banks to stabilize property values by removing excess properties from the market. Land banks also
assist partners to aggregate land where it can have the greatest impact on neighborhood stabilization. • Neighborhood Commerce – Establishing commercial uses for vacant property helps to reclaim the area
and plant seeds for future local economic growth. • Temporary Tenants and Merchandising. – Perception is reality – merchandising and cleaning up
window areas of vacant buildings can help to improve visual appeal. Vacant storefronts are often made available to local businesses and nonprofits for marketing – which helps to marginalize the impact.
• Enforcing Zoning – Proper and consistent enforcement of building codes and zoning regulations can effectively combat blight. As Pawtucket transitions to enforcement, it has to engage stakeholders throughout the duration, and set up a process of enforcement – from ticketing to transitions to new ownership.
This list is not tailored to Pawtucket, but gives some of the menu options with which Pawtucket can customize its own approach. Pawtucket’s strategy for reversing vacancy and blight should state which combination of these tools the city will employ and the timing or sequencing of their use.
1Best Practices taken from Case Studies in Addressing Neighborhood Vacancy and Blight, IEDC, July 2014. Full Report at http://restoreyoureconomy.org/wp-content/uploads/2014/08/Addressing-Vacancy-and-Blight.pdf
BEST PRACTICE: Neighborhood Commerce: REVOLVE DETROIT– Detroit, Michigan
REVOLVE is a collaborative program of the Detroit Economic Growth Corporation (DEGC) that partners with local leaders, building owners, entrepreneurs, and artists to activate vacant storefronts with transformational businesses and art installations. The goal of the program is to foster the evolution and vibrancy of Detroit's neighborhood business districts1.
At its core, REVOLVE uses “pop-ups” as a catalyst to accomplish three main objectives: 1) recruit and grow full-time tenants, 2) spark public and private investment, and 3) change the image and experience of neighborhood business districts. REVOLVE combines pop-up with other tools, such as incentives to support building restoration and technical assistance for entrepreneurs1.
According to REVOVLE pop-ups are the temporary use of an under-utilized space. Pop-ups allow an entrepreneur to test their business in a location for a month instead of a year (or more) that is usually required by a lease. It also creates the opportunity to make money, make adjustments, and prove to financers and landlords that a business can succeed. Building owners benefit from getting a prospective long-term tenant and unprecedented marketing1.
The organization works with building owners, entrepreneurs, and artists by connecting the two parties to transform a vacant space. When a property owner is identified or approaches REVOLVE they work to market the space and can place a call for pop-ups to fill the space. After recruiting applications they review the applications and work with the property owner to pick a good fit1.
Another resource REVOLVE offers to simplify the process is the REVOLVE Guidebook. The guidebook is designed for various stakeholders and is a one-stop shop for practical how-to information on working to revitalize Detroit neighborhoods. Information covers permits, sample agreements, checklists, financial resources, and much more.
To learn more about the REVOVLE model visit the Overview Chapter of their Guidebook.
IEDC Technical Assistance Final Report – Pawtucket, Rhode Island 14
Many communities face the challenge of finding support for infrastructure. Voters in Pawtucket have recently approved bonds to address infrastructure. The city will also need Tax Increment Financing to keep up with these needs. It must provide amenities, ensuring that the roads and sidewalks are in good shape, adding new (and low maintenance) amenities. The city has great partners in the downtown: committed workforce development partners, the downtown Community Development Corporation, and private and invested local developers. Local lenders have funds to lend, but lack qualified projects. There is pent-up demand to lend to credit-worthy developments.
But while there are loan funds, the gap between the cost of redevelopment and the return on investment continues to make redevelopment unfeasible. That gap was bridged in past years by state historic tax credits. Regardless of the type of development - residential, commercial or industrial – the public interest in providing some kind of tax credit program is getting historic and culturally valuable buildings occupied and returning value to the community.
The city has a potential partner in the Local Initiatives Support Corporation (LISC) that is dedicated to providing resources to community leaders for revitalizing neighborhoods.3 At the technical assistance meetings, the LISC representative expressed support for a revolving loan fund. LISC is a partner that can help the city with its strategy to provide gap financing that makes redevelopment of the downtown buildings feasible.
4. Implement Five Keys for Successful development A city builds credibility and momentum with successful developments. There are five keys to a successful development, and it is the city’s due diligence to ensure that the developments that receive public support are clearly analyzed relative to these keys and that those results are transparent to all involved. There should be no mystery about why the public is supporting a development.
• Marketing feasibility. The developer must provide the analysis of the market for the proposed development. The market analysis will have detail that allows the city and the public to evaluate the developer’s assumptions that underlie the prediction of success for the development. Such an analysis is also necessary for evaluation of the project’s financial feasibility.
• Financial feasibility. Pro forma review: the city must do due diligence and set a standard for return on investment, so as to properly evaluate requests for gap financing. This is important to assure taxpayers that the city is making decisions based on sound criteria and transparent policies.
• Consistency with community goals. Show how each targeted development strategy links back to the goals for the community.
• Broad public support. To do this the city must engage the community in the discussion of what it would like the city to be in 20 years. For example, there should be discussions about what amenities the community wants and the type of image the community would like to see, i.e. “modern and fresh,”
3 www.lisc.org
The Local Initiatives Support Corporation (LISC) is dedicated to helping community residents transform distressed neighborhoods into healthy and sustainable communities of choice and opportunity — good places to work, do business and raise children. LISC mobilizes corporate, government and philanthropic support to provide local community development organizations with:
• loans, grants and equity investments
• local, statewide and national policy support
• technical and management assistance
IEDC Technical Assistance Final Report – Pawtucket, Rhode Island 15
“quaint and historic,” “full of cultural amenities,” etc. Each development project is supported by its connection to this vision and the needs of the community. The city must perform this process for each individual development project. The public must understand what is happening, what it is gaining, and potentially what some of the losses or tradeoffs as likely to be.
• Experienced developers. The city must strive to attract experienced developers who understand the complexities of financing, the complexities of partnerships, etc. Experienced developers will be more likely to invest when there is public support. An experienced developer will not risk opportunity costs – i.e. devoting time and money to a project that is not likely to receive public support.
Rethink Downtown Pawtucket is part of a larger metropolitan region. The downtown no longer serves the shopping mall consumer. Downtowns are finding success in diversity and alternative markets. Pawtucket has already benefited from this with the successful live/work mill redevelopments. Another market well worth exploring is the young 20-somethings, also known as “millennials.” Another approach is to explore how the downtown might build upon the strengths of its diverse population. Pawtucket will also want to rethink downtown in terms of creating bridges between its pockets of success, such as the River Mill apartments, and its vacancies and blight. Organize downtown advocacy so that the city can focus on three to five of the most promising strategies and fully support them. Strategically activate by doing key events well.
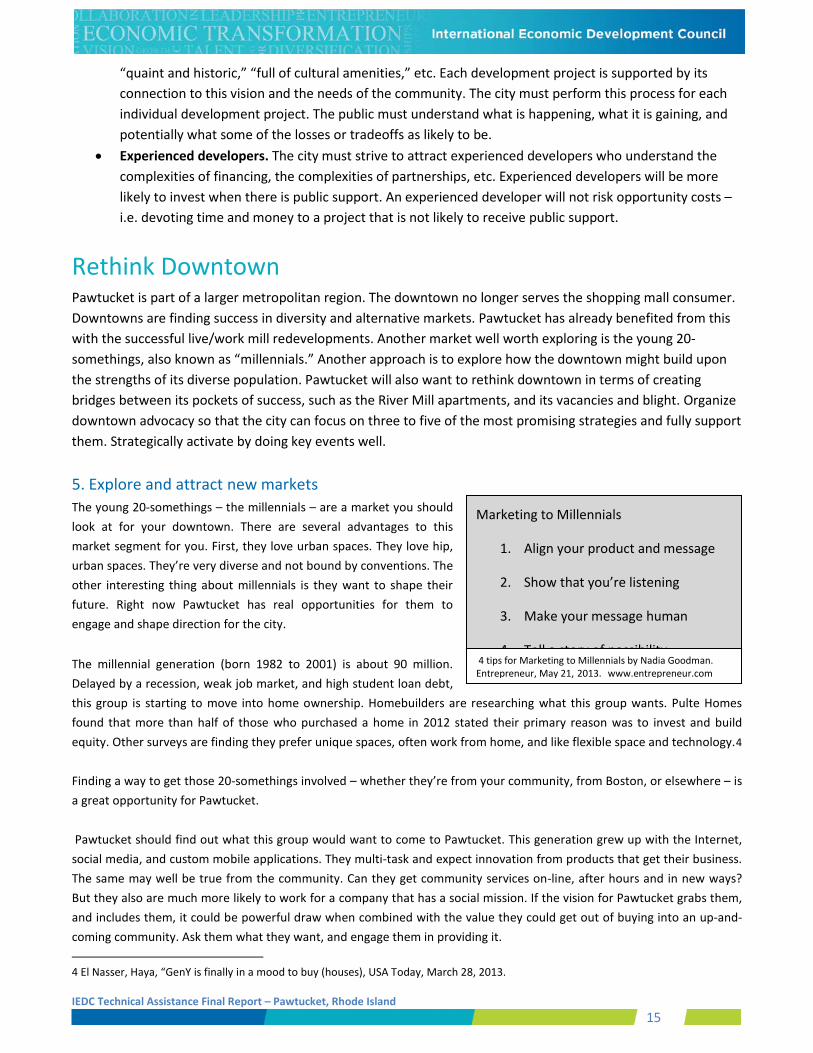
5. Explore and attract new markets The young 20-somethings – the millennials – are a market you should look at for your downtown. There are several advantages to this market segment for you. First, they love urban spaces. They love hip, urban spaces. They’re very diverse and not bound by conventions. The other interesting thing about millennials is they want to shape their future. Right now Pawtucket has real opportunities for them to engage and shape direction for the city. The millennial generation (born 1982 to 2001) is about 90 million. Delayed by a recession, weak job market, and high student loan debt, this group is starting to move into home ownership. Homebuilders are researching what this group wants. Pulte Homes found that more than half of those who purchased a home in 2012 stated their primary reason was to invest and build equity. Other surveys are finding they prefer unique spaces, often work from home, and like flexible space and technology.4 Finding a way to get those 20-somethings involved – whether they’re from your community, from Boston, or elsewhere – is a great opportunity for Pawtucket. Pawtucket should find out what this group would want to come to Pawtucket. This generation grew up with the Internet, social media, and custom mobile applications. They multi-task and expect innovation from products that get their business. The same may well be true from the community. Can they get community services on-line, after hours and in new ways? But they also are much more likely to work for a company that has a social mission. If the vision for Pawtucket grabs them, and includes them, it could be powerful draw when combined with the value they could get out of buying into an up-and-coming community. Ask them what they want, and engage them in providing it. 4 El Nasser, Haya, “GenY is finally in a mood to buy (houses), USA Today, March 28, 2013.
Marketing to Millennials
1. Align your product and message
2. Show that you’re listening
3. Make your message human
4. Tell a story of possibility 4 tips for Marketing to Millennials by Nadia Goodman. Entrepreneur, May 21, 2013. www.entrepreneur.com
IEDC Technical Assistance Final Report – Pawtucket, Rhode Island 16
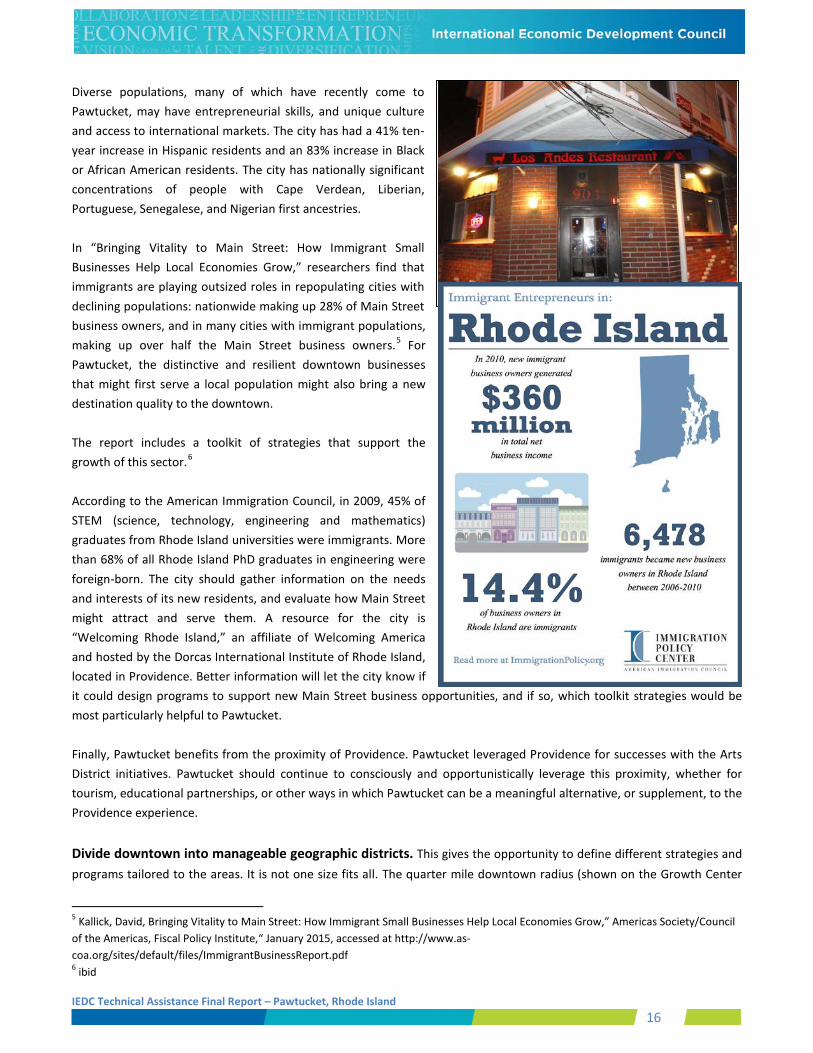
Diverse populations, many of which have recently come to Pawtucket, may have entrepreneurial skills, and unique culture and access to international markets. The city has had a 41% ten-year increase in Hispanic residents and an 83% increase in Black or African American residents. The city has nationally significant concentrations of people with Cape Verdean, Liberian, Portuguese, Senegalese, and Nigerian first ancestries. In “Bringing Vitality to Main Street: How Immigrant Small Businesses Help Local Economies Grow,” researchers find that immigrants are playing outsized roles in repopulating cities with declining populations: nationwide making up 28% of Main Street business owners, and in many cities with immigrant populations, making up over half the Main Street business owners.5 For Pawtucket, the distinctive and resilient downtown businesses that might first serve a local population might also bring a new destination quality to the downtown. The report includes a toolkit of strategies that support the growth of this sector.6 According to the American Immigration Council, in 2009, 45% of STEM (science, technology, engineering and mathematics) graduates from Rhode Island universities were immigrants. More than 68% of all Rhode Island PhD graduates in engineering were foreign-born. The city should gather information on the needs and interests of its new residents, and evaluate how Main Street might attract and serve them. A resource for the city is “Welcoming Rhode Island,” an affiliate of Welcoming America and hosted by the Dorcas International Institute of Rhode Island, located in Providence. Better information will let the city know if it could design programs to support new Main Street business opportunities, and if so, which toolkit strategies would be most particularly helpful to Pawtucket. Finally, Pawtucket benefits from the proximity of Providence. Pawtucket leveraged Providence for successes with the Arts District initiatives. Pawtucket should continue to consciously and opportunistically leverage this proximity, whether for tourism, educational partnerships, or other ways in which Pawtucket can be a meaningful alternative, or supplement, to the Providence experience. Divide downtown into manageable geographic districts. This gives the opportunity to define different strategies and programs tailored to the areas. It is not one size fits all. The quarter mile downtown radius (shown on the Growth Center
5 Kallick, David, Bringing Vitality to Main Street: How Immigrant Small Businesses Help Local Economies Grow,” Americas Society/Council of the Americas, Fiscal Policy Institute,“ January 2015, accessed at http://www.as-coa.org/sites/default/files/ImmigrantBusinessReport.pdf 6 ibid
IEDC Technical Assistance Final Report – Pawtucket, Rhode Island 17
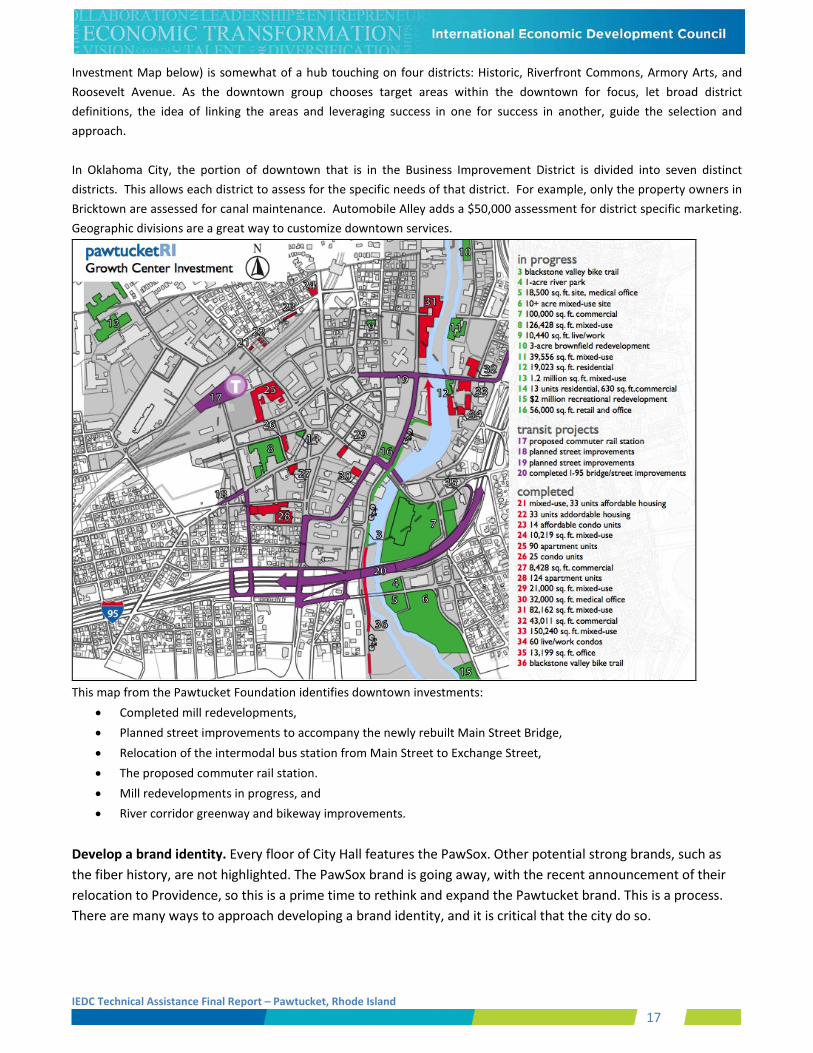
Investment Map below) is somewhat of a hub touching on four districts: Historic, Riverfront Commons, Armory Arts, and Roosevelt Avenue. As the downtown group chooses target areas within the downtown for focus, let broad district definitions, the idea of linking the areas and leveraging success in one for success in another, guide the selection and approach. In Oklahoma City, the portion of downtown that is in the Business Improvement District is divided into seven distinct districts. This allows each district to assess for the specific needs of that district. For example, only the property owners in Bricktown are assessed for canal maintenance. Automobile Alley adds a $50,000 assessment for district specific marketing. Geographic divisions are a great way to customize downtown services.
This map from the Pawtucket Foundation identifies downtown investments:
• Completed mill redevelopments, • Planned street improvements to accompany the newly rebuilt Main Street Bridge, • Relocation of the intermodal bus station from Main Street to Exchange Street, • The proposed commuter rail station. • Mill redevelopments in progress, and • River corridor greenway and bikeway improvements.
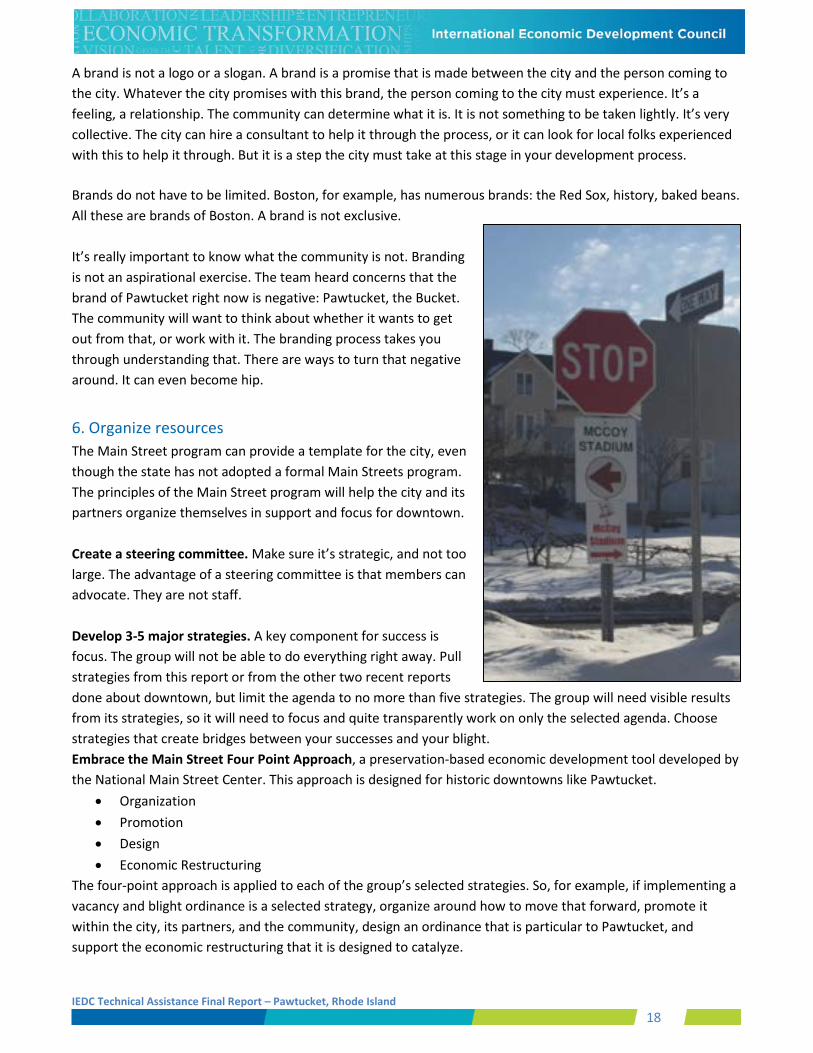
Develop a brand identity. Every floor of City Hall features the PawSox. Other potential strong brands, such as the fiber history, are not highlighted. The PawSox brand is going away, with the recent announcement of their relocation to Providence, so this is a prime time to rethink and expand the Pawtucket brand. This is a process. There are many ways to approach developing a brand identity, and it is critical that the city do so.
IEDC Technical Assistance Final Report – Pawtucket, Rhode Island 18
A brand is not a logo or a slogan. A brand is a promise that is made between the city and the person coming to the city. Whatever the city promises with this brand, the person coming to the city must experience. It’s a feeling, a relationship. The community can determine what it is. It is not something to be taken lightly. It’s very collective. The city can hire a consultant to help it through the process, or it can look for local folks experienced with this to help it through. But it is a step the city must take at this stage in your development process. Brands do not have to be limited. Boston, for example, has numerous brands: the Red Sox, history, baked beans. All these are brands of Boston. A brand is not exclusive. It’s really important to know what the community is not. Branding is not an aspirational exercise. The team heard concerns that the brand of Pawtucket right now is negative: Pawtucket, the Bucket. The community will want to think about whether it wants to get out from that, or work with it. The branding process takes you through understanding that. There are ways to turn that negative around. It can even become hip.
6. Organize resources The Main Street program can provide a template for the city, even though the state has not adopted a formal Main Streets program. The principles of the Main Street program will help the city and its partners organize themselves in support and focus for downtown. Create a steering committee. Make sure it’s strategic, and not too large. The advantage of a steering committee is that members can advocate. They are not staff. Develop 3-5 major strategies. A key component for success is focus. The group will not be able to do everything right away. Pull strategies from this report or from the other two recent reports done about downtown, but limit the agenda to no more than five strategies. The group will need visible results from its strategies, so it will need to focus and quite transparently work on only the selected agenda. Choose strategies that create bridges between your successes and your blight. Embrace the Main Street Four Point Approach, a preservation-based economic development tool developed by the National Main Street Center. This approach is designed for historic downtowns like Pawtucket.
• Organization • Promotion • Design • Economic Restructuring
The four-point approach is applied to each of the group’s selected strategies. So, for example, if implementing a vacancy and blight ordinance is a selected strategy, organize around how to move that forward, promote it within the city, its partners, and the community, design an ordinance that is particular to Pawtucket, and support the economic restructuring that it is designed to catalyze.
IEDC Technical Assistance Final Report – Pawtucket, Rhode Island 19
_____________________________________________________________________________________ The Main Street Four Point Approach, as presented at www.preservationnation.org:
Organization
Organization establishes consensus and cooperation by building partnerships among the various groups that have a stake in the commercial district. The most effective Main Street programs get everyone working toward the same goal. With this level of collaboration, your Main Street program can provide effective, ongoing management and advocacy for your downtown or neighborhood business district. Through volunteer recruitment and collaboration with partners representing a broad cross section of the community, your program can incorporate a wide range of perspectives into its efforts. A governing board of directors and standing committees make up the fundamental organizational structure of volunteer-driven revitalization programs. Volunteers are coordinated and supported by a paid program director. This structure not only divides the workload and clearly delineates responsibilities, but also builds consensus and cooperation among the various stakeholders.
Promotion
Promotion takes many forms, but the goal is to create a positive image that will renew community pride and tell your Main Street story to the surrounding region. The techniques we teach, and the variety of tools at your disposal, will help to rekindle the vitality of your community. Promotions communicate your commercial district's unique characteristics, its cultural traditions, architecture, and history and activities to shoppers, investors, potential business and property owners, and visitors.
Design
Design means getting Main Street into top physical shape and creating a safe, preserving a place's historic character, inviting environment for shoppers, workers, and visitors. Successful Main Streets take advantage of the visual opportunities inherent in a commercial district by directing attention to all of its physical elements: public and private buildings, storefronts, signs, public spaces, parking areas, street furniture, public art, landscaping, merchandising, window displays, and promotional materials. An appealing atmosphere, created through attention to all of these visual elements, conveys a positive message about the commercial district and what it has to offer. Popular design activities also include instilling good maintenance practices in the
IEDC Technical Assistance Final Report – Pawtucket, Rhode Island 20
commercial district, enhancing the district's physical appearance through the rehabilitation of historic buildings, encouraging appropriate new construction, developing sensitive design management systems, educating business and property owners about design quality, and long-term planning.
Economic Restructuring
Through economic restructuring, we can show you how to strengthen your community's existing economic assets while diversifying its economic base. Successful communities accomplish this by evaluating how to retain and expand successful businesses to provide a balanced commercial mix, sharpening the competitiveness and merchandising skills of business owners, and attracting new businesses that the market can support. Many Main Street programs also achieve success through creative reuse of historic properties. Converting unused or underused commercial space into economically productive property also helps boost the profitability of the district. The goal is to build a commercial district that responds to the needs of today's consumers while maintaining the community’s historic character.
_____________________________________________________________________________________ As the downtown group applies these four points to each major strategies, it breaks things down into more manageable pieces, while ensuring that each focus area gets the ingredients necessary for success. Only take on as many strategies as the group can completely support. Façade programs are often used to improve the look of the downtown district, with funding as part of a BID district, or with Community Development Block Grant (CDBG) funding. The incentive may be a matching grant or a zero percent loan with repayment deferred until sale of the property. An architect, or design school students, should identify ways in which to strengthen the consistency of the look and feel of the area buildings, and these become guidelines for expenditures through the program. The program should be part of the defined focused downtown strategy, however, and Pawtucket may find that initially this program is not the priority.
Facade Improvement Program Guidelines and Application, City of Cambridge, MA
The City of Cambridge Community Development Department (CDD) has established a Façade, Signage and Lighting Improvement Program that provides technical and financial assistance to property owners or business tenants seeking to renovate or restore their exterior signage, lighting or commercial building facades. The Program’s objectives are to improve the physical appearance of independent businesses and enhance the commercial districts.
The Program provides a matching grant for funding of well-designed improvements that will coordinate all the important features of the storefront into a more attractive image while creating, if necessary, an accessible entrance for the public. This may include the restoration of architectural details, better windows and doors, and well-proportioned signage and lighting. Past reimbursement grants have ranged from $2,500 to $35,000 based on scope of work and available funds. Reimbursement grants vary each year so contact CDD for further information.
A consultant retained by the City will be available to provide assistance to applicants through the conceptual design stage at no cost to the applicants. Applicants, however, will be responsible to hire licensed architects and contractors to refine this conceptual design depending on the scope of work.
More information about the Facade, Signage and Lighting Improvement Program. Storefront Improvement Program Guidelines and Application Source:http://www.cambridgema.gov/permitsandapplications/detail.aspx?path=%2fsitecore%2fcontent%2fhome%2fCDD%2fForms%2fForms%2fF%2ffacadeapp
IEDC Technical Assistance Final Report – Pawtucket, Rhode Island 21
Designate (or hire) a downtown advocate. Someone needs to be the point person for downtown.
7. Strategically Activate Enhance the Arts Festival. Develop a business plan for the Arts Festival. If it’s to be a multi-week event, it needs to produce income and become self-sustaining. This event resembles the Fringe Festivals that are occurring internationally, increasingly in the United States. Consider associating with international Fringe Festival to leverage the branding and promotion of that event as well as the organizational models.
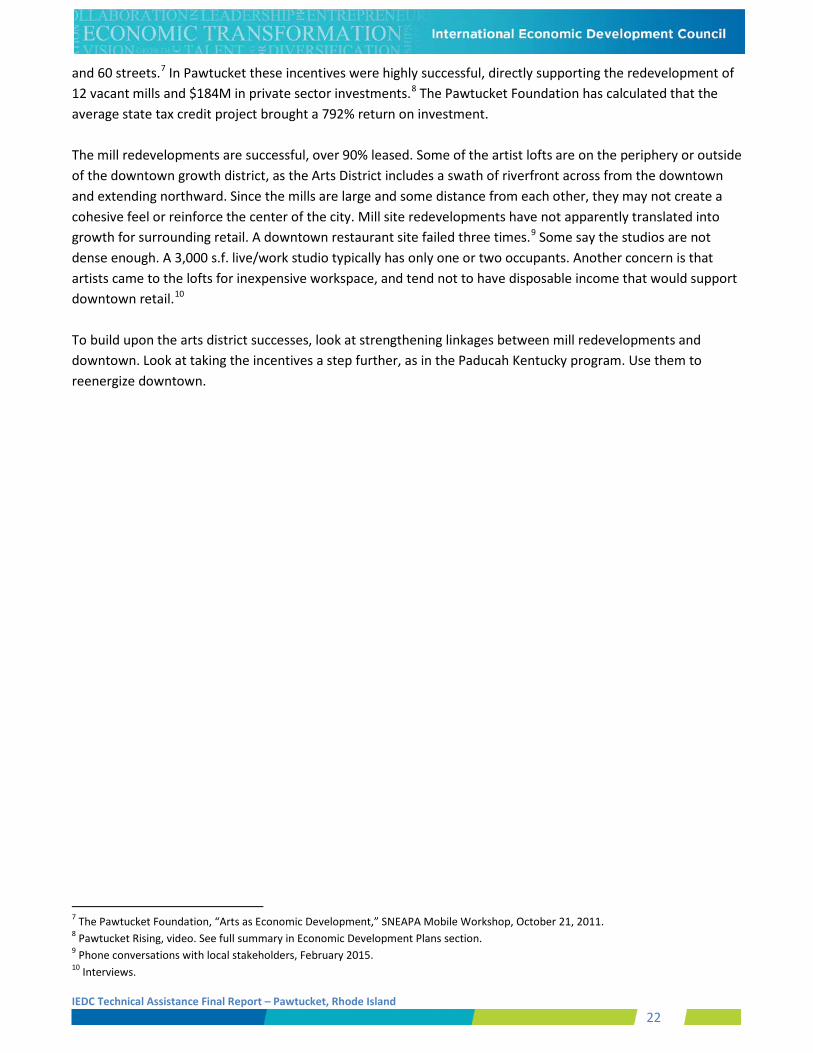
The city needs to focus on quality over quantity. If the Arts Festival is a signature event, focus your energies there and make it grow. Utilize tactical urbanism. The Pawtucket Foundation created an example of this at the top of Main Street with the chalk wall: “in my lifetime....” It’s low cost: lighter, cheaper, quicker. Parking days, better blocks are two great examples of tactical urbanism. The key to it is to tell people it’s there. Social media is the best way to do this. The city has to activate its installations. The installations should also be aligned with the overall economic strategy. They should reinforce the city’s brand, target its markets, and help activate focus areas. Re-energize Arts District incentives
In 1998 the state established eight arts districts, including one in Pawtucket, to stimulate redevelopment of the large inventory of mill complexes throughout the state into live/work artist spaces. Incentives included exemption from state income tax on certified artist residents and exemption from sales tax on goods produced. Additionally the state provided tax credits for redevelopment. The Pawtucket Arts District encompasses 23 mills
Chalk Wall, Pawtucket RI
Fringe Festivals Providing artists an affordable space is a key role for fringe festivals. The events are generally not juried or curated, and anyone can participate if they pay the registration fee.
The Fringe sees itself as a provider of services that facilitate artist-driven initiatives. For example, the Festival runs its own box office, Fringe Tix; all bookings are controlled through this central system which gives artists accurate figures on the numbers of bookings for every show, as well as detailed information about audience profile and booking patterns. Several guides are available to assist artists and producers to register themselves, book and manage venues, access technical, marketing and media information, and participate successfully by maximizing both the media interest and box office outcomes of their event. This study finds that Fringe artists value the Fringe for the opportunities it provides to take an active role in the creation and management of their professional lives.1
IEDC Technical Assistance Final Report – Pawtucket, Rhode Island 22
and 60 streets.7 In Pawtucket these incentives were highly successful, directly supporting the redevelopment of 12 vacant mills and $184M in private sector investments.8 The Pawtucket Foundation has calculated that the average state tax credit project brought a 792% return on investment. The mill redevelopments are successful, over 90% leased. Some of the artist lofts are on the periphery or outside of the downtown growth district, as the Arts District includes a swath of riverfront across from the downtown and extending northward. Since the mills are large and some distance from each other, they may not create a cohesive feel or reinforce the center of the city. Mill site redevelopments have not apparently translated into growth for surrounding retail. A downtown restaurant site failed three times.9 Some say the studios are not dense enough. A 3,000 s.f. live/work studio typically has only one or two occupants. Another concern is that artists came to the lofts for inexpensive workspace, and tend not to have disposable income that would support downtown retail.10 To build upon the arts district successes, look at strengthening linkages between mill redevelopments and downtown. Look at taking the incentives a step further, as in the Paducah Kentucky program. Use them to reenergize downtown.
7 The Pawtucket Foundation, “Arts as Economic Development,” SNEAPA Mobile Workshop, October 21, 2011. 8 Pawtucket Rising, video. See full summary in Economic Development Plans section. 9 Phone conversations with local stakeholders, February 2015. 10 Interviews.
IEDC Technical Assistance Final Report – Pawtucket, Rhode Island 23
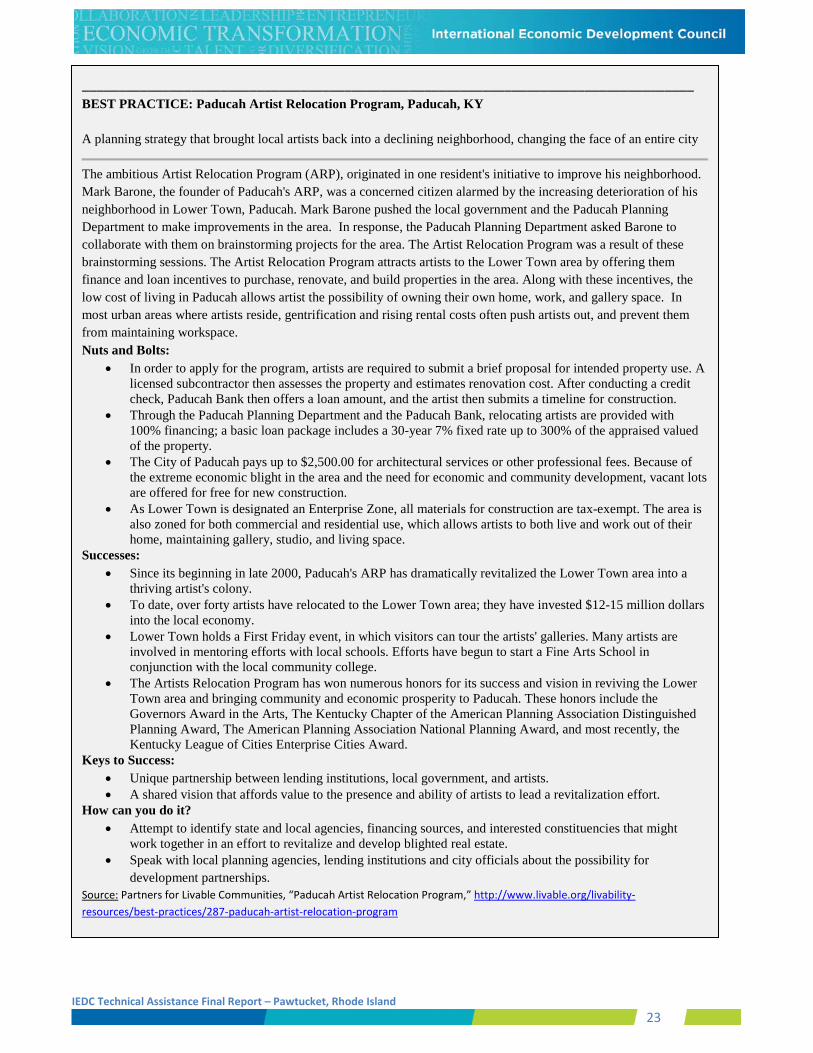
____________________________________________________________________________________ BEST PRACTICE: Paducah Artist Relocation Program, Paducah, KY A planning strategy that brought local artists back into a declining neighborhood, changing the face of an entire city
The ambitious Artist Relocation Program (ARP), originated in one resident's initiative to improve his neighborhood. Mark Barone, the founder of Paducah's ARP, was a concerned citizen alarmed by the increasing deterioration of his neighborhood in Lower Town, Paducah. Mark Barone pushed the local government and the Paducah Planning Department to make improvements in the area. In response, the Paducah Planning Department asked Barone to collaborate with them on brainstorming projects for the area. The Artist Relocation Program was a result of these brainstorming sessions. The Artist Relocation Program attracts artists to the Lower Town area by offering them finance and loan incentives to purchase, renovate, and build properties in the area. Along with these incentives, the low cost of living in Paducah allows artist the possibility of owning their own home, work, and gallery space. In most urban areas where artists reside, gentrification and rising rental costs often push artists out, and prevent them from maintaining workspace. Nuts and Bolts:
• In order to apply for the program, artists are required to submit a brief proposal for intended property use. A licensed subcontractor then assesses the property and estimates renovation cost. After conducting a credit check, Paducah Bank then offers a loan amount, and the artist then submits a timeline for construction.
• Through the Paducah Planning Department and the Paducah Bank, relocating artists are provided with 100% financing; a basic loan package includes a 30-year 7% fixed rate up to 300% of the appraised valued of the property.
• The City of Paducah pays up to $2,500.00 for architectural services or other professional fees. Because of the extreme economic blight in the area and the need for economic and community development, vacant lots are offered for free for new construction.
• As Lower Town is designated an Enterprise Zone, all materials for construction are tax-exempt. The area is also zoned for both commercial and residential use, which allows artists to both live and work out of their home, maintaining gallery, studio, and living space.
Successes: • Since its beginning in late 2000, Paducah's ARP has dramatically revitalized the Lower Town area into a
thriving artist's colony. • To date, over forty artists have relocated to the Lower Town area; they have invested $12-15 million dollars
into the local economy. • Lower Town holds a First Friday event, in which visitors can tour the artists' galleries. Many artists are
involved in mentoring efforts with local schools. Efforts have begun to start a Fine Arts School in conjunction with the local community college.
• The Artists Relocation Program has won numerous honors for its success and vision in reviving the Lower Town area and bringing community and economic prosperity to Paducah. These honors include the Governors Award in the Arts, The Kentucky Chapter of the American Planning Association Distinguished Planning Award, The American Planning Association National Planning Award, and most recently, the Kentucky League of Cities Enterprise Cities Award.
Keys to Success: • Unique partnership between lending institutions, local government, and artists. • A shared vision that affords value to the presence and ability of artists to lead a revitalization effort.
How can you do it? • Attempt to identify state and local agencies, financing sources, and interested constituencies that might
work together in an effort to revitalize and develop blighted real estate. • Speak with local planning agencies, lending institutions and city officials about the possibility for
development partnerships. Source: Partners for Livable Communities, “Paducah Artist Relocation Program,” http://www.livable.org/livability-resources/best-practices/287-paducah-artist-relocation-program
IEDC Technical Assistance Final Report – Pawtucket, Rhode Island 24
Enhance Marketing: Tell Your Story Marketing can be used to help attract, retain and expand businesses, improve a community’s image both inside and outside the community and promote policies and programs. Marketing, however, is neither an end in itself nor is it a panacea. It cannot make up for a community’s shortcomings. Rather, marketing is a tool to help economic development practitioners reach their short and long-term economic goals. Similar to what marketing can do for a community, it can also do for neighborhoods and downtowns. Marketing can help re-brand the community and the downtown. In the new economy, many regions need to change the images that often endure, even though an economy has restructured. For example, Pittsburgh, once synonymous with the steel industry, has invested in a new high-tech image. Re-position Pawtucket
Marketing is positioning a product, and currently Pawtucket and the downtown need to re-position its product. Marketing is not strictly advertising or selling, although these are perhaps the most visible elements. Marketing entails:
• Identifying and meeting the customer’s needs. • Developing a message to communicate a community’s attributes. • Persuading potential investors to “buy” the product.
Positioning involves distinguishing a product from the competition. The three main distinctions marketers can make are: product differentiation, price competitiveness, and market focus such as geographic region or audience. The three are not mutually exclusive; a marketer can make more than one distinction in its marketing efforts. For example, a marketer can target a certain region in a state or a specific audience such as high tech manufacturers and offer a low-cost product or service such as low business tax rates or lower wages. Product Differentiation: Developing resources and/or an image that is distinct from competing communities such as a skilled workforce, geographic advantage, core industries, or unique R & D activities. Price Competitiveness: Having the comparatively low cost of doing business such as lower labor and land costs, lower tax and utility rates, incentives that reduce operation costs and so forth. The stress here is on cost over the quality of production factors, resources or services. Market Focus: Targeting a particular industry sector such as plastics or geographic area such as local, state, regional, national or international markets. Economic development marketing occurs for a variety of purposes. Business recruitment is the most common objective, but quite often, economic developers find themselves marketing to organizations and people within their region. Looking at the current position of Pawtucket and the Downtown, City and partners need to re-position its marketing and image in a more economically attractive manner with the three distinctive marketing means. Currently, the Pawtucket Foundation is trying to do such by targeting marketing at Millennials to live in downtown Pawtucket. Expanding upon this strategy to develop a complete marketing strategy with the target audience can assist in re-positioning the downtown and bring new development and a new sense of hope and community pride among residents.
IEDC Technical Assistance Final Report – Pawtucket, Rhode Island 25
8. Be proactive and deliberate with marketing strategy A community which haphazardly markets itself, its downtown, or neighborhoods using generalized presentations instead of developing a marketing strategy that targets industries as part of its overall vision of the local economy, does not promote the community’s overall economic development goals, broader economic environment or its competitiveness. These approaches are reactive rather than proactive to the community’s economic development. Developing a marketing strategy for the downtown and focus areas of Pawtucket can ensure the city will be proactive with its marketing instead of reactive. A marketing strategy provides a guide for all marketing activities. The strategy outlines a means for achieving the marketing goals, the specific activities and timetables to realize those goals, as well as the financial resources and staff needed to support the activities, and finally how to evaluate the effectiveness of those activities. Any neighborhood or focused area marketing strategy should be compatible with the overall community marketing strategy. A marketing strategy typically includes the following elements:
• Mission Statement – Mission of the Organization • Situation Analysis – Overview of local strengths, weaknesses, opportunities and threats • Goal & Objectives – Established list created during planning process • Target Markets – Lists and describe their needs and preferences, and their potential benefit to the
community • Strategy – Delineates how the community will achieve its goals, its promotional strategies, its budget
sources and the use of funds • Implementation and Measurements – Documents schedules, responsibilities, and benchmarks • Appendix – Provides supporting documents
Developing and writing a Marketing Plan may seem time-consuming and unnecessary, however, it is imperative. A Marketing Plan:
• Communicates to the community, government officials and board members what the organization is trying to achieve, why, and how it will do it.
• Provides a guide for management actions and resource allocations. • Allows the organization to shape its future rather than react to situations as they arise. • Coordinates activities of different members of the marketing effort. • Provides a control system to monitor deviations from assumptions that underlie the plan, as well as
results, that do not meet targeted goals. • Provides justification for funding; the plan lays out how funds will be spent and the expected return on
the investment.11
The Marketing Plan process consists of: • Pre-planning: Initiate and organize the strategic planning process. Identify the players and stakeholders
to be involved in the process, the context in which the strategic plan will be conducted and define the area to be assessed.
• Assessing the local community and economic competitiveness: Profile and assess the economic environment, community resources and barriers to local development. Look at the strengths, weaknesses, opportunities and threats of the area involved as well as an analysis of the local economy and trends.
11 Economic Development Marketing and Attraction Manual, International Economic Development Council, 2006.
IEDC Technical Assistance Final Report – Pawtucket, Rhode Island 26
• Formulating realistic goals, objectives, and strategies: Identify feasible growth options, given the external environment and internal opportunities and constraints. Develop goals and objectives based on assessment.
• Identifying, evaluating, and prioritizing projects. Identify potential projects to maximize or create opportunities, or minimize threats to achieve economic goals and prioritize the projects based on the best approach and return on the project.
• Developing plans of action: Set out the sequence of events and resources necessary to achieve the goals, including overhead, staff, information and financial capital. Includes defining the physical steps that can lead to accomplishing the set goals.
• Implementing those plans: Carrying out action plans. • Monitoring and evaluating outcomes: Monitor and measure the effectiveness of the plan and related
programs and adjust the plan to meet changing conditions. Make sure goals and projects remain realistic and are worthwhile to carry out while still fitting into the changing economy.
• Retooling and adjusting: Adjust the plan regularly to meet changing conditions and outcomes.12
9. Enhance communication and promote the downtown and community The marketing strategy will include tools and goals on how to enhance communications and promote the downtown and the community overall. The IEDC team would like to stress the importance of this with this separate recommendation.
12 Ibid
Highlight: Washington DC Marketing Campaign In the 1990’s when DC was under receivership, a committee comprised of real estate professionals collaborated to create a marketing campaign to market the city to potential businesses. The campaign was driven by the approach that a continual and consistent message would make inroads with the target audiences. The messaging centered around metrics that demonstrated economic growth, economic stability, and market potential (Residential base and percentage of growth; education levels of residents; education levels of workforce; daytime population; average worker income; and revenue generation (tax, sales). The committee, part of the DC Building Industry Association, provided these metrics and other relevant information to landlords in the downtown market and adjacent submarkets as well as elected and civic leaders. This effort morphed into a retail centric strategy used to market DC to retailers as part of a broader effort to enhance the quality of life for residents and potential employers. The retail campaign – The Retail Initiative – was formalized and funded as one of the first responsibilities of a citywide marketing organization charged with economic development market and business attraction - The DC Marketing Center. Initially, for the first four years, the DC Marketing Center was funded by private and institutional partners. Once there were measurable results (year 5), the City committed a permanent funding stream to the center which then changed its name (and legal status) to the Washington DC Economic Partnership (WDCEP). Combined the organizations have influenced more than 2 million square feet of new retail in the city, the creation of over 3.500 jobs, and helped to attract hundred of new residents.
IEDC Technical Assistance Final Report – Pawtucket, Rhode Island 27
Enhancing communication from a downtown organization and the city will help market and promote both areas. Think about where to spread positive news and opportunities in Pawtucket, and develop ways to get information there. Media outlets, both local and regional, always need information and stories. The city and downtown organization should develop relationships with the media and feed these outlets with positive stories as often as possible. Possible stories to develop include new businesses to the community, expanding businesses, milestones, and achievements. Milestones such as the National Park designation, any partnerships the city makes that can enhance the community, and anniversaries of businesses being open should all be announced. With announcements, a wide breadth of media should be used, such as social media outlets of Twitter, LinkedIn, Facebook, and standard communication such as flyers, press releases or newsletters. Expanding on possible communication outlets: Press Releases: News releases are an important means to keep the press informed and up to date about a market, and can be used to encourage newspaper and magazine editors to print articles about the community in general or about a particular project. Trade journals can be an excellent vehicle for press releases in the target industries a community has identified. Press releases should be newsworthy, but also can be used for perception management. Topics might include new business openings or expansions, financial milestones such as bond rating changes, market and demographic changes – residential growth, rental growth, and job creation, as well as announcements of regarding launch and enhancement of business incentives or reduction in disincentives. Social Media: Social media has proven a very effective tool to reach targeted audiences. Twitter, Facebook, even Pinterest can be used to push out news and releases as well as announce events and milestones. Twitter provides and easy way to capture the attention of individual writers and media sources as well as broader communities, especially millennials. This can also be effective to market individual businesses in the downtown whether announcing a sale, a new product or an opening. Op-Eds/Letters to the Editor: Write opinion pieces and letters to the editor regularly in response to local issues to promote the community or specific projects. Encourage community leaders and residents to contribute pieces regularly Media Events: Coordinate media coverage for conferences, forums, ribbon cuttings, deal signings and other events, and develop activities at these events that will draw the media. Pawtucket Hashtag: Build a hashtag around Pawtucket that can be used in all announcements. This helps build the brand and identity. To activate a lively and useful Pawtucket hashtag, engage public and private partners in using the hashtag as well.
IEDC Technical Assistance Final Report – Pawtucket, Rhode Island 28
Define Roles, Develop Partnerships Pawtucket is well aware of the usefulness of public private partnership. The Pawtucket Foundation, supported by the business and philanthropic community, acts in partnership with the city as the city’s economic development arm. The IEDC advisory team, however, heard a desire for greater clarity about roles.
10. Clearly define roles and responsibilities While many cities staff economic development from within city government, a business and community supported nonprofit organization like the foundation is not uncommon. Private economic development organizations have greater flexibility than public EDOs to conduct economic development activities because of the inclusion of private funds and a non-elected board. In Pawtucket, the foundation has been able to further strong planning and marketing for the city. The discomfort the advisory team heard may come from the fact that while the foundation and the city inevitably overlap and work together, they have not formally aligned their missions and activities. The foundation and the city should consider ways to strengthen accountability and communication between the organizations. Successful public-private economic development organizations generally have:
• A clearly defined mission that addresses the concerns of both the private and public sectors; • Consensus among members regarding how to implement the mission; • The commitment of both the public and private sector reflected by an adequate level of funding to
achieve goals; • A validation system designed to establish and monitor performance objectives to measure success,
determine change-of-course program modifications, and to justify continued support and funding. In its 2015-2017 Strategic Plan, the Pawtucket Foundation expresses a vision, and core values to guide its actions. It’s important that economic development furthers a vision of the entire community. A great way to ensure that the vision is authentic, expansive and inclusive would be to refine it as part of the branding exercise. Pawtucket’s elected leaders should endorse the vision that guides the economic strategy. The city and the foundation can coordinate their efforts within the advisory team’s recommendation to appoint a Downtown Committee. These should be people who have a stake in the commercial success of the downtown. The Mayor should appoint this committee. Its members should likely be the following:
• A real estate professional • A banker • The Pawtucket Foundation • Planning Director • LISC • The Pawtucket CDC • The Pawtucket Housing Authority • A representative from the Arts Community • A property owner • A downtown business person • Two residents of the downtown neighborhoods
Use the Main Street Four Point approach to guide the development of the committee. This committee can be the vehicle to ensure that the vision is inclusive, and develop the city’s brand.
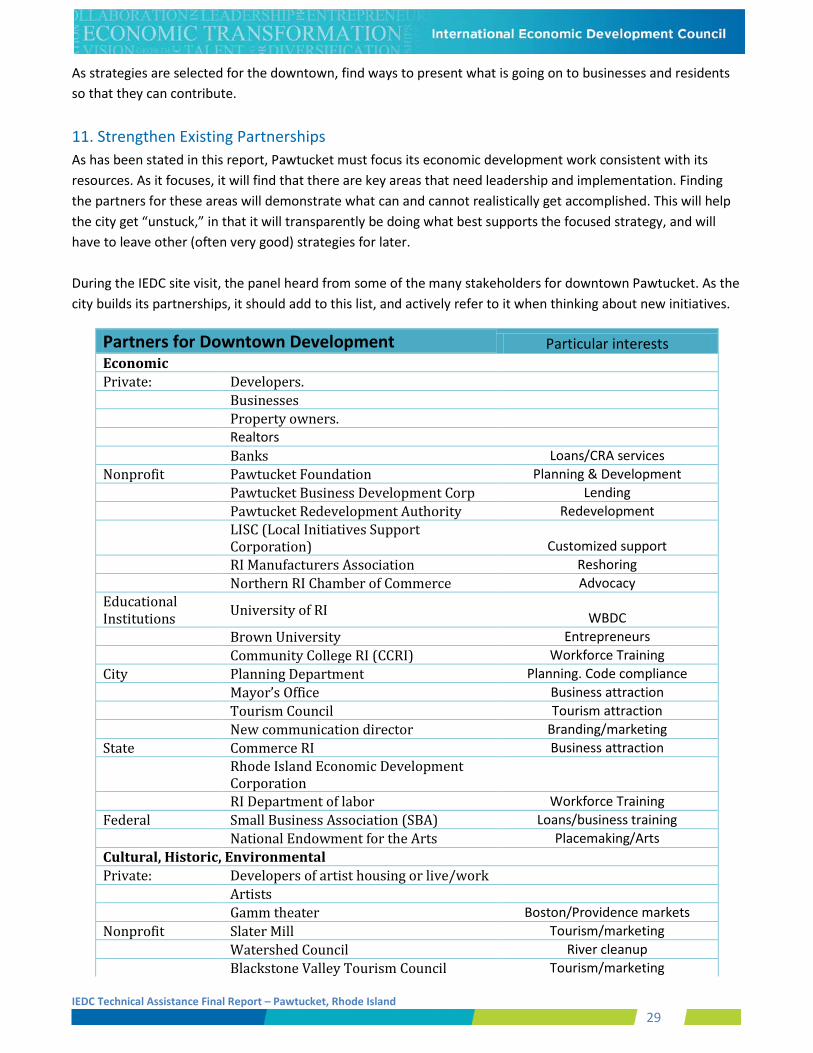
IEDC Technical Assistance Final Report – Pawtucket, Rhode Island 29
As strategies are selected for the downtown, find ways to present what is going on to businesses and residents so that they can contribute.
11. Strengthen Existing Partnerships As has been stated in this report, Pawtucket must focus its economic development work consistent with its resources. As it focuses, it will find that there are key areas that need leadership and implementation. Finding the partners for these areas will demonstrate what can and cannot realistically get accomplished. This will help the city get “unstuck,” in that it will transparently be doing what best supports the focused strategy, and will have to leave other (often very good) strategies for later. During the IEDC site visit, the panel heard from some of the many stakeholders for downtown Pawtucket. As the city builds its partnerships, it should add to this list, and actively refer to it when thinking about new initiatives.
Partners for Downtown Development Particular interests Economic Private: Developers. Businesses Property owners. Realtors Banks Loans/CRA services Nonprofit Pawtucket Foundation Planning & Development Pawtucket Business Development Corp Lending Pawtucket Redevelopment Authority Redevelopment
LISC (Local Initiatives Support Corporation) Customized support
RI Manufacturers Association Reshoring Northern RI Chamber of Commerce Advocacy Educational Institutions University of RI WBDC Brown University Entrepreneurs Community College RI (CCRI) Workforce Training City Planning Department Planning. Code compliance Mayor’s Office Business attraction Tourism Council Tourism attraction New communication director Branding/marketing State Commerce RI Business attraction
Rhode Island Economic Development Corporation
RI Department of labor Workforce Training Federal Small Business Association (SBA) Loans/business training National Endowment for the Arts Placemaking/Arts Cultural, Historic, Environmental Private: Developers of artist housing or live/work Artists Gamm theater Boston/Providence markets Nonprofit Slater Mill Tourism/marketing Watershed Council River cleanup Blackstone Valley Tourism Council Tourism/marketing
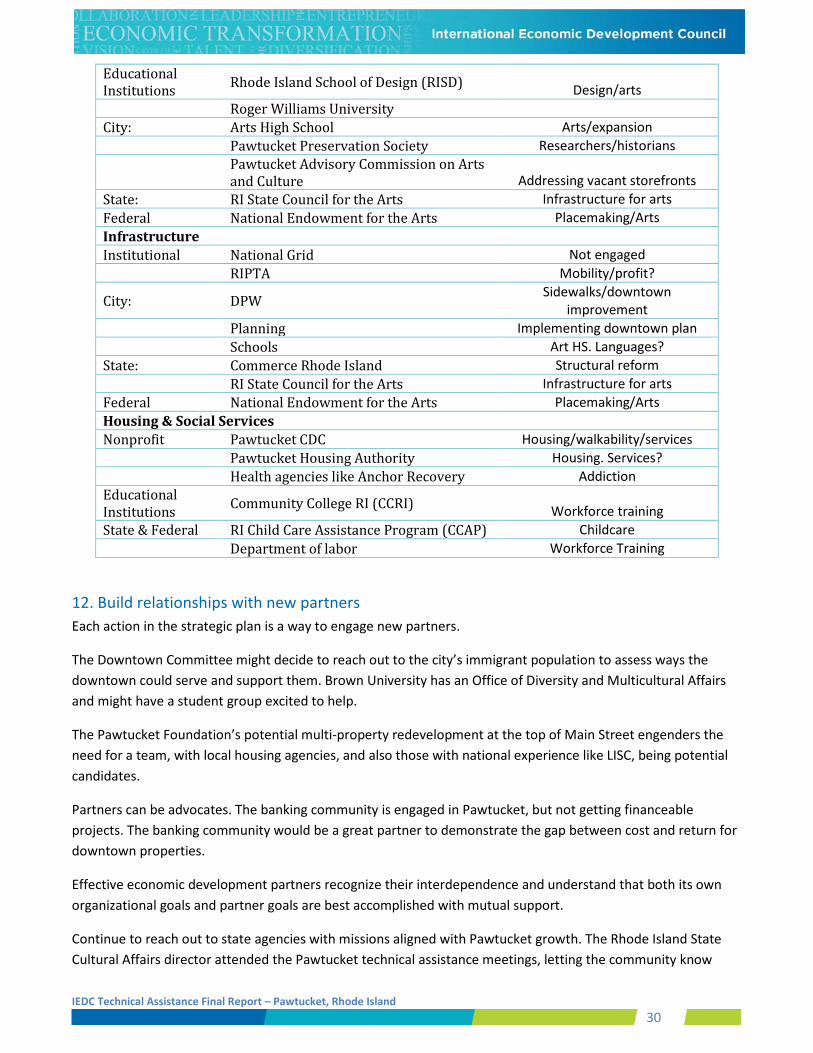
IEDC Technical Assistance Final Report – Pawtucket, Rhode Island 30
Educational Institutions Rhode Island School of Design (RISD) Design/arts Roger Williams University City: Arts High School Arts/expansion Pawtucket Preservation Society Researchers/historians
Pawtucket Advisory Commission on Arts and Culture Addressing vacant storefronts
State: RI State Council for the Arts Infrastructure for arts Federal National Endowment for the Arts Placemaking/Arts Infrastructure Institutional National Grid Not engaged RIPTA Mobility/profit?
City: DPW Sidewalks/downtown improvement
Planning Implementing downtown plan Schools Art HS. Languages? State: Commerce Rhode Island Structural reform RI State Council for the Arts Infrastructure for arts Federal National Endowment for the Arts Placemaking/Arts Housing & Social Services Nonprofit Pawtucket CDC Housing/walkability/services Pawtucket Housing Authority Housing. Services? Health agencies like Anchor Recovery Addiction Educational Institutions Community College RI (CCRI) Workforce training State & Federal RI Child Care Assistance Program (CCAP) Childcare Department of labor Workforce Training
12. Build relationships with new partners Each action in the strategic plan is a way to engage new partners.
The Downtown Committee might decide to reach out to the city’s immigrant population to assess ways the downtown could serve and support them. Brown University has an Office of Diversity and Multicultural Affairs and might have a student group excited to help.
The Pawtucket Foundation’s potential multi-property redevelopment at the top of Main Street engenders the need for a team, with local housing agencies, and also those with national experience like LISC, being potential candidates.
Partners can be advocates. The banking community is engaged in Pawtucket, but not getting financeable projects. The banking community would be a great partner to demonstrate the gap between cost and return for downtown properties.
Effective economic development partners recognize their interdependence and understand that both its own organizational goals and partner goals are best accomplished with mutual support.
Continue to reach out to state agencies with missions aligned with Pawtucket growth. The Rhode Island State Cultural Affairs director attended the Pawtucket technical assistance meetings, letting the community know
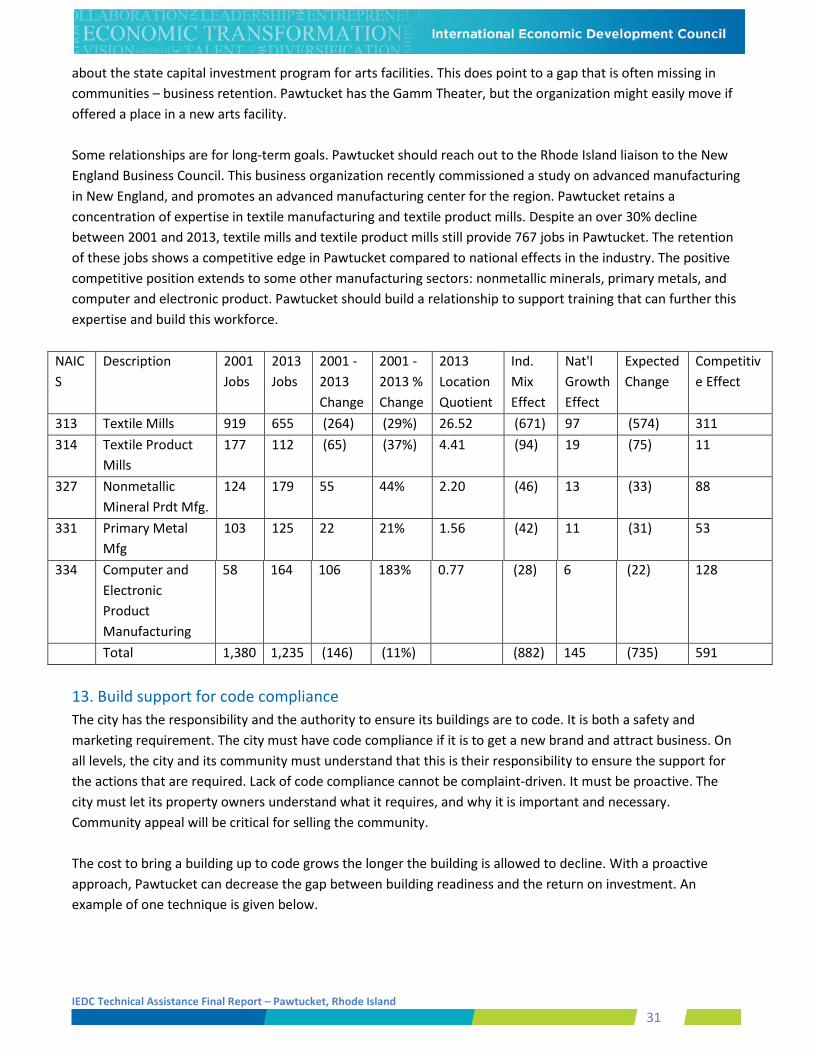
IEDC Technical Assistance Final Report – Pawtucket, Rhode Island 31
about the state capital investment program for arts facilities. This does point to a gap that is often missing in communities – business retention. Pawtucket has the Gamm Theater, but the organization might easily move if offered a place in a new arts facility. Some relationships are for long-term goals. Pawtucket should reach out to the Rhode Island liaison to the New England Business Council. This business organization recently commissioned a study on advanced manufacturing in New England, and promotes an advanced manufacturing center for the region. Pawtucket retains a concentration of expertise in textile manufacturing and textile product mills. Despite an over 30% decline between 2001 and 2013, textile mills and textile product mills still provide 767 jobs in Pawtucket. The retention of these jobs shows a competitive edge in Pawtucket compared to national effects in the industry. The positive competitive position extends to some other manufacturing sectors: nonmetallic minerals, primary metals, and computer and electronic product. Pawtucket should build a relationship to support training that can further this expertise and build this workforce.
NAICS
Description 2001 Jobs
2013 Jobs
2001 - 2013 Change
2001 - 2013 % Change
2013 Location Quotient
Ind. Mix Effect
Nat'l Growth Effect
Expected Change
Competitive Effect
313 Textile Mills 919 655 (264) (29%) 26.52 (671) 97 (574) 311 314 Textile Product
Mills 177 112 (65) (37%) 4.41 (94) 19 (75) 11
327 Nonmetallic Mineral Prdt Mfg.
124 179 55 44% 2.20 (46) 13 (33) 88
331 Primary Metal Mfg
103 125 22 21% 1.56 (42) 11 (31) 53
334 Computer and Electronic Product Manufacturing
58 164 106 183% 0.77 (28) 6 (22) 128
Total 1,380 1,235 (146) (11%) (882) 145 (735) 591
13. Build support for code compliance The city has the responsibility and the authority to ensure its buildings are to code. It is both a safety and marketing requirement. The city must have code compliance if it is to get a new brand and attract business. On all levels, the city and its community must understand that this is their responsibility to ensure the support for the actions that are required. Lack of code compliance cannot be complaint-driven. It must be proactive. The city must let its property owners understand what it requires, and why it is important and necessary. Community appeal will be critical for selling the community. The cost to bring a building up to code grows the longer the building is allowed to decline. With a proactive approach, Pawtucket can decrease the gap between building readiness and the return on investment. An example of one technique is given below.
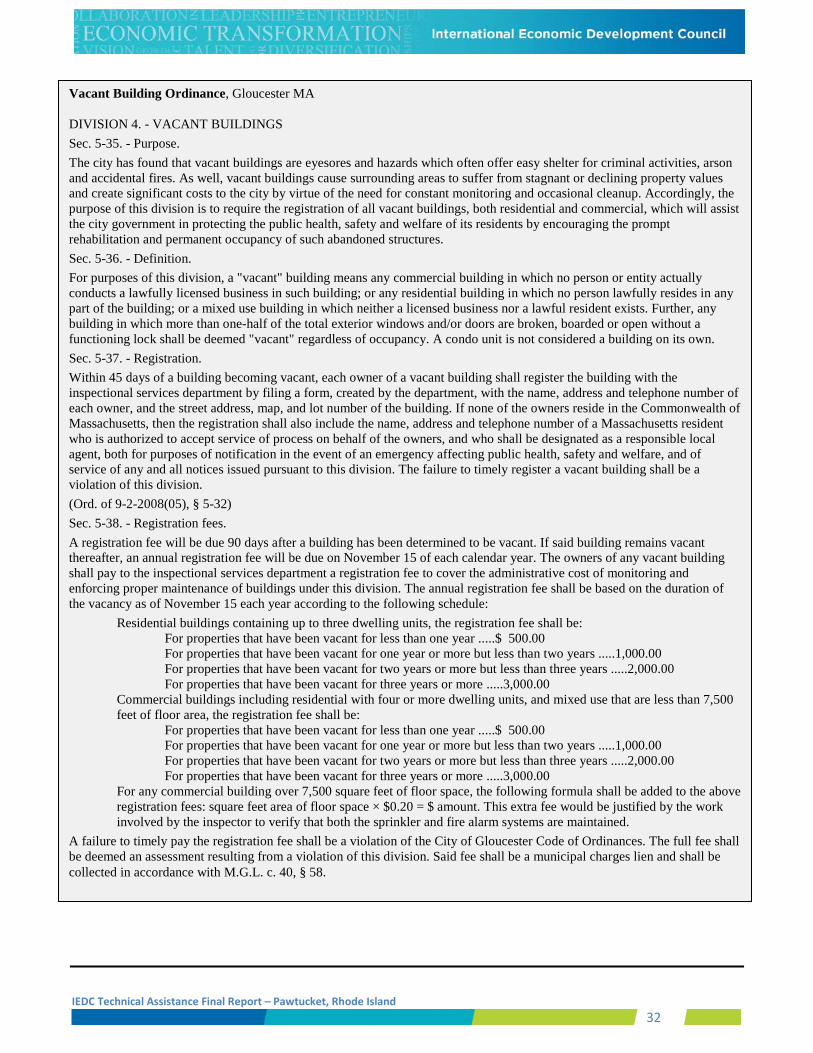
IEDC Technical Assistance Final Report – Pawtucket, Rhode Island 32
Vacant Building Ordinance, Gloucester MA
DIVISION 4. - VACANT BUILDINGS Sec. 5-35. - Purpose. The city has found that vacant buildings are eyesores and hazards which often offer easy shelter for criminal activities, arson and accidental fires. As well, vacant buildings cause surrounding areas to suffer from stagnant or declining property values and create significant costs to the city by virtue of the need for constant monitoring and occasional cleanup. Accordingly, the purpose of this division is to require the registration of all vacant buildings, both residential and commercial, which will assist the city government in protecting the public health, safety and welfare of its residents by encouraging the prompt rehabilitation and permanent occupancy of such abandoned structures. Sec. 5-36. - Definition. For purposes of this division, a "vacant" building means any commercial building in which no person or entity actually conducts a lawfully licensed business in such building; or any residential building in which no person lawfully resides in any part of the building; or a mixed use building in which neither a licensed business nor a lawful resident exists. Further, any building in which more than one-half of the total exterior windows and/or doors are broken, boarded or open without a functioning lock shall be deemed "vacant" regardless of occupancy. A condo unit is not considered a building on its own. Sec. 5-37. - Registration. Within 45 days of a building becoming vacant, each owner of a vacant building shall register the building with the inspectional services department by filing a form, created by the department, with the name, address and telephone number of each owner, and the street address, map, and lot number of the building. If none of the owners reside in the Commonwealth of Massachusetts, then the registration shall also include the name, address and telephone number of a Massachusetts resident who is authorized to accept service of process on behalf of the owners, and who shall be designated as a responsible local agent, both for purposes of notification in the event of an emergency affecting public health, safety and welfare, and of service of any and all notices issued pursuant to this division. The failure to timely register a vacant building shall be a violation of this division. (Ord. of 9-2-2008(05), § 5-32) Sec. 5-38. - Registration fees. A registration fee will be due 90 days after a building has been determined to be vacant. If said building remains vacant thereafter, an annual registration fee will be due on November 15 of each calendar year. The owners of any vacant building shall pay to the inspectional services department a registration fee to cover the administrative cost of monitoring and enforcing proper maintenance of buildings under this division. The annual registration fee shall be based on the duration of the vacancy as of November 15 each year according to the following schedule:
Residential buildings containing up to three dwelling units, the registration fee shall be: For properties that have been vacant for less than one year .....$ 500.00 For properties that have been vacant for one year or more but less than two years .....1,000.00 For properties that have been vacant for two years or more but less than three years .....2,000.00 For properties that have been vacant for three years or more .....3,000.00
Commercial buildings including residential with four or more dwelling units, and mixed use that are less than 7,500 feet of floor area, the registration fee shall be:
For properties that have been vacant for less than one year .....$ 500.00 For properties that have been vacant for one year or more but less than two years .....1,000.00 For properties that have been vacant for two years or more but less than three years .....2,000.00 For properties that have been vacant for three years or more .....3,000.00
For any commercial building over 7,500 square feet of floor space, the following formula shall be added to the above registration fees: square feet area of floor space × $0.20 = $ amount. This extra fee would be justified by the work involved by the inspector to verify that both the sprinkler and fire alarm systems are maintained.
A failure to timely pay the registration fee shall be a violation of the City of Gloucester Code of Ordinances. The full fee shall be deemed an assessment resulting from a violation of this division. Said fee shall be a municipal charges lien and shall be collected in accordance with M.G.L. c. 40, § 58.
IEDC Technical Assistance Final Report – Pawtucket, Rhode Island 33
Activate Tools and Techniques 14. Target and prioritize action areas The City of Pawtucket has many different areas of asset, but with limited resources targeting and prioritizing action areas will be key to ensuring economic success. The city and partners cannot focus on all areas at once, but instead need to pick 3-5 major strategies from all identified areas of focus and support these to fruition. These can be supported by the Main Street four-point approach. Picking strategies that give a visible result will help build support in the community and allow work to continue to additional strategies. The team identified the following areas of focus: Areas of focus:
• The River • The Exchange Street corridor and idea of focusing on a particular development cluster. The Pawtucket
Foundation has suggested a focus at the top of Main Street near Exchange Street. It has the advantage of immediate visual connection to the mill district success.
• The Civic Area: City Hall, Slater Mill • The Armory/Arts district
Each district needs its own plan, strategy and tools, and will need its unique approach to marketing its assets and attributes that together would comprise an overall marketing strategy. The team identified the downtown shopping center as the growth center. With Pawtucket being part of a metropolitan region, the city is integrated into a web of metropolitan relationships. The downtown won’t return to what it was before, but it can become an economically active area with a specialized return. 15. Put fiscal incentives to work The City of Pawtucket needs to maintain the current incentives it is using and examine all available incentives to be used to ensure it remains competitive as a city. One tax credit that the city should be closely following and supporting for refunding is the State’s Historic Tax Credit. Tax Increment Financing The team heard in the meetings that Pawtucket is exploring tax increment financing. The Pawtucket TIF ordinance seems to have all the controls it needs. Communities across the nation are using this tool to return investment to the downtown and Pawtucket should do the same. TIF can be a project incentive, or it can be a district incentive. The district incentive is achieved with a TIF overlay of an area, and subsidizes public improvements that benefit those located in the region. Pawtucket will have to do the due diligence for the TIF, to show how the community investment is repaying benefit to the whole community. With this diligence and a shared vision with the Council, when a project comes to the Council, they can turn to the community plan and commitment rather than what this is doing for their specific neighborhood. Historic Tax Credits With the city’s large cluster of historic buildings, this tax credit is an important tool that needs to be brought back to life. The city has seen what this credit can do, with the lofts across from City Hall as an example, and is aware that developers currently are holding onto properties because they need this credit to assist in overcoming the large financial burden of restoring a historic building.
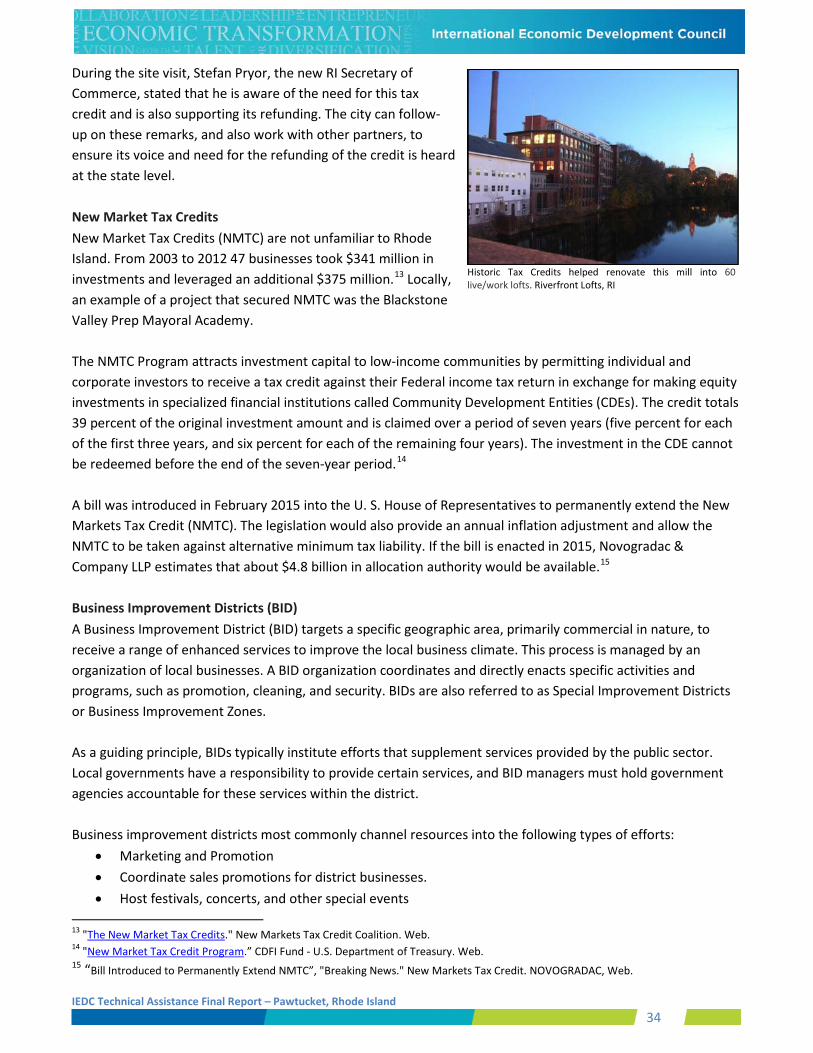
IEDC Technical Assistance Final Report – Pawtucket, Rhode Island 34
During the site visit, Stefan Pryor, the new RI Secretary of Commerce, stated that he is aware of the need for this tax credit and is also supporting its refunding. The city can follow-up on these remarks, and also work with other partners, to ensure its voice and need for the refunding of the credit is heard at the state level. New Market Tax Credits New Market Tax Credits (NMTC) are not unfamiliar to Rhode Island. From 2003 to 2012 47 businesses took $341 million in investments and leveraged an additional $375 million.13 Locally, an example of a project that secured NMTC was the Blackstone Valley Prep Mayoral Academy. The NMTC Program attracts investment capital to low-income communities by permitting individual and corporate investors to receive a tax credit against their Federal income tax return in exchange for making equity investments in specialized financial institutions called Community Development Entities (CDEs). The credit totals 39 percent of the original investment amount and is claimed over a period of seven years (five percent for each of the first three years, and six percent for each of the remaining four years). The investment in the CDE cannot be redeemed before the end of the seven-year period.14 A bill was introduced in February 2015 into the U. S. House of Representatives to permanently extend the New Markets Tax Credit (NMTC). The legislation would also provide an annual inflation adjustment and allow the NMTC to be taken against alternative minimum tax liability. If the bill is enacted in 2015, Novogradac & Company LLP estimates that about $4.8 billion in allocation authority would be available.15 Business Improvement Districts (BID) A Business Improvement District (BID) targets a specific geographic area, primarily commercial in nature, to receive a range of enhanced services to improve the local business climate. This process is managed by an organization of local businesses. A BID organization coordinates and directly enacts specific activities and programs, such as promotion, cleaning, and security. BIDs are also referred to as Special Improvement Districts or Business Improvement Zones. As a guiding principle, BIDs typically institute efforts that supplement services provided by the public sector. Local governments have a responsibility to provide certain services, and BID managers must hold government agencies accountable for these services within the district. Business improvement districts most commonly channel resources into the following types of efforts:
• Marketing and Promotion • Coordinate sales promotions for district businesses. • Host festivals, concerts, and other special events
13 "The New Market Tax Credits." New Markets Tax Credit Coalition. Web. 14 "New Market Tax Credit Program.” CDFI Fund - U.S. Department of Treasury. Web. 15 “Bill Introduced to Permanently Extend NMTC”, "Breaking News." New Markets Tax Credit. NOVOGRADAC, Web.
Historic Tax Credits helped renovate this mill into 60 live/work lofts. Riverfront Lofts, RI
IEDC Technical Assistance Final Report – Pawtucket, Rhode Island 35
• Promote the district to prospective new businesses • Provide maps, banners, and ambassadors to guide visitors • Publish newsletters • Maintenance - BIDs hire personnel and purchase equipment to: • Collect rubbish • Remove litter • Clean graffiti • Scrub sidewalks • Shovel snow • Maintain landscaping
Security – BIDs employ security personnel to patrol district streets, guard against petty crimes, and encourage pedestrian activity. They may also purchase and install surveillance equipment. Policy Advocacy – BIDs lobby local and state governments on behalf of district businesses, and attempt to build community support for policies that could benefit the business climate in the area. Limited Capital Improvements – BIDs fund and implement capital projects to improve the esthetic and functional qualities of the district to make it more inviting. Improvements might include streetlights, signs, trees, flowers, bike lanes, street furniture, façade restoration, and parking facilities. Pawtucket’s downtown may not have the base for a BID yet, but the City or Pawtucket Foundation can build an organization with the end goal of a BID. This can be started with a team at the City level or as a committee under the Foundation. Primary startup and operational funding for BIDs derives from either an assessment charged to district property owners or a fee gathered from businesses within the BID. Assessments are more common than business fees. BID organizers use different formulas to determine the amount of each owner’s assessment. Common components of assessment formulas include: square footage of buildings or parcels, street frontage, property value, and the percentage of total benefits expected to accrue to a particular property.
In addition to assessments and fees, many BIDs gather supplemental funding from other sources. Voluntary donations, local government subsidies, and competitive federal grants may increase BID budgets. Some BIDs sell goods or services and channel the profits into improvement programs.
Given the current business taxes in Rhode Island it may be difficult to convince property owners to accept an additional tax. With a well-planned outreach program to business owners that cites the benefits for the businesses and the chance to increase investment in the area and in businesses, convincing owners can be easier. Additional Resources: A to Z of Business Improvement Districts. Project for Public Spaces. Web (Re)vitalizing Inner-City Neighborhood Business Districts. Joint Center For Housing Studies Of Harvard University, November 2011. Web
IEDC Technical Assistance Final Report – Pawtucket, Rhode Island 36
16. Link code enforcement to occupancy permit Many downtown businesses and residential buildings had visible code violations that aesthetically can hinder development and economic activity. To bolster the performance of code enforcement, ordinances should be in place that triggers actions that incentivize code compliance. One means to do this is by linking code compliance to the ability to have an occupancy permit. This ordinance will take time to implement, especially given the number of properties currently in non-compliance. To ease the transition to a new, tougher ordinance, education, careful implementation, and legal support are all important. University City, MO pioneered the use of the occupancy permit as a lever for code compliance.
University City is an inner-ring suburb of the bi-state St. Louis metropolitan area. It pioneered the use of the occupancy permit to ensure compliance with building code regulations. Beginning in the mid-1960s, the city experienced extensive racial transition. Unethical real estate practices by financial institutions and brokers included ‘red-lining’ and fostering panic selling by white households in the face of in-migration of African American households. This fed a rapid decline in investment in the housing stock by both landlords and homeowners. The city’s response was a rigorous program of code enforcement linked to a requirement that improvements and compliance be required for the issuance of an occupancy permit at the time of any change of tenant or owner occupant. This program remains in effect and has resulted in a stable, healthy and attractive housing inventory citywide. The same concept has been used to insure constant re-investment in the commercial and industrial properties in the city’s business districts.
17. Establish a common/public parking system Pawtucket’s downtown currently faces parking problems and needs a system or strategy in place to plan how to accommodate increased economic activity in the future. The public parking garage is an asset to downtown businesses, and the rezoning of new development to not need accompanying parking is developer friendly, both these elements need to be tied together strategically to ensure parking works. This will need to incorporate the fact that the building inventory will have to match the parking inventory or economic activity downtown will not flourish. To develop a parking system, Pawtucket will need to inventory its parking availability and parking demand. The city will also need to model growth scenarios to figure out how parking will be available to support it. The following three communities provide excellent examples of proactive, successful parking management. Reaching out to these communities with questions, or even to develop a mentor/mentee relationship would be beneficial.
• Royal Oak is an inner-ring suburb of the City of Detroit, Michigan. The City of Royal Oak and its business district is focused on the Woodward Avenue corridor just north of Detroit. Royal Oak initiated a downtown revitalization program in the 1970s with the area being transformed with improved shopping and dining businesses. A key to this progress was the city taking responsibility for providing strategically located public parking lots and garages while eliminating requirements in its zoning code that individual businesses or projects provide for their own parking needs.
• Downtown Greenville, South Carolina, is one of the most successful case studies in downtown
revitalization and resurgence in the country. The process began in the mid 1970s with a design strategy that reconfigured the Main Street to become a desirable pedestrian-friendly environment. Then limited urban renewal added a major hotel and office towers as a polar anchor. At this point, the city put in
IEDC Technical Assistance Final Report – Pawtucket, Rhode Island 37
place a common, public parking framework comprised of both surface lots and garages. This step led to a dynamic influx of new retailing to join a thriving bar and restaurant inventory. At the same time the second major anchor cluster emerged, comprised of city hall, a performance hall, a restored hotel and new park along the Reedy River. However, the critical element holding the new downtown together was the visionary public parking system. Greenville, SC is a premier downtown renovation story. From the get-go, the city built a parking system to go along with development plans, and has contracted third-party reservation management for its parking areas.16
• The University City Delmar Loop district (suburban St. Louis) has been supported by a public parking
system comprised of both surface lots and a garage over the course of its 40-year evolution from a run down streetcar business district to a vital model of a successful contemporary ‘Main Street’.
18. Improve zoning as a development investment tool Zoning can give a city the ability to truly shape a downtown’s appearance and performance. Examples where zoning can be improved in Pawtucket to do this include: Design review: Design review is an excellent zoning tool that gives the community and the developer a venue in which to share understandings and improve the proposed development. Zoning incentives: Using zoning to incentivize is not a new concept. The City of Pawtucket should review the code to see where additional incentives for desired outcomes can be incorporated. For example, cities often allow less parking in return for more open space or streetscape amenities. It is helpful to a developer if the community has identified its needs, so there is a targeted benefit. Mixed use development: Currently Pawtucket does have mixed use development, but faces barriers to encouraging further mixed use with regulatory requirements such as the fire code. Finding a means to incentivize commercial activation of first-floor uses is a key element of a successful downtown, as is proximity to high-density residential housing, which often means housing above commercial. A critical mass of housing directly above Main Street businesses can be the bread and butter for service-oriented Main Street businesses and supports activity and improved safety of the street at all hours. 19. Develop a targeted capital improvement program Part of the focus the city can develop is to align the Capital Improvement Plan (CIP) with the targeted outcomes of the economic development strategy. Public infrastructure needs are always much greater than the public budgets. Economic focus for capital investment becomes necessary, because the public investment has to produce results that attract private investment if the city is to make headway. The Metropolitan Area Project (MAP) in Oklahoma City, OK is an example of a targeted CIP. Oklahoma City was on its back following the 1995 bombing of the Alfred P. Murrah federal building. One incentive for MAP was the loss of a United Airlines facility to Indianapolis. After doing everything they could to entice United Airlines to
16 http://lanierparking.com/
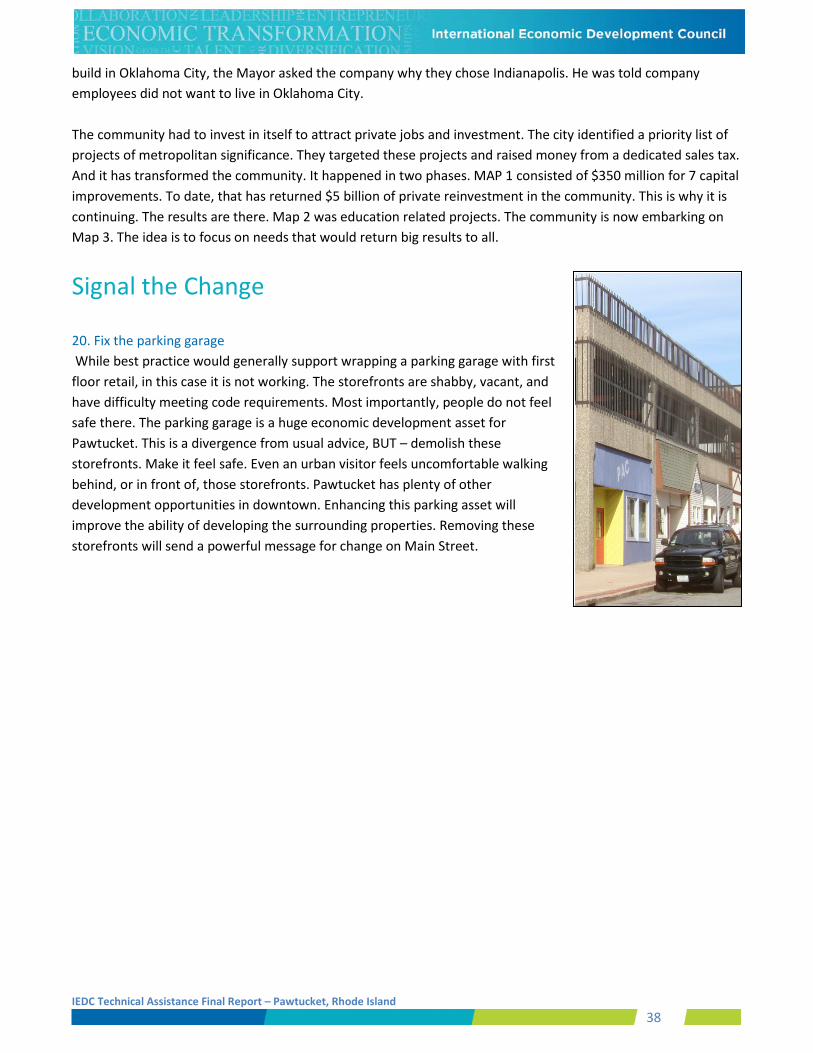
IEDC Technical Assistance Final Report – Pawtucket, Rhode Island 38
build in Oklahoma City, the Mayor asked the company why they chose Indianapolis. He was told company employees did not want to live in Oklahoma City. The community had to invest in itself to attract private jobs and investment. The city identified a priority list of projects of metropolitan significance. They targeted these projects and raised money from a dedicated sales tax. And it has transformed the community. It happened in two phases. MAP 1 consisted of $350 million for 7 capital improvements. To date, that has returned $5 billion of private reinvestment in the community. This is why it is continuing. The results are there. Map 2 was education related projects. The community is now embarking on Map 3. The idea is to focus on needs that would return big results to all.
Signal the Change 20. Fix the parking garage While best practice would generally support wrapping a parking garage with first floor retail, in this case it is not working. The storefronts are shabby, vacant, and have difficulty meeting code requirements. Most importantly, people do not feel safe there. The parking garage is a huge economic development asset for Pawtucket. This is a divergence from usual advice, BUT – demolish these storefronts. Make it feel safe. Even an urban visitor feels uncomfortable walking behind, or in front of, those storefronts. Pawtucket has plenty of other development opportunities in downtown. Enhancing this parking asset will improve the ability of developing the surrounding properties. Removing these storefronts will send a powerful message for change on Main Street.
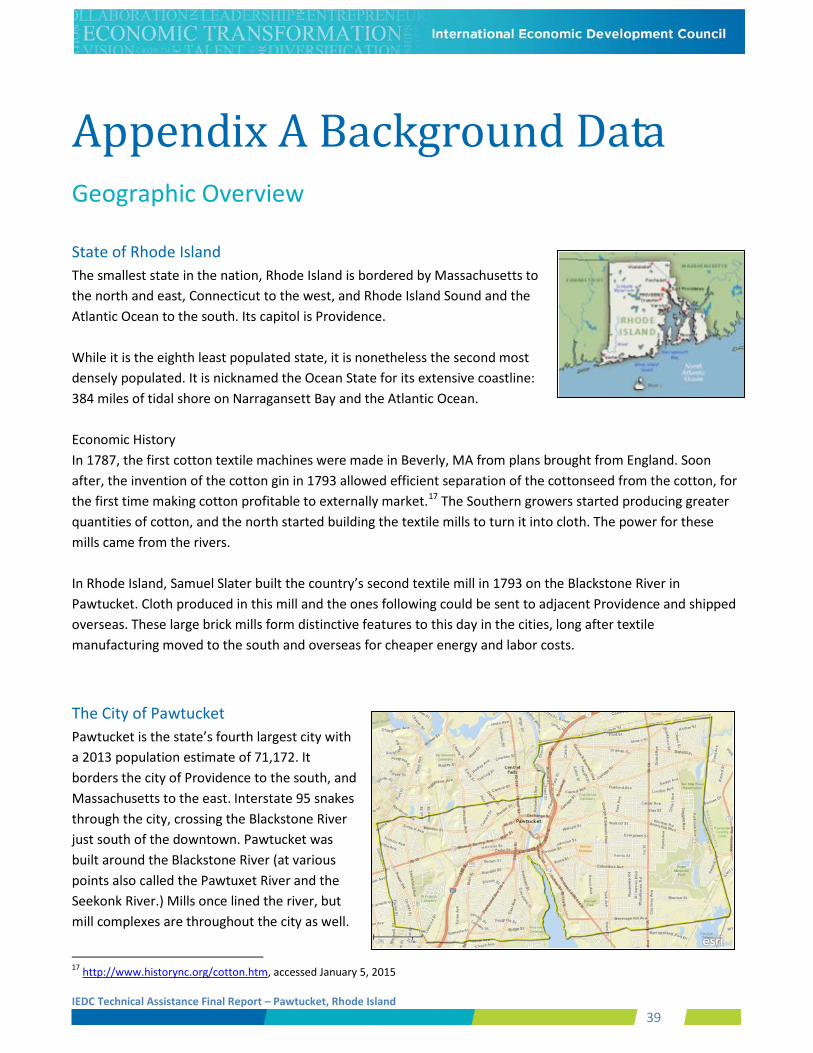
IEDC Technical Assistance Final Report – Pawtucket, Rhode Island 39
Appendix A Background Data
Geographic Overview State of Rhode Island The smallest state in the nation, Rhode Island is bordered by Massachusetts to the north and east, Connecticut to the west, and Rhode Island Sound and the Atlantic Ocean to the south. Its capitol is Providence. While it is the eighth least populated state, it is nonetheless the second most densely populated. It is nicknamed the Ocean State for its extensive coastline: 384 miles of tidal shore on Narragansett Bay and the Atlantic Ocean. Economic History In 1787, the first cotton textile machines were made in Beverly, MA from plans brought from England. Soon after, the invention of the cotton gin in 1793 allowed efficient separation of the cottonseed from the cotton, for the first time making cotton profitable to externally market.17 The Southern growers started producing greater quantities of cotton, and the north started building the textile mills to turn it into cloth. The power for these mills came from the rivers. In Rhode Island, Samuel Slater built the country’s second textile mill in 1793 on the Blackstone River in Pawtucket. Cloth produced in this mill and the ones following could be sent to adjacent Providence and shipped overseas. These large brick mills form distinctive features to this day in the cities, long after textile manufacturing moved to the south and overseas for cheaper energy and labor costs. The City of Pawtucket Pawtucket is the state’s fourth largest city with a 2013 population estimate of 71,172. It borders the city of Providence to the south, and Massachusetts to the east. Interstate 95 snakes through the city, crossing the Blackstone River just south of the downtown. Pawtucket was built around the Blackstone River (at various points also called the Pawtuxet River and the Seekonk River.) Mills once lined the river, but mill complexes are throughout the city as well.
17 http://www.historync.org/cotton.htm, accessed January 5, 2015
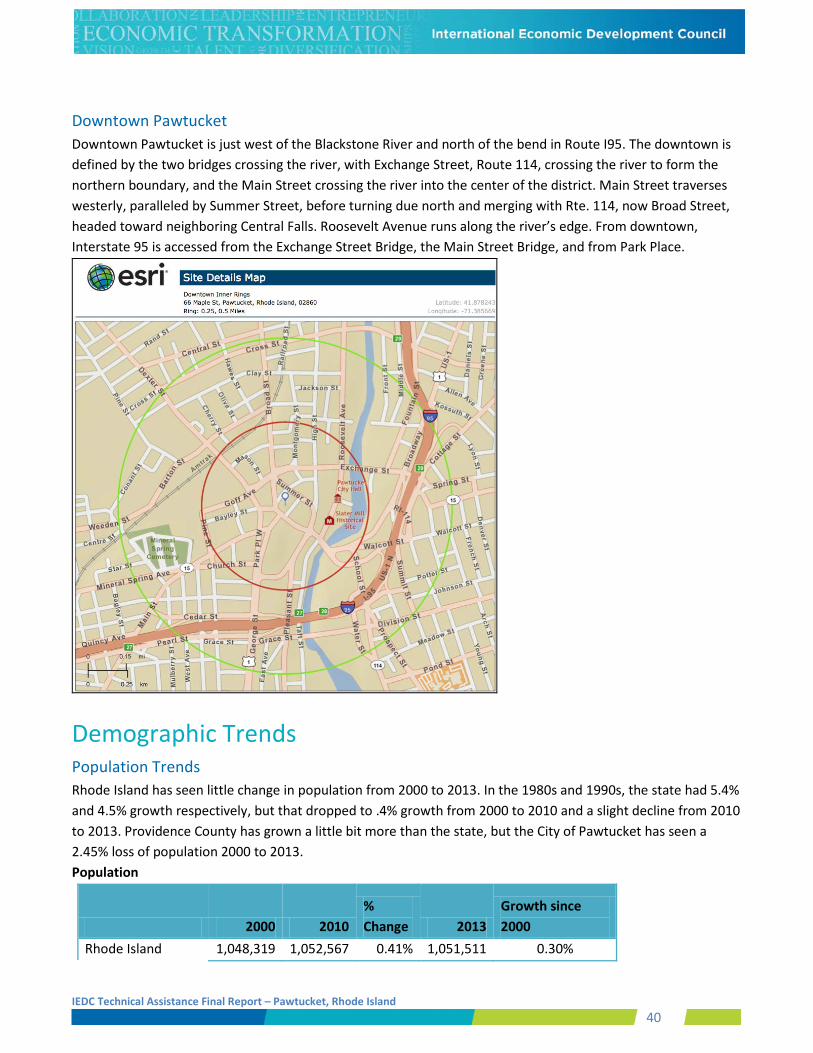
IEDC Technical Assistance Final Report – Pawtucket, Rhode Island 40
Downtown Pawtucket Downtown Pawtucket is just west of the Blackstone River and north of the bend in Route I95. The downtown is defined by the two bridges crossing the river, with Exchange Street, Route 114, crossing the river to form the northern boundary, and the Main Street crossing the river into the center of the district. Main Street traverses westerly, paralleled by Summer Street, before turning due north and merging with Rte. 114, now Broad Street, headed toward neighboring Central Falls. Roosevelt Avenue runs along the river’s edge. From downtown, Interstate 95 is accessed from the Exchange Street Bridge, the Main Street Bridge, and from Park Place.
Demographic Trends Population Trends Rhode Island has seen little change in population from 2000 to 2013. In the 1980s and 1990s, the state had 5.4% and 4.5% growth respectively, but that dropped to .4% growth from 2000 to 2010 and a slight decline from 2010 to 2013. Providence County has grown a little bit more than the state, but the City of Pawtucket has seen a 2.45% loss of population 2000 to 2013. Population
2000 2010 % Change 2013
Growth since 2000
Rhode Island 1,048,319 1,052,567 0.41% 1,051,511 0.30%
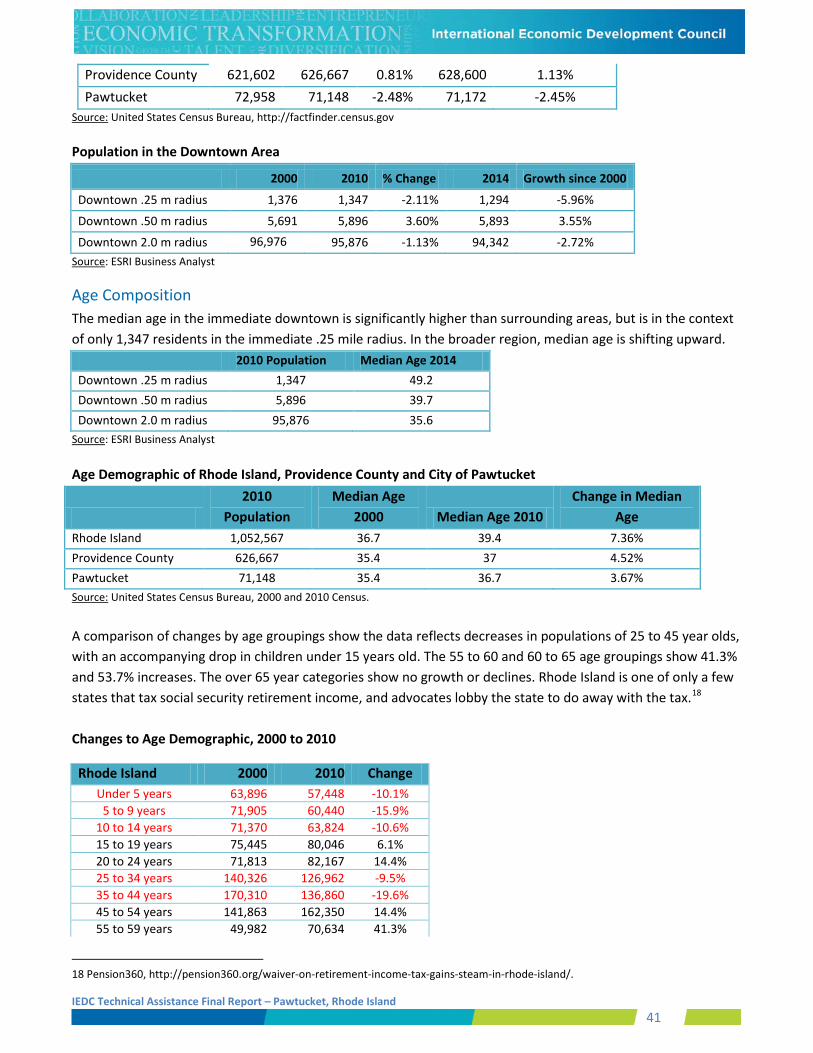
IEDC Technical Assistance Final Report – Pawtucket, Rhode Island 41
Providence County 621,602 626,667 0.81% 628,600 1.13% Pawtucket 72,958 71,148 -2.48% 71,172 -2.45%
Source: United States Census Bureau, http://factfinder.census.gov
Population in the Downtown Area
2000 2010 % Change 2014 Growth since 2000
Downtown .25 m radius 1,376 1,347 -2.11% 1,294 -5.96%
Downtown .50 m radius 5,691 5,896 3.60% 5,893 3.55%
Downtown 2.0 m radius 96,976 95,876 -1.13% 94,342 -2.72% Source: ESRI Business Analyst
Age Composition The median age in the immediate downtown is significantly higher than surrounding areas, but is in the context of only 1,347 residents in the immediate .25 mile radius. In the broader region, median age is shifting upward.
2010 Population Median Age 2014 Downtown .25 m radius 1,347 49.2 Downtown .50 m radius 5,896 39.7 Downtown 2.0 m radius 95,876 35.6
Source: ESRI Business Analyst
Age Demographic of Rhode Island, Providence County and City of Pawtucket
2010
Population Median Age
2000 Median Age 2010 Change in Median
Age Rhode Island 1,052,567 36.7 39.4 7.36% Providence County 626,667 35.4 37 4.52% Pawtucket 71,148 35.4 36.7 3.67% Source: United States Census Bureau, 2000 and 2010 Census.
A comparison of changes by age groupings show the data reflects decreases in populations of 25 to 45 year olds, with an accompanying drop in children under 15 years old. The 55 to 60 and 60 to 65 age groupings show 41.3% and 53.7% increases. The over 65 year categories show no growth or declines. Rhode Island is one of only a few states that tax social security retirement income, and advocates lobby the state to do away with the tax.18 Changes to Age Demographic, 2000 to 2010
Rhode Island 2000 2010 Change Under 5 years 63,896 57,448 -10.1%
5 to 9 years 71,905 60,440 -15.9% 10 to 14 years 71,370 63,824 -10.6% 15 to 19 years 75,445 80,046 6.1% 20 to 24 years 71,813 82,167 14.4% 25 to 34 years 140,326 126,962 -9.5% 35 to 44 years 170,310 136,860 -19.6% 45 to 54 years 141,863 162,350 14.4% 55 to 59 years 49,982 70,634 41.3%
18 Pension360, http://pension360.org/waiver-on-retirement-income-tax-gains-steam-in-rhode-island/.
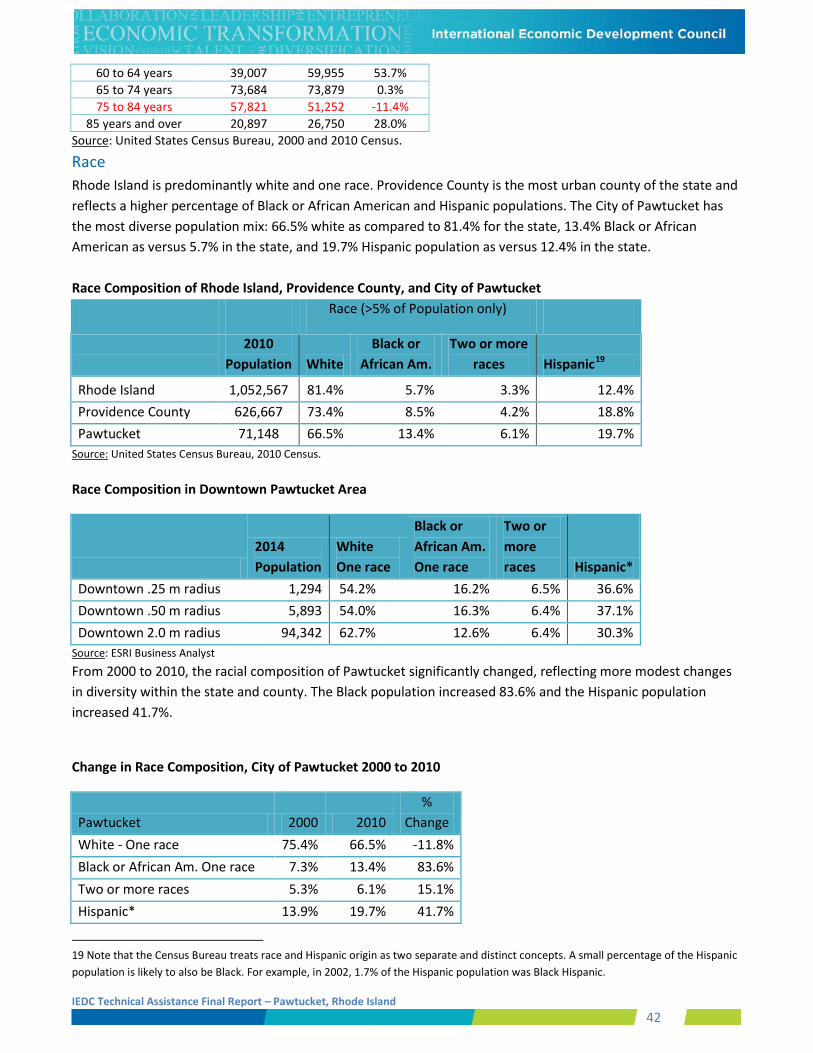
IEDC Technical Assistance Final Report – Pawtucket, Rhode Island 42
60 to 64 years 39,007 59,955 53.7% 65 to 74 years 73,684 73,879 0.3% 75 to 84 years 57,821 51,252 -11.4%
85 years and over 20,897 26,750 28.0% Source: United States Census Bureau, 2000 and 2010 Census.
Race Rhode Island is predominantly white and one race. Providence County is the most urban county of the state and reflects a higher percentage of Black or African American and Hispanic populations. The City of Pawtucket has the most diverse population mix: 66.5% white as compared to 81.4% for the state, 13.4% Black or African American as versus 5.7% in the state, and 19.7% Hispanic population as versus 12.4% in the state. Race Composition of Rhode Island, Providence County, and City of Pawtucket Race (>5% of Population only)
2010
Population White Black or
African Am. Two or more
races Hispanic19
Rhode Island 1,052,567 81.4% 5.7% 3.3% 12.4% Providence County 626,667 73.4% 8.5% 4.2% 18.8% Pawtucket 71,148 66.5% 13.4% 6.1% 19.7%
Source: United States Census Bureau, 2010 Census.
Race Composition in Downtown Pawtucket Area
2014 Population
White One race
Black or African Am. One race
Two or more races Hispanic*
Downtown .25 m radius 1,294 54.2% 16.2% 6.5% 36.6% Downtown .50 m radius 5,893 54.0% 16.3% 6.4% 37.1% Downtown 2.0 m radius 94,342 62.7% 12.6% 6.4% 30.3%
Source: ESRI Business Analyst
From 2000 to 2010, the racial composition of Pawtucket significantly changed, reflecting more modest changes in diversity within the state and county. The Black population increased 83.6% and the Hispanic population increased 41.7%.
Change in Race Composition, City of Pawtucket 2000 to 2010
Pawtucket 2000 2010 %
Change White - One race 75.4% 66.5% -11.8% Black or African Am. One race 7.3% 13.4% 83.6% Two or more races 5.3% 6.1% 15.1% Hispanic* 13.9% 19.7% 41.7%
19 Note that the Census Bureau treats race and Hispanic origin as two separate and distinct concepts. A small percentage of the Hispanic population is likely to also be Black. For example, in 2002, 1.7% of the Hispanic population was Black Hispanic.
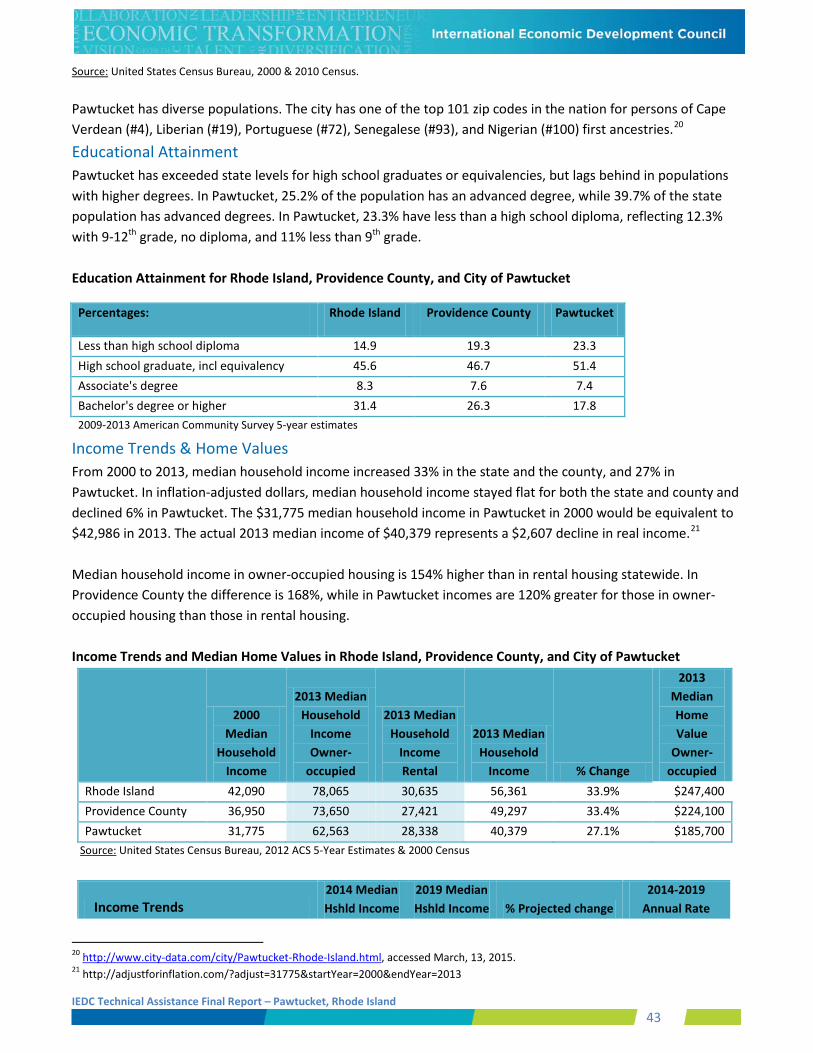
IEDC Technical Assistance Final Report – Pawtucket, Rhode Island 43
Source: United States Census Bureau, 2000 & 2010 Census. Pawtucket has diverse populations. The city has one of the top 101 zip codes in the nation for persons of Cape Verdean (#4), Liberian (#19), Portuguese (#72), Senegalese (#93), and Nigerian (#100) first ancestries.20
Educational Attainment Pawtucket has exceeded state levels for high school graduates or equivalencies, but lags behind in populations with higher degrees. In Pawtucket, 25.2% of the population has an advanced degree, while 39.7% of the state population has advanced degrees. In Pawtucket, 23.3% have less than a high school diploma, reflecting 12.3% with 9-12th grade, no diploma, and 11% less than 9th grade. Education Attainment for Rhode Island, Providence County, and City of Pawtucket
Percentages: Rhode Island Providence County Pawtucket
Less than high school diploma 14.9 19.3 23.3 High school graduate, incl equivalency 45.6 46.7 51.4 Associate's degree 8.3 7.6 7.4 Bachelor's degree or higher 31.4 26.3 17.8 2009-2013 American Community Survey 5-year estimates
Income Trends & Home Values From 2000 to 2013, median household income increased 33% in the state and the county, and 27% in Pawtucket. In inflation-adjusted dollars, median household income stayed flat for both the state and county and declined 6% in Pawtucket. The $31,775 median household income in Pawtucket in 2000 would be equivalent to $42,986 in 2013. The actual 2013 median income of $40,379 represents a $2,607 decline in real income.21 Median household income in owner-occupied housing is 154% higher than in rental housing statewide. In Providence County the difference is 168%, while in Pawtucket incomes are 120% greater for those in owner-occupied housing than those in rental housing. Income Trends and Median Home Values in Rhode Island, Providence County, and City of Pawtucket
2000 Median
Household Income
2013 Median Household
Income Owner-
occupied
2013 Median Household
Income Rental
2013 Median Household
Income % Change
2013 Median Home Value
Owner-occupied
Rhode Island 42,090 78,065 30,635 56,361 33.9% $247,400 Providence County 36,950 73,650 27,421 49,297 33.4% $224,100 Pawtucket 31,775 62,563 28,338 40,379 27.1% $185,700
Source: United States Census Bureau, 2012 ACS 5-Year Estimates & 2000 Census
Income Trends 2014 Median Hshld Income
2019 Median Hshld Income % Projected change
2014-2019 Annual Rate
20 http://www.city-data.com/city/Pawtucket-Rhode-Island.html, accessed March, 13, 2015. 21 http://adjustforinflation.com/?adjust=31775&startYear=2000&endYear=2013
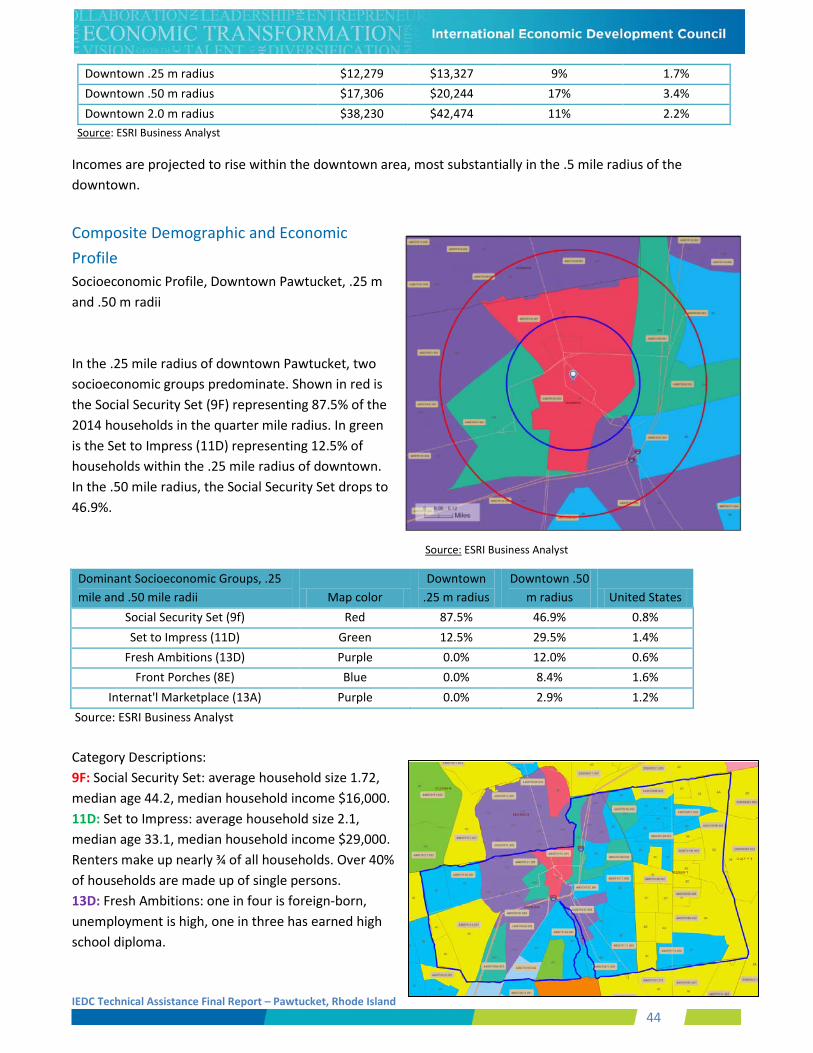
IEDC Technical Assistance Final Report – Pawtucket, Rhode Island 44
Downtown .25 m radius $12,279 $13,327 9% 1.7% Downtown .50 m radius $17,306 $20,244 17% 3.4% Downtown 2.0 m radius $38,230 $42,474 11% 2.2%
Source: ESRI Business Analyst
Incomes are projected to rise within the downtown area, most substantially in the .5 mile radius of the downtown.
Composite Demographic and Economic Profile Socioeconomic Profile, Downtown Pawtucket, .25 m and .50 m radii In the .25 mile radius of downtown Pawtucket, two socioeconomic groups predominate. Shown in red is the Social Security Set (9F) representing 87.5% of the 2014 households in the quarter mile radius. In green is the Set to Impress (11D) representing 12.5% of households within the .25 mile radius of downtown. In the .50 mile radius, the Social Security Set drops to 46.9%.
Dominant Socioeconomic Groups, .25 mile and .50 mile radii Map color
Downtown .25 m radius
Downtown .50 m radius United States
Social Security Set (9f) Red 87.5% 46.9% 0.8% Set to Impress (11D) Green 12.5% 29.5% 1.4%
Fresh Ambitions (13D) Purple 0.0% 12.0% 0.6% Front Porches (8E) Blue 0.0% 8.4% 1.6%
Internat'l Marketplace (13A) Purple 0.0% 2.9% 1.2% Source: ESRI Business Analyst Category Descriptions: 9F: Social Security Set: average household size 1.72, median age 44.2, median household income $16,000. 11D: Set to Impress: average household size 2.1, median age 33.1, median household income $29,000. Renters make up nearly ¾ of all households. Over 40% of households are made up of single persons. 13D: Fresh Ambitions: one in four is foreign-born, unemployment is high, one in three has earned high school diploma.
Source: ESRI Business Analyst
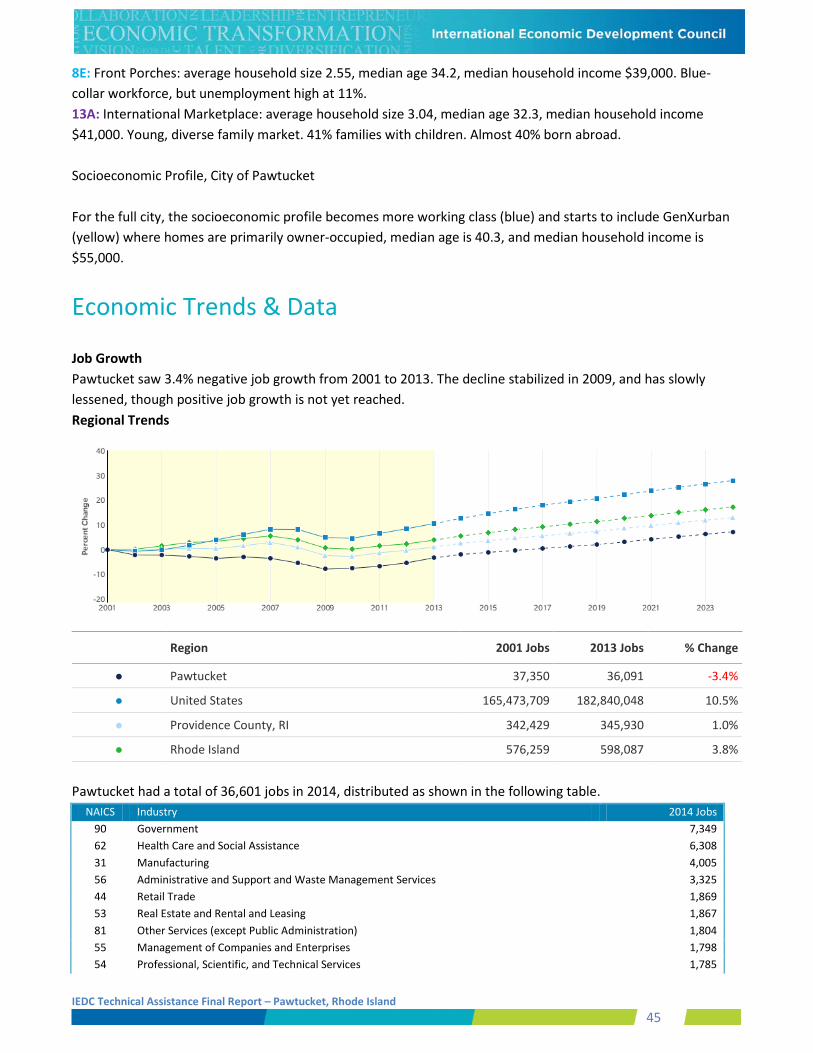
IEDC Technical Assistance Final Report – Pawtucket, Rhode Island 45
8E: Front Porches: average household size 2.55, median age 34.2, median household income $39,000. Blue-collar workforce, but unemployment high at 11%. 13A: International Marketplace: average household size 3.04, median age 32.3, median household income $41,000. Young, diverse family market. 41% families with children. Almost 40% born abroad. Socioeconomic Profile, City of Pawtucket For the full city, the socioeconomic profile becomes more working class (blue) and starts to include GenXurban (yellow) where homes are primarily owner-occupied, median age is 40.3, and median household income is $55,000.
Economic Trends & Data Job Growth Pawtucket saw 3.4% negative job growth from 2001 to 2013. The decline stabilized in 2009, and has slowly lessened, though positive job growth is not yet reached. Regional Trends
Region 2001 Jobs 2013 Jobs % Change
● Pawtucket 37,350 36,091 -3.4%
● United States 165,473,709 182,840,048 10.5%
● Providence County, RI 342,429 345,930 1.0%
● Rhode Island 576,259 598,087 3.8%
Pawtucket had a total of 36,601 jobs in 2014, distributed as shown in the following table.
NAICS Industry 2014 Jobs 90 Government 7,349 62 Health Care and Social Assistance 6,308 31 Manufacturing 4,005 56 Administrative and Support and Waste Management Services 3,325 44 Retail Trade 1,869 53 Real Estate and Rental and Leasing 1,867 81 Other Services (except Public Administration) 1,804 55 Management of Companies and Enterprises 1,798 54 Professional, Scientific, and Technical Services 1,785
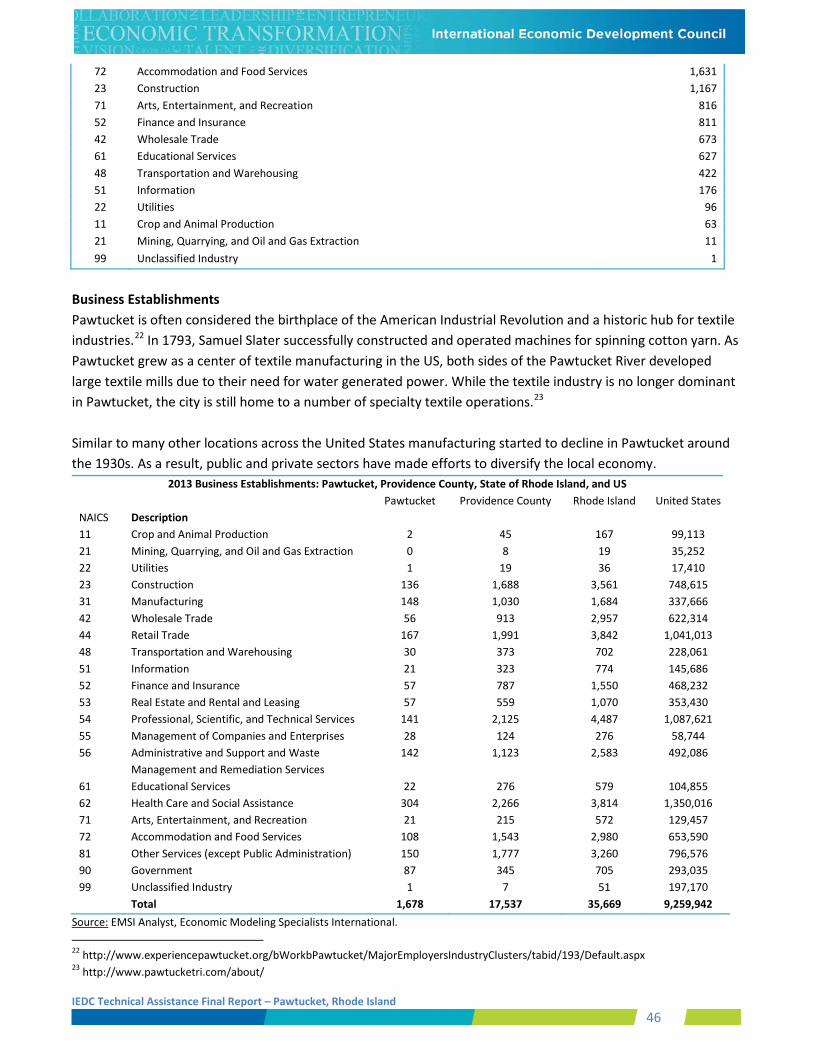
IEDC Technical Assistance Final Report – Pawtucket, Rhode Island 46
72 Accommodation and Food Services 1,631 23 Construction 1,167 71 Arts, Entertainment, and Recreation 816 52 Finance and Insurance 811 42 Wholesale Trade 673 61 Educational Services 627 48 Transportation and Warehousing 422 51 Information 176 22 Utilities 96 11 Crop and Animal Production 63 21 Mining, Quarrying, and Oil and Gas Extraction 11 99 Unclassified Industry 1
Business Establishments Pawtucket is often considered the birthplace of the American Industrial Revolution and a historic hub for textile industries.22 In 1793, Samuel Slater successfully constructed and operated machines for spinning cotton yarn. As Pawtucket grew as a center of textile manufacturing in the US, both sides of the Pawtucket River developed large textile mills due to their need for water generated power. While the textile industry is no longer dominant in Pawtucket, the city is still home to a number of specialty textile operations.23 Similar to many other locations across the United States manufacturing started to decline in Pawtucket around the 1930s. As a result, public and private sectors have made efforts to diversify the local economy.
2013 Business Establishments: Pawtucket, Providence County, State of Rhode Island, and US Pawtucket Providence County Rhode Island United States
NAICS Description 11 Crop and Animal Production 2 45 167 99,113 21 Mining, Quarrying, and Oil and Gas Extraction 0 8 19 35,252 22 Utilities 1 19 36 17,410 23 Construction 136 1,688 3,561 748,615 31 Manufacturing 148 1,030 1,684 337,666 42 Wholesale Trade 56 913 2,957 622,314 44 Retail Trade 167 1,991 3,842 1,041,013 48 Transportation and Warehousing 30 373 702 228,061 51 Information 21 323 774 145,686 52 Finance and Insurance 57 787 1,550 468,232 53 Real Estate and Rental and Leasing 57 559 1,070 353,430 54 Professional, Scientific, and Technical Services 141 2,125 4,487 1,087,621 55 Management of Companies and Enterprises 28 124 276 58,744 56 Administrative and Support and Waste
Management and Remediation Services 142 1,123 2,583 492,086
61 Educational Services 22 276 579 104,855 62 Health Care and Social Assistance 304 2,266 3,814 1,350,016 71 Arts, Entertainment, and Recreation 21 215 572 129,457 72 Accommodation and Food Services 108 1,543 2,980 653,590 81 Other Services (except Public Administration) 150 1,777 3,260 796,576 90 Government 87 345 705 293,035 99 Unclassified Industry 1 7 51 197,170 Total 1,678 17,537 35,669 9,259,942
Source: EMSI Analyst, Economic Modeling Specialists International. 22 http://www.experiencepawtucket.org/bWorkbPawtucket/MajorEmployersIndustryClusters/tabid/193/Default.aspx 23 http://www.pawtucketri.com/about/
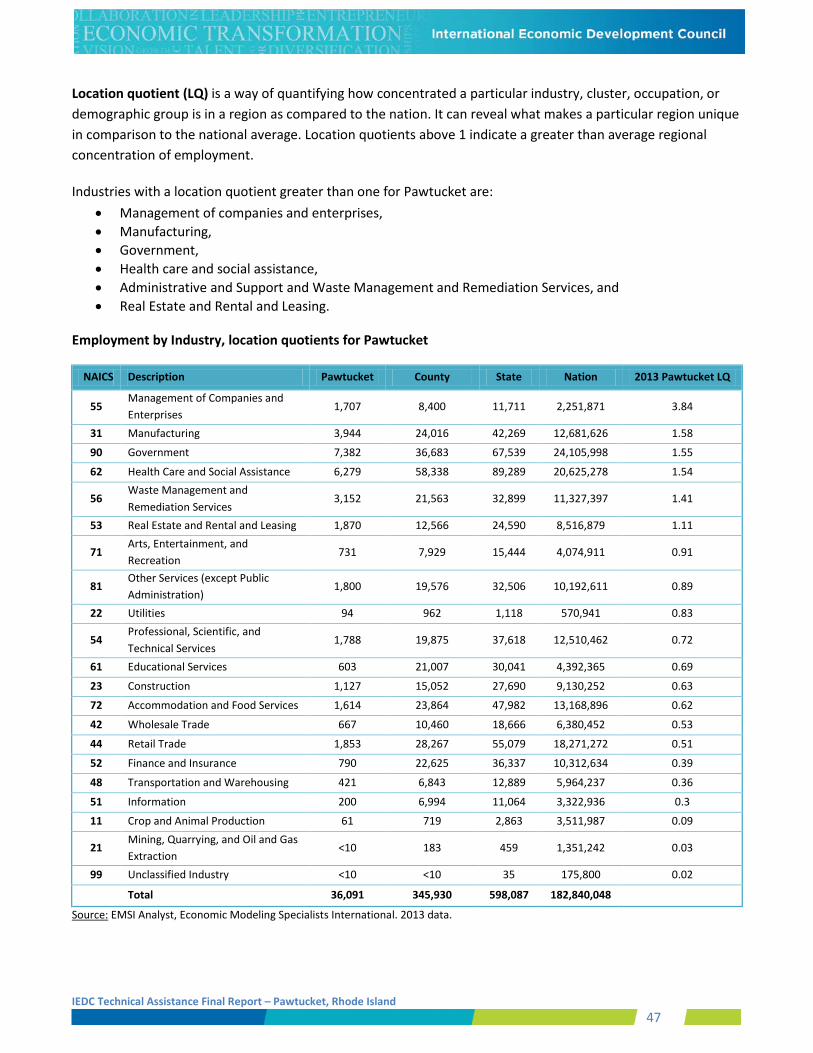
IEDC Technical Assistance Final Report – Pawtucket, Rhode Island 47
Location quotient (LQ) is a way of quantifying how concentrated a particular industry, cluster, occupation, or demographic group is in a region as compared to the nation. It can reveal what makes a particular region unique in comparison to the national average. Location quotients above 1 indicate a greater than average regional concentration of employment.
Industries with a location quotient greater than one for Pawtucket are: • Management of companies and enterprises, • Manufacturing, • Government, • Health care and social assistance, • Administrative and Support and Waste Management and Remediation Services, and • Real Estate and Rental and Leasing.
Employment by Industry, location quotients for Pawtucket
NAICS Description Pawtucket County State Nation 2013 Pawtucket LQ
55 Management of Companies and Enterprises
1,707 8,400 11,711 2,251,871 3.84
31 Manufacturing 3,944 24,016 42,269 12,681,626 1.58
90 Government 7,382 36,683 67,539 24,105,998 1.55
62 Health Care and Social Assistance 6,279 58,338 89,289 20,625,278 1.54
56 Waste Management and Remediation Services
3,152 21,563 32,899 11,327,397 1.41
53 Real Estate and Rental and Leasing 1,870 12,566 24,590 8,516,879 1.11
71 Arts, Entertainment, and Recreation
731 7,929 15,444 4,074,911 0.91
81 Other Services (except Public Administration)
1,800 19,576 32,506 10,192,611 0.89
22 Utilities 94 962 1,118 570,941 0.83
54 Professional, Scientific, and Technical Services
1,788 19,875 37,618 12,510,462 0.72
61 Educational Services 603 21,007 30,041 4,392,365 0.69
23 Construction 1,127 15,052 27,690 9,130,252 0.63
72 Accommodation and Food Services 1,614 23,864 47,982 13,168,896 0.62
42 Wholesale Trade 667 10,460 18,666 6,380,452 0.53
44 Retail Trade 1,853 28,267 55,079 18,271,272 0.51
52 Finance and Insurance 790 22,625 36,337 10,312,634 0.39
48 Transportation and Warehousing 421 6,843 12,889 5,964,237 0.36
51 Information 200 6,994 11,064 3,322,936 0.3
11 Crop and Animal Production 61 719 2,863 3,511,987 0.09
21 Mining, Quarrying, and Oil and Gas Extraction
<10 183 459 1,351,242 0.03
99 Unclassified Industry <10 <10 35 175,800 0.02
Total 36,091 345,930 598,087 182,840,048
Source: EMSI Analyst, Economic Modeling Specialists International. 2013 data.
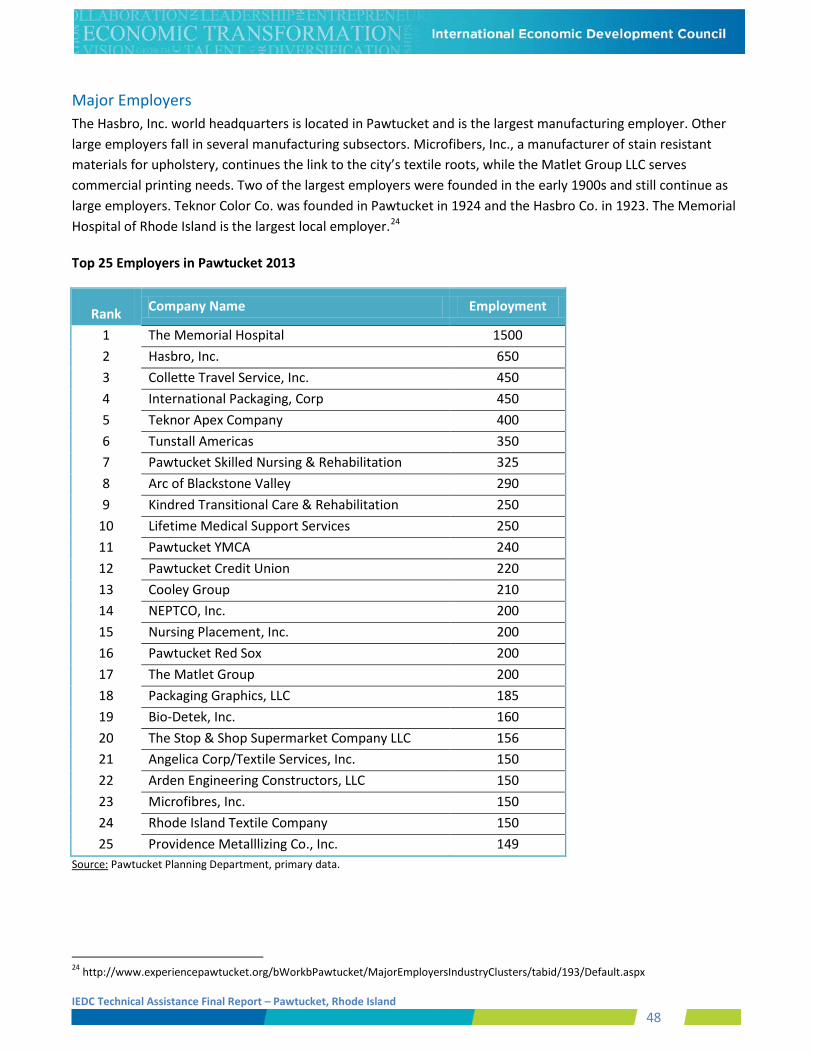
IEDC Technical Assistance Final Report – Pawtucket, Rhode Island 48
Major Employers The Hasbro, Inc. world headquarters is located in Pawtucket and is the largest manufacturing employer. Other large employers fall in several manufacturing subsectors. Microfibers, Inc., a manufacturer of stain resistant materials for upholstery, continues the link to the city’s textile roots, while the Matlet Group LLC serves commercial printing needs. Two of the largest employers were founded in the early 1900s and still continue as large employers. Teknor Color Co. was founded in Pawtucket in 1924 and the Hasbro Co. in 1923. The Memorial Hospital of Rhode Island is the largest local employer.24
Top 25 Employers in Pawtucket 2013
Rank Company Name Employment
1 The Memorial Hospital 1500 2 Hasbro, Inc. 650 3 Collette Travel Service, Inc. 450 4 International Packaging, Corp 450 5 Teknor Apex Company 400 6 Tunstall Americas 350 7 Pawtucket Skilled Nursing & Rehabilitation 325 8 Arc of Blackstone Valley 290 9 Kindred Transitional Care & Rehabilitation 250
10 Lifetime Medical Support Services 250 11 Pawtucket YMCA 240 12 Pawtucket Credit Union 220 13 Cooley Group 210 14 NEPTCO, Inc. 200 15 Nursing Placement, Inc. 200 16 Pawtucket Red Sox 200 17 The Matlet Group 200 18 Packaging Graphics, LLC 185 19 Bio-Detek, Inc. 160 20 The Stop & Shop Supermarket Company LLC 156 21 Angelica Corp/Textile Services, Inc. 150 22 Arden Engineering Constructors, LLC 150 23 Microfibres, Inc. 150 24 Rhode Island Textile Company 150 25 Providence Metalllizing Co., Inc. 149
Source: Pawtucket Planning Department, primary data.
24 http://www.experiencepawtucket.org/bWorkbPawtucket/MajorEmployersIndustryClusters/tabid/193/Default.aspx
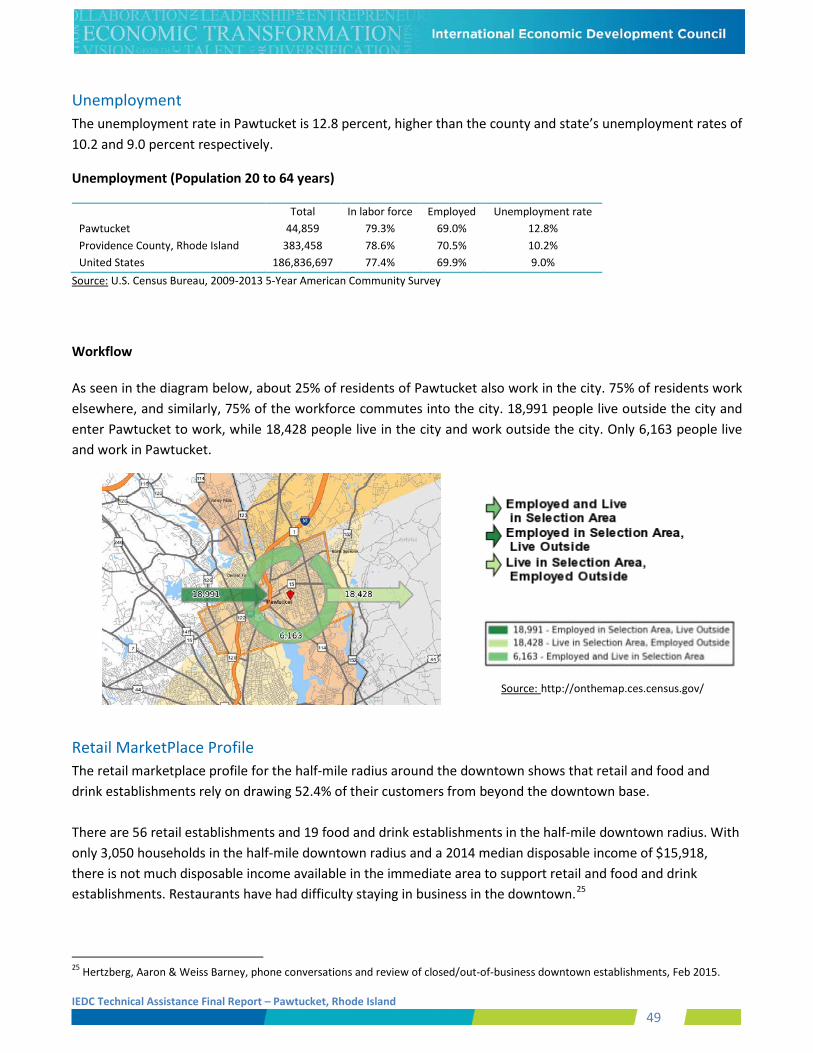
IEDC Technical Assistance Final Report – Pawtucket, Rhode Island 49
Unemployment The unemployment rate in Pawtucket is 12.8 percent, higher than the county and state’s unemployment rates of 10.2 and 9.0 percent respectively.
Unemployment (Population 20 to 64 years)
Total In labor force Employed Unemployment rate Pawtucket 44,859 79.3% 69.0% 12.8% Providence County, Rhode Island 383,458 78.6% 70.5% 10.2% United States 186,836,697 77.4% 69.9% 9.0%
Source: U.S. Census Bureau, 2009-2013 5-Year American Community Survey
Workflow
As seen in the diagram below, about 25% of residents of Pawtucket also work in the city. 75% of residents work elsewhere, and similarly, 75% of the workforce commutes into the city. 18,991 people live outside the city and enter Pawtucket to work, while 18,428 people live in the city and work outside the city. Only 6,163 people live and work in Pawtucket.
Source: http://onthemap.ces.census.gov/
Retail MarketPlace Profile The retail marketplace profile for the half-mile radius around the downtown shows that retail and food and drink establishments rely on drawing 52.4% of their customers from beyond the downtown base. There are 56 retail establishments and 19 food and drink establishments in the half-mile downtown radius. With only 3,050 households in the half-mile downtown radius and a 2014 median disposable income of $15,918, there is not much disposable income available in the immediate area to support retail and food and drink establishments. Restaurants have had difficulty staying in business in the downtown.25
25 Hertzberg, Aaron & Weiss Barney, phone conversations and review of closed/out-of-business downtown establishments, Feb 2015.
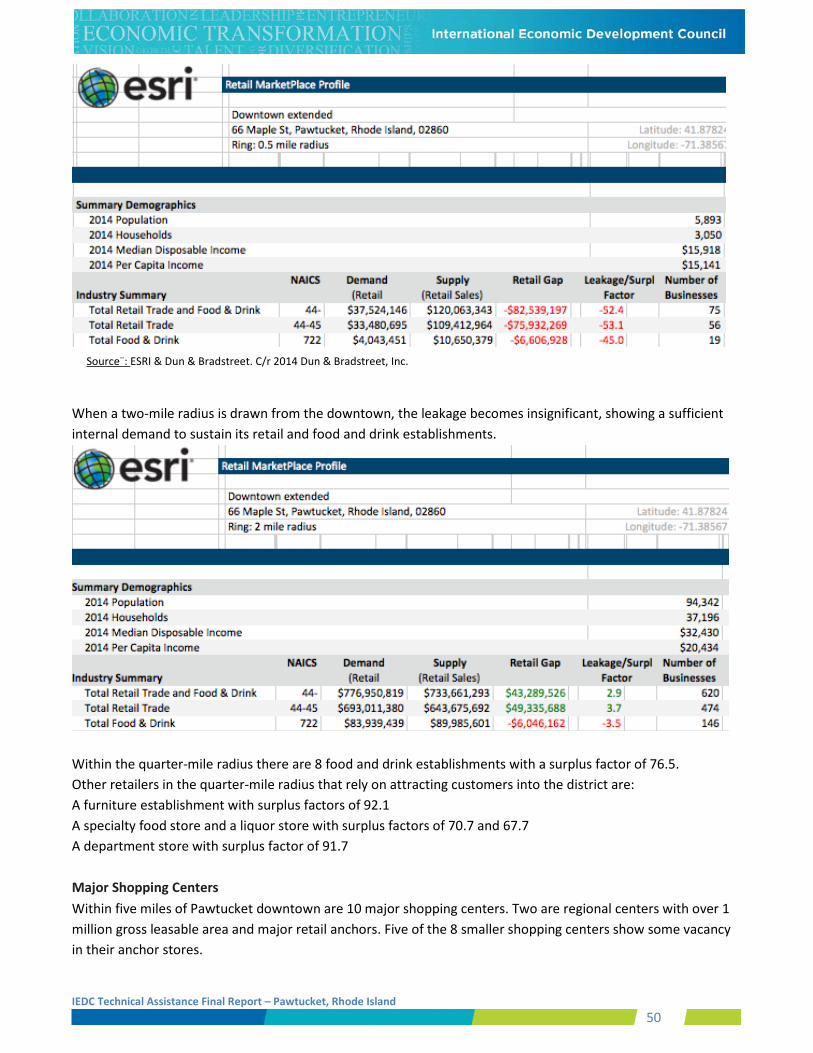
IEDC Technical Assistance Final Report – Pawtucket, Rhode Island 50
Source¨: ESRI & Dun & Bradstreet. C/r 2014 Dun & Bradstreet, Inc.
When a two-mile radius is drawn from the downtown, the leakage becomes insignificant, showing a sufficient internal demand to sustain its retail and food and drink establishments.
Within the quarter-mile radius there are 8 food and drink establishments with a surplus factor of 76.5. Other retailers in the quarter-mile radius that rely on attracting customers into the district are: A furniture establishment with surplus factors of 92.1 A specialty food store and a liquor store with surplus factors of 70.7 and 67.7 A department store with surplus factor of 91.7 Major Shopping Centers Within five miles of Pawtucket downtown are 10 major shopping centers. Two are regional centers with over 1 million gross leasable area and major retail anchors. Five of the 8 smaller shopping centers show some vacancy in their anchor stores.
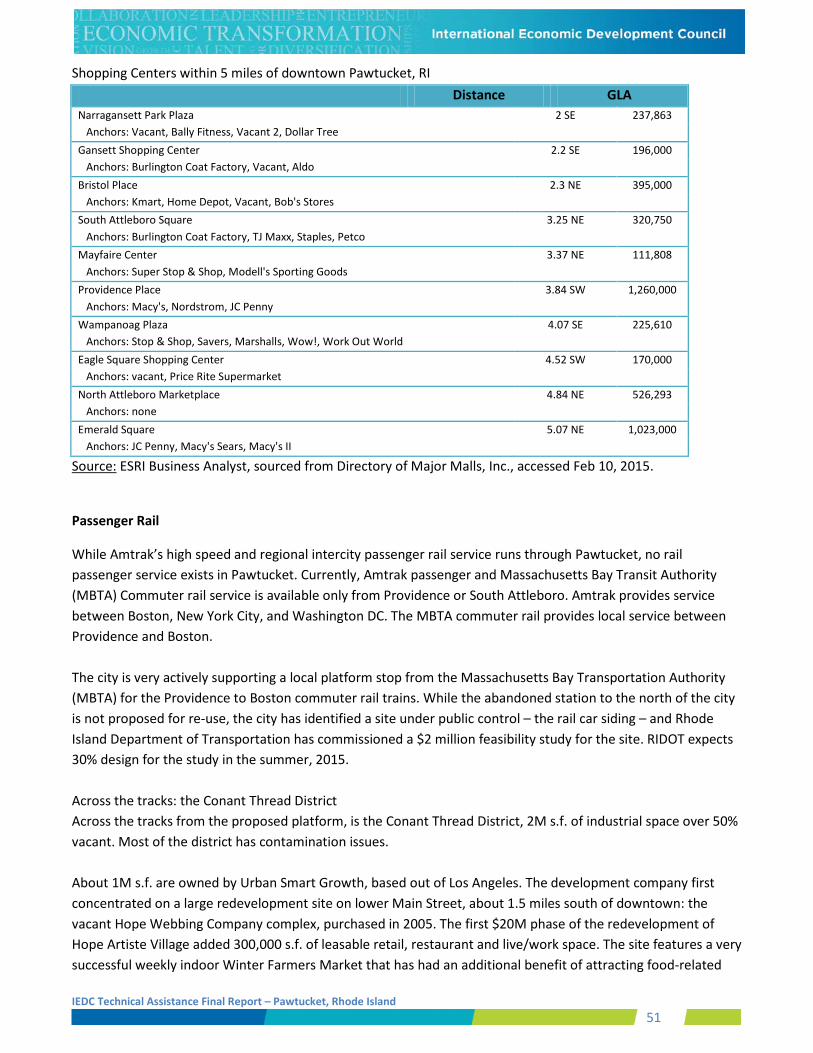
IEDC Technical Assistance Final Report – Pawtucket, Rhode Island 51
Shopping Centers within 5 miles of downtown Pawtucket, RI Distance GLA Narragansett Park Plaza 2 SE 237,863 Anchors: Vacant, Bally Fitness, Vacant 2, Dollar Tree Gansett Shopping Center 2.2 SE 196,000 Anchors: Burlington Coat Factory, Vacant, Aldo Bristol Place 2.3 NE 395,000 Anchors: Kmart, Home Depot, Vacant, Bob's Stores South Attleboro Square 3.25 NE 320,750 Anchors: Burlington Coat Factory, TJ Maxx, Staples, Petco Mayfaire Center 3.37 NE 111,808 Anchors: Super Stop & Shop, Modell's Sporting Goods Providence Place 3.84 SW 1,260,000 Anchors: Macy's, Nordstrom, JC Penny Wampanoag Plaza 4.07 SE 225,610 Anchors: Stop & Shop, Savers, Marshalls, Wow!, Work Out World Eagle Square Shopping Center 4.52 SW 170,000 Anchors: vacant, Price Rite Supermarket North Attleboro Marketplace 4.84 NE 526,293 Anchors: none Emerald Square 5.07 NE 1,023,000 Anchors: JC Penny, Macy's Sears, Macy's II
Source: ESRI Business Analyst, sourced from Directory of Major Malls, Inc., accessed Feb 10, 2015.
Passenger Rail
While Amtrak’s high speed and regional intercity passenger rail service runs through Pawtucket, no rail passenger service exists in Pawtucket. Currently, Amtrak passenger and Massachusetts Bay Transit Authority (MBTA) Commuter rail service is available only from Providence or South Attleboro. Amtrak provides service between Boston, New York City, and Washington DC. The MBTA commuter rail provides local service between Providence and Boston. The city is very actively supporting a local platform stop from the Massachusetts Bay Transportation Authority (MBTA) for the Providence to Boston commuter rail trains. While the abandoned station to the north of the city is not proposed for re-use, the city has identified a site under public control – the rail car siding – and Rhode Island Department of Transportation has commissioned a $2 million feasibility study for the site. RIDOT expects 30% design for the study in the summer, 2015. Across the tracks: the Conant Thread District Across the tracks from the proposed platform, is the Conant Thread District, 2M s.f. of industrial space over 50% vacant. Most of the district has contamination issues. About 1M s.f. are owned by Urban Smart Growth, based out of Los Angeles. The development company first concentrated on a large redevelopment site on lower Main Street, about 1.5 miles south of downtown: the vacant Hope Webbing Company complex, purchased in 2005. The first $20M phase of the redevelopment of Hope Artiste Village added 300,000 s.f. of leasable retail, restaurant and live/work space. The site features a very successful weekly indoor Winter Farmers Market that has had an additional benefit of attracting food-related
IEDC Technical Assistance Final Report – Pawtucket, Rhode Island 52
businesses to lease permanent space. The planned breakdown of spaces was 25-30% living space, 40% retail, 15% office, 10% restaurants and cafes, and 10-15% light manufacturing.26 But no plans have been forthcoming for the Conant Thread site. In February 2014, the Providence Journal reported the Thread Mill Complex and the Hope Artiste Village owed Pawtucket and neighboring Central Falls a combined $776,306 in property taxes, but that the cities were working out a payment plan.27
Freight Rail Providence and Worcester Railroad (P&W) provides the city’s freight service. The East Providence Running Track connects Valley Falls to the Massachusetts State Line. The Moshassuck Industrial Track runs along the Moshassuck River Valley and provides service to a heavily industrialized area at the Pawtucket/Lincoln line and it also links to the P&W’s yard on the Shoreline route. Air Two international airports service Pawtucket. The T.F. Green International Airport in Warwick, RI (commonly known as the Providence Airport) and Logan International Airport in Boston, MA are accessible to Pawtucket via car, taxi, bus and rail. T.F. Green International Airport is a 20 minute drive from Pawtucket and Boston Logan International Airport is about a 50 minute drive away. Marine Facilities The Blackstone River that runs through Pawtucket is tidal up to the Main Street bridge crossing. Although the river eventually reaches Narragansett Bay, several dams eventually block access downstream. But the river broadens as it flows south into the Pawtuxet, with access for Pawtucket boaters and recreational fishermen. The history of the mills lining the river has prevented consistent public access along the shore, and the city is working to improve that. Pawtucket has two areas where direct public access to the water is available for boaters. Town Landing on Taft Street has a 100-foot dock, a small boat launch ramp, parking facilities and a handicapped accessible fishing area. Because of the current at this location, the dock has been damaged. The City of Pawtucket is currently working on a construction project to relocate the dock and rebuild it. This project also includes the redevelopment of the land area, into walking paths. The project has funding and is ongoing. A future phase of the project includes the construction of an intermodal facility (Town Landing is also the planned southern terminus of the Blackstone Valley Bikeway), with restrooms and concessions. A public boat launch is south of downtown at the Former State Pier facility on the east bank of the Pawtucket River (now referred to by the City as Festival Pier). Residents utilize the pier for fishing. Also, for the past nine years, the site has also been host to the Pawtucket Chinese American Festival, which has drawn thousands from all over New England to participate in the Dragon Boat Races and to enjoy the food and entertainment.28
26 Rhode Island Art in Ruins, “Hope Artiste Village former Hope Webbing Co.,” accessed Feb 9, 2015, www.artinruns.com. 27 Shorey, Ethan, “Students present findings, take ideas on future of The thread Factory,” The Valley Breeze, 4/1/2014, www.valleybreeze.com. 28 Vanasse, Hangen, Brustlin, Inc, The Riverfront Corridor Plan, 2013, Pawtucket & Central Falls Rhode Island.
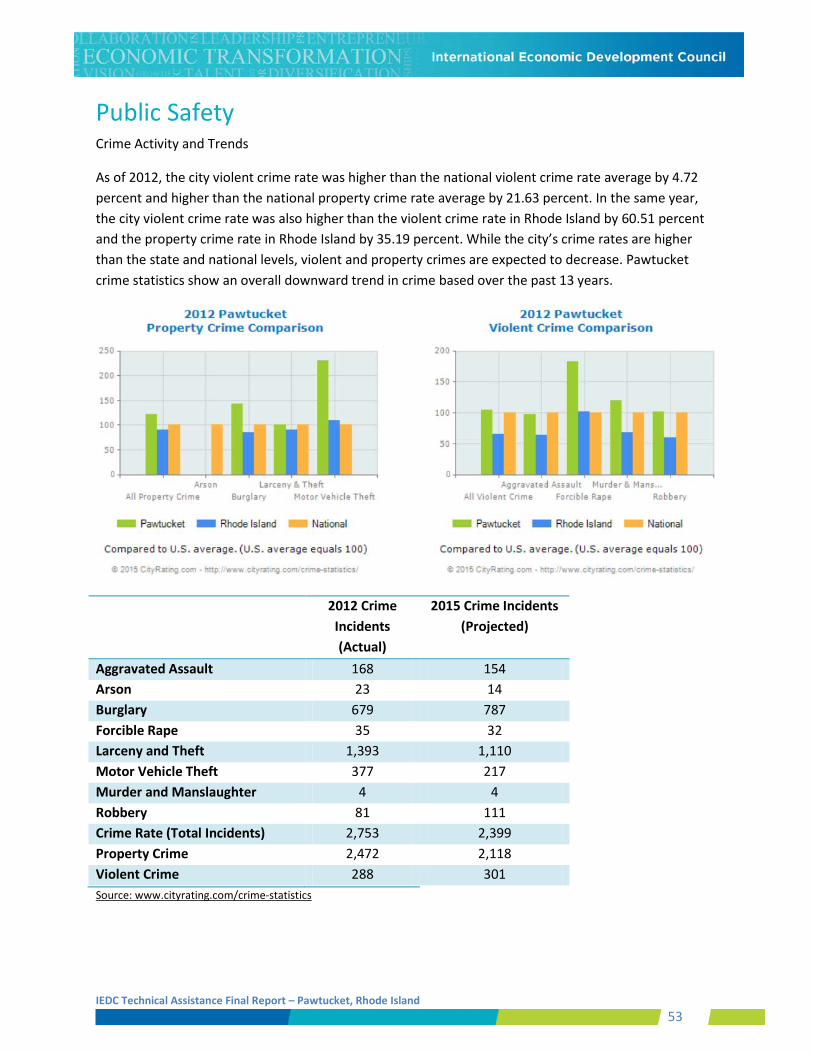
IEDC Technical Assistance Final Report – Pawtucket, Rhode Island 53
Public Safety Crime Activity and Trends
As of 2012, the city violent crime rate was higher than the national violent crime rate average by 4.72 percent and higher than the national property crime rate average by 21.63 percent. In the same year, the city violent crime rate was also higher than the violent crime rate in Rhode Island by 60.51 percent and the property crime rate in Rhode Island by 35.19 percent. While the city’s crime rates are higher than the state and national levels, violent and property crimes are expected to decrease. Pawtucket crime statistics show an overall downward trend in crime based over the past 13 years.
2012 Crime Incidents (Actual)
2015 Crime Incidents (Projected)
Aggravated Assault 168 154 Arson 23 14 Burglary 679 787 Forcible Rape 35 32 Larceny and Theft 1,393 1,110 Motor Vehicle Theft 377 217 Murder and Manslaughter 4 4 Robbery 81 111 Crime Rate (Total Incidents) 2,753 2,399 Property Crime 2,472 2,118 Violent Crime 288 301 Source: www.cityrating.com/crime-statistics
IEDC Technical Assistance Final Report – Pawtucket, Rhode Island 54
Appendix B- Recent Plans that are informing Downtown Development 2011 Pawtucket Downtown Design Plan Pawtucket River Corridor Initiative River Corridor Plan Pawtucket Rising
2012 Pawtucket Hazard Mitigation Plan Comprehensive Community Plan, 2011 Update – Chapter 3, Economic Development 2014 Rhode Map RI
IEDC Technical Assistance Final Report – Pawtucket, Rhode Island 55
Appendix C - The Team Christine Butterfield Senior Management Advisor, Management Partners, Inc. San Jose, CA Christine Butterfield has worked in local government since 1992 in both the public and private sectors. In 2008, when working as Community Development Director for the City of Cedar Rapids, Iowa, she led disaster recovery planning and service delivery following a record flood the left the community with $7 billion in damages. The disaster affected 1,400 city blocks and displaced 18,000 people. Christine is an experienced facilitator. She oversaw, designed and led a community-wide recovery planning process that engaged more than 4,000 residents in a 10-month period. In addition to residents, the process engaged all levels of government and generated plans for flood protection and the redevelopment of 10 neighborhoods. The plans and implementation actions garnered national recognition including: the American Planning Association 2011 National Planning Excellence Award for Best Practices in Hazard Mitigation and Disaster Planning; 2010 U.S Army Corps of Engineers Outstanding Planning Achievement Award; and the 2009 International Downtown Association Pinnacle Award. Christine remains active in the hazard mitigation and risk reduction community. She recently edited the American Planning Association/FEMA 2014 publication of Planning for Post-Disaster Recovery: Next Generation. In addition, she authored a 2015 American Planning Association Post-Disaster Briefing Paper titled Public Engagement in Recovery Planning. She is a member of the American Planning Association, the International City/County Managers Association and serves on the Policy Committee of the National Earthquake Engineering Research Institute. Christine holds two Bachelor of Arts degrees from the University of Minnesota in History and Political Science, and a Master’s of Arts degree in Public Policy and Administration from the Robert M. La Follette School of Public Affairs at the University of Wisconsin.
Jane Jenkins President & CEO, Downtown Oklahoma City, Inc. Oklahoma City, OK Jane Jenkins has been the President and CEO of Downtown Oklahoma City, Incorporated, since 2009. With close to 30 years of experience in downtown revitalization and management, most recently in Boulder, CO., Jane is an internationally recognized speaker and expert on urban issues.
IEDC Technical Assistance Final Report – Pawtucket, Rhode Island 56
Jane is a former Chairman for the International Downtown Association Board of Directors and is also active in the International Economic Development Council, Urban Land Institute, and the American Institute of Architects. In 2014, Jane earned accreditation from the Congress for New Urbanism. Jane is a three time finalist as Oklahoma's "Woman of the Year", and has twice been listed by Friday Magazine as one of the most powerful women in Oklahoma. Jane is a graduate of Leadership Oklahoma City and Leadership Oklahoma. She serves on the Board of Trustees for the Oklahoma City National Memorial and is a board member of HPI in Heritage Hills. A former high school educator, Jane was named 1982 Teacher of the Year at Union High School in Tulsa, Oklahoma. She holds a Master of Public Administration from the University of North Texas in Denton. Catherine Timko Principal & founder, The Riddle Company Washington, D.C. With a degree in urban studies, Catherine has more than 25 years of experience in economic and real estate marketing. Catherine is a nationally recognized expert on downtown and neighborhood retail development and attraction. She has completed retail marketing and attraction strategies for almost every major market on the East Coast including Miami, Atlanta, Washington, Philadelphia, Newark and Boston. This has resulted in considerable new retail space in underserved markets, including the first full service grocer in Newark. She has advised communities and investors on the use of economic development programs and financing and has been instrumental in the development of tools to advance retail attraction and investment. Her recent work on the Center City Philadelphia retail campaign, Be In On It, has achieved national recognition and resulted in close to 500,000 sf of new retail investment. Catherine has completed over 200 projects and studies for communities and economies of all sizes and economic strength. She has attained over $75m in earned media for client communities and investors as part of positioning strategies. Her work has netted over 1,700 new permanent jobs and more than 3 million square feet of net new retail space. Catherine is widely published on issues related to real estate and economic development and business attraction. Catherine is a frequent presenter on best practices and was recently the keynote speaker at Cleveland’s Urban Retail conference. She has also been a guest lecturer at several masters programs in real estate including at the University of Pennsylvania and University of Maryland. Catherine is the former Dean for Economic Development for ICSC Institute for Shopping Centers and is centrally active in many key industry organizations including APA, DCBIA (Founder, the Retail Committee), IDA, IEDC, ICSC (Mid-Atlantic Planning Committee; Alliance Committee), and ULI.
IEDC Technical Assistance Final Report – Pawtucket, Rhode Island 57
Richard Ward, CRE, CEcD, AICP Principal, Ward Development LLC St. Louis, MO Ward Development Counsel was established in 2011 by Richard Ward as a platform for engagement in real estate, economic and community development, planning and counseling. Previously he managed the St. Louis office of Zimmer Real Estate Services, where he was a Vice President and a member of its Development Management Group. Prior to his work with Zimmer, he was the founder and principal owner of Development Strategies, Inc. (1988-2007) Richard’s development counseling and planning assignments have been throughout the U.S, including downtown revitalization in eight major central cities and an equal number of satellite central business districts, economic development strategic and business plans on behalf of nearly twenty state, metropolitan regional, central city, urban county and major suburban economic development organizations. Richard has a Master of Business Administration and a Master of Architecture and Urban Design from Washington University, St. Louis, and a Master of Urban and Regional Planning and a Bachelor of Architecture from Virginia Tech.
Sarah Garcia, AICP Economic Development Advisor, IEDC Washington, D.C.
Sarah Garcia is an Economic Development Advisor at the International Economic Development Council. She works on a variety of technical assistance projects for disaster and community economic resilience in the Knowledge Management and Development (KMD) department at IEDC.
Sarah is a project development specialist with more than 25 years of experience, specializing in economic development, project planning and development, maritime economies, and funding strategies. She previously served as the Director of Community Development for the City of Gloucester, MA, managing city planning, economic development, conservation, open space and recreation.
During the economic collapse of the fishing industry, she led port redevelopment and diversification strategies that became national models of success. Sarah was appointed a Port Professional to the State of MA, and served on technical advisory committees to the MA Executive Office of Energy and Environmental Affairs. Sarah authored a four-course MBA concentration in Maritime Economy for the Van Loan School of Business at Endicott College. She has presented at national conferences across the country on maritime economic development.
Sarah earned her undergraduate degree in Government from Harvard University in 1982, and her Master in Public Policy from Tufts University in 2006.
IEDC Technical Assistance Final Report – Pawtucket, Rhode Island 58
Scott Annis Economic Development Specialist, IEDC Washington, D.C. Scott Annis is an Economic Development Specialist at the International Economic Development Council. He works on a variety of research and technical assistance projects in the Knowledge Management and Development (KMD) department at IEDC. He currently serves as the coordinator of grants from the U.S. Economic Development Administration that seek to provide a comprehensive set of services and resources in economic recovery and resiliency for communities throughout the EDA Northeast and Southeast regions. In addition, he serves as the coordinator of all of IEDC’s international activities and partnerships. Scott has broad experience in local and regional planning and economic development. He has worked on, and developed projects in, a variety of areas including post-disaster economic recovery, disaster resiliency, smart growth planning, brownfield redevelopment, strategic planning, long-term local and regional comprehensive planning, small business and entrepreneurship development, developing local food systems, sustainability, and bicycle & pedestrian planning. Scott earned his M.S. in Urban and Regional Planning from the University of Iowa’s School of Urban & Regional Planning. He also earned his undergraduate degree in Business Administration Finance (minor, international studies) from the University of Iowa.