Embed Size (px)
Citation preview

STRENGTHENING
CONTINUOUS
STEEL GIRDER
BRIDGES WITH
POST-INSTALLED
SHEAR
CONNECTORS
KERRY KREITMAN
AMIR R. GHIAMI AZAD
MICHAEL ENGELHARDT
TODD HELWIG
ERIC WILLIAMSON
BIOGRAPHY
Kerry Kreitman is a Ph.D.
candidate at the University of
Texas at Austin. Her doctoral
research is focused on the
strength and inelastic behavior
of composite bridge girders
under large repeated loads.
Amir Reza Ghiami Azad is a
Ph.D. candidate at the
University of Texas at Austin.
His doctoral research is focused
on the fatigue performance of
shear connectors in composite
bridge girders.
Michael Engelhardt is a
Professor at the University of
Texas at Austin. His research
covers a wide range of topics
including composite behavior,
structural fire engineering, and
earthquake engineering.
Todd Helwig is a Professor at
the University of Texas at
Austin. His research interests
include the stability of steel
structures and steel bridge
performance.
Eric Williamson is a Professor
at the University of Texas at
Austin. His research areas
include steel bridge behavior,
the dynamic response of
structures, and progressive
collapse.
SUMMARY
Many continuous steel girder
bridges constructed in the mid-
1900s have non-composite floor
systems with no shear studs.
One method of strengthening
such bridges is to “post-install”
shear connectors to attach the
existing concrete deck to the
steel girders to create composite
action. Increases in load rating
of up to 60% can be achieved by
installing a relatively small
number of connectors, which
have significantly improved
fatigue strength over welded
shear studs so that partially
composite design is feasible.
Because composite behavior
provides little strength increase
in negative bending, inelastic
moment redistribution can be
used to improve the load rating
at the interior supports.
This paper summarizes the
results of an experimental
investigation on a strengthened
girder tested under both fatigue
and strength loading conditions,
describes the design process and
connector installation
procedure, and discusses
construction considerations for
strengthening bridges in this
manner.
Page 1 of 12
STRENGTHENING CONTINUOUS STEEL GIRDER BRIDGES
WITH POST-INSTALLED SHEAR CONNECTORS
Introduction and Background
Many bridges constructed in the mid-1900s have
non-composite floor systems consisting of a
concrete deck on top of steel girders with no shear
connectors. Although these bridges are nearing
the end of their expected design life, many are still
in good condition and can potentially remain in
service for many more years. However, because
these bridges were typically designed for smaller
live loads than are used today, some may need to
be strengthened to maintain a safe load-carrying
capacity for current and future demands.
An efficient method of strengthening such bridges
is to “post-install” shear connectors to connect the
existing concrete deck to the steel girders and
create composite action. This is most effective in
regions of the bridge primarily subjected to large
positive bending moments, where the concrete is
in compression and can contribute a significant
amount of strength and stiffness to the composite
section. To address strength deficiencies in
regions dominated by negative bending, inelastic
moment redistribution from the interior supports
can be considered following the provisions in the
AASHTO LRFD Bridge Design Specifications (1).
An experimental program was carried out to
investigate the behavior of a large-scale
representative bridge girder strengthened with
post-installed shear connectors at fatigue and
strength limit states. The results of these tests,
along with findings from previous research, were
used to develop a design procedure for
strengthening continuous non-composite steel
girder bridges using post-installed shear
connectors. This paper gives an overview of the
experimental testing and results, along with a
description of the design procedure, connector
installation procedure, and construction-related
items to consider when strengthening existing
bridges in this manner.
Post-Installed Shear Connectors
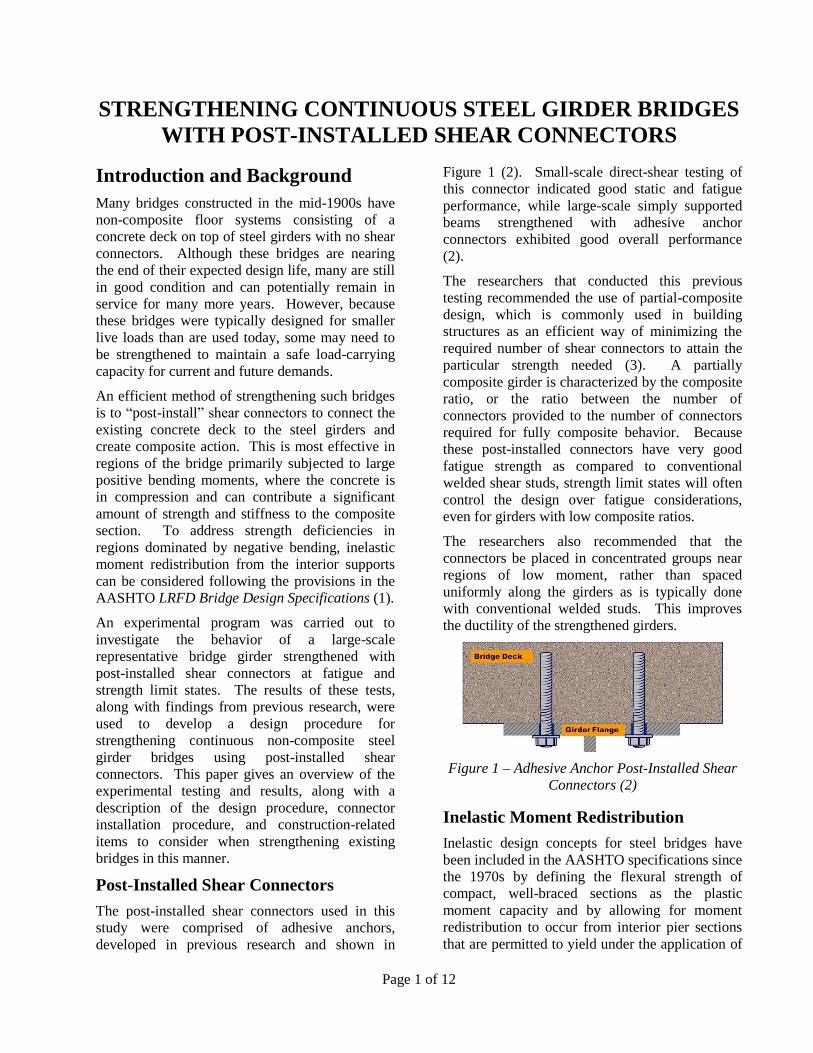
The post-installed shear connectors used in this
study were comprised of adhesive anchors,
developed in previous research and shown in
Figure 1 (2). Small-scale direct-shear testing of
this connector indicated good static and fatigue
performance, while large-scale simply supported
beams strengthened with adhesive anchor
connectors exhibited good overall performance
(2).
The researchers that conducted this previous
testing recommended the use of partial-composite
design, which is commonly used in building
structures as an efficient way of minimizing the
required number of shear connectors to attain the
particular strength needed (3). A partially
composite girder is characterized by the composite
ratio, or the ratio between the number of
connectors provided to the number of connectors
required for fully composite behavior. Because
these post-installed connectors have very good
fatigue strength as compared to conventional
welded shear studs, strength limit states will often
control the design over fatigue considerations,
even for girders with low composite ratios.
The researchers also recommended that the
connectors be placed in concentrated groups near
regions of low moment, rather than spaced
uniformly along the girders as is typically done
with conventional welded studs. This improves
the ductility of the strengthened girders.
Figure 1 – Adhesive Anchor Post-Installed Shear
Connectors (2)
Inelastic Moment Redistribution
Inelastic design concepts for steel bridges have
been included in the AASHTO specifications since
the 1970s by defining the flexural strength of
compact, well-braced sections as the plastic
moment capacity and by allowing for moment
redistribution to occur from interior pier sections
that are permitted to yield under the application of
Page 2 of 12
large loads. The appropriate limit state for
yielding under a repeated load pattern is termed
“shakedown,” and refers to the stabilization of
permanent deformations after several cycles of a
particular load pattern (4). This stabilization
occurs due to the formation of residual moments in
the statically indeterminate structure which
counteract the moments from the applied load. If
the residual moments are of such a magnitude that
when combined with the moments from the
applied load, the flexural capacity of every section
along the girder is not exceeded, elastic behavior
will ensue for all future cycles of equal or lesser
load.
This behavior serves as the basis for Autostress
Design, also called Alternate Load Factor Design
(ALFD), a bridge design method developed in the
1970s that incorporates inelastic analysis to
determine the redistribution moments for design
(5). A simpler procedure based only on elastic
analysis has since replaced the Autostress Design
provisions for moment redistribution and is
covered in Appendix B6 of the AASHTO LRFD
Bridge Design Specifications (6).
The capability of composite girders to “shake
down” has been questioned over the years due to
the lack of ductility of the concrete deck and the
complex interactions of the shear connectors with
the deck and the steel girders. Several
experimental tests of composite girders and multi-
girder systems have shown that the ALFD
provisions are conservative (7-9). However, a few
more recent tests of composite and partially
composite girders indicate that the deflections may
never truly stabilize in a composite system under
shakedown-type loading (10-12). This is possibly
due to the small-scale of these experiments, as
none were larger than ½-scale models with deck
thicknesses not exceeding 4 inches.
Survey of Non-Composite Bridges
Original plans and recent inspection reports were
reviewed for 25 non-composite steel girder bridges
in Texas to investigate the typical properties,
geometry, and condition of bridges that may be
candidates for strengthening with post-installed
shear connectors (13). With a few exceptions,
these bridges were constructed between 1955 and
1965 and have many common features.
The bridges contain two- to five-span continuous
steel girder units with three to ten girders across
the width of the bridge, carrying two to six lanes
of traffic. Span lengths vary from 40 to 270 feet,
with the spans not exceeding 100 feet long
comprised of 27- to 36-inch deep rolled wide
flange sections and longer spans made up of 4- to
10-foot deep plate girders. Cover plates are
commonly welded on the top and bottom flange of
the rolled wide flange girders at the interior piers
and in some cases in the middle of the spans as
well. All flanges of both the rolled wide flange
and plate girder sections are compact, assuming a
yield stress of 33 ksi corresponding to A7 grade
steel, which was common for the time period (14).
Concrete deck thickness varies from 6 to 7.25
inches, with #4 or #5 bars for transverse and
longitudinal reinforcement. Design compressive
strength for all decks was 3000 psi.
The surveyed bridges are generally in acceptable
condition with the most common problems being
minor rust on all steel elements, over-rotation of
bearings, and minor to moderate cracking and
spalling of the deck and concrete substructure.
Superstructure inspection ratings range from 5 to
7, or fair to good, while substructure ratings vary
from 4 to 8, or poor to very good.
Analysis of nearly half of the surveyed bridges
both before and after strengthening indicates that
up to a 60% increase in the load rating can be
achieved with this strengthening method. The
majority of these bridges can be strengthened to
reach a load-carrying capacity exceeding that
required by current design standards with a
composite ratio of only 30% and minimal moment
redistribution.
Experimental Program
Laboratory testing of a two-span continuous girder
strengthened with post-installed shear connectors
was conducted to examine the structural behavior
of such a system under different types of loading.
A summary of the test program and results is
presented here, and more details can be found
elsewhere (13).
Test Specimen and Setup
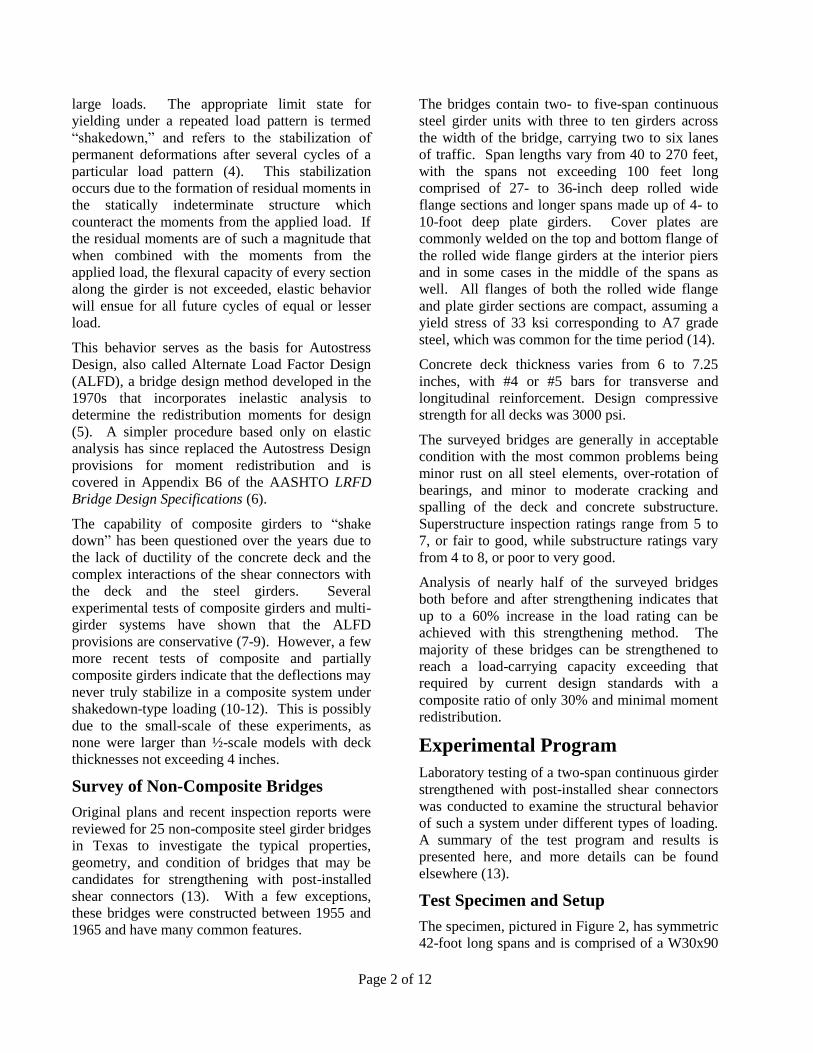
The specimen, pictured in Figure 2, has symmetric
42-foot long spans and is comprised of a W30x90
Page 3 of 12
steel beam with a 6.5-foot wide, 6.5-inch thick
concrete deck reinforced with details typically
found in the surveyed bridges. After erecting the
steel and casting the deck, a total of 56 adhesive
anchor connectors were installed in pairs in four
groups along the girder, as shown in Figure 3,
resulting in a composite ratio of approximately
30%. The test setup consisted of three load frames
which supported 400- or 500-kip capacity
hydraulic rams and could be configured to apply
point loads at the four locations labeled “A”
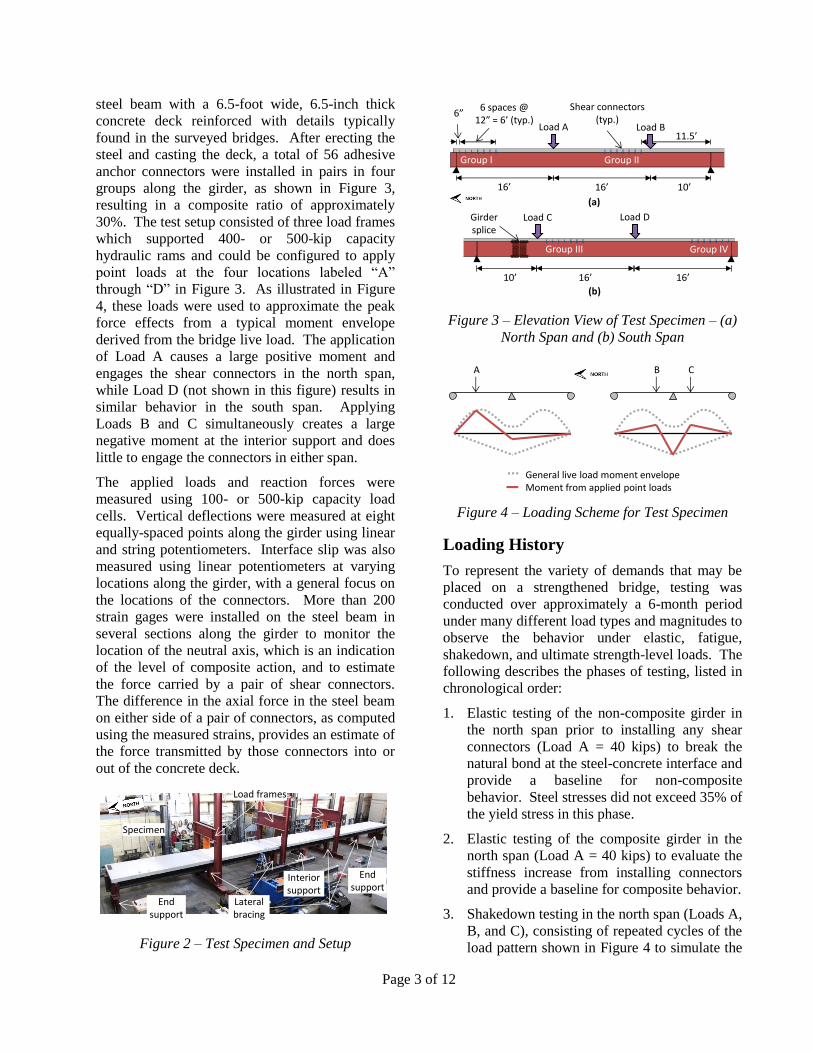
through “D” in Figure 3. As illustrated in Figure
4, these loads were used to approximate the peak
force effects from a typical moment envelope
derived from the bridge live load. The application
of Load A causes a large positive moment and
engages the shear connectors in the north span,
while Load D (not shown in this figure) results in
similar behavior in the south span. Applying
Loads B and C simultaneously creates a large
negative moment at the interior support and does
little to engage the connectors in either span.
The applied loads and reaction forces were
measured using 100- or 500-kip capacity load
cells. Vertical deflections were measured at eight
equally-spaced points along the girder using linear
and string potentiometers. Interface slip was also
measured using linear potentiometers at varying
locations along the girder, with a general focus on
the locations of the connectors. More than 200
strain gages were installed on the steel beam in
several sections along the girder to monitor the
location of the neutral axis, which is an indication
of the level of composite action, and to estimate
the force carried by a pair of shear connectors.
The difference in the axial force in the steel beam
on either side of a pair of connectors, as computed
using the measured strains, provides an estimate of
the force transmitted by those connectors into or
out of the concrete deck.
Load frames
End support
End support
Specimen
Interior support
Lateral bracing
Figure 2 – Test Specimen and Setup
16’ 16’ 10’
10’
6 spaces @ 12” = 6’ (typ.)
Load A Load B
Load CGirder splice
(a)
(b)
Load D
16’ 16’
Group I Group II
Group III Group IV
11.5’
6”Shear connectors
(typ.)
Figure 3 – Elevation View of Test Specimen – (a)
North Span and (b) South Span
A B C
General live load moment envelopeMoment from applied point loads
Figure 4 – Loading Scheme for Test Specimen
Loading History
To represent the variety of demands that may be
placed on a strengthened bridge, testing was
conducted over approximately a 6-month period
under many different load types and magnitudes to
observe the behavior under elastic, fatigue,
shakedown, and ultimate strength-level loads. The
following describes the phases of testing, listed in
chronological order:
1. Elastic testing of the non-composite girder in
the north span prior to installing any shear
connectors (Load A = 40 kips) to break the
natural bond at the steel-concrete interface and
provide a baseline for non-composite
behavior. Steel stresses did not exceed 35% of
the yield stress in this phase.
2. Elastic testing of the composite girder in the
north span (Load A = 40 kips) to evaluate the
stiffness increase from installing connectors
and provide a baseline for composite behavior.
3. Shakedown testing in the north span (Loads A,
B, and C), consisting of repeated cycles of the
load pattern shown in Figure 4 to simulate the
Page 4 of 12
effects a large truck crossing one-half of the
bridge. Cycles were repeated at the same
magnitude of load until the change in
deflection from one cycle to the next was less
than 0.01 inches. At this point, shakedown
was deemed to have occurred and the
magnitude of the loads was increased for
future cycles.
4. Fatigue testing in the south span (Load D =
50-kip range for 2 million cycles) at a load
level that caused connector slips that would be
expected to occur under HL-93 fatigue loading
in a typical strengthened bridge. A closed
loop control system was used to apply a
sinusoidal load with a frequency of 0.85 Hz.
5. Fatigue testing in the north span (Load A =
75-kip range for 330,000 cycles), at a load
level 50% greater than would be expected to
occur under HL-93 fatigue loading in a typical
strengthened bridge using a sinusoidal load
with a frequency of 0.45 Hz.
6. Shakedown testing in the south span (Loads B,
C, and D) in a similar manner to the
shakedown testing conducted previously in the
north span.
7. Ultimate strength testing in the south span
(Load D = 233 kips maximum), conducted
under monotonic load through a maximum
deflection of more than 14 inches.
8. Ultimate strength testing in the north span
(Load A = 240 kips maximum), conducted in a
similar manner as in the south span to a
maximum deflection of nearly 9 inches.
Experimental Results
Throughout all phases of testing, the girder
exhibited good structural performance and
resilience. No shear connector failures occurred in
either span until the ultimate strength testing was
conducted in the final phases.
Elastic Testing
Small levels of load were sufficient to break the
bond at the steel-concrete interface along the
majority of the girder with the exception of the
region near the load point. The remaining bond
was broken at this point by directly lifting the deck
with small hydraulic rams placed under the deck
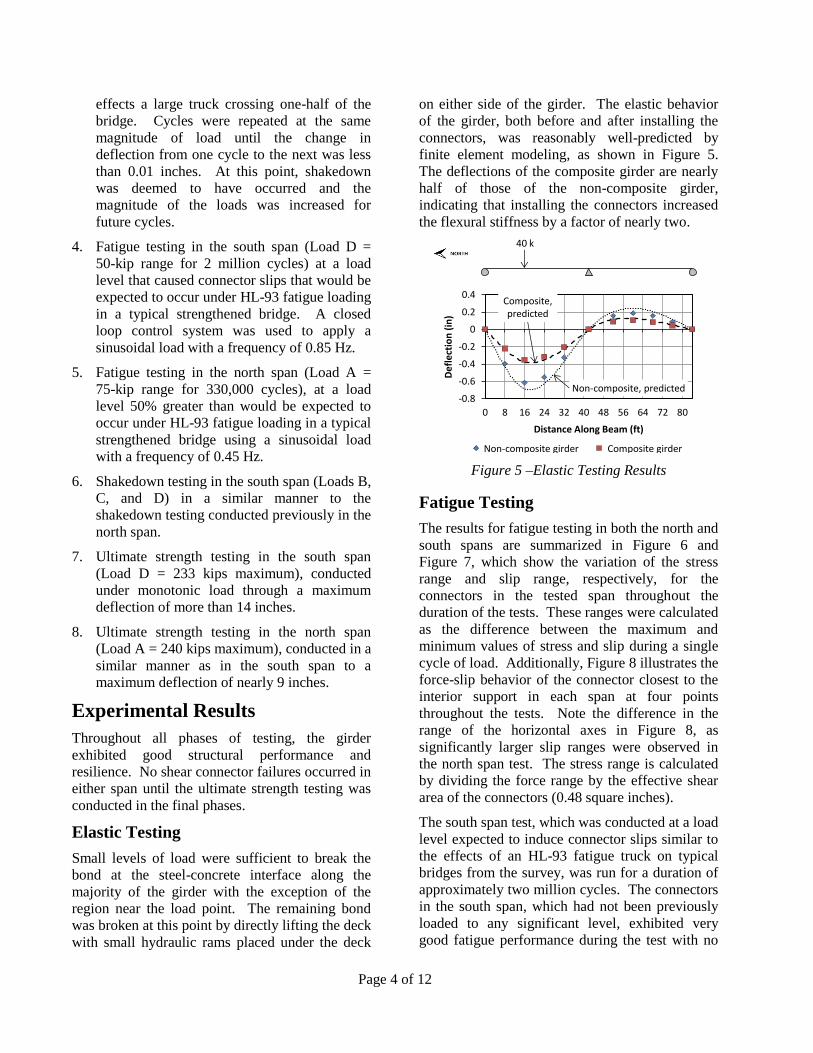
on either side of the girder. The elastic behavior
of the girder, both before and after installing the
connectors, was reasonably well-predicted by
finite element modeling, as shown in Figure 5.
The deflections of the composite girder are nearly
half of those of the non-composite girder,
indicating that installing the connectors increased
the flexural stiffness by a factor of nearly two.
-0.8
-0.6
-0.4
-0.2
0
0.2
0.4
0 8 16 24 32 40 48 56 64 72 80
De
fle
ctio
n (
in)
Distance Along Beam (ft)
Composite, predicted
Non-composite, predicted
Non-composite girder Composite girder
40 k
Figure 5 –Elastic Testing Results
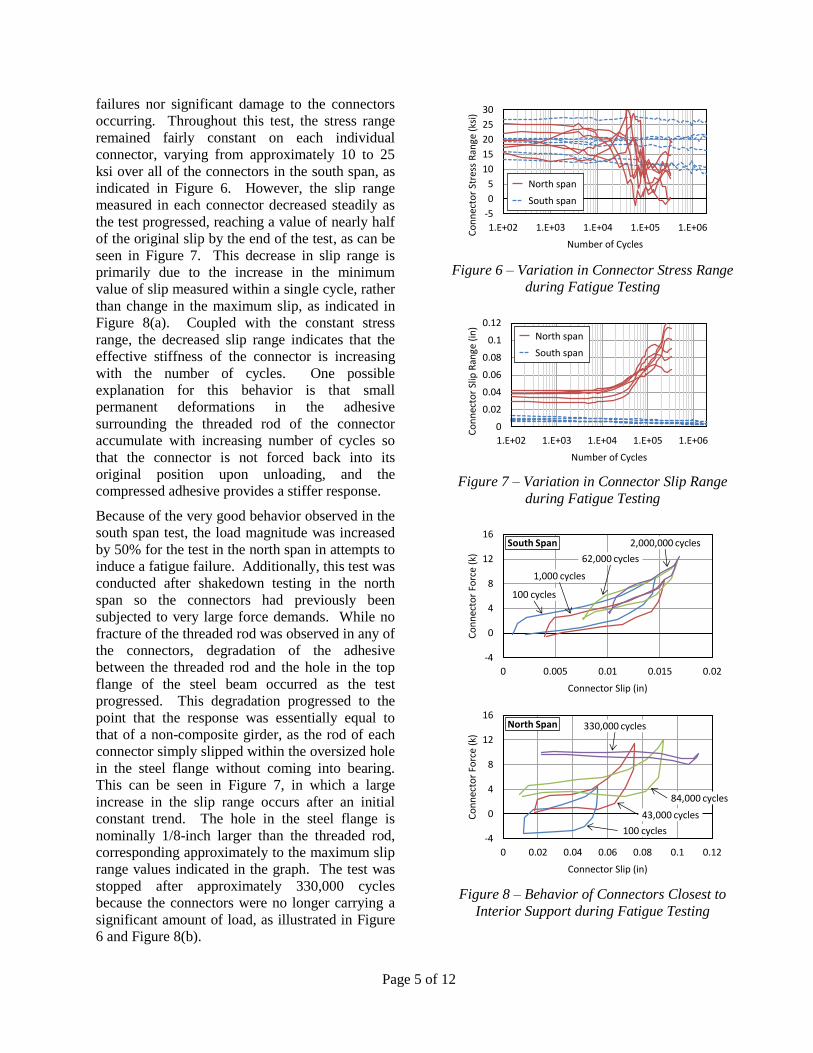
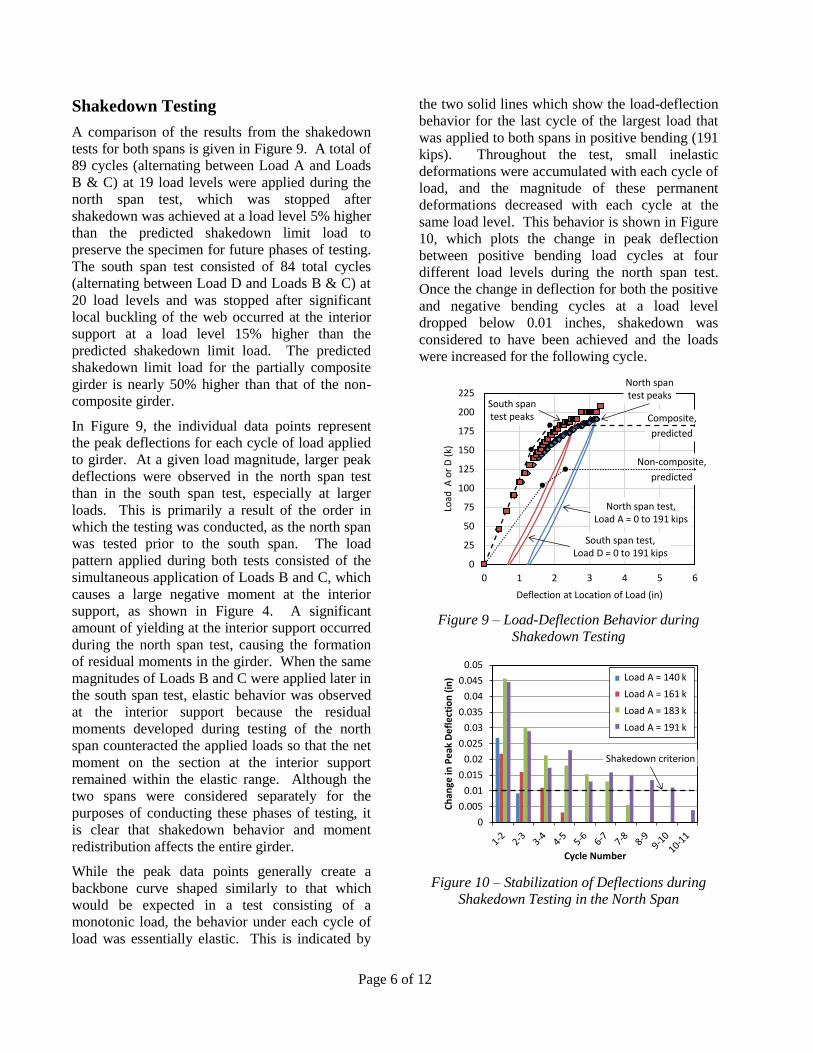
Fatigue Testing
The results for fatigue testing in both the north and
south spans are summarized in Figure 6 and
Figure 7, which show the variation of the stress
range and slip range, respectively, for the
connectors in the tested span throughout the
duration of the tests. These ranges were calculated
as the difference between the maximum and
minimum values of stress and slip during a single
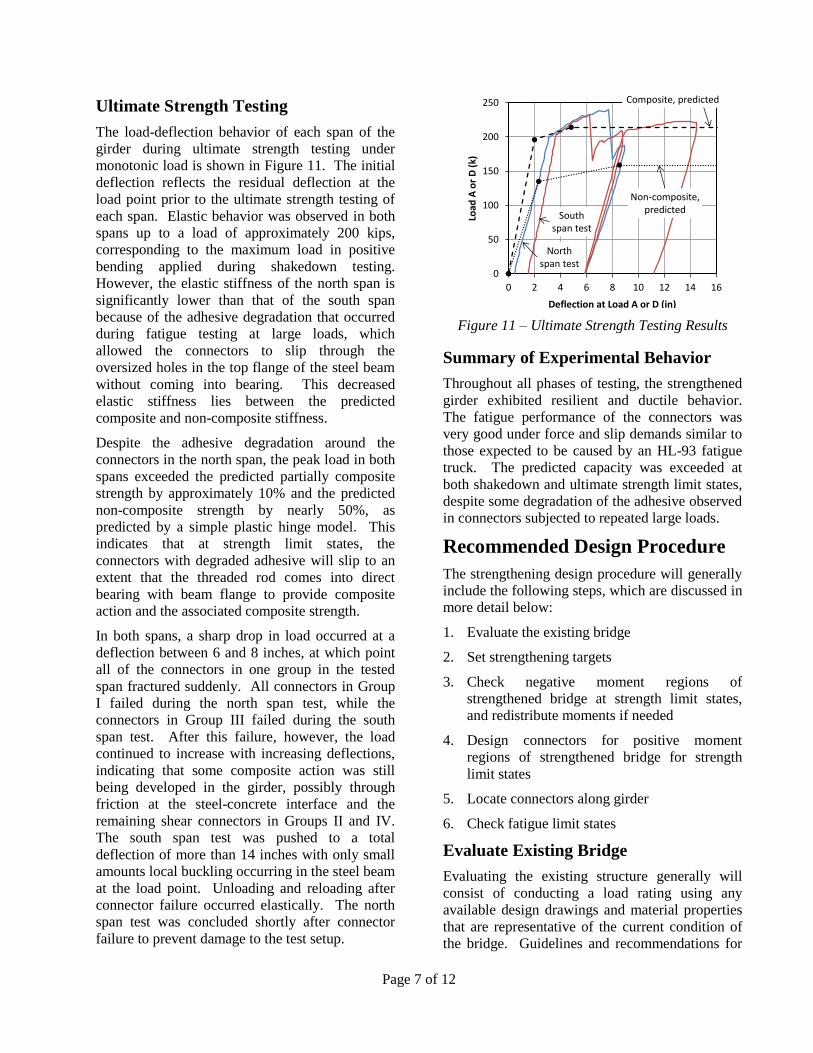
cycle of load. Additionally, Figure 8 illustrates the
force-slip behavior of the connector closest to the
interior support in each span at four points
throughout the tests. Note the difference in the
range of the horizontal axes in Figure 8, as
significantly larger slip ranges were observed in
the north span test. The stress range is calculated
by dividing the force range by the effective shear
area of the connectors (0.48 square inches).
The south span test, which was conducted at a load
level expected to induce connector slips similar to
the effects of an HL-93 fatigue truck on typical
bridges from the survey, was run for a duration of
approximately two million cycles. The connectors
in the south span, which had not been previously
loaded to any significant level, exhibited very
good fatigue performance during the test with no
Page 5 of 12
failures nor significant damage to the connectors
occurring. Throughout this test, the stress range
remained fairly constant on each individual
connector, varying from approximately 10 to 25
ksi over all of the connectors in the south span, as
indicated in Figure 6. However, the slip range
measured in each connector decreased steadily as
the test progressed, reaching a value of nearly half
of the original slip by the end of the test, as can be
seen in Figure 7. This decrease in slip range is
primarily due to the increase in the minimum
value of slip measured within a single cycle, rather
than change in the maximum slip, as indicated in
Figure 8(a). Coupled with the constant stress
range, the decreased slip range indicates that the
effective stiffness of the connector is increasing
with the number of cycles. One possible
explanation for this behavior is that small
permanent deformations in the adhesive
surrounding the threaded rod of the connector
accumulate with increasing number of cycles so
that the connector is not forced back into its
original position upon unloading, and the
compressed adhesive provides a stiffer response.
Because of the very good behavior observed in the
south span test, the load magnitude was increased
by 50% for the test in the north span in attempts to
induce a fatigue failure. Additionally, this test was
conducted after shakedown testing in the north
span so the connectors had previously been
subjected to very large force demands. While no
fracture of the threaded rod was observed in any of
the connectors, degradation of the adhesive
between the threaded rod and the hole in the top
flange of the steel beam occurred as the test
progressed. This degradation progressed to the
point that the response was essentially equal to
that of a non-composite girder, as the rod of each
connector simply slipped within the oversized hole
in the steel flange without coming into bearing.
This can be seen in Figure 7, in which a large
increase in the slip range occurs after an initial
constant trend. The hole in the steel flange is
nominally 1/8-inch larger than the threaded rod,
corresponding approximately to the maximum slip
range values indicated in the graph. The test was
stopped after approximately 330,000 cycles
because the connectors were no longer carrying a
significant amount of load, as illustrated in Figure
6 and Figure 8(b).
-5
0
5
10
15
20
25
30
1.E+02 1.E+03 1.E+04 1.E+05 1.E+06
Co
nn
ecto
r St
ress
Ran
ge (
ksi)
Number of Cycles
North span
South span
Figure 6 – Variation in Connector Stress Range
during Fatigue Testing
0
0.02
0.04
0.06
0.08
0.1
0.12
1.E+02 1.E+03 1.E+04 1.E+05 1.E+06
Co
nn
ecto
r Sl
ip R
ange
(in
)
Number of Cycles
North span
South span
Figure 7 – Variation in Connector Slip Range
during Fatigue Testing
-4
0
4
8
12
16
0 0.02 0.04 0.06 0.08 0.1 0.12
Co
nn
ecto
r Fo
rce
(k)
Connector Slip (in)
-4
0
4
8
12
16
0 0.005 0.01 0.015 0.02
Co
nn
ecto
r Fo
rce
(k)
Connector Slip (in)
100 cycles
43,000 cycles
84,000 cycles
330,000 cycles
100 cycles
1,000 cycles
2,000,000 cycles
62,000 cycles
South Span
North Span
Figure 8 – Behavior of Connectors Closest to
Interior Support during Fatigue Testing
Page 6 of 12
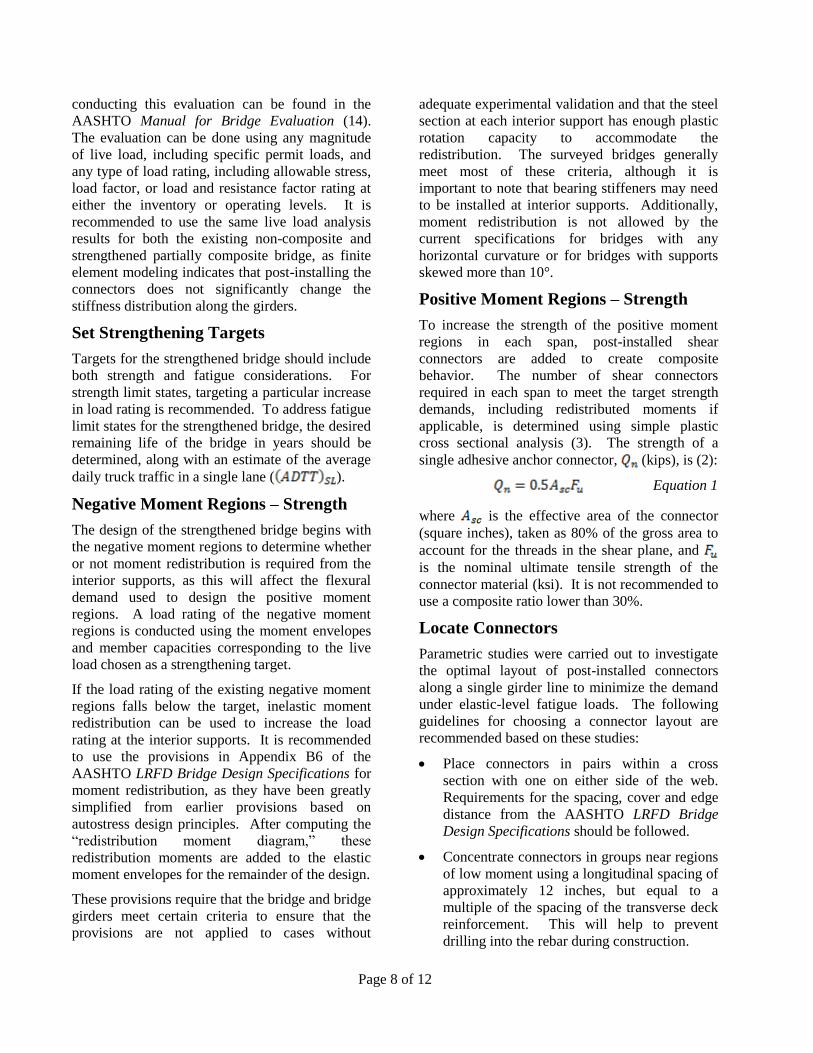
Shakedown Testing
A comparison of the results from the shakedown
tests for both spans is given in Figure 9. A total of
89 cycles (alternating between Load A and Loads
B & C) at 19 load levels were applied during the
north span test, which was stopped after
shakedown was achieved at a load level 5% higher
than the predicted shakedown limit load to
preserve the specimen for future phases of testing.
The south span test consisted of 84 total cycles
(alternating between Load D and Loads B & C) at
20 load levels and was stopped after significant
local buckling of the web occurred at the interior
support at a load level 15% higher than the
predicted shakedown limit load. The predicted
shakedown limit load for the partially composite
girder is nearly 50% higher than that of the non-
composite girder.
In Figure 9, the individual data points represent
the peak deflections for each cycle of load applied
to girder. At a given load magnitude, larger peak
deflections were observed in the north span test
than in the south span test, especially at larger
loads. This is primarily a result of the order in
which the testing was conducted, as the north span
was tested prior to the south span. The load
pattern applied during both tests consisted of the
simultaneous application of Loads B and C, which
causes a large negative moment at the interior
support, as shown in Figure 4. A significant
amount of yielding at the interior support occurred
during the north span test, causing the formation
of residual moments in the girder. When the same
magnitudes of Loads B and C were applied later in
the south span test, elastic behavior was observed
at the interior support because the residual
moments developed during testing of the north
span counteracted the applied loads so that the net
moment on the section at the interior support
remained within the elastic range. Although the
two spans were considered separately for the
purposes of conducting these phases of testing, it
is clear that shakedown behavior and moment
redistribution affects the entire girder.
While the peak data points generally create a
backbone curve shaped similarly to that which
would be expected in a test consisting of a
monotonic load, the behavior under each cycle of
load was essentially elastic. This is indicated by
the two solid lines which show the load-deflection
behavior for the last cycle of the largest load that
was applied to both spans in positive bending (191
kips). Throughout the test, small inelastic
deformations were accumulated with each cycle of
load, and the magnitude of these permanent
deformations decreased with each cycle at the
same load level. This behavior is shown in Figure
10, which plots the change in peak deflection
between positive bending load cycles at four
different load levels during the north span test.
Once the change in deflection for both the positive
and negative bending cycles at a load level
dropped below 0.01 inches, shakedown was
considered to have been achieved and the loads
were increased for the following cycle.
0
25
50
75
100
125
150
175
200
225
0 1 2 3 4 5 6
Load
A o
r D
(k)
Deflection at Location of Load (in)
Non-composite,
predicted
Composite,
predicted
South span test peaks
North span test peaks
South span test,Load D = 0 to 191 kips
North span test,Load A = 0 to 191 kips
Figure 9 – Load-Deflection Behavior during
Shakedown Testing
0
0.005
0.01
0.015
0.02
0.025
0.03
0.035
0.04
0.045
0.05
Ch
ange
in P
eak
De
fle
ctio
n (
in)
Cycle Number
Load A = 140 k
Load A = 161 k
Load A = 183 k
Load A = 191 k
Shakedown criterion
Figure 10 – Stabilization of Deflections during
Shakedown Testing in the North Span
Page 7 of 12
Ultimate Strength Testing
The load-deflection behavior of each span of the
girder during ultimate strength testing under
monotonic load is shown in Figure 11. The initial
deflection reflects the residual deflection at the
load point prior to the ultimate strength testing of
each span. Elastic behavior was observed in both
spans up to a load of approximately 200 kips,
corresponding to the maximum load in positive
bending applied during shakedown testing.
However, the elastic stiffness of the north span is
significantly lower than that of the south span
because of the adhesive degradation that occurred
during fatigue testing at large loads, which
allowed the connectors to slip through the
oversized holes in the top flange of the steel beam
without coming into bearing. This decreased
elastic stiffness lies between the predicted
composite and non-composite stiffness.
Despite the adhesive degradation around the
connectors in the north span, the peak load in both
spans exceeded the predicted partially composite
strength by approximately 10% and the predicted
non-composite strength by nearly 50%, as
predicted by a simple plastic hinge model. This
indicates that at strength limit states, the
connectors with degraded adhesive will slip to an
extent that the threaded rod comes into direct
bearing with beam flange to provide composite
action and the associated composite strength.
In both spans, a sharp drop in load occurred at a
deflection between 6 and 8 inches, at which point
all of the connectors in one group in the tested
span fractured suddenly. All connectors in Group
I failed during the north span test, while the
connectors in Group III failed during the south
span test. After this failure, however, the load
continued to increase with increasing deflections,
indicating that some composite action was still
being developed in the girder, possibly through
friction at the steel-concrete interface and the
remaining shear connectors in Groups II and IV.
The south span test was pushed to a total
deflection of more than 14 inches with only small
amounts local buckling occurring in the steel beam
at the load point. Unloading and reloading after
connector failure occurred elastically. The north
span test was concluded shortly after connector
failure to prevent damage to the test setup.
0
50
100
150
200
250
0 2 4 6 8 10 12 14 16
Load
A o
r D
(k)
Deflection at Load A or D (in)
Composite, predicted
Non-composite, predicted
North span test
South span test
Figure 11 – Ultimate Strength Testing Results
Summary of Experimental Behavior
Throughout all phases of testing, the strengthened
girder exhibited resilient and ductile behavior.
The fatigue performance of the connectors was
very good under force and slip demands similar to
those expected to be caused by an HL-93 fatigue
truck. The predicted capacity was exceeded at
both shakedown and ultimate strength limit states,
despite some degradation of the adhesive observed
in connectors subjected to repeated large loads.
Recommended Design Procedure
The strengthening design procedure will generally
include the following steps, which are discussed in
more detail below:
1. Evaluate the existing bridge
2. Set strengthening targets
3. Check negative moment regions of
strengthened bridge at strength limit states,
and redistribute moments if needed
4. Design connectors for positive moment
regions of strengthened bridge for strength
limit states
5. Locate connectors along girder
6. Check fatigue limit states
Evaluate Existing Bridge
Evaluating the existing structure generally will
consist of conducting a load rating using any
available design drawings and material properties
that are representative of the current condition of
the bridge. Guidelines and recommendations for
Page 8 of 12
conducting this evaluation can be found in the
AASHTO Manual for Bridge Evaluation (14).
The evaluation can be done using any magnitude
of live load, including specific permit loads, and
any type of load rating, including allowable stress,
load factor, or load and resistance factor rating at
either the inventory or operating levels. It is
recommended to use the same live load analysis
results for both the existing non-composite and
strengthened partially composite bridge, as finite
element modeling indicates that post-installing the
connectors does not significantly change the
stiffness distribution along the girders.
Set Strengthening Targets
Targets for the strengthened bridge should include
both strength and fatigue considerations. For
strength limit states, targeting a particular increase
in load rating is recommended. To address fatigue
limit states for the strengthened bridge, the desired
remaining life of the bridge in years should be
determined, along with an estimate of the average
daily truck traffic in a single lane ( ).
Negative Moment Regions – Strength
The design of the strengthened bridge begins with
the negative moment regions to determine whether
or not moment redistribution is required from the
interior supports, as this will affect the flexural
demand used to design the positive moment
regions. A load rating of the negative moment
regions is conducted using the moment envelopes
and member capacities corresponding to the live
load chosen as a strengthening target.
If the load rating of the existing negative moment
regions falls below the target, inelastic moment
redistribution can be used to increase the load
rating at the interior supports. It is recommended
to use the provisions in Appendix B6 of the
AASHTO LRFD Bridge Design Specifications for
moment redistribution, as they have been greatly
simplified from earlier provisions based on
autostress design principles. After computing the
“redistribution moment diagram,” these
redistribution moments are added to the elastic
moment envelopes for the remainder of the design.
These provisions require that the bridge and bridge
girders meet certain criteria to ensure that the
provisions are not applied to cases without
adequate experimental validation and that the steel
section at each interior support has enough plastic
rotation capacity to accommodate the
redistribution. The surveyed bridges generally
meet most of these criteria, although it is
important to note that bearing stiffeners may need
to be installed at interior supports. Additionally,
moment redistribution is not allowed by the
current specifications for bridges with any
horizontal curvature or for bridges with supports
skewed more than 10°.
Positive Moment Regions – Strength
To increase the strength of the positive moment
regions in each span, post-installed shear
connectors are added to create composite
behavior. The number of shear connectors
required in each span to meet the target strength
demands, including redistributed moments if
applicable, is determined using simple plastic
cross sectional analysis (3). The strength of a
single adhesive anchor connector, (kips), is (2):
Equation 1
where is the effective area of the connector
(square inches), taken as 80% of the gross area to
account for the threads in the shear plane, and
is the nominal ultimate tensile strength of the
connector material (ksi). It is not recommended to
use a composite ratio lower than 30%.
Locate Connectors
Parametric studies were carried out to investigate
the optimal layout of post-installed connectors
along a single girder line to minimize the demand
under elastic-level fatigue loads. The following
guidelines for choosing a connector layout are
recommended based on these studies:
Place connectors in pairs within a cross
section with one on either side of the web.
Requirements for the spacing, cover and edge
distance from the AASHTO LRFD Bridge
Design Specifications should be followed.
Concentrate connectors in groups near regions
of low moment using a longitudinal spacing of
approximately 12 inches, but equal to a
multiple of the spacing of the transverse deck
reinforcement. This will help to prevent
drilling into the rebar during construction.
Page 9 of 12
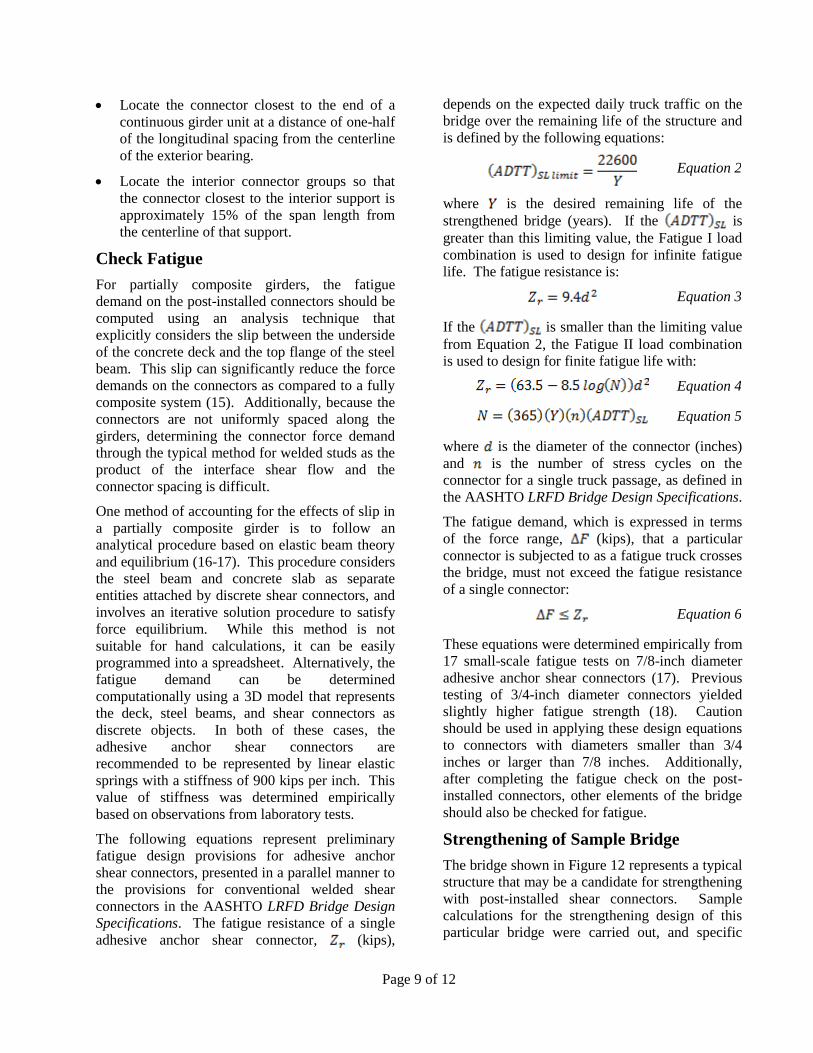
Locate the connector closest to the end of a
continuous girder unit at a distance of one-half
of the longitudinal spacing from the centerline
of the exterior bearing.
Locate the interior connector groups so that
the connector closest to the interior support is
approximately 15% of the span length from
the centerline of that support.
Check Fatigue
For partially composite girders, the fatigue
demand on the post-installed connectors should be
computed using an analysis technique that
explicitly considers the slip between the underside
of the concrete deck and the top flange of the steel
beam. This slip can significantly reduce the force
demands on the connectors as compared to a fully
composite system (15). Additionally, because the
connectors are not uniformly spaced along the
girders, determining the connector force demand
through the typical method for welded studs as the
product of the interface shear flow and the
connector spacing is difficult.
One method of accounting for the effects of slip in
a partially composite girder is to follow an
analytical procedure based on elastic beam theory
and equilibrium (16-17). This procedure considers
the steel beam and concrete slab as separate
entities attached by discrete shear connectors, and
involves an iterative solution procedure to satisfy
force equilibrium. While this method is not
suitable for hand calculations, it can be easily
programmed into a spreadsheet. Alternatively, the
fatigue demand can be determined
computationally using a 3D model that represents
the deck, steel beams, and shear connectors as
discrete objects. In both of these cases, the
adhesive anchor shear connectors are
recommended to be represented by linear elastic
springs with a stiffness of 900 kips per inch. This
value of stiffness was determined empirically
based on observations from laboratory tests.
The following equations represent preliminary
fatigue design provisions for adhesive anchor
shear connectors, presented in a parallel manner to
the provisions for conventional welded shear
connectors in the AASHTO LRFD Bridge Design
Specifications. The fatigue resistance of a single
adhesive anchor shear connector, (kips),
depends on the expected daily truck traffic on the
bridge over the remaining life of the structure and
is defined by the following equations:
Equation 2
where is the desired remaining life of the
strengthened bridge (years). If the is
greater than this limiting value, the Fatigue I load
combination is used to design for infinite fatigue
life. The fatigue resistance is:
Equation 3
If the is smaller than the limiting value
from Equation 2, the Fatigue II load combination
is used to design for finite fatigue life with:
Equation 4
Equation 5
where is the diameter of the connector (inches)
and is the number of stress cycles on the
connector for a single truck passage, as defined in
the AASHTO LRFD Bridge Design Specifications.
The fatigue demand, which is expressed in terms
of the force range, (kips), that a particular
connector is subjected to as a fatigue truck crosses
the bridge, must not exceed the fatigue resistance
of a single connector:
Equation 6
These equations were determined empirically from
17 small-scale fatigue tests on 7/8-inch diameter
adhesive anchor shear connectors (17). Previous
testing of 3/4-inch diameter connectors yielded
slightly higher fatigue strength (18). Caution
should be used in applying these design equations
to connectors with diameters smaller than 3/4
inches or larger than 7/8 inches. Additionally,
after completing the fatigue check on the post-
installed connectors, other elements of the bridge
should also be checked for fatigue.
Strengthening of Sample Bridge
The bridge shown in Figure 12 represents a typical
structure that may be a candidate for strengthening
with post-installed shear connectors. Sample
calculations for the strengthening design of this
particular bridge were carried out, and specific

Page 10 of 12
details can be found elsewhere (13). Evaluation of
an interior girder of the existing bridge yields a
load factor rating of HS 12.6 at the inventory
level, considering both the Overload and
Maximum Load limit states from the AASHTO
Standard Specifications for Highway Bridges (19).
A strengthening target of an HS 20 inventory load
factor rating can be attained by post-installing a
total of 128 adhesive anchor shear connectors
along a single girder line. This results in the outer
spans becoming nearly 50% composite and the
middle span becoming 30% composite. The shear
connector layout, shown in Figure 13, was slightly
modified from the recommended layout by
shifting the interior connectors in the outer spans
closer to the interior support to reduce the fatigue
demand. A remaining life of 20 years was chosen
as a strengthening target, with an estimated
of 300 trucks per day over that time.
14.5’
70’ 42.5’
Transverse rebar: #5 @ 6” in top and bottom mats (typ.)
Pier at end of steel unit
Pier at interior of steel unit
Centerline of steel unit(symmetric)
Cross frames, 7 spaces @ 14’
7’-10” 3’-11”Centerline of cross-section (symmetric)
Cro
ss f
ram
e (t
yp.)
Half Elevation
W33x152
8” x 3/8” x 12’ cover plates
Centerline of bearing
6.5”Half Plan View
Cross Section View
Figure 12 – Sample Bridge Geometry
70’ 42.5’
11 spaces @ 12” = 11’
7’
7 spaces @ 12” = 7’
12.5’
Centerline of bridge
(symmetric)
6”
12 pairs 12 pairs 8 pairs
Figure 13 – Connector Layout for Sample Bridge
Connector Installation Procedure
The adhesive anchor shear connectors used in this
study were comprised of 7/8-inch diameter ASTM
A193 Grade B7 threaded rods and a structural
adhesive. Figure 14 shows a photograph of a
typical group of connectors after installation. The
following steps describe the installation process:
1. Drill a 1-inch diameter hole through the top
flange of the steel beam. This can be done
using a portable drill with a magnetic base.
2. Through the hole in the flange, drill a 15/16-
inch diameter hole into the concrete deck to
the desired depth. This can be done using a
rotary hammer drill. At least a 2-inch cover to
the top of the concrete deck should be
maintained, following the provisions in the
AASHTO LRFD specifications for shear
connectors.
3. Clean the hole with a wire brush and
compressed air, or as specified by the adhesive
installation instructions.
4. Inject the adhesive into the hole as specified
by the installation instructions. Fill the hole
from the top down so that no air bubbles are
present.
5. Place the threaded rod into the hole using a
twisting motion so the adhesive fills the
threads. The threaded rod should be long
enough so that it extends below the underside
of the bottom flange an adequate distance to
accommodate a washer and a nut.
6. Allow the adhesive to cure as specified in the
instructions. After curing, install the washer
and nut. Tighten the nut to the torque
specified by the installation instructions.
7. Strike the threads below the nut with a grinder.
This will prevent the unlikely event of any
nuts that may loosen over time falling on
traffic or pedestrians passing under the bridge.
Figure 14 – Installed Adhesive Anchor Connectors
Page 11 of 12
Construction Considerations
Post-installed shear connectors have been used to
strengthen a simple span bridge located near San
Antonio, Texas (20). Experiences from field
installation on this bridge and from laboratory
work have indicated the following items to be
considered when planning to post-install shear
connectors in an existing bridge:
When completing the design and choosing
specific connector locations, accessibility and
constructability should be taken into
consideration. In some cases, it may be more
economical to install slightly more connectors
in a less efficient layout if the locations of the
connectors are more easily accessible for
installation. Slight modifications to the
recommended connector layout will generally
not have a significant effect on performance.
Depending on the particular bridge, there may
be some preparation work that needs to be
done before the connectors can be installed.
This may include general cleaning and rust
and/or paint removal in the areas in which
connectors will be installed.
The annular cutters used to drill through the
flange of the steel beam can become dull
quickly when coming in contact with concrete.
Care should be taken not to penetrate into the
concrete deck when drilling through the steel
beam. This is a more significant issue if the
inner flange surface of the steel beam is
sloped, as for S-shaped sections.
The use of a rebar locator to determine the
positions of the transverse reinforcing bars in
the deck is highly recommended to avoid
hitting rebar when drilling into the deck. If a
bar is encountered during installation, shift
away from that location approximately one-
half of the rebar spacing and continue
installing connectors from the new location.
It is recommended to choose a high quality
structural adhesive that is viscous enough to
not run downwards after it is injected into the
hole and to hold the threaded rod in place once
it is inserted. The adhesive used in all
laboratory testing (Hilti HIT-HY 150-MAX
and 200-R) exhibited adequate viscosity and
no issues were encountered during the
installation process. However, a different type
of adhesive was used to install connectors in
the field which was less viscous and created
some difficulties in completing the field
installation.
Summary and Conclusions
This study investigated the static and fatigue
behavior of continuous bridge girders strengthened
with post-installed shear connectors and inelastic
moment redistribution, and developed design
recommendations for strengthening existing non-
composite bridges in this manner. The proposed
strengthening method provides an efficient way to
extend the service life of an existing bridge and is
a feasible alternative to load-posting or other
strengthening measures, such as a full deck
replacement to install conventional welded shear
studs. Resilient and ductile structural performance
was observed under a variety of fatigue and
strength loading conditions during a 6-month long
large-scale experimental study of a two-span
strengthened girder. The design procedure is
rational and is based largely on existing bridge
design provisions, while also incorporating the
efficiency of partial-composite design concepts
and a type of shear connector with very good
fatigue strength. The installation of the adhesive
anchor connectors is straightforward and requires
minimal traffic interruption.
Acknowledgements
The authors would like to extend appreciation to
the Texas Department of Transportation for
providing the funding for this research. The views
expressed here are those of the authors, not
necessarily those of the sponsor.
References
(1) AASHTO 2010, AASHTO LRFD Bridge
Design Specifications, 5th edition, American
Association of State Highway and
Transportation Officials, Washington, DC.
(2) Kwon, G, Hungerford, B, Kayir, H, Schaap,
B, Ju, YK, Klingner, R & Engelhardt, M
2007, Strengthening Existing Non-Composite
Steel Bridge Girders Using Post-Installed
Shear Connectors, Research Report No.
Page 12 of 12
FHWA/TX-07/0-4124-1, Center for
Transportation Research, Austin, Texas.
(3) Oehlers, DJ & Bradford, MA 1995,
Composite Steel and Concrete Structural
Members: Fundamental Behavior, 1st edition,
Elsevier Science Inc., Tarrytown, New York.
(4) AISC-WRC 1971, Plastic Design in Steel: A
Guide and Commentary, 2nd edition,
American Society of Civil Engineers and the
Welding Research Council, New York, New
York.
(5) AASHTO 1986, Guide Specifications for
Alternate Load Factor Design Procedures for
Steel Beam Bridges Using Braced Compact
Sections, 1st edition, American Association of
State Highway and Transportation Officials,
Washington, DC.
(6) Barth, KE, Hartnagel, BA, White, DW &
Barker, MG 2004, “Recommended
Procedures for Simplified Inelastic Design of
Steel I-Girder Bridges,” Journal of Bridge
Engineering, vol. 9, no. 3, pp. 230-242.
(7) Roeder, CW & Eltvik, L 1985, ‘An
Experimental Evaluation of Autostress
Design,’ Transportation Research Record,
vol. 1044, pp. 35-42.
(8) Moore, M & Grubb, MA 1990, ‘Behavior of
a Two-Span Continuous Plate Girder Bridge
Designed by the Alternate Load Factor
Method,” AISC Engineering Journal, vol. 27,
no. 4, pp. 132-149.
(9) Weber, DC 1994, Experimental Verification
of Inelastic Load and Resistance Factor
Design Limits, MS Thesis, University of
Missouri-Columbia, Columbia, Missouri.
(10) Thirugnanasundralingam, K 1991,
Continuous Composite Beams under Moving
Loads, PhD Dissertation, Monash University,
Victoria, Australia.
(11) Bergson, PM 1994, Shakedown and Ultimate
Load Tests of a One-Third Scale Three-Span
Composite Bridge, MS Thesis, University of
Minnesota, Minneapolis, Minnesota.
(12) Flemming, DJ 1994, Experimental
Verification of Shakedown Loads for
Composite Bridges, PhD Thesis, University
of Minnesota, Minneapolis, Minnesota.
(13) Kreitman, K, Ghiami Azad, AR, Patel, H,
Engelhardt, M, Helwig, T, Williamson, E &
Klingner, R 2015, Strengthening Existing
Continuous Non-Composite Steel Girder
Bridges Using Post-Installed Shear
Connectors, Research Report No.
FHWA/TX-16/0-6719-1, Center for
Transportation Research, Austin, Texas.
(14) AASHTO 2011, The Manual for Bridge
Evaluation, 2nd edition, American
Association of State Highway and
Transportation Officials, Washington, DC.
(15) Seracino, R 1999, Partial-Interaction
Behavior of Composite Steel-Concrete
Bridge Beams Subjected to Fatigue Loading,
PhD Dissertation, University of Adelaide,
Adelaide, Australia.
(16) Proctor, MH 1963, Analytical and
Experimental Study of Lightweight concrete-
Steel Composite Beams, MS Thesis,
University of Missouri-Columbia, Columbia,
Missouri.
(17) Patel, HV 2013, Strengthening of
Noncomposite Steel Girder Bridges with
Post-Installed Shear Connectors: Fatigue
Behavior of the Adhesive Anchor, MS
Thesis, University of Texas at Austin, Austin,
Texas.
(18) Kayir, H 2006, Methods to Develop
Composite Action in Non-Composite Bridge
Floor Systems: Fatigue Behavior of Post-
Installed Shear Connectors, MS Thesis,
University of Texas at Austin, Austin, Texas.
(19) AASHTO 2002, Standard Specifications for
Highway Bridges, 17th edition, American
Association of State Highway and
Transportation Officials, Washington, DC.
(20) Kwon, G, Engelhardt, M & Klingner, R
2009, Implementation Project: Strengthening
of a Bridge near Hondo, Texas using Post-
Installed Shear Connectors, Research report
no. 5-4124-01-1, Center for Transportation
Research, Austin, Texas.