Embed Size (px)
Citation preview

Street Light Assessment
ET09SDGE0008
Prepared for: Prepared by:
With sections by:
December 15, 2009

Street Light Assessment ET09SDGE0008
Page 1
Preface
PROJECT TEAM
This project is sponsored by San Diego Gas & Electric’s (SDG&E®) Emerging Technologies Program
(ETP) with Jerine Ahmed as the project manager. Dan Weinheimer of the City of San Diego was the city
contact and project manager. Emerging Technologies Associates, Inc. (ETA) provided the overall
coordination of all parties involved and finalized the report. Celtic Energy, Inc. provided the technical
consulting and data analysis.
DISCLAIMER
This report was prepared as an account of work sponsored by SDG&E® ETP. While this document is
believed to contain correct information, neither SDG&E®, ETA, nor City of San Marcos, nor any
employees, associates, makes any warranty, expressed or implied, or assumes any legal responsibility
for the accuracy, completeness, or usefulness of any information, apparatus, product, or process
disclosed, or represents that its use would not infringe privately owned rights. References herein to
any specific commercial product, process or service by its trade name, trademark, manufacturer, or
otherwise, does not necessarily constitute or imply its endorsement, recommendation, or favoring by
SDG&E®, ETA nor City of San Marcos, their employees, associates, officers and members. The ideas,
views, opinions or findings of authors expressed herein do not necessarily state or reflect those of
SDG&E®, ETA or City of San Marcos. Such ideas, views, opinions or findings should not be construed as
an endorsement to the exclusion of others that may be suitable. The contents, in whole or part, shall
not be used for advertising or product endorsement purposes. Any reference to an external hyperlink
does not constitute an endorsement. Although efforts have been made to provide complete and
accurate information, the information should always be verified before it is used in any way.
ACKNOWLEDGEMENTS
The report was completed with the equipment supplied by several lighting manufacturers. SDG&E®
would like to acknowledge and thank the various vendors and the City of San Marcos. Without their
participation, this assessment project would not have been possible.

Street Light Assessment ET09SDGE0008
Page 2
Table of Contents
Executive Summary .................................................................................................................................... 5
Introduction ................................................................................................................................................ 7
Project Background .................................................................................................................................... 8
Project Overview .................................................................................................................................... 8
Technological Overview .......................................................................................................................... 8
Market Overview .................................................................................................................................... 9
Project Objectives .................................................................................................................................... 10
Methodology ............................................................................................................................................ 11
Host Site Information ........................................................................................................................... 11
Measurement Plan ............................................................................................................................... 13
Equipment ............................................................................................................................................ 15
Project Results .......................................................................................................................................... 16
Electrical Energy and Demand Savings ................................................................................................. 16
Lighting Performance ........................................................................................................................... 16
Economic Performance ......................................................................................................................... 21
Conclusion ................................................................................................................................................ 25
Appendix A ............................................................................................................................................... 27
Appendix B ............................................................................................................................................... 33
Appendix C ............................................................................................................................................... 35

Street Light Assessment ET09SDGE0008
Page 3
Abbreviations and Acronyms
ANSI American National Standards Institute
CCT Correlated Color Temperature
CIE Commission on Illumination
CRI Color Rendering Index
DOE Department of Energy
ETCC Emerging Technologies Coordinating Council
ETA Emerging Technologies Associates, Inc.
ETP Emerging Technologies Program
FC Foot Candle
FT Feet
HPS High Pressure Sodium
HR Hour
IES Illuminating Engineering Society of North America
IOU Investor-owned Utility
K Kelvin
kWh Kilowatt hours
LED Light Emitting Diode
LBNL Lawrence Berkley National Laboratory
LPD Lighting Power Density
LPS Low Pressure Sodium
MH Metal Halide
PG&E® Pacific Gas & Electric
PNNL Pacific Northwest National Laboratory
SDG&E® San Diego Gas & Electric
SSL Solid State Lighting
W Watts

Street Light Assessment ET09SDGE0008
Page 4
List of Figures
Figure 1: Existing LPS luminaire on Lindsley Park Drive ........................................................................... 10
Figure 2: Google Earth satellite image of Lindsley Park Drive .................................................................. 11
Figure 3: Induction luminaire at Lindsley Park Drive ................................................................................ 12
Figure 4: LED luminaire at Lindsley Park Drive ......................................................................................... 12
Figure 5: Typical site grid layout (Lindsley Park Drive) ............................................................................. 14
Figure 6: Scotopic and Photopic sensitivity functions .............................................................................. 18
Figure 7: CCT and effect on visibility ........................................................................................................ 20
Figure 8: CRI - Impact of light source on colors ........................................................................................ 21
List of Tables
Table 1: Energy and Demand Savings ........................................................................................................ 5
Table 2: Simple Payback - Retrofit .............................................................................................................. 5
Table 3: Energy and Demand Savings ...................................................................................................... 16
Table 4: Photopic Illuminance Levels ....................................................................................................... 17
Table 5: Scotopic Illuminance Levels ........................................................................................................ 17
Table 6: Average Scotopic and Photopic Illuminance and S/P Ratio ........................................................ 19
Table 7: Correlated Color Temperature Data ........................................................................................... 20
Table 8: Energy Cost by Light Source ....................................................................................................... 22
Table 9: Simple Payback - Retrofit ............................................................................................................ 22
Table 10: Simple Payback – New Construction ........................................................................................ 22
Table 11: City of San Marcos Labor and Truck Rate Schedule ................................................................. 23
Table 12: Paybacks with Energy and Maintenance Savings ..................................................................... 23

Street Light Assessment ET09SDGE0008
Page 5
Executive Summary
In July, 2008, the City of San Marcos and San Diego Gas & Electric’s (SDG&E®) Emerging Technologies
Program (ETP) agreed to conduct an assessment project to evaluate broad spectrum lighting
technologies, specifically induction and Lighting Emitting Diode (LED). The goal of the project was to
determine the energy savings potential provided by white light, broad spectrum lighting, as compared
to the existing low pressure sodium (LPS) street lights in a residential setting.
In addition to the assessment project goals, the City’s goals were to:
save electricity and related costs as part of its ongoing city-wide energy saving plan
improve public safety and the existing street lighting system
meet the State’s mandates such as AB32 – Global Warming Solutions Act of 2006
The project was selected due to the City of San Marcos’ willingness to allow for demonstration of
broad spectrum lighting in a residential area.
Quantitative and qualitative light and electric power measurements were taken. As reflected in the
tables below the system wattage, which accounts for the ballast and lamp, is different than just the
lamp wattage. A 39% and 32% reduction in annual energy usage and demand were recorded with LED
and induction luminaires, respectively. The simple payback is 22.0 years for LED and 22.1 years for
induction lighting. However, the payback when maintenance savings are considered is 15.5 years for
LED and 12.8 years for induction lighting.
Table 1: Energy and Demand Savings
Luminaire System Wattage
(W)
Power Savings
(W)
Demand Savings
(%)
Energy Savings
(kWh)
LPS * 83 - - -
LED 51 32 39 134
Induction 56 27 32 113
* Base Case
Table 2: Simple Payback - Retrofit
Luminaire
Luminaire
Cost
($)
Installation
Cost
($)
Total Cost
($)
Annual
Energy Cost
($)
Annual Energy
Savings
($)
Simple
Payback
(years)
LPS 55 W * 43
LED 48 W 366 38 404 24 18 22.0
Induction 55 W 289 38 327 28 15 22.1
* Base Case

Street Light Assessment ET09SDGE0008
Page 6
This assessment project will assist not only the City of San Marcos, but numerous cities across the
country to determine the street lighting retrofit options, calculate the pros and cons of each
technology and determine the impact of the streetlights on its residents and other stakeholders such
as the local law enforcement agencies and astronomer community. Local conditions and requirements
as well as economic considerations may directly impact the outcome of similar assessment projects.
Therefore, readers are advised that each installation is unique. The results of this project corroborate
similar studies, specifically those conducted by Pacific Gas & Electric (PG&E®) in the cities of Oakland,
San Francisco and San Jose, California.
Based upon the findings of this project, it is recommended that future projects conducted consider
methodology to determine the impact of broad spectrum street lighting on driver visual acuity and
responsiveness at various speeds to broad spectrum lighting technologies. Additionally, a more in
depth constituent survey may provide valuable insight as to the perception and receptiveness of such
street lighting technology.
Street Light Assessment ET09SDGE0008
Page 7
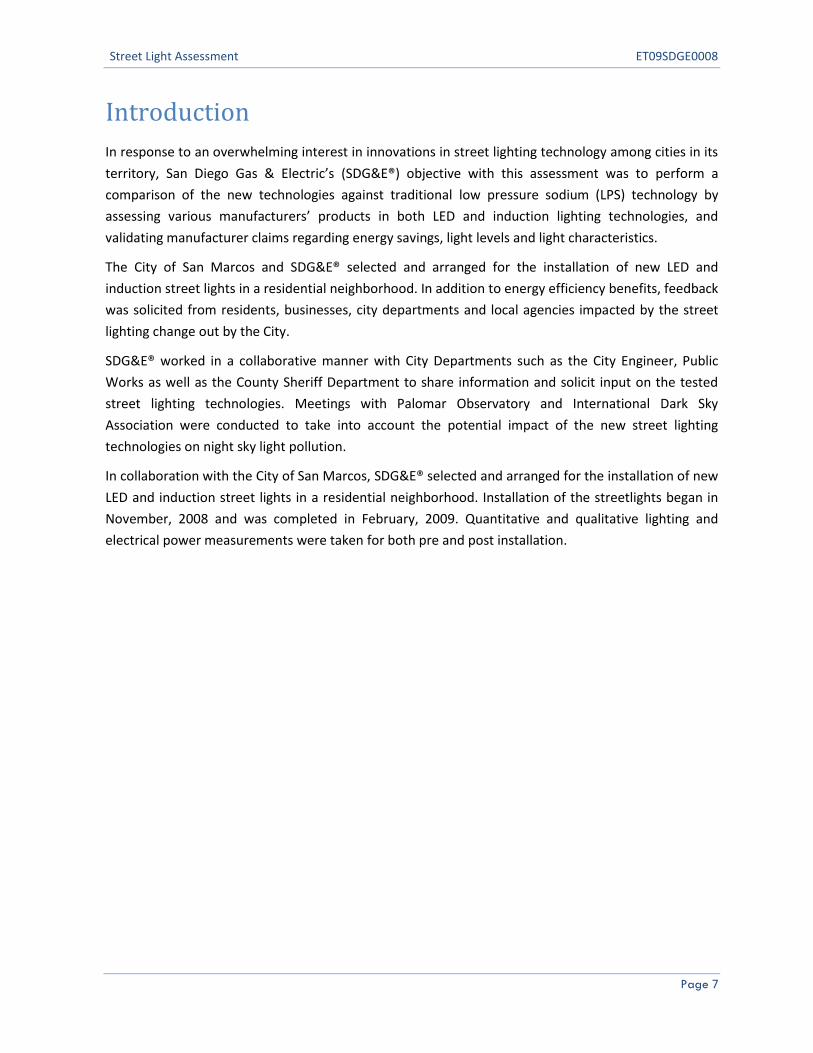
Introduction
In response to an overwhelming interest in innovations in street lighting technology among cities in its
territory, San Diego Gas & Electric’s (SDG&E®) objective with this assessment was to perform a
comparison of the new technologies against traditional low pressure sodium (LPS) technology by
assessing various manufacturers’ products in both LED and induction lighting technologies, and
validating manufacturer claims regarding energy savings, light levels and light characteristics.
The City of San Marcos and SDG&E® selected and arranged for the installation of new LED and
induction street lights in a residential neighborhood. In addition to energy efficiency benefits, feedback
was solicited from residents, businesses, city departments and local agencies impacted by the street
lighting change out by the City.
SDG&E® worked in a collaborative manner with City Departments such as the City Engineer, Public
Works as well as the County Sheriff Department to share information and solicit input on the tested
street lighting technologies. Meetings with Palomar Observatory and International Dark Sky
Association were conducted to take into account the potential impact of the new street lighting
technologies on night sky light pollution.
In collaboration with the City of San Marcos, SDG&E® selected and arranged for the installation of new
LED and induction street lights in a residential neighborhood. Installation of the streetlights began in
November, 2008 and was completed in February, 2009. Quantitative and qualitative lighting and
electrical power measurements were taken for both pre and post installation.

Street Light Assessment ET09SDGE0008
Page 8
Project Background
PROJECT OVERVIEW
The Street Lighting Assessment project was conducted as part of the Emerging Technologies Program
of San Diego Gas & Electric Company. The Emerging Technologies program “is an information-only
program that seeks to accelerate the introduction of innovative energy efficient technologies,
applications and analytical tools that are not widely adopted in California. The information includes
verified energy savings and demand reductions, market potential and market barriers, incremental
cost, and the technology’s life expectancy. Project Management and Methodology was provided by
Emerging Technologies Associates, Inc.
The Street Lighting Assessment project studied the applicability of broad spectrum lighting consisting
of LED and QL induction luminaires on existing street light poles. Existing LPS luminaires were replaced
with new LED and induction luminaires in a neighborhood in San Marcos, CA. The street selected for
the assessment was Lindsley Park Drive. The test site allowed for side-by-side comparison of the
lighting performance of the base case, LPS and the emerging technologies, LED and QL induction, being
assessed. The applicability of the technology was determined by light output, energy and power usage,
economic factors and qualitative satisfaction.
TECHNOLOGICAL OVERVIEW
At the time of this assessment, LED and induction broad spectrum lighting were gaining momentum
because of the luminaire’s ability to provide greater control of light dispersion, greater operating and
maintenance savings and desire for higher quality light for exterior use. One such application is street
and roadway light luminaires. Currently, the streets in San Diego County, in which San Marcos is
located, are illuminated with LPS, HPS and less frequently metal halide (MH). LPS lights are used
primarily because of their long rated life and high efficiency relative to other conventional options, but
LPS sources also have low color rendition. In San Diego County, ordinances were passed by cities in
1984 requiring LPS street lighting to protect the night sky. New technologies like induction lighting and
LEDs have the potential for even longer life than LPS, reduced maintenance, high color rendition, and
reduced operating cost including lower energy usage. Currently however, the initial cost of this
technology is higher than conventional light sources.
The US Department of Energy reports that LED technology is changing at a rapid pace. Overall, the
performance of LED technology is quickly gaining efficiency but the first cost remains a barrier to
market entry. However, it should be noted that the costs for LED technology seems to be getting more
competitive in the market place with each year that passes and technological advances are applied to
street lighting. The induction technology has been in the market since the early 1990s. Therefore,
induction has more of a history in numerous outdoor lighting applications including street lighting. For
Street Light Assessment ET09SDGE0008
Page 9
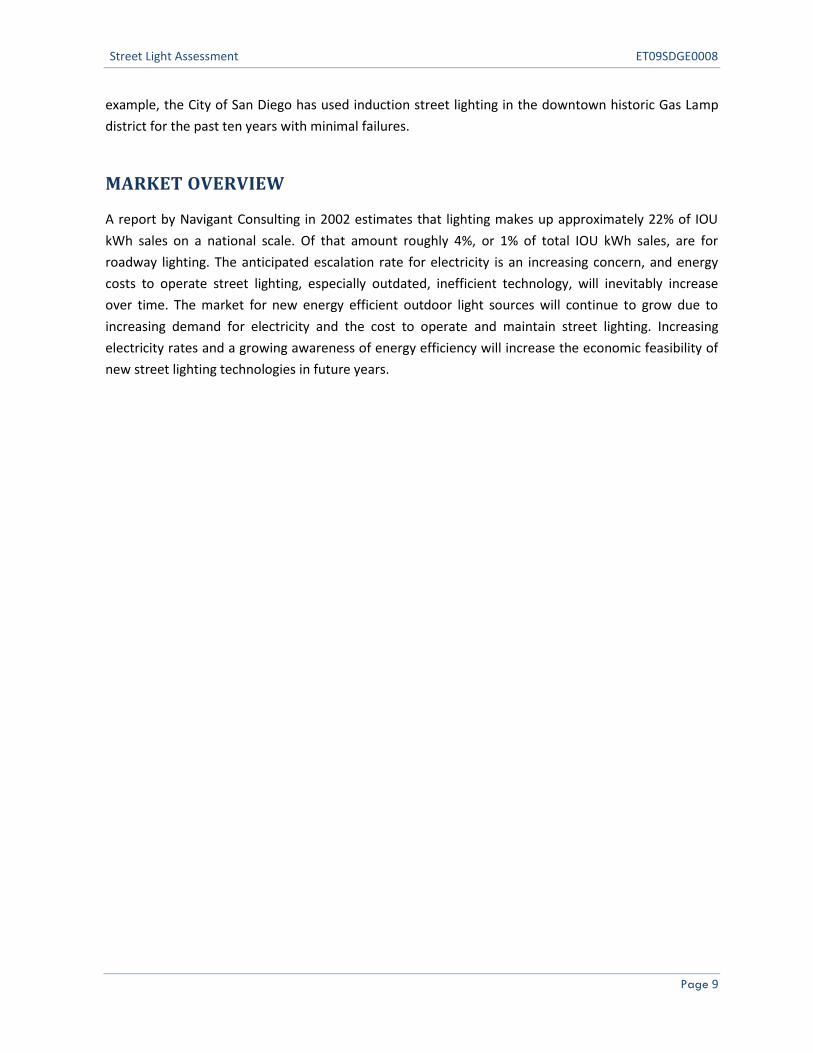
example, the City of San Diego has used induction street lighting in the downtown historic Gas Lamp
district for the past ten years with minimal failures.
MARKET OVERVIEW
A report by Navigant Consulting in 2002 estimates that lighting makes up approximately 22% of IOU
kWh sales on a national scale. Of that amount roughly 4%, or 1% of total IOU kWh sales, are for
roadway lighting. The anticipated escalation rate for electricity is an increasing concern, and energy
costs to operate street lighting, especially outdated, inefficient technology, will inevitably increase
over time. The market for new energy efficient outdoor light sources will continue to grow due to
increasing demand for electricity and the cost to operate and maintain street lighting. Increasing
electricity rates and a growing awareness of energy efficiency will increase the economic feasibility of
new street lighting technologies in future years.

Street Light Assessment ET09SDGE0008
Page 10
Project Objectives
The objectives of this project were to examine electrical, lighting, and economic performance of cobra-
head LPS luminaires as compared to LED and induction luminaires used in this assessment conducted
at the City of San Marcos. The potential electrical demand and energy savings were measured in terms
of instantaneous system wattage and estimated annual kWh usage based on SDG&E’s LS-2 Rate which
assumes 4,165 annual operating hours. Lighting performance was measured in terms of illuminance,
uniformity, the scotopic to photopic ratios and Correlated Color Temperature (CCT) measured in Kelvin
(K). Additionally, acceptance from residents and community interested parties such as Palomar
Observatory and law enforcement authorities was sought by the City of San Marcos officials. Finally,
economic performance was calculated as simple-payback for substitution in new installation or
replacement scenarios, accounting for lamp life-span, maintenance costs, and electrical costs.
Figure 1: Existing LPS luminaire on Lindsley Park Drive

Street Light Assessment ET09SDGE0008
Page 11
Methodology
HOST SITE INFORMATION
The site selected for this assessment was Lindsley Park Drive, San Marcos, CA (see Figure 2) a
residential area where the existing street lights are 55 W (nominal) LPS cobra-head luminaires. The LPS
luminaires are at a height of 26.5 ft. As shown in Figure 1 below, the street makes a U-shape
connecting Rees Road to Rock Springs Road. Two street lights were chosen on each side of the street
which is marked on the Google Earth satellite photo. It should be noted that all LPS fixtures were
replaced in the area with LED and Induction to provide for an assessment area free from other light
source trespass which may have affected the data. The natural curvature of the street provided for a
“buffer zone” and served as the demarcation between the two technologies. A street view of each
light pole fixture chosen for the data collection is shown in Figures 3 and 4.
Figure 2: Google Earth satellite image of Lindsley Park Drive
LED
LED
Induction
Buffer Zone
Street Light Assessment ET09SDGE0008
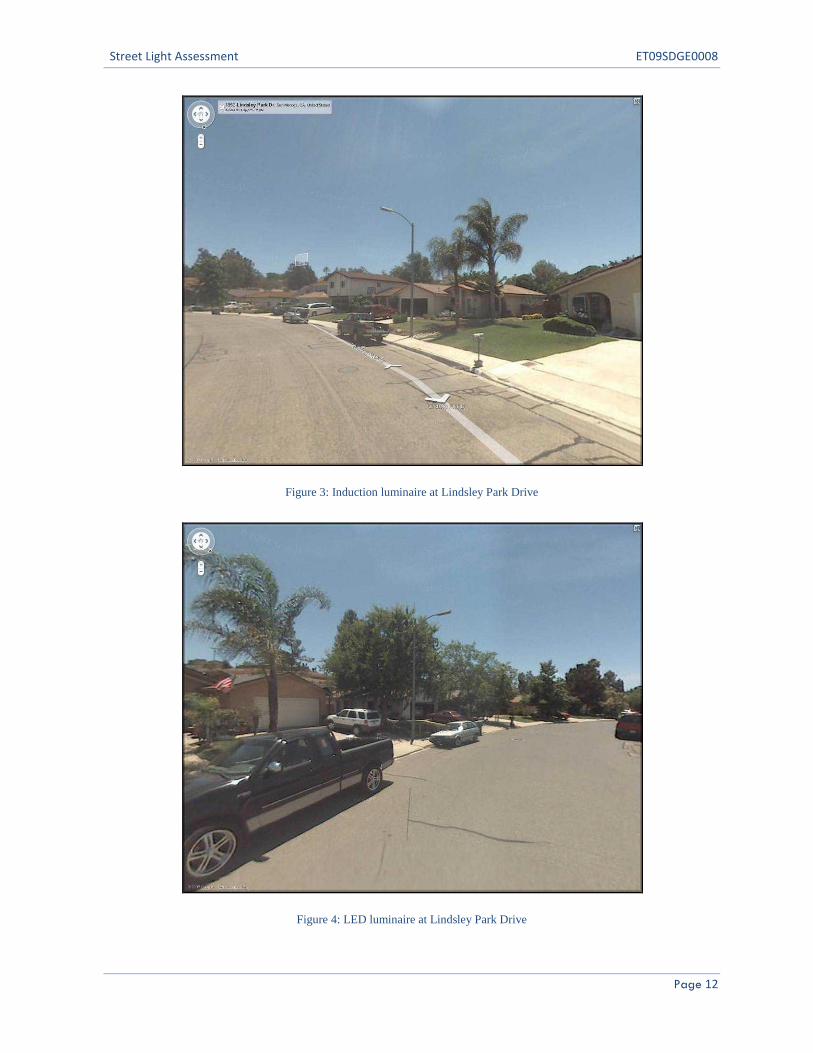
Page 12
Figure 3: Induction luminaire at Lindsley Park Drive
Figure 4: LED luminaire at Lindsley Park Drive

Street Light Assessment ET09SDGE0008
Page 13
MEASUREMENT PLAN
The Street Lighting Assessment project studies the suitability and performance of LED and QL
induction luminaires in a street lighting application. LPS luminaires were replaced with new LED and
induction luminaires along Lindsley Park Drive with the established buffer zone in between the
technologies. Quantitative and qualitative light and electrical power measurements were taken.
A measurement plan was developed for this assessment. Pre-installation and post-installation field
visits were conducted. The monitoring area was established during the first site visit prior to taking
measurements. Meetings with the City Manager’s Office and Public Works project team were
conducted to ensure that no outstanding issues would preclude the installation of the LED and
induction luminaires on San Marcos city streets.
During the pre-installation field visit, data point grids were laid out on the asphalt in accordance with
RP-08-00, the methodology recommended by the Pacific Northwest National Laboratory (PNNL) who
conducts Gateway demonstrations for the DOE’s Solid State Lighting (SSL) Commercialization Initiative.
“RP-08-00 American National Standard Practice for Roadway Lighting is the Recommended Practice
provides the design basis for lighting roadways, adjacent bikeways, and pedestrian ways. It deals
entirely with lighting and does not give advice on construction. It is not intended to be applied to
existing lighting systems until such systems are redesigned. This Practice revises and replaces the
previous edition which was published in 1983 and reaffirmed in 1993. Roadway lighting is intended to
produce quick, accurate, and comfortable seeing at night that will safeguard, facilitate, and encourage
vehicular and pedestrian traffic. The proper use of roadway lighting is also associated here with certain
economic and social benefits including a reduction in nighttime accidents, aid to police, facilitation of
traffic flow, and the promotion of business during nighttime.” (source: ANSI/IES RP-08-00 (2005))
To ensure proper documentation of the existing LPS street lighting, the LPS lamps had been replaced
with new lamps and the luminaires had been cleaned. The LPS lamps were burned in for approximately
100 hours prior to conducting measurements. All light measurements were taken after dusk.
A two phase measurement plan was undertaken. In Phase 1, pre-installation power readings and light
measurements of the LPS fixtures illuminated at both locations were taken. The light measurements
that were taken included both photopic and scotopic illuminance readings. Phase 2 of this assessment
involved the replacement of the LPS fixtures at both locations with LED and Induction fixtures. During
the post-installation visit, power readings and light measurements were taken again on the same grid
layout. This allowed for a comparison analysis between the street lighting technologies: the base case
LPS, LED and induction.
Photopic and scotopic illuminance measurements were taken on a 50’ by 45’ grid under two street
lights at separate locations on Lindsley Park Drive. The average, maximum, and minimum illuminance
levels along with average uniformity ratio were measured in foot candles (fc) for ease of use and
understanding.

Street Light Assessment ET09SDGE0008
Page 14
Figure 5: Typical site grid layout (Lindsley Park Drive)
The luminaires extend up approximately 26.5' above the finished grade, on 6’ mounting arms out from
metal poles. The illuminance levels were taken with a Solar Light PMA220 meter with photopic and
scotopic detectors that were placed directly on the pavement. This meter has a precision of 0.09 fc.
It should be noted that the field measurements differ slightly from those defined in the “Illuminating
Engineering Society of North America (IES) Guide for Photometric Measurement of Roadway Lighting
Installations.” IES recommends that the grid be laid out so that measurements are taken beginning at
one-half the grid spacing from the spot directly beneath the luminaire. In this study, the measurement
grid was laid out such that the measurements were taken at the predicted maximum and minimum
illuminance levels in the test area, corresponding to the areas directly underneath luminaires and at 5’
increments between luminaires. This was done to capture the full effect of differing uniformity in the
LPS, LED, and Induction luminaires. IES also recommends that care be taken to level the detector
before each measurement and that the detector be less than 6” off the ground. The monitoring team
determined that the former recommendation was of greater importance, so measurements were
taken at ground level. The same procedure was followed for both pre and post measurements.

Street Light Assessment ET09SDGE0008
Page 15
EQUIPMENT
The following equipment used in the execution of this Measurement Plan was obtained from the
Pacific Energy Center:
Illuminance Meter
Solar Light SnP Meter (PMA220) with Photopic Detector (PMA2130) and Scotopic Detector (PMA2131),
last calibrated 10/2007
Correlated Color Temperature meter
Konica Minolta Chrome Meter, Model CL-200, last calibrated 10/2007
Consultant owned equipment was used for:
Power Readings
Fluke Clamp Meter, Model 332

Street Light Assessment ET09SDGE0008
Page 16
Project Results
ELECTRICAL ENERGY AND DEMAND SAVINGS
The LED luminaire used 39% less power than the LPS with an annual reduction of energy usage of 134
kWh. These results are similar to those recorded in other assessments in Oakland, San Jose and San
Francisco (see Appendix C). The induction luminaires used 32% less power than the LPS with an annual
reduction of 113 kWh. Table 3 contains this data. The energy use is based on 4,165 hours.
Table 3: Energy and Demand Savings
Luminaire Voltage
(V)
System
Wattage (W)
Energy
(kWh)
Power
Savings (W)
Demand
Savings (%)
Energy
Savings (kWh)
LPS * 240 83 346 - - -
LED 240 51 212 32 39 134
Induction 240 56 233 27 32 113
* Base Case
LIGHTING PERFORMANCE
Both photopic and scotopic illuminance measurements were taken on the 50’ x 45’ grid described in
the above section, “Monitoring Plan.” The eye’s “photopic response” to light is primarily vision under
well-lit conditions such as daytime. The “scotopic response” to light is primarily vision under very low
light such as nighttime. Published lumen ratings reflect photopic lumens. A scotopic/photopic meter
was used to measure spectral responses following the CIE scotopic and photopic action spectrum.
Determining the photopic and scotopic lumens of a particular light source simulates how the human
eye perceives light at normal light levels.
Current scientific research is determining that the interplay of scotopic and photopic vision helps us to
see under different conditions. Therefore, it is important to record both photopic and scotopic light
measurements as a part of the light performance assessment. Dr. Sam Berman in his article, “The
Coming Revolution in Lighting Practice,” states, “…both cone and rod responses to lighting need to be
evaluated. This means knowledge of both photopic and scotopic components of the observed light is
necessary to provide optimum lighting for visual performance and brightness perception.” (Source:
www.bluebellgroup.com/62.pdf). Because of the eye’s response to lower light levels at night through
rod activated vision (scotopic), the scotopic response may be a factor to consider when selecting street
light or outdoor luminaires.

Street Light Assessment ET09SDGE0008
Page 17
1. Average, Minimum and Maximum Illuminance
The average illuminance levels for each test site were calculated and recorded in fc for ease of use.
These average illuminance levels, along with the maximum and minimum measured values, were then
used to calculate the average- and maximum-to-minimum uniformity ratios. See Appendix A for raw
illuminance data and plots.
Table 4 and 5 contain the data which represents a comparison of average, maximum, and minimum
illuminance levels as well as uniformity ratios for each street light technology at its respective location.
Table 4: Photopic Illuminance Levels
Luminaire Illuminance (fc) Uniformity
Avg Max Min Avg to Min Max to Min
LPS * 0.47 1.2 0.1 4.7:1 12:1
LED 0.53 1.3 0.1 5.3:1 13:1
Induction 0.47 1.2 0.1 4.7:1 12:1
* Base Case
Table 5: Scotopic Illuminance Levels
Luminaire Illuminance (fc) Uniformity
Avg Max Min Avg to Min Max to Min
LPS * 0.23 0.5 0.05 4.6:1 10:1
LED 0.74 2.1 0.1 7.4:1 21:1
Induction 0.66 1.9 0.1 6.6:1 19:1
* Base Case
It should be noted that due to the layout of the test area and the orientation of the luminaire arms,
measurements were not necessarily taken directly under the luminaires. However, this deviation was
deemed to be of small enough order to have minimal effect on the overall analysis. In addition, due to
the in situ nature of the monitoring, some measurement locations were obstructed. When possible,
data for these locations was estimated to be the same as that from nearby points on the grid.
2. Uniformity Ratios
In outdoor lighting uniformity is a measure of how evenly light is distributed across a surface. Typically,
the measure is expressed as a ratio of one value to another such as maximum to minimum. Using
ratios, perfect uniformity is 1:1.
As indicated in Table 5, photopically, uniformity ratios for the LED luminaire were slightly higher, less
uniform, than the LPS luminaire and lower for the induction luminaire. Scotopically, the uniformity
ratios were higher for both the LED and induction luminaires. Although the uniformity of light
distribution was similar photopically and higher scotopically for the LED and induction luminaires, the

Street Light Assessment ET09SDGE0008
Page 18
difference in distribution is less critical when taking into account the major decrease in overall power
and energy usage between the lighting technologies.
3. Scotopic/Photopic Ratios
Dr. Sam Berman, Senior Scientist Emeritus, Lawrence Berkley National Laboratory (LBNL), is a leading
scientist conducting research of the effect of lighting on vision. He states, “At different light levels,
people exhibit different relative sensitivities to light.” Another important factor to analyze is the S/P
ratio. An S/P ratio is the ratio of light measured by the scotopic and photopic light meters. This ratio is
important as it determines how well a person can/will perceive something based upon the eye’s
sensitivity to different wavelengths of light. The retina, a light sensitive membrane at the back of the
eye, contains millions of very tiny light receptors that convert light into electrified signals sent to the
vision centers of the brain. The two major categories of light receptors (photoreceptors) are called
cones and rods because of their shapes. The very central part of the retina, the fovea, contains only
cones. The rest of the retina contains both rods and cones, with the number of rods dominating the
cones by about ten to one. Up until now, it is widely accepted that the cones handle day vision while
the rods are designed for night vision.
Figure 6 shows the scotopic and photopic sensitivity differences at various wavelengths of light.
Figure 6: Scotopic and Photopic sensitivity functions
Table 6 below shows the S/P ratios of each luminaire.

Street Light Assessment ET09SDGE0008
Page 19
Table 6: Average Scotopic and Photopic Illuminance and S/P Ratio
Luminaire Average
Scotopic Illuminance (fc) Average
Photopic Illuminance (fc) S/P Ratio
LPS * 0.23 0.47 0.49
LED 0.74 0.53 1.40
Induction 0.66 0.47 1.40
* Base Case
Based on the calculated S/P ratios above, the values discovered for the LED and Induction luminaires
are approximately three times as high as that of the LPS luminaires. However, recently the IES
published a Position Statement (IES PS-02-09) regarding the “Use of Spectral Weighting Functions for
Compliance with IES Recommendations.” Research has shown that other spectral weighting
functions can be useful in evaluating radiation that produces human visual sensation. This
realization has led to the development of other possible spectral weighting functions which in turn
have misrepresented the true definition of photopic lumens. The IES has determined that at this
time, there is no sufficient research to support the application of any alternative to photopic
luminous efficiency function. IES 10th edition clarifies that any calculations that modify photopic
lumens are not supported as an appropriate calculation method. As a result, lighting calculations
and energy savings predictions that use ‘modified’ lumens (S/P ratio lumens, for example) cannot be
used as a basis for comparing the performance of various lighting systems. Therefore, it is
recommended readers consider the IES position and further research on the S/P ratios when
considering broad spectrum lighting for street light and other outdoor lighting applications.
4. Correlated Color Temperature and Color Rendering Index
Correlated Color Temperature (CCT) measurements were taken using a Konica Minolta Chromameter
under the LED and induction luminaires. The average color temperature under the LED luminaire was
4,691 K. The average under the induction luminaire was 4,376 K. Because the LED and induction
luminaires have a measured average color temperature of over 4,000 K, more along that of natural
light, they are able to display the true color of an object or area much more effectively. This can be
especially important for busy traffic areas and the safety of neighborhoods. See Appendix C for more
details. Figure 7 below illustrates the importance of a color temperature near daylight for law
enforcement officials. The top two photos are of induction lighting while the bottom two are of LED
lighting. These photos were not taken in the actual assessed areas.

Street Light Assessment ET09SDGE0008
Page 20
Figure 7: CCT and effect on visibility
Table 7 below gives a summary of average, maximum, and minimum measured color temperatures
taken on the same grid used to collect the other project data.
Table 7: Correlated Color Temperature Data
Luminaire Color Temperature (K)
Min Max Avg
LED 3,450 4,996 4,691
Induction 4,300 4,435 4,376
Another factor to consider may be the Color Rendering Index (CRI), the measure of the quality of light
color, developed by the International Commission on Illumination (CIE). When coupled with the color
temperature of a light source near daylight, the higher the CRI the truer the colors of objects. This is
particularly important for law enforcement and public safety. Figure 8 below shows the difference
between CRI with LPS (CRI – 0) and 3,500 K LED and induction (CRI – 65+).

Street Light Assessment ET09SDGE0008
Page 21
LPS LED and Induction
Figure 8: CRI - Impact of light source on colors
ECONOMIC PERFORMANCE
It is important to note that the cost and equipment assumptions made in this section apply only to the
City of San Marcos. The City was assessing the replacement of the most efficacious (100 – 185 lumens
per watt) light source, Low Pressure Sodium. Therefore, readers should consider their specific variables
such as maintenance, energy, luminaire efficacy, luminaire costs and type of distribution before
drawing any conclusions about the cost effectiveness of LED or induction luminaires. For both LED and
induction, luminaire lifetime is a function of the manufacturer’s components of the luminaire (LEDs,
driver, housing, coatings, etc.), electrical and thermal properties. Therefore, manufacturer claims, with
regard to the aforementioned factors, are highly variable. The cost and savings estimates for this
section is based upon City of San Marcos to evaluate economic performance of the base case LPS
luminaire and the advance street light broad spectrum technologies, LED and induction luminaires,
assessed in this project.
1. Energy Cost Estimates
The energy cost for each luminaire is based upon the SDG&E® LS-2 rate schedule as of July 2009.
Under this rate schedule, street lights are billed a monthly set rate based on the type and wattage of
the lamp assuming 4,165 annual operating hours. The rate is specific to customer-owned street
lighting luminaires. This project focused on the replacement of LPS luminaires with both LED and
induction technology. Table 8 provides the charges for the street lights based upon the wattages in the
City of San Marcos.

Street Light Assessment ET09SDGE0008
Page 22
Table 8: Energy Cost by Light Source
Luminaire Actual Power kWh UDC ($)
Energy Charge ($)
Monthly Cost ($)
Annual Cost ($)
LPS 55 W * 83 346 1.44 2.13 3.57 42.86
LED 48W 51 212 0.73 1.31 2.04 24.47
Induction 55 W 56 233 0.90 1.44 2.34 28.06
* Base Case
Simple payback calculations were calculated for retrofit and new construction scenarios. In a retrofit
scenario the new technology was installed replacing an existing operational LPS luminaire before end
of the useful life and factors the total investment cost and energy savings for both the LED and
induction luminaire. The paybacks for a retrofit and new construction are shown in Tables 9 and 10.
Table 9: Simple Payback - Retrofit
Luminaire
Luminaire
Cost
($)
Installation
Cost
($)
Total Cost ($)
Annual
Energy Cost
($)
Annual Energy
Savings
($)
Simple
Payback
(years)
LPS 55W * 43
LED 48W 366 38 404 24 18 22.0
Induction 55W 289 38 327 28 15 22.1
* Base Case Note: The initial investment reflects discounted pricing for 1000 units +
Table 10: Simple Payback – New Construction
Luminaire Luminaire
Cost
($)
Installation Cost
($)
Total Cost
($)
Total
Incremental
Cost ($)
Annual
Energy
Cost ($)
Annual Energy Savings
($)
Simple Payback
(years)
LPS 55W 316 38 354 43
LED 48W 366 38 404 50 24 18 2.7
Induction 55W 289 38 327 -27 28 15 -1.8
* Base Case Note: The initial investment reflects discounted pricing for 1000+ units.
2. Maintenance and Repair Cost Estimates
The City of San Marcos performs streetlight maintenance when lamps burn out and also as group re-
lamping. For this project, City of San Marcos total maintenance cost for LPS luminaires were estimated
based upon reported labor and material spending history. A system wide annual maintenance cost was
calculated. The rate structure for such maintenance is shown below in Table 11. The table includes
estimated costs for the boom truck and provides time for establishing traffic control.

Street Light Assessment ET09SDGE0008
Page 23
Table 11: City of San Marcos Labor and Truck Rate Schedule
Re-lamping Labor Rates – Loaded ($)
Time (hrs) 0.25 0.5 0.75 1.0
Labor 14.04 28.08 42.11 56.15
Truck 4.75 9.50 14.25 19.00
Total 18.79 37.58 56.36 75.15
In estimating the labor component of routine maintenance costs, it was assumed that inspection,
photocell and cleaning are consistent among all luminaires. Therefore, these were not considered in
the maintenance savings calculations.
Cost of each input to determine annualized maintenance cost:
Labor and Truck: $37.58 for all luminaire replacements.
Lamp Cost: Actual LPS cost $15.84/lamp; LED assumed cost based upon 10% failure $36.60
(10% of luminaire cost $366) and induction assumed cost based upon 10% failure $28.90 (10%
of luminaire cost $289).
Disposal Fee: The author used the fees assigned in the City of San Diego Assessment project.
The fees were assigned by the City of San Diego Environmental Services Department and
varied by technology: LPS $4.50, LED $7.50 and induction $25.00.
Table 12: Paybacks with Energy and Maintenance Savings
Luminaire Total Cost
($)
Total
Incremental Cost
($)
Maintenance
Cost
($)
Maintenance
Savings
($)
Annual
Energy Savings
($)
Total Savings ($)
Retrofit
Payback
(years)
New
Constr. Payback
(years)
LPS 55W 354 - 14.48 - - - - -
LED 48W 404 50 6.81 7.67 18.39 26.07 15.5 1.9
Induction 55W 327 -27 3.81 10.67 14.80 25.47 12.8 -1.1
* Base Case
Example of calculating annualized LED maintenance cost: The total cost of a lamp replacement equals
the sum of the labor ($37.58), LED lamp cost based upon 10% failure ($36.60) and the assigned
disposal fee ($7.50). This results in $81.68 which is divided by an expected 12 year life yielding an
annualized maintenance cost of $6.81. Due to the inability to accurately pinpoint actual factors, this
maintenance cost calculation does not take into consideration an inflation factor, escalating energy
cost or the future cost of LEDs which is expected to be much less in 10 years.

Street Light Assessment ET09SDGE0008
Page 24
3. Luminaires and Lamp Life
For the purposes of this project, the end of useful life in hours for each technology is as follows: LPS –
18,000; LED – 50,000; induction – 100,000.
For both the LED and induction technology, a properly designed fixture is required, meaning
electrically and thermally, to achieve the life expectancy. If the fixture has poor electrical or thermal
design the light source life is adversely affected resulting in a much shorter life.
The manufacturers of the LED luminaires assessed in this project claim life expectancies from 50,000 to
89,000 hours (approximately 12 to 21 years at 4,165 operating hours per year). This report uses 50,000
hours, or 12 years in this situation, as the LED life expectancy. The base case 55 W LPS lamp has an
expected life of 18,000 hours (approximately 4 years). The induction lamp has a stated life of 100,000
hours (approximately 24 years). The induction lamp life was based upon proven life in a properly
designed fixture, meaning electrically and thermally.
To determine the maintenance cost it was assumed that LEDs would experience a fractional failure
rate of 10% (PG&E Emerging Technology Program, Application Assessment Report 0727, Dec 2008,
page 38 http://www.etcc-ca.com/index.php?option=com_content&task=view&id=2841&Itemid=72)
while induction would experience a 10% failure rate before 100,000 hours (Philips QL Induction
Lighting Systems, Information for Original Equipment Manufacturers, July 2007
www.lighting.philips.com/us_en/.../download/ql_oem_guide.pdf).
James Brodrick, Lighting Program Manager, US DOE, Building Technologies Program, in a recent article
entitled “Lifetime Concerns”, when discussing how best to define the longevity of LED luminaires
stated: “That’s not a simple matter, because it doesn’t just involve the LED themselves, but rather
encompasses the entire system-including the power supply or driver, the electrical components,
various optical components and the fixture housing.” Therefore, the assumptions for LED life
expectancy in this project is based upon 50,000 hours as per the DOE website
(source: http://apps1.eere.energy.gov/buildings/publications/pdfs/ssl/lifetime_white_leds.pdf)
4. Life Cycle Cost Analysis
As stated in the previous section, to properly assess technology a full life cycle cost analysis is
recommended. There are many variables and considerations which are specific to each reader’s
situation. It is recommended that variables such as labor, cost of materials, maintenance practices,
cost of financing, inflation, energy rates, material cost, etc be determined for the specific project under
evaluation.
Due to the uncertainty as to future labor, product and other costs, especially for LED technology,
readers are recommended to use their judgment regarding the future costs.

Street Light Assessment ET09SDGE0008
Page 25
Conclusion
This assessment demonstrated that LED and induction broad spectrum lighting technologies deliver
superior lighting performance in most areas when compared to LPS. LED and induction street lighting
technology exhibited great potential for energy savings 39% and 32%, respectively, and the potential
for even better operation and maintenance savings.
The lessons learned from this assessment are as follows:
testing before adopting new technologies
further studies required to indemnify cities against potential liability
street lighting technologies are application and geographic specific
not to rely on marketing brochures and technical data sheets; full assessment is recommended
While the results of this project attest to the leaps in technological enhancements of both LED and
induction luminaires, the high first cost required to retrofit street lights with either LED or induction
will be the main barrier to significant market adoption. The significant energy savings and reduce
maintenance costs, do not adequately offset this high initial first cost. Performance of the LED and
induction luminaires combined with growing industry acceptance of their higher performance versus
LPS luminaires may provide early adopters the impetus to invest in the emerging technology.
Due to the as yet proven long life of LEDs, economic and reliability claims are based on the best
available information from the manufacturer and DOE reports. James Brodrick, Lighting Program
Manager, US DOE, Building Technologies Program, wrote an article in which he states, “The question of
LED luminaire and reliability is a complex one, fraught with nuance and ramification.” On the other
hand, induction lighting technology was introduced into the US in 1992. As with LEDs, induction
requires proper thermal management to achieve the 100,000 hour stated life. To date, induction
lighting has been installed in many applications successfully resulting in induction supporting the
claimed life expectancy up to 100,000 hours of operation. It should be noted that the manufacturers
provide various warranty periods with their product, usually with a very conservative technology life
cycle estimate.
Although the results of this assessment indicate a relatively long payback period for LED and Induction
street lighting under current conditions, other performance attributes combined with operating cost
savings may be such that longer than typically acceptable commercial payback periods are acceptable.
As induction gains acceptance as a viable alternative to existing streetlight technology and LED street
lighting technologies advancing at such a fast rate, expectations are that these luminaires will be more
economical in the near future. Utility incentives could also help in the short-term to make the
luminaires cost-effective for customers fueling earlier adoption of the new technologies.

Street Light Assessment ET09SDGE0008
Page 26
Based upon the findings of this project and others, it is important to note that each situation is
different. It is highly recommended that prior to committing to a technology, readers conduct their
own pilot or mini assessment of the available options to determine the economic feasibility of their
particular project. This recommendation is encouraged by James Brodrick, Lighting Program Manager,
US DOE, Building Technologies Program, in one of his recent Postings, stated, “Outdoor lighting efforts
seem to be at the top of the list for many local governments; all their reps are trying to learn about it as
fast as they can. As I mentioned a few weeks ago, using LEDs for street lighting is not yet a slam-dunk.
Evaluating and selecting street lighting products is a complex process, and learning from others before
taking the plunge is highly recommended.”

Street Light Assessment ET09SDGE0008
Page 27
Appendix A
Raw Illumination Data
Lindsley Park Drive Light Illuminance Testing

Street Light Assessment ET09SDGE0008
Page 28
Lindsley Park Drive Light Illuminance Testing
Street Light Assessment ET09SDGE0008
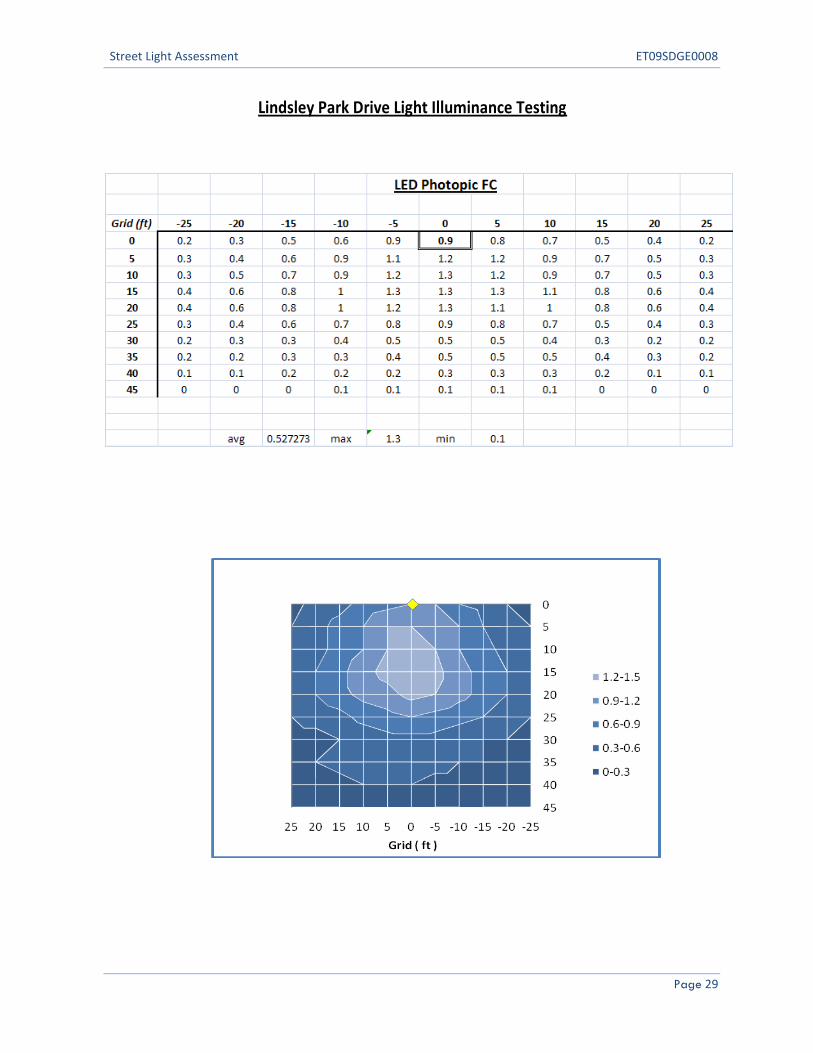
Page 29
Lindsley Park Drive Light Illuminance Testing

Street Light Assessment ET09SDGE0008
Page 30
Lindsley Park Drive Light Illuminance Testing
Street Light Assessment ET09SDGE0008
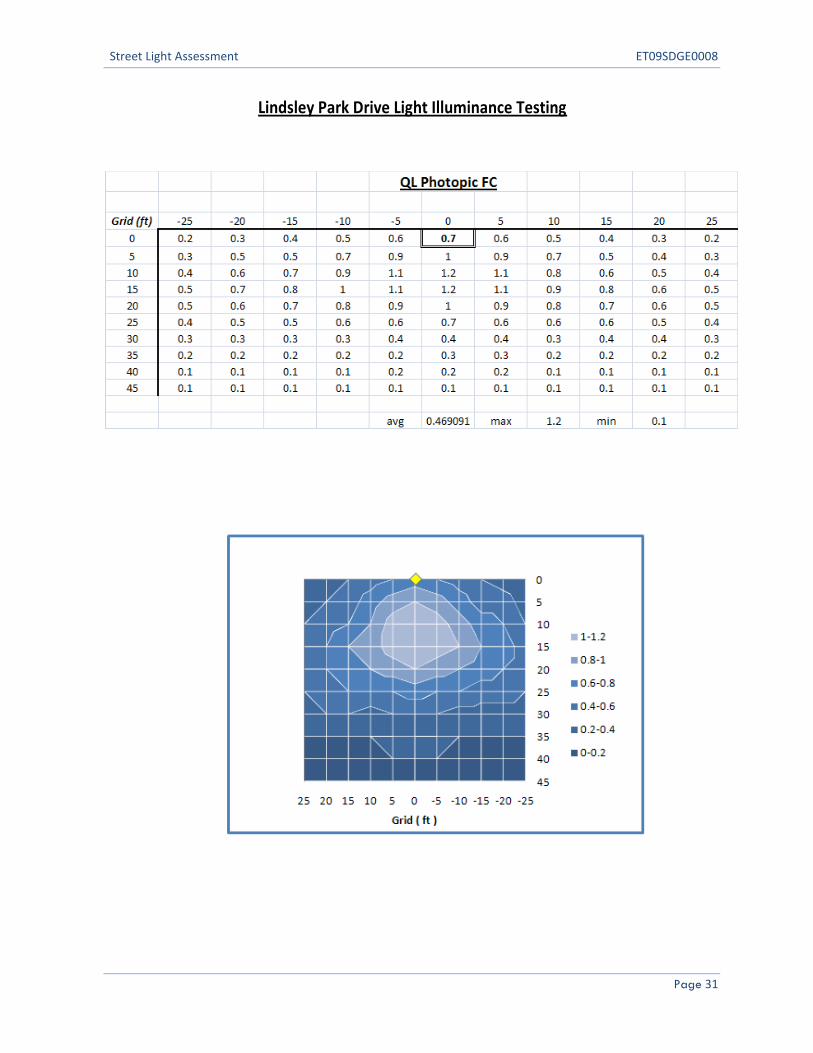
Page 31
Lindsley Park Drive Light Illuminance Testing

Street Light Assessment ET09SDGE0008
Page 32
Lindsley Park Drive Light Illuminance Testing

Street Light Assessment ET09SDGE0008
Page 33
Appendix B
Lighting Characteristic Discussion
Color Temperature
Temperature, or Chromaticity, is a measure in degrees Kelvin that indicates
the appearance of a source. If a steel rod were placed into a fire it would
first turn red, then orange as it heats up, until it finally turns bluish white.
The temperatures of the rod and the color at each temperature describe
the color of a source. It may sound like a contradiction, but low color
temperature lamps have more red wavelengths, thus creating a warm
feeling. High color temperature lamps have more blue wavelengths
creating a cool feeling.
The figure to the left shows displays the International Commission on
Illumination (CIE) chromaticity space, as well as the chromaticity of black-
body light sources of various temperatures and lines of constant correlated color temperature. As the
Kelvin Temperature increases from right to left into the chromaticity space, the color temperature
changes from red to blue. Monochromatic wavelengths are shown in blue in units of nanometers
around the outside of the space.
Lumen Maintenance
LED and induction lumen depreciation is minimal compared to conventional lighting sources. The
provided charts below give typical lumen maintenance curves for various light sources corresponding
to their estimates of lumen maintenance for burn hours. It should be noted however, that since the
expected average annual nighttime temperature is below 25 degrees C, and no comparable luminaire
has been operated for over 100,000 hours (nearly 25 years at 4,100 hours per year), no independent
data is available to corroborate this figure.
Figure 14: Typical Lumen Maintenance Curves (Sources: www.eere.energy.gov & www.miserlighting.com)

Street Light Assessment ET09SDGE0008
Page 34
Estimating LED and induction lamp life is problematic because the long projected lifetimes make full
life testing impractical, and because the technology continues to evolve quickly, superseding past test
results. Most manufacturers define useful life based on the estimated time at which light output will
depreciate to 70% of its initial rating; often the target is 50,000 hours for interior luminaires, but some
outdoor luminaires are designed for much longer useful lives of 100,000 to 150,000 hours. Luminaire
manufacturers typically determine the maximum drive current and junction temperature at which the
fixtures will produce greater than 70% of initial lumens for at least the target useful life in hours. If the
lamps are driven at lower current and/or maintained at lower temperatures, useful life may be greatly
increased.
In general, LEDs and induction lighting in well-designed luminaires are less likely to fail catastrophically
than to depreciate slowly over time, so it may be difficult for a utility or maintenance crew to identify
when to replace the luminaire. In contrast, poorly designed luminaires may experience rapid lumen
depreciation or outright failure.
Thermal management is critical to the long-term performance of the LED, since heat can degrade or
destroy the longevity and light output of the LED. The temperature at the junction of the diode
determines performance, so heat sinking and air flow must be designed to maintain an acceptable
range of operating temperature for both the LEDs and the electronic power supply. For induction
lighting, the temperature sensitivity of the generator, which is a solid-state electronic device that can
fail prematurely if it gets too hot, is also critical to long-term life. While HID systems can operate at
temperatures of 90°C-105°C, induction systems are limited to the 70°C -75°C range. The luminaire
manufacturer should provide operating temperature data at a verifiable temperature measurement
point on the luminaire, and data explaining how that temperature relates to expected light output and
lumen maintenance for the specific technology used.
All light sources experience a decrease in light output (lumen depreciation) over their operating life. To
account for this, lighting designers use mean lumens, usually defined as luminous flux at 40% of rated
life, instead of initial lumens. For LPS lamps, mean lumens are about 90% of initial lumens. Pulse-start
MH mean lumens are about 75% of initial lumens, while ceramic MH lamps have slightly higher mean
lumens, around 80% of initial lumens.

Street Light Assessment ET09SDGE0008
Page 35
Appendix C
Pacific Gas & Electric Project Summaries
LED Street Lighting - Phase II, Oakland, CA
ETCC Project Number PGE 0714
This report summarizes an LED street lighting assessment project conducted to study the applicability
of LED luminaires in a street lighting application. In this project, LED lights replaced regular high
pressure sodium (HPS) streetlights on several streets in Oakland, California. Side-by-side assessments
tested energy consumption, potential cost savings, and lighting quality. Quantitative and qualitative
light and electrical power measurements were taken on all streets, and economic costs estimated and
qualitative satisfaction gauged with a resident survey.
For more information:
http://www.etcc-ca.com/images/stories/pdf/ETCC_Report_460.pdf
LED Street Lighting - San Francisco
ETCC Project Number PGE 0727
This report summarizes an assessment project conducted to study the performance of light emitting
diode (LED) luminaires in a street lighting application. The project included installation of four
manufacturers’ LED street lights on public roadways in San Francisco, California. Quantitative light and
electrical power measurements as well as surface and overhead photographs were taken to compare
base case high pressure sodium (HPS) performance with that of the LED replacement luminaires.
Estimated economic performance of the LED luminaires as compared to HPS street lights was also
calculated and qualitative satisfaction with the LEDs was gauged through a resident survey.
For more information:
http://www.etcc-ca.com/images/stories/et_report_for_led_street_lighting_sf.final.011509.pdf
LED Street Lighting and Network Controls - San Jose
ETCC Project Number PGE 0913
This report summarizes an assessment project conducted to study the performance of light emitting
diode (LED) luminaires with network controls in a street lighting application. The project included
installation of LED street lights with network controls on public roadways in San Jose,
California. Quantitative light and electrical power measurements as well as surface and overhead
photographs from a maintenance bucket truck were taken to compare base case low pressure sodium
(LPS) performance with that of the LED replacement luminaires. Network controls functionality was
also tested and qualitative satisfaction with the system was gauged through a user survey. Estimated

Street Light Assessment ET09SDGE0008
Page 36
economic performance of the network-controlled LED street lighting system was compared to that of
the incumbent LPS streetlights.
For more information:
http://www.etcc-ca.com/images/pge_0913_san_jose_efficient_street_light_report_final.pdf