Embed Size (px)
Citation preview

STRATMOR | GROUP
We want your feedback REAL TIME
• Please use your phone and browse to the URL below
• You do NOT need a login • You will be asked a series of questions
throughout this session • Answer on phone, and results appear
instantly• You can also ask questions through web
page
www.PollEv.com/STRATMOR

STRATMOR | GROUP2
Who and What We ArePractice Description Practice Leader
Benchmarking, and Financial Analysis
• The type of work required by CFO’s, whether independent or bank owned • MBA / STRATMOR Peer Group Program (PRG), with over 80 of the top lenders participating • We use our extensive industry data, going back years and through multiple rate cycles• Build financial models for lenders – 5 year P&L, Balance Sheet and Capital projections
Jim Cameron
Nicole Yung
Strategic Planning Services
• Strategic planning and executive leadership coaching • Consideration of entering and exiting channels and markets, competitive positioning
Dr. Matt Lind
IT Procurement and Advisory
• Independent evaluation of 26 primary LOS• Typically an exercise in reducing the list, and assisting with procurement• Executive coaching and IT readiness•Implementation and rescue efforts
Len Tichy

STRATMOR | GROUP3
“Torture The Data Until It Confesses”Practice Description Practice Leader
Capital Markets • From Best Efforts to Mandatory• Agency delivery • Alternate Investors• Pricing strategy and execution
Rob Chrisman
Mergers and Acquisition
• Buy side advisory• Sell side representation • Middle man for interested parties
Jeff Babcock
Sales and Marketing • Consumer Direct and Retail• Lead generation and Lead Management • E-Commerce and Direct Marketing
Garth Graham
Herding • Making sure everything works well • Making sure the partnership is moving in the right direction • Helping us meet the product needs of our clients
Lisa Springer

STRATMOR | GROUP
We want your feedback REAL TIME
• Please use your phone and browse to the URL below
• You do NOT need a login • You will be asked a series of questions
throughout this session • Answer on phone, and results appear
instantly• You can also ask questions through web
page
www.PollEv.com/STRATMOR

STRATMOR | GROUP5
Projected Changes in the Population by Age(2012 – 2022)
Baby Boomers:Net Sellers
Gen XNet Buyers
MillennialsHome Buyers

STRATMOR | GROUP6
Owner and Renter Occupied Households &Homeownership Rate

STRATMOR | GROUP7
Sum of a Niche!
1. First time buyers
2. Millennials under 35
3. Minority borrowers
4. Evolving Product
Sum of Niches!

STRATMOR | GROUP
We want your feedback REAL TIME
• Please use your phone and browse to the URL below
• You do NOT need a login • You will be asked a series of
questions throughout this session • Answer on phone, and results appear
instantly• You can also ask questions through
web page
www.PollEv.com/STRATMOR

STRATMOR | GROUP9
How Do the Groups Compare?
1 Source: Ethics Reource Center, Ethics.org

STRATMOR | GROUP10
World Events Drive Perceptions
Source: Ethics Resource Center, Ethics.org
Foreclosure!
STRATMOR | GROUP11
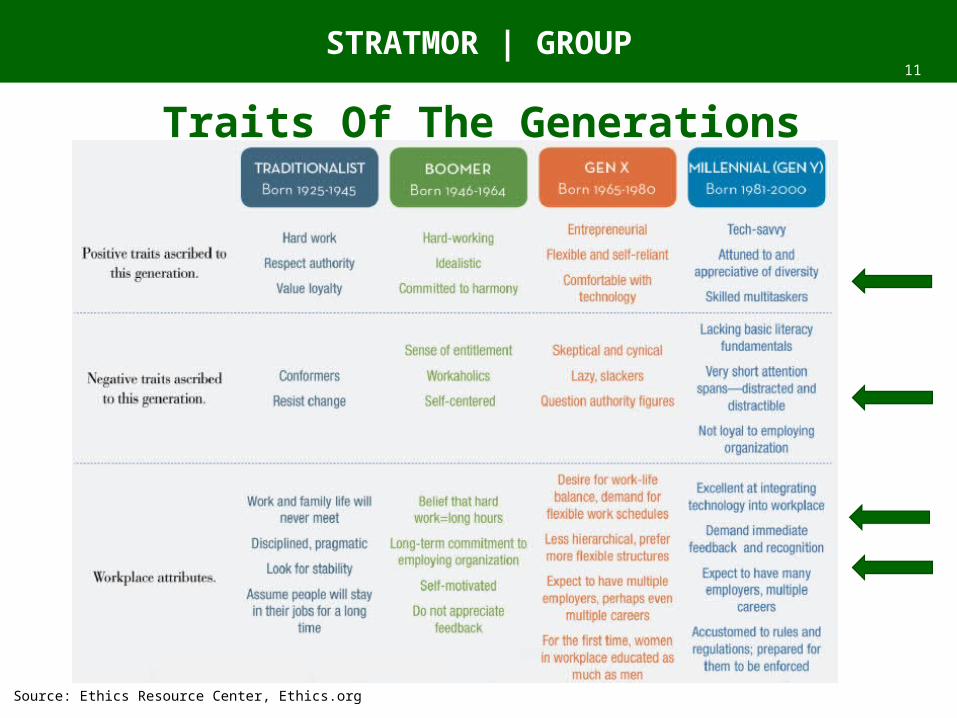
Traits Of The Generations
Source: Ethics Resource Center, Ethics.org

STRATMOR | GROUP12
Workplace Attributes
Source: Ethics Resource Center, Ethics.org

STRATMOR | GROUP13
How many social media accounts do you actively use?

STRATMOR | GROUP14
How active are you in Social Media?

STRATMOR | GROUP15
Do you have a formalized Social Media program?
STRATMOR | GROUP16
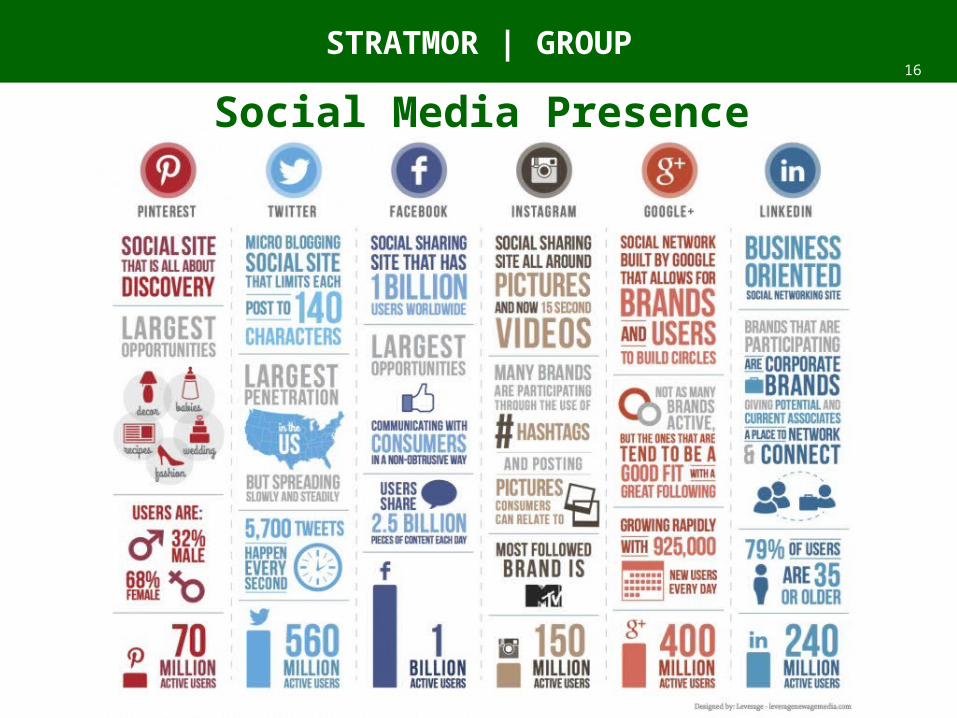
Social Media Presence

STRATMOR | GROUP17
Millennials and Money Millennials keep more of their assets in
cash, less in stocks - UBS report described them as “the most conservative generation since the Great Depression”
The average Millennial investor has 52 percent of their savings in cash, compared to 23 percent for other age groups
Accenture survey found high levels of mistrust of financial institutions among Millennials and a greater reliance on the Internet, social media, and personal networks for financial advice
The ten least-liked brands among members of this generation include four of the nation’s most powerful banks—Chase, BofA, Wells Fargo and Citigroup

STRATMOR | GROUP18
Millennials and Money 70 percent of Millennials thought that the way to pay for things five years from
now will be totally different and one-third said they didn’t believe that they will need a bank at all in the future
Almost all (88%) of Millennials do their banking online and half of those use their smart phone to do so
Three-fourths of Millennials (73%) to be “more excited about a new offering in financial services from Google, Amazon, Apple, Paypal or Square” than from a nationwide bank
STRATMOR | GROUP19
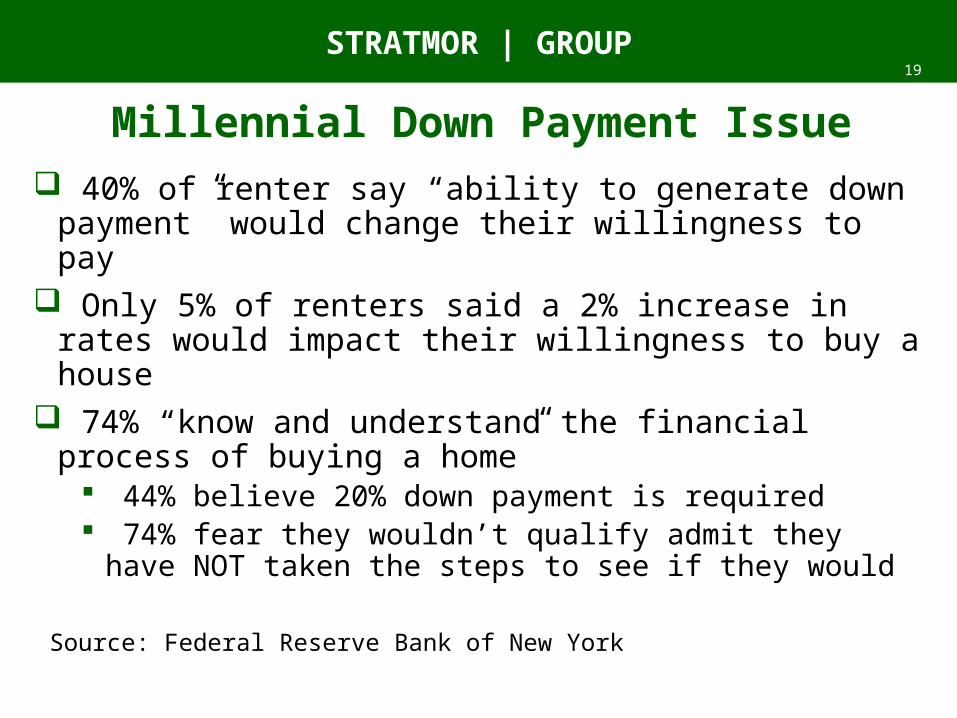
Millennial Down Payment Issue 40% of renter say “ability to generate down payment” would
change their willingness to pay Only 5% of renters said a 2% increase in rates would impact their
willingness to buy a house 74% “know and understand the financial process of buying a
home” 44% believe 20% down payment is required 74% fear they wouldn’t qualify admit they have NOT taken the steps
to see if they would
Source: Federal Reserve Bank of New York

STRATMOR | GROUP20
STRATMOR Originator Census and Compensation

STRATMOR | GROUP21
What percent of Retail Loan Originators are less than 35 years old?

STRATMOR | GROUP22
Millennial originators (less than 35 years old) are less productive than older originators?

STRATMOR | GROUP23
Background STRATMOR believes that the more you can understand and measure the key
attributes of your sales force, the better you will be able to proactively manage them
STRATMOR Originator Census survey focuses on five key areas: Production Distribution - Consistent with conventional wisdom, do 20% of your
Originators close 80% of your volume? Productivity by Quintile - What is the average productivity of your top quintile
of producers versus peers? Originator Age - What is the average age of your originators overall? By
production quintile? Turnover - What is your Originator turnover overall? By Age? By production
quintile? Many lenders maintain that they keep their core group and that turnover is limited to lower producing quintiles. Is that really true?
Tenure - What is the average tenure of originators by production quintile? Are your veterans out-producing the less experienced originators? How does your average tenure compare with peer group averages?
STRATMOR | GROUP24
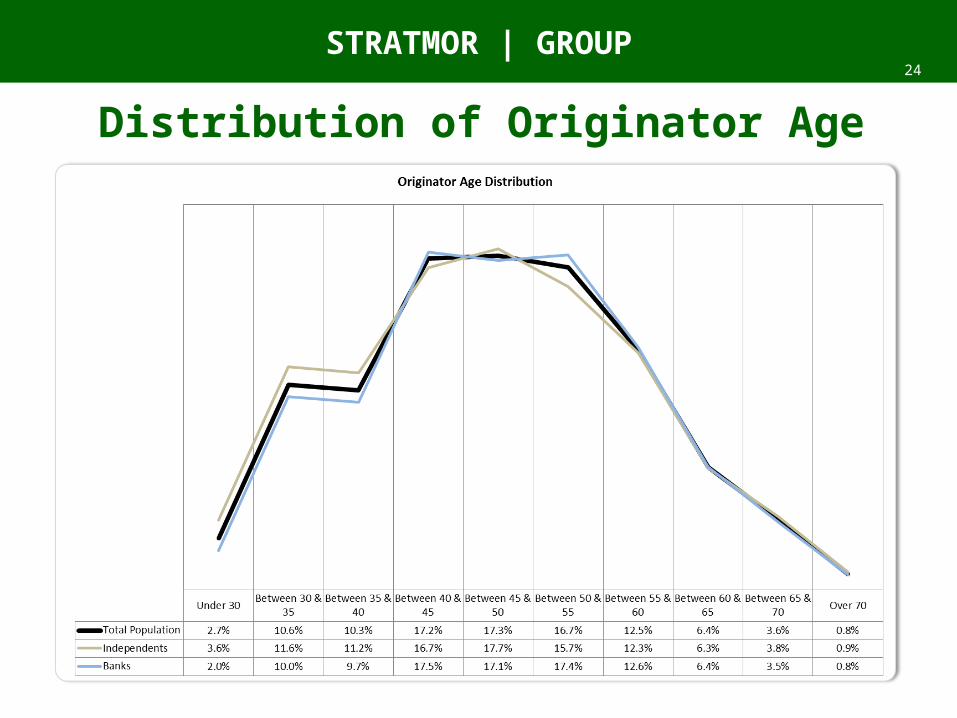
Distribution of Originator Age

STRATMOR | GROUP25
Key Findings from 2013 LO Census 40% of the originators do 80% of the business
Top 20% doing 55-57% of the total production Independent Mortgage companies originators top 20% do 61% of the
production The Top 20% of originators averaged 10 loans per month which is twice
the average production of the next quintile who originated 4.4 loans per month
The Bottom 20% of originators averaged less than one loan per month About 50% of the originator population is between the ages of 40-55
with an average age of 47 There was no material difference in ages by quintile
We had expected to see the Top 20% age to skew older than the average and the lower production quintiles to skew younger
The millennials productivity was the same as the older after normalizing for tenure

STRATMOR | GROUP26
# of Companies
Count of Originators Turnover % Avg Tenure Avg Age
Annual Avg Production per
Originator % of Total
Monthly Production per FTE Equivalent Purchase %
Annual Avg Production per
Originator % of Total
Monthly Production per FTE Equivalent Purchase %
Independent Mortgage Company 9 2,756.0 29.3% 2.7 47.2 7,621,111 100.0% 768,339 49.9% 32.0 100.0% 3.2 51.5%Bank Owned/Affi liated Mortgage 12 4,072.0 30.7% 3.5 47.9 11,484,877 100.0% 1,112,148 44.0% 57.5 100.0% 5.5 45.6%
Over $5 Billion 6 3,718.0 33.9% 3.2 47.2 10,556,731 100.0% 1,037,614 47.4% 50.1 100.0% 4.9 49.1%Between $2 Billion and $5 Billion 6 2,166.0 27.0% 3.3 48.1 9,743,958 100.0% 906,265 44.8% 47.8 100.0% 4.4 46.3%Between $1 Billion and $2 Billion 3 349.0 8.3% 3.6 50.0 11,040,492 100.0% 1,150,508 44.4% 48.0 100.0% 4.7 45.0%Under $1 Billion 6 595.0 29.1% 1.9 46.9 5,986,104 100.0% 688,406 47.0% 26.6 100.0% 3.0 48.6%
LO Primarily Stand-Alone Branches 12 4,276.0 32.7% 2.4 47.3 8,842,044 100.0% 906,701 50.0% 38.9 100.0% 4.0 51.7%LO Primarily Bank Branches 3 871.0 21.6% 5.7 46.7 11,929,307 100.0% 1,123,163 34.6% 66.9 100.0% 6.3 36.3%LO Mixed Bank & Stand-Alone Branches 6 1,681.0 28.3% 3.8 49.0 11,642,589 100.0% 1,060,293 43.1% 58.1 100.0% 5.3 44.3%Overall 6,828.0 30.1% 3.2 47.6 9,925,337 100.0% 971,707 46.4% 47.2 100.0% 4.6 48.0%
All OriginatorsOriginator Statistics Origination Dollars Origination Units
Key Statistics from 2013
Turnover averaged 30.1% for our sample in 2013 Average age of our survey group was 48 years old An average originator originated 4.6 loans in 2013 with 48% of
those being purchase loans
STRATMOR | GROUP27
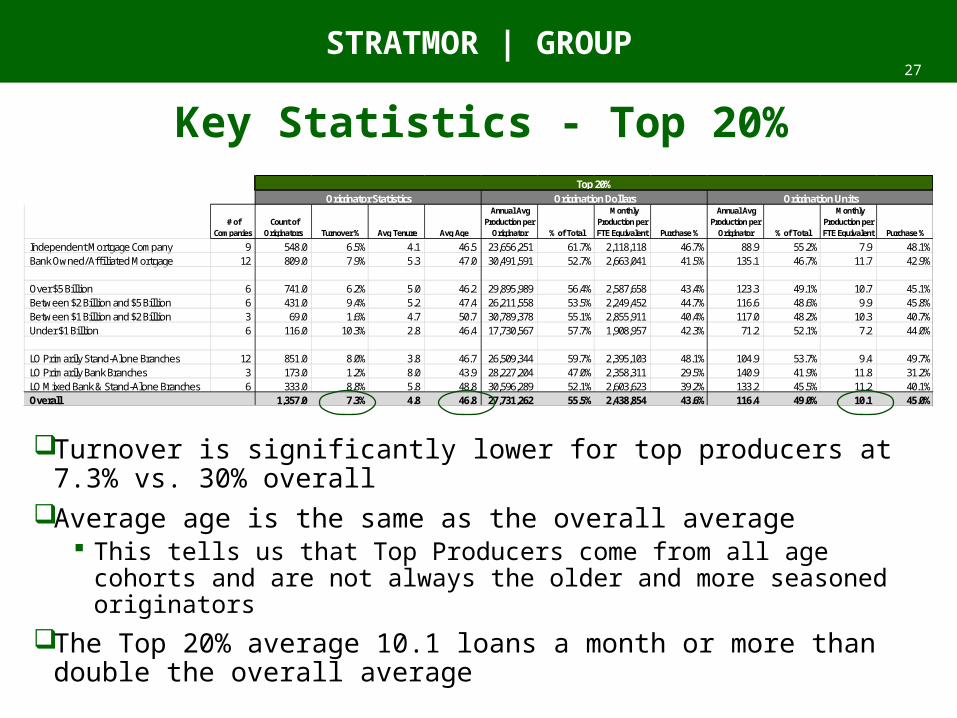
Key Statistics - Top 20%
Turnover is significantly lower for top producers at 7.3% vs. 30% overall
Average age is the same as the overall average This tells us that Top Producers come from all age cohorts and are not
always the older and more seasoned originatorsThe Top 20% average 10.1 loans a month or more than double the
overall average
# of Companies
Count of Originators Turnover % Avg Tenure Avg Age
Annual Avg Production per
Originator % of Total
Monthly Production per FTE Equivalent Purchase %
Annual Avg Production per
Originator % of Total
Monthly Production per FTE Equivalent Purchase %
Independent Mortgage Company 9 548.0 6.5% 4.1 46.5 23,656,251 61.7% 2,118,118 46.7% 88.9 55.2% 7.9 48.1%Bank Owned/Affi liated Mortgage 12 809.0 7.9% 5.3 47.0 30,491,591 52.7% 2,663,041 41.5% 135.1 46.7% 11.7 42.9%
Over $5 Billion 6 741.0 6.2% 5.0 46.2 29,895,989 56.4% 2,587,658 43.4% 123.3 49.1% 10.7 45.1%Between $2 Billion and $5 Billion 6 431.0 9.4% 5.2 47.4 26,211,558 53.5% 2,249,452 44.7% 116.6 48.6% 9.9 45.8%Between $1 Billion and $2 Billion 3 69.0 1.6% 4.7 50.7 30,789,378 55.1% 2,855,911 40.4% 117.0 48.2% 10.3 40.7%Under $1 Billion 6 116.0 10.3% 2.8 46.4 17,730,567 57.7% 1,908,957 42.3% 71.2 52.1% 7.2 44.0%
LO Primarily Stand-Alone Branches 12 851.0 8.0% 3.8 46.7 26,509,344 59.7% 2,395,103 48.1% 104.9 53.7% 9.4 49.7%LO Primarily Bank Branches 3 173.0 1.2% 8.0 43.9 28,227,204 47.0% 2,358,311 29.5% 140.9 41.9% 11.8 31.2%LO Mixed Bank & Stand-Alone Branches 6 333.0 8.8% 5.8 48.8 30,596,289 52.1% 2,603,623 39.2% 133.2 45.5% 11.2 40.1%Overall 1,357.0 7.3% 4.8 46.8 27,731,262 55.5% 2,438,854 43.6% 116.4 49.0% 10.1 45.0%
Top 20%Originator Statistics Origination Dollars Origination Units

STRATMOR | GROUP28
Consumer Research Online / Offline Behavior
STRATMOR | GROUP29
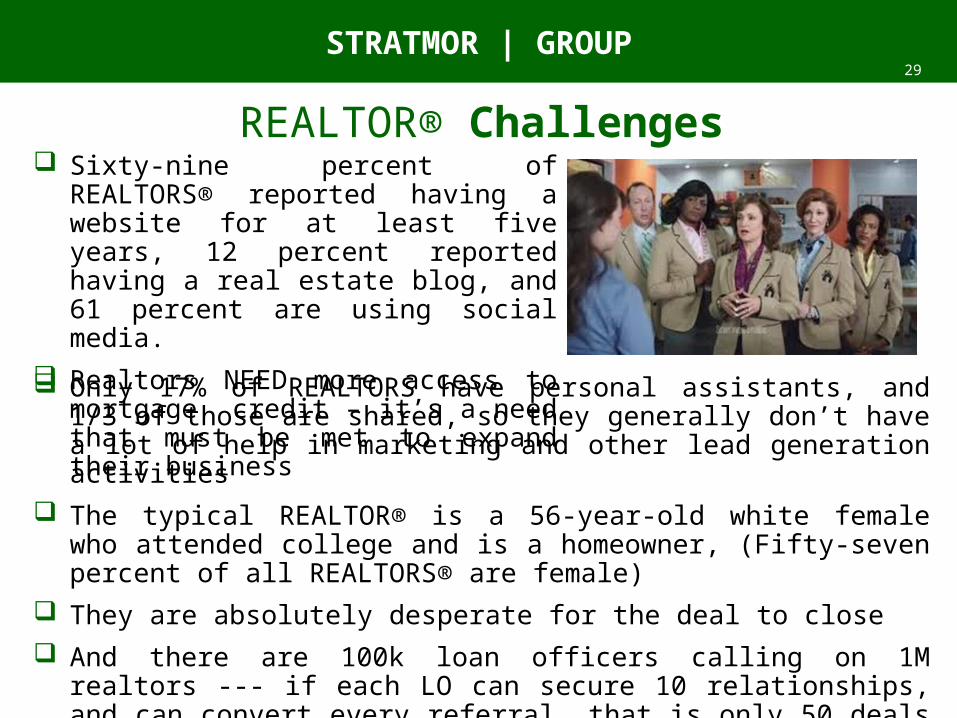
REALTOR® Challenges Sixty-nine percent of REALTORS® reported
having a website for at least five years, 12 percent reported having a real estate blog, and 61 percent are using social media.
Realtors NEED more access to mortgage credit – it’s a need that must be met to expand their business
Only 17% of REALTORS have personal assistants, and 1/3 of those are shared, so they generally don’t have a lot of help in marketing and other lead generation activities
The typical REALTOR® is a 56-year-old white female who attended college and is a homeowner, (Fifty-seven percent of all REALTORS® are female)
They are absolutely desperate for the deal to close And there are 100k loan officers calling on 1M realtors --- if each LO can secure
10 relationships, and can convert every referral, that is only 50 deals per YEAR!

STRATMOR | GROUP30
Lengthy research period provides multiple opportunities to connect
Typical buyers search for 12 weeks Buyers who use agent, typically contact agents after 3 weeks
(which means the keep searching after that) 78% of home shoppers visit 3 or more sites prior to taking action
on real estate site Only 24% take action (generate lead) the same day they begin
search 36% take up to 60 days And 40% do not take action for up to 120 days
STRATMOR | GROUP31
Age of Internet User Much Different than Typical REALTOR®
86% of those who take action on site are LESS than 55 years old 67% of those take action are less than 44 years old And average age of Realtor is 56 years old! Understanding Realtors is key to being successful AND Diversify the bet into evolving Realtors or direct methods of
communication?

STRATMOR | GROUP32
Home Search in the Information Age1. Look at online listings
2. Check out Mortgage rates
3. Look at more information about homes
4. Find an agent (after several weeks)
5. Look up agent on internet, AND social media
6. Talk to agent
7. Receive referral, Pre-Approval encouraged
8. Search online for comps
9. Check out neighborhood stats
10. Send link to house to influencer
11. Drive through neighborhood
12. Look at house
13. Listen to Realtor spiel about mortgage
14. Look up loan officer on social media and internet

STRATMOR | GROUP34
Customer Satisfaction MortgageSAT survey system launched August 2013 with over
~45,000 customers surveyed We provide lenders insights into how their customer service
performs across a broad range of transaction, demographic, and organizational aspects
This reveals details in overall satisfaction Critical points in the process Preference of how contacted How applied Millennials vs previous generations

STRATMOR | GROUP35
Millennial Satisfaction Based on 45,000 surveys, Millennials (those borrowers under age
34) have roughly same satisfaction then older borrowers (88 vs 89)
They are even less likely to recommend (87 vs 89) but more likely to comment on social media (74 on a 100 point scale)
Under 34 Over 34 TOTAL Survey Size 12706 32797 45503Survey percent of Total 28% 72% 100%Satisfaction 89 89 89Likelihood to use again 88 90 89Likelihood to Comment 74 71 72Likelihood to Recommend 87 89 88

STRATMOR | GROUP36
First source of information For purchase borrowers, millennials are far more likely to seek internet and
friends/family for information 23% friends and family vs 14% older borrowers – highest satisfaction
with 91 11% internet vs 7% internet from older borrowers Millennials less likely (7%) to contact a branch office
Millennials Internet Realtor Other personal finance
professionalFamily or friends Branch office
Pct of Total 11% 42% 5% 23% 7%Sample Size 1172 4681 538 2517 758Satisfaction 87 88 86 91 92Likelihood to use again 88 89 86 92 93Likelihood to Comment 68 71 67 74 81Likelihood to Recommend 87 88 86 91 93
Previous GenerationsInternet Realtor Other personal finance
professionalFamily or friends Branch office
Pct of Total 7% 46% 5% 14% 9%Sample Size 1362 9090 1064 2803 1758Satisfaction 88 89 87 91 91Likelihood to use again 89 90 88 92 93Likelihood to Comment 70 72 68 75 76Likelihood to Recommend 89 90 88 92 93

STRATMOR | GROUP37
Relationships can be established via Internet or Phone
Less than 10% of purchase borrowers completed the application face to face, but have slightly higher satisfaction
19% completed it via the internet 69% completed via phone Customer satisfaction in all three methods was very similar
although face to face is more likely to comment on social media
Face to Face Internet Mail TelephonePct of Total 9% 19% 2% 69%
Sample Size 2900 5807 712 21447Satisfaction 90 88 89 89Likelihood to use again 90 89 89 90Likelihood to Comment 76 72 72 72Likelihood to Recommend 90 89 89 89
STRATMOR | GROUP38
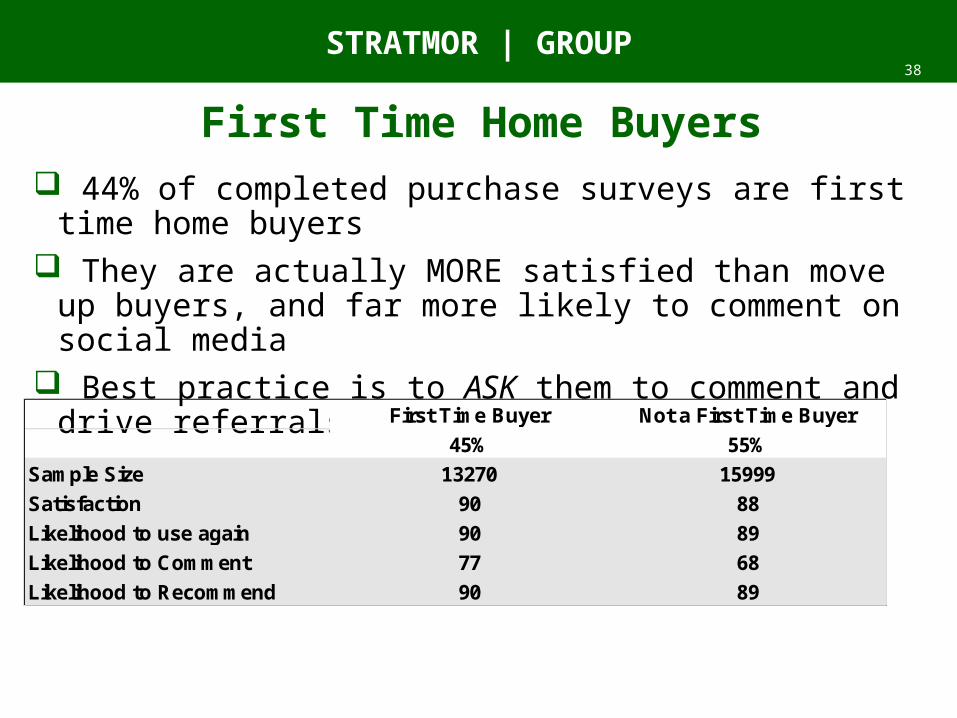
First Time Home Buyers 44% of completed purchase surveys are first time home buyers They are actually MORE satisfied than move up buyers, and far
more likely to comment on social media Best practice is to ASK them to comment and drive referrals
First Time Buyer Not a First Time Buyer45% 55%
Sample Size 13270 15999Satisfaction 90 88Likelihood to use again 90 89Likelihood to Comment 77 68Likelihood to Recommend 90 89

STRATMOR | GROUP
Importance of Alerts• MortgageSAT
automatically alerts lenders when customers are dissatisfied
• Quick call back from Senior Mgt has a huge impact on turning around satisfaction
• Having that push notification is a key to driving the quick call
• Note – Interaction with originator is a key driver of why choose a lender, AND big driver of satisfaction
Satisfaction Segment Percent Frequency SatisfactionSatisfaction 1-6 8% 1,405 24Satisfaction 7-8 10% 1,718 72Satisfaction 9-10 82% 14,651 97Number of Respondents
Response Count
17,774
Reason for choosing lender Percent Frequency SatisfactionInteraction with originator or loan officer 59% 4,037 94Lender of my previous mortgage 18% 1,245 85Other 11% 784 73Ability to close loan on time 5% 355 89Good reputation 4% 264 92Have other financial products 1% 72 83Material that was mailed to me 1% 85 83Good web-based tools 0% 27 89
Response Count

STRATMOR | GROUP
SPOC for origination?• Higher satisfaction
appears to exist when consumer only talks to one person
• Providing a checklist at application is a key driver of satisfaction (33 point difference!)
• Not asking for additional document drive satisfaction from 87 - 93
Worked with person other than Loan Officer Percent Frequency SatisfactionWorked with someone else 61% 4,172 87Worked only with Loan Officer 39% 2,697 93Number of Respondents
Response Count
6,869
Provided Checklist Percent Frequency SatisfactionProvided 88% 15,735 91Not provided 4% 737 58Don´t remember 7% 1,331 81Number of Respondents
Asked for additional docs Percent Frequency SatisfactionAsked 39% 6,214 87Not asked 45% 7,063 93Don´t remember 16% 2,458 92Number of Respondents
Response Count17,803
15,735

STRATMOR | GROUP
Customer preference
• Customers are most satisfied when lender proactively provides status to lender
• 67% of customers say they want status by email or outbound phone call
Method for receiving status updates Percent Frequency SatisfactionEmail from lender 59% 4,062 91Lender called me 24% 1,680 94I called 7% 508 67Other 6% 393 80Text message 2% 116 93Logging into website 1% 73 83Mobile app 0% 8 88Letter mailed to home 0% 29 88Number of Respondents
Preferred method for receiving updates Percent Frequency SatisfactionEmail 67% 4,580 90Phone call from lender 24% 1,618 88Text message 3% 216 88Other 3% 214 84Placing a phone call 2% 136 81Logging into website 1% 50 88Letter mailed to home 1% 42 81Mobile app 0% 13 87Number of Respondents
Response Count
Response Count6,869
6,869

STRATMOR | GROUP
People matter• Benchmarking
performance by all four primary individuals (LO, Processor, Underwriter, and Closer) and
• Benchmarking up to all levels of management (i.e. branch, region, area, division)
STRATMOR | GROUP43
Power of Big Data Data gives you ability to predict likelihood of consumers taking
action So, a consumer who is qualified for a mortgage is a better lead
than one that is not… But it’s a better lead if you know they had a life change event … If they are doing online search for real estate … If they recent listed their home for sale … Had a recent credit pull …. Are active on social media … Have a valid email address

STRATMOR | GROUP44
Monitor Households
Corporate Campaign Management - 3rd party Data to drive marketing efforts - Monitor for life change events, such as marriage and divorce- Monitor for property events: change of address, recent home listing, increase home value - Monitor for credit events, such as recent mortgage inquiries
Corporate Lead Management- Create corporate standards regarding lead assignment, including involvement of retail and consumer direct loan officers- Recruit and retain better LO’s through a commitment to retail marketing support using best of breed consumer components - Protect relationship with consumer when LO departs - Leverage corporate systems for lead management and referral management - Ensure compliance with regulatory standards, including CFPB, FCRA and Fair Lending13.5
Call Center Leads50% of leads
Retail Leads 50% of total leads

STRATMOR | GROUP
• 91% said that enhanced tools for lenders to monitor regulatory compliance during the loan cycle and/or to minimize the risk of regulatory non-compliance were “extremely important
• Both document management and system security tied for the next most important consideration. Overall, 82% of respondents said that greater use of document management or enhancement to imaging technology (e.g. OCR, data extraction, etc.) to improve the efficiency of the staff and the quality of the loan files was “extremely important.”
STRATMOR GROUP – PROPRIETARY & CONFIDENTIALNOT FOR EXTRNAL DISTRIBUTION
STRATMOR Executive Survey: Most Important

STRATMOR | GROUP
Technology Developments – Less Important
• Innovations such as mobile devices (46%) and CRM (41%) and Self Service tools (41%) all were considered less important by lenders.
46
STRATMOR GROUP – PROPRIETARY & CONFIDENTIALNOT FOR EXTRNAL DISTRIBUTION

STRATMOR | GROUP47
Questions and Comments --

STRATMOR | GROUP48
Strategies to Generate Millennial Mortgage Opportunities
Hire and retain millennials Consider mentoring by successful older staff Creating meaning and inclusiveness Recognition and feedback – “catch them doing something right” Patience – accept the differences, and give them time to grow
Millennial Outreach Hire millennials Focus on their needs – down payment for example Embrace their tools – mobile, text and online Self service is expected Use alternative referral sources
Embrace Data

STRATMOR | GROUP
Garth Graham, Managing Director 954-325-7816 [email protected]
What You Can Do
1. The consumer is central to the process – produce happy customers NOT just compliant loans
2. Embrace transparency – Millennials don’t trust!
3. Need to hire younger and need to mentor be successful
4. Invest in technology that enables you to connect with consumers
5. Big Data can generate big results
6. Measure and manage to high customer satisfaction
Check out my weekly column in National Mortgage News

STRATMOR | GROUP50
Questions and Comments --

STRATMOR | GROUP52
Women and Marriage Women are as satisfied as men They are also more likely to comment on social media And borrowers who are separated are happier then the others
Gender Percent Frequency Satisfaction
Male 67% 3,917 90
Female 32% 1,879 90
Information Not Provided 1% 69 86
Number of Respondents 5,865
Marital Status Percent Frequency Satisfaction
Married 63% 3,672 90
Unmarried 37% 2,162 90
Separated 0% 26 92
Number of Respondents 5,860
STRATMOR | GROUP53
The importance of Social Media A way to engage for professionals to engage other professionals
and build brand So, use linked in, twitter and facebook to find Realtors and other
referral sources Provide value added information – something happens nearly every
day that is deserving of commentary Make it professional and personal – how do things make you feel?
What do you think about changes in the market Engaging consumers in a compliant way – not “offering” loans, but
sharing your experience in the industry Use what you are good at – not being phony

STRATMOR | GROUP54
Power of data aggregation Outlook has plug-ins for facebook and linked in (FREE!) Let’s you see picture and immediately link to social media page
for those you are connected to Let’s you immediately look up people on social media based on
email – new borrowers (before you call them), or new Realtors before you walk in office

STRATMOR | GROUP56
Sales Activity may not be a Funnel Old model was a funnel, with the
opportunities always flowing down, with fallout reducing the amount that comes out the bottom.
New Model is more like a flight path, with customers bouncing from spot to spot seeking out information.
Data analyzed by Google (search history and behavior) and Compete (click steam behavior) reveals the trend

STRATMOR | GROUP57
New Sales Funnel 90% of home buyers rely on the
internet as one of their primary research sources
52% turn to internet as their first step Our MortgageSAT data for last month
showed Realtors the first step for financing less than 40% of the time
Real Estate search up 50% in the past year, and up 253% in the past 4 years
40% of Real Estate search on mobile devices, an increase of 120% in past year
89% of Real Estate Consumers ALSO use a Real Estate Agent

STRATMOR | GROUP58
Do you have use texts to communicate with borrowers?

STRATMOR | GROUP
MGIC.com/social
2005:Q4 2006:Q4 2007:Q4 2008:Q4 2009:Q4 2010:Q4 2011:Q4 2012:Q4 2013:Q40%
2%
4%
6%
8%
10%
12%
14%
16%
18%
Share borrowers age 25 - 30 years old with new mortgage originations
no student debt with current student debt with current student debt of 100K+
with 90+ delinquent student debt with student debt, current or delinquent
Source: New York Fed Consumer Credit Panel / Equifax

STRATMOR | GROUP60
BackgroundThe STRATMOR Compensation Connection is an annual survey of compensation
amounts and structure.Survey is set up in modules:
Executive Management Retail Sales Consumer Direct Sales TPO Sales Fulfillment (All Channels) Production Support
Results are available to participants and include: Cross tabulation based on:
• Independents vs. bank-owned lenders • Production scale brackets to differentiate between large and mid-size lenders• Relevant position-related metrics (tenure, management scope)
Key executive, sales, and back office roles within your organization Compensation structures along with compensation levels

STRATMOR | GROUP61
Positions Surveyed for CD SalesSenior Consumer Direct Production Executive The top sales position in the Consumer Direct channel
Call Center Manager Responsible for recruiting, hiring, managing, and training call center personnel including loan officers in a particular call center
Campaign Manager Coordinates and assists with the marketing activities, including database and direct mail marketing, and ecommerce marketing
campaigns.
Producing Team Leader Manages the activities of a call center team, including training and managing loan officers; Also acts as a loan officer by originating
loans
Non-Producing Team Leader Manages the activities of a call center team, including training and managing loan officers; Does not originate loans
Loan Officer Located in call center; receives incoming calls (leads) and attempts to convert to application; may make outbound marketing calls;
counsel borrowers, recommend loan products ; Takes original application directly with borrower and coordinates with loan processors and underwriters in obtaining information necessary to close the loan.
Call Screener Assists the sales consultants by taking inbound calls from clients including providing clients with product, program and rate
information

STRATMOR | GROUP62
Sample Results – CD Loan Officer
Bank Independent Under $1B Over $1B Retention New Customer12 6 6 6 6 7 5 8
Using the average for the year, how many Loan Officers - Non-Exempt did your organization employ in 2013? 83.7 35.7 131.7 15.7 151.7 62.2 113.8 49.8
What was your Loan Officer - Non-Exempt turnover for 2013? 64% 40% 87% 100% 27% 84% 35% 33%
How many loans, on average, did an Loan Officer close per month? 14.5 11.6 16.9 9.0 20.8 9.9 21.7 25.2
What was the average compensation for the Loan Officers -Non-Exempt for 2013?Base Salary 24,407 26,594 22,219 26,403 22,410 27,454 20,141 27,582 Overtime 2,039 2,805 1,272 2,070 2,008 2,295 1,680 928 Incentive / Variable Compensation 63,450 58,499 68,401 56,890 70,010 62,007 65,470 55,679 Total 89,895 87,898 91,892 85,363 94,427 91,755 87,291 84,189
What was the average compensation for the Loan Officers -Non-Exempt for 2013?Base Salary 27% 30% 24% 31% 24% 30% 23% 33%Overtime 2% 3% 1% 2% 2% 3% 2% 1%Incentive / Variable Compensation 71% 67% 74% 67% 74% 68% 75% 66%Total 100% 100% 100% 100% 100% 100% 100% 100%
Is the monthly Base Salary paid to Loan Officers -Non-Exempt a recoverable amount?Yes 0% 0% 0% 0% 0% 0% 0% 0%No 100% 100% 100% 100% 100% 100% 100% 100%
Loan Officer - Non-Exempt
Job Description - Located in call center; receives incoming calls (leads) and attempts to convert to application; may make outbound marketing calls; counsel borrowers, recommend loan products. Takes original application directly with borrower (over the phone or in person) and coordinates with loan processors and underwriters in obtaining information necessary to close the loan. Classified as Inside Sales under Department of Labor guidelines. Typically classified as Non-Exempt employees and are eligible for Overtime.
2013 Survey Average
Type of Company Annual VolumeCross-Tabulated Results
Source of Loans 2012 Survey Average

STRATMOR | GROUP
Bank Independent Under $1B Over $1B Retention New Customer12 6 6 6 6 7 5 8
Please enter the percentage breakdown of the variable portion of Cash Compensation paid to the Loan Officers - Non-Exempt for 2013.FLAT % based on production VOLUMES 23% 33% 12% 33% 12% 0% 36% 24%TIERED % based on production VOLUMES 37% 19% 55% 37% 37% 31% 46% 21%Based on FLAT $/loan 15% 30% 0% 30% 0% 26% 0% 0%Based on TIERED $/loan 15% 15% 15% 0% 30% 0% 36% 24%HYBRID commission equal to greater of % or $/loan 0% 0% 0% 0% 0% 0% 0% 0%Based on the achievement of quantitative and/or qualitative OBJECTIVES 10% 3% 17% 0% 19% 15% 2% 18%DISCRETIONARY 1% 0% 2% 0% 2% 0% 2% 13%OTHER 0% 0% 0% 0% 0% 0% 0% 1%Total 100% 100% 100% 100% 100% 71% 122% 100%
Loan Officer - Non-Exempt commissions vary by:Purchase vs. Refinance 25% 17% 33% 0% 50% 0% 60% 13%New vs. Existing Customers 0% 0% 0% 0% 0% 0% 0% 25%Other: Lead Source - Capture Rate - Customer Service 8% 17% 0% 17% 0% 14% 0% 13%
Do your offer more than one compensation plan to Loan Officers - Non-Exempt?Yes, Loan Officers can choose among a variety of plans 0% 0% 0% 0% 0% 0% 0% 13%Yes, but compensation plans vary by geography/branch 17% 0% 33% 17% 17% 14% 20% 25%No, we only offer one Loan Officer plan 83% 100% 67% 83% 83% 86% 80% 50%
Loan Officer - Non-Exempt plans have the following features:Minimum Payout 33% 50% 17% 33% 33% 29% 40% 25%Maximum Payout 33% 33% 33% 50% 17% 43% 20% 13%Quarterly volume add-on 0% 0% 0% 0% 0% 0% 0% 25%Annual volume add-on 17% 33% 0% 17% 17% 14% 20% 38%Quality Control Components 50% 67% 33% 50% 50% 43% 60% 50%
Loan Officer - Non-Exempt
Job Description - Located in call center; receives incoming calls (leads) and attempts to convert to application; may make outbound marketing calls; counsel borrowers, recommend loan products. Takes original application directly with borrower (over the phone or in person) and coordinates with loan processors and underwriters in obtaining information necessary to close the loan. Classified as Inside Sales under Department of Labor guidelines. Typically classified as Non-Exempt employees and are eligible for Overtime.
2013 Survey Average
Type of Company Annual VolumeCross-Tabulated Results
Source of Loans 2012 Survey Average

STRATMOR | GROUP64
Consumer Direct Percent of Units High of 46%
of units in 2012
35% of units in 2014 and actually rising YTD 2015
By state is very interesting…
Highest percent of CD volume
VT OK MS LA NH RI AR ME AL NM

STRATMOR | GROUP65
CD is rising for both Refinance and Purchase
Refinance volume was over 50% of units 2013-2014 Purchase units have risen from 12% of units to over 21% of units in the past 5
years

STRATMOR | GROUP66
Value Proposition For CD CD refinance loans typically have higher rates than traditional retail while…. (4
bps higher in 2015, avg 3 bps over 7 years) CD purchase loans are typically offered at lower rates than retail – 14 bps
average over 7 years
2008 2009 2010 2011 2012 2013 2014 2015 AverageTraditional Retail 6.10 5.12 4.76 4.45 3.71 3.85 4.14 3.83 4.50 Consumer Direct 5.96 4.93 4.60 4.34 3.59 3.74 4.00 3.66 4.35 Average Delta (0.14) (0.19) (0.16) (0.11) (0.12) (0.11) (0.14) (0.17) (0.14)
Purchase Only Average Interest Rate2008 2009 2010 2011 2012 2013 2014 2015 Average
Traditional Retail 5.87 4.93 4.67 4.36 3.77 3.70 4.18 3.87 4.42 Consumer Direct 5.84 4.96 4.71 4.39 3.81 3.73 4.24 3.91 4.45 Average Delta (0.03) 0.04 0.04 0.03 0.04 0.03 0.05 0.04 0.03
Refi & Cash Out Only Average Interest Rate

STRATMOR | GROUP67
36% of eligible voters are Millennials $1.6T (Trillion) home purchases by 2018 (in a market that is only
….) More racially diverse - Minority young householders = 28% in
1995; 41% in 2014 Married later - Young adult householders living with a spouse:
60% in the 1980s; 50% during housing boom; 42% in 2014 Higher education - Young adult householders that are college
grads: 32% in the 1995; nearly half in 2014 12% of renters or 5.2 million renters nationwide plan to buy in the
next year
STRATMOR | GROUP68
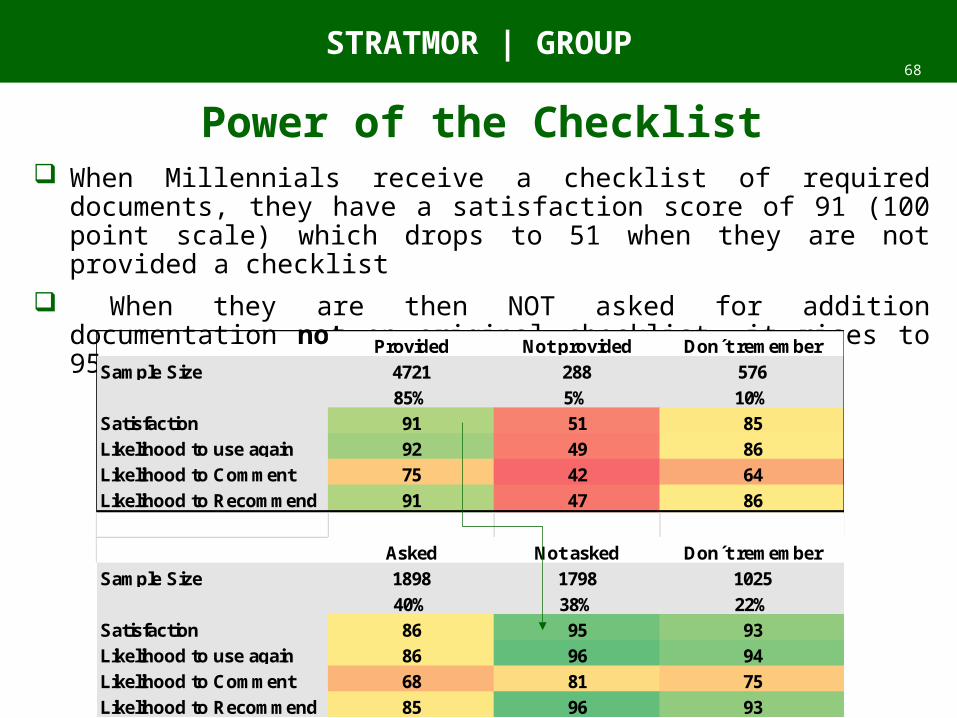
Power of the Checklist When Millennials receive a checklist of required documents, they have a
satisfaction score of 91 (100 point scale) which drops to 51 when they are not provided a checklist
When they are then NOT asked for addition documentation not on original checklist, it rises to 95
Provided Not provided Don t rememberSample Size 4721 288 576
85% 5% 10%Satisfaction 91 51 85Likelihood to use again 92 49 86Likelihood to Comment 75 42 64Likelihood to Recommend 91 47 86
Asked Not asked Don t rememberSample Size 1898 1798 1025
40% 38% 22%Satisfaction 86 95 93Likelihood to use again 86 96 94Likelihood to Comment 68 81 75Likelihood to Recommend 85 96 93

STRATMOR | GROUP69
Mobile Messaging Younger generations over 100 messages per day, and growing