Embed Size (px)
Citation preview

University of Arkansas, FayettevilleScholarWorks@UARK
Theses and Dissertations
12-2016
Stratigraphy and Depositional Environment of theMiddle Atoka Formation, Central Arkoma Basin,Western ArkansasYueyang WangUniversity of Arkansas, Fayetteville
Follow this and additional works at: http://scholarworks.uark.edu/etd
Part of the Geology Commons, Sedimentology Commons, and the Stratigraphy Commons
This Thesis is brought to you for free and open access by ScholarWorks@UARK. It has been accepted for inclusion in Theses and Dissertations by anauthorized administrator of ScholarWorks@UARK. For more information, please contact [email protected], [email protected].
Recommended CitationWang, Yueyang, "Stratigraphy and Depositional Environment of the Middle Atoka Formation, Central Arkoma Basin, WesternArkansas" (2016). Theses and Dissertations. 1774.http://scholarworks.uark.edu/etd/1774

Stratigraphy and Depositional Environment of the Middle Atoka Formation, Central Arkoma
Basin, Western Arkansas
A thesis submitted in partial fulfillment
of the requirements for the degree of
Master of Science in Geology
by
Yueyang Wang
China University of Petroleum
Bachelor of Engineering in Resource Exploration, 2013
December 2016
University of Arkansas
This thesis is approved for recommendation to the Graduate Council.
____________________________________
Professor Doy L. Zachry
Thesis Director
____________________________________ ____________________________________
Dr. Adriana Potra Dr. Gregory Dumond
Committee Member Committee Member

ABSTRACT
Wire line logs are widely used in analysis of the subsurface stratigraphy of the middle
Atoka Formation, Central Arkoma Basin, Western Arkansas. SP log, Gamma ray log, resistivity
log and conductivity log provide valuable information to construct cross sections.
The middle Atoka formation is composed of a succession of shale and sandstone
alternations with thickness reaching approximately 3000 feet in the study area. It contains several
sandstone units which include Morris, Tackett, Areci, Bynum, Casey and Dunn”A” separated by
shale intervals. The purpose of this study is to identify these units and predict sequence
stratigraphy and depositional environment by constructing cross-sections, observing wireline
logs and associating previous research. Several isopach maps are made, explaining the
development of sandstone in target units such as Tackett and Casey.
The sequence stratigraphy of the middle Atoka formation is mainly composed of
transgressive systems tracts and part of a highstands systems tract. The intervals indicate
successive sea-level cycles associated transgression and regression from shallow marine to
shoreface.
The middle Atoka formation has been proved as a significant exploration target since
1950’s. In order to understand geologic setting and find potential reservoirs within the Arkoma
basin, it is vital to comprehend the sequence development and depositional environment of the
intervals within the middle Atoka.

ACKNOWLEDGMENTS
I would like to thank various people for their contribution to my thesis and the whole
graduate study. First of all, I would like to express my deep gratitude to Doy Zachry, my advisor,
Professor, committee leader, for his selfless support, excellent guidance, enthusiastic
encouragement and useful critiques. As a foreigner student, Dr. Zachry helps me adapt to new
learning and living environment, like a gracious grandpa. It is a great honor to have worked with
him.
I would also like to thank Dr. Adriana Potra and Dr. Gregory Dumond, committee
member. They gave me lots of suggestions and encourage me in the course study as well as this
thesis. My grateful thanks are also extended to Ms. Jamie Woolsey for patiently teaching me how
to use the Petra software and helping me solve some tough questions. I would like to offer my
special thanks to my friend, Aboaba Lanre, Ikramuddin G. Bahram and Yirong Chen for all the
pleasure memories and lasting friendship. Thanks to all faculty in Geoscience Department for
offering me such an enjoyable study place.
It is undeniable to thank my family. I can’t have any opportunities to study abroad
without their support. Life is not easy for a foreigner; they always inspire me when I confused
about the future. A special thanks to my girlfriend, Ruizhe Yin whose share many memorable
moments with me.
TABLE OF CONTENTS
1. INTRODUCTION .......................................................................................................................... 1
1.1 Geological Setting ...................................................................................................................... 1
1.1.1 Arkoma Basin ...................................................................................................................... 1
1.1.2 Ozark Dome ........................................................................................................................ 3
1.1.3 Ouachita Mountain Fold Belt ............................................................................................. 4
1.2 Study Area .................................................................................................................................. 4
1.3 Lithostratigraphy ........................................................................................................................ 5
1.4 Tectonic and structural history ................................................................................................ 10
1.5 Paleogeography and Depositional History ............................................................................. 12
2. METHODOLOGY ....................................................................................................................... 16
3. LOG EXPRESSION .................................................................................................................... 18
3.1 Log Analysis ............................................................................................................................. 18
3.2 Facies and Log expression interpretation ............................................................................... 20
4. SEQUENCE STRATIGRAPHY ................................................................................................ 24
4.1 Lowstand System s Tract (LST).............................................................................................. 24
4.2 Transgression Systems Tract (TST) ........................................................................................ 28
4.3 Highstand Systems Tract (HST) ............................................................................................. 29
4.4 Sequence stratigraphy of the Middle Atoka Formation ......................................................... 31
5. DEPOSITIONAL ENVIRONMENT ........................................................................................ 36
5.1 The whole middle Atoka formation ........................................................................................ 37
5.2 Casey sandstone unit ................................................................................................................ 39
5.3 Tackett sandstone unit.............................................................................................................. 45

5.4 Coastal settings ......................................................................................................................... 48
6. CONCLUSION ............................................................................................................................. 50
REFERENCES.................................................................................................................................. 51
APPENDIX Ⅰ: STRATIGRAPHIC CROSS SECTIONS ....................................................... 55
APPENDIX Ⅱ: LIST OF WELLS USED IN CROSS SECTIONS ........................................ 61

LIST OF FIGURES
Figure 1 Outline of the Arkoma basin, the study area is indicated by the black square .................. 2
Figure 2 North-south section across Arkoma basin showing sydepositional faults (modified from
Zachry and Sutherland, 1984) ..................................................................................................... 2
Figure 3 Map of Ozark Dome (modified from Huffman, 1958) ....................................................... 3
Figure 4 Location of study area. Cross sections and wells are shown on the map........................... 5
Figure 5 Stratigraphic column of the middle Atoka formation (modified from Fort Smith
Geological Society, 1988)............................................................................................................ 8
Figure 6 QFL diagram showing grain composition of Ozark and Arkoma petrofacies
(Houseknecht, 1986) .................................................................................................................... 9
Figure 7 Cross sections showing the tectonic development of the Ouachita-Arkoma system. ..... 11
Figure 8 Lithospheric transect model. Numbers are densities in g/cm3. All interfaces in crust
beneath area of PASSCAL-COCORP surveys are constrained primarily by seismic data.
(Mickus and Keller, 1992) ......................................................................................................... 12
Figure 9 Paleogeographic reconstructions of Mississippian and Pennsylvanian depositional
systems. Reconstructions focus on present day eastern Oklahoma and western Arkansas.
Modified from Sutherland (1988). ............................................................................................ 15
Figure 10 Map showing wells used for constructing cross-sections ............................................... 17
Figure 11 Combination of Gamma ray, SP, resistivity and conductivity log in a #4 Robinson Sam
Well (T9N R28W S24) .............................................................................................................. 19
Figure 12 Schematic representation of log patterns for sand-rick depositional regimes for which
the patterns are characteristically blocky in appearance. (Modified from Garcia, 1981) ...... 21

Figure 13 Presentations of blocky signature from Bollinger #1-18 located in T7N R28W S18 and
serrated signature from Hatchett Lidsey #7 located in T9N R30W S30 ................................ 21
Figure 14 Schematic representation of log patterns of a variety of depositional environments in
which sand-shale sequences are developed. (Modified from Garcia, 1981) .......................... 22
Figure 15 Presentations of upward-flaring signature from Snodgrass J S #3 located in T9N
R28W S6; Upward-narrowing signature from Fisher Carty #1-31 located in T10N R28W
S31 ............................................................................................................................................... 23
Figure 16 Schematic dip section of early and late phase lowstand systems tract and the
relationship with relative sea-level. (Posamentier and Allen, 1999) ...................................... 25
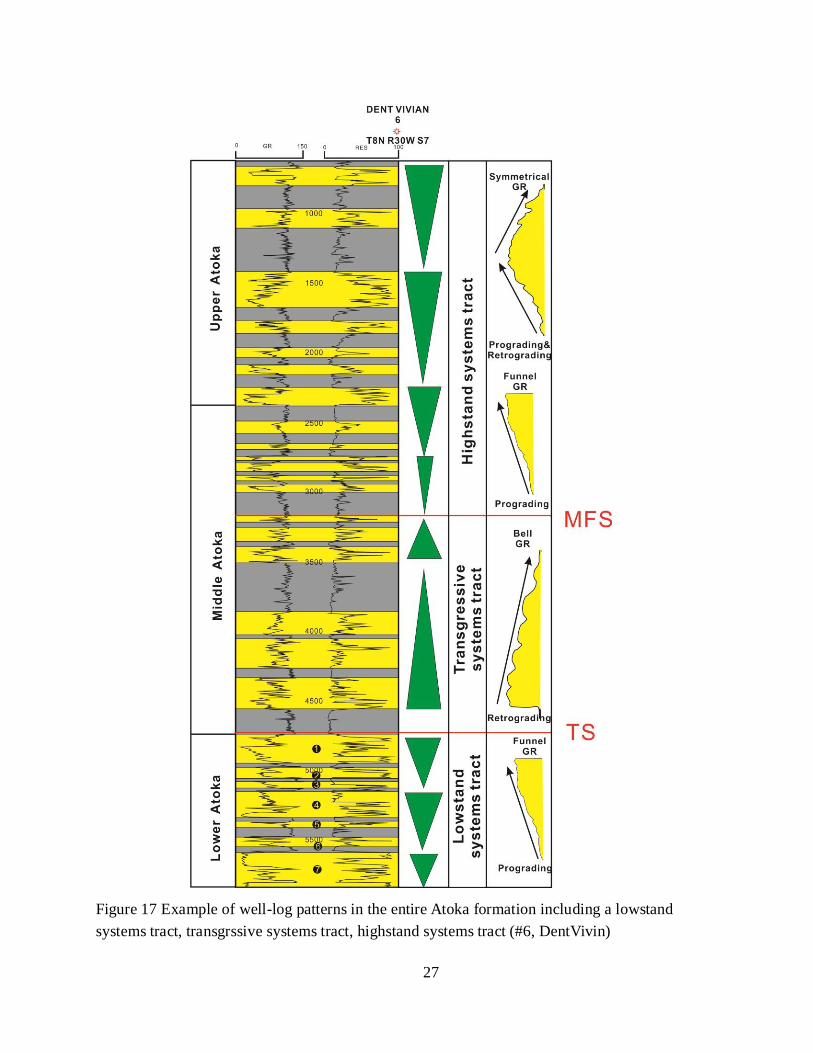
Figure 17 Example of well-log patterns in the entire Atoka formation including a lowstand
systems tract, transgrssive systems tract, highstand systems tract (#6, DentVivin) .............. 27
Figure 18 Schematic depiction of important boundary surfaces in systems tract (Modified from
Christopher Kendall, 2003) ....................................................................................................... 29
Figure 19 The stacking pattern of highstand systems tract (Posamentier and Allen, 1999) .......... 31
Figure 20 Example of well-log patterns in a transgrssive systems tract and highstand systems
tract within study area (#6, DentVivin) .................................................................................... 33
Figure 21 Selected well log from cross section A-A’ shows Dunn”A”-Casey Cycle.................... 34
Figure 22 Selected well log from cross section A-A’ shows Bynum-Areci Cycle ........................ 35
Figure 23 Isopach map of the Middle Atoka formation ................................................................... 38
Figure 24 Isopach map of Casey unit ................................................................................................ 40
Figure 25 Facies association: depositional environment associated with facies units. (Modified
from Farrell, 2013) ..................................................................................................................... 42
Figure 26 Casey sandstone unit in cross-section A-A’, B-B’ and C-C’.......................................... 43
Figure 27 Casey sandstone unit in cross-section D-D’ and E-E’ .................................................... 44
Figure 28 Isopach map of Tackett sandstone unit ............................................................................ 46
Figure 29 Tackett sandstone unit in cross-section A-A’, B-B’ and C-C’ ....................................... 47
Figure 30 Gamma ray response to variation in grain size associated depositional environment
(Emery, 1996) ............................................................................................................................. 49
Figure 31 N-S stratigraphic cross section A-A' ................................................................................ 56
Figure 32 N-S stratigraphic cross section B-B' ................................................................................. 57
Figure 33 N-S stratigraphic cross section C-C'.............................................................................. 58
Figure 34 W-E stratigraphic cross section D-D' ............................................................................... 59
Figure 35 W-E stratigraphic cross section E-E’ ............................................................................... 60

LIST OF TABLES
Table 1 Stratigraphic column depicitng from Atokan.(Haley and Hendricks, 1972; Zachry, 1983)
....................................................................................................................................................... 7

1
1. INTRODUCTION
1.1 Geological Setting
1.1.1 Arkoma Basin
The Arkoma Basin is a peripheral foreland basin (Allen et al., 1986; Miall, 1995; Griles,
1996) bounded by the Choctaw fault and Ross creek fault on the south side, by the Ozark uplift and
northeast Oklahoma platform on the north side, by Seminole uplift, the Arbuckle mountains on the
western side and by Cenozoic coastal plain on the eastern side (Figure 1). It ranges 40-80 km wide.
The Arkoma Basin is the most northern, least deformed, and youngest part of a
northward-migrating foreland basin that began forming in the early Mississippian. The formation
of this basin was caused by the collision of North American and Sabine Terrane plate from the
early Mississippian to the Middle Pennsylvanian time. The Ouachita fold and thrust belt has a
close relationship with the sedimentary and structure of Arkoma Basin (Suneson, 2012).

2
Figure 1 Outline of the Arkoma basin, the study area is indicated by the black square
Chesterian, Morrowan, and early Atokan time were stable periods for the Arkoma Basin.
After that, the syndepositional faults caused by continued basin subsidence widely developed
during middle Atokan time (Figure 2). The basin is characterized by increasing thickness from
north to south (Sutherland, 1988). This process is a significant mark which Arkoma Basin was
transited from a passive margin to a foreland basin.
Figure 2 North-south section across Arkoma basin showing sydepositional faults (modified from
Zachry and Sutherland, 1984)

3
1.1.2 Ozark Dome
The Ozark Dome is a highland region of approximately 150,000 km2 known as Ozark
uplift, Ozark Mountains or Ozark Plateau. It is an asymmetrical, broad and extended uplift which
covers south part of Missouri, northern part of Arkansas and northeastern part of Oklahoma
(Figure 3). Its northern boundary is located near the Missouri River. Its southern boundary goes
across from Batesville on the east to Fayetteville on the western. The eastern boundary lies on the
Mississippi River and the western ends in northeastern Oklahoma.
Stratigraphic data indicates that in the Mississippian Period it was submerged in shallow
marine environment. After that, it was uplifted caused by the Ouachita orogeny in Pennsylvanian
Period. The deep ocean basin was lifted due to the collision between the Sabine Plate and denser
North American continental curst. It rose a few hundred meters by the end of Paleozoic.
Figure 3 Map of Ozark Dome (modified from Huffman, 1958)

4
1.1.3 Ouachita Mountain Fold Belt
The Ouachita fold belt trends east across Arkansas and eastern Oklahoma. The boundary to
the north is the Choctaw fault and the southern boundary is the Cretaceous overlap. It ranges from
80 km to 96 km wide in Arkansas and extends 180 km from the eastern to western.
Deformation of the Ouachita fold belt was due to the interaction of North America and the
Sabine micro plate. The evidence shows that the thickness of southward Carboniferous sequence
increases to an Atlantic style continental margin. The lack of Paleozoic plutonic rocks and
high-temperature low-pressure metamorphic rock also proves that the Ouachita Mountain is
remnant of an antithetic subduction zone (Roeder, 1973).
The Ouachita orogeny activity happened during Late Pennsylvanian to the Permian Time
(King, 1961; Denison et al, 1969). Outcrops from the Ouachita Mountains includes a series of deep
water chert, shale, submarine debris flows, and turbidite sandstone from Cambrian to lower
Mississippian and another outcrops above them is flysch (Ann et al, 1988).
1.2 Study Area
The portion of the Arkoma basin included in this study is limited to west-central Arkansas.
The study area includes Townships 7-9 North and Ranges 27-30 West. It encompasses
approximately 507 square miles and includes southeastern Crawford, northeastern of Sebastian
and western Franklin counties (Figure 4).

5
Figure 4 Location of study area. Cross sections and wells are shown on the map.
1.3 Lithostratigraphy
The Atoka formation is composed of shales and sandstones that display complex
stratigraphic and facies characteristics (Figure 5). The maximum thickness of Atoka formation is
approximately 6,400 m along the southern margin of the basin (Haley, 1982).The minimum
thickness ranges from 305 m to 396 m from northern margin of the Arkoma basin (Zachry, 1983).
The Atoka formation can be included to upper, middle and lower member (Johnson, 1968; Zachry,
1983).
The middle Atoka formation in Arkansas composes mainly shale, but with a great number

6
of sandstone intervals. For example, there are four to eight sandstone units with thickness
exceeding 15 feet that occur south of 7 N. The grain size profiles suggest that sandstone were
formed at the distal margin of active submarine-fan systems (Zachry and Sutherland, 1984).
The units’ names are from the stratigraphic column are on the basis of petroleum industry.
Other used names are showed in the table 1. The middle Atoka fomation includes Morris, Tackett,
Areci, Bynum and Casey (Figure 5).

7
Table 1 Stratigraphic column depicitng from Atokan (Haley and Hendricks, 1972; Zachry, 1983)

8
Figure 5 Stratigraphic column of the middle Atoka formation (modified from Fort Smith
Geological Society, 1988)

9
The thickness of the upper Atoka in the south-central part of Arkoma basin ranges to 915
m(Zachry, 1983). The interval is predominately shale and thin sandstone units. Figure 6 is the
QFL diagram showing grain composition of Ozark and Arkoma petrofacies. Sandstones from
Atoka formation have 75 to 90 percent of quartz with very fine to fine grained and poorly to
moderately rounded, 5 to 25 percent of metamorphic lithic fragments (such as slate and phyllite)
and up to 8 percent of feldspar (Houseknecht, 1986). The thickness of lower Atoka ranges from
150 m near the northern margin of Arkoma Basin to 305 m in the south (Zachry, 1983). The
sandstones from lower Atoka were developed four to five units separated by shale units in delta
and tidal flat systems.
Figure 6 QFL diagram showing grain composition of Ozark and Arkoma petrofacies (Houseknecht,
1986)

10
1.4 Tectonic and structural history
Atoka formation of the Arkoma basin reflects the transition from sedimentation on a
passive, rifted margin to sedimentation in a foreland basin. The tectonic interpretation of Ouachita
orogenic belt and foreland basin is based on the consumption of oceanic crust and lithosphere
collision (Houseknecht, 1986).
Rifting activity caused the expanding of ocean basin in the late Precambrian or earliest
Palaeozoic (Thomas, 1977) (Figure 7A). After that, the southern margin of North America was
replaced by an Atlantic type margin during the middle Palaeozoic (Figure 7B). From early
Mississippian, the expanded ocean basin terminated and started to converge effected by
southwards subduction (Figure 7C). In early Atokan time, the subduction activity continually
impacted the residual ocean basin. The cracked continental margin of North America was
obducted by the north side of subduction zone (Figure 7D). As a result, a great number of normal
faults were formed by flexural bending of continental crust occurring in the foreland part. The
different thickness of stratum between these normal faults that synsedimentary faults were formed
during the early to the middle Atoka time. In late Atokan time, the subduction successively pushed
northwards against stratum, forming a foreland basin (Figure 7E).

11
Figure 7 Cross sections showing the tectonic development of the Ouachita-Arkoma system.
A: Precambrian rifting B: Late Cambrian to Early Mississippian passive margin development C:
Early Mississippian to Early Pennsylvanian south-directed subduction D: Late Mississippian to
Early Pennsylvanian normal faulting E: Late Pennsylvanian thrusting. Cross sections modified
from Houseknecht (1986)
Alternately, another tectonic history model of the Arkoma Basin was constructed, based on
seismic and gravity data (Mickus and Keller, 1992). As opposed to Houseknecht’s theory, it
suggests that the Sabine block docked with North America in late Paleozoic time (Permian), but no
large-scale collision occurred between the North American Plate and the Sabine continental block,
reflected by difference of density value (Figure 8). The thickness of the Arkoma basin is about 14

12
km from middle to upper Paleozoic. The sediments which include marine and nonmarine types
came from the Ouachita orogeny in Pennsylvanian time. The thickness of lower Paleozoic
(Cambrian- Silurian) is less than 3 km and the density of these rocks is similar to the upper
crystalline crust. The sediments of Ouachita facies in the Ouachita Mountains accumulated to 15
km, and formed in deep-water environment. These sedimentary units are characterized by
low-grade metamorphism with higher density reflections.
Figure 8 Lithospheric transect model. Numbers are densities in g/cm3. All interfaces in crust
beneath area of PASSCAL-COCORP surveys are constrained primarily by seismic data. (Mickus
and Keller, 1992)
1.5 Paleogeography and Depositional History
From Cambrian to early Mississippian time, shallow-water carbonates were deposited on
the Arkoma shelf (Figure 9A), caused accumulation of black shales and cherts. In late
Mississippian time, a thick sequence of turbidites was deposited southwestward into central

13
Arkansas. Submarine fans were formed due to massive accumulations of turbidites and other deep
water deposits.
In Morrowan time, fluvial-deltaic facies were deposited in the northeastern part of the
Arkoma Basin and shallow marine carbonate sediments were found to the northwest (Figure 9C).
Slope, submarine fan and basin facies were deposited to the south reflected by deep-water
quartzose clastics. The thickness of sediments increased from north to south. One of the reasons
that the thickness of sediments was different is synsedimentary normal faults started to grow. On
the slope area, sediments transported across the continental shelf and into the ocean formed
submarine landslides. Debris flows also developed on this area causing olistostrome deposits
(Link, 1986).
During the Atokan, the overthrust structure from south caused the foreland basin to
contract and move northward. On the north part of the continental shelf, fluvial-deltacic,
shallow-marine facies and shelf facies were mainly depositional environment (Figure 9EF). On the
south part, slope, submarine fan and basin facies occurred. Meanwhile, high angle syndepositional
normal faults were formed at the outer shelf edge (Link, 1986).The lower Atoka units formed thick
turbidite facies in the south and thin fluvial-deltaic facies in the north. As time goes by,
fluvial-deltaic depositional environment becomes majority facies during late Atoka time.
In the Desmoinesian, the foreland basin was continually impacted by advancing thrust
from southern side and was restricted by the Ozark dome which was a positive lowland from
northern side. As a result of these, the foreland basin closed from south to west. Fluvial, deltaic and

14
shallow-marine deposits were mainly formed in western Arkansas (Houseknecht and Kacena,
1984).

15
Figure 9 Paleogeographic reconstructions of Mississippian and Pennsylvanian depositional
systems. Reconstructions focus on present day eastern Oklahoma and western Arkansas. Modified
from Sutherland (1988).

16
2. METHODOLOGY
Raster logs: There are total 986 wells and 38 of them are used in cross sections, however,
some of these wells were not used due to poor quality and lack of Raster Log curves. Gamma ray,
Spontaneous (SP), resistivity and conductivity log are used to identify sandstone units such as
Areci and Tackett, as well as the intervening shale formations. Figure 10 shows wells used to
construct cross-sections and contour maps. Petra® is the main software used in data management,
manipulation, visualization and integration of geological data.
Cross-section maps: Six regional index cross-sections were made. Three cross-sections
stretch from north to south and three sections extend from west to east. Cross-sections which are
2D planes indicate the form and orientation of strata structure. It is used to understand the
development of different strata and faults.
Isopach Mapping: Several isopach maps for target units and whole the middle Atoka are
constructed to figure out differential thickness in Atokan time and support the development of the
stratigraphic sequence.
Sediment Mapping: The distributions of the various types of classified sediment were
mapped. Based on different shape of Gamma ray and resistivity logs, a variety of depositional
models were constructed in the research area.
Stratigraphic Columns: Stratigraphic columns were constructed to show different
formations and units with their thickness on the map and help understanding variation in the

17
depositional environment over time. They were constructed for locations along the delta or coastal
area that show a wide variety of sediment and structures. These columns aid in interpreting
relationships between morphology and sediment. Ultimately, the geologic processes responsible
for the observed sediment distribution and structures will be interpreted.
Figure 10 Map showing wells used for constructing cross-sections

18
3. LOG EXPRESSION
Logging techniques have rapidly improved in recent decades. Geologists are able to use
specific software acquiring high resolution well log figures through internet database. Meanwhile,
the highly accurate and reliable data are the basis to identify physical properties of rocks and
build reasonable correlation between wells. Consequently, log analysis is commonly used to
make cross-sections and classify different strata in this study. Figure 11 shows frequently used
logging curve, involving SP log, Gamma ray log, resistivity log and conductivity log.
3.1 Log Analysis
SP curve also called spontaneous potential curve is one of the basic logs used in analysis.
The mechanism of SP curve is measuring the difference in electromotive force between the fluid
in the drilling mud and fluid in the pores of rock (North, 1985). Using SP curve is an approach to
detect permeable beds, boundaries of permeable bed, determine formation-water resistivity and
the volume of shale in permeable beds (Asquith and Krygowski, 2004). The value of SP curve is
negative to the left and positive to the right. In the normal situation, the curve moving to the left
means porous rock, such as porous sandstone. On the contrary, high positive reading indicates
imporous rocks, such as dense limestones, shales and evaporates. As a result, the SP curve is an
indicator to identify lithology of different rocks, and variation of porosity and pore fluid.
In addition to SP curve, gamma ray is the other useful logging method in recognizing
19
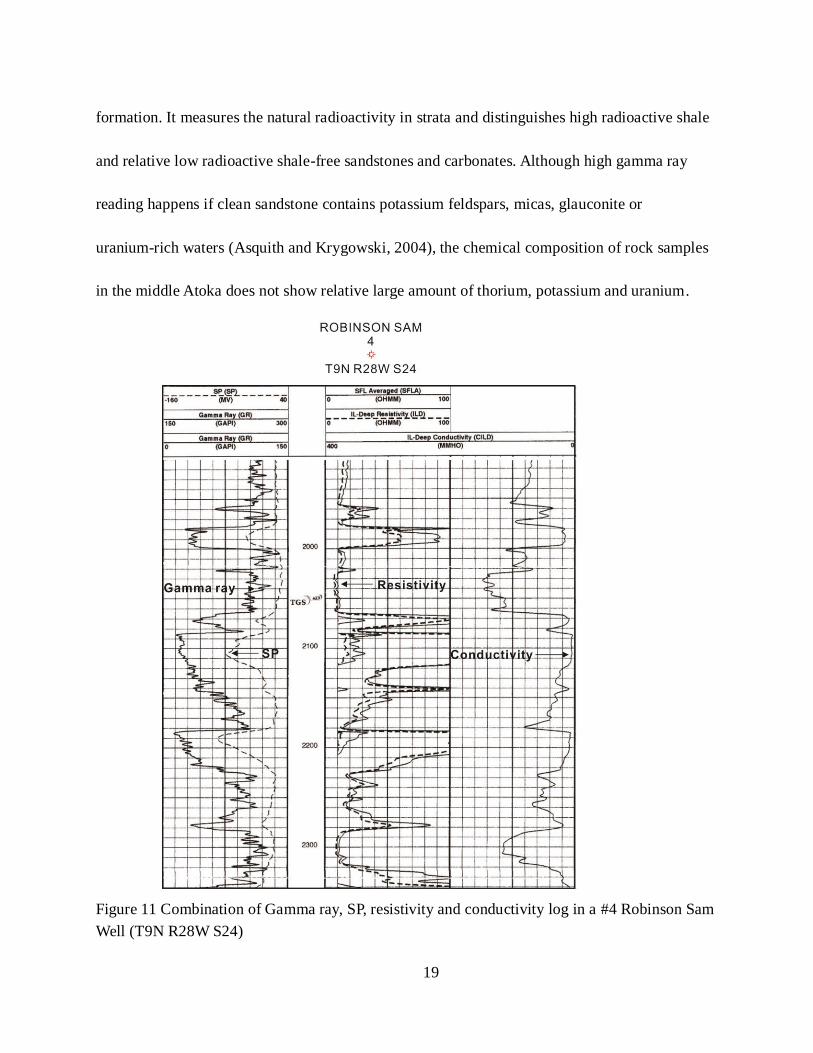
formation. It measures the natural radioactivity in strata and distinguishes high radioactive shale
and relative low radioactive shale-free sandstones and carbonates. Although high gamma ray
reading happens if clean sandstone contains potassium feldspars, micas, glauconite or
uranium-rich waters (Asquith and Krygowski, 2004), the chemical composition of rock samples
in the middle Atoka does not show relative large amount of thorium, potassium and uranium.
Figure 11 Combination of Gamma ray, SP, resistivity and conductivity log in a #4 Robinson Sam
Well (T9N R28W S24)

20
The resistivity log and the conductivity log have reciprocal relationship. As for resistivity
log, it is used for determining hydrocarbon-bearing versus water-bearing zones and identifying
porosity and permeable zones (Asquith and Krygowski, 2004). The value of resistivity log is
high in dense rocks, such as limestones, evaporates, metasedimentary rocks and porous rocks
with oil or fresh water. In contrast, the low resistivity reading with high SP value generally infers
shales with dispersive quartz or tight siltstones because clay is a conductor.
3.2 Facies and Log expression interpretation
Gamma ray and SP logs are generally used in log expressions of sandstone. The middle
Atoka is composed of sandstone and shale units. There are four basic wireline log models
reflecting different depositional facies.
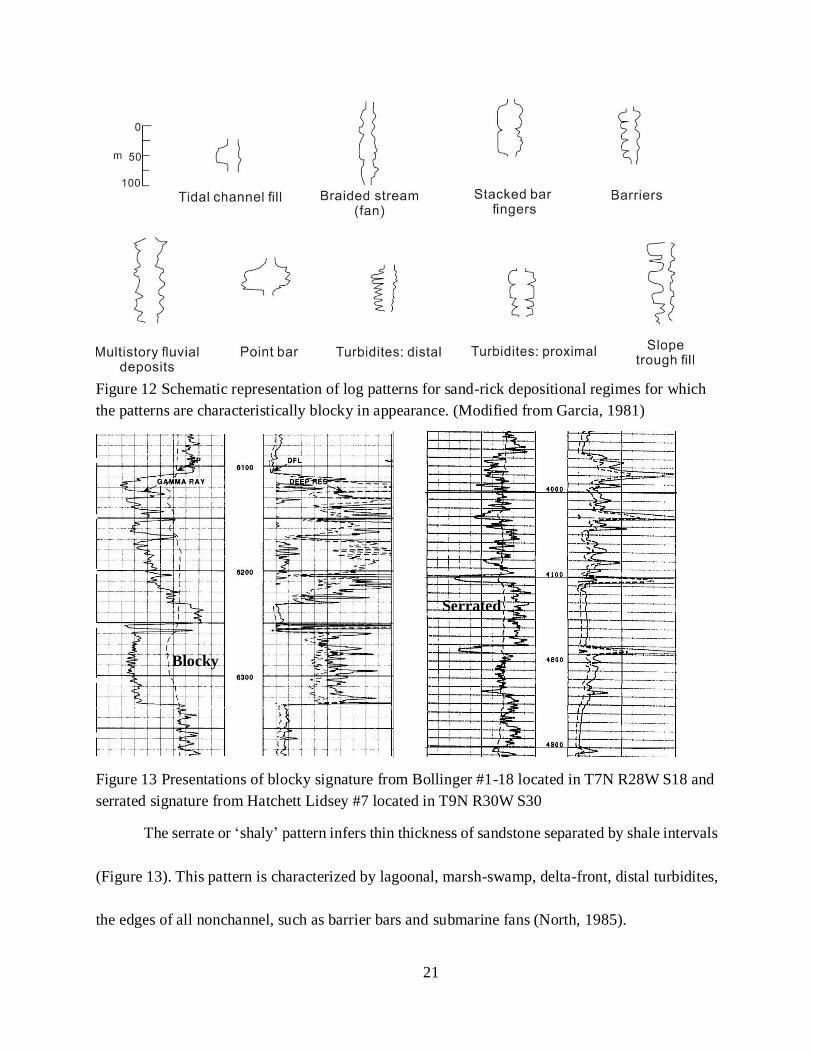
The blocky or bell-shaped curves represent the successive uniform and massive sandstone
and few nonsandy intervals (Figure 12). The typical depositional environments of blocky log
pattern have channel-bars, fluvial channel, distributary channel, deltas and turbidity current. In
particularly, these sandstones are stacked one upon the other, forming sequential deposition (North,
1985). Figure 13 shows an example logging signature in T7N R28W S18 section, with a blocky
pattern.
21
Figure 12 Schematic representation of log patterns for sand-rick depositional regimes for which
the patterns are characteristically blocky in appearance. (Modified from Garcia, 1981)
Figure 13 Presentations of blocky signature from Bollinger #1-18 located in T7N R28W S18 and
serrated signature from Hatchett Lidsey #7 located in T9N R30W S30
The serrate or ‘shaly’ pattern infers thin thickness of sandstone separated by shale intervals
(Figure 13). This pattern is characterized by lagoonal, marsh-swamp, delta-front, distal turbidites,
the edges of all nonchannel, such as barrier bars and submarine fans (North, 1985).
Blocky
Serrated
22
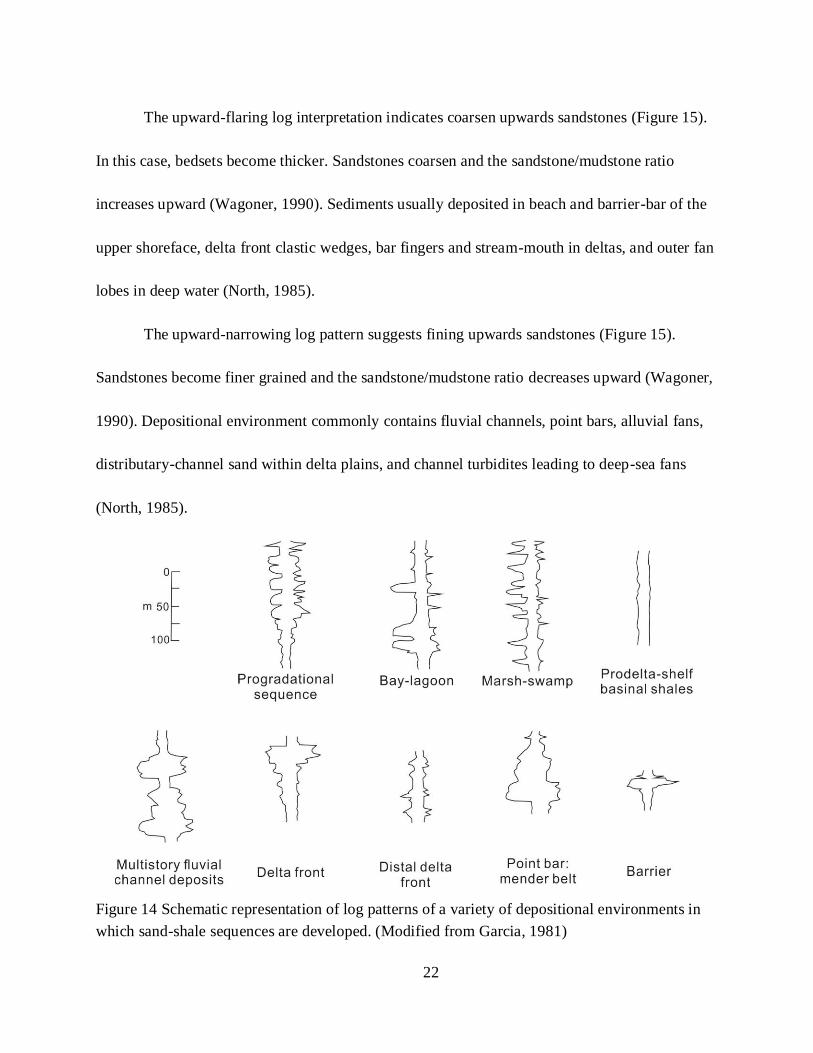
The upward-flaring log interpretation indicates coarsen upwards sandstones (Figure 15).
In this case, bedsets become thicker. Sandstones coarsen and the sandstone/mudstone ratio
increases upward (Wagoner, 1990). Sediments usually deposited in beach and barrier-bar of the
upper shoreface, delta front clastic wedges, bar fingers and stream-mouth in deltas, and outer fan
lobes in deep water (North, 1985).
The upward-narrowing log pattern suggests fining upwards sandstones (Figure 15).
Sandstones become finer grained and the sandstone/mudstone ratio decreases upward (Wagoner,
1990). Depositional environment commonly contains fluvial channels, point bars, alluvial fans,
distributary-channel sand within delta plains, and channel turbidites leading to deep-sea fans
(North, 1985).
Figure 14 Schematic representation of log patterns of a variety of depositional environments in
which sand-shale sequences are developed. (Modified from Garcia, 1981)

23
Figure 15 Presentations of upward-flaring signature from Snodgrass J S #3 located in T9N R28W
S6; Upward-narrowing signature from Fisher Carty #1-31 located in T10N R28W S31
24
4. SEQUENCE STRATIGRAPHY
A sequence is a relatively conformable succession of related strata bounded by
unconformities and their correlative conformities (Vail, et al., 1977) In general, a complete
sequence includes three systems tract: lowstand, transgressive and highstand. According to
relative sea-level change over time, the interplay between sediment flux and rate of
accommodation restricts sedimentary succession in different stacking patterns.
4.1 Lowstand System s Tract (LST)
Lowstand systems tract involves sediments that accumulate after the onset of a relative
sea-level fall (Figure 16). It is positioned between upper transgressive surface formed when the
deposits onlap onto the shelf margin and the lower sequence boundary. A forced regression
means a shoreline move seaward in response to relative sea-level declining. The lowstand
systems tract can be classified into an early lowstand systems tract which implies a forced
regression and forms an unconformity sequence boundary when relative sea-level falls and a late
lowstand systems tract which means the lowest position on the relative sea-level curve
(Posamentier and Allen, 1999). However, the boundary between early Lowstand systems tract
and overlying sediments is not clear if the lowstand systems tract were filled by incised valleys.
Estuaries are landwards formed if the incised valleys begin to flood when relative sea-level rise,
blocked dispersal of sediment onto the shelf. Lowstand systems tract ceases when the rate of

25
relative sea-level rise exceeds sediment supply, resulting transgression. The characteristic of
lowstand systems tract in strata is an overall regressive stratigraphic unit that overlays the
sequence boundary and onlaps onto the unconformable sequence boundary (Posamentier and
Allen, 1999). The middle Atoka formation includes several sea-level cycles, reflecting shoreface,
coastal plain or nearshore marine environment.
Figure 16 Schematic dip section of early and late phase lowstand systems tract and the
relationship with relative sea-level. (Posamentier and Allen, 1999)
Sea-level change plays a major role determining construction of strata and location of
stratigraphic boundary in coastal and shoreface environment. Through observing well log section
in the middle Atoka, it is clearly shows series of successive sandstone units separated by thin
shale units. For example, there are seven sandstone units divided by six shale units within 1000
feet of thickness in the lower Atoka formation (Figure 17). The thickness of the thin shale is
about 30 feet per unit, indicating that higher-frequency cycles existed in early Atoka time. An

26
unconformity occurs at the base of the lower Atoka formation, which is the sequence boundary
of lowstand systems tract. Successive sequences and associated sea-level cycles are developed in
the lowstand systems tracts. Parasequences consist a stacking pattern which forms seaward
progradation. As time goes by, late lowstand systems tract gradually formed from a prograding to
an aggrading stacking pattern.
27
Figure 17 Example of well-log patterns in the entire Atoka formation including a lowstand
systems tract, transgrssive systems tract, highstand systems tract (#6, DentVivin)

28
4.2 Transgression Systems Tract (TST)
A transgression occurs when the rate of relative sea-level rise exceeds the rate of
sediment input, and leads a shoreline landward migration. When relative sea-level rapidly rises,
the transgression systems tract is easier to identify in coastal to shelf settings because it generally
has fining-upward expression, inferring shaly sandstone or shale-rich marine sediments. The
others common depositional environments involves fluvial, estuary and lagoon. The
transgression systems tract can include single or a series of smaller-scale regressive-transgressive
events which means a landward stepping and upward-deeping stacking pattern.
Transgressive surface (TS) is a term to describe the boundary between lowstand systems
tract and transgressive system tract (Posamentier et al., 1998). It is important to note that
trangressive surface which is characterized by the consolidated muds can be identified in well
logs by a regressive stacking pattern, to a trangressive stacking pattern. The other boundary is
defined by maximum flooding surface (MFS) which shorelines reach at the maximum landward
position (Figure 18).

29
Figure 18 Schematic depiction of important boundary surfaces in systems tract (Modified from
Christopher Kendall, 2003)
The cross-section from a well log in the middle Atoka formation (Figure 17) shows that
coastline rapidly retreats across the shelf within a relatively short geological time because thin
sandstone and shale units alternately appear in thin intervals. After that, relative sea-level
continuously rise, reflected by the thick shale units. In addition, condensed section which is a
thin marine stratigraphic unit formed within a slow depositional rate also occurs in the cross
section, indicated by high gamma ray (Vail et al., 1984). It is a significant marker of the upper
boundary of the transgressive systems tract and contains the maximum flooding surface (MFS)
which is overlain by the down lapping highstand systems tract.
4.3 Highstand Systems Tract (HST)
Above maximum flooding surface, the regressive sediment deposited and constructed
highstand systems tract when sediment supply exceed the rate of relative sea-level rise. It located
in topographically higher setting, compared with lowstand systems tract. The lower boundary is
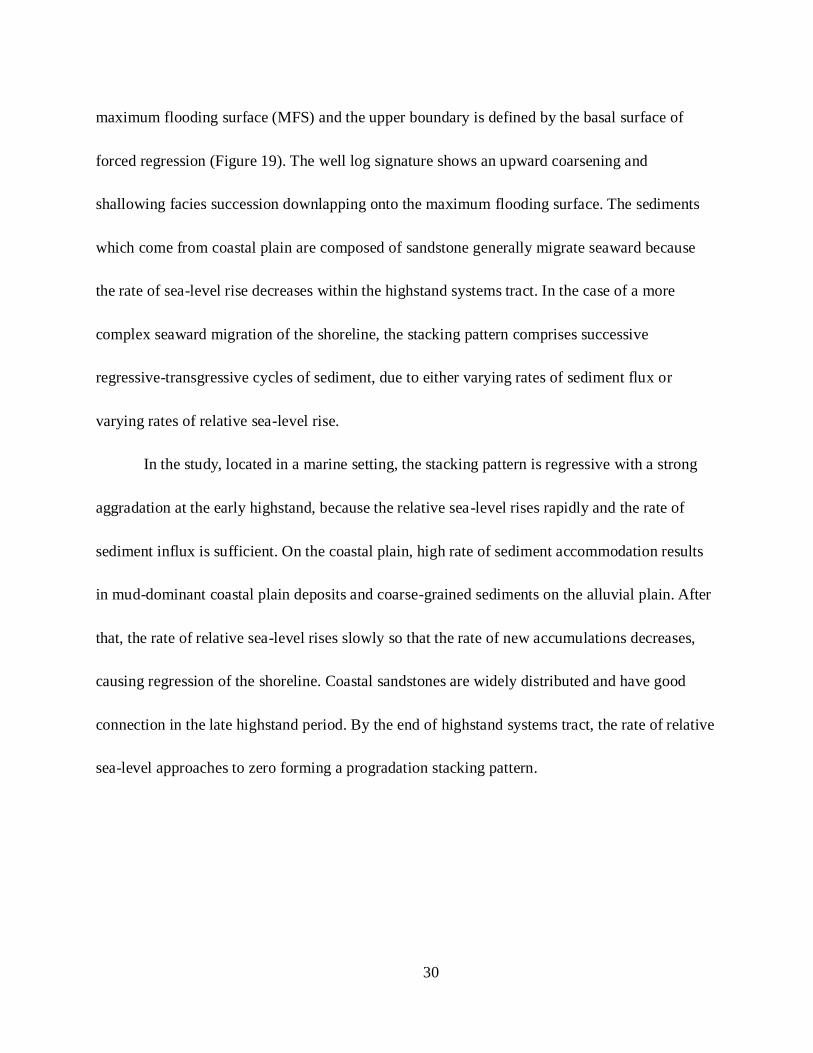
30
maximum flooding surface (MFS) and the upper boundary is defined by the basal surface of
forced regression (Figure 19). The well log signature shows an upward coarsening and
shallowing facies succession downlapping onto the maximum flooding surface. The sediments
which come from coastal plain are composed of sandstone generally migrate seaward because
the rate of sea-level rise decreases within the highstand systems tract. In the case of a more
complex seaward migration of the shoreline, the stacking pattern comprises successive
regressive-transgressive cycles of sediment, due to either varying rates of sediment flux or
varying rates of relative sea-level rise.
In the study, located in a marine setting, the stacking pattern is regressive with a strong
aggradation at the early highstand, because the relative sea-level rises rapidly and the rate of
sediment influx is sufficient. On the coastal plain, high rate of sediment accommodation results
in mud-dominant coastal plain deposits and coarse-grained sediments on the alluvial plain. After
that, the rate of relative sea-level rises slowly so that the rate of new accumulations decreases,
causing regression of the shoreline. Coastal sandstones are widely distributed and have good
connection in the late highstand period. By the end of highstand systems tract, the rate of relative
sea-level approaches to zero forming a progradation stacking pattern.
31
Figure 19 The stacking pattern of highstand systems tract (Posamentier and Allen, 1999)
There are some crucial factors determining these systems tracts, such as the depostional
environment and type of sedimentary processes; the balance between the rate of sediment supply
and accommodation; tectonic and physiographic setting; frequency of relative sea-level cycles.
This study only focuses on the influence of depositional environment and high frequency of
relative sea-level cycles because of limitation of data.
4.4 Sequence stratigraphy of the Middle Atoka Formation
Sequence stratigraphy study is an effective way to identify chronostratigraphic framework
of repetitive, strata boundaries and their correlative conformities (Van Waggoner, 1988). Previous
investigations of the Atoka formation conclude that a third order cycle exists along with the
overlying Hartshorne sandstone (Valek, 1999).

32
1. Dunn”A”-Casey Cycle
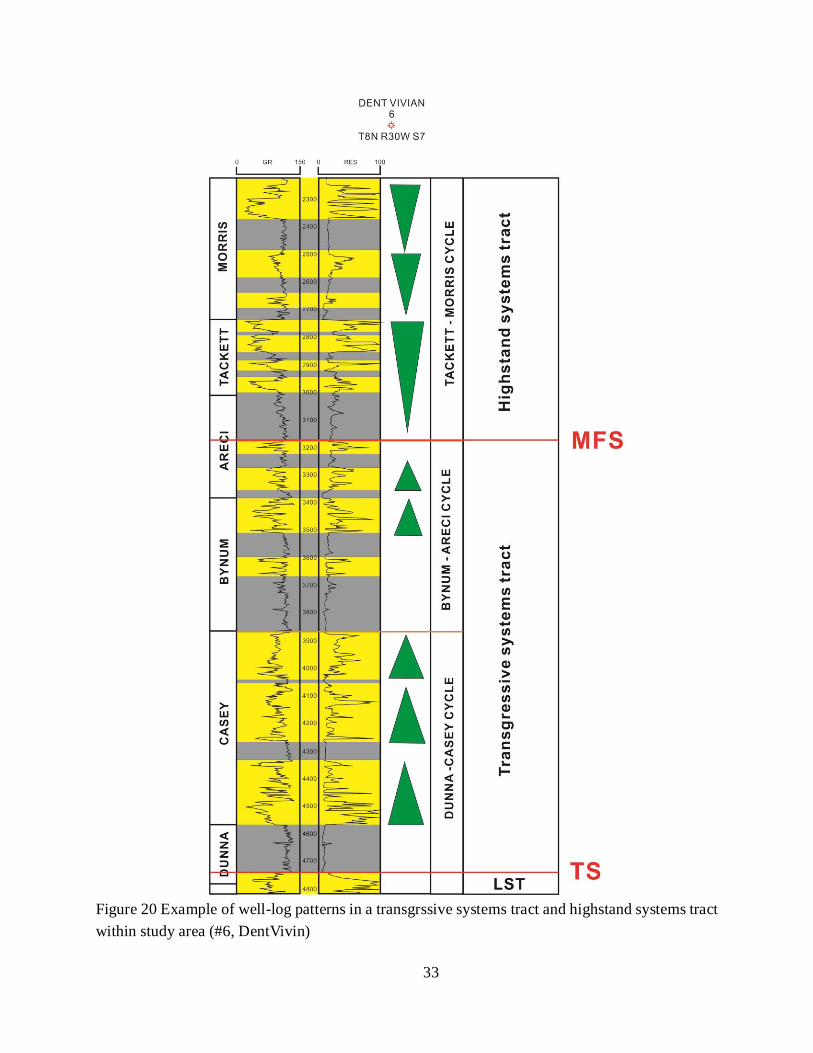
In the northern part of study area, the middle Atoka can be divided into three cycles based
on the well logs and cross-sections (Figure 20). The first Dunn”A”-Casey cycle has three major
sandstone intervals and three shale units (Figure 21). The thickness of each sandstone interval
ranges from 150 to 200 feet. The thick shale unit which is a mark of a bottom boundary indicates
sea-level rapidly rising. Compared with the stable shale unit, the gamma ray curve frequently
varies in most sandstone intervals, reflected a high level of wave energy between where sand and
shale accumulate. It probably infers coastal, deltaic or tidal environment. The thickness of shale
unit decrease which means relative sea-level rising slowly.
33
Figure 20 Example of well-log patterns in a transgrssive systems tract and highstand systems tract
within study area (#6, DentVivin)

34
Figure 21 Selected well log from cross section A-A’ shows Dunn”A”-Casey Cycle
2. Bynum-Areci Cycle
This cycle contains four sandstone intervals separated by four shale units (Figure 22).
The thickest shale unit, at the base of the boundary, reaches 200 feet. With increasing depth, the
ratio of sand/mud decreases, indicating that he grain size of sandstone increases from the bottom
to the top. The alternating appearing of sandstone and shale is a typical sign of coastal or
shoreline environment, because transgression and regression, affected by high frequency wave.
The tendency of gamma ray shows fining-upward, indicating a transgressive systems tract. From
north to south, the thickness of these sandbodies increase slightly.

35
Figure 22 Selected well log from cross section A-A’ shows Bynum-Areci Cycle
3. Tackett-Morris Cycle
Tackett-Morris Cycle contains two different depositional environments. Both of them
have upward-coarsening features. The lower part starts from 2750 feet to 3200 feet. This
parasequence reflects coastal environment, similar with Bynum-Areci cycle, because the
alternative feature of sandstone and shale units. However, the upper part of this cycle is likely a
deltaic environment. From 2200 feet to 2400 feet, it is possible be a distributary mouth bar
associated the shape of gamma ray curve. Below 2400 feet to upper boundary of coastal
parasequence, it can be explained as a delta front or prodelta environment.

36
5. DEPOSITIONAL ENVIRONMENT
The depositional environments experienced changes during the Atoka in the Arkoma
Basin. During the early Atoka, northward transgression formed widespread Atoka sediments
above an erosion surface (unconformity). The blocky sandstone intervals are recognized on the
well log (Figure 17), represented pre-transgression channel systems and shorefacies. During the
middle Atoka, transgressive systems tract controlled the distribution and the development of
sandbodies. Periodic northward transgressions brought open-shelf environments to the Arkoma
Basin, forming several thick shale units. Tidal flat coastal facies and deltaic facies are present. In
addition, northeast trending normal faults were formed from south to north, so that increasing
volume of sediments accumulated on the downthrown side. Upper Atoka strata are characterized
by tectonic controlled depositional mode. However, periodic transgression persistently
interrupted deltaic environment and generated shale units.
Several Isopach maps were constructed in order to find a pattern of the distribution of
each sandbody unit, were based on the stratigraphic delineation and correlation from
cross-sections. This study mainly focuses on the Tackett and Casey units because these intervals
involve a complete interval. The Isopach maps reflect the variation of thickness and distribution
of sandbodies in the study area.

37
5.1 The whole middle Atoka formation
The whole middle Atoka formation includes units from Lower Carpenter to Dunn”A”.
The maximum thickness reaches 4027.8 feet in section 7N 28W (southeast) and the minimum
thickness is about 1878.1 feet in section 9N 30W (northwest). The average thickness is 2774.4
feet. From the figure 23, the thickness increases from northwest to southeast, and the
sedimentary center located in southeastern part of study area.

38
Figure 23 Isopach map of the Middle Atoka formation
39
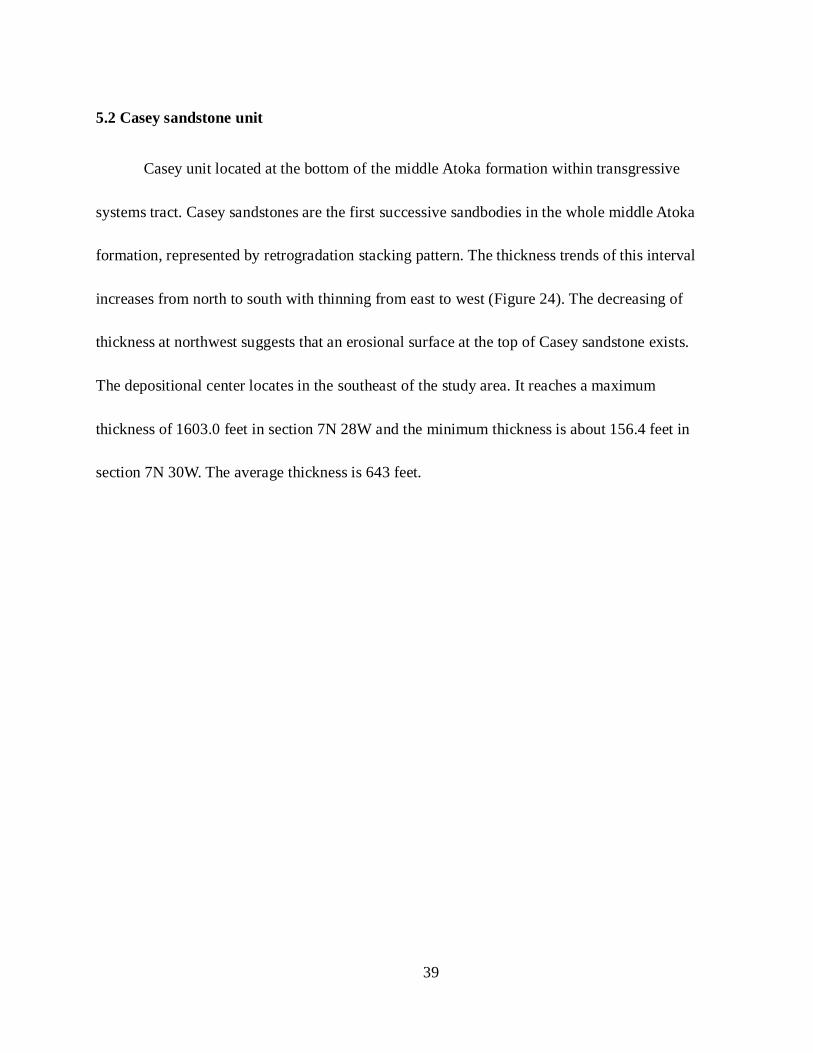
5.2 Casey sandstone unit
Casey unit located at the bottom of the middle Atoka formation within transgressive
systems tract. Casey sandstones are the first successive sandbodies in the whole middle Atoka
formation, represented by retrogradation stacking pattern. The thickness trends of this interval
increases from north to south with thinning from east to west (Figure 24). The decreasing of
thickness at northwest suggests that an erosional surface at the top of Casey sandstone exists.
The depositional center locates in the southeast of the study area. It reaches a maximum
thickness of 1603.0 feet in section 7N 28W and the minimum thickness is about 156.4 feet in
section 7N 30W. The average thickness is 643 feet.
40
Figure 24 Isopach map of Casey unit
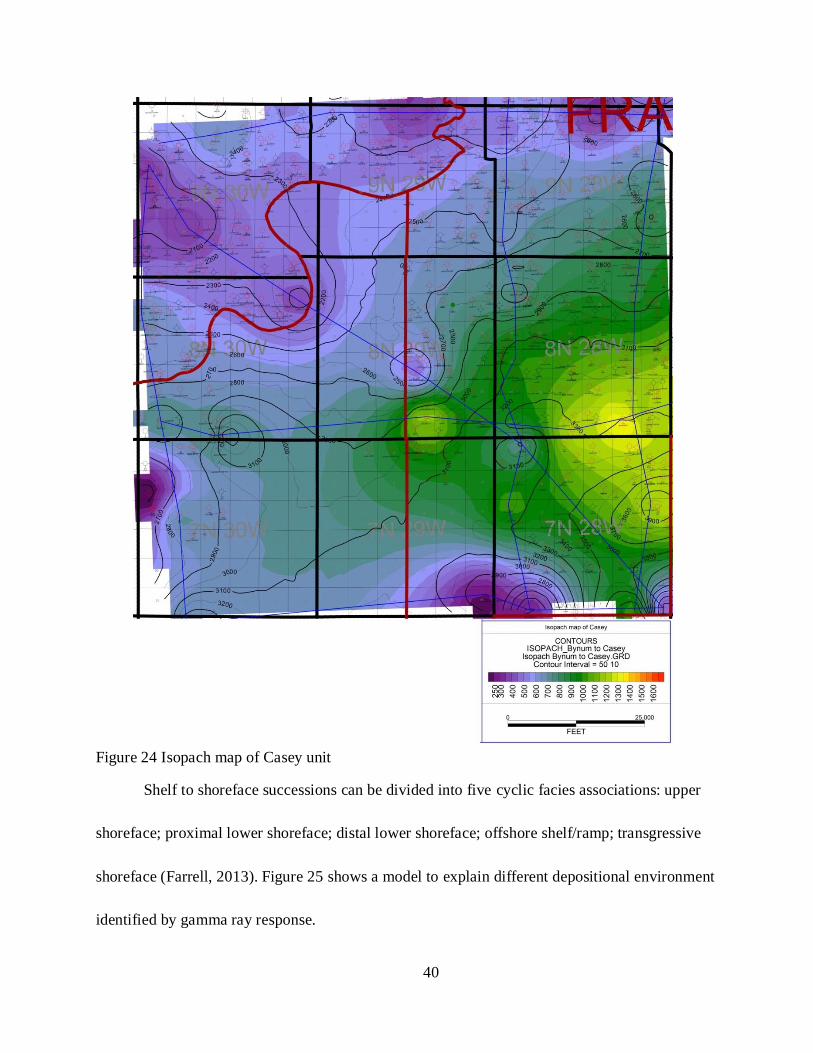
Shelf to shoreface successions can be divided into five cyclic facies associations: upper
shoreface; proximal lower shoreface; distal lower shoreface; offshore shelf/ramp; transgressive
shoreface (Farrell, 2013). Figure 25 shows a model to explain different depositional environment
identified by gamma ray response.

41
Figure 26 and 27 show the selected well log signatures in cross section. In cross section
A-A’, the first well log #1 Harris C Unit shows spikes in high gamma ray values, indicating a
transgressive shoreface environment which involves sediment from subtidal to intertidal located
near or above the low-tide level.
Proximal lower shoreface and distal lower shoreface deposited above storm-weather
wave base and they are widespread in cross-section B-B’. Both of them are featured by coarsely
serrated. The blocky sandstone units near the bottom such as #6 Dent Vivian, #1 Hatfield, #17-1
USA, #1 W H Lewis in cross section A-A’ are good examples.
Distal lower shoreface contains muddy sands and sand-dominated heterolithic strata with
mud interbeds. The difference between proximal lower shoreface and distal lower shoreface is
changing from muddy to clean sand or lack of mud interbeds. For instance, in cross section B-B’,
the coarsening sandstone is separated by thin mud interbeds.
Upper shoreface is defined as sediment deposited above fair-weather wave base. It is
characterized by massive, poorly stratified or graded beds and blocky gamma ray response. The
absence of mud is the distinction between proximal lower shoreface and upper shoreface. In the
lower Atoka formation, several thick blocky sandstone units represent upper shoreface.
Offshore shelf or ramp deposited below storm-weather wave base, indicated by fining
upward sawtooth pattern and high gamma ray response. It has sandy mud heterolithic strata with
thin sand interbeds. Shelf commonly occurs in the middle Atoka formation and it is a signifcant
marker to identify sea-level cycles.
42
Figure 25 Facies association: depositional environment associated with facies units. (Modified
from Farrell, 2013)

43
Fig
ure
26
Cas
ey s
and
ston
e u
nit
in
cro
ss-s
ecti
on
A-A
’, B
-B’
and
C-C
’

44
Fig
ure
27
Cas
ey s
and
ston
e u
nit
in
cro
ss-s
ecti
on
D-D
’ an
d E
-E’
45
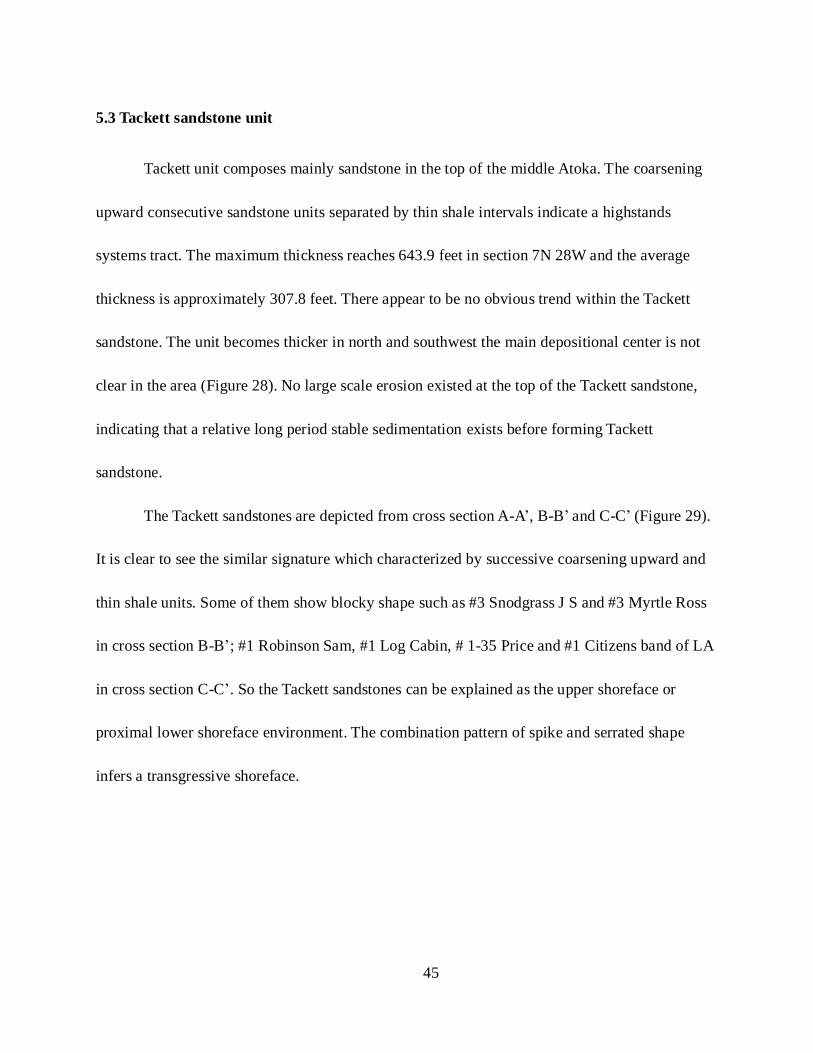
5.3 Tackett sandstone unit
Tackett unit composes mainly sandstone in the top of the middle Atoka. The coarsening
upward consecutive sandstone units separated by thin shale intervals indicate a highstands
systems tract. The maximum thickness reaches 643.9 feet in section 7N 28W and the average
thickness is approximately 307.8 feet. There appear to be no obvious trend within the Tackett
sandstone. The unit becomes thicker in north and southwest the main depositional center is not
clear in the area (Figure 28). No large scale erosion existed at the top of the Tackett sandstone,
indicating that a relative long period stable sedimentation exists before forming Tackett
sandstone.
The Tackett sandstones are depicted from cross section A-A’, B-B’ and C-C’ (Figure 29).
It is clear to see the similar signature which characterized by successive coarsening upward and
thin shale units. Some of them show blocky shape such as #3 Snodgrass J S and #3 Myrtle Ross
in cross section B-B’; #1 Robinson Sam, #1 Log Cabin, # 1-35 Price and #1 Citizens band of LA
in cross section C-C’. So the Tackett sandstones can be explained as the upper shoreface or
proximal lower shoreface environment. The combination pattern of spike and serrated shape
infers a transgressive shoreface.

46
Figure 28 Isopach map of Tackett sandstone unit

47
Fig
ure
29
Tac
ket
t sa
nd
sto
ne u
nit
in
cro
ss-s
ecti
on
A-A
’, B
-B’
and
C-C
’

48
5.4 Coastal settings
In a coastal setting, it is necessary to discussion wave energy and tidal energy. These two
factors control the morphology of coasts and thickness of systems tract, particularly in
transgressive systems tract. A coast with low wave energy and high tidal energy means recurrent
sediment erosion and reworking during transgression. Estuarine-like embayment is formed
including tidal channels, sand ridges, tidal flats and marshes (Posamentier and Allen, 1999).
Impacted of sediment reworking, tidal currents generate a pattern described by successive fining
upward transgressive systems tract.
The existence of tidal sand ridges is a key characteristic in coastal depositional
environments associated with high tidal energy but low wave energy. They are formed as a
combination of aggradation and progradation, identified by an hour glass shape (Figure 30). The
depositional environment can be reworked offshore bars, regressive to transgressive shoreface
deltas. In such settings, tidal sand ridges, tidal channels and distributary channels deposit above
lowstand or highstand fluvial or coastal plain sediments. High tidal setting has influence on
incised valleys during transgression (Dalrymple et al., 1994). Fluvial sediments from incised
valley are overlaid by tidal estuaries and channels. The different between these two settings is
that the grain changes from coarse size in fluvial sediments to medium size in tide dominated
estuarine channel-fill deposits. An example from #6 Dent Vivian well log (Figure 20), there are
several thick sandstone intervals in the lower Atoka formation with low gamma ray value,

49
represented a transition from fluvial deposit to tidal deposit.
Figure 30 Gamma ray response to variation in grain size associated depositional environment
(Emery, 1996)
Through observing the well log, it is obvious that the thickness of sandbodies decreases
upward and sandstones become more shaley upward in transgressive systems tract because of the
relative high gamma ray value. The thick shale unit is inferred to be shelf after flooding of the
coastal or delta plain (Figure 30). When tidal cureent are not sufficiently strong to support sand
ridges, other small sandbodies such as sand ribbons, sand pathes can be formed. But it is
extremely difficult to identify in well logs because these small sandboies are general less than 1.6
feet thick (Posamentier and Allen, 1999).

50
6. CONCLUSION
The middle Atoka formation is composed of transgressive systems tract and highstand
systems tract. It includes mainly three sedimentary cycles with high frequency wave. Wireline
logs, sequence stacking patterns indicate deposition in coastal shoreface or nearshore marine
environment. During the middle Atoka period, transgressive systems tract control the distribution
and development of sandbodies. Periodic northward transgressions bring open-shelf environment
to the Arkoma Basin, forming several thick shale units. Tidal flat associated coast with low wave
energy and high tidal energy is present in the study area, reflected by tidal sand ridges. In
addition, northeast trending normal faults were formed from south to north, so that increasing
number of sediments accumulated on the downthrown.
Casey sandstone units are the first successive sandbodies in the entire middle Atoka
formation, represented by retrogradation stacking pattern. It can be inferred deposition in shelf to
shoreface environment. The thickness trends of this interval increases from north to south with
thinning from east to west
Tackett sandstone units compose mainly sandstone in the top of the middle Atoka. The
progradation stacking pattern indicates a highstand systems tract. The strata become thicker in
north and southwest the mainly depositional center is not clear in the area.

51
REFERENCES
Asquith, G., and D. Krygowski., 2004, Basic Well Log Analysis (2nd Edition), American
Association of Petroleum Geologists, Tulsa, 21 p.
Allen, P.A.; Homewood, Peter; and Williams, G.D., 1986, Foreland basins: an introduction, in
Allen, P.A.; and Homewood, Peter, eds., Foreland basins: Blackwood Scientific Publications,
Boston, Massachusetts, p. 3-12.
Dalrymple, G.B., 1994. The age of the Earth. Stanford University Press.
Decelles, P.G.; and Giles, K.A., 1996, Foreland basin systems: Basin Research, v. 8, p. 105-123.
Denison, R.E., Kenny, G.S., Burke, W.H. and Hetherington, E.A., 1969. Isotopic ages of igneous
and metamorphic boulders from the Haymond Formation (Pennsylvanian), Marathon Basin, Texas,
and their significance.Geological Society of America Bulletin, 80(2), pp.245-256.
Emery, D & Myers, KJ., 1996. Sequence stratigraphy. Blackwell Science Limited, 297pp.
Farrell, K.M., Harris, W.B., Mallinson, D.J., Culver, S.J., Riggs, S.R., Wehmiller, J.F., Moore, J.P.,
Self-Trail, J.M. and Lautier, J.C., 2013. Graphic logging for interpreting process-generated
stratigraphic sequences and aquifer/reservoir potential: with analog shelf to shoreface examples
from the Atlantic Coastal Plain Province, USA. Journal of Sedimentary Research,83(8),
pp.723-745.
Garcia, M. N., 1981, Geophysical Log Correlation of Far Away Logs Drilled In the Southern
Region of Mexico And Its Relation With The Possible Yucatan Atoll (Spanish). Society of
Petrophysicists and Well-Log Analysts
Haley, B,R., 1982, Geology and energy resources of the Arkoma Basin, Oklahoma and Arkansas:
University of Missouri at Rolla, UMR Journal, no. 3, p. 42-53.
Haley, B. R., & Hendricks, T. A., 1972. Geology of the Van Buren and Lavaca quadrangles,
Arkansas-Oklahoma. [Little Rock], Arkansas Geological Commission.
Houseknecht, D.W. and Kacena, J.A., 1983. Tectonic and sedimentary evolution of the Arkoma
foreland basin. Tectonic-sedimentary evolution of the Arkoma basin: SEPM Midcontinent Section

52
Guidebook, 1, pp.3-33.
Houseknecht, David W., 1986, Evolution from Passive Margin to Foreland Basin: The Atoka
Formation of the Arkoma Basin, South‐Central USA. Foreland basins, p.327-345.
Johnson, K. E., 1968, Sedimentary environment of Stanley Group of the Ouachita Mountains of
Oklahoma: Jour. Sed. Petrology, v. 38, p. 723-733.
King, P. B., 1961, History of the Ouachita system, in The Ouachita system: Texas Univ. Pub.
6120, p. 83-98
Kendell, C.S.C., Lakshmi, V., Althausen, J. and Alsharhan, A.S., 2003. Changes in microclimate
tracked by the evolving vegetation cover of the Holocene beach ridges of the United Arab
Emirates. Desertification in the Third Millennium, pp.91-98.
Link, M.H., and M.t. Roberts, 1986, Pennsylvanian paleogeography for the Ozarks, Arkoma, and
Ouachita Basins in east-central Arkansas, in C.G. Stone and B. R. Haley,eds., Sedimentary and
igneous rocks of the Ouachita Mountains of Arkansas: a guidebook with contributed papers part 2:
Arkansas Geological Commission Guidebook 86-2, p. 37-60.
Miall, A.D., 1995, Collision-related foreland basins, in Busby, C.J.; and Ingersoll, R.V., eds.,
Tectonics of sedimentary basins: Blackwell Science, Cambridge, Massachusetts, p. 393- 424.
Mickus, K. L., & Keller, G. R., 1992. Lithospheric structure of the south-central united
states. Geology (Boulder), 20(4), 335-338.
North, F.K., 1985. Petroleum geology. Boston et al.: Allen and Unwin.
Posamentier, H.W. and Allen, G.P., 1999. Siliciclastic sequence stratigraphy: concepts and
applications (Vol. 7). Tulsa: SEPM (Society for Sedimentary Geology).
Posamentier, H.W., Jervey, M.T., Vail, P.R., 1988, eustatic controls on clastic deposition. I.
Conceptual framework. In: Wilgus, C.K., Hastings, B.S., Kendall, C.G.St.C., Posamentier, H.W.,
Ross, C.A., Van Wagoner, J.C. (Eds.), Sea Level Changes––An Integrated Approach, vol. 42.
SEPM Special Publication, pp. 110– 124.
Posamentier, A.S. and Krulik, S., 1998. Problem-Solving Strategies for Efficient and Elegant
Solutions: A Resource for the Mathematics Teacher. Corwin Press, 2455 Teller Road, Thousand

53
Oaks, CA 91320.
Posamentier, H.W., Vail, P.R., 1988, eustatic controls on clastic deposition.
II. Sequence and systems tract models. In: Wilgus, C.K., Hastings, B.S., Kendall, C.G.St.C.,
Posamentier, H.W., Ross, C.A., Van Wagoner, J.C., Sea Level Changes––An Integrated Approach,
vol. 42. SEPM Special Publication, pp. 125– 154.
Roeder, D. H., 1973, Subduction and orogeny, J. Geophys. Res., 78(23), 5005–5024
Suneson, Neil H., 2012, Arkoma Basin Petroleum-Past, Present, and Future, p. 38-70.
Sutherland, P.K., 1988, Late Mississippian and Pennsylvanian depositional history in the Arkoma
basin area, Oklahoma and Arkansas: GSA Bulletin, v. 100, p. 1787-1802
Thomas, W.A., 1977, Evolution of Appalachian-Ouachita salient and recesses for reentrants and
promontories in the continental margin. Am. J. Sci.277, 1233-1279
Vail PR, Hardenbol J, Todd RG. 1984. Jurassic unconformities, chronostratigraphy, and sealevel
changes from seismic stratigraphy and biostratigraphy. In Interregional Unconformities and
Hydrocarbon Accumulation, ed. JS Schlee, pp. 129-44. Am. Assoc. Petrol. Geol. Mere. 36. 184
pp.
Valek, E. J., 1999, Sequence Stratigraphy and Depositional Dynamics of the Atoka Formation
(Pennsylvanian) Based on Surface Exposures in the Southern Exposures in the Southern Ozarks,
Northwestern Arkansas, [Master’s Thesis, unpublished] University of Arkansas, Fayetteville, 104
p.
Van Waggoner, et al., 1988, An Overview of the Fundamentals of Sequence Stratigraphy and Key
Definitions, In Sea-level changes: an integrated approach. Society of Economic Paleontologists
and Mineralogists, Special Publication No. 42, p.39-45.
Van Wagoner, J.C., Mitchum, R.M., Campion, K.M. and Rahmanian, V.D., 1990. Siliciclastic
sequence stratigraphy in well logs, cores, and outcrops: concepts for high-resolution correlation of
time and facies.
Zachry, D.L., 1983, Sedimentary framework of the Atoka Formation, Arkoma Basin, Arkansas, in
Houseknecht, D. W., Tectonic-sedimentary evolution of the Arkoma Basin: Society of Economic
Paleontologists and Mineralogists Midcontinent Section Buidebook, v. 1, p. 34-52.

54
Zachry, D.L. and Sutherland, P.K., 1984. Stratigraphy and depositional framework of the Atoka
Formation (Pennsylvanian), Arkoma Basin of Arkansas and Oklahoma. In The Atokan Series
(Pennsylvanian) and its Boundaries—A Symposium. Oklahoma Geol. Surv. Bull (Vol. 136, pp.
9-17).

55
APPENDIX Ⅰ: STRATIGRAPHIC CROSS SECTIONS

56
Fig
ure
31
N-S
str
atig
rap
hic
cro
ss s
ecti
on
A-A
'

57
Fig
ure
32
N-S
str
ati
gra
ph
ic c
ross
secti
on
B-B
'

58
Fig
ure
33
N
-S s
trat
igra
ph
ic c
ross
sec
tio
n C
-C'

59
Fig
ure
34
W-E
str
ati
gra
ph
ic c
ross
secti
on
D-D
'

60
Fig
ure
35
W-E
str
atig
rap
hic
cro
ss s
ecti
on
E-E
’

61
APPENDIX Ⅱ: LIST OF WELLS USED IN CROSS SECTIONS
Operator API Number Well Name
GULF OIL CORP 03033003090000 HARRIS C UNIT
STEPHENS PRDCTN CO 03033104470000 STEWARD GILLIE SMIT
STEPHENS PRDCTN CO 03033100130000 LURA M ADAMS
XTO ENERGY INC 03047112900000 SWIFT OLLIE
SAGELY FLOYD O&G CO 03047110910000 MIESNER
TXO PROD CORP 03047103760000 PHILMON
STEPHENS PRDCTN CO 03033103350000 HATCHETT LINDSEY
STEPHENS PRDCTN CO 03033105430000 DENT VIVIAN
DIAMOND SHMROCK CORP03131100140000 HATFIELD
GETTY OIL COMPANY 03131102620000 USA
STEPHENS PRDCTN CO 03131100050000 W H LEWIS
BUTTONWOOD PET INC 03047110040000 FISHER CARTY
STEPHENS PRDCTN CO 03047107720000 SNODGRASS J S
ARK LA GAS CO ET AL 03047600310000 ARK VALLEY TR CO
ARKOMA PROD OF CA 03047104260000 POSEY
STEPHENS PRDCTN CO 03047106580000 PETTIGREW RUTH
STEPHENS PRDCTN CO 03047101010000 MYRTLE ROSS

62
STEPHENS PRDCTN CO 03047113380000 MEEK ESTATE
SAGELY FLOYD O&G CO 03047110910000 MIESNER
SEDNA ENERGY INC 03047112780000 BOLLINGER
TERRA RESOURCES INC 03047104900000 WAGGONER
SEECO INCORPORATED 03047101200000 POWELL
STEPHENS PRDCTN CO 03047109990000 ROBINSON SAM
HANNA OIL & GAS CO 03047104330000 LOG CABIN
REVERE CORP 03047104050000 PRICE
SEECO INCORPORATED 03047106720000 CITIZENS BANK OF LA
STEPHENS PRDCTN CO 03047103000000 LONG JULIA
IAMOND SHMROCK CORP 03131100140000 HATFIELD
STEPHENS PRDCTN CO 03131107680000 THOMAS WAYNE
TXO PROD CORP 03047104820000 MOORE "U"
ARKOMA PROD OF CA 03047104990000 THOMPSON
ARKANSAS WESTERN GAS03047300130000 REYNOLDS
OXLEY PETROLEUM CO 03047100860000 PRICE
WILLIFORD ENERGY CO 03033101840000 NEAL
GULF OIL CORP 03033300240000 WHITLOCK
ARKOMA PROD OF CA 03033101950000 CRAIN ERP

63
SEECO INCORPORATED 03033104210000 ALEXANDER
STEPHENS PRDCTN CO 03047102830000 RAS FISHER ESTATE
SEAGULL MID-STH INC 03047108210000 ALSTON
STEPHENS PRDCTN CO 03131100050000 W H LEWIS
TERRY ENERGY INC 03047106370000 FORT CHAFFEE
TERRA RESOURCES INC 03047104900000 WAGGONER
TXO PROD CORP 03047103760000 PHILMON