Embed Size (px)
Citation preview
For permission to copy, contact [email protected]© 2011 Geological Society of America
Stratigraphic record of basin development within the San Andreas fault system:
Late Cenozoic Fish Creek–Vallecito basin, southern California
Rebecca J. Dorsey1†, Bernard A. Housen2, Susanne U. Janecke3, C. Mark Fanning4, and Amy L.F. Spears2
1Department of Geological Sciences, 1272 University of Oregon, Eugene, Oregon 97403-1272, USA2Department of Geology (ES 236), Western Washington University, 516 High Street, Bellingham, Washington 98225-9080, USA3Department of Geology, Utah State University, 4505 Old Main Hill, Logan, Utah 84322-4505, USA4Research School of Earth Sciences, Australian National University, Building 61, Mills Road, Canberra, ACT 0200, Australia
771
GSA Bulletin; May/June 2011; v. 123; no. 5/6; p. 771–793; doi: 10.1130/B30168.1; 14 fi gures; 1 table; Data Repository item 2010211.
†E-mail: [email protected]
ABSTRACT
The Fish Creek–Vallecito basin contains a 5.5-km-thick section of late Miocene to early Pleistocene sedimentary rocks exposed in the hanging wall of the West Salton detachment fault. These deposits preserve a high-fi delity record of late Cenozoic subsidence and basin fi lling that resulted from deformation in the San Andreas fault system of southern Cali-fornia. Existing and new paleomagnetic data, combined with new U-Pb zircon ages of two tuffs high in the section, show that the section ranges in age from ca. 8.0 ± 0.4 Ma at the base to ca. 0.95 Ma at the top. Geohistory analysis reveals: (1) moderate subsidence (0.46 mm/yr) from ca. 8.0 to 4.5 Ma; (2) rapid subsidence (2.1 mm/yr) from 4.5 to 3.1 Ma; (3) moder-ate subsidence (0.40 mm/yr) from 3.1 to 0.95 Ma; and (4) rapid uplift and erosion that has exhumed the section since ca. 1 Ma. Onset of sedimentation at ca. 8.0 ± 0.4 Ma records earliest extension or transtension in the area, possibly related to localization of the Pacifi c–North America plate boundary in the Salton Trough and Gulf of California. Alternatively, marine incursion at 6.3 Ma may be the earliest record of plate-boundary deformation in the Gulf of California–Salton Trough region. A thick interval higher in the section records progradation of the Colorado River delta into and across the basin starting ca. 4.9 Ma. Progradation continued during an abrupt increase in subsidence rate at 4.5 Ma, and fl uvial-deltaic conditions persisted for 1.4 m.y. during the rapid-subsidence phase, indicating that delta progradation was driven by a large increase in rate of sediment input
from the Colorado River. Uplift and inversion of the basin starting ca. 1.0 Ma record initia-tion of strike-slip faults that defi ne the mod-ern phase of dextral wrench tectonics in the western Salton Trough.
INTRODUCTION
Sedimentary basins that form adjacent to transform faults offer unique insights into regional isostasy, strain partitioning, fault displacements, and kinematic evolution of strike-slip fault zones (e.g., Mann et al., 1983; Christie-Blick and Biddle, 1985; May et al., 1993; Crowell, 2003; Mann, 2007; Seeber et al., 2010). Stratigraphic studies allow us to track the initiation and development of continental transforms because motion on strike-slip faults typically produces local- to regional-scale crustal subsidence that leads to accumulation and preservation of sedimentary deposits. The Salton Trough in southern Cali-fornia is a large, late Cenozoic transform basin at the northwest end of the Gulf of California (Fig. 1) that has subsided and fi lled in response to changes in crustal thickness, sediment input, and deformation associated with development of the San Andreas fault. While it is well known that transtensional deformation resulted in deep subsidence and basin fi lling during Miocene to Pleistocene time (Dibblee, 1954, 1984; John-son et al., 1983; Winker, 1987; Herzig et al., 1988; Winker and Kidwell, 1996), the timing of basin initiation, changes in subsidence rate, and relation to the kinematic evolution of the Pacifi c–North America plate boundary are in-completely understood.
A thick stratigraphic record is exposed in the western Salton Trough, where dextral wrench deformation has resulted in rapid up-
lift and erosion of late Cenozoic deposits since ca. 1.1–1.3 Ma (Figs. 1 and 2; Steely et al., 2009; Janecke et al., 2010). These sedimentary rocks contain a rich record of basin subsidence, sediment accumulation, delta progradation, and changing patterns of crustal deforma-tion since late Miocene time. During much of the basin’s history, regional strain and crustal subsidence were accommodated by combined slip on the low-angle West Salton detachment fault in the west and the San Andreas transform fault on the northeast side of the basin (Axen and Fletcher, 1998). Despite this general un-derstanding, the age of the West Salton de-tachment fault is poorly known; it could have initiated as early as ca. 12 Ma (Shirvell et al., 2009) or as late as earliest Pliocene (Steely, 2006). Moreover, the timing of initiation of the San Andreas fault system in the Salton Trough and Gulf of California region is uncertain, with estimates ranging from 12 to 17 Ma (e.g., Pow-ell and Weldon, 1992; Matti and Morton, 1993; Gans, 1997; Fletcher et al., 2007) to ca. 6 Ma (e.g., Stock and Hodges, 1989; Nicholson et al., 1994; Ingersoll and Rumelhart, 1999; Atwater and Stock, 1998; Oskin and Stock, 2003b). Lack of consensus on these questions currently obscures our understanding of the kinematic evolution of the Pacifi c–North America plate boundary through time.
In addition to regional deformation, volumi-nous input of sediment from the Colorado River has exerted a major infl uence on late Cenozoic paleogeography and crustal evolution in the Salton Trough and northern Gulf of Califor-nia. Colorado River sediment is rapidly buried and metamorphosed in active basins, where it is mixed with mantle-derived intrusions and converted to young metamorphic rock (Muf-fl er and White, 1969; Fuis et al., 1984; Elders
on March 29, 2011gsabulletin.gsapubs.orgDownloaded from
Dorsey et al.
772 Geological Society of America Bulletin, May/June 2011
and Sass, 1988; Schmitt and Vazquez, 2006). The volume of sediment in the basins is roughly equal to material eroded from the Colorado Pla-teau in the past 5–6 m.y., and it contributes to crustal growth along the plate boundary at rates similar to those documented for subduction-related magmatic arcs and seafl oor spreading centers (Dorsey, 2010). Although input of sedi-ment clearly affects thermal structure, crustal rheology, and deformation style in this setting (Persaud et al., 2003; González-Fernández et al., 2005; Lizarralde et al., 2007; Bialas and Buck, 2009; Dorsey and Umhoefer, 2010), little is known about the interplay between crustal subsidence and Pliocene progradation of the
Colorado River delta into and across the Salton Trough basin.
This paper presents the results of an integrated fi eld, stratigraphic, paleomagnetic, and geohis-tory analysis of the Fish Creek–Vallecito basin in the western Salton Trough (Fig. 1). Previous studies have provided insights into the age, li-thology, depositional environments, and subsi-dence history, while also leaving some problems unresolved. Magnetostratigraphic studies (Op-dyke et al., 1977; Johnson et al., 1983) started ~1000 m above the base of the section, thus omitting the fi rst ~3.2 m.y. (~45%) of the basin history. Winker (1987) analyzed geologic struc-tures, depositional environments, paleocurrents,
and basin architecture, but relied on existing age controls to interpret the basin history and did not recognize the signifi cant role of the basin-bounding West Salton detachment fault. In this study, we use new detailed geologic mapping, section measuring, and paleomagnetic analyses to document a continuous section that passes through an area of newly recognized structural complexity, thus permitting quantitative geohis-tory analysis of the entire 5.5-km-thick basinal succession. When integrated with prior studies, the new data allow us to test hypotheses for the timing of plate-boundary–related crustal defor-mation and dynamic controls on progradation of the Colorado River delta.
SJFZ
EF
WSDF
IF
ABF
E
?
117˚W 116˚W 115˚W 114˚WS
SP
MF
U.S.A.Mexico
CD
D
SD
CPF
Gila R.
Y
LSF
SAF
Fig. 2
E
31˚N
32˚N
33˚N
34˚N
35˚N
113˚W118˚W119˚W
E C S Z
LA
PacificOcean
Color
a do
R
iver
100 km0 50
Salton Trough
T
Gulfof California
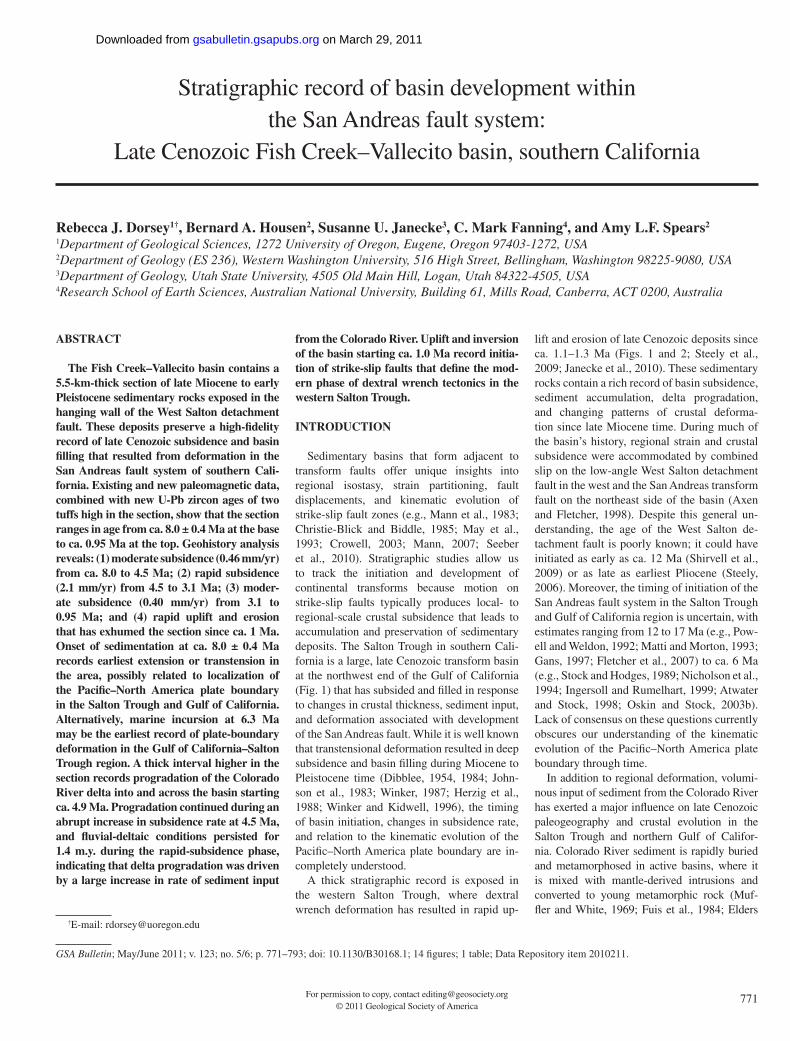
Figure 1. Regional map of topography and main faults of the San Andreas fault system in the southwestern United States and northwestern Mexico. The Salton Trough is a large transtensional basin that straddles the Pacifi c–North America plate boundary in southern California. ABF—Agua Blanca fault; CDD—Canada David detachment; CPF—Cerro Prieto fault; E—Ensenada; ECSZ—eastern California shear zone; EF—Elsinore fault; IF—Imperial fault; LA—Los Angeles; LSF—Laguna Salada fault; SAF—San Andreas fault; SD—San Diego; SJFZ—San Jacinto fault zone; SSPMF—Sierra San Pedro Martir fault; T—Tijuana; WSDF—West Salton detachment fault; Y—Yuma.
on March 29, 2011gsabulletin.gsapubs.orgDownloaded from
Late Cenozoic basin development, southern California
Geological Society of America Bulletin, May/June 2011 773
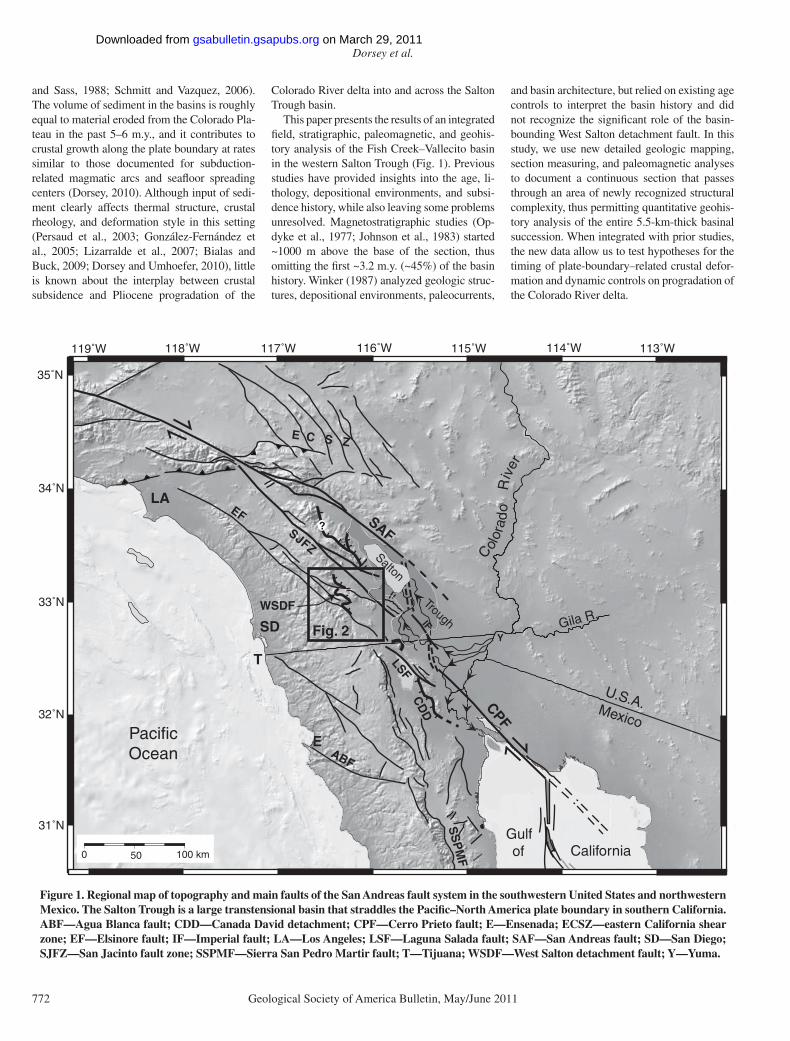
TECTONIC SETTING AND STRATIGRAPHY
Salton Trough Region
The Fish Creek–Vallecito basin is part of a large, late Cenozoic sedimentary basin that
formed in the hanging wall of the West Salton detachment fault and was bounded on the north-east side of the Salton Trough by the San An-dreas fault (Fig. 1; Dibblee, 1954, 1984; Axen and Fletcher, 1998; Dorsey, 2006). Regional extension, transtension, and crustal subsidence led to late Miocene deposition of coarse clastic
alluvial deposits and overlying marine turbi-dites, followed by Pliocene to early Pleistocene subsidence and fi lling of the Salton Trough ba-sin with marine and nonmarine deposits (Dib-blee, 1954, 1984; Woodard, 1963, 1974; Kerr, 1982; Winker, 1987; Kerr and Kidwell, 1991; Dibblee, 1996; Winker and Kidwell, 1996;
FFFFFEEEEE
Qalal
GGGGPPPP
b
PdPd
Pdggg
PdgPdgPdg
PdPd
PdPdPooooPoPoooPPPoPP
CarriCarriCarrrrrizozozzozMtnMtnMtnM
4040
455
3030
20200
PtP
777
1212122
11000777
10
131313
lMMPPP
C i
15
PdPdPdgPdPP
Qm
Qm6
23
224422
26
25
31
25
2424444
3324
25 25
27
28
23
30
19
EF
SFF
CCF
FCMF
FCMF
0 5 10 km
YR
PR
2
4
WPWPWPWPPWPWP
QalQal
QalQa
QtQt railroad
QPcQPcQPc
PoPo
QPh
QalQaQalQal
QalQaQaQa
QPcQPcQPc
Qal
PdgPdgPdgd
QalQ
QalQ
MsMsMsss
Ms
QPhQPhQPhQPhPhPhh
PdPd
Carrizo Ck.
SS22
east
mesa
QtQtsoutsouth
mesmesaa
PdPdgPdg
MMMMMGGGGGGGGMMMMMMMMMMMMMMMMMMMMMMMMMGGMGMGMGMGMGMMMMG
Laguna Mts.
Laguna Mts.
Laguna Mts.
PENINSULARPENINSULARRANGESRANGES
PENINSULARRANGES
Inkopa Mts.
Inkopa Mts.
Inkopa Mts.
Jacumba Mts.
Jacumba Mts.
Jacumba Mts.
TBMTBMTBM
FCM
VM
lower platelower platebasementbasementlower platebasement
upper-plate basement
upper-plate basement
upper-plate basement
lower-plate basementlower-plate basementlower-plate basement
Cretaceous and pre-K crystalline rockslower plate upper plate
MioceneMs - SPLIT MT. GROUP
Plio-PleistoceneQPh - Hueso Formation
QPc - Canebrake Congl.
Po - Olla Formation
Pd - A. Diablo Formation
Pdg - Deguynos Fm
Pliocene
PMl - Latrania Fm
Qm - “Mesa” gravels
Pleistocene
EXPLANATION
Pt - Tapiado Formation
QPcQPcQ c
I-88I-8
QalQal
IMPERIALGROUP(marine)
PALMSPRINGGROUP(non-marine)
Pi/p - Pliocene Imperial andPalm Spring Groups (undiff.)
Pi/p
Pwb - West Butte Conglom.
Northern Area
PwbPwbb
PwbPwb
Qo - Ocotillo Conglomerate
QoQQoQ
MsMsMsss
MfMff
MfMfM
Mf - Fish Creek Gypsum
117oW 115oW
34o N
32o N
West Salton detachmt. fault(WSDF)
jeep trails
QPcQPcP
N
Car
rizo
Can
yon
Car
rizo
Can
yon
Car
rizo
Can
yon
Vallecito Ck
QPcQPQPcPcQPP
QPcQPcQPcQPcQPcQP
CCarrizoImpact Area
Pacific O
cean
MexicoUSA
SAF
SAF
IF SD
Col
orad
o R
.
EF
SJFZ
0 50
km
RRCRRCRRC
22
lateralfacies change
Line o
f
Tufflocality
SMG
Sxn27
28
–116°30′
33°00′33°00′
–116°30′
32°45′
–116°
–116°
Figure 2. Geologic map of the Fish Creek–Vallecito basin and surrounding area, modifi ed from Winker (1987), Winker and Kidwell (1996), Dibblee (1996), Axen and Fletcher (1998), Kairouz (2005), G. Axen (2008, personal commun.), and Steely (2006). CCF—Coyote Creek fault; FCM—Fish Creek Mountains; FCMF—Fish Creek Mountains fault; GM—Granite Mountain; PR—Pinyon Ridge; RRC—Red Rock Canyon; SFF—San Felipe fault; SMG—Split Mountain Gorge; TBM—Tierra Blanca Mountains; VM—Vallecito Mountains; YR—Yaqui Ridge; WP—Whale Peak.
on March 29, 2011gsabulletin.gsapubs.orgDownloaded from
Dorsey et al.
774 Geological Society of America Bulletin, May/June 2011
Axen and Fletcher, 1998; Dorsey et al., 2007; McDougall, 2008). Colorado River sediment constructed a large delta that prograded into marine water and fi lled the basin at the north end of the Gulf of California during Pliocene time, when the Fish Creek–Vallecito basin was contiguous with the larger Salton Trough dep-ocenter (Winker and Kidwell, 1986). Sediment derived from local basement uplifts, including the footwall of the West Salton detachment fault, produced coarse arkosic Pliocene- Pleistocene conglomerate and sandstone that interfi nger lat-erally with Colorado River sediment and make up a narrow belt of coarse alluvial facies around the margins of the basin (Winker and Kidwell, 1996; Kairouz, 2005; Steely, 2006; Belgarde, 2007). Dextral offset along the San Andreas fault translated the basin—and all crust southwest of the San Andreas —to the northwest relative to North America during Pliocene-Pleistocene fi ll-ing of the basin.
A major tectonic reorganization at ca. 1.1–1.3 Ma terminated slip on the West Salton de-tachment fault along most of its length and initiated the modern San Jacinto, San Felipe, and Elsinore strike-slip faults (Figs. 1 and 2; Matti and Morton, 1993; Kirby, 2005; Lutz, 2005; Lutz et al., 2006; Steely, 2006; Kirby et al., 2007; Steely et al., 2009; Janecke et al., 2010). This event initiated present-day uplift and erosion of the southwestern parts of the former suprade-tachment basin in the western Salton Tough. The end of deposition and onset of uplift in the Fish Creek–Vallecito basin was part of this reorgani-zation, and was related to initiation of currently active strike-slip faults at ca. 1 Ma (Johnson et al., 1983; Magistrale and Rockwell, 1996).
Fish Creek–Vallecito Basin
Sedimentary rocks of the Fish Creek– Vallecito basin are exposed in a thick SW- dipping section that ranges in age from Miocene to early Pleisto-cene (Figs. 2 and 3; Woodard, 1963, 1974; Op-dyke et al., 1977; Johnson et al., 1983; Winker, 1987; Dibblee, 1996; Winker and Kidwell, 1996; Dorsey et al., 2007). Johnson et al. (1983) constructed a subsidence curve for this section using map-based estimates of present-day thick-nesses and ages determined from paleomagnetic study. They implied that the base of the Impe-rial Formation is 4.3 Ma, but the base of their dated section is in the Mud Hills member of the Deguynos Formation, well above the base of the Imperial Group. Johnson et al. (1983) concluded that the basin underwent a gradual exponential decrease in subsidence rate, from 5.5 mm/yr to <0.5 mm/yr during the period 4.3–0.9 Ma. They attributed basin subsidence to continental rifting and crustal thinning and, by comparison to ocean
basins, implied a thermal control on the expo-nential form of the subsidence curve.
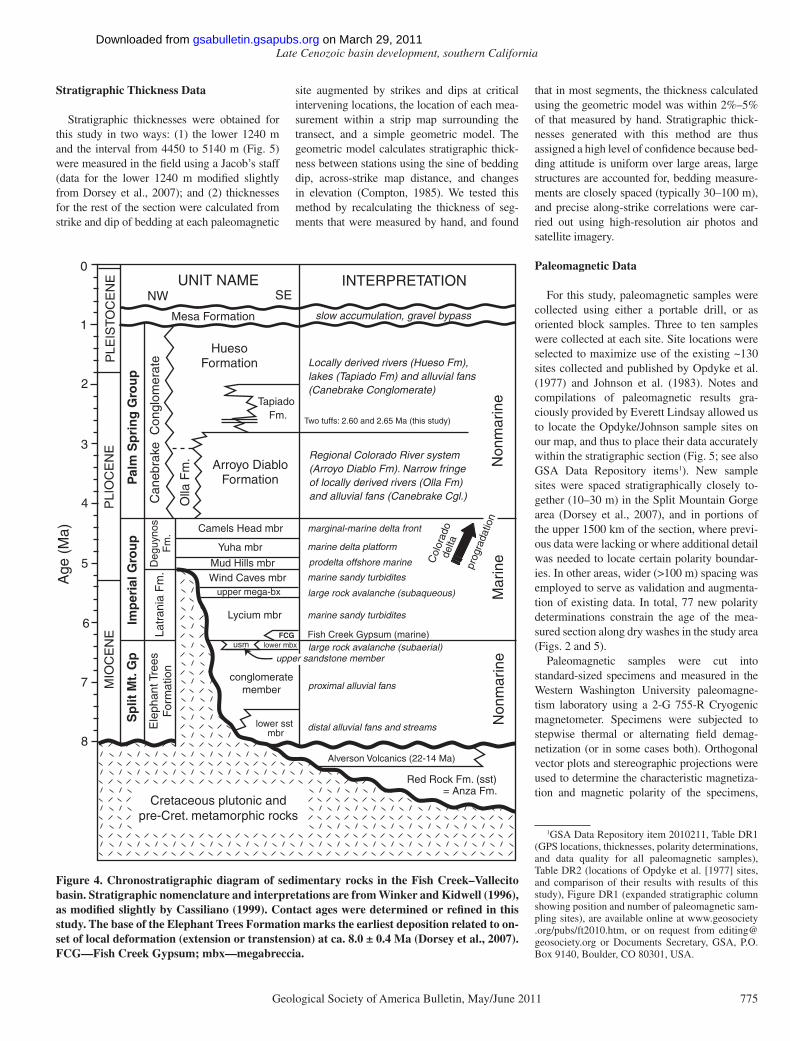
Building on prior work of Woodard (1963), Winker and Kidwell (1996) elevated the forma-tions of the Fish Creek–Vallecito basin to three groups: (1) the Miocene, nonmarine Split Moun-tain Group; (2) Lower Pliocene, marine Imperial Group; and (3) Pliocene-Pleistocene, nonmarine Palm Spring Group (Fig. 4). The oldest deposits predate strong extension and include nonmarine sandstone of the Red Rock Formation (exposed in Red Rock Canyon; Fig. 2) and overlying ba-saltic andesite of the 22–14 Ma Alverson vol-canics (Ruisaard, 1979; Kerr, 1982; Winker and Kidwell, 1996). The base of the Elephant Trees Formation, and thus the onset of structur-ally controlled basin formation at Split Moun-tain Gorge, was dated at ca. 8.1 ± 0.4 Ma by Dorsey et al. (2007). This revised previous age estimates for the lower sandstone member of the Elephant Trees Formation, which had been correlated to the much older Red Rock Forma-tion (Anza Formation of Woodard, 1963) in the western Fish Creek Mountains (Kerr, 1982; Kerr and Kidwell, 1991; Winker, 1987; Winker and Kidwell, 1996).
The Fish Creek–Vallecito basin is bounded on its NW and SW margin by the curviplanar, low-angle West Salton detachment fault, and on the SW by the strike-slip Elsinore fault zone (Fig. 2; Axen and Fletcher, 1998). In addition
to Pliocene-Pleistocene slip on the detachment fault, the basin margin was active in middle to late Quaternary time, based on the presence of NW- and NE-trending fault scarps and faulted alluvial fans at the steep range front of the Tierra Blanca Mountains and around Whale Peak (Pinault, 1984; Magistrale and Rockwell, 1996; Todd, 2004; Kairouz, 2005). The faulted range front of the Tierra Blanca Mountains contains older strands of the detachment that are crosscut by younger strands of the active Elsinore fault zone (Dorsey and Axen, 2009).
METHODS
Geologic and Structural Mapping
We carried out detailed geologic and struc-tural fi eld mapping at scales of 1:10,000 to 1:24,000, integrated with analysis of air photos and high-resolution satellite imagery, to locate stratigraphic contacts and document major structures that must be identifi ed in order to ac-curately reconstruct the section. Mapping and fault analysis are especially important in areas of structural complexity, where faults may offset the section and duplicate or cut out stratigraphic intervals. Through this work, we have identifi ed the major structures that cross the section, thus providing a high degree of confi dence in the thicknesses and ages of the section.
Elephant Trees Congl.
Elephant Trees Congl.
Elephant Trees Congl.
Fish Creek GypsumFish Creek GypsumFish Creek Gypsum Split Mtn. GorgeSplit Mtn. GorgeSplit Mtn. Gorge
Peninsular Ranges
TBMTBMTBM
Imperial GroupImperial GroupImperial Group
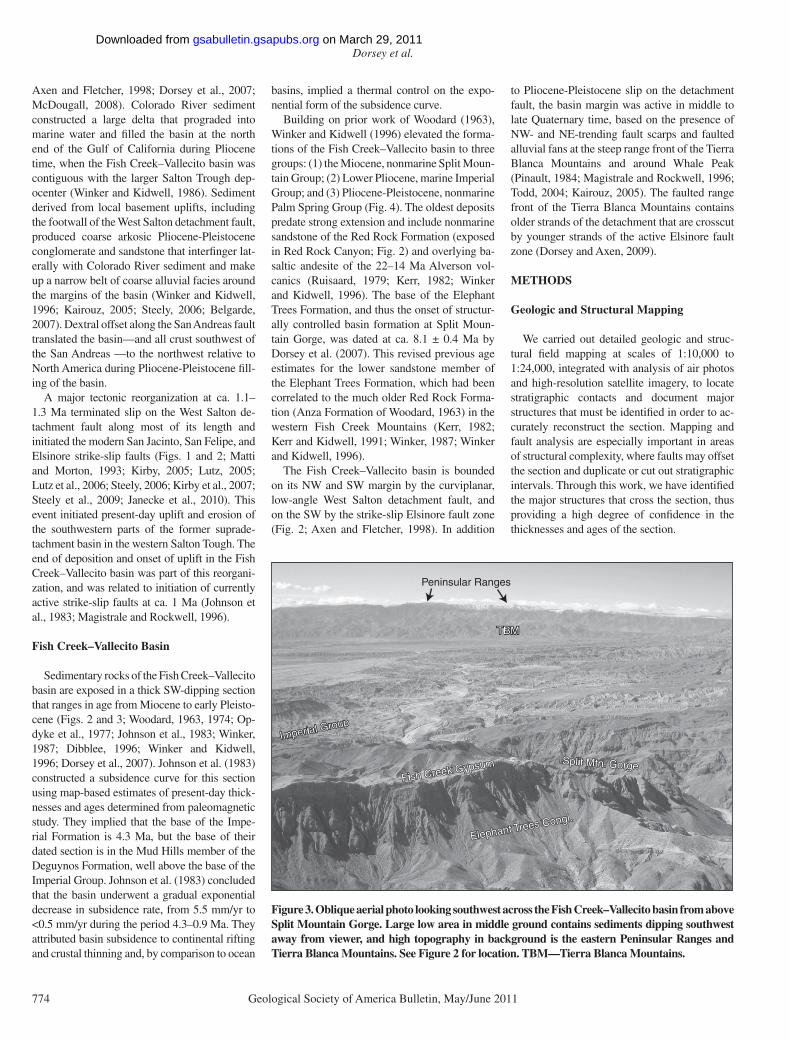
Figure 3. Oblique aerial photo looking southwest across the Fish Creek–Vallecito basin from above Split Mountain Gorge. Large low area in middle ground contains sediments dipping southwest away from viewer, and high topography in background is the eastern Peninsular Ranges and Tierra Blanca Mountains. See Figure 2 for location. TBM—Tierra Blanca Mountains.
on March 29, 2011gsabulletin.gsapubs.orgDownloaded from
Late Cenozoic basin development, southern California
Geological Society of America Bulletin, May/June 2011 775
Stratigraphic Thickness Data
Stratigraphic thicknesses were obtained for this study in two ways: (1) the lower 1240 m and the interval from 4450 to 5140 m (Fig. 5) were measured in the fi eld using a Jacob’s staff (data for the lower 1240 m modifi ed slightly from Dorsey et al., 2007); and (2) thicknesses for the rest of the section were calculated from strike and dip of bedding at each paleomagnetic
site augmented by strikes and dips at critical intervening locations, the location of each mea-surement within a strip map surrounding the transect, and a simple geometric model. The geometric model calculates stratigraphic thick-ness between stations using the sine of bedding dip, across-strike map distance, and changes in elevation (Compton, 1985). We tested this method by recalculating the thickness of seg-ments that were measured by hand, and found
8
6
4
2
1
HuesoFormation
Sp
lit M
t. G
pIm
per
ial G
rou
pP
alm
Sp
rin
g G
rou
p
7
5
3
0
Age
(M
a)
Alverson Volcanics (22-14 Ma)
Red Rock Fm. (sst) = Anza Fm.
Cretaceous plutonic andpre-Cret. metamorphic rocks
Ele
phan
t Tre
esF
orm
atio
nD
eguy
nos
Fm
.La
tran
ia F
m.
MIO
CE
NE
PLI
OC
EN
EP
LEIS
TOC
EN
E
Tapiado Fm.
Can
ebra
ke C
ongl
omer
ate
Olla
Fm
. Arroyo DiabloFormation
lower mbx
upper mega-bxWind Caves mbr
Lycium mbr
conglomeratemember
lower sst mbr
Mud Hills mbr
Yuha mbr
Camels Head mbr
Locally derived rivers (Hueso Fm),lakes (Tapiado Fm) and alluvial fans(Canebrake Conglomerate)
Regional Colorado River system(Arroyo Diablo Fm). Narrow fringe of locally derived rivers (Olla Fm)and alluvial fans (Canebrake Cgl.)
Mar
ineprodelta offshore marine
marine delta platform
marginal-marine delta front
marine sandy turbidites
marine sandy turbidites
large rock avalanche (subaqueous)
large rock avalanche (subaerial)
proximal alluvial fans
distal alluvial fans and streams Non
mar
ine
Non
mar
ine
Col
orad
ode
lta
prog
rada
tion
Mesa Formation slow accumulation, gravel bypass
INTERPRETATIONUNIT NAME
Two tuffs: 2.60 and 2.65 Ma (this study)
FCG Fish Creek Gypsum (marine)usm
upper sandstone member
NW SE
Figure 4. Chronostratigraphic diagram of sedimentary rocks in the Fish Creek–Vallecito basin. Stratigraphic nomenclature and interpretations are from Winker and Kidwell (1996), as modifi ed slightly by Cassiliano (1999). Contact ages were determined or refi ned in this study. The base of the Elephant Trees Formation marks the earliest deposition related to on-set of local deformation (extension or transtension) at ca. 8.0 ± 0.4 Ma (Dorsey et al., 2007). FCG—Fish Creek Gypsum; mbx—megabreccia.
that in most segments, the thickness calculated using the geometric model was within 2%–5% of that measured by hand. Stratigraphic thick-nesses generated with this method are thus assigned a high level of confi dence because bed-ding attitude is uniform over large areas, large structures are accounted for, bedding measure-ments are closely spaced (typically 30–100 m), and precise along-strike correlations were car-ried out using high-resolution air photos and satellite imagery.
Paleomagnetic Data
For this study, paleomagnetic samples were collected using either a portable drill, or as oriented block samples. Three to ten samples were collected at each site. Site locations were selected to maximize use of the existing ~130 sites collected and published by Opdyke et al. (1977) and Johnson et al. (1983). Notes and compilations of paleomagnetic results gra-ciously provided by Everett Lindsay allowed us to locate the Opdyke/Johnson sample sites on our map, and thus to place their data accurately within the stratigraphic section (Fig. 5; see also GSA Data Repository items1). New sample sites were spaced stratigraphically closely to-gether (10–30 m) in the Split Mountain Gorge area (Dorsey et al., 2007), and in portions of the upper 1500 km of the section, where previ-ous data were lacking or where additional detail was needed to locate certain polarity boundar-ies. In other areas, wider (>100 m) spacing was employed to serve as validation and augmenta-tion of existing data. In total, 77 new polarity determinations constrain the age of the mea-sured section along dry washes in the study area (Figs. 2 and 5).
Paleomagnetic samples were cut into standard-sized specimens and measured in the Western Washington University paleomagne-tism laboratory using a 2-G 755-R Cryogenic magnetometer. Specimens were subjected to stepwise thermal or alternating fi eld demag-netization (or in some cases both). Orthogonal vector plots and stereographic projections were used to determine the characteristic magnetiza-tion and magnetic polarity of the specimens,
1GSA Data Repository item 2010211, Table DR1 (GPS locations, thicknesses, polarity determinations, and data quality for all paleomagnetic samples), Table DR2 (locations of Opdyke et al. [1977] sites, and comparison of their results with results of this study), Figure DR1 (expanded stratigraphic column showing position and number of paleomagnetic sam-pling sites), are available online at www.geosociety.org/pubs/ft2010.htm, or on request from [email protected] or Documents Secretary, GSA, P.O. Box 9140, Boulder, CO 80301, USA.
on March 29, 2011gsabulletin.gsapubs.orgDownloaded from
Dorsey et al.
776 Geological Society of America Bulletin, May/June 2011
5.33
Ele
vatio
n (m
)
1200
1000
800
600
400
200
0
2000
1800
1600
1400
2200
3000
2800
2600
2400
3200
4000
3800
3600
3400
4200
5000
4800
4600
4400
5200
5400Jaramillo
Reunion
5500
8
7
6
5
4
3
2
1
Bru
nhes
0.780 Ma
2.582 Ma
Mat
uyam
aG
auss
Gilb
ert
3.596 Ma
Jaramillo
Olduvai
Reunion C2r.1n
Kaena
Mammoth
C3n.1n
C3n.2n
C3n.3n
C3n.4n
C1n
C2n
C2An.1n
C2An.2n
C2An.3n
C3An.1n
C3An.2n
C3Bn
C3Br.1n
C4n.1n
C4n.2n
7.432
Chr
on 4
Sidufjall
Thvera
Nunivak
Cochiti
nodata
PL
IOC
EN
E
GPTS0Age (Ma)
MIO
CE
NE
PL
EIS
TO
CE
NE
?
C2An.1n
C3Br.2n
subaerial sturzstrom
proximal alluvial fan,coarsening-up
distal alluvial fan andbraided stream
DE
GU
YN
OS
FO
RM
ATIO
N
Split Mt.Sturz-strom
Nunivak
5.896.146.27
6.947.09
MIO
CE
NE
PL
IOC
EN
E
PA
LM
S
PR
ING
G
RO
UP
IMP
ER
IAL
G
PS
PL
IT M
T G
PLA
TR
AN
IAE
LEP
H. T
RE
ES
Mud
Hill
s M
brW
.C.
Lyc.
u.m.
low
erm
bx
Yuha
Mbr
Cam
. Hea
dA
RR
OY
O D
IAB
LO F
MO
LLA
F
OR
MAT
ION
HU
ES
O F
MTA
PIA
DO
PL
EIS
T.
1.94
1.79
1.070.99
Age (Ma)
3.03
2.58C
2An
.1n
.2n
Ma
tuy
am
aG
au
ss
Gil
be
rt
ma
gn
eto
ch
ron
C2A
n.3
n
3.60
3.33
3.12
3.21
Lay
er
Ca
ke
Lo
cal
Fa
un
aA
rroy
o
Se
co
L.
F.V
alle
cito
Cre
ek
L.
F.
Co
chit
i
4.30
4.19
C3Bn
C3An.2n
C3An.1n
Thvera
Siduf.
Nun.4.634.49
5.24
5.004.904.80
xline basement rocks
Con
gl. m
br
Old.
2.152.13
Mesa Fm
6.57
marine claystone
marine rhythmites
subaqueous sturzstrommarine turbidites
large debris flow
Sharp base of L-suite ssttuff sample 440 (2.65 +/- 0.05 Ma).
base of Johnson et al. (1983)
shallow-marineColorado Delta
fluvial:Colorado River
fluvial:
shallow lake
fluvial:locally derived
Interpretation:gravel bypass
fanning-dip interval
nodataS
st.
? ?
5.33base of C-suite Sst
tuff sample 441 (2.60 +/- 0.06 Ma).
mixed-composition
on March 29, 2011gsabulletin.gsapubs.orgDownloaded from
Late Cenozoic basin development, southern California
Geological Society of America Bulletin, May/June 2011 777
along with a qualitative assessment of the qual-ity of the polarity determination for each site.
U-Pb Zircon Methods
Zircon grains were separated from total rock samples using standard crushing, washing, heavy-liquid (specifi c gravity 2.96 and 3.3), and paramagnetic procedures. Hand-selected
zircon grains were placed onto double-sided tape, mounted in epoxy together with grains of the Temora reference zircon, sectioned ap-proximately in half, and polished. Refl ected and transmitted light photomicrographs were prepared for all zircons, as were cathodolumi-nescence (CL) scanning electron microscope (SEM) images. The CL images were used to decipher the internal structures of the sectioned grains and to ensure that the ~20 µm sensitive high-resolution ion microprobe (SHRIMP) spot was wholly within a single age component in the sectioned grains.
The U-Th-Pb analyses were made using SHRIMP IIe at Geoscience Australia, Can-berra, Australia, following procedures given in Williams (1998, and references therein). Each analysis consisted of six scans through the mass range, with the Temora reference zircon grains analyzed after every three unknown analyses. The data were reduced using the SQUID Ex-cel macro of Ludwig (2001). The Pb/U ratios were normalized relative to a value of 0.0668
for the FC1 reference zircon, equivalent to an age of 417 Ma (see Black et al., 2003). Uncer-tainty in the Temora U/Pb ratio calibration was 0.39% for the SHRIMP IIe session. Due to the young age of the zircon grains, the U-Pb data need to be corrected for 230Th disequilibrium that induces a defi cit of 206Pb in Th-poor min-erals such as zircon (Schärer, 1984). This was done using the 232Th/238U measured ratio in the zircon and assuming a Th/U ratio of the magma in equilibrium with the crystallizing zircon. We used a Th/U ratio of 2.25 for the magma based on whole-rock geochemical data in Sarna-Wojcicki et al. (2005) for tuffs that likely have the same source (Long Valley caldera, eastern California) as the two tuffs analyzed in this study. This is similar to the value of 2.2 that was used by Schmitz and Bowring (2001) for the Fish Canyon Tuff.
Uncertainties given for individual analyses (ratios and ages) are at the 1σ level (Table 1). Tera and Wasserburg (1972) concordia plots, proba-bility density plots with stacked histograms, and
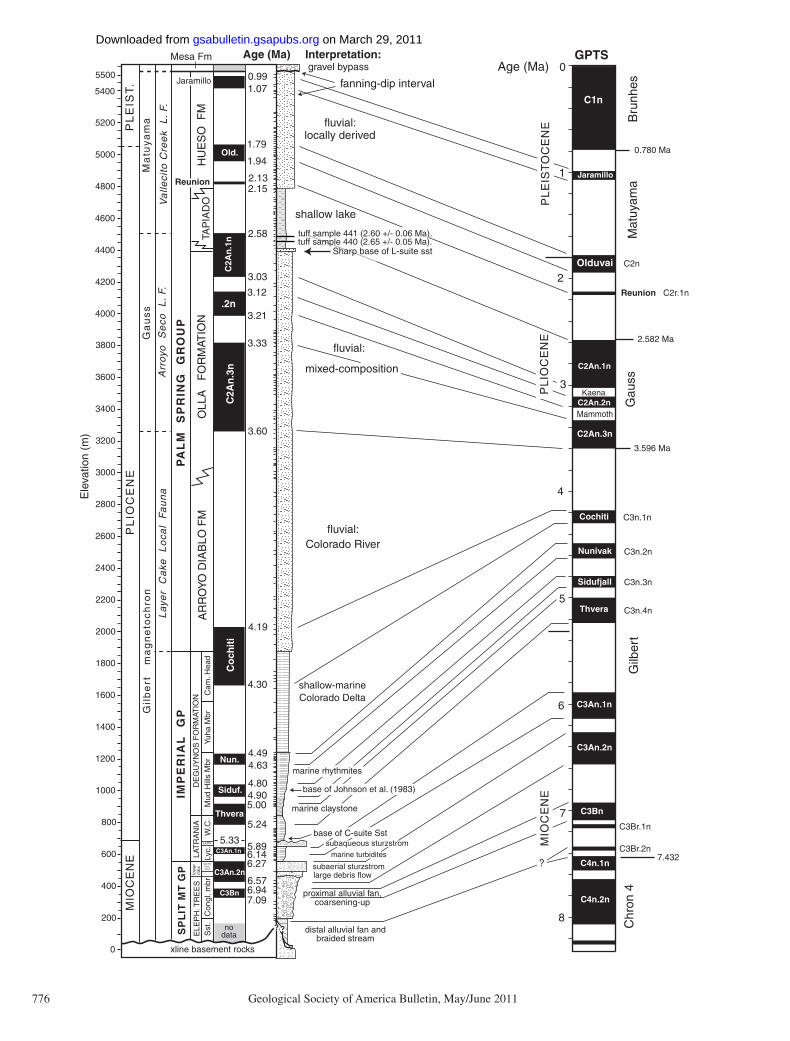
Figure 5. Composite section for the Fish Creek–Vallecito basin showing thicknesses, stratigraphic position of paleomagnetic sample sites, and correlation of reversals to the geomagnetic polarity time scale (GPTS). Tick marks left of lithic log indicate posi-tion of samples collected for paleomagnetic study (see Fig. DR1 and Table DR1 [see text footnote 1]). Stratigraphic nomenclature is from Winker and Kidwell (1996), as modi-fi ed slightly by Cassiliano (1999).
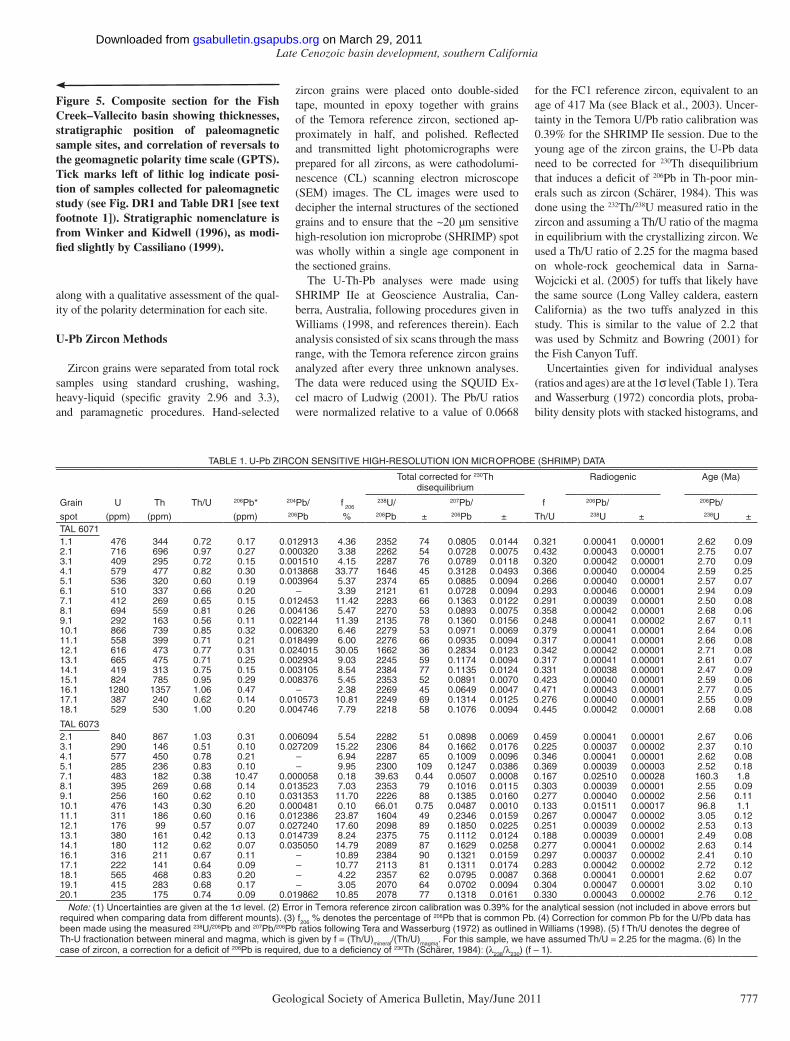
TABLE 1. U-Pb ZIRCON SENSITIVE HIGH-RESOLUTION ION MICROPROBE (SHRIMP) DATA
Total corrected for 230Th disequilibrium
Radiogenic Age (Ma)
Grain U Th Th/U 206Pb* 204Pb/ f 206238U/ 207Pb/ f 206Pb/ 206Pb/
spot (ppm) (ppm) (ppm) 206Pb % 206Pb ± 206Pb ± Th/U 238U ± 238U ±TAL 60711.1 476 344 0.72 0.17 0.012913 4.36 2352 74 0.0805 0.0144 0.321 0.00041 0.00001 2.62 0.092.1 716 696 0.97 0.27 0.000320 3.38 2262 54 0.0728 0.0075 0.432 0.00043 0.00001 2.75 0.073.1 409 295 0.72 0.15 0.001510 4.15 2287 76 0.0789 0.0118 0.320 0.00042 0.00001 2.70 0.094.1 579 477 0.82 0.30 0.013868 33.77 1646 45 0.3128 0.0493 0.366 0.00040 0.00004 2.59 0.255.1 536 320 0.60 0.19 0.003964 5.37 2374 65 0.0885 0.0094 0.266 0.00040 0.00001 2.57 0.076.1 510 337 0.66 0.20 – 3.39 2121 61 0.0728 0.0094 0.293 0.00046 0.00001 2.94 0.097.1 412 269 0.65 0.15 0.012453 11.42 2283 66 0.1363 0.0122 0.291 0.00039 0.00001 2.50 0.088.1 694 559 0.81 0.26 0.004136 5.47 2270 53 0.0893 0.0075 0.358 0.00042 0.00001 2.68 0.069.1 292 163 0.56 0.11 0.022144 11.39 2135 78 0.1360 0.0156 0.248 0.00041 0.00002 2.67 0.1110.1 866 739 0.85 0.32 0.006320 6.46 2279 53 0.0971 0.0069 0.379 0.00041 0.00001 2.64 0.0611.1 558 399 0.71 0.21 0.018499 6.00 2276 66 0.0935 0.0094 0.317 0.00041 0.00001 2.66 0.0812.1 616 473 0.77 0.31 0.024015 30.05 1662 36 0.2834 0.0123 0.342 0.00042 0.00001 2.71 0.0813.1 665 475 0.71 0.25 0.002934 9.03 2245 59 0.1174 0.0094 0.317 0.00041 0.00001 2.61 0.0714.1 419 313 0.75 0.15 0.003105 8.54 2384 77 0.1135 0.0124 0.331 0.00038 0.00001 2.47 0.0915.1 824 785 0.95 0.29 0.008376 5.45 2353 52 0.0891 0.0070 0.423 0.00040 0.00001 2.59 0.0616.1 1280 1357 1.06 0.47 – 2.38 2269 45 0.0649 0.0047 0.471 0.00043 0.00001 2.77 0.0517.1 387 240 0.62 0.14 0.010573 10.81 2249 69 0.1314 0.0125 0.276 0.00040 0.00001 2.55 0.0918.1 529 530 1.00 0.20 0.004746 7.79 2218 58 0.1076 0.0094 0.445 0.00042 0.00001 2.68 0.08
TAL 60732.1 840 867 1.03 0.31 0.006094 5.54 2282 51 0.0898 0.0069 0.459 0.00041 0.00001 2.67 0.063.1 290 146 0.51 0.10 0.027209 15.22 2306 84 0.1662 0.0176 0.225 0.00037 0.00002 2.37 0.104.1 577 450 0.78 0.21 – 6.94 2287 65 0.1009 0.0096 0.346 0.00041 0.00001 2.62 0.085.1 285 236 0.83 0.10 – 9.95 2300 109 0.1247 0.0386 0.369 0.00039 0.00003 2.52 0.187.1 483 182 0.38 10.47 0.000058 0.18 39.63 0.44 0.0507 0.0008 0.167 0.02510 0.00028 160.3 1.88.1 395 269 0.68 0.14 0.013523 7.03 2353 79 0.1016 0.0115 0.303 0.00039 0.00001 2.55 0.099.1 256 160 0.62 0.10 0.031353 11.70 2226 88 0.1385 0.0160 0.277 0.00040 0.00002 2.56 0.1110.1 476 143 0.30 6.20 0.000481 0.10 66.01 0.75 0.0487 0.0010 0.133 0.01511 0.00017 96.8 1.111.1 311 186 0.60 0.16 0.012386 23.87 1604 49 0.2346 0.0159 0.267 0.00047 0.00002 3.05 0.1212.1 176 99 0.57 0.07 0.027240 17.60 2098 89 0.1850 0.0225 0.251 0.00039 0.00002 2.53 0.1313.1 380 161 0.42 0.13 0.014739 8.24 2375 75 0.1112 0.0124 0.188 0.00039 0.00001 2.49 0.0814.1 180 112 0.62 0.07 0.035050 14.79 2089 87 0.1629 0.0258 0.277 0.00041 0.00002 2.63 0.1416.1 316 211 0.67 0.11 – 10.89 2384 90 0.1321 0.0159 0.297 0.00037 0.00002 2.41 0.1017.1 222 141 0.64 0.09 – 10.77 2113 81 0.1311 0.0174 0.283 0.00042 0.00002 2.72 0.1218.1 565 468 0.83 0.20 – 4.22 2357 62 0.0795 0.0087 0.368 0.00041 0.00001 2.62 0.0719.1 415 283 0.68 0.17 – 3.05 2070 64 0.0702 0.0094 0.304 0.00047 0.00001 3.02 0.1020.1 235 175 0.74 0.09 0.019862 10.85 2078 77 0.1318 0.0161 0.330 0.00043 0.00002 2.76 0.12
Note: (1) Uncertainties are given at the 1σ level. (2) Error in Temora reference zircon calibration was 0.39% for the analytical session (not included in above errors but required when comparing data from different mounts). (3) f206 % denotes the percentage of 206Pb that is common Pb. (4) Correction for common Pb for the U/Pb data has been made using the measured 238U/206Pb and 207Pb/206Pb ratios following Tera and Wasserburg (1972) as outlined in Williams (1998). (5) f Th/U denotes the degree of Th-U fractionation between mineral and magma, which is given by f = (Th/U)mineral/(Th/U)magma. For this sample, we have assumed Th/U = 2.25 for the magma. (6) In the case of zircon, a correction for a defi cit of 206Pb is required, due to a defi ciency of 230Th (Schärer, 1984): (λ238/λ230) (f – 1).
on March 29, 2011gsabulletin.gsapubs.orgDownloaded from
Dorsey et al.
778 Geological Society of America Bulletin, May/June 2011
weighted mean 206Pb/238U age calculations were generated using ISOPLOT/EX (Ludwig, 2003). Weighted mean 206Pb/238U ages were calculated, and the uncertainties are reported as 95% confi -dence limits. The decay constants used are those recommended by the International Union of Geological Sciences (IUGS) Subcommission on Geochronology (Steiger and Jäger, 1977).
Decompaction and Backstripping
Accurate reconstruction of long-term basin subsidence requires use of numerical methods that correct for loss of pore space during pro-gressive burial and compaction of sediment. We used the method of Angevine et al. (1990), which is adapted from previous studies (Van Hinte, 1978; Sclater and Christie, 1980; Bond et al., 1983). This approach assumes that poros-ity varies as a function of depth and lithology, and that pore spaces are interconnected (i.e., no overpressured zones). The decompaction algo-rithm employs empirically derived, lithology-dependent, porosity-depth relationships that follow an exponential decrease in porosity with depth (e.g., Sclater and Christie, 1980; Bond et al., 1983). The section was decompacted by calculating the effects of removing successively older units from the top and allowing the section to expand as underlying units are unloaded. Tec-tonic subsidence is defi ned as the component of total subsidence attributed to a tectonic driving force, and is calculated by removing the effect of the sediment load assuming a local (Airy) isostatic response to sediment loading.
For the subsidence analysis, we assumed that stratigraphic thickness—corrected for the ef-fects of compaction and sea level—represents the total depth of the basin through time. Alter-natively, if the section was progressively tilted above the West Salton detachment fault during deposition, the total depth of the basin would be less than the measured stratigraphic thickness. We rule out this possibility based on the overall uniform bedding dips through all but the up-per ~150 m of the section, which indicate that tilting took place after deposition. The analysis also assumes that nonmarine sediments were ac-cumulated close to sea level, as indicated by the present-day distribution of fl uvial environments in the modern Salton Trough (Fig. 1).
Possible Sources of Error
FaultsOffset on faults can juxtapose different parts
of an original stratigraphic section and, if offset strata are incorrectly correlated, can produce er-ror in measurements of stratigraphic thickness. Large unrecognized fault offsets may also result
in omission or duplication of magnetic rever-sals. Through detailed geologic and structural mapping, we have identifi ed and quantifi ed most or all of the large fault offsets in the stud-ied section. Some uncertainty persists in one area where the section crosses the upper Wind Caves and lower Mud Hills Members (Fig. 2), which are cut by a series of incompletely mapped right-lateral and left-lateral strike-slip faults. Some of these faults are potentially large and have latest Quaternary fault scarps, yet were not observed along strike in the measured sec-tion. This introduces potential error to the thick-ness of the upper Wind Caves and lower Mud Hills Members (likely ≤30–50 m), which likely does not alter the main conclusions of this study.
Ages of Magnetic ReversalsAges in this section are based on correlation
of the observed paleomagnetic reversals to the global geomagnetic polarity time scale (GPTS; Cande and Kent, 1995; Lourens et al., 1996; Gradstein et al., 2004). Correct correlation to the GPTS requires independent age controls such as isotopically dated tuffs or biostratigraphic markers, both of which are present in the Fish Creek–Vallecito basin. Even with independent age controls, correlation to the GPTS can be incorrect if unconformities are present but not recognized, if parts of the section are duplicated or omitted by unmapped faults, or if magnetic polarities are misidentifi ed due to incompletely removed modern magnetic overprint.
Thickness and Emplacement of MegabrecciasThe two megabreccias in the upper Split
Mountain Group and lower Imperial Group display considerable lateral variations in thick-ness, which can potentially affect the shape of the subsidence curve. Because previous studies have shown that the megabreccias were em-placed instantaneously (e.g., Kerr and Abbott, 1996; Winker and Kidwell, 1996; Abbott et al., 2002), we assume that they represent little or no time. In both subaerial and subaqueous environ-ments, it is likely that a short-lived hiatus formed on the upper surface of a megabreccia during the time it took for background deposition to ac-cumulate sediment up to that surface. We thus assume that the thickness of a megabreccia rep-resents an amount of time similar to an equiva-lent thickness of background sediment. This is a simplifying assumption that does not account for possible erosion or soft-sediment deforma-tion during emplacement of the megabreccia, or other related complicating factors.
Estimates of PaleobathymetryThe shape of any subsidence curve that in-
cludes marine deposits is dependent on esti-
mates of water depth, which typically are based on fossils preserved in the section (e.g., Van Hinte, 1978; Angevine et al., 1990). Paleo– water depths must be bracketed within a range of possible end members, and the subsidence curve is then bracketed using this range. Esti-mates of paleo–water depth in the marine part of the section are subject to large uncertainties because of two plausible interpretations (mini-mum and maximum water depth) of micropale-ontology data presented by Dorsey et al. (2007).
Paleo-Elevation of Nonmarine DepositionThe geohistory analysis assumes that non-
marine deposits of the Split Mountain and Palm Spring Groups accumulated slightly above sea level. However, it is possible that the Split Mountain Group accumulated in an active basin either above or below sea level, and remained subaerial for a period of time due to the presence of topographic barriers. Based on comparison to the modern Salton Sea, which is ~70 m below sea level, we infer that this uncertainty may in-troduce ~50–100 m of uncertainty in the sub-sidence analysis prior to 6.3 Ma. Similarly, by comparison to elevations in the modern Salton Trough region, we assume that fl uvial and del-taic deposits of the Pliocene Palm Spring Group accumulated at or near sea level, thus introduc-ing a similar error of ±50–100 m. This mag-nitude of error is small compared to the large thickness of the section, and therefore it does not signifi cantly affect the overall shape of the subsidence curve.
RESULTS
Lithostratigraphy
The total thickness of the section is slightly over 5500 m from the base of the Elephant Trees Formation to the unconformable top of the Hueso Formation (Fig. 5; Fig. DR1 [see footnote 1]). We use the stratigraphic nomen-clature of Winker and Kidwell (1996), as modi-fi ed slightly by Cassiliano (1999), in which the Split Mountain, Imperial, and Palm Spring For-mations are elevated to group status, and some members of Winker (1987) are elevated to for-mation status.
Split Mountain and Imperial GroupsThe lower sandstone member of the Elephant
Trees Formation is exposed east of Split Moun-tain Gorge (Fig. 2) in a small paleovalley, where it rests on Cretaceous tonalite and is conform-ably overlain by coarse bouldery conglomerate (Figs. 5 and 6A). There, the lower sandstone member is estimated to be 150–200 m thick based on detailed geologic mapping, eye-height
on March 29, 2011gsabulletin.gsapubs.orgDownloaded from
Late Cenozoic basin development, southern California
Geological Society of America Bulletin, May/June 2011 779
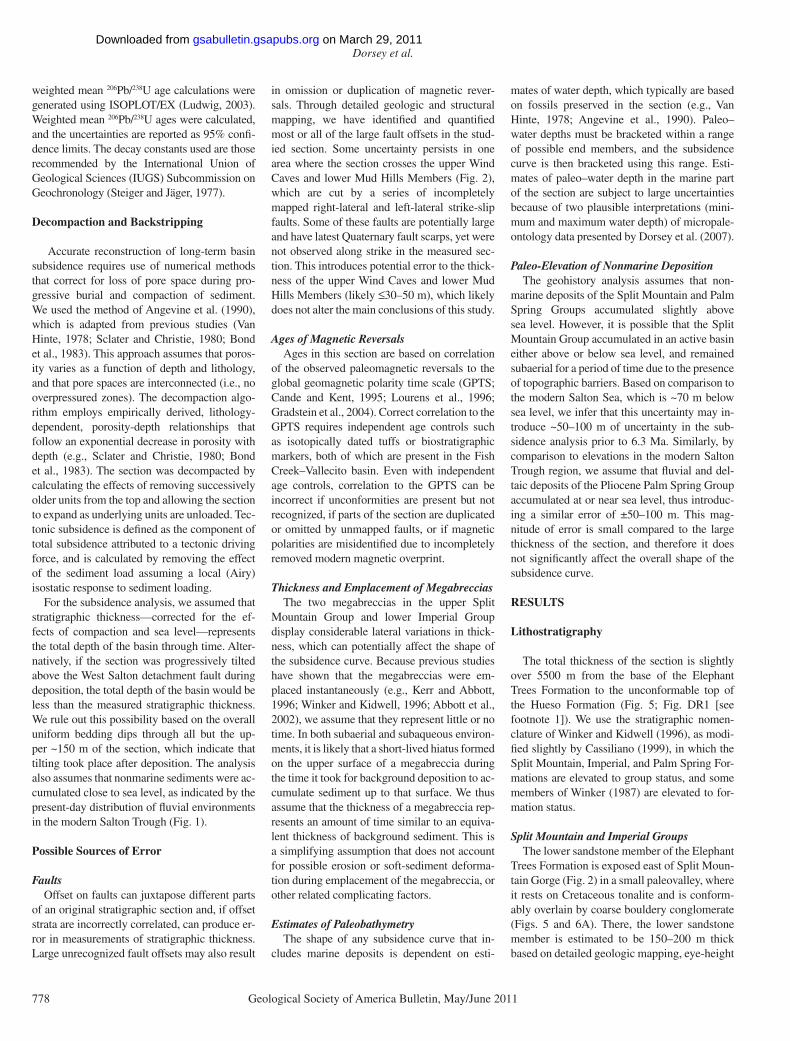
measurements, and visual inspection (Shirvell, 2006; Dorsey et al., 2007; this study). Else-where, the lower sandstone member is thin to absent, onlaps a buttress unconformity, and passes laterally into conglomerate that also rests directly on pre-Cenozoic crystalline rocks (Shirvell, 2006). Red sandstone exposed be-neath conglomerate on the west side of the main
wash in Split Mountain Gorge reveals a pro-gressive unconformity (angular unconformity that passes laterally into a concordant contact), and records local tilting to the southeast during deposition of the upper part of the lower sand-stone member. Thick alluvial-fan conglomerate of the Elephant Trees Formation is capped by the lower megabreccia landslide derived from
AA
B
A
B
Figure 6. Field photos of the Split Mountain Group in the lower part of the section. (A) Coarse bouldery conglomerate of the Elephant Trees Formation records deposition by de-bris fl ows and sheet fl oods in a fault-bounded alluvial fan. (B) Detail of the lower megabreccia.
the nearby Vallecito Mountains (Figs. 5 and 6B; Winker and Kidwell, 1996; Abbott et al., 2002; Shirvell, 2006).
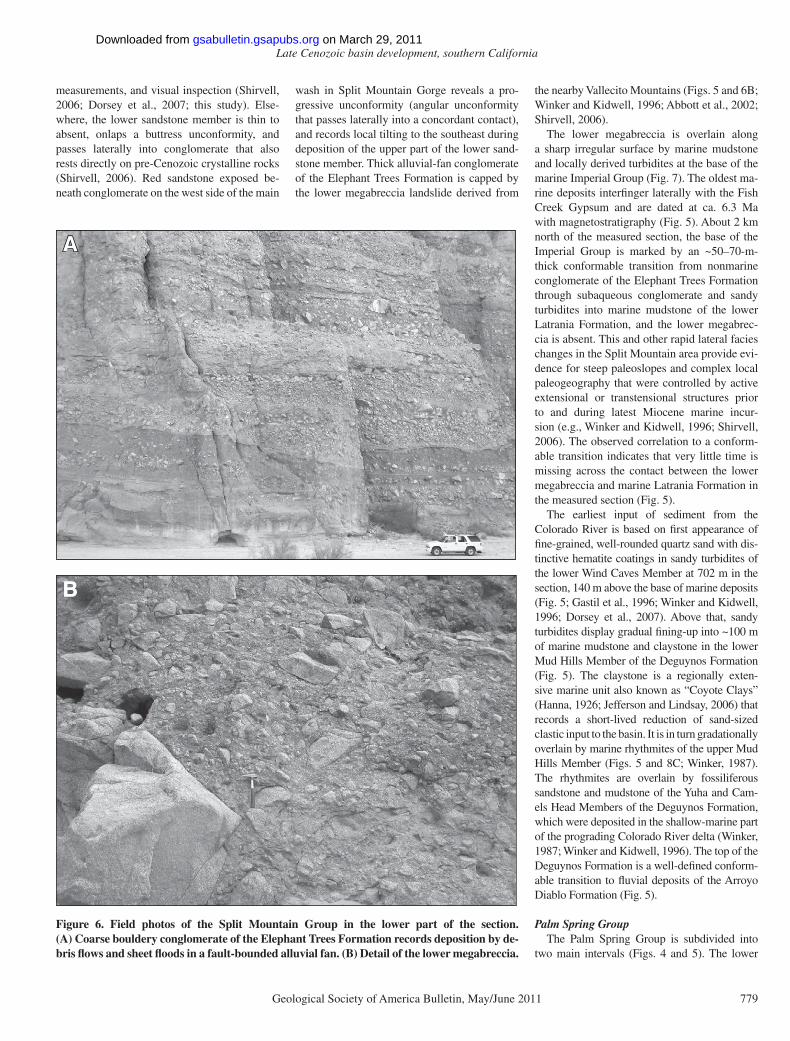
The lower megabreccia is overlain along a sharp irregular surface by marine mudstone and locally derived turbidites at the base of the marine Imperial Group (Fig. 7). The oldest ma-rine deposits interfi nger laterally with the Fish Creek Gypsum and are dated at ca. 6.3 Ma with magnetostratigraphy (Fig. 5). About 2 km north of the measured section, the base of the Imperial Group is marked by an ~50–70-m-thick conformable transition from nonmarine conglomerate of the Elephant Trees Formation through subaqueous conglomerate and sandy turbidites into marine mudstone of the lower Latrania Formation, and the lower megabrec-cia is absent. This and other rapid lateral facies changes in the Split Mountain area provide evi-dence for steep paleoslopes and complex local paleogeography that were controlled by active extensional or transtensional structures prior to and during latest Miocene marine incur-sion (e.g., Winker and Kidwell, 1996; Shirvell, 2006). The observed correlation to a conform-able transition indicates that very little time is missing across the contact between the lower megabreccia and marine Latrania Formation in the measured section (Fig. 5).
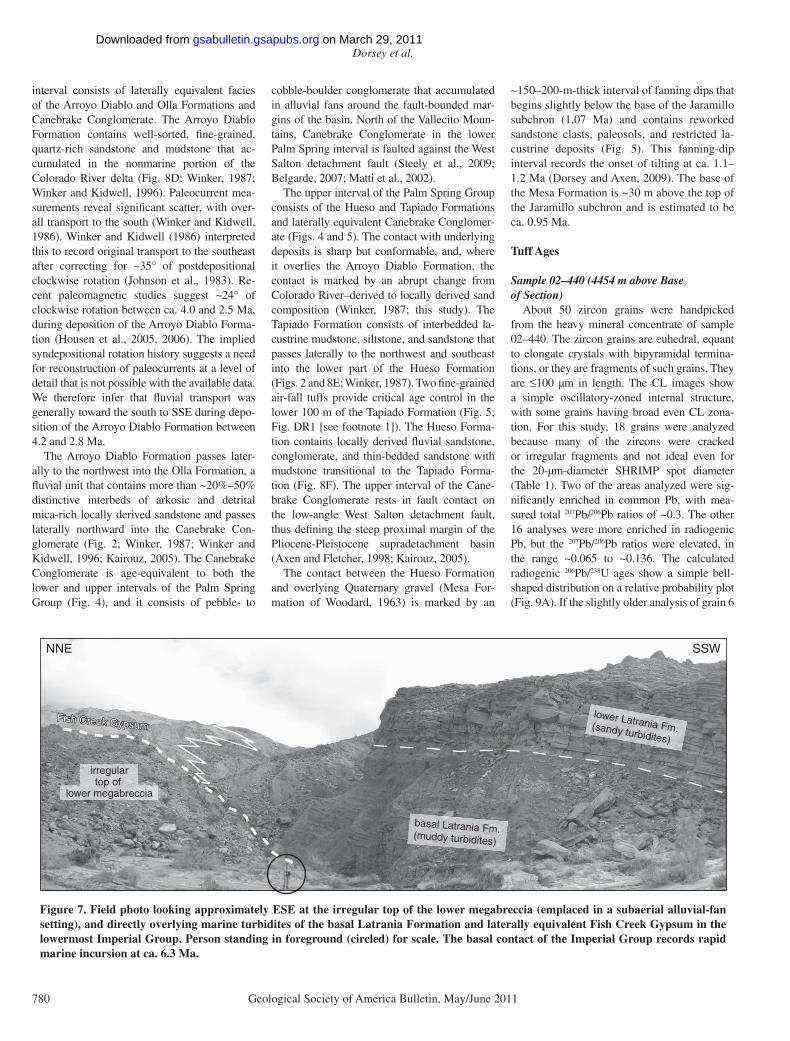
The earliest input of sediment from the Colorado River is based on fi rst appearance of fi ne-grained, well-rounded quartz sand with dis-tinctive hematite coatings in sandy turbidites of the lower Wind Caves Member at 702 m in the section, 140 m above the base of marine deposits (Fig. 5; Gastil et al., 1996; Winker and Kidwell, 1996; Dorsey et al., 2007). Above that, sandy turbidites display gradual fi ning-up into ~100 m of marine mudstone and claystone in the lower Mud Hills Member of the Deguynos Formation (Fig. 5). The claystone is a regionally exten-sive marine unit also known as “Coyote Clays” (Hanna, 1926; Jefferson and Lindsay, 2006) that records a short-lived reduction of sand-sized clastic input to the basin. It is in turn gradationally overlain by marine rhythmites of the upper Mud Hills Member (Figs. 5 and 8C; Winker, 1987). The rhythmites are overlain by fossiliferous sandstone and mudstone of the Yuha and Cam-els Head Members of the Deguynos Formation, which were deposited in the shallow- marine part of the prograding Colorado River delta (Winker, 1987; Winker and Kidwell, 1996). The top of the Deguynos Formation is a well-defi ned conform-able transition to fl uvial deposits of the Arroyo Diablo Formation (Fig. 5).
Palm Spring GroupThe Palm Spring Group is subdivided into
two main intervals (Figs. 4 and 5). The lower
on March 29, 2011gsabulletin.gsapubs.orgDownloaded from
Dorsey et al.
780 Geological Society of America Bulletin, May/June 2011
interval consists of laterally equivalent facies of the Arroyo Diablo and Olla Formations and Canebrake Conglomerate. The Arroyo Diablo Formation contains well-sorted, fi ne-grained, quartz-rich sandstone and mudstone that ac-cumulated in the nonmarine portion of the Colorado River delta (Fig. 8D; Winker, 1987; Winker and Kidwell, 1996). Paleocurrent mea-surements reveal signifi cant scatter, with over-all transport to the south (Winker and Kidwell, 1986). Winker and Kidwell (1986) interpreted this to record original transport to the southeast after correcting for ~35° of postdepositional clockwise rotation (Johnson et al., 1983). Re-cent paleomagnetic studies suggest ~24° of clockwise rotation between ca. 4.0 and 2.5 Ma, during deposition of the Arroyo Diablo Forma-tion (Housen et al., 2005, 2006). The implied syndepositional rotation history suggests a need for reconstruction of paleocurrents at a level of detail that is not possible with the available data. We therefore infer that fl uvial transport was generally toward the south to SSE during depo-sition of the Arroyo Diablo Formation between 4.2 and 2.8 Ma.
The Arroyo Diablo Formation passes later-ally to the northwest into the Olla Formation, a fl uvial unit that contains more than ~20%–50% distinctive interbeds of arkosic and detrital mica-rich locally derived sandstone and passes laterally northward into the Canebrake Con-glomerate (Fig. 2; Winker, 1987; Winker and Kidwell, 1996; Kairouz, 2005). The Canebrake Conglomerate is age-equivalent to both the lower and upper intervals of the Palm Spring Group (Fig. 4), and it consists of pebble- to
cobble-boulder conglomerate that accumulated in alluvial fans around the fault-bounded mar-gins of the basin. North of the Vallecito Moun-tains, Canebrake Conglomerate in the lower Palm Spring interval is faulted against the West Salton detachment fault (Steely et al., 2009; Belgarde, 2007; Matti et al., 2002).
The upper interval of the Palm Spring Group consists of the Hueso and Tapiado Formations and laterally equivalent Canebrake Conglomer-ate (Figs. 4 and 5). The contact with underlying deposits is sharp but conformable, and, where it overlies the Arroyo Diablo Formation, the contact is marked by an abrupt change from Colorado River–derived to locally derived sand composition (Winker, 1987; this study). The Tapiado Formation consists of interbedded la-custrine mudstone, siltstone, and sandstone that passes laterally to the northwest and southeast into the lower part of the Hueso Formation (Figs. 2 and 8E; Winker, 1987). Two fi ne-grained air-fall tuffs provide critical age control in the lower 100 m of the Tapiado Formation (Fig. 5; Fig. DR1 [see footnote 1]). The Hueso Forma-tion contains locally derived fl uvial sandstone, conglomerate, and thin-bedded sandstone with mudstone transitional to the Tapiado Forma-tion (Fig. 8F). The upper interval of the Cane-brake Conglomerate rests in fault contact on the low-angle West Salton detachment fault, thus defi ning the steep proximal margin of the Pliocene-Pleistocene supradetachment basin (Axen and Fletcher, 1998; Kairouz, 2005).
The contact between the Hueso Formation and overlying Quaternary gravel (Mesa For-mation of Woodard, 1963) is marked by an
~150–200-m-thick interval of fanning dips that begins slightly below the base of the Jaramillo subchron (1.07 Ma) and contains reworked sandstone clasts, paleosols, and restricted la-custrine deposits (Fig. 5). This fanning-dip interval records the onset of tilting at ca. 1.1–1.2 Ma (Dorsey and Axen, 2009). The base of the Mesa Formation is ~30 m above the top of the Jaramillo subchron and is estimated to be ca. 0.95 Ma.
Tuff Ages
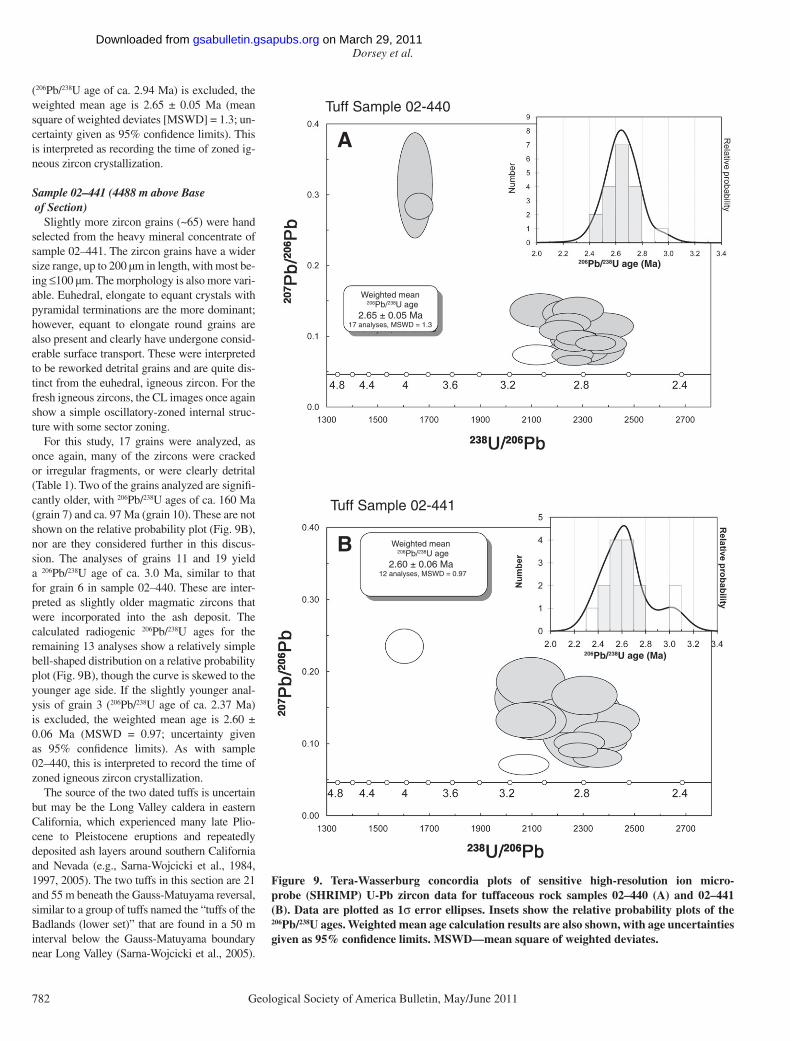
Sample 02–440 (4454 m above Base of Section)
About 50 zircon grains were handpicked from the heavy mineral concentrate of sample 02–440. The zircon grains are euhedral, equant to elongate crystals with bipyramidal termina-tions, or they are fragments of such grains. They are ≤100 µm in length. The CL images show a simple oscillatory-zoned internal structure, with some grains having broad even CL zona-tion. For this study, 18 grains were analyzed because many of the zircons were cracked or irregular fragments and not ideal even for the 20-µm-diameter SHRIMP spot diameter (Table 1). Two of the areas analyzed were sig-nifi cantly enriched in common Pb, with mea-sured total 207Pb/206Pb ratios of ~0.3. The other 16 analyses were more enriched in radiogenic Pb, but the 207Pb/206Pb ratios were elevated, in the range ~0.065 to ~0.136. The calculated radiogenic 206Pb/238U ages show a simple bell-shaped distribution on a relative probability plot (Fig. 9A). If the slightly older analysis of grain 6
Fish Creek GypsumFish Creek GypsumFish Creek Gypsum
irregulartop of
lower megabreccia
basal Latrania Fm.(muddy turbidites)
lower Latrania Fm.(sandy turbidites)
NNE SSW
Figure 7. Field photo looking approximately ESE at the irregular top of the lower megabreccia (emplaced in a subaerial alluvial-fan setting), and directly overlying marine turbidites of the basal Latrania Formation and laterally equivalent Fish Creek Gypsum in the lowermost Imperial Group. Person standing in foreground (circled) for scale. The basal contact of the Imperial Group records rapid marine incursion at ca. 6.3 Ma.
on March 29, 2011gsabulletin.gsapubs.orgDownloaded from
Late Cenozoic basin development, southern California
Geological Society of America Bulletin, May/June 2011 781
BB
D
B
D
FFE
A
C
A
C
Figure 8. (A) Sandy turbidites of the Latrania Formation, showing a typical paleomagnetic sampling site (~590 m in section; Fig. 5). Hammer (circled) is 32.5 cm long. (B) Transition from muddy turbidites of the upper Latrania Formation (foreground) to marine claystone in the lower Mud Hills Member of the Deguynos Formation (middle ground). Ridge in distance is held up by shallow-marine calcarenite and shell beds at the base of the Yuha Member of the Deguynos Formation (Fig. 5). View shows about 400 meters of section. (C) Marine rhythmites of the Mud Hills Member (~1070 m in Fig. 5). Hammer (circled) is 32.5 cm long. (D) Channelized, cross-bedded sandstone and interbedded mudstone of the Arroyo Diablo Formation (Palm Spring Group). (E) Tabular-bedded lacustrine mudstone and sandstone of the Tapiado Formation. (F) Interbedded fl uvial sandstone and mudstone of the Hueso Formation. Resistant sandstone unit in right center of photo is 5.5 m thick.
on March 29, 2011gsabulletin.gsapubs.orgDownloaded from
Dorsey et al.
782 Geological Society of America Bulletin, May/June 2011
(206Pb/238U age of ca. 2.94 Ma) is excluded, the weighted mean age is 2.65 ± 0.05 Ma (mean square of weighted deviates [MSWD] = 1.3; un-certainty given as 95% confi dence limits). This is interpreted as recording the time of zoned ig-neous zircon crystallization.
Sample 02–441 (4488 m above Base of Section)
Slightly more zircon grains (~65) were hand selected from the heavy mineral concentrate of sample 02–441. The zircon grains have a wider size range, up to 200 µm in length, with most be-ing ≤100 µm. The morphology is also more vari-able. Euhedral, elongate to equant crystals with pyramidal terminations are the more dominant; however, equant to elongate round grains are also present and clearly have undergone consid-erable surface transport. These were interpreted to be reworked detrital grains and are quite dis-tinct from the euhedral, igneous zircon. For the fresh igneous zircons, the CL images once again show a simple oscillatory-zoned internal struc-ture with some sector zoning.
For this study, 17 grains were analyzed, as once again, many of the zircons were cracked or irregular fragments, or were clearly detrital (Table 1). Two of the grains analyzed are signifi -cantly older, with 206Pb/238U ages of ca. 160 Ma (grain 7) and ca. 97 Ma (grain 10). These are not shown on the relative probability plot (Fig. 9B), nor are they considered further in this discus-sion. The analyses of grains 11 and 19 yield a 206Pb/238U age of ca. 3.0 Ma, similar to that for grain 6 in sample 02–440. These are inter-preted as slightly older magmatic zircons that were incorporated into the ash deposit. The calculated radiogenic 206Pb/238U ages for the remaining 13 analyses show a relatively simple bell-shaped distribution on a relative probability plot (Fig. 9B), though the curve is skewed to the younger age side. If the slightly younger anal-ysis of grain 3 (206Pb/238U age of ca. 2.37 Ma) is excluded, the weighted mean age is 2.60 ± 0.06 Ma (MSWD = 0.97; uncertainty given as 95% confi dence limits). As with sample 02–440, this is interpreted to record the time of zoned igneous zircon crystallization.
The source of the two dated tuffs is uncertain but may be the Long Valley caldera in eastern California, which experienced many late Plio-cene to Pleistocene eruptions and repeatedly deposited ash layers around southern California and Nevada (e.g., Sarna-Wojcicki et al., 1984, 1997, 2005). The two tuffs in this section are 21 and 55 m beneath the Gauss-Matuyama reversal, similar to a group of tuffs named the “tuffs of the Badlands (lower set)” that are found in a 50 m interval below the Gauss-Matuyama boundary near Long Valley (Sarna-Wojcicki et al., 2005).
A
B
Tuff Sample 02-440
Tuff Sample 02-441
Weighted mean
17 analyses, MSWD = 1.32.65 ± 0.05 Ma
206Pb/238U age
Weighted mean
12 analyses, MSWD = 0.972.60 ± 0.06 Ma
206Pb/238U age
206Pb/238U age (Ma)
206Pb/238U age (Ma)
Figure 9. Tera-Wasserburg concordia plots of sensitive high-resolution ion micro-probe (SHRIMP) U-Pb zircon data for tuffaceous rock samples 02–440 (A) and 02–441 (B). Data are plotted as 1σ error ellipses. Insets show the relative probability plots of the 206Pb/238U ages. Weighted mean age calculation results are also shown, with age uncertainties given as 95% confi dence limits. MSWD—mean square of weighted deviates.
on March 29, 2011gsabulletin.gsapubs.orgDownloaded from
Late Cenozoic basin development, southern California
Geological Society of America Bulletin, May/June 2011 783
Based on their similar stratigraphic position, we speculate that these tuffs may have been pro-duced by the same eruptions at Long Valley.
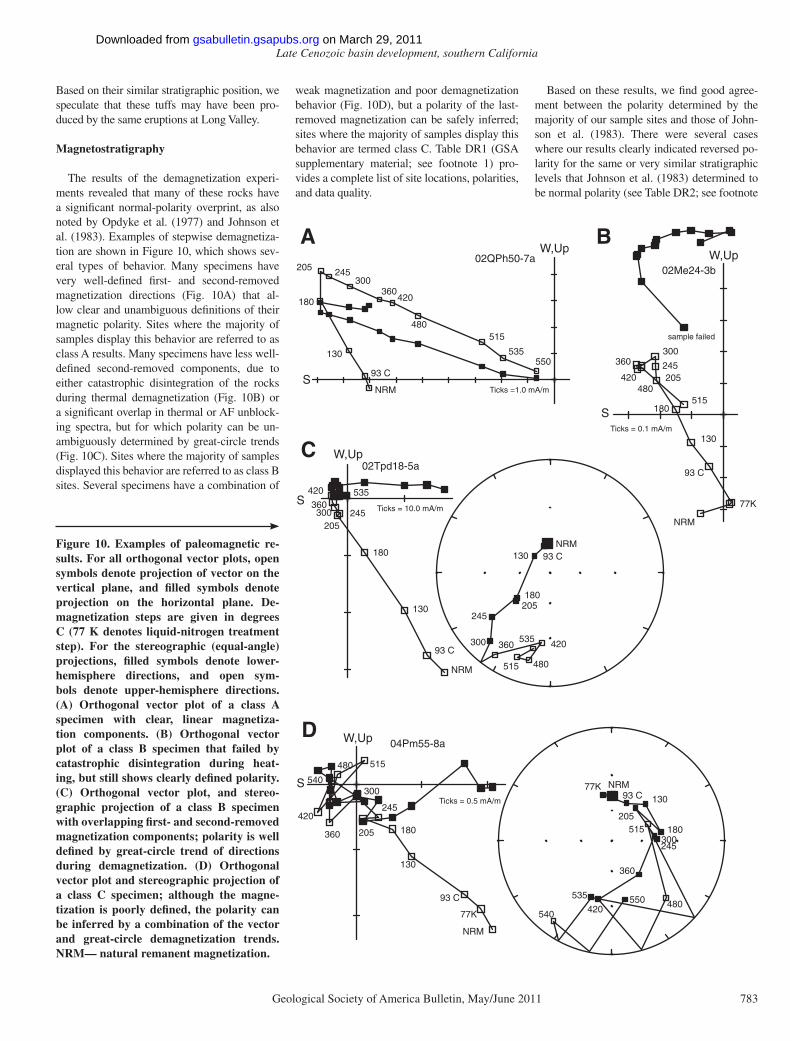
Magnetostratigraphy
The results of the demagnetization experi-ments revealed that many of these rocks have a signifi cant normal-polarity overprint, as also noted by Opdyke et al. (1977) and Johnson et al. (1983). Examples of stepwise demagnetiza-tion are shown in Figure 10, which shows sev-eral types of behavior. Many specimens have very well-defi ned fi rst- and second-removed magnetization directions (Fig. 10A) that al-low clear and unambiguous defi nitions of their magnetic polarity. Sites where the majority of samples display this behavior are referred to as class A results. Many specimens have less well-defi ned second-removed components, due to either catastrophic disintegration of the rocks during thermal demagnetization (Fig. 10B) or a signifi cant overlap in thermal or AF unblock-ing spectra, but for which polarity can be un-ambiguously determined by great-circle trends (Fig. 10C). Sites where the majority of samples displayed this behavior are referred to as class B sites. Several specimens have a combination of
02QPh50-7aW,Up
S
535550
NRM
93 C
130
180
205 245300
360420
480515
Ticks =1.0 mA/m
A
NRM
77K
93 C
130
180
205245
300360
420480
515
W,Up02Me24-3b
STicks = 0.1 mA/m
B
sample failed
02Tpd18-5aC
Ticks = 10.0 mA/m
NRM
93 C
130
180
205245300
360
420 535
NRM93 C130
180205
245
300 360 420
515 480
535
W,Up
S
04Pm55-8a
Ticks = 0.5 mA/m
D W,Up
S
NRM
93 C
130
180205
245
300
360
420
515
480540
550
NRM93 C 130
180205
245300
360
420
515
480
535
540
77K
77K
Figure 10. Examples of paleomagnetic re-sults. For all orthogonal vector plots, open symbols denote projection of vector on the vertical plane, and fi lled symbols denote projection on the horizontal plane. De-magnetization steps are given in degrees C (77 K denotes liquid-nitrogen treatment step). For the stereographic (equal-angle) projections, fi lled symbols denote lower-hemisphere directions, and open sym-bols denote upper-hemisphere directions. (A) Orthogonal vector plot of a class A specimen with clear, linear magnetiza-tion components. (B) Orthogonal vector plot of a class B specimen that failed by catastrophic disintegration during heat-ing, but still shows clearly defi ned polarity. (C) Orthogonal vector plot, and stereo-graphic projection of a class B specimen with overlapping fi rst- and second-removed magnetization components; polarity is well defi ned by great-circle trend of directions during demagnetization. (D) Orthogonal vector plot and stereographic projection of a class C specimen; although the magne-tization is poorly defi ned, the polarity can be inferred by a combination of the vector and great-circle demagnetization trends. NRM— natural remanent magnetization.
weak magnetization and poor demagnetization behavior (Fig. 10D), but a polarity of the last-removed magnetization can be safely inferred; sites where the majority of samples display this behavior are termed class C. Table DR1 (GSA supplementary material; see footnote 1) pro-vides a complete list of site locations, polarities, and data quality.
Based on these results, we fi nd good agree-ment between the polarity determined by the majority of our sample sites and those of John-son et al. (1983). There were several cases where our results clearly indicated reversed po-larity for the same or very similar stratigraphic levels that Johnson et al. (1983) determined to be normal polarity (see Table DR2; see footnote
on March 29, 2011gsabulletin.gsapubs.orgDownloaded from
Dorsey et al.
784 Geological Society of America Bulletin, May/June 2011
1). We attribute this difference to the combined effects of the often diffi cult to remove normal-polarity overprint, and the single-step thermal treatment (with no vector or great-circle analy-sis), of Johnson et al.’s (1983) results. We also identifi ed several sites reported in our prior work in the Split Mountain Gorge area (Dorsey et al., 2007) where revisions to the reported po-larity are made in this study. These changes are attributed to a combination of sparse demagne-tization data (1–2 samples in the study by John-son et al., 1983), revisions in demagnetization treatments that led to better-defi ned results, and use of combined vector and great-circle trends to determine the polarity of the last-removed magnetization component. The end result is the delineation of 26 polarity reversals that are defi ned by 228 sites in the section (Fig. 5; Fig. DR1 [see footnote 1]).
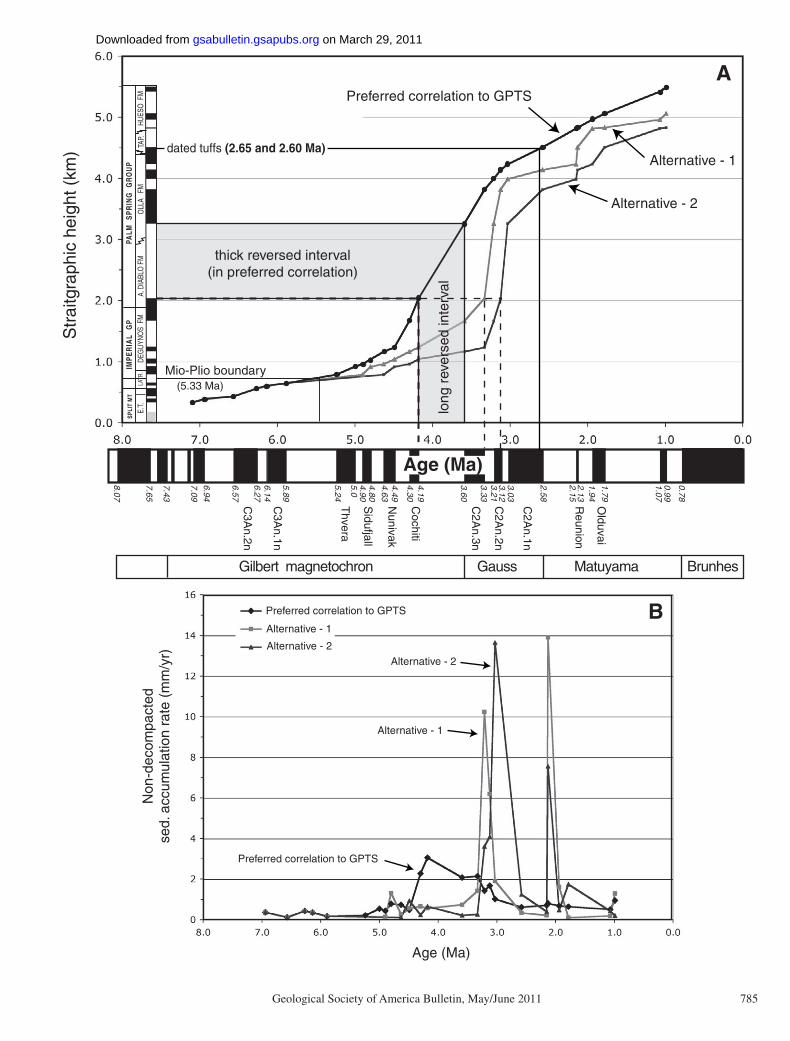
Correlation of 26 magnetic reversals to the geomagnetic polarity time scale (GPTS; Cande and Kent, 1995; Gradstein et al., 2004) pro-vides excellent control on the age of the sec-tion (Fig. 5). The reversals are hung from the GPTS using biostratigraphic placement of the Miocene-Pliocene boundary at 691 m in the section (Dorsey et al., 2007) and new U-Pb ages of the two tuffs at 4454 and 4488 m (2.65 ± 0.05 and 2.60 ± 0.06 Ma, this study). The re-sulting correlation to the GPTS is the only one that produces a reasonable chronology of sedi-ment accumulation. Alternative correlations require extremely large, unreasonable spikes in sedimentation rate and violate independent age controls, and thus are rejected (Fig. 11). Our preferred chronology places the Miocene- Pliocene boundary at the position determined from marine microfossils (Dorsey et al., 2007), and it is consistent with prior results of Opdyke et al. (1977) and Johnson et al. (1983).
There is some uncertainty in the age of the lower part of the section (Fig. 5; Fig. DR1 [see footnote 1]). We infer that the thick reversed interval in the lower half of the Elephant Trees conglomerate member correlates to the lower part of the Gilbert magnetochron (7.09–7.34 or 7.43 Ma). One short-lived normal subchron (C3Br.1n; 3 k.y. duration) likely was missed between sample sites (Fig. 5). Our lowest re-versed site, at the top of the lower sandstone member, most likely sits just above the top of subchron C4n.1n (7.43 Ma) or subchron C3Br.2n (7.34 Ma). This interpretation yields a nondecompacted sediment-accumulation rate of 0.4–0.5 mm/yr in the lower 130 m of the con-glomerate member, consistent with rates calcu-lated for the upper half of the Elephant Trees Formation. Because there is no age control in the lower sandstone member of the Elephant Trees Formation (Fig. 5), the age of the oldest
sediment at the base of the section, east of Split Mountain Gorge, is estimated by extrapolating a nondecompacted sediment-accumulation rate of 0.2–0.5 mm/yr through the lower 140–190 m of section, and adding the range of possible du-rations to the inferred age of the lowest paleo-magnetic collection site (7.34 or 7.43 Ma). This yields an age of 8.0 ± 0.4 Ma for the oldest de-posits at the base of the section.
Our new data confi rm that the change from normal to reversed polarity located 21 ± 13 m above the upper tuff is the Gauss-Matuyama boundary (2.58 Ma) (Fig. 5). Using present-day stratigraphic thicknesses, we calculate un-decompacted sediment-accumulation rates of ~0.7 mm/yr between the two tuffs, and 1.0 mm/yr between the upper tuff and the Gauss-Matuyama reversal. These rates are similar to the average, longer-term nondecompacted accumulation rate of ~0.60 mm/yr calculated using magnetic rever-sals in this part of the section (Fig. 12).
SUBSIDENCE ANALYSIS
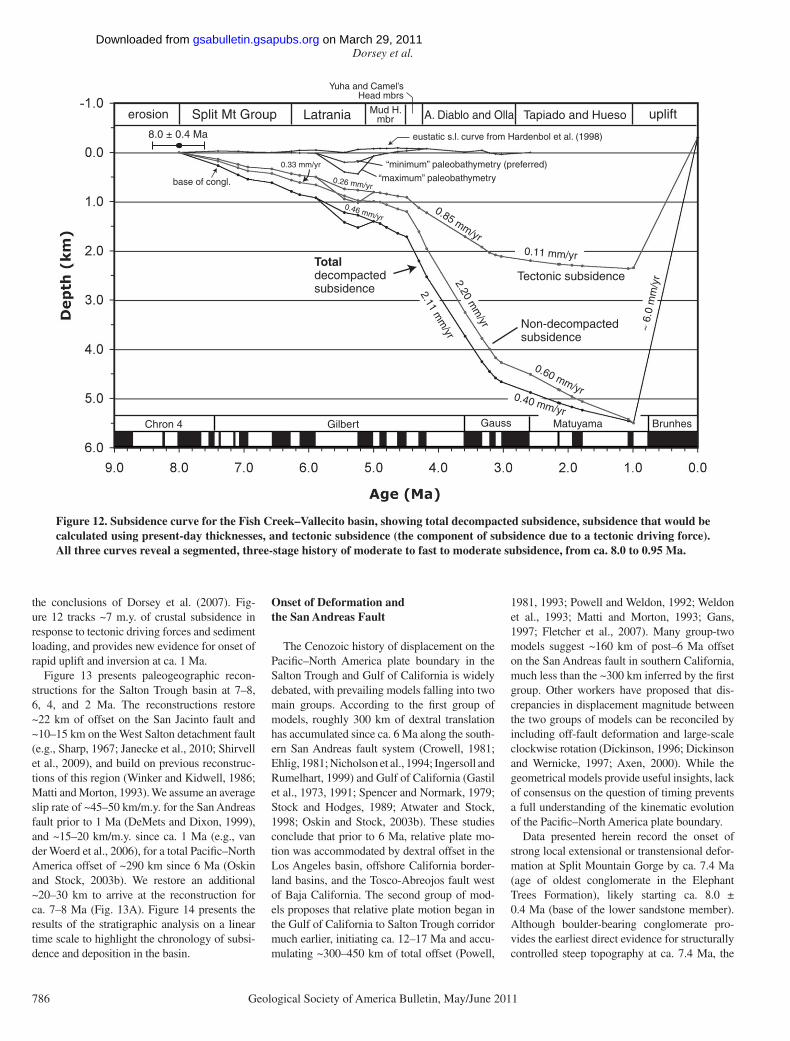
Figure 12 tracks 7 m.y. of subsidence in the Fish Creek–Vallecito basin, from ca. 8.0 to 0.95 Ma. This plot includes three curves for basin subsidence: one showing a plot of pres-ent-day thickness as a function of age (= nonde-compacted subsidence), one for total subsidence calculated using the decompaction method de-scribed previously, and one for the component of total subsidence that is attributed to a tectonic driving force. All three curves are corrected for changes in global eustatic sea level using the curve of Hardenbol et al. (1998), and assume that nonmarine units accumulated at or close to sea level. The magnitude of eustatic change, albeit uncertain, is small relative to stratigraphic thickness, so the choice of a eustatic curve does not strongly affect the overall shape of the sub-sidence curve. The curve that uses present-day thickness does not include the effects of sedi-ment compaction during burial and therefore is not an accurate subsidence history; it is in-cluded for comparison and completeness only. The curve for total subsidence tracks the depth to the base of the section through time and ac-counts for the effects of progressive sediment compaction with increasing burial depth. Tec-tonic subsidence is calculated by removing the effect of the sediment load assuming a local (Airy) isostatic response to loading, and the re-sidual is assumed to be due to a tectonic driving force (Angevine et al., 1990). All three versions of the subsidence curve reveal a relatively sim-ple four-part history of moderate (8.0–4.5 Ma) to fast (4.5–3.1 Ma) to moderate (3.1–0.95 Ma) subsidence, followed by post–1 Ma rapid uplift of the base of the section (Fig. 12).
The decompacted subsidence curves diverge into two lines in the marine part of the sec-tion (Fig. 12), refl ecting uncertainty in paleo–water depth. Curves that assume a minimum paleobathymetry reveal relatively constant subsidence at a rate of 0.46 mm/yr (total) and 0.26 mm/yr (tectonic) between 8.0 and 4.5 Ma. In contrast, curves that assume the maximum paleobathymetry suggest a period of accelerated subsidence followed by rapid uplift between ca. 5.8 and 5.0 Ma, refl ecting inferred large changes in paleo–water depth. While we cannot rule out the maximum estimate of paleobathym-etry, we favor the minimum estimate because it is consistent with observed lithofacies, and it removes a short-lived pulse of uplift in the basin for which we have no other evidence and no ob-vious mechanism.
The plot in Figure 12 reveals an abrupt change at 4.5 Ma to rapid subsidence (2.11 mm/yr total rate; 0.85 mm/yr tectonic rate) that lasted for 1.4 m.y. until 3.1 Ma. The end of this segment is marked by a similarly abrupt return to moderate subsidence rate that lasted from 3.1 Ma to the end of basin subsid-ence at ca. 1 Ma. Since ca. 1 Ma, the entire basin has been inverted, uplifted, and deeply eroded, exposing the base of the section at el-evations up to ~300 m above sea level around Split Mountain Gorge (Figs. 2 and 12).
DISCUSSION
The results of this study provide new insights into the subsidence history of the Fish Creek–Vallecito basin, crustal deformation related to development of the Pacifi c–North America plate boundary, chronology and dynamics of the Pliocene Colorado River, and the competing roles of subsidence and sediment supply in fi ll-ing this large transtensional basin. We fi nd that the base of the Elephant Trees Formation is 8.0 ± 0.4 Ma, the oldest marine deposits are 6.3 Ma, and Colorado River–derived sand fi rst appears in this section at 5.3 Ma (Fig. 5), consistent with
Figure 11. Comparison of our preferred correlation to the geomagnetic polarity time scale (GPTS) with two alternative correla-tions. (A) Present-day stratigraphic height versus age. (B) Sediment-accumulation rates (using present-day thicknesses) ver-sus age. The alternative correlations yield unreasonably large spikes in sediment- accumulation rate, and do not correctly correlate the Gauss-Matuyama reversal to the two dated tuffs at ~4500 m in the section (Fig. 5).
on March 29, 2011gsabulletin.gsapubs.orgDownloaded from
Late Cenozoic basin development, southern California
Geological Society of America Bulletin, May/June 2011 785
7.09
6.94
6.57
6.276.14
5.89
5.24
5.04.904.80
4.63
7.65
4.49
4.304.19
3.60
3.333.213.123.03
2.58
0.78
0.991.07
1.79
1.942.132.15
7.43
8.07
Olduvai
Reunion
C2A
n.1n
C2A
n.2n
C2A
n.3n
Cochiti
Nunivak
Sidufjall
Thvera
C3A
n.1n
C3A
n.2n
Gilbert magnetochron Gauss Matuyama Brunhes
thick reversed interval(in preferred correlation)
long
rev
erse
d in
terv
al
Age (Ma)
APreferred correlation to GPTS
Alternative - 1
Alternative - 2
Non
-dec
ompa
cted
sed.
acc
umul
atio
n ra
te (
mm
/yr)
Age (Ma)
BPreferred correlation to GPTS
Alternative - 1
Alternative - 2
DEG
UYNO
S F
M
Nunivak
PALM
S
PR
ING
G
RO
UP
IMP
ER
IAL
GP
SPLI
T M
T
LATR
.E.
T.A.
DIA
BLO
FM
OLL
A F
MHU
ESO
FM
TAP.
Str
aitg
raph
ic h
eigh
t (km
)
Mio-Plio boundary(5.33 Ma)
dated tuffs (2.65 and 2.60 Ma)
Preferred correlation to GPTS
Alternative - 1
Alternative - 2
on March 29, 2011gsabulletin.gsapubs.orgDownloaded from
Dorsey et al.
786 Geological Society of America Bulletin, May/June 2011
the conclusions of Dorsey et al. (2007). Fig-ure 12 tracks ~7 m.y. of crustal subsidence in response to tectonic driving forces and sediment loading, and provides new evidence for onset of rapid uplift and inversion at ca. 1 Ma.
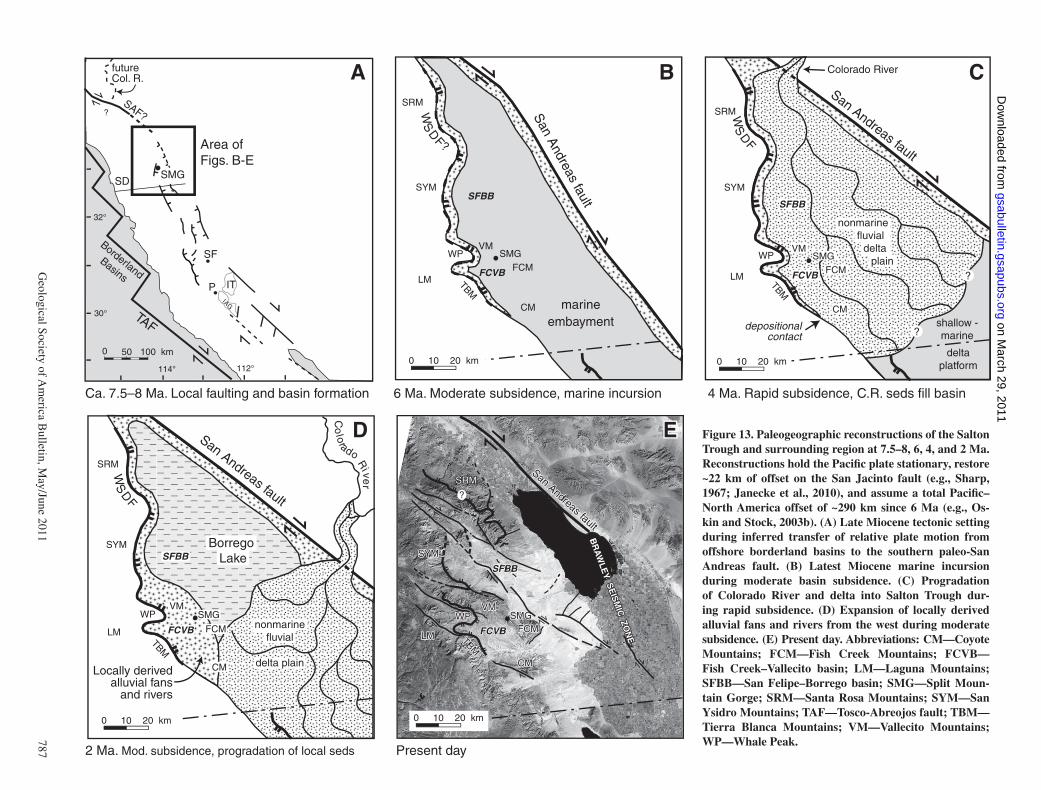
Figure 13 presents paleogeographic recon-structions for the Salton Trough basin at 7–8, 6, 4, and 2 Ma. The reconstructions restore ~22 km of offset on the San Jacinto fault and ~10–15 km on the West Salton detachment fault (e.g., Sharp, 1967; Janecke et al., 2010; Shirvell et al., 2009), and build on previous reconstruc-tions of this region (Winker and Kidwell, 1986; Matti and Morton, 1993). We assume an average slip rate of ~45–50 km/m.y. for the San Andreas fault prior to 1 Ma (DeMets and Dixon, 1999), and ~15–20 km/m.y. since ca. 1 Ma (e.g., van der Woerd et al., 2006), for a total Pacifi c–North America offset of ~290 km since 6 Ma (Oskin and Stock, 2003b). We restore an additional ~20–30 km to arrive at the reconstruction for ca. 7–8 Ma (Fig. 13A). Figure 14 presents the results of the stratigraphic analysis on a linear time scale to highlight the chronology of subsi-dence and deposition in the basin.
Onset of Deformation and the San Andreas Fault
The Cenozoic history of displacement on the Pacifi c–North America plate boundary in the Salton Trough and Gulf of California is widely debated, with prevailing models falling into two main groups. According to the fi rst group of models, roughly 300 km of dextral translation has accumulated since ca. 6 Ma along the south-ern San Andreas fault system (Crowell, 1981; Ehlig, 1981; Nicholson et al., 1994; Ingersoll and Rumelhart, 1999) and Gulf of California (Gastil et al., 1973, 1991; Spencer and Normark, 1979; Stock and Hodges, 1989; Atwater and Stock, 1998; Oskin and Stock, 2003b). These studies conclude that prior to 6 Ma, relative plate mo-tion was accommodated by dextral offset in the Los Angeles basin, offshore California border-land basins, and the Tosco-Abreojos fault west of Baja California. The second group of mod-els proposes that relative plate motion began in the Gulf of California to Salton Trough corridor much earlier, initiating ca. 12–17 Ma and accu-mulating ~300–450 km of total offset (Powell,
1981, 1993; Powell and Weldon, 1992; Weldon et al., 1993; Matti and Morton, 1993; Gans, 1997; Fletcher et al., 2007). Many group-two models suggest ~160 km of post–6 Ma offset on the San Andreas fault in southern California, much less than the ~300 km inferred by the fi rst group. Other workers have proposed that dis-crepancies in displacement magnitude between the two groups of models can be reconciled by including off-fault deformation and large-scale clockwise rotation (Dickinson, 1996; Dickinson and Wernicke, 1997; Axen, 2000). While the geometrical models provide useful insights, lack of consensus on the question of timing prevents a full understanding of the kinematic evolution of the Pacifi c–North America plate boundary.
Data presented herein record the onset of strong local extensional or transtensional defor-mation at Split Mountain Gorge by ca. 7.4 Ma (age of oldest conglomerate in the Elephant Trees Formation), likely starting ca. 8.0 ± 0.4 Ma (base of the lower sandstone member). Although boulder-bearing conglomerate pro-vides the earliest direct evidence for structurally controlled steep topography at ca. 7.4 Ma, the
0.26 mm/yr
0.46 mm/yr0.85 mm/yr
~ 6.
0 m
m/y
r
Total decompactedsubsidence
Tectonic subsidence2.20 mm
/yr
0.40 mm/yr
Non-decompactedsubsidence
0.60 mm/yr
eustatic s.l. curve from Hardenbol et al. (1998)
“maximum” paleobathymetry
“minimum” paleobathymetry (preferred)
0.11 mm/yr
2.11 mm
/yr
Split Mt Group Latrania Mud H.mbr A. Diablo and Olla Tapiado and Hueso
Yuha and Camel’sHead mbrs
uplifterosion
Chron 4 Gilbert Gauss Matuyama Brunhes
base of congl.
0.33 mm/yr
8.0 ± 0.4 Ma
Figure 12. Subsidence curve for the Fish Creek–Vallecito basin, showing total decompacted subsidence, subsidence that would be calculated using present-day thicknesses, and tectonic subsidence (the component of subsidence due to a tectonic driving force). All three curves reveal a segmented, three-stage history of moderate to fast to moderate subsidence, from ca. 8.0 to 0.95 Ma.
on March 29, 2011gsabulletin.gsapubs.orgDownloaded from
Late C
enozoic basin development, southern C
alifornia
G
eological Society of Am
erica Bulletin, M
ay/June 2011 787
6 Ma. Moderate subsidence, marine incursion 4 Ma. Rapid subsidence, C.R. seds fill basin
2 Ma. Mod. subsidence, progradation of local seds Present day
FCMFCM
VMVM
CMCM
WPWP
LMLM
SYMSYM
TBMTBM
SMGSMGFCM
VM
CM
SRM
SRMSRMSRM
WP WPFCVB FCVBFCVBFCVB
SYM
TBM
LM LM
0 5 10 km0 10 20 km 0 10 20 km
SYM
TBM
San Andreas fault
San Andreas fault
San Andreas fault
San Andreas fault
Locally derivedalluvial fans
and riversC
olo
rado Ri ve
r
SMG
CM
SRM
WP
FCVB
SYM
LM
SFBB
0 10 20 km
TBM
San A
ndreas fault
marineembayment
FCM
VMSMG
WS
DF?
WS
DF
nonmarinefluvial
delta plain
Borrego LakeSFBB
FCM
CM
VM
FCVB
SMG
?
SFBBSFBBSFBB
BR
AW
LEY
SE
ISM
IC ZO
NE
BR
AW
LEY
SE
ISM
IC ZO
NE
BR
AW
LEY
SE
ISM
IC ZO
NE
Ca. 7.5–8 Ma. Local faulting and basin formation
100 km0 50
SD
SF
IAG
112°114°
SAF??
32°
30°
P IT
future Col. R.
SMG
Area ofFigs. B-E
TAF
BorderlandBasins
SRM
WP
SYM
LM
0 10 20 km
TBM
shallow -marine
deltaplatform
San Andreas fault
?
?
Colorado River
WS
DF
nonmarine fluvial delta
plain
CM
FCVB
SFBB
FCM
VMSMG
depositionalcontact
A B C
D EEE Figure 13. Paleogeographic reconstructions of the Salton Trough and surrounding region at 7.5–8, 6, 4, and 2 Ma. Reconstructions hold the Pacifi c plate stationary, restore ~22 km of offset on the San Jacinto fault (e.g., Sharp, 1967; Janecke et al., 2010), and assume a total Pacifi c–North America offset of ~290 km since 6 Ma (e.g., Os-kin and Stock, 2003b). (A) Late Miocene tectonic setting during inferred transfer of relative plate motion from offshore borderland basins to the southern paleo-San Andreas fault. (B) Latest Miocene marine incursion during moderate basin subsidence. (C) Progradation of Colorado River and delta into Salton Trough dur-ing rapid subsidence. (D) Expansion of locally derived alluvial fans and rivers from the west during moderate subsidence. (E) Present day. Abbreviations: CM—Coyote Mountains; FCM—Fish Creek Mountains; FCVB—Fish Creek–Vallecito basin; LM—Laguna Mountains; SFBB—San Felipe–Borrego basin; SMG—Split Moun-tain Gorge; SRM—Santa Rosa Mountains; SYM—San Ysidro Mountains; TAF—Tosco-Abreojos fault; TBM—Tierra Blanca Mountains; VM—Vallecito Mountains; WP—Whale Peak.
on March 29, 2011
gsabulletin.gsapubs.orgD
ownloaded from
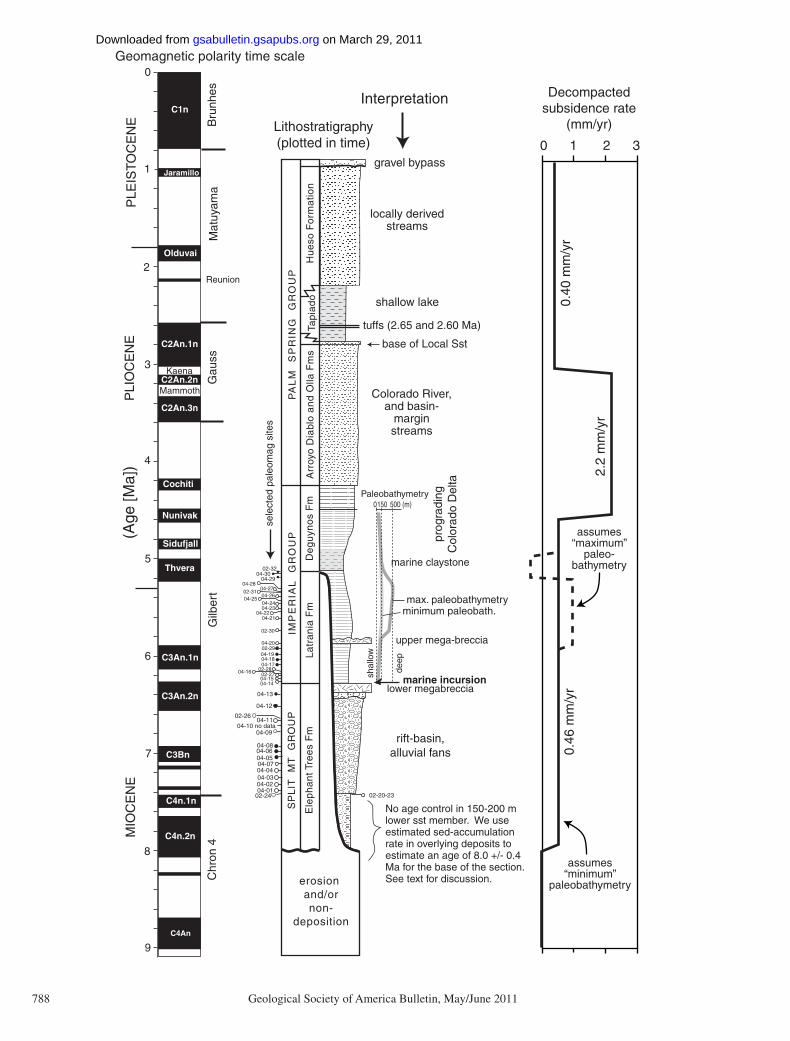
Dorsey et al.
788 Geological Society of America Bulletin, May/June 2011
9
8
7
6
5
4
3
2
1
(Age
[Ma]
)
Bru
nhes
Mat
uyam
aG
auss
Gilb
ert
Jaramillo C1r.1n
Olduvai
Reunion
Kaena
Mammoth
C1n
C2An.1n
C2An.2n
C2An.3n
C3An.1n
C3An.2n
C3Bn
C4n.1n
C4n.2n
C4An
Chr
on 4
PLE
ISTO
CE
NE
MIO
CE
NE
Sidufjall
Thvera
Nunivak
Cochiti
PLI
OC
EN
E
Geomagnetic polarity time scale0
Decompactedsubsidence rate
(mm/yr)
0 1 2 3
0.46
mm
/yr
2.2
mm
/yr
0.40
mm
/yr
Lithostratigraphy(plotted in time)
assumes“minimum”
paleobathymetry
assumes“maximum”
paleo-bathymetry
erosion and/ornon-
deposition
PA
LM
S
PR
ING
G
RO
UP
IMP
ER
IAL
G
RO
UP
SP
LIT
M
T
GR
OU
P
Ele
ph
an
t Tre
es
Fm
La
tra
nia
Fm
De
gu
yno
s F
mA
rroy
o D
iabl
o a
nd
Olla
Fm
sH
ue
so F
orm
atio
nTa
pia
do
Interpretation
02-2404-0104-0204-0304-04
04-0504-06
04-07
04-08
04-0904-10 no data
04-11
04-12
04-13
02-26
04-19
04-20
04-1404-15
04-1604-1704-18
02-2702-28
02-29
02-30
04-2104-22
04-2304-24
04-2504-2604-27
04-28
02-31
Paleobathymetry0150 500 (m)
max. paleobathymetryminimum paleobath.
lower megabrecciamarine incursion
upper mega-breccia
marine claystone
prog
radi
ngC
olor
ado
Del
ta
Colorado River,and basin-
marginstreams
base of Local Sst
shallow lake
locally derivedstreams
rift-basin,alluvial fans
tuffs (2.65 and 2.60 Ma)
deep
shal
low
02-20-23
No age control in 150-200 m lower sst member. We use estimated sed-accumulation rate in overlying deposits to estimate an age of 8.0 +/- 0.4 Ma for the base of the section. See text for discussion.
04-29
02-3204-30
gravel bypass
sele
cted
pal
eom
ag s
ites
on March 29, 2011gsabulletin.gsapubs.orgDownloaded from
Late Cenozoic basin development, southern California
Geological Society of America Bulletin, May/June 2011 789
conformable nature of the lower Elephant Trees Formation east of Split Mountain Gorge indi-cates that the lower sandstone member likely ac-cumulated in a tectonically active basin starting ca. 8.0 ± 0.4 Ma. We speculate that the onset of local deformation may refl ect initiation of off-fault strain adjacent to the paleo–San Andreas fault when it became established as the Pacifi c–North America plate boundary in the Salton Trough at ca. 7–8 Ma (Fig. 13A). This coincides temporally with—and may have been linked to—a change to a more strike-slip relative plate motion at ca. 8 Ma (Atwater and Stock, 1998), though newer analyses do not indicate a change in plate motion at this time (Wilson et al., 2005). Alternatively, the onset of deformation in this area could represent intraplate strain prior to es-tablishment of the Pacifi c–North America plate boundary in the Salton Trough at ca. 6 Ma, or it could be off-fault strain that started long after initiation of the paleo–San Andreas fault around 12–17 Ma. We favor the fi rst hypothesis— onset of local deformation due to initiation of the paleo–San Andreas fault—because the present-day San Andreas fault is embedded in a wide belt of deformation, and the study area restores to a position close to the paleo–San Andreas fault in the reconstruction (Fig. 13A). While we cannot rule out the possibility that the paleo–San Andreas fault was present NE of the Salton Trough before the onset of deformation at Split Mountain Gorge, the overlying marine deposits and correlation to other distant localities pro-vide clear evidence that the plate boundary was established in the Salton Trough by or before 6.3 Ma (see following).
Our conclusion that local transtensional de-formation started at ca. 8.0 ± 0.4 Ma differs from a recent study of (U-Th)/He cooling ages in the lower plate of the West Salton detachment fault (Shirvell et al., 2009), which suggested that exhumation due to slip on the detachment fault may have started as early as ca. 12 Ma. However, Shirvell et al. (2009) did not consider long-term cooling due to a regional thermal
event—perhaps related to development of a slab window east of the San Andreas transform boundary (e.g., Dickinson and Snyder, 1979; Severinghaus and Atwater, 1990; Wilson et al., 2005)—as an alternative explanation for the data. The cause of slow cooling since ca. 25 Ma north of Split Mountain Gorge in the eastern Peninsular Ranges (Luther et al., 2008) is simi-larly enigmatic. We propose that, in contrast to ambiguous results emerging from thermochro-nologic studies, stratigraphy provides a robust, well-dated record of crustal deformation in this area, and that there is no compelling evidence for major extensional or transtensional deforma-tion in the Fish Creek–Vallecito basin prior to ca. 8 Ma. Suggestions that an older stratigraphic record resides concealed in the subsurface are untenable because the latest Miocene and Plio-cene base of the section is well exposed in numerous places due to young uplift and exhu-mation. Because the Salton Trough has opened by lithospheric rupture and spreading (e.g., Fuis et al., 1984), the study area restores to a position close to the paleo–San Andreas fault (Fig. 13A), making it unlikely that a deep older section is preserved at depth in the subsurface of the mod-ern Salton Trough. We therefore conclude that crustal extension or transtension in the western Salton Trough began at ca. 7.5–8 Ma, and that older (U-Th)/He ages in the footwall of the West Salton detachment fault most likely record the younger part of a protracted regional cooling history that began in middle Tertiary time.
Late Miocene Marine Incursion
The oldest marine deposits at Split Moun-tain Gorge, dated here at ca. 6.3 Ma, record late Miocene marine fl ooding into the Salton Trough (Fig. 13B). Subsidence rate in the basin was moderate and more or less constant from ca. 8.0 to 4.5 Ma (Fig. 12), so it is unlikely that marine incursion resulted from an abrupt increase in subsidence rate at 6.3 Ma. Thus, it is tempting to attribute this event to a late Miocene rise in global sea level (e.g., Haq et al., 1987; Hard-enbol et al., 1998) superimposed on long-term tectonic subsidence. However, recent recon-structions of global sea level based on refi ned stratigraphic analysis and backstripping meth-ods do not reveal a large-magnitude change in global sea level in late Miocene time (Van Sickel et al., 2004; Miller et al., 2005). Large discrep-ancies between published sea-level curves, combined with possible complications related to slab-window thermal effects (e.g., Wilson et al., 2005) and dynamic topography (Moucha et al., 2008; Spasojevic et al., 2008), currently make it impossible to assess the possible infl uence of eustatic sea-level change on this event.
Despite the uncertain role of late Miocene eustatic sea level, the regional distribution of marine sediments places a useful constraint on the timing of plate-boundary deforma-tion. Marine deposits of remarkably similar age (ca. 6.3–6.5 Ma) are preserved in a nar-row, ~600-km-long belt from Isla Tiburon in the south (Oskin et al., 2001; Oskin and Stock, 2003a) to the northern Salton Trough and south-ern San Bernardino Mountains (Rymer et al., 1994, 1995; McDougall et al., 1999; McDou-gall, 2008). In most localities, late Miocene marine deposits conformably overlie nonmarine deposits that themselves rest nonconformably on Cretaceous or older plutonic rock. This sug-gests that these localities were either uplifting or neutral until a structural change caused sub-sidence and deposition in nonmarine environ-ments, which subsequently were inundated by marine water. The similar timing of these events along a 600-km-long narrow belt provides clear evidence that the Pacifi c–North America plate boundary was established along the Salton Trough–Gulf of California corridor by the time of marine incursion. We infer that local defor-mation at Split Mountain Gorge and elsewhere was replaced by regionally integrated exten-sion and transtension along the plate boundary, which caused crustal thinning and lowering of topography to sea level and culminated in ma-rine fl ooding at ca. 6.3–6.5 Ma.
Controls on Segmented Basin Subsidence
As noted already, the subsidence history for the Fish Creek–Vallecito basin consists of three linear segments with abrupt changes in rate from moderate (0.46 mm/yr) to fast (2.11 mm/yr) to moderate (0.40 mm/yr), followed by rapid uplift and exhumation (Fig. 5). This is not pre-dicted for rift basins, which typically show a gradual decay of subsidence rate in response to lithospheric cooling (McKenzie, 1978; Sclater and Christie, 1980; Bond et al., 1983). Instead, the second two stages of subsidence are remi-niscent of strike-slip–related basins, such as the Miocene-Pliocene Ridge Basin (Crowell and Link, 1982; Christie-Blick and Biddle, 1985) and Pliocene Loreto basin (Dorsey and Umhoefer, 2000), which experience an early stage of rapid subsidence followed by an abrupt change to slower subsidence (see also Xie and Heller, 2009). Pitman and Andrews (1985) pro-posed that the segmented subsidence pattern of transtensional strike-slip basins results from signifi cant heat loss during rifting, with much slower postrift subsidence due to little heat loss after the end of the rift phase. Karner and Dewey (1986) suggested that the presence of a subho-rizontal midcrustal detachment leads to thinning
Figure 14. Chronostratigraphic summary of the Fish Creek–Vallecito basin show-ing lithostratigraphy, subsidence rates, and inferred paleobathymetry for the ma-rine Imperial Group (Dorsey et al., 2007; this study), plotted as a function of time. Paleomagnetic sample sites and polarities are shown for the lower part of the sec-tion, where scale permits. Additional de-tails of sample locations are provided in the GSA Data Repository online supplement (Fig. DR1; see text footnote 1).
on March 29, 2011gsabulletin.gsapubs.orgDownloaded from
Dorsey et al.
790 Geological Society of America Bulletin, May/June 2011
of the crust without involvement of the mantle lithosphere, thus maximizing subsidence rate during rifting. Segmented subsidence histories also result from geometric complexities and changes in fault geometry and slip rate as rocks enter and exit bends and steps in strike-slip fault systems. Such changes typically occur in strike-slip fault zones over short time scales (Mann et al., 1983; Dickinson et al., 1987; Machette et al., 1991, 1992; McCalpin and Nishenko, 1996) and have been documented north of the Fish Creek–Vallecito basin in smaller Pleistocene strike-slip basins (Lutz et al., 2006; Kirby et al., 2007; Bel-garde, 2007; Steely et al., 2009).
In the Fish Creek–Vallecito basin, temporal changes in subsidence rate likely refl ect changes in slip rate on basin-bounding faults, and may record initiation of the West Salton detach-ment fault as early as 8.0 ± 0.4 Ma or as late as ca. 4.5 Ma. Onset of lithospheric rupture and vo-luminous mafi c intrusions in the Salton Trough (e.g., Fuis et al., 1984) may have also played a role. Although a specifi c driving mechanism can-not be isolated, the segmented subsidence curve in Figure 12 suggests evolving deformation ad-jacent to geometrically complex transtensional faults in a regional strike-slip–related fault sys-tem. This conclusion is consistent with our gen-eral understanding that Pliocene subsidence and deposition took place during translation along the San Andreas fault at the northeast margin of the basin (Figs. 1 and 13; Axen and Fletcher, 1998).
Progradation and Basin Filling by the Colorado Delta
During early Pliocene time, the Colorado River produced a large volume of sediment that fi lled the Salton Trough up to sea level, forcing progradation of the fl uvial delta plain southeast into the northern Gulf of California (Fig. 13C). Up-section coarsening through the upper Mud Hills, Yuha, and Camels Head Members (Fig. 5) records progradation of the Colorado River delta into the basin from ca. 4.9 to 4.2 Ma. The base of the Arroyo Diablo Formation signals ar-rival of the fl uvial part of the system at 4.25 Ma. It is signifi cant that the delta prograded into this area continuously during an abrupt fourfold in-crease in subsidence rate at ca. 4.5 Ma (Fig. 12). If other parameters (sea level, climate, rate of sediment input) are held constant, an increase in subsidence rate should cause retrogradation and retreat of a delta, which would produce an up-section decrease in grain size and change to more distal deposits (e.g., Paola et al., 1992; Heller and Paola, 1992), opposite of the docu-mented coarsening-up trend.
The observation that delta progradation took place during accelerated subsidence, and that
fl uvial conditions persisted for 1.4 m.y. during the rapid-subsidence phase, provides evidence that a large increase in sediment fl ux to the ba-sin at 4.9–4.6 Ma overwhelmed the competing effect of increased subsidence rate, which oth-erwise would have caused coastal transgression and a decrease in the size of the delta (e.g., Van Wagoner et al., 1990; Posamentier et al., 1988; Muto and Steel, 1992, 2001, 2002). This kind of behavior—strong delta progradation during in-creased production of accommodation space—has been observed elsewhere and is used to document the occurrence and signifi cance of supply-driven deltas (e.g., Goodbred and Kuehl, 2000; Carvajal and Steel, 2006; Porebski and Steel, 2006).
Basin Inversion and Uplift
The Fish Creek–Vallecito basin is well ex-posed because the section has been uplifted, tilted, and eroded during the past ~1 m.y. The onset of tilting is dated at ca. 1.2 Ma based on a zone of fanning dips that begins just below the base of the Jaramillo subchron (1.07 Ma; Fig. 5). Basin subsidence and sediment accumu-lation had ended by ca. 0.95 Ma. We infer that post–1 Ma tilting is currently taking place in a large tilt block bounded by the Elsinore fault on the southwest and the Fish Creek Mountains fault on the northeast (Fig. 2). Because strati-graphic thickness likely represents total depth of the basin, and the base of the section is now exposed at ~300 m elevation, we conclude that there has been as much as 5.7 km of uplift in the Fish Creek Mountains since 0.95 Ma, at an average rate of ~6 mm/yr. The amount of uplift decreases to the southwest and approaches zero to slight subsidence close to the Elsinore fault (Fig. 2). The change from widespread subsi-dence to uplift and basin inversion resulted from initiation of the Elsinore and other strike-slip faults in the western Salton Trough at ca. 1.1–1.3 Ma (Johnson et al., 1983; Lutz et al., 2006; Kirby et al., 2007; Steely et al., 2009; Janecke et al., 2010; this study). Onset of this new struc-tural style represents a major, relatively recent tectonic reorganization and southwestward wid-ening of the San Andreas fault system.
CONCLUSIONS
A 5.5-km-thick stratigraphic section exposed in the Fish Creek–Vallecito basin provides a high-fi delity record of sedimentation, subsi-dence, basin fi lling, and uplift from late Miocene time to the present. Geohistory analysis reveals a segmented history of: (1) moderate subsidence from 8.0 to 4.5 Ma; (2) rapid subsidence from 4.5 to 3.1 Ma; (3) moderate subsidence from 3.1
to 0.95 Ma; and (4) tilting and rapid uplift and erosion since ca. 1 Ma. The strongly segmented nature of the subsidence history is likely related to changes in slip rate and slip partitioning on basin-bounding faults, in particular the low-angle West Salton detachment fault on the west and the San Andreas fault on the northeast.
The onset of subsidence and deposition at ca. 8.0 ± 0.4 Ma resulted from onset of local extensional or transtensional deformation, and may record initiation of the paleo–San Andreas fault when it became established as the Pacifi c–North America plate boundary in the Salton Trough. Alternatively, plate-boundary strain could have initiated in the Salton Trough region prior to or after the onset of deformation in this area, but no later than 6.3 Ma (age of wide-spread marine incursion). The age of the West Salton detachment fault remains uncertain, and could be as old as ca. 8.0 or as young as 4.5 Ma (age of abrupt increase in subsidence rate).
Large-scale progradation of the Colorado delta into the basin took place during an abrupt increase in subsidence rate at ca. 4.5 Ma, and fl uvial-deltaic conditions persisted for 1.4 m.y. during the rapid-subsidence phase. This behav-ior contradicts the predictions of subsidence-driven stratigraphic models because, if other parameters are held constant, a change to rapid subsidence should cause retreat and retrograda-tion of a delta, not progradation. We therefore infer that Pliocene progradation of the delta re-sulted from a large increase in sediment input from the Colorado River that overwhelmed the competing infl uence of rapid subsidence.
Rapid uplift, inversion, and erosion of the ba-sinal succession began at ca. 1 Ma in response to initiation of currently active strike-slip faults and dextral wrench deformation in the western Salton Trough. Complex segmentation and de-struction of the formerly intact supradetachment basin refl ect profound, relatively recent reorga-nization of the San Andreas fault system.
ACKNOWLEDGMENTS
This study was supported by grants from the Na-tional Science Foundation to Dorsey (EAR-0838119), Housen (EAR- 0838167), and Janecke (EAR-0125497). The Cryogenic magnetometer at Western Washington University was provided by NSF grant EAR-9727032 to Housen. We thank George Jeffer-son and Mark Jorgenson for permits for fi eld work in Anza-Borrego Desert State Park. Gary Petro, Jim Smith, and many volunteers from the Stout Paleon-tology Laboratory assisted with fi eld work. L. Louise Gee helped with Arc-GIS data, and Everett Lindsay kindly shared unpublished notes from previous stud-ies. This research benefi ted from discussions with Pat Abbott, Gary Axen, George Jefferson, Susan Kidwell, Kris McDougall, Lyn Murray, Mike Oskin, Tom Peryam, Catherine Shirvell, and Charlie Winker, and from reviews by Nick Christie-Blick, Cari Johnson,
on March 29, 2011gsabulletin.gsapubs.orgDownloaded from
Late Cenozoic basin development, southern California
Geological Society of America Bulletin, May/June 2011 791
Paul Mann, and Jonathan Matti. We thank Burnie and Karen Burnworth for their kind hospitality and shelter at “El Rancho not so Grande” at the top of the section, and Eric Mustonen for housing and generous support in Borrego Springs.
REFERENCES CITED
Abbott, P.L., Kerr, D.R., Borron, S.E., Washburn, J.L., and Rightmer, D.A., 2002, Neogene sturzstrom deposits, Split Mountain area, Anza-Borrego Desert State Park, California, in Evans, S.G., and DeGraff, J.V., eds., Catastrophic Landslides: Effects, Occurrence, and Mechanisms: Geological Society of America, Reviews in Engineering Geology, v. 15, p. 379–400.
Angevine, C.L., Heller, P.L., and Paola, C., 1990, Quanti-tative Sedimentary Basin Modeling: American Asso-ciation of Petroleum Geologists (AAPG) Short Course Note Series 32, 247 p.
Atwater, T., and Stock, J.M., 1998, Pacifi c–North America plate tectonics of the Neogene southwestern United States: An update: International Geology Review, v. 40, p. 375–402, doi: 10.1080/00206819809465216.
Axen, G.J., 2000, New palinspastic reconstructions of the southern San Andreas fault system and northern Gulf of California at 2, 4, 6.5, and 12 Ma: Eos (Transac-tions, American Geophysical Union), v. 81, no. 48, Fall Meeting supplement, abstract T22F–07.
Axen, G.J., and Fletcher, J.M., 1998, Late Miocene–Pleistocene extensional faulting, northern Gulf of California, Mexico and Salton Trough, California: International Geology Review, v. 40, p. 217–244, doi: 10.1080/00206819809465207.
Belgarde, B.E., 2007, Structural Characterization of the Three Southeast Segments of the Clark Fault, Salton Trough, California [M.S thesis]: Logan, Utah, Utah State University, 4 plates, map scale 1:24,000, 216 p.
Bialas, R.W., and Buck, W.R., 2009, How sediment pro-motes narrow rifting: Application to the Gulf of Cali-fornia: Tectonics, v. 28, doi: 10.1029/2008TC002394.
Black, L.P., Kamo, S.L., Williams, I.S., Mundil, R., Davis, D.W., Korsch, R.J., and Foudoulis, C., 2003, The ap-plication of SHRIMP to Phanerozoic geochronol-ogy; a critical appraisal of four zircon standards: Chemical Geology, v. 200, p. 171–188, doi: 10.1016/S0009-2541(03)00166-9.
Bond, G.C., Kominz, M.A., and Devlin, W.J., 1983, Ther-mal subsidence and eustasy in the lower Palaeozoic miogeocline of western North: American Naturalist, v. 306, p. 775–779.
Cande, S.C., and Kent, D.V., 1995, Revised calibration of the geomagnetic polarity timescale for the Late Creta-ceous and Cenozoic: Journal of Geophysical Research, ser. B, Solid Earth and Planets, v. 100, p. 6093–6095.
Carvajal, C.R., and Steel, R.J., 2006, Thick turbidite succes-sions from supply-dominated shelves during sea-level highstand: Geology, v. 34, p. 665–668, doi: 10.1130/G22505.1.
Cassiliano, M.J., 1999, Biostratigraphy of Blancan and Irvingtonian mammals in the Fish Creek–Vallecito section, southern California, and a review of the Blancan-Irvingtonian boundary: Journal of Vertebrate Paleontology, v. 19, p. 169–186.
Christie-Blick, N., and Biddle, K.T., 1985, Deformation and basin formation along strike-slip faults, in Biddle, K.T., and Christie-Blick, N., eds., Strike-Slip Deformation, Basin Formation, and Sedimentation: Society of Eco-nomic Paleontologists and Mineralogists Special Pub-lication 37, p. 1–34.
Compton, R.R., 1985, Geology in the Field: New York, John Wiley, 398 p.
Crowell, J.C., 1981, An outline of the tectonic history of southeastern California, in Ernst, W.G., ed., The Geotectonic Development of California, Rubey Vol-ume 1: Englewood Cliffs, New Jersey, Prentice-Hall, p. 583–600.
Crowell, J.C., ed., 2003, Evolution of Ridge Basin, Southern California: An Interplay of Sedimentation and Tectonics: Geological Society of America Special Paper 367, 247 p.
Crowell, J.C., and Link, M.H., eds., 1982, Geologic His-tory of Ridge Basin, Southern California: Los Angeles,
California, Pacifi c Section, Society of Economic Pale-ontologists and Mineralogists, 304 p.
DeMets, C., and Dixon, T.H., 1999, New kinematic mod-els for Pacifi c–North America motion from 3 Ma to present: I. Evidence for steady motion and biases in the NUVEL-1A model: Geophysical Research Letters, v. 26, p. 1921–1924, doi: 10.1029/1999GL900405.
Dibblee, T.W., Jr., 1954, Geology of the Imperial Valley region, California, in Jahns, R.H., ed., Geology of Southern California: California Division of Mines Bul-letin 170, p. 21–28.
Dibblee, T.W., Jr., 1984, Stratigraphy and tectonics of the San Felipe Hills, Borrego Badlands, Superstition Hills, and vicinity, in Rigsby, C.A., ed., The Imperial Basin—Tectonics, Sedimentation, and Thermal Aspects: Los Angeles, California, Pacifi c Section, Society of Eco-nomic Paleontologists and Mineralogists, p. 31–44.
Dibblee, T.W., Jr., 1996, Stratigraphy and tectonics of the Vallecito–Fish Creek Mountains, Vallecito Badlands, Coyote Mountains, and Yuha Desert, southwestern Im-perial Basin, in Abbott, P.L., and Seymour, D.C., eds., Sturzstroms and Detachment Faults, Anza-Borrego Desert State Park, California: Santa Ana, California, South Coast Geological Society, Annual Field Trip Guide Book, v. 24, p. 59–80.
Dickinson, W.R., 1996, Kinematics of Transrotational Tec-tonism in the California Transverse Ranges and its Contribution to Cumulative Slip along the San Andreas Transform Fault System: Geological Society of Amer-ica Special Paper 305, 46 p.
Dickinson, W.R., and Snyder, W.S., 1979, Geometry of subducted slabs related to San Andreas transform: The Journal of Geology, v. 87, p. 609–627, doi: 10.1086/628456.
Dickinson, W.R., and Wernicke, B.P., 1997, Reconciliation of San Andreas slip discrepancy by a combination of interior Basin and Range extension and transrota-tion near the coast: Geology, v. 25, p. 663–665, doi: 10.1130/0091-7613(1997)025<0663:ROSASD>2.3.CO;2.
Dickinson, W.R., Armin, R.A., Beckvar, N., Goodlin, T.C., Janecke, S.U., Mark, R.A., Norris, R.D., Radel, G., and Wortman, A.A., 1987, Geohistory analysis of rates of sediment accumulation and subsidence for selected California basins, in Ingersoll, R.V., and Ernst, W.G., eds., Cenozoic Basin Development of Coastal Califor-nia; Rubey Volume VI: Englewood Cliffs, New Jersey, Prentice-Hall, p. 1–23.
Dorsey, R.J., 2006, Stratigraphy, tectonics, and basin evolu-tion in the Anza-Borrego Desert region, in Jefferson, G.T., and Lindsay, L.E., eds., Fossil Treasures of Anza-Borrego Desert: San Diego, California, Sunbelt Publi-cations, p. 89–104.
Dorsey, R.J., 2010, Sedimentation and crustal recycling along an active oblique-rift margin: Salton Trough and northern Gulf of California: Geology, v. 38, p. 443–446.
Dorsey, R.J., and Axen, G.J., 2009, End of detachment fault-ing and initiation of strike-slip faults at 1.0 Ma, western Fish Creek–Vallecito basin, southern California: Geo-logical Society of America Abstracts with Programs, v. 41, no. 7, p. 138.
Dorsey, R.J., and Umhoefer, P.J., 2000, Tectonic and eu-static controls on sequence stratigraphy of the Plio-cene Loreto basin, Baja California Sur, Mexico: Geological Society of America Bulletin, v. 112, p. 177–199, doi: 10.1130/0016-7606(2000)112<177:TAECOS>2.0.CO;2.
Dorsey, R.J., and Umhoefer, P.J., 2010, Infl uence of sediment input and plate-motion obliquity on basin development along an active oblique-divergent plate boundary: Gulf of California and Salton Trough, in Busby, C., and Azor, A., eds., Recent Advances in Tectonics of Sedi-mentary Basins: Wiley-Blackwell (in press).
Dorsey, R.J., Fluette, A., McDougall, K.A., Housen, B.A., Janecke, S.U., Axen, G.J., and Shirvell, C.R., 2007, Chronology of Miocene-Pliocene deposits at Split Mountain Gorge, southern California: A record of re-gional tectonics and Colorado River evolution: Geol-ogy, v. 35, p. 57–60, doi: 10.1130/G23139A.1.
Ehlig, P.L., 1981, Origin and tectonic history of the base-ment terrane of the San Gabriel Mountains, central Transverse Ranges, in Ernst, W.G., eds., The Geotec-
tonic Development of California; Rubey Volume 1: En-glewood Cliffs, New Jersey, Prentice-Hall, p. 253–283.
Elders, W.A., and Sass, J.H., 1988, The Salton Sea scien-tifi c drilling project: Journal of Geophysical Research, v. 93, no. B11, p. 12,953–12,968, doi: 10.1029/JB093iB11p12953.
Fletcher, J.M., Grove, M., Kimbrough, D., Lovera, O., and Gehrels, G.E., 2007, Ridge-trench interactions and the Neogene tectonic evolution of the Magdalena shelf and southern Gulf of California: Insights from detrital zir-con U-Pb ages from the Magdalena fan and adjacent areas: Geological Society of America Bulletin, v. 119, p. 1313–1336, doi: 10.1130/B26067.1.
Fuis, G.S., Mooney, W.D., Healy, J.H., McMechan, G.A., and Lutter, W.J., 1984, A seismic refraction survey of the Imperial Valley region, California: Journal of Geo-physical Research, v. 89, p. 1165–1189, doi: 10.1029/JB089iB02p01165.
Gans, P.B., 1997, Large-magnitude Oligo-Miocene exten-sion in southern Sonora: Implications for the tectonic evolution of northwest Mexico: Tectonics, v. 16, p. 388–408, doi: 10.1029/97TC00496.
Gastil, R.G., Lemone, D.V., and Stewart, W.J., 1973, Perm-ian fusulinids from near San Felipe, Baja California: The American Association of Petroleum Geologists Bulletin, v. 57, p. 746–747.
Gastil, R.G., Miller, R.H., Anderson, P., Crocker, J., Campbell, M., Buch, P., Lothringer, C., Leier-Engeldardt, P., DeLat-tre, M., Hoobs, J., and Roldan-Quintana, J., 1991, The re-lation between the Paleozoic strata on opposite sides of the Gulf of California, in Perez-Segura, E., and Jacques-Ayala, C., eds., Studies of Sonoran Geology: Geological Society of America Special Paper 254, p. 7–16.
Gastil, R.G., Kimbrough, D.L., and Abbott, P.L., 1996, Ar-rival of the Colorado River in the Salton Trough de-fi ned by magnetic susceptibility, in Abbott, P.L., and Seymour, D.C., eds., Sturzstroms and Detachment Faults, Anza-Borrego Desert State Park, California: Santa Ana, California, South Coast Geological Society, p. 203–207.
González-Fernández, A., Dañobeitia, J.J., Delgado-Argote, L.A., Michaud, F., Córdoba, D., and Bartolomé, R., 2005, Mode of extension and rifting history of upper Tiburón and upper Delfín basins, northern Gulf of California: Journal of Geophysical Research, v. 110, p. B01313, doi: 10.1029/2003JB002941.
Goodbred, S.L., and Kuehl, S.A., 2000, The signifi cance of large sediment supply, active tectonism, and eustasy on margin sequence development: Late Quaternary stratigraphy and evolution of the Ganges–Brahmaputra delta: Sedimentary Geology, v. 133, p. 227–248, doi: 10.1016/S0037-0738(00)00041-5.
Gradstein, F., Ogg, J.G., and Smith, A.G., eds., 2004, A Geo-logic Time Scale: Cambridge, UK, Cambridge Univer-sity, 610 p.
Hanna, G.D., 1926, Paleontology of Coyote Mountain, Im-perial County, California: Proceeding of the California Academy of Sciences, fourth series, v. 14, p. 427–503.
Haq, B.U., Hardenbol, J., and Vail, P.R., 1987, Chronology of fl uctuating sea levels since the Triassic: Science, v. 235, p. 1156–1167, doi: 10.1126/science.235.4793.1156.
Hardenbol, J., Thierry, J., Farley, M.B., Jacquin, T., de Gra-ciansky, P.C., and Vail, P.R., 1998, Mesozoic and Ce-nozoic sequence chronostratigraphic framework, in de Graciansky, P.C., Hardenbol, J., Jacquin, T., and Vail, P.R., eds., Mesozoic and Cenozoic Sequence Stratig-raphy of European Basins: Society for Sedimentary Geology, Special Publication 60 (Charts), p. 3–13.
Heller, P.L., and Paola, C., 1992, The large-scale dynamics of grain-size variation in alluvial basins: 2. Applica-tion to syntectonic conglomerate: Basin Research, v. 4, p. 91–102.
Herzig, C.T., Mehegan, J.M., and Stelting, C.E., 1988, Lithostratigraphy of the State 2–14 Borehole; Salton Sea Scientifi c Drilling Project: Journal of Geophysi-cal Research, v. 93, p. 12,969–12,980, doi: 10.1029/JB093iB11p12969.
Housen, B.A., Dorsey, R.J., Janecke, S.U., and Axen, G.J., 2005, Rotation of Plio-Pleistocene sedimentary rocks in the Fish Creek–Vallecito Basin, western Salton Trough, CA: Eos (Transactions, American Geophysi-cal Union), v. 86, no. 52, Fall Meeting supplement, abstract GP13A–0039.
on March 29, 2011gsabulletin.gsapubs.orgDownloaded from
Dorsey et al.
792 Geological Society of America Bulletin, May/June 2011
Housen, B.A., Dorsey, R.J., Janecke, S.U., and Axen, G.J., 2006, Evolution of rotations in the Fish Creek– Vallecito basin, western Salton Trough, CA: Eos (Transactions, American Geophysical Union), v. 87, no. 52, Fall Meeting supplement, abstract T41D–1601.
Ingersoll, R.V., and Rumelhart, P.E., 1999, Three-stage evolution of the Los Angeles basin, southern Cali-fornia: Geology, v. 27, p. 593–596, doi: 10.1130/0091-7613(1999)027<0593:TSEOTL>2.3.CO;2.
Janecke, S.U., Dorsey, R.J., Forand, D., Steely, A.N., Kirby, S.M., Lutz, A.T., Housen, B.A., Belgarde, B., Langen-heim, V.E., and Rittenour, T.M., 2010, High Geologic Slip Rates since Early Pleistocene Initiation of the San Jacinto and San Felipe Fault Zones in the San An-dreas Fault System: Southern California, USA: Geo-logical Society of America Special Paper 475, 48 p., doi:10.1130/2010.2475.
Jefferson, G.T., and Lindsay, L.E., eds., 2006, Fossil Trea-sures of Anza-Borrego Desert: San Diego, California, Sunbelt Publications, 394 p.
Johnson, N.M., Offi cer, C.B., Opdyke, N.D., Woodard, G.D., Zeitler, P.K., and Lindsay, E.H., 1983, Rates of late Cenozoic tectonism in the Vallecito–Fish Creek basin, western Imperial Valley: California Geology, v. 11, p. 664–667.
Kairouz, M.E., 2005, Geology of the Whale Peak Region of the Vallecito Mountains: Emphasis on the Kinemat-ics and Timing of the West Salton Detachment Fault, Southern California [M.S. thesis]: Los Angeles, Uni-versity of California, 156 p.
Karner, G.D., and Dewey, J.F., 1986, Rifting, lithospheric versus crustal extension as applied to the Ridge Basin of southern California, in Halbouty, M.E., ed., Future Petroleum Provinces of the World: American Associa-tion of Petroleum Geologists Memoir 40, p. 317–337.
Kerr, D.R., 1982, Early Neogene Continental Sedimentation, Western Salton Trough, California [M.S. thesis]: San Diego, California, San Diego State University, 138 p.
Kerr, D.R., and Abbott, P.L., 1996, Miocene subaerial stur-zstrom deposits, Split Mountain, Anza-Borrego Desert State Park, in Abbott, P.L., and Seymour, D.C., eds., Sturzstroms and Detachment Faults, Anza-Borrego Desert State Park, California: Santa Ana, California, South Coast Geological Society, p. 149–163.
Kerr, D.R., and Kidwell, S.M., 1991, Late Cenozoic sedi-mentation and tectonics, western Salton Trough, Cali-fornia, in Walawender, M.J., and Hanan, B.B., eds., Geological Excursions in Southern California and Mexico: San Diego, California, Department of Geolog-ical Sciences, San Diego State University, p. 397–416.
Kirby, S.M., 2005, The Quaternary Structural and Tectonic Evolution of the San Felipe Hills, CA. [M.S. thesis]: Logan, Utah, Utah State University, 3 plates, 181 p.
Kirby, S.M., Janecke, S.U., Dorsey, R.J., Housen, B.A., Langenheim, V., McDougall, K., and Steely, A.N., 2007, Pleistocene Brawley and Ocotillo Formations: Evidence for initial strike-slip deformation along the San Felipe and San Jacinto fault zones, southern Cali-fornia: The Journal of Geology, v. 115, p. 43–62, doi: 10.1086/509248.
Lizarralde, D., Axen, G.J., Brown, H.E., Fletcher, J.M., Antonio González-Fernández, A., Harding, A.J., Hol-brook, W.S., Kent, G.M., Paramo, P., Sutherland, F., and Umhoefer, P.J., 2007, Variation in styles of rifting in the Gulf of California: Nature, v. 448, p. 466–469, doi: 10.1038/nature06035.
Lourens, L.J., Antonarakou, A., Hilgen, F.J., Van Hoof, A.A.M., Vergnaud-Grazzini, C., and Zachariasse, W.J., 1996, Evaluation of the Plio-Pleistocene astronomical timescale: Paleoceanography, v. 11, p. 391–413, doi: 10.1029/96PA01125.
Ludwig, K.R., 2001, SQUID 1.02; A User’s Manual: Berke-ley Geochronology Center Special Publication 2, 22 p.
Ludwig, K.R., 2003, User’s Manual for Isoplot/Ex, Version 3.0; A Geochronological Toolkit for Microsoft Excel: Berkeley Geochronology Center Special Publication 4, 70 p.
Luther, A., Axen, G., Stockli, D., Kelley, S., and Grove, M., 2008, Preliminary apatite (U-Th)/He thermochronol-ogy of the eastern Santa Rosa and San Jacinto blocks, Peninsular Ranges, southern California: Geological Society of America Abstracts with Programs, v. 40, no. 6, p. 444.
Lutz, A.T., 2005, Tectonic Controls on Pleistocene Basin Evolution in the Central San Jacinto Fault Zone, South-ern California [M.S. thesis]: Eugene, Oregon, Univer-sity of Oregon, 136 p.
Lutz, A.T., Dorsey, R.J., Housen, B.A., and Janecke, S.U., 2006, Stratigraphic record of Pleistocene faulting and basin evolution in the Borrego Badlands, San Jacinto fault zone, southern California: Geological Society of America Bulletin, v. 118, p. 1377–1397, doi: 10.1130/B25946.1.
Machette, M.N., Personius, S.F., Nelson, A.R., Schwartz, D.P., and Lund, W.R., 1991, The Wasatch fault zone, Utah; segmentation and history of Holocene earth-quakes: Journal of Structural Geology, v. 13, p. 137–149, doi: 10.1016/0191-8141(91)90062-N.
Machette, M.N., Personius, S.F., and Nelson, A.R., 1992, Paleoseismology of the Wasatch fault zone; summary, interpretations, conclusions, in Gori, P.L., and Hays, W.W., eds., Assessment of Earthquake Hazards and Risks along the Wasatch Front: U.S. Geological Survey Professional Paper P1500AJ, p. A1–A71.
Magistrale, H., and Rockwell, T.K., 1996, The central and southern Elsinore fault zone: Bulletin of the Seismo-logical Society of America, v. 86, p. 1793–1803.
Mann, P., 2007, Global catalogue, classifi cation and tectonic origins of restraining and releasing bends on active and ancient strike- slip fault systems, in Cunningham, W.D., and Mann, P., eds., Tectonics of Strike- Slip Re-straining and Releasing Bends: Geological Society of London Special Publication 290, p. 13–142.
Mann, P., Hempton, M., Bradley, D., and Burke, K., 1983, Development of pull-apart basins: The Journal of Geol-ogy, v. 91, p. 529–554, doi: 10.1086/628803.
Matti, J.C., and Morton, D.M., 1993, Paleogeographic evolu-tion of the San Andreas fault in southern California: A reconstruction based on a new cross-fault correlation, in Powell, R.E., Weldon, R.J., and Matti, J.C., eds., The San Andreas Fault System: Displacement, Palinspastic Reconstruction, and Geologic Evolution: Geological Society of America Memoir 178, p. 107–159.
Matti, J.C., Cox, B., Morton, D.M., Sharp, R.V., and King, T., 2002, Fault-bounded Neogene sedimentary depos-its in the Santa Rosa Mountains, southern California; crustal stretching or transpressional uplift?: Geologi-cal Society of America Abstracts with Programs, v. 34, no. 6, p. 124.
May, S.R., Ehman, K.D., Gray, G., and Crowell, J.C., 1993, A new angle on the tectonic evolution of the Ridge Basin, a strike- slip basin, southern California: Geological Society of America Bulletin, v. 105, p. 1357–1372, doi: 10.1130/0016-7606(1993)105<1357:ANAOTT>2.3.CO;2.
McCalpin, J.P., and Nishenko, S.P., 1996, Holocene pa-leoseismicity, temporal clustering, and probabilities of future large (M>7) earthquakes on the Wasatch fault zone, Utah: Journal of Geophysical Research, v. 101, p. 6233–6253, doi: 10.1029/95JB02851.
McDougall, K., 2008, Late Neogene marine incursions and the ancestral Gulf of California, in Reheis, M., Her-schler, R., and Miller, D., eds., Late Cenozoic Drainage History of the Southwestern Great Basin and Lower Colorado River Region: Geologic and Biotic Perspec-tives: Geological Society of America Special Paper 439, p. 355–373.
McDougall, K.A., Poore, R.Z., and Matti, J.C., 1999, Age and paleoenvironment of the Imperial Formation near San Gorgonio Pass, southern California: Journal of Fo-raminiferal Research, v. 29, p. 4–25.
McKenzie, D.P., 1978, Some remarks on the development of sedimentary basins: Earth and Planetary Science Let-ters, v. 40, p. 25–32.
Miller, K.G., Kominz, M.A., Browning, J.V., Wright, J.D., Mountain, G.S., Katz, M.E., Sugarman, P.J., Cramer, B.S., Christie-Blick, N., and Pekar, S.F., 2005, The Phanerozoic record of global sea-level change: Science, v. 310, p. 1293–1298, doi: 10.1126/science.1116412.
Moucha, R., Forte, A.M., Mitrovica, J.X., Rowley, D.B., Quéré, S., Simmons, N.A., and Grand, S.P., 2008, Dy-namic topography and long-term sea-level variations: There is no such thing as a stable continental platform: Earth and Planetary Science Letters, v. 271, p. 101–108, doi: 10.1016/j.epsl.2008.03.056.
Muffl er, J.L.P., and White, D.E., 1969, Active metamorphism of the upper Cenozoic sediments in the Salton Sea
geothermal fi eld and the Salton Trough, southern Cali-fornia: Geological Society of America Bulletin, v. 80, p. 157–182, doi: 10.1130/0016-7606(1969)80[157:AMOUCS]2.0.CO;2.
Muto, T., and Steel, R.J., 1992, Retreat of the front in a prograding delta: Geology, v. 20, p. 967–970, doi: 10.1130/0091-7613(1992)020<0967:ROTFIA>2.3.CO;2.
Muto, T., and Steel, R.J., 2001, Auto-stepping during the transgressive growth of deltas: Results from fl ume experiments: Geology, v. 29, p. 771–774, doi: 10.1130/0091-7613(2001)029<0771:ADTTGO>2.0.CO;2.
Muto, T., and Steel, R.J., 2002, In defense of shelf-edge delta development during falling and lowstand of relative sea level: The Journal of Geology, v. 110, p. 421–436, doi: 10.1086/340631.
Nicholson, C., Sorlien, C.C., Atwater, T., Crowell, J.C., and Luyendyk, B.P., 1994, Microplate capture, rotation of the western Transverse Ranges, and initiation of the San Andreas transform as a low-angle fault system: Geology, v. 22, p. 491–495, doi: 10.1130/0091-7613(1994)022<0491:MCROTW>2.3.CO;2.
Opdyke, N.D., Lindsay, E.H., Johnson, N.M., and Downs, T., 1977, The paleomagnetism and magnetic polarity stratigraphy of the mammal-bearing section of Anza Borrego State Park, California: Quaternary Research, v. 7, p. 316–329, doi: 10.1016/0033-5894(77)90024-2.
Oskin, M., and Stock, J.M., 2003a, Marine incursion syn-chronous with plate-boundary localization in the Gulf of California: Geology, v. 31, p. 23–26, doi: 10.1130/0091-7613(2003)031<0023:MISWPB>2.0.CO;2.
Oskin, M., and Stock, J.M., 2003b, Pacifi c–North America plate motion and opening of the Upper Delfín basin, northern Gulf of California: Geological Society of America Bulletin, v. 115, p. 1173–1190, doi: 10.1130/B25154.1.
Oskin, M., Stock, J., and Martín-Barajas, A., 2001, Rapid localization of Pacifi c–North America plate motion in the Gulf of California: Geology, v. 29, p. 459–462, doi: 10.1130/0091-7613(2001)029<0459:RLOPNA>2.0.CO;2.
Paola, C., Heller, P.L., and Angevine, C.L., 1992, The large-scale dynamics of grain-size variation in alluvial ba-sins; 1. Theory: Basin Research, v. 4, p. 73–90.
Persaud, P., Stock, J.M., Steckler, M.S., Martin-Barajas, A., Diebold, J.B., Gonzalez-Fernandez, A., and Mountain, G.S., 2003, Active deformation and shallow structure of the Wagner, Consag, and Delfi n basins, northern Gulf of California, Mexico: Journal of Geophysical Research, v. 108, doi: 10.1029/2002JB001937.
Pinault, C.T., 1984, Structure, Tectonic Geomorphology and Neotectonics of the Elsinore Fault Zone between Ban-ner Canyon and the Coyote Mountains, Southern Cali-fornia [M.S. thesis]; San Diego, California, San Diego State University, 231 p.
Pitman, W.C., and Andrews, J.A., 1985, Subsidence and thermal history of small pull- apart basins, in Biddle, K.T., and Christie-Blick, N., eds., Strike-Slip Deforma-tion, Basin Formation, and Sedimentation: Society of Economic Paleontologists and Mineralogists Special Publication 37, p. 45–50.
Porebski, S.J., and Steel, R.J., 2006, Deltas and sea-level change: Journal of Sedimentary Research, v. 76, p. 390–403, doi: 10.2110/jsr.2006.034.
Posamentier, H.W., Jervey, M.T., and Vail, P.R., 1988, Eu-static controls on clastic deposition: I. Conceptual framework, in Wilgus, C.K., Hastings, B.S., Kendall, C.G.St.C., Posamentier, H.W., Ross, C.A., and Van Wagoner, J.C., eds., Sea-Level Changes: An Integrated Approach: Society of Economic Paleontologists and Mineralogists Special Publication 42, p. 109–124.
Powell, R.E., 1981, Geology of the Crystalline Basement Complex, Eastern Transverse Ranges, Southern Cali-fornia: Constraints on Regional Tectonic Interpretation [Ph.D. thesis]: Pasadena, California, California Insti-tute of Technology, 441 p.
Powell, R.E., 1993, Balanced palinspastic reconstruction of pre–late Cenozoic paleogeology, southern California: Geologic and kinematic constraints on evolution of the San Andreas fault system, in Powell, R.E., Wel-don, R.J., and Matti, J.C., eds., The San Andreas Fault
on March 29, 2011gsabulletin.gsapubs.orgDownloaded from
Late Cenozoic basin development, southern California
Geological Society of America Bulletin, May/June 2011 793
System: Displacement, Palinspastic Reconstruction, and Geologic Evolution: Geological Society of Amer-ica Memoir 178, p. 1–106.
Powell, R.E., and Weldon, R.J., II, 1992, Evolution of the San Andreas fault: Annual Review of Earth and Plane-tary Sciences, v. 20, p. 431–468, doi: 10.1146/annurev.ea.20.050192.002243.
Ruisaard, C.I., 1979, Stratigraphy of the Miocene Alverson For-mation, Imperial County, California [M.S. Thesis]: San Diego, California, San Diego State University, 125 p.
Rymer, M.J., Sarna-Wojcicki, A.M., Powell, C.L., and Barron, J.A., 1994, Stratigraphic evidence for late Miocene opening of the Salton Trough in southern California: Geological Society of America Abstracts with Programs, v. 26, no. 2, p. 87.
Rymer, M.J., Powell, C.L., Sarna-Wojcicki, A.M., II, and Barron, J.A., 1995, Late Miocene stratigraphic and paleogeographic setting of Garnet Hill in the north-western Salton Trough, Southern California: American Association of Petroleum Geologists (AAPG) Pacifi c Section Meeting Abstracts, v. 79, no. 4, p. 596.
Sarna-Wojcicki, A.M., Bowman, H.R., Meyer, C.E., Rus-sell, P.C., Woodward, M.J., McCoy, G., Rowe, J.J., Jr., Baedecker, P.A., Asarao, F., and Michael, H., 1984, Chemical Analyses, Correlations, and Ages of Upper Pliocene and Pleistocene Ash Layers of East-Central and Southern California: U.S. Geological Survey Pro-fessional Paper 1293, 40 p.
Sarna-Wojcicki, A.M., Meyer, C.E., Wan, E., and Soles, S., 1997, Age and correlation of tephra layers, position of the Matuyama-Brunhes chron boundary, and ef-fects of Bishop ash eruption on Owens Lake, as deter-mined from drill core OL-92, southeast California, in Smith, G.I., and Bischoff, J.L., eds., An 800,000-Year Paleoclimatic Record from Core OL-92, Owens Lake, Southeast California: Geological Society of America Special Paper 317, p. 79–90.
Sarna-Wojcicki, A.M., Reheis, M.C., Pringle, M.S., Fleck, R.J., Burbank, D., Meyer, C.E., Slate, J.L., Wan, E., Budahn, J.R., Troxel, B., and Walker, J.P., 2005, Tephra Layers of Blind Spring Valley and Related Upper Pliocene and Pleistocene Tephra Layers, California, Nevada, and Utah: Isotopic Ages, Correlation, and Magnetostratigraphy: U.S. Geological Survey Profes-sional Paper 1701, 63 p.
Schärer, U., 1984, The effect of initial 230Th disequilibrium on young U-Pb ages: The Makalu case, Himalaya: Earth and Planetary Science Letters, v. 67, p. 191–204, doi: 10.1016/0012-821X(84)90114-6.
Schmitt, A.K., and Vazquez, J.A., 2006, Alteration and re-melting of nascent oceanic crust during continental rupture: Evidence from zircon geochemistry of rhyo-lites and xenoliths from the Salton Trough, California: Earth and Planetary Science Letters, v. 252, p. 260–274, doi: 10.1016/j.epsl.2006.09.041.
Schmitz, M.D., and Bowring, S.A., 2001, U-Pb zircon and titanite systematics of the Fish Canyon Tuff: An as-sessment of high-precision U-Pb geochronology and its application to young volcanic rocks: Geochimica et Cosmochimica Acta, v. 65, no. 15, p. 2571–2587, doi: 10.1016/S0016-7037(01)00616-0.
Sclater, J.G., and Christie, P.A.F., 1980, Continental stretch-ing: An explanation of the post–Mid-Cretaceous sub-sidence of the Central North Sea Basin: Journal of Geophysical Research, v. 85, no. B7, p. 3711–3739, doi: 10.1029/JB085iB07p03711.
Seeber, L., Sorlien, C., Steckler, M., and Cormier, M.H., 2010, Continental transform basins: Why are they
asymmetric?: Eos, v. 91, no. 4, p. 29–30, doi: 10.1029/2010EO040001.
Severinghaus, J., and Atwater, T.M., 1990, Cenozoic geometry and thermal state of the subducting slabs beneath North America, in Wernicke, B.P., ed., Basin and Range Exten-sional Tectonics Near the Latitude of Las Vegas: Geologi-cal Society of America Memoir 176, p. 1–22.
Sharp, R.V., 1967, San Jacinto fault zone in the Peninsu-lar Ranges of southern California: Geological So-ciety of America Bulletin, v. 78, p. 705–729, doi: 10.1130/0016-7606(1967)78[705:SJFZIT]2.0.CO;2.
Shirvell, C., 2006, Pliocene Exhumation along the West Salton Detachment System and Tectonic Evolution of the Fish Creek–Vallecito Supradetachment Basin, Salton Trough, Southern California [M.S. thesis]: Los Angeles, University of California, 133 p.
Shirvell, C.R., Stockli, D.F., Axen, G.J., and Grove, M., 2009, Miocene-Pliocene exhumation along the west Salton detachment fault, southern California, from (U-Th)/He thermochronometry of apatite and zircon: Tec-tonics, v. 28, p. TC2006, doi: 10.1029/2007TC002172.
Spasojevic, S., Liu, L., Gurnis, M., and Müller, R.D., 2008, The case for dynamic subsidence of the U.S. East Coast since the Eocene: Geophysical Research Letters, v. 35, p. L08305, doi: 10.1029/2008GL033511.
Spencer, J.E., and Normark, W.R., 1979, Tosco-Abreojos fault zone: A Neogene transform plate boundary within the Pacifi c margin of southern Baja California: Geology, v. 7, p. 554–557, doi: 10.1130/0091-7613(1979)7<554:TFZANT>2.0.CO;2.
Steely, A.N., 2006, The Evolution from Late Miocene West Salton Detachment Faulting to Cross-Cutting Pleis-tocene Oblique Strike Slip Faults in the SW Salton Trough, Southern California [M.S. thesis]: Logan, Utah, Utah State University, 3 plates, 238 p.
Steely, A.N., Janecke, S.U., Dorsey, R.J., and Axen, G.J., 2009, Early Pleistocene initiation of the San Felipe fault zone, SW Salton Trough, during reorganization of the San Andreas fault system: Geological Society of America Bulletin, v. 121, p. 663–687, doi: 10.1130/B26239.1.
Steiger, R.H., and Jäger, E., 1977, Subcommission on Geochronology: Convention on the use of decay constants in geo- and cosmochronology: Earth and Planetary Science Letters, v. 36, p. 359–362, doi: 10.1016/0012-821X(77)90060-7.
Stock, J.M., and Hodges, K.V., 1989, Pre-Pliocene extension around the Gulf of California and the transfer of Baja California to the Pacifi c plate: Tectonics, v. 8, p. 99–115, doi: 10.1029/TC008i001p00099.
Tera, F., and Wasserburg, G., 1972, U-Th-Pb systematics in three Apollo 14 basalts and the problem of initial Pb in lunar rocks: Earth and Planetary Science Letters, v. 14, p. 281–304, doi: 10.1016/0012-821X(72)90128-8.
Todd, V.R., 2004, Preliminary Geologic Map of the El Cajon 30′ × 60′ Quadrangle, Southern California, Version 1.0: U.S. Geological Survey Open-File Report 2004–1361, scale 1:100,000.
van der Woerd, J., Klinger, Y., Sieh, K., Tapponnier, P., Ryer-son, F.J., and Mériaux, A.S., 2006, Long-term slip rate of the southern San Andreas fault from 10 Be–26 Al surface exposure dating of an offset alluvial fan: Jour-nal of Geophysical Research, v. 111, p. B04407, doi: 10.1029/2004JB003559.
Van Hinte, J.E., 1978, Geohistory analysis—Application of micropaleontology in exploration geology: American Association of Petroleum Geologists Bulletin, v. 62, p. 201–222.
Van Sickel, W.A., Kominz, M.A., Miller, K.G., and Brown-ing, J.V., 2004, Late Cretaceous and Cenozoic sea-level estimates: Backstripping analysis of borehole data, on-shore New Jersey: Basin Research, v. 16, p. 451–465, doi: 10.1111/j.1365-2117.2004.00242.x.
Van Wagoner, J.C., Mitchum, R.M., Campion, K.M., and Rahmanian, V.D., 1990, Siliciclastic Sequence Stra-tigraphy in Well Logs, Cores, and Outcrops: Concepts for High-Resolution Correlation of Time and Facies: American Association of Petroleum Geologists, Meth-ods in Exploration Series 7, 55 p.
Weldon, R.J., II, Meisling, K.E., and Alexander, J., 1993, A speculative history of the San Andreas fault in the central Transverse Ranges, California, in Powell, R.E., Weldon, R.J., II, and Matti, J.C., eds., The San Andreas Fault System: Displacement, Palinspastic Reconstruc-tion, and Geologic Evolution: Geological Society of America Memoir 178, p. 161–198.
Williams, I.S., 1998, U-Th-Pb geochronology by ion mi-croprobe, in McKibben, M.A., Shanks III, W.C., and Ridley, W.I., eds., Applications of Microanalytical Techniques to Understanding Mineralizing Processes: Reviews in Economic Geology, v. 7, p. 1–35.
Wilson, D.S., McCrory, P.A., and Stanley, R.G., 2005, Implications of volcanism in coastal California for the Neogene deformation history of western North America: Tectonics, v. 24, p. TC3008, doi: 10.1029/2003TC001621.
Winker, C.D., 1987, Neogene Stratigraphy of the Fish Creek–Vallecito section, Southern California: Implica-tions for Early History of the Northern Gulf of Cali-fornia and the Colorado Delta [Ph.D. thesis]: Tucson, University of Arizona, 494 p.
Winker, C.D., and Kidwell, S.M., 1986, Paleocurrent evi-dence for lateral displacement of the Pliocene Colo-rado River delta by the San Andreas fault system, southeastern: California Geology, v. 14, p. 788–791.
Winker, C.D., and Kidwell, S.M., 1996, Stratigraphy of a marine rift basin: Neogene of the western Salton Trough, California, in Abbott, P.L., and Cooper, J.D., eds., Field Conference Guidebook and Volume for the American Association of Petroleum Geologists Annual Convention: American Association of Petroleum Ge-ologists: Bakersfi eld, California, p. 295–336.
Woodard, G.D., 1963, The Cenozoic Succession of the West Colorado Desert, San Diego and Imperial Counties, Southern California [Ph.D. thesis]: Berkeley, Univer-sity of California, 494 p.
Woodard, G.D., 1974, Redefi nition of Cenozoic strati-graphic column in Split Mountain Gorge, Imperial Valley, California: The American Association of Petro-leum Geologists Bulletin, v. 58, p. 521–539.
Xie, X., and Heller, P.L., 2009, Plate tectonics and basin sub-sidence history: Geological Society of America Bulle-tin, v. 121, p. 55–64.
MANUSCRIPT RECEIVED 3 SEPTEMBER 2009REVISED MANUSCRIPT RECEIVED 17 MARCH 2010MANUSCRIPT ACCEPTED 18 MARCH 2010
Printed in the USA
on March 29, 2011gsabulletin.gsapubs.orgDownloaded from