Embed Size (px)
Citation preview

Stratford-on-Avon Strategic Transport Assessment: Further Focused Assessment of Development Options in the Stratford-upon-Avon & Southam areas
July 2015


Contents
1 INTRODUCTION .......................................................................................................... 3
Objectives .................................................................................................................. 3 Stratford-upon-Avon Focussed Objectives ......................................................... 3 Southam Focussed Objectives ........................................................................... 4
Background ................................................................................................................ 5 Stratford-upon-Avon Focus ............................................................................... 5 South of Stratford Sensitivity Test ..................................................................... 6 Southam Focus ................................................................................................. 6
Report Structure ........................................................................................................ 6
2 METHODLOGY............................................................................................................ 8
Stratford-upon-Avon Focus ........................................................................................ 8 Southam Focus ........................................................................................................... 9
3 STRATFORD FOCUSSED SCENARIO OVERVIEW ........................................................... 10
Stratford Reference Case Amendments .................................................................... 10 Stratford Transport Package............................................................................ 10
Stratford-upon-Avon Employment Options ............................................................... 11 Stratford-upon-Avon Residential Options ................................................................. 12 Stratford-upon-Avon Strategic Options ..................................................................... 12
Strategic Scenario 01 ...................................................................................... 13 Strategic Scenarios 02 to 05 ............................................................................ 14 Relief Road Alignments ................................................................................... 14
Trip Generation and Trip Distribution ....................................................................... 15
4 SOUTHAM FOCUSSED SCENARIO OVERVIEW ............................................................. 19
Reference Case Amendments ................................................................................... 19 Southam Focussed Options ...................................................................................... 19
5 STRATFORD FOCUSSED ANALYSIS ............................................................................. 22
Results Overview ..................................................................................................... 22 Scenario Comparisons ..................................................................................... 23
Employment Options Analysis .................................................................................. 23 Employment Option Analysis- Initial Summary ................................................ 24 Employment Option Analysis- Initial Conclusions ............................................. 25
Residential Options Analysis ..................................................................................... 26 Residential Option Analysis- Initial Summary ................................................... 27 Residential Option Analysis- Initial Conclusions ............................................... 28 Residential Option Analysis – Additional Considerations .................................. 29
Strategic Options Analysis ........................................................................................ 30 Strategic Options Analysis – Initial Summary ................................................... 34 Strategic Options Analysis – Initial Conclusions ................................................ 36
Strategic Scenarios Analysis - Additional Considerations .................................. 37
6 SOUTHAM FOCUSSED ANALYSIS ............................................................................... 39
Results Overview ..................................................................................................... 39 Southam Focussed Option Analysis ........................................................................... 39
Southam Focussed Options Analysis – Initial Summary .................................... 42 Warwick and Leamington Impact Analysis ................................................................ 43
Warwick and Leamington Impact Analysis Summary ....................................... 45 Southam Focussed Analysis – Conclusions ................................................................ 45 Southam Focussed Analysis – Additional Considerations ........................................... 46
7 SUMMARY AND CONCLUSIONS ................................................................................ 48
Summary ................................................................................................................. 48 Scenarios – Stratford Focus ............................................................................. 49 Scenarios – Southam Focus ............................................................................. 51
Conclusion ............................................................................................................... 52 Stratford Focussed Assessment ....................................................................... 52 Southam Focussed Assessment ....................................................................... 55
Recommendations and Additional Considerations .................................................... 56 Stratford Focus – Additional Considerations .................................................... 56 Southam Focus – Additional Considerations .................................................... 58

1 INTRODUCTION
1.1 Vectos Microsim (VM) has been commissioned by Stratford District Council (SDC) and
Warwickshire County Council (WCC) to update the recently completed Strategic Transport
Assessment (STA) work which looks at the impacts of the allocation of various options
pertaining to the delivery of housing and employment within Stratford-on-Avon.
1.2 This report and the analysis presented herein focusses specifically on the options for
allocating housing and employment within the Stratford-upon-Avon and Southam areas.
Objectives
1.3 The objectives of this assessment are split and depend entirely on the area of the
assessment focus. There are distinct objectives associated with assessments concerning the
allocation of growth in the areas around the towns of Stratford-upon-Avon and Southam. As
a result two assessments have been run in tandem, one focussed on the issues around
Stratford-upon-Avon and the other focussed on the issues around Southam and on the
routes between Southam and the towns of Warwick and Leamington.
1.4 The objectives for each of these discrete assessments are summarised as follows:
Stratford-upon-Avon Focussed Objectives
To update the original Stratford-upon-Avon assessment work in light of
developments that have occurred since that point, in particular the inclusion of two
new committed developments and associated mitigation measures.
To assess in more detail, 3 options for allocating employment around the area of
Stratford-upon-Avon, specifically:
Allocation of 10 Ha of employment to the north near the A46/Alcester Road
roundabout.
Allocation of 20 Ha of employment to the north near the A46/Alcester Road
roundabout.
Allocation of 10 Ha of employment to the north near the A46/Alcester Road
roundabout and allocation of 10 Ha of employment to the south accessed via
the A3400.

To assess, in more detail, revisions to the strategy for allocating housing within the
immediate area of the town, focussing specifically on the following options:
Allocation of 650 dwellings in an area to the north of the river Avon, focussing
to the north of Stratford-upon-Avon and 650 dwellings in the area identified as
the Stratford Regeneration Zone (SRZ).
Allocation of 650 dwellings in an area to the south of the river, focussing to the
south east of Stratford-upon-Avon and 650 dwellings in the area identified as
the SRZ.
Allocation of 650 dwellings to the north of the river, with the area identified as
the SRZ being retained for employment use.
Allocation of 650 dwellings to the south of the river, with the area identified as
the SRZ being retained for employment use.
To assess, in more detail, the implications of four options for allocating strategic
housing development in the Stratford-upon-Avon area, in addition to the housing
and employment identified during the previous phases of assessment, specifically:
Allocation of 2,750 dwellings to the southeast of Stratford-upon-Avon in land
parcels around Banbury Road, Loxley Road and Trinity Way.
Allocation of 3,500 dwellings in the area of Long Marston Airfield (LMA).
Allocation of 800 dwellings in the area of Meon Vale.
Allocation of 1,600 dwellings in the area of Wellesbourne Airfield.
Southam Focussed Objectives
To update the original assessment work in the Southam area in light of the
recalibration and revalidation of the extended M40 Paramics model, completed in
August/September 2014.
To assess in more detail, the incremental impact of allocating housing in the
Southam area by assigning demands equivalent to 1,000 dwelling at intervals
between 1,000 and 3,000 dwellings.
To use the M40 model to identify areas likely to come under additional stress as a
result of the allocation of housing in the Southam area and, where possible,
identify potential mitigation measures.
To utilise linkages between the M40 model and the Warwick and Leamington Wide
Area (WLWA) model to identify what additional areas, as covered by the WLWA
model, may require mitigation.
Background
1.5 This work is intended to revisit the earlier phases of the Strategic Transport Assessment work
and, therefore, it is recommended that it is considered in conjunction with the existing
evidence base. In particular, the Stratford-on-Avon Strategic Transport Assessment – Options
Analysis Report (June 2014) should be taken into account since this work has been
undertaken in a consistent manner with that, earlier study.
Stratford-upon-Avon Focus
1.6 Since the previous work was completed, there have been permissions granted for the
delivery of an additional 550 houses at the Meon Vale site and also 380 dwellings at the
adjacent Codex Sims Metals site, both of which provide infrastructure updates. It was
therefore considered pertinent that the assessment account for these changes in addition to
the revised allocation strategies. The main changes relevant to this assessment include:
The introduction of signal proposals at the Clifford Lane/Shipston Road (Waitrose)
Roundabout.
The introduction of signal proposals at either end of Clopton Bridge. The signals to
the south of the bridge focus on the Tiddington Road/Swans Nest Lane/Clopton
Bridge junction and, as well as introducing an element of signal control, enabling
traffic from Tiddington Road to turn right as they exit (removing the u-turn
manoeuvre that is currently made at the Shipston Road/Banbury Road
roundabout). The signals to the north enable the management of flow away from
the bridge and also introduces additional stacking capacity along the Bridgefoot SB
approach to the junction with Clopton Bridge.
1.7 These schemes were included within the modelling alongside the development trip
generation figures to form a new Reference Case.
South of Stratford Sensitivity Test
1.8 The findings from an isolated sensitivity test which assessed the impacts of allocating
housing around the south west of Stratford are reviewed in conjunction with this work.
1.9 This work identified the maximum threshold for allocating housing to the south west of
Stratford-upon-Avon, within the capacity constraints of the proposed scheme for either end
of Clopton Bridge. This work concluded that allocating a level of housing beyond 650
dwellings would likely result in severe impacts, specifically in terms of impacts on Shipston
Road and Tiddington Road queues.
1.10 It also identified that allocating 650 dwellings southeast of Stratford town centre, would
likely induce increases in the level of queued traffic on Tiddington Road and that it is unlikely
that these impacts can be mitigated without significant revisions to the mitigation proposals
within the area.
1.11 The full Technical Note outlining these findings is provided within Appendix A.
Southam Focus
1.12 Since the previous work was undertaken, the M40 model has been recalibrated and
validated in a manner which addressed the underlying issues identified during the previous
phase of analysis. Updates have focussed specifically on the highway calibration parameters
and the assignment of new and existing trips associated with the extant permissions in place
at the Jaguar Land Rover (JLR) and Aston Martin Lagonda (AML) employment zones.
1.13 The assessment pertaining to the impacts of allocating housing in the Southam area was
therefore based on the updated M40 Paramics model.
Report Structure
1.14 The remainder of this report is set out as follows:
Section 2 – Documents the methodology.
Section 3 – Provides an overview of the Stratford-upon-Avon assessment.
Section 4 – Provides an overview of the Southam assessment.
Section 5 – Presents the outputs from the Stratford-upon-Avon focussed
assessment.

Section 6 – Presents the findings from the Southam focussed assessment.
Section 7 – Provides the summary and conclusions arising from the work alongside
the recommendations for consideration in any additional stages of assessment.
2 METHODLOGY
2.1 The two phases of the assessment have been dealt with via discrete modelling exercises,
both of which have been based on updated Forecast models. An overview of the
methodology adopted for both assessments is provided within the following section of this
report.
Stratford-upon-Avon Focus
2.2 The methodology for completing the assessment of the impacts of allocating housing and
employment around the area of Stratford-upon-Avon was as follows:
1) The Stratford-upon-Avon 2031 forecast Paramics model was updated to include the
developments outlined within section 1.6 of this Report.
2) Once updated, the employment options were identified and the appropriate trip
generation figures established for assignment within the Paramics model.
3) The impact of the employment options were reviewed.
4) Two employment options were then taken forward within the reference case to
underpin the assessment of 4 residential options for the allocation of up to 1300
dwellings in close proximity to Stratford town centre.
5) The impacts of the residential options were then reviewed.
6) A single residential option was then adopted to form the basis of the assessment of
up to 4 strategic options for allocating a range of housing numbers across 4 distinct
areas.
2.3 In cases where options were taken forward to underpin subsequent stages of assessment,
options were chosen on the basis that they delivered higher growth levels with lower levels
of impact than alternative options. The selection and retention in subsequent stages of
assessment is intended to ensure that the growth assumptions are robust, it does not infer
the adoption of one or other option in favour of alternatives.
2.4 It should be acknowledged that testing of multiple combinations would be extremely
resource intensive and yield little in the way of additional evidence compared to that which
has been presented within the remainder of this report.

Southam Focus
2.5 The methodology for completing the assessment of the impacts of allocating housing in the
Southam area made use of the M40 Paramics model and involved the assignment of housing
around the Southam area in increments of 1,000 dwellings, specifically 1,000, 2,000 and
3,000 dwellings.
3 STRATFORD FOCUSSED SCENARIO OVERVIEW
3.1 The assessment of impacts within the Stratford-upon-Avon area made use of the Stratford-
upon-Avon Paramics model and involved the development of a number of specific model
scenarios. These are outlined within the following section of this Report.
Stratford Reference Case Amendments
3.2 The original 2031 Reference conditions were documented within the Stratford-on-Avon
Strategic Transport Assessment – Options Analysis Report (June 2014, Section 3.2).
3.3 This model was then updated to account for the delivery of an additional 550 houses at the
Meon Vale site and 380 dwellings at the adjacent Codex Sims Metals site alongside the
following network changes:
The introduction of signal proposals at the Clifford Lane/Shipston Road (Waitrose)
Roundabout.
The introduction of signal proposals at either end of Clopton Bridge. The signals to
the south of the Bridge focus on the Tiddington Road/Swans Nest Lane/Clopton
Bridge junction and, as well as introducing an element of signal control, enable
traffic from Tiddington Road to turn right as they exit (removing the u-turn
manoeuvre that is currently made at the Shipston Road/Banbury Road
roundabout). The signals to the north enable the management of flow away from
the bridge and also introduces additional stacking capacity along the Bridgefoot SB
approach to the junction with Clopton Bridge.
Stratford Transport Package
3.4 The Stratford Transport Package comprises a series of mitigation measures identified to
accommodate growth in traffic within the area of Stratford-upon-Avon whilst minimising the
potential impacts. There are further details pertaining to the Stratford Transport Package
provided within the Stratford-on-Avon Strategic Transport Assessment: Stratford (Canal
Quarter) Regeneration Zone Scenario Analysis Report (June 2013, Section 3.2.7) and the
Stratford-on-Avon Strategic Transport Assessment: S-Paramics Modelling Report (October
2012, Section 8.3).
3.5 Two Reference Case scenarios have been created:
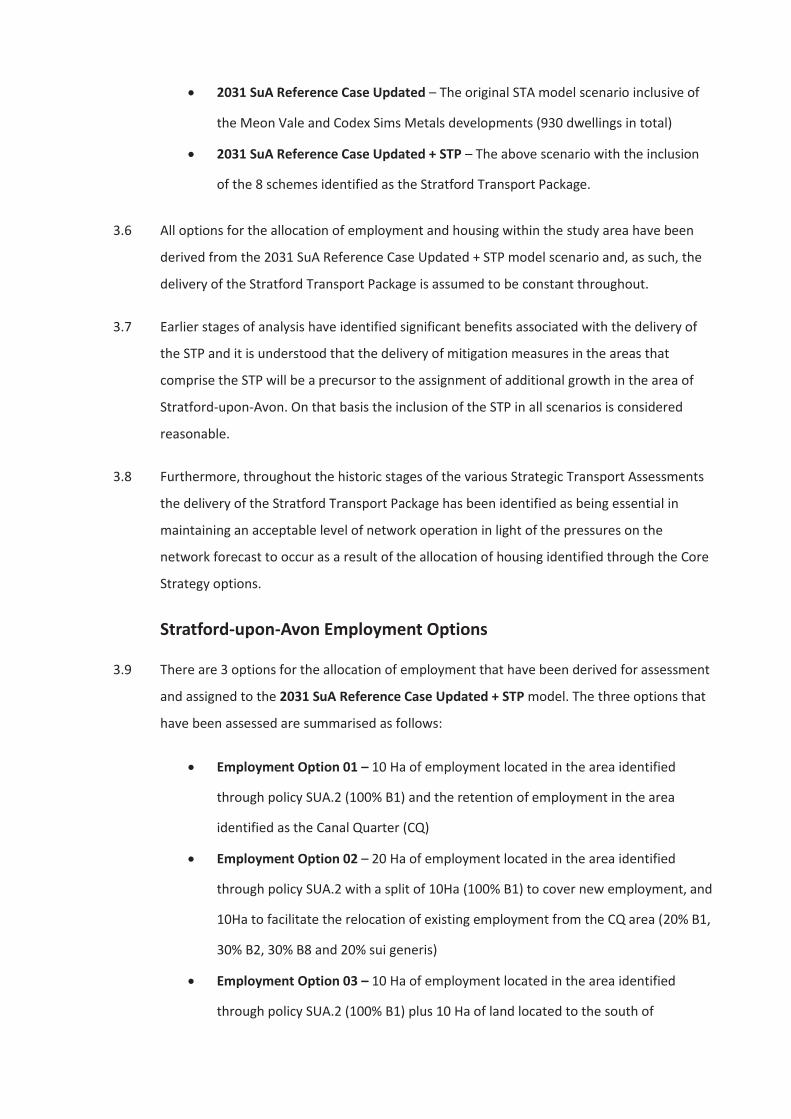
2031 SuA Reference Case Updated – The original STA model scenario inclusive of
the Meon Vale and Codex Sims Metals developments (930 dwellings in total)
2031 SuA Reference Case Updated + STP – The above scenario with the inclusion
of the 8 schemes identified as the Stratford Transport Package.
3.6 All options for the allocation of employment and housing within the study area have been
derived from the 2031 SuA Reference Case Updated + STP model scenario and, as such, the
delivery of the Stratford Transport Package is assumed to be constant throughout.
3.7 Earlier stages of analysis have identified significant benefits associated with the delivery of
the STP and it is understood that the delivery of mitigation measures in the areas that
comprise the STP will be a precursor to the assignment of additional growth in the area of
Stratford-upon-Avon. On that basis the inclusion of the STP in all scenarios is considered
reasonable.
3.8 Furthermore, throughout the historic stages of the various Strategic Transport Assessments
the delivery of the Stratford Transport Package has been identified as being essential in
maintaining an acceptable level of network operation in light of the pressures on the
network forecast to occur as a result of the allocation of housing identified through the Core
Strategy options.
Stratford-upon-Avon Employment Options
3.9 There are 3 options for the allocation of employment that have been derived for assessment
and assigned to the 2031 SuA Reference Case Updated + STP model. The three options that
have been assessed are summarised as follows:
Employment Option 01 – 10 Ha of employment located in the area identified
through policy SUA.2 (100% B1) and the retention of employment in the area
identified as the Canal Quarter (CQ)
Employment Option 02 – 20 Ha of employment located in the area identified
through policy SUA.2 with a split of 10Ha (100% B1) to cover new employment, and
10Ha to facilitate the relocation of existing employment from the CQ area (20% B1,
30% B2, 30% B8 and 20% sui generis)
Employment Option 03 – 10 Ha of employment located in the area identified
through policy SUA.2 (100% B1) plus 10 Ha of land located to the south of
Stratford-upon-Avon, near Atherstone Airfield, to facilitate the relocation of
employment from the CQ area (20% B1, 30% B2, 30% B8 and 20% sui generis)
Stratford-upon-Avon Residential Options
3.10 Once the employment options had been fully defined, it was then necessary to develop the
residential options. The analysis presented within the later sections of this report revealed
that the allocation of employment north of the river was prone to a lower level of impact
than allocating employment to the land in the south. Therefore the residential options were
derived from the scenarios which allocated employment wholly in the north, be that split
between the CQ and SUA.2 land or entirely within the boundary of SUA.2.
3.11 The inclusion of employment land at the CQ was dependent upon whether or not the area of
the CQ was allocated for housing through the Stratford Regeneration Zone (SRZ) policy.
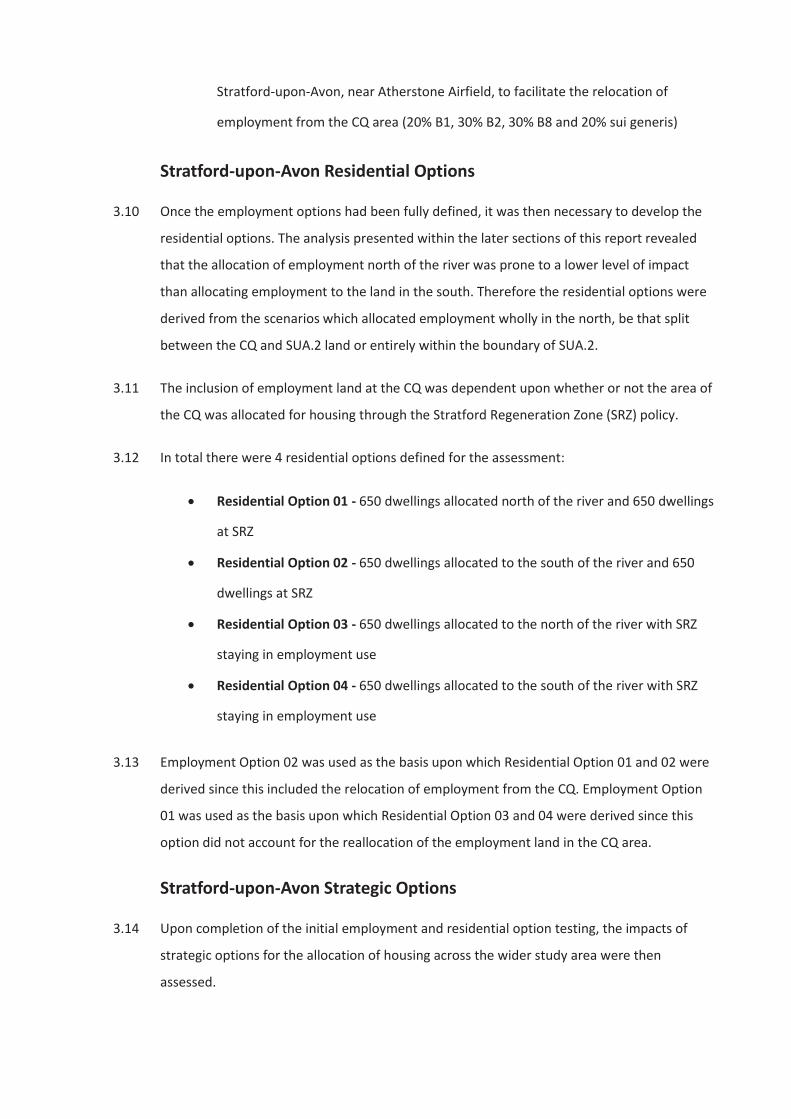
3.12 In total there were 4 residential options defined for the assessment:
Residential Option 01 - 650 dwellings allocated north of the river and 650 dwellings
at SRZ
Residential Option 02 - 650 dwellings allocated to the south of the river and 650
dwellings at SRZ
Residential Option 03 - 650 dwellings allocated to the north of the river with SRZ
staying in employment use
Residential Option 04 - 650 dwellings allocated to the south of the river with SRZ
staying in employment use
3.13 Employment Option 02 was used as the basis upon which Residential Option 01 and 02 were
derived since this included the relocation of employment from the CQ. Employment Option
01 was used as the basis upon which Residential Option 03 and 04 were derived since this
option did not account for the reallocation of the employment land in the CQ area.
Stratford-upon-Avon Strategic Options
3.14 Upon completion of the initial employment and residential option testing, the impacts of
strategic options for the allocation of housing across the wider study area were then
assessed.
3.15 As with the analysis of the employment options, analysis of the residential options revealed
that allocation of development to the north was favourable over the allocation of housing to
the south of the river. Since all but one of the strategic options involved the allocation of
housing to the south, it was decided that all of the strategic options would be based on
Residential Option 01 since this scenario allocated the largest amount of housing but still
suffered a lower level of impact than Residential Options 02 and 04.
3.16 Initially SDC advised that the following strategic scenarios were to be tested within the SuA
Paramics model:
Strategic Scenario 01 – Allocation of 500 dwellings to the north of Stratford in land
between the A46 and Bishopton Lane.
Strategic Scenario 02 - Allocation of 2,750 dwellings to the southeast of Stratford-
upon-Avon in land parcels around Banbury Road, Loxley Road and Trinity Way,
alongside an eastern relief road.
Strategic Scenario 03 - Allocation of 3,500 dwellings in the area of Long Marston
Airfield (LMA) alongside a South-western relief road.
Strategic Scenario 04 - Allocation of 800 dwellings in the area of Meon Vale.
Strategic Scenario 05 - Allocation of 1,600 dwellings in the area of Wellesbourne
Airfield.
Strategic Scenario 01
3.17 There was a broad similarity between Strategic Scenario 01 and Residential Option 01 and 03
insofar as both residential options include an amount of housing delivered to the north of
Stratford-upon-Avon (albeit in broad locations) which is essentially mirrored within Strategic
Scenario 01.
3.18 On that basis it was determined that the impacts likely to be identified in the analysis of this
strategic option would mirror those identified during the earlier phase of residential testing.
3.19 As a result, it was concluded that any of the findings which arose as a result of the testing of
Residential Options 01 and 03 would be applicable to the assessment of Strategic Scenario
01 and, therefore, no further testing of the impacts of allocating housing to the north of the
river, at the quantum identified by SDC, was necessary.

Strategic Scenarios 02 to 05
3.20 Aside from Strategic Scenario 01, it was considered appropriate to take each of the
alternative options forward for further, more detailed, analysis.
3.21 Strategic Options 02 and 03 were assumed to be centred on the delivery of either an Eastern
or South-Western Relief Road. Both options closely align with the options tested during the
previous stage of the Strategic Transport Assessment, specifically the South East Stratford
and Long Marston Airfield assessments. As such, assumptions pertaining to the delivery of
either the Eastern or South-Western Relief Road were consistent with that previous stage of
the assessment.
3.22 In total two or three variations of each scenario were created, depending upon the status of
the Relief Roads, as follows:
Do Nothing – assignment of the development demands only.
Do Minimum – The Do Nothing with the addition of the Eastern or South-Western
Relief Roads. (Scenario 02 & 03 only).
Do Something – The Do Minimum with additional, development specific,
mitigation.
Relief Road Alignments
3.23 There are two broad alignments for the Relief Roads, the principle of both is to provide a
third point for traffic to cross the River Avon.
3.24 SDC have advised that there is a greater degree of uncertainty at the present time
surrounding the delivery of the Eastern Relief Road (ERR) than the South-Western Relief
Road (SWRR) which should be a material concern when assessing the relative merits of both
options. The SWRR is, at this stage, considered a more realistic option as it is being actively
promoted as an integral part of a development option.
3.25 The SWRR involves the delivery of a route between Shipston Road to the south of Stratford
and the Western Relief Road at Evesham Road which is to be delivered as part of the 800
dwellings consented in the West of Shottery area, which then connects to the A46.
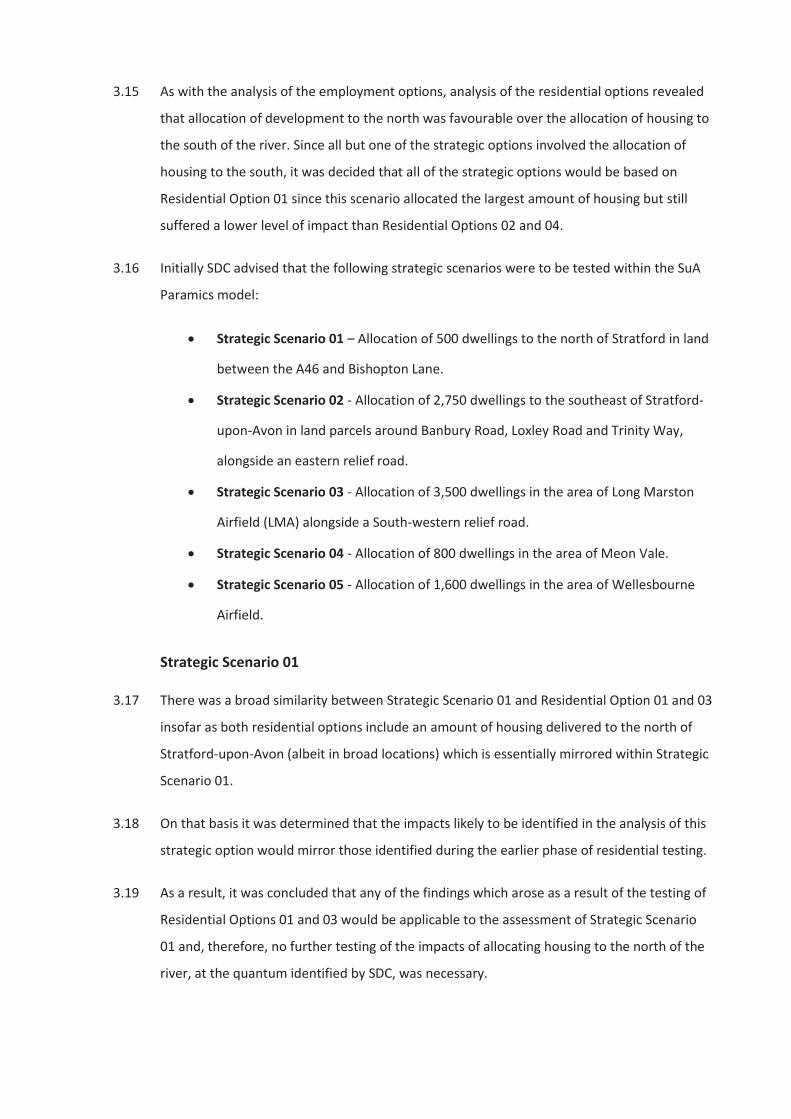
3.26 An overview of the site locations, alongside the alignments assumed for the ERR and SWRR
has been provided within Figure 01.
Figure 01 – Strategic Allocations and Relief Road Alignments
Trip Generation and Trip Distribution
3.27 The assumptions pertaining to the assignment of the demands associated with each of the
options were retained, as far as was practicable, in a manner which was consistent with the
previous stages of the STA.
3.28 However, in order that all residential sites could be assessed on a consistent basis, WCC
standard residential trip generation rates were assigned on a per dwelling basis. In all cases,
a flat 15% reduction was applied to account for mode shift.
3.29 Both of these assumptions are considered to be relatively simplistic and would require
further refinement during any detailed assessment stages necessary to underpin a planning
application. However, by adopting a standardised approach for each of the sites it means
that the impacts that are discernible between options will largely be related to the location
and quantum of development rather than any subtle difference between the trip rates
applied between options.
3.30 The residential trips rates adopted for this assessment have been documented within Table
01. The trip rates associated with the employment allocations are in line with those adopted
during the previous stage of the STA and are documented within the Stratford-on-Avon
Strategic Transport Assessment – Options Analysis Report (Section 3.2.1).
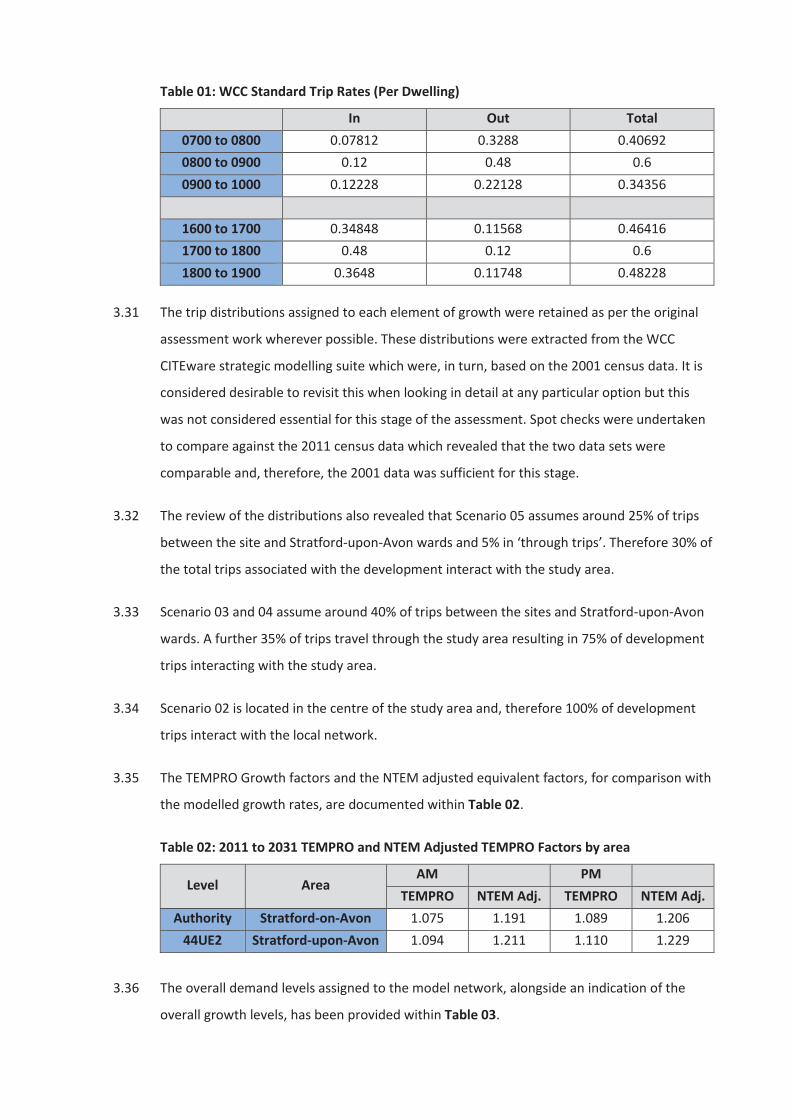
Table 01: WCC Standard Trip Rates (Per Dwelling)
In Out Total 0700 to 0800 0.07812 0.3288 0.40692 0800 to 0900 0.12 0.48 0.6 0900 to 1000 0.12228 0.22128 0.34356
1600 to 1700 0.34848 0.11568 0.46416 1700 to 1800 0.48 0.12 0.6 1800 to 1900 0.3648 0.11748 0.48228
3.31 The trip distributions assigned to each element of growth were retained as per the original
assessment work wherever possible. These distributions were extracted from the WCC
CITEware strategic modelling suite which were, in turn, based on the 2001 census data. It is
considered desirable to revisit this when looking in detail at any particular option but this
was not considered essential for this stage of the assessment. Spot checks were undertaken
to compare against the 2011 census data which revealed that the two data sets were
comparable and, therefore, the 2001 data was sufficient for this stage.
3.32 The review of the distributions also revealed that Scenario 05 assumes around 25% of trips
between the site and Stratford-upon-Avon wards and 5% in ‘through trips’. Therefore 30% of
the total trips associated with the development interact with the study area.
3.33 Scenario 03 and 04 assume around 40% of trips between the sites and Stratford-upon-Avon
wards. A further 35% of trips travel through the study area resulting in 75% of development
trips interacting with the study area.
3.34 Scenario 02 is located in the centre of the study area and, therefore 100% of development
trips interact with the local network.
3.35 The TEMPRO Growth factors and the NTEM adjusted equivalent factors, for comparison with
the modelled growth rates, are documented within Table 02.
Table 02: 2011 to 2031 TEMPRO and NTEM Adjusted TEMPRO Factors by area
Level Area AM PM
TEMPRO NTEM Adj. TEMPRO NTEM Adj. Authority Stratford-on-Avon 1.075 1.191 1.089 1.206
44UE2 Stratford-upon-Avon 1.094 1.211 1.110 1.229
3.36 The overall demand levels assigned to the model network, alongside an indication of the
overall growth levels, has been provided within Table 03.
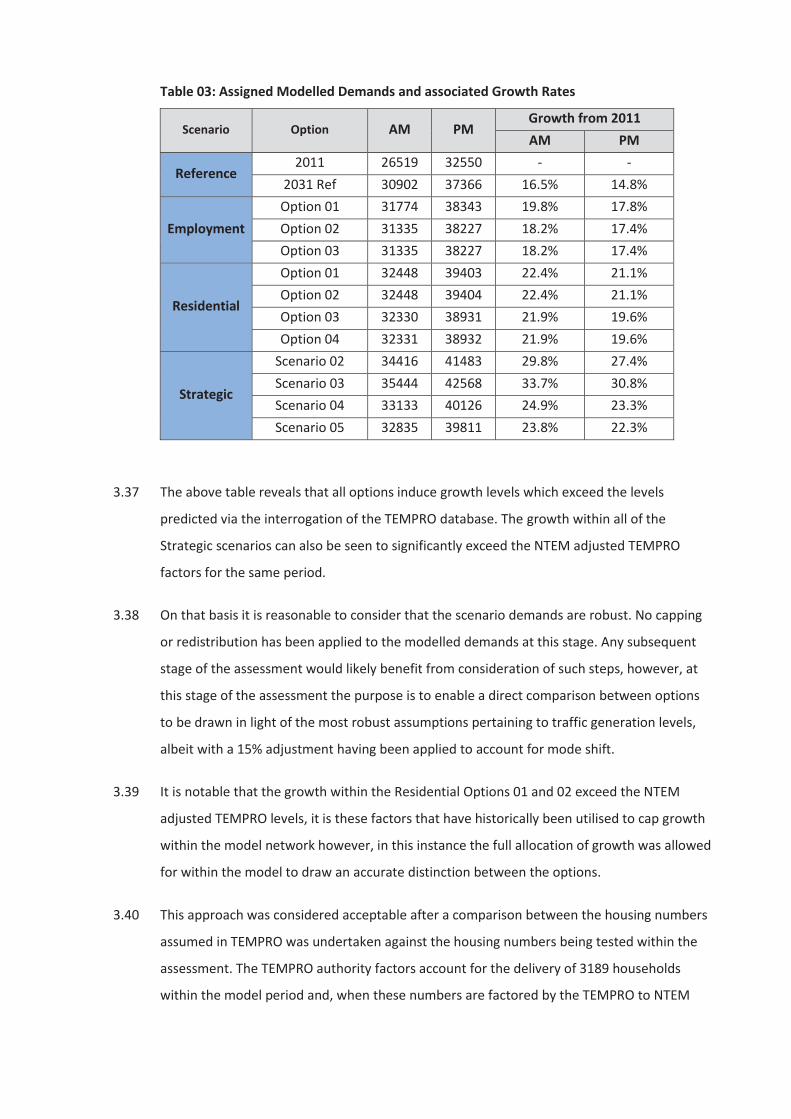
Table 03: Assigned Modelled Demands and associated Growth Rates
Scenario Option AM PM Growth from 2011 AM PM
Reference 2011 26519 32550 - -
2031 Ref 30902 37366 16.5% 14.8%
Employment Option 01 31774 38343 19.8% 17.8% Option 02 31335 38227 18.2% 17.4% Option 03 31335 38227 18.2% 17.4%
Residential
Option 01 32448 39403 22.4% 21.1% Option 02 32448 39404 22.4% 21.1% Option 03 32330 38931 21.9% 19.6% Option 04 32331 38932 21.9% 19.6%
Strategic
Scenario 02 34416 41483 29.8% 27.4% Scenario 03 35444 42568 33.7% 30.8% Scenario 04 33133 40126 24.9% 23.3% Scenario 05 32835 39811 23.8% 22.3%
3.37 The above table reveals that all options induce growth levels which exceed the levels
predicted via the interrogation of the TEMPRO database. The growth within all of the
Strategic scenarios can also be seen to significantly exceed the NTEM adjusted TEMPRO
factors for the same period.
3.38 On that basis it is reasonable to consider that the scenario demands are robust. No capping
or redistribution has been applied to the modelled demands at this stage. Any subsequent
stage of the assessment would likely benefit from consideration of such steps, however, at
this stage of the assessment the purpose is to enable a direct comparison between options
to be drawn in light of the most robust assumptions pertaining to traffic generation levels,
albeit with a 15% adjustment having been applied to account for mode shift.
3.39 It is notable that the growth within the Residential Options 01 and 02 exceed the NTEM
adjusted TEMPRO levels, it is these factors that have historically been utilised to cap growth
within the model network however, in this instance the full allocation of growth was allowed
for within the model to draw an accurate distinction between the options.
3.40 This approach was considered acceptable after a comparison between the housing numbers
assumed in TEMPRO was undertaken against the housing numbers being tested within the
assessment. The TEMPRO authority factors account for the delivery of 3189 households
within the model period and, when these numbers are factored by the TEMPRO to NTEM
adjusted TEMPRO ratio, this would increase to 4,567 households if the NTEM adjusted
TEMPRO factors were used as a cap.
3.41 There are around 3200 dwellings accounted for within the original reference case and a
further 1,300 dwellings are assigned within the model as part of the Testing of Residential
Option 01 and 02. Thus the 4,500 dwellings accounted for within the modelling should be
considered comparable to the 4,567 houses that would be accounted for via the application
of the NTEM adjusted TEMPRO factors meaning that, at this stage, a cap was not considered
necessary.
3.42 It is recommended that these assumptions should be revisited and subject to a realism test
at a later stage when more detailed analysis is required to support a planning application
associated with one or more of the identified sites. Particularly as this approach does not
allow for the occurrence of any redistribution, reallocation or diversion effects which would
likely occur when considering the quantum of development being assessed. Such
assumptions are omitted at this stage to maintain consistency throughout the comparisons.
4 SOUTHAM FOCUSSED SCENARIO OVERVIEW
Reference Case Amendments
4.1 Since the completion of the STA work in June 2014 the M40 Paramics model has been
updated and, as a result, it was the new M40 model which was utilised during the
assessment of impacts associated with the allocation of housing in Southam.
4.2 A full record of the changes applied to the M40 Paramics model, as well as the resultant
calibration and validation levels are available within the supporting model LMVR.
Southam Focussed Options
4.3 The methodology behind the production of the Southam focussed assessment was fairly
simplistic insofar as it simply incorporated demands associated with the allocation of 1,000,
2,000 and 3,000 dwellings in broad locations surrounding Southam.
4.4 Once the demands were derived for the housing developments then they were added to the
model network in increments and the impact on network performance was reviewed.
4.5 As a second assessment the demands associated with the allocation of housing in Southam
were also processed from the M40 Paramics model and converted to input demands for
assignment into the Warwick and Leamington Wide Area (WLWA) Paramics model.
4.6 The WLWA assessment was undertaken using the WLWA 2031 Reference Case rather than
the Warwick District Council (WDC) Local Plan model. The purpose of using the WLWA
Reference Case was that it would more easily enable the impacts associated with the
Southam developments to be identified. There was potential, should the WLWA Local Plan
Model have been adopted, for some of the impacts associated with the residential
developments in Southam to be mitigated by WDC Local Plan schemes to which the Southam
developments would reasonably be asked to contribute to should they be adopted.
4.7 By testing in a modelling environment which did not contain the WDC Local Plan growth or
schemes the impacts of the allocation of housing in Southam are, therefore, more
discernible.
4.8 The growth levels tested within the M40 Model representing the 3 housing levels are
summarised within Table 04 whilst the resultant growth levels assigned within the WLWA
model are summarised within Table 05.
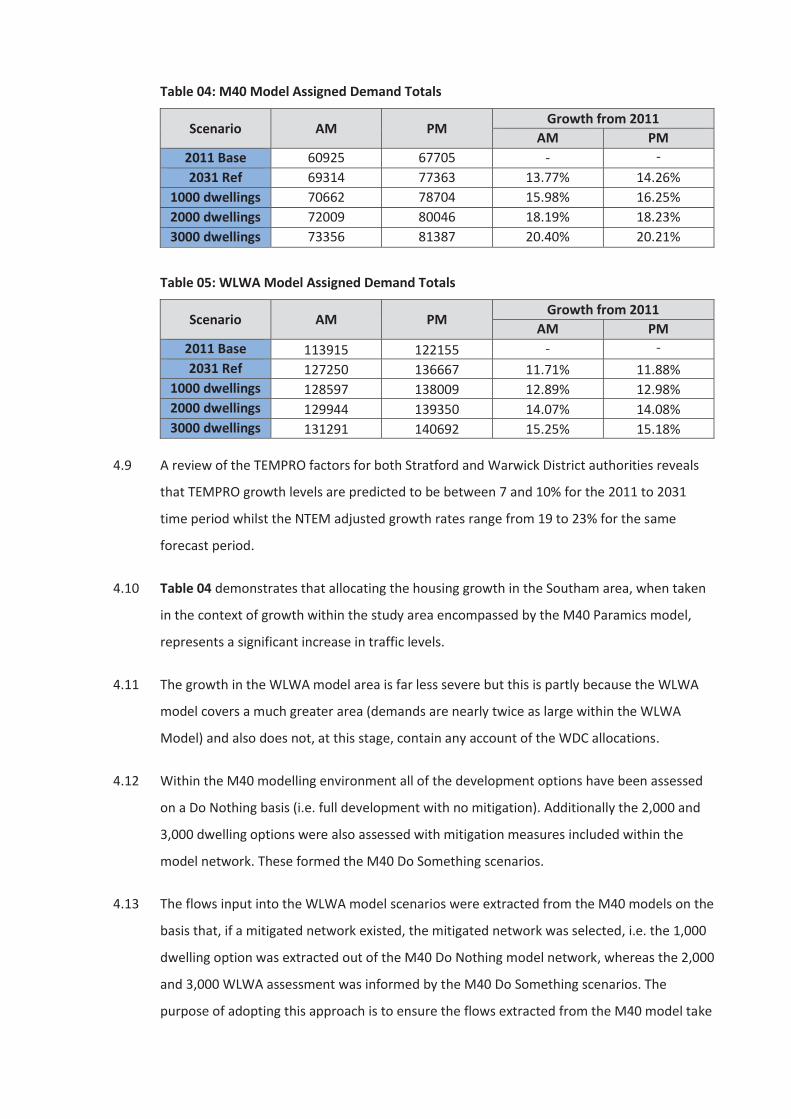
Table 04: M40 Model Assigned Demand Totals
Scenario AM PM Growth from 2011
AM PM 2011 Base 60925 67705 - - 2031 Ref 69314 77363 13.77% 14.26%
1000 dwellings 70662 78704 15.98% 16.25% 2000 dwellings 72009 80046 18.19% 18.23% 3000 dwellings 73356 81387 20.40% 20.21%
Table 05: WLWA Model Assigned Demand Totals
Scenario AM PM Growth from 2011
AM PM 2011 Base 113915 122155 - - 2031 Ref 127250 136667 11.71% 11.88%
1000 dwellings 128597 138009 12.89% 12.98% 2000 dwellings 129944 139350 14.07% 14.08% 3000 dwellings 131291 140692 15.25% 15.18%
4.9 A review of the TEMPRO factors for both Stratford and Warwick District authorities reveals
that TEMPRO growth levels are predicted to be between 7 and 10% for the 2011 to 2031
time period whilst the NTEM adjusted growth rates range from 19 to 23% for the same
forecast period.
4.10 Table 04 demonstrates that allocating the housing growth in the Southam area, when taken
in the context of growth within the study area encompassed by the M40 Paramics model,
represents a significant increase in traffic levels.
4.11 The growth in the WLWA model area is far less severe but this is partly because the WLWA
model covers a much greater area (demands are nearly twice as large within the WLWA
Model) and also does not, at this stage, contain any account of the WDC allocations.
4.12 Within the M40 modelling environment all of the development options have been assessed
on a Do Nothing basis (i.e. full development with no mitigation). Additionally the 2,000 and
3,000 dwelling options were also assessed with mitigation measures included within the
model network. These formed the M40 Do Something scenarios.
4.13 The flows input into the WLWA model scenarios were extracted from the M40 models on the
basis that, if a mitigated network existed, the mitigated network was selected, i.e. the 1,000
dwelling option was extracted out of the M40 Do Nothing model network, whereas the 2,000
and 3,000 WLWA assessment was informed by the M40 Do Something scenarios. The
purpose of adopting this approach is to ensure the flows extracted from the M40 model take

account of the mitigation measures being delivered and account for them accordingly by
ensuring a robust level of flows are assigned to the WLWA model.

5 STRATFORD FOCUSSED ANALYSIS
Results Overview
5.1 The following section of this report documents the analysis of the results obtained from the
Stratford-upon-Avon focussed assessments.
5.2 The results analysis has been undertaken in a manner which is consistent with the previous
stages of Strategic Transport Assessment work.
5.3 The results analysis has focussed primarily on the impact on key network performance
indicators, coupled with more detailed analysis of the impact on queueing levels at key
junctions, illustrated within supporting plots.
5.4 The key network performance indicators that have been assessed are summarised as
follows:
Model Stability – The number of successful runs expressed as a percentage of the
total runs completed.
Completed Trips (vehicles) – The number of completed trips recorded during the
model simulation.
Trip Completion Ratio – The percentage of assigned trips that are completed
within the model simulation period.
Average Speed (Km/h) – The average speed travelled by all vehicles that
completed a journey during the model simulation period.
Average Time (seconds) – The average travel time of a completed trip during the
model simulation period.
5.5 A second, more detailed, level of analysis has been undertaken in the form of queue length
analysis. Queue length analysis is intended to accompany the network wide analysis as it
provides a more detailed picture of the impacts at specific junctions within the model
network.
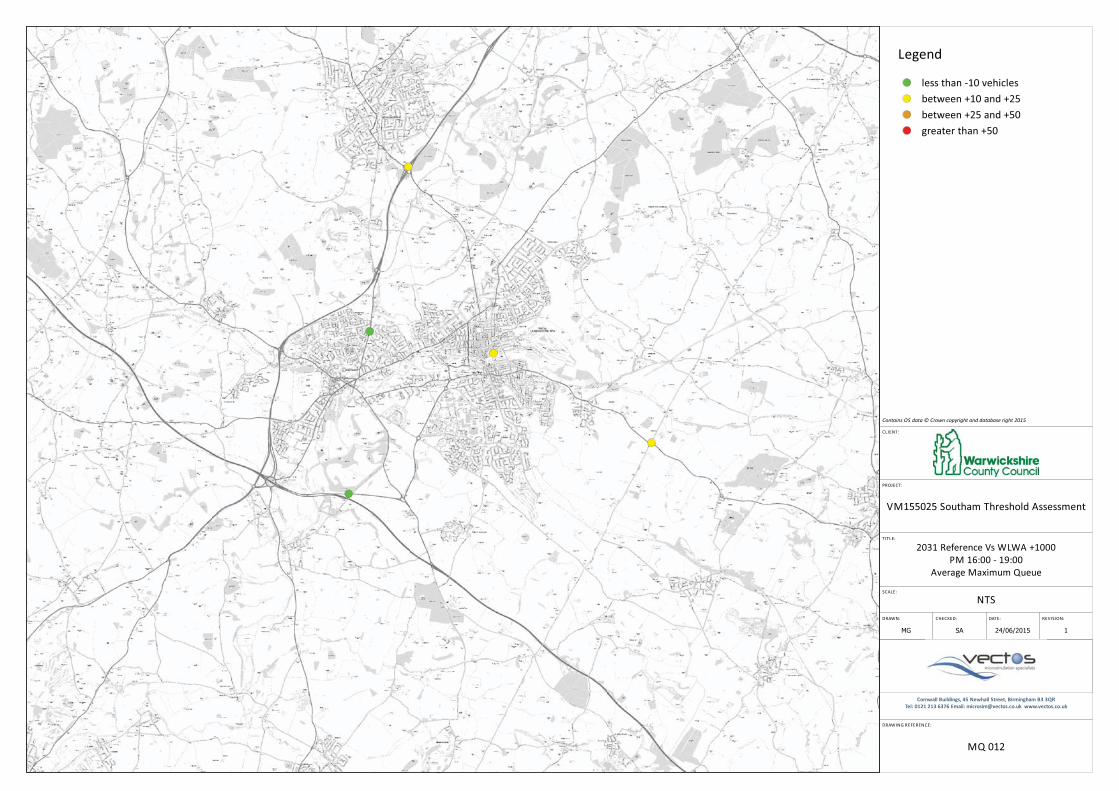
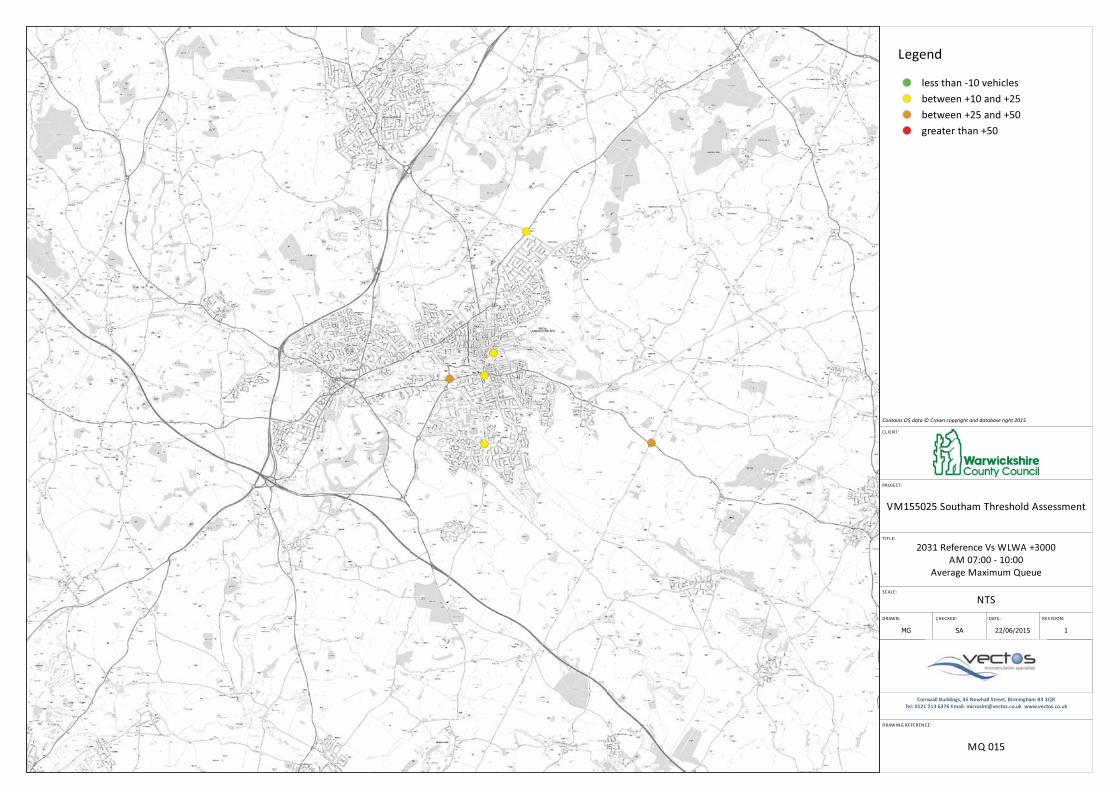
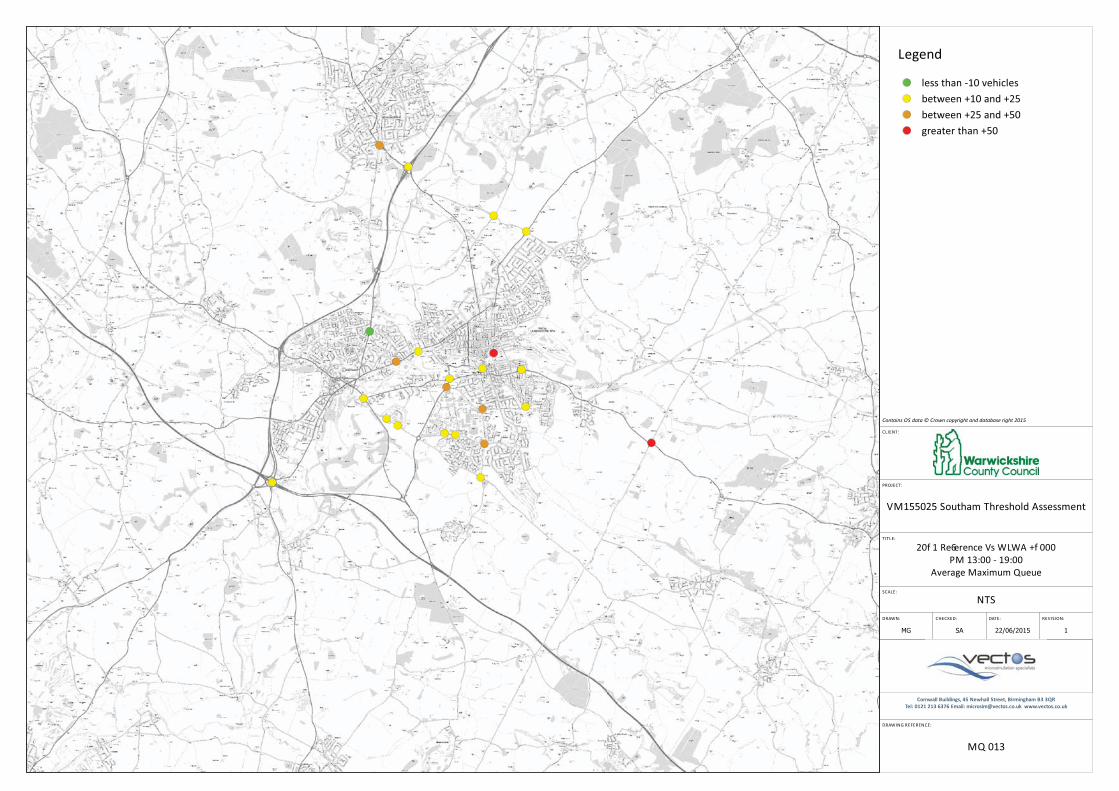
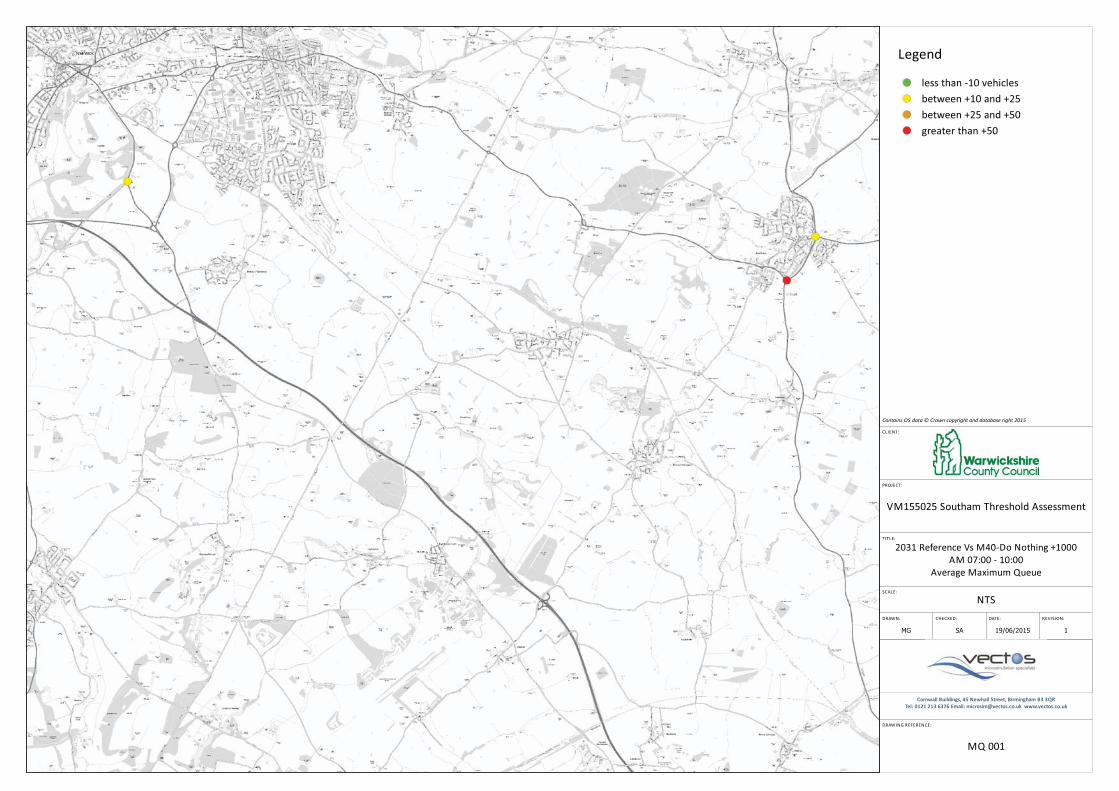
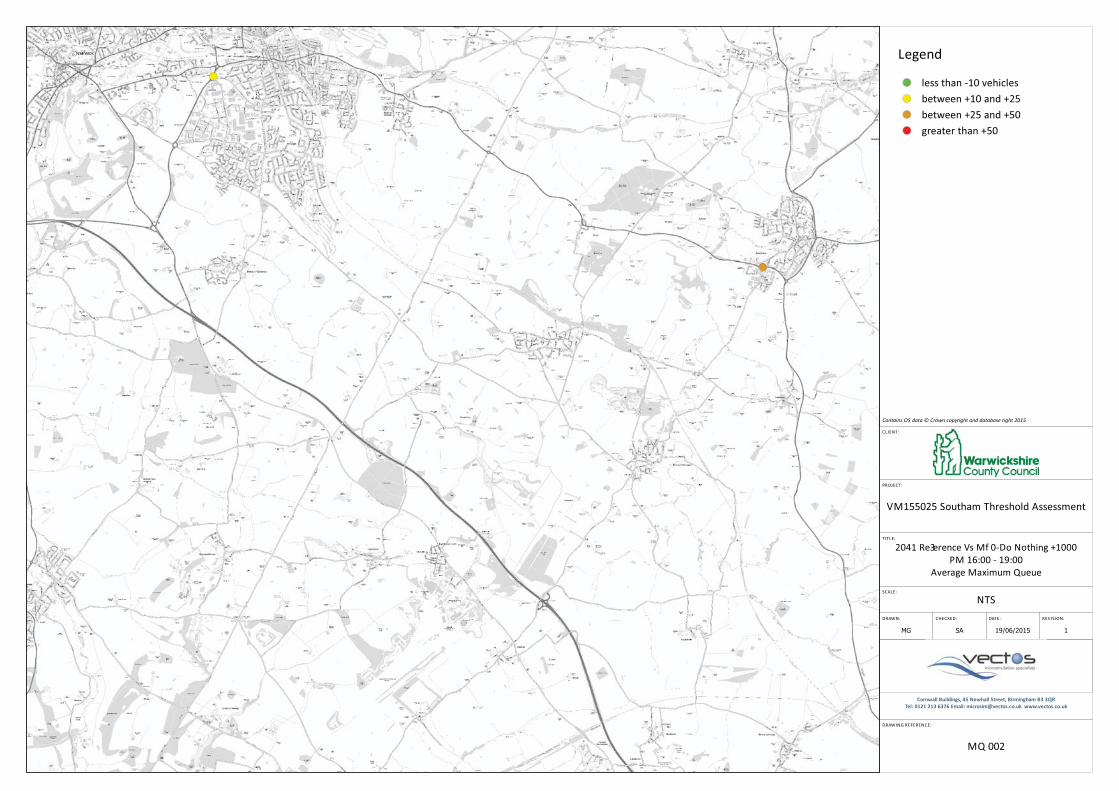
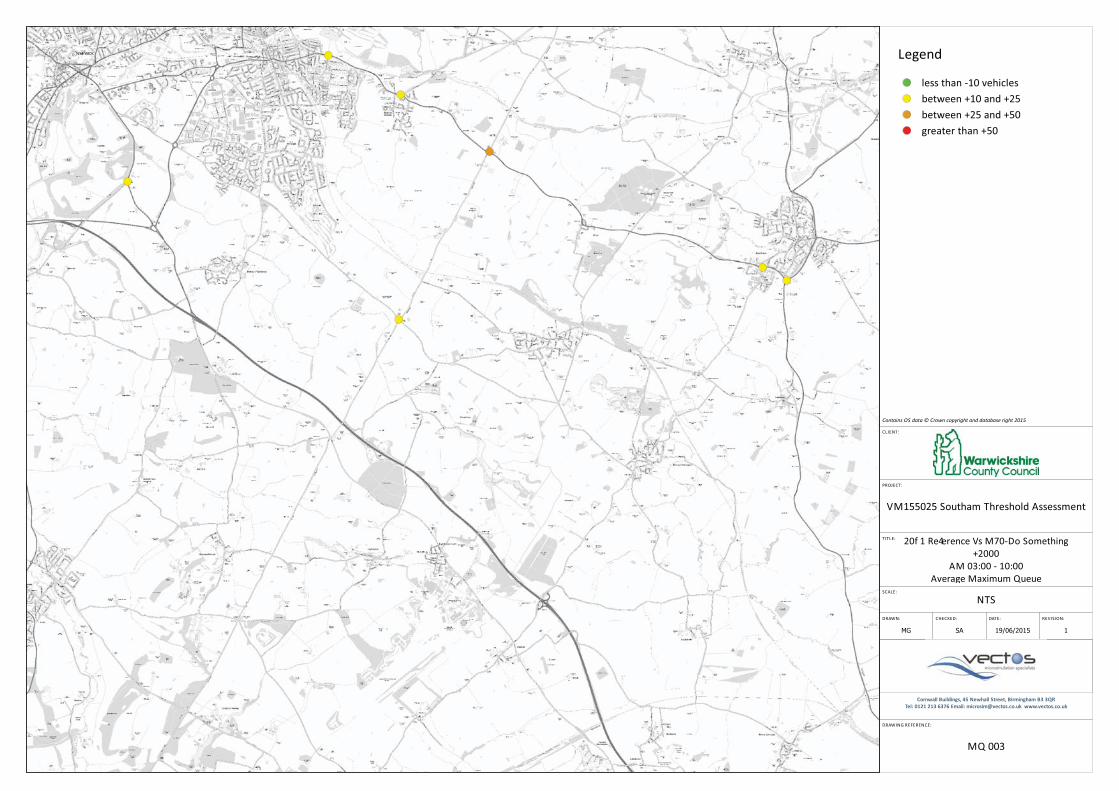
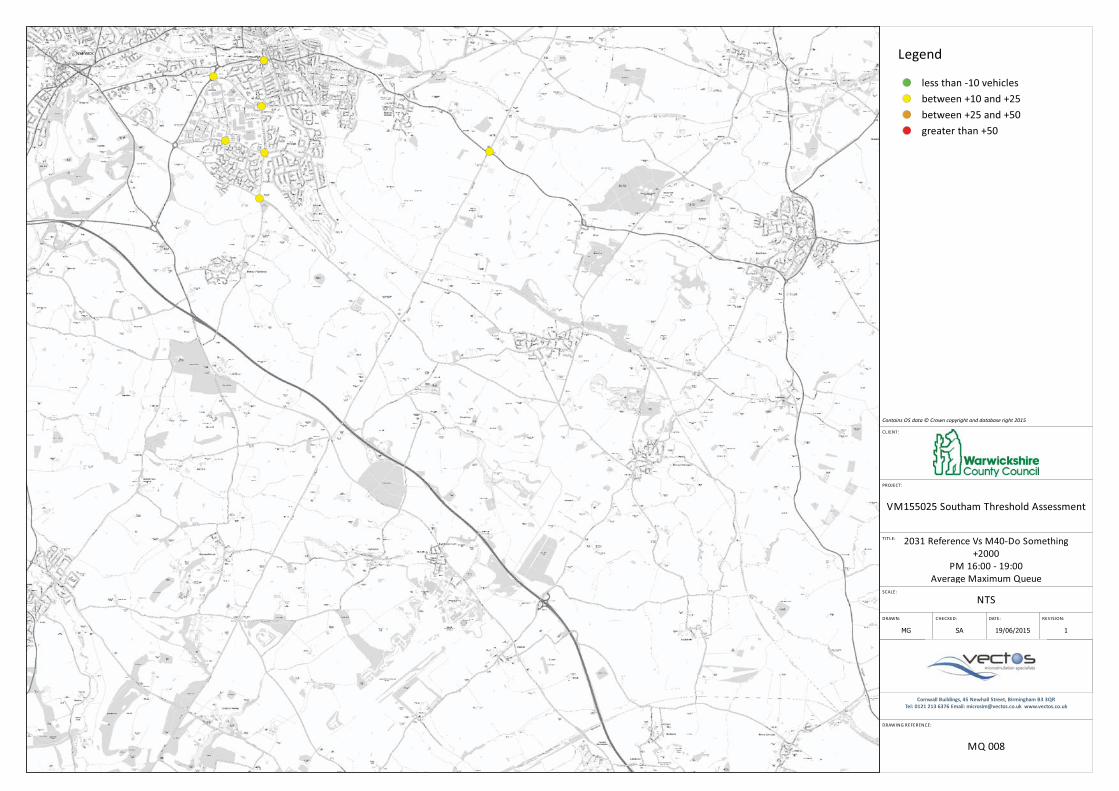
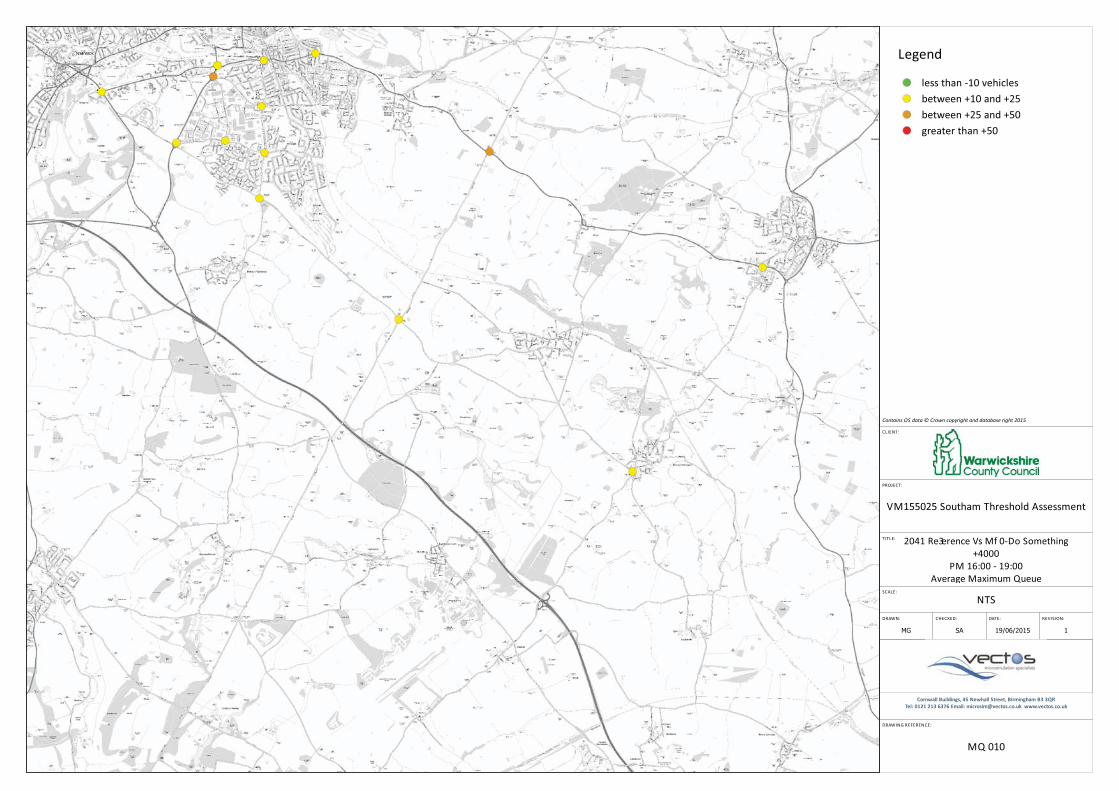
5.6 At this stage the analysis of queue lengths has been based on the periodic average of the
hourly maximum queue lengths. Results presented for each junction are based on the worst
performing single approach. The hourly maximum for each individual model run has been
calculated and then the average of all runs has been calculated for each hour. The maximum
of these values, across all hours, is reported as the maximum periodic average maximum
queue length. All queues are reported in numbers of vehicles.
5.7 The classifications for the queue length analysis are outlined as follows:
Queue Reduction (a reduction in queue lengths of greater than 5 vehicles)
Moderate Increase (an increase in queue lengths of between 15 and 30 vehicles)
Severe Increase (an increase in queue lengths of between 30 and 50 vehicles)
Very Severe Increase (an increase in queue length of over 50 vehicles)
5.8 Plots illustrating the impacts on queuing levels across all junctions have been provided within
Appendix B and Appendix D of this Report.
Scenario Comparisons
5.9 In all cases the comparison between the respective development scenario and the reference
case are based on the 2031 Updated Reference Case without the inclusion of the STP. With
regards the analysis of the key network performance indicators, the results pertaining to the
2031 Updated Reference Case plus STP have also been provided for information purposes.
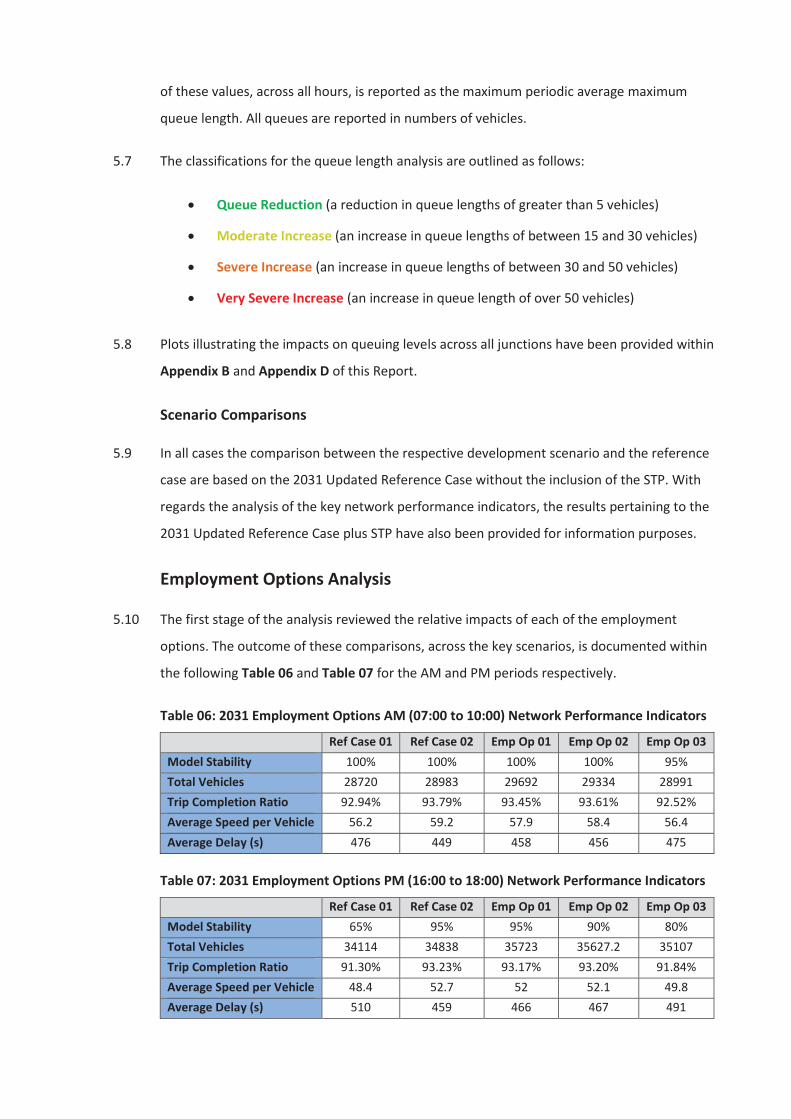
Employment Options Analysis
5.10 The first stage of the analysis reviewed the relative impacts of each of the employment
options. The outcome of these comparisons, across the key scenarios, is documented within
the following Table 06 and Table 07 for the AM and PM periods respectively.
Table 06: 2031 Employment Options AM (07:00 to 10:00) Network Performance Indicators
Ref Case 01 Ref Case 02 Emp Op 01 Emp Op 02 Emp Op 03 Model Stability 100% 100% 100% 100% 95% Total Vehicles 28720 28983 29692 29334 28991 Trip Completion Ratio 92.94% 93.79% 93.45% 93.61% 92.52% Average Speed per Vehicle 56.2 59.2 57.9 58.4 56.4 Average Delay (s) 476 449 458 456 475
Table 07: 2031 Employment Options PM (16:00 to 18:00) Network Performance Indicators
Ref Case 01 Ref Case 02 Emp Op 01 Emp Op 02 Emp Op 03 Model Stability 65% 95% 95% 90% 80% Total Vehicles 34114 34838 35723 35627.2 35107 Trip Completion Ratio 91.30% 93.23% 93.17% 93.20% 91.84% Average Speed per Vehicle 48.4 52.7 52 52.1 49.8 Average Delay (s) 510 459 466 467 491

5.11 Analysis of the results presented within the previous tables reveals a notable reduction in
network performance within Employment Option 03 when compared to the other two
options. Model stability drops to 80% in the PM, speeds fall and delay increases. However, it
should be noted that the performance of Employment Option 03 still represents an
improvement over the 2031 Reference Case 01 (i.e. without the STP measures included).
5.12 The impacts on queueing levels that are predicted to occur as a result of the adoption of the
three different employment options have been presented within plots MQ001 to MQ006
within Appendix B.
5.13 A review of these plots reveals the following:
Queueing increases at a higher number of locations within the PM, compared to
the AM, across all scenarios.
Within the PM, Employment Option 03 incurs far higher increases in queueing as a
result of the allocation of employment to the south of the River Avon. This
increases the number of trips travelling across the two existing river crossings
which, in turn, increases the queueing experienced at junctions along these routes.
Queueing impacts in the PM networks of Employment Options 01 and 02 are
broadly consistent indicating little difference between the two options relative to
the poor performance of Option 03.
Although not recorded within the plots due to a lack of measurement, observations
of the Employment Option 03 network also reveals significant issues with the
proposed Clifford Lane/Shipston Road junction which indicates that, if employment
is to be allocated in the south, further work at this junction will be required.
Employment Option Analysis- Initial Summary
5.14 Analysis of the employment options, coupled with a review of the network performance,
reveals the following:
Access to the employment land to the north is better served by a junction which
caters for all movements, a left-in/left-out arrangement would unnecessarily
increase the movements around the A46/Alcester Road ‘Wildmoor’ roundabout
which already requires mitigation to be delivered through the STP.
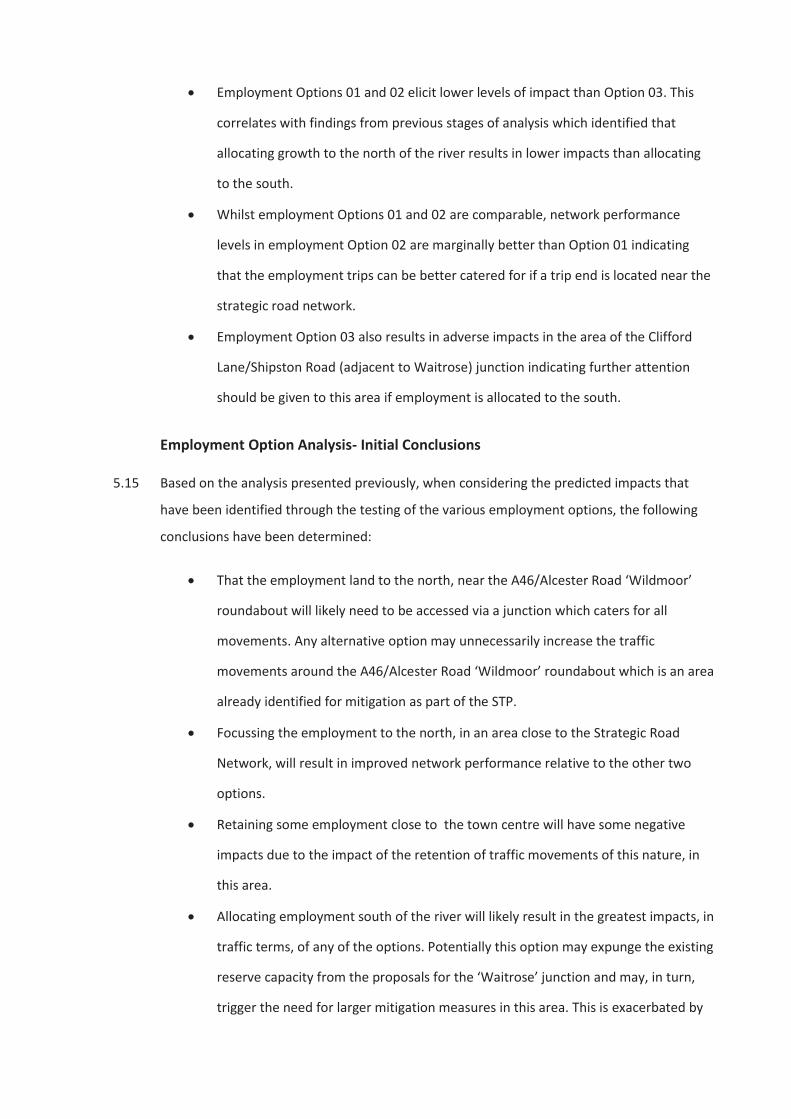
Employment Options 01 and 02 elicit lower levels of impact than Option 03. This
correlates with findings from previous stages of analysis which identified that
allocating growth to the north of the river results in lower impacts than allocating
to the south.
Whilst employment Options 01 and 02 are comparable, network performance
levels in employment Option 02 are marginally better than Option 01 indicating
that the employment trips can be better catered for if a trip end is located near the
strategic road network.
Employment Option 03 also results in adverse impacts in the area of the Clifford
Lane/Shipston Road (adjacent to Waitrose) junction indicating further attention
should be given to this area if employment is allocated to the south.
Employment Option Analysis- Initial Conclusions
5.15 Based on the analysis presented previously, when considering the predicted impacts that
have been identified through the testing of the various employment options, the following
conclusions have been determined:
That the employment land to the north, near the A46/Alcester Road ‘Wildmoor’
roundabout will likely need to be accessed via a junction which caters for all
movements. Any alternative option may unnecessarily increase the traffic
movements around the A46/Alcester Road ‘Wildmoor’ roundabout which is an area
already identified for mitigation as part of the STP.
Focussing the employment to the north, in an area close to the Strategic Road
Network, will result in improved network performance relative to the other two
options.
Retaining some employment close to the town centre will have some negative
impacts due to the impact of the retention of traffic movements of this nature, in
this area.
Allocating employment south of the river will likely result in the greatest impacts, in
traffic terms, of any of the options. Potentially this option may expunge the existing
reserve capacity from the proposals for the ‘Waitrose’ junction and may, in turn,
trigger the need for larger mitigation measures in this area. This is exacerbated by
the location of the development in the testing which allocates the employment on
the A3400 south of the junction with Clifford Lane, thereby increasing conflicts with
traffic moving between the A3400 and Clifford Lane.
Residential Options Analysis
5.16 Following the completion of the analysis of the employment options, the next stage of
analysis focussed on the impacts of the residential options identified by SDC.
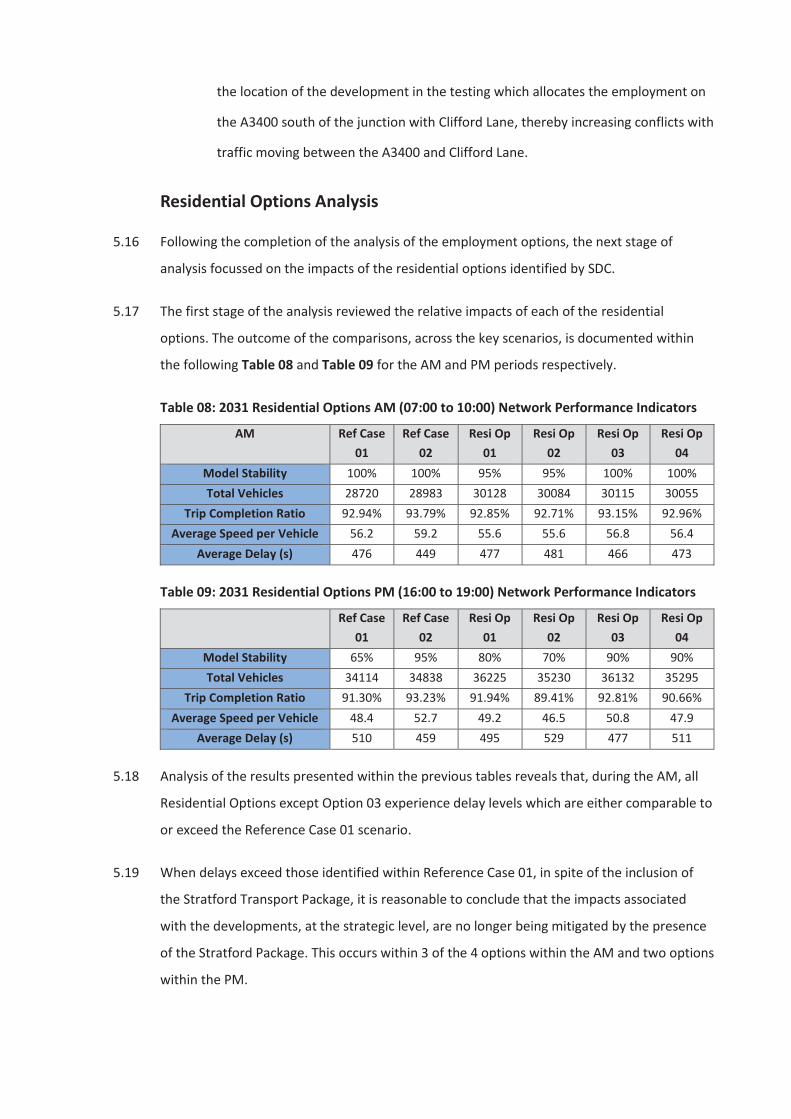
5.17 The first stage of the analysis reviewed the relative impacts of each of the residential
options. The outcome of the comparisons, across the key scenarios, is documented within
the following Table 08 and Table 09 for the AM and PM periods respectively.
Table 08: 2031 Residential Options AM (07:00 to 10:00) Network Performance Indicators
AM Ref Case 01
Ref Case 02
Resi Op 01
Resi Op 02
Resi Op 03
Resi Op 04
Model Stability 100% 100% 95% 95% 100% 100% Total Vehicles 28720 28983 30128 30084 30115 30055
Trip Completion Ratio 92.94% 93.79% 92.85% 92.71% 93.15% 92.96% Average Speed per Vehicle 56.2 59.2 55.6 55.6 56.8 56.4
Average Delay (s) 476 449 477 481 466 473
Table 09: 2031 Residential Options PM (16:00 to 19:00) Network Performance Indicators
Ref Case 01
Ref Case 02
Resi Op 01
Resi Op 02
Resi Op 03
Resi Op 04
Model Stability 65% 95% 80% 70% 90% 90% Total Vehicles 34114 34838 36225 35230 36132 35295
Trip Completion Ratio 91.30% 93.23% 91.94% 89.41% 92.81% 90.66% Average Speed per Vehicle 48.4 52.7 49.2 46.5 50.8 47.9
Average Delay (s) 510 459 495 529 477 511
5.18 Analysis of the results presented within the previous tables reveals that, during the AM, all
Residential Options except Option 03 experience delay levels which are either comparable to
or exceed the Reference Case 01 scenario.
5.19 When delays exceed those identified within Reference Case 01, in spite of the inclusion of
the Stratford Transport Package, it is reasonable to conclude that the impacts associated
with the developments, at the strategic level, are no longer being mitigated by the presence
of the Stratford Package. This occurs within 3 of the 4 options within the AM and two options
within the PM.

5.20 Delays within Residential Option 02 are consistently higher than the Reference Case prior to
the allocation of the STP measures.
5.21 When comparing the performance of each of the residential options it is evident that the
options which contain only 650 dwellings are also more likely to result in improved network
performance when compared to the options which contain 1300 dwellings.
5.22 It is notable that the delay within Residential Option 04, which contains only 650 dwellings,
are higher within the PM and comparable within the AM to the Residential Option 01 which
contains 1300 dwellings.
5.23 The impacts on queueing levels that are predicted to occur as a result of the adoption of the
three different employment options have been presented within plots MQ007 to MQ014 in
Appendix B.
5.24 A review of these plots reveals the following:
Queueing increases at a higher number of locations within the PM, compared to
the AM, across all scenarios.
Queueing levels within Residential Options 02 and 04 are higher than 01 and 03
which indicates that the allocation of housing to the north alongside the SRZ incurs
lower increases in queueing levels than allocation of housing to the south only.
In the majority of options there are severe queue increases within the PM at the
Tiddington Road/Clopton Bridge junction. This is in spite of the inclusion of the new
junction in this area and is indicative of an increase in queueing on Tiddington Road
as a result of the introduction of the signals which throttle traffic on Tiddington
Road to maintain flow on Clopton Bridge and Banbury Road/Shipston Road.
It is notable that the presence of the STP schemes along Birmingham Road and at
Bishopton Island enables the housing to be delivered without incurring an increase
in queueing in this area.
Residential Option Analysis- Initial Summary
5.25 Analysis of the residential options, coupled with a review of the network performance,
reveals the following:
The network still operates within ± 10% of the Reference Case levels (prior to the
allocation of the STP), across all options.
The instability of the Residential Option 02, during the PM assessment, indicates
that this option will likely require additional mitigation measures to be identified
over and above those which form the STP.
Continuing with the emerging themes, the model stability and network
performance measures indicate that allocating housing to the north is preferable
when compared to the south.
Residential Option 04 contains half of the housing tested within Residential Option
01 but Option 01 results in an improved level of network performance when
compared to Option 04.
Whilst Residential Option 01 performs worse, in terms of network performance,
than Option 03 this is in light of a higher number of houses having been tested in
Option 01 and should be recognised as such.
Residential Option Analysis- Initial Conclusions
5.26 Based on the analysis presented previously, when considering the predicted impacts that
have been identified through the testing of the various residential options, the following
conclusions have been identified:
Allocating housing to the north results in less impacts than allocating housing to the
south and, as such, should be considered favourable in traffic impact terms.
The network stability, during the PM, within Option 02 is such that it is considered
highly likely that additional mitigation measures would be required in this option.
This does not transpire within the alternative options and, therefore, it is
reasonable to conclude that, based on the current modelling evidence, Option 02 is
the least favourable in traffic impact terms.
Whilst Residential Option 04 does not suffer the same issues with instability,
network performance in this scenario is still lower in comparison to Option 01 in
spite of the fact that Option 01 contains a higher level of housing. Thus, it is
reasonable to conclude that the lifespan of the exiting network and proposed STP
measures will increase as a result of adopting either Option 01 or 03 when
compared to Option 02 or 04.
It should be acknowledged that the STP measures and the mitigation identified
through the strategic scenario analysis, which follows this chapter of the report,
present a comprehensive list of measures that can be delivered. Option 02 and 04
elicit a higher level of impact and so may bring forward the need for STP measures
sooner or, conversely, may trigger the need for some of the mitigation measures
identified within the strategic scenario analysis. If this happens then the lifespan of
the mitigation measures will reduce as there are pressure brought about earlier by
the allocation of housing as per Option 02 and 04 that increase the stress on the
junctions. Options 01 and 03 produce less stress on the network and would
therefore maintain a higher standard of network operation for a longer period.
These conclusions should be reviewed in conjunction with the supporting
sensitivity test outputs which reveal that delivery of between 500 and 650 houses
in the area immediately south-east of the town will result in adverse impacts
insofar as the new proposals for Clopton Bridge are concerned. This further
demonstrates that delivery of housing to the north and in the region of the SRZ
may be easier to realise than delivery of housing to the south-east.
5.27 When considering the final bullet point above, it should be noted that the testing assumed
the delivery of development in land immediately south east of the town centre, the number
of dwellings that are likely to incur the impacts identified would decrease if they were
delivered in an area further to the south which may encourage use of Seven Meadows Road
as an alternative crossing point to Clopton Bridge which is not accounted for within the
cordon assessment.
Residential Option Analysis – Additional Considerations
5.28 Subsequent to the results analysis and subsequent conclusions, the following additional
points of consideration have been identified:
The assessment includes some account of scheme proposals at both the
A3400/A46 Bishopton Island and A46/Alcester Road ‘Wildmoor’ roundabout. The
exact form of these junctions is currently still to be determined. However, the
strategic significance of these junctions may mean that additional sources of
funding for the junction improvements may be found to support their early delivery
to sustain economic growth within the area.
There is a risk that improvements at Wildmoor may require third party land.
Allocating employment and housing to the north increases the likelihood that a
larger mitigation scheme may be required at one, or both of the A46 junctions.
Conversely, there is a greater potential to deliver enhanced mitigation measures in
these areas than there are to the south where the network is heavily constrained
by the limited access to land due to the physical build out and reduced highway
boundary and limited points to cross the River Avon which constrains the
dissipation of the trips. Testing has already considered the updated proposals for
Clopton Bridge and it is understood that the potential to deliver further mitigation
in this area (other than the signalisation of the remaining gyratory entry arms) is
very limited.
Strategic Options Analysis
5.29 Following the completion of the local employment and residential allocation assessments, it
was then necessary to review the performance of the Strategic Scenarios.
5.30 As has been outlined previously within this report, Strategic Scenario 01, as identified by
SDC, centred on the delivery of 500 dwellings on land to the North of Stratford-upon-Avon
and it is reasonable to conclude that the impacts likely to occur as a result of this option will
be broadly consistent with those identified within the analysis of Residential Option 01. On
that basis, no further testing of this option was considered necessary at this stage.
5.31 The remaining 4 strategic Scenarios were then assessed on the following basis:
Do Nothing – assignment of the development demands only.
Do Minimum – The Do Nothing with the addition of the Eastern or South-Western
Relief Roads. (Scenario 02 & 03 only).
Do Something – The Do Minimum with additional, development specific,
mitigation.

5.32 The mitigation measures identified in the Do Something scenarios were identified in addition
to the STP measures and comprised the changes identified within Table 10.
Table 10: Strategic Scenario Mitigation Measures
Location Description Windsor St/Greenhill St Right turn ban, Windsor St to Greenhill St
B439 Evesham Rd/Shottery Rd
Right turn ban, Evesham Pl to Shottery Rd Two-lane exit, Seven Meadows Rd southbound Left turn lanes 1 and 2, Evesham Pl to Seven Meadows Rd Right turn ban, Evesham Rd to Seven Meadows Rd (Scen 03 only)
Left turn ban, Seven Meadows Rd to Evesham Rd B439 Evesham Rd/Brookvale Rd Right turn lane, Evesham Rd westbound B4632 Clifford Ln/Shipston Rd Roundabout scheme (Scen 03) or enhanced signal proposals
A46/A439 Marraway Free-flow left turn lane, A46 eastbound Part signalisation
5.33 Schemes should be considered conceptual at this stage and indicative of the key principles
rather than the definitive form.
5.34 Some key principles have been identified through the mitigation review:
That mitigation will also be required at Marraway Roundabout (as identified in
some previous stages of STA work).
A scheme is required at the Evesham Place/Evesham Road junction which delivers
additional capacity compared to the STP scheme. This includes restriction of some
movements, currently the left turn from Seven Meadows Road to Evesham Road
has been removed to encourage traffic bound for west Stratford to travel via
Clopton Bridge. In reality, more work is required before the full extent of proposals
in this area is required.
Delivery of the SWRR may provide an opportunity to rationalise some of the
movements at the Evesham Place/Evesham Road junction (as has been tested in
Scenario 03 by banning the right turn from Evesham Road into Seven Meadows
Road to encourage traffic to use the SWRR).
That the existing proposals for the Clifford Lane/Shipston Road junction will need
to be revisited in order that additional growth to the south can be accommodated.
5.35 The subsequent stages of analysis focus on the performance of the Do Something scenarios
for each of the options inclusive of mitigation measures. It should be noted that the full
analysis of all scenarios, with regards the key network performance indicators, has been
provided within Appendix C.
5.36 Reviewing the Tables presented within Appendix C reveals that the Do Nothing scenarios are
prone to high levels of instability, with the PM networks for both Scenario 02 and Scenario
03 producing no successful runs, which indicates that the delivery of the ERR or SWRR should
be considered as a pre-requisite of either Scenario 02 or Scenario 03.
5.37 The first stage of the analysis reviewed the relative impacts of each of the strategic
scenarios. The outcome of the comparisons, across the key scenarios, is documented within
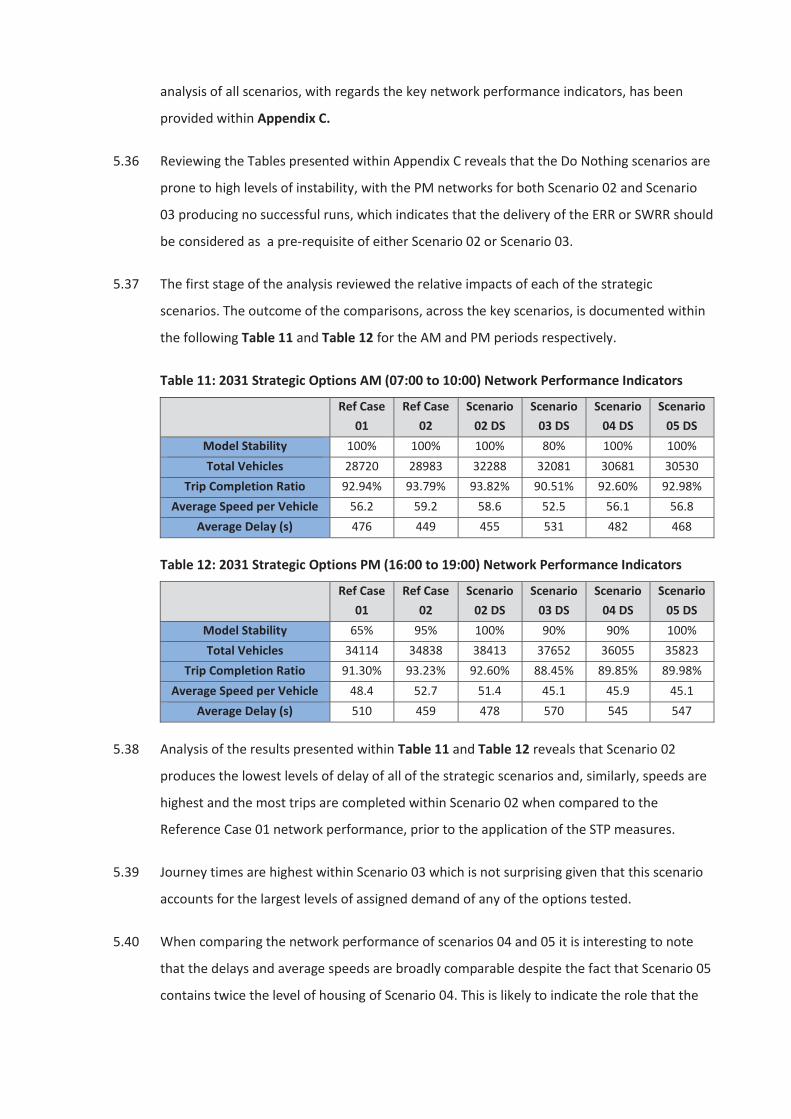
the following Table 11 and Table 12 for the AM and PM periods respectively.
Table 11: 2031 Strategic Options AM (07:00 to 10:00) Network Performance Indicators
Ref Case 01
Ref Case 02
Scenario 02 DS
Scenario 03 DS
Scenario 04 DS
Scenario 05 DS
Model Stability 100% 100% 100% 80% 100% 100% Total Vehicles 28720 28983 32288 32081 30681 30530
Trip Completion Ratio 92.94% 93.79% 93.82% 90.51% 92.60% 92.98% Average Speed per Vehicle 56.2 59.2 58.6 52.5 56.1 56.8
Average Delay (s) 476 449 455 531 482 468
Table 12: 2031 Strategic Options PM (16:00 to 19:00) Network Performance Indicators
Ref Case 01
Ref Case 02
Scenario 02 DS
Scenario 03 DS
Scenario 04 DS
Scenario 05 DS
Model Stability 65% 95% 100% 90% 90% 100% Total Vehicles 34114 34838 38413 37652 36055 35823
Trip Completion Ratio 91.30% 93.23% 92.60% 88.45% 89.85% 89.98% Average Speed per Vehicle 48.4 52.7 51.4 45.1 45.9 45.1
Average Delay (s) 510 459 478 570 545 547
5.38 Analysis of the results presented within Table 11 and Table 12 reveals that Scenario 02
produces the lowest levels of delay of all of the strategic scenarios and, similarly, speeds are
highest and the most trips are completed within Scenario 02 when compared to the
Reference Case 01 network performance, prior to the application of the STP measures.
5.39 Journey times are highest within Scenario 03 which is not surprising given that this scenario
accounts for the largest levels of assigned demand of any of the options tested.
5.40 When comparing the network performance of scenarios 04 and 05 it is interesting to note
that the delays and average speeds are broadly comparable despite the fact that Scenario 05
contains twice the level of housing of Scenario 04. This is likely to indicate the role that the
location plays between the two options. Trips to/from the site tested within Option 05 are
able to make use of the A429 to travel north towards the M40. This is also likely to elicit
further impacts at the M40 J15 that will not have been identified as a result of this phase of
testing due to the study area coverage.
5.41 Analysis of the difference in queueing levels has also been undertaken and compares the
Original Reference Case (pre-STP allocation) and the Do Something networks created for
each of the Strategic Options.
5.42 This analysis has been presented within plots that accompany this presentation for the 4
strategic scenarios (MQ015 to MQ022). A review of these plots reveals the following:
Queue increases are consistently higher within the PM than the AM for Scenarios
03, 04 and 05.
Scenario 02 experiences the greatest level of reduction in queues particularly
around the Birmingham Road corridor, Stratford town centre and also at the two
A46 junctions. This is indicative of the presence of the STP measures coupled with
the additional relief that is provided as a result of the ERR which serves to direct
traffic away from these areas and towards the M40 via the Warwick Road.
Scenario 03 is the only scenario to return severe increase in queueing within both
the AM and PM periods. However, the queueing in the AM on Evesham Road could
potentially be mitigated by improving the junction arrangement at the point where
the SWRR ties in, whilst the queue at the Shipston Road/Banbury Road roundabout
is coupled with an improvement at the Tiddington Road junction indicating that
reconfiguration of the signals in this area would likely reduce this impact. On that
basis the queueing impacts identified within the AM assessment of Scenario 03 are
not considered significant.
Within the PM there are large increases in queueing levels observed in a number of
locations. Predominantly these increases occur on the routes from the
development to the A46. It is likely that the increases in queueing along Evesham
Road could be further reduced by improvements to the network infrastructure in
this area. The increases in queueing on the routes between the town centre and
the proposed site are likely to be harder to mitigate. Further work on the gyratory,

potentially with the inclusion of signals on the Warwick Road entrance, additional
mitigation of the Banbury Road/Shipston Road roundabout (most likely widening)
and further enhancements to the Trinity Way/Seven Meadows Road junction are
also required.
Notably, the configuration of the network within Scenario 03 is the only one which
returns a reduction in queueing around the Evesham Place/Evesham Road junction
which indicates that the extent of the proposals adopted within the modelling
could well be reduced in future testing and a smaller scheme delivered.
In all other scenarios an increase in queueing is still experienced in the area of
Evesham Road/Evesham Place despite the presence of the enhanced mitigation.
Within Scenarios 04 and 05 the pattern of increase in queueing is comparable.
There are severe queues experienced along both routes into town that cross the
river (Seven Meadow Road and Clopton Bridge). The fact that both junctions
around Tiddington Road suffer increases in queueing indicates that there is less
scope to improve conditions in this area, whilst the queueing along the Seven
Meadows Road route into town indicates that, even with the mitigation in place at
Evesham Road, the network is not able to accommodate the additional
development demands.
It is interesting to note that the impacts are comparable between Scenario 04 and
Scenario 05 in spite of the different levels of housing. This is because the modelling
indicates that the development location in Scenario 5 provides development trips
with an alternative route to the north and M40 via the A429 whilst in Scenario 04
the majority of trips travel via the town centre and either Clopton Bridge or Seven
Meadows Road.
Strategic Options Analysis – Initial Summary
5.43 Analysis of the strategic scenarios indicates the following:
Scenario 02 and Scenario 03 are entirely dependent upon the delivery of the
respective relief roads as a minimum.
Scenario 03 suffers the greatest increase in journey times. Once the mitigation
measures are added, increases in the average journey times still exceed 10% but
this is in the context of an increase in completed trips of more than 10% also. Thus
some of the analysis will be affected by the fact that more of the longer distance
trips are completed in this scenario (symptomatic of the development location).
When considering journey times as a whole and focussing only on the Do
Something scenarios:
Scenario 02 is the only scenario tested which produces journey times which
are lower than the Reference Case journey times (Pre-STP) indicating that the
combination of the STP, the ERR and the development specific mitigation
measures will serve to mitigate the impacts of the development.
Journey times are consistently highest within the Scenario 03 network (AM &
PM).
Within the AM, journey times within Scenario 04 and 05 are comparable to the
Reference Case before the STP measures are included but during the PM there
is a marked increase in journey times in the same scenarios relative to the
Reference Case, therefore the mitigation is not as effective in the PM.
Within the PM, journey times in scenario 04 and 05 are only 5% quicker than
Scenario 03 despite it containing at least 2,000 more houses.It is therefore
unreasonable to assume that Scenarios 04 and 05 are performing better than
03.
The limited significant difference in both Scenario 04 and Scenario 05 network
performance indicates that both options perform at a comparable level.
Scenario 05 appears to perform better than 04, despite having more houses. This is
because a large number of those houses do not create trips bound for Stratford-
upon-Avon as the A429 serves as a better method for accessing the M40 whilst
more of the trips associated with Scenario 05 appear to travel through the town
centre network.
Scenario 02 clearly produces the best overall level of network performance, once
all mitigation has been included. Scenario 03 produced the worst levels of network
performance but allocates a far higher number of houses in a less accessible area
and so this is to be expected. Both scenarios, once mitigation measures have been
applied, appear to work but it is clear that Scenario 03 will suffer a greater degree
of residual impact than Scenario 02.
Strategic Options Analysis – Initial Conclusions
5.44 Analysis of the strategic scenarios produces the following conclusions:
Scenario 02 performs most favourably in traffic impact terms. This is likely to be
because the location of a relief road to the east is, potentially, more beneficial to
the wider road users than the location of a relief road to the west.
Scenario 03 performs least favourably but this should be taken in context of the
fact that this option delivers the largest number of houses. Option 03 also provides
scope for the internalisation of movements which has not currently been factored
into the assessment in any way.
All scenarios will require additional mitigation focussed in the following areas:
Clifford Lane/Shipston Road as the proposed signals are unlikely to be
sufficient (potentially not applicable to Scenario 02)
Evesham Road/Evesham Place – additional highway land required to
accommodate vehicle movements whilst some movements may also need to
be restricted.
The A46/A439 roundabout will require additional mitigation, most likely in the
form of signalisation.
Scenario 03 is the only scenario that may require a smaller mitigation scheme at
the Evesham Place/Evesham Road junction
Journey times in Scenario 04 and 05 are only 5% faster than Scenario 03 which may
indicate that even these scenarios may require the delivery of a relief road if
network impacts are to be minimised.
The impacts identified through the analysis of Scenario 03 reveals that it would be
considered highly undesirable to allocate Scenario 03 in combination with either
Scenario 04 or Scenario 05 since both would inevitably compound the issues and
impacts that have been identified through the analysis of the performance of
Scenario 03.
5.45 When considering the appropriate status of either the ERR or the SWRR, there is no tipping
point at which the need for a relief road becomes clearly discernible, nor is there a succinct
definition of ‘severe’ at this stage to identify what would render an option undeliverable
without a relief road.
5.46 However, it is considered reasonable to conclude that a relief road could be required at the
point when journey times within the network begin to exceed those within the Reference
Case prior to the application of the STP measures. This is considered appropriate in part
because the STP focussed mitigation measures to the north of the river and the growth is
frequently located to the south. This means that whilst general increases in journey times
are present across the modelled averages, these increases must be far greater in the south
due to the presence of the developments and limited potential for mitigation measures to be
delivered in the south, particularly due to the limited number of river crossings.
5.47 At the point at which the journey times in a scenario which includes the STP measures
exceeds the journey times in the reference case that occur prior to the STP being included, it
can be concluded that the additional capacity and benefits delivered by the STP have been
exhausted. If that is the case, the following options appear to indicate the need for
mitigation in addition to the STP and, where appropriate, development specific mitigation
measures, which would most likely comprise the delivery of an Eastern or South-Western
Relief Road:
Residential Options 02 & 04
Scenario 04 Do Something
Scenario 05 Do Something
Strategic Scenarios Analysis - Additional Considerations
5.48 Subsequent to the review of the results and the identification of the accompanying
conclusions, the following additional points of consideration have been identified:
As with the previous stage - the assessment includes some account of scheme
proposals at both the A3400/A46 Bishopton Island and A46/Alcester Road
‘Wildmoor’ roundabout. The exact form of these junctions is currently still to be
determined.

Additional measures are now also required at the Marraway roundabout but it is
not anticipated that there will be the same difficulties delivering schemes at this
junction as the land constraints appear less than those around ‘Wildmoor’.
Further enhancements will likely be required in the area of Evesham
Road/Evesham Place.
This work is based on simplistic assumptions pertaining to trip generation and
mode share. It is also based on existing distribution information. All of which
should be reviewed during any detailed stage of testing should it be undertaken.
Similarly it would be beneficial for the assessment to be revisited once the updated
Stratford-upon-Avon model becomes available since this model will cover the full
AM and PM period and allow the traffic dissipation period to be fully assessed (at
times the model currently cuts off at the point when traffic levels have plateaued)
as opposed to the two hour periods tested within the current assessment.

6 SOUTHAM FOCUSSED ANALYSIS
Results Overview
6.1 The same measures were used to assess the Southam developmental impacts as were
adopted during the Stratford focussed analysis, namely the following key network
performance indicators:
Model Stability – The number of successful runs expressed as a percentage of the
total runs completed.
Completed Trips (vehicles) – The number of completed trips recorded during the
model simulation.
Trip Completion Ratio – The percentage of assigned trips that are completed
within the model simulation period.
Average Speed (Km/h) – The average speed travelled by all vehicles that
completed a journey during the model simulation period.
Average Time (seconds) – The average travel time of a completed trip during the
model simulation period.
6.2 In addition to the above, more detailed analysis was undertaken pertaining to the impact on
queueing levels within the study areas for both the extended M40 and WLWA model areas.
Queue length analysis is intended to accompany the network wide analysis and provide a
more detailed picture of the impacts at specific junctions within the model network.
Southam Focussed Option Analysis
6.3 As outlined previously each of the residential options have been created on the following
basis:
Do Nothing – assignment of the development demands only.
Do Something – The Do Minimum with additional, development specific,
mitigation.
6.4 The Do Something scenarios were run for the 2000 and 3000 dwelling options only. The
mitigation measures identified in the Do Something comprised the changes identified within
Table 13.

Table 13: Southam Specific Mitigation Strategy (M40 Model)
Location Proposed Improvements A425 Leamington Rd / Kineton Rd roundabout
Widening on the A425 approaches (increase flare lengths) and increased radius and deflection to provide increased gaps from all approaches.
A423 Banbury Rd / Galanos House / A425 Leamington Rd roundabout
Widening on A423 & A425 approaches. Likely signalisation with 3000 dwellings.
A423 Coventry Road/A426 Although not included within the model, widening is anticipated at 2000 dwellings and signalisation may be required at 3000 dwellings
A423 / Daventry Rd roundabout Increased flare lengths on all approaches and addition of 2 lane exits (merge ~80m) on the A423 arms. Signalisation likely at 3,000 dwellings
A425 Southam Rd / B4455 Fosse Way roundabout
Widening on Fosse Way approaches with 2000 dwellings Signalisation with 3000 dwellings likely
6.5 Following the identification of the mitigation measures, the next stage of the analysis
reviewed the relative impacts of each of the residential options tested within the M40
model. The outcome of the comparisons, across the key scenarios, is documented within the
following Table 14 and Table 15 for the AM and PM periods respectively.
Table 14: 2031 Southam Dev Options AM (07:00 to 10:00) Network Performance Indicators
2031 Ref
Do Nothing Do Something 1000
dwell. 2000
dwell. 3000
dwell. 2000
dwell. 3000
dwell. Model Stability 100.0% 80.0% 100.0% 80.0% 80.0% 100.0%
Total Vehicles 75244 76414 77072 77337 77531 78515 Trip Completion Ratio 96.99% 96.82% 96.02% 94.76% 96.59% 96.20%
Average Speed per Vehicle 40.4 38.4 35.7 34 38.5 35.4 Average Delay (s) 458 485 528 559 488 535

Table 15: 2031 Southam Dev Options PM (16:00 to 19:00) Network Performance Indicators
2031 Ref
Do Nothing Do Something 1000
dwell. 2000
dwell. 3000
dwell. 2000
dwell. 3000
dwell. Model Stability 80.0% 80.0% 90.0% 90.0% 100.0% 100.0% Total Vehicles 74858 76028 76671 76993 77036 78141
Trip Completion Ratio 96.76% 96.60% 95.78% 94.60% 96.24% 96.01% Average Speed per Vehicle 40.1 38.8 36.2 33.2 38.1 36.7
Average Delay (s) 453 472 510 559 486 508
6.6 Analysis of the results presented within Table 13 and Table 14 reveals that all three
residential options experience negative impacts in terms of a reduction in the trips that are
completed and the average delays and speeds that occur within the model scenarios. As
would be expected the 3000 dwelling option induces the most severe impacts.
6.7 When reviewing the performance of the Do Something scenarios it is apparent that the
mitigation measures may not fully mitigate the impacts of the residential developments as
delays are still higher than the Reference Case, the speeds are lower and, most significantly,
the trip completion ratio also reduces which indicates that the number of trips that complete
within the simulation period, relative to the total assigned demands, reduces.
6.8 Analysis of the difference in queueing levels has been undertaken comparing the original
Reference Case and the Do Something networks created for each of the residential options.
6.9 Full disclosure of the queueing analysis, produced from the M40 Paramics model outputs, is
available within Appendix D, plots MQ001 to MQ010 inclusive.
6.10 A review of these plots reveals the following:
At 1000 dwellings the impacts are less discernible but a severe impact is predicted
within the PM at the A425/B4451 roundabout.
At 2000 dwellings the queuing impacts increase at the A425/B4451 roundabout
and the two A423 roundabouts, east of Southam (A423/A425 S and A423/A425 N)
that have been modelled. It is reasonable to assume that the A423/A426
roundabout would also require mitigation but this isn’t included within the current
model extent.
At 2000 dwellings, impacts are also discernible along the Fosse Way and Europa
Way Corridor. Previously, the Fosse Way/Chesterton Junction has already been
identified as requiring mitigation whilst the Europa Way junctions will be mitigated
via a contribution towards the WDC Local Plan infrastructure delivery schedule.
At 3000 dwellings there are some very severe impacts on the A452 and also severe
impacts to the south of Warwick and Leamington, the latter of which will likely be
mitigated via the allocation of the WDC Local Plan infrastructure.
6.11 Following the allocation of mitigation within the model, the following changes have been
observed:
All instances of very severe increases in queueing are removed at 2000 dwellings.
At 3000 dwellings there are still substantial increases occurring on the model
network. In part this is because the application of mitigation ensures more vehicles
are released onto the network which, in turn, induces problems downstream. This
may indicate the need for larger or more comprehensive mitigation measures to be
delivered in areas where mitigation has been assumed and also reveals that further
mitigation on the A452 route between Southam and Warwick/Leamington, as well
as the Europa Way Corridor, may also be required.
Southam Focussed Options Analysis – Initial Summary
6.12 Analysis of the relative performance of each of the residential options reveals the following:
The impacts up to 1,000 dwellings are less discernible than for 2,000 and 3,000
dwellings but there are still impacts on journey times and speeds that indicate
some mitigation is likely.
When reviewing the impacts, as expected, they occur along the A452, the Fosse
Way and Europa Way.
Mitigation along a number of junctions to the west of Southam as well as along the
A452 will likely be essential at between 2,000 to 3,000 dwellings, albeit to a greater
extent within the 3000 dwelling option. This may even include signalisation of the
Fosse Way/Southam Road junction which was previously just widened.

Warwick and Leamington Impact Analysis
6.13 Once the initial analysis had been completed within the M40 Paramics model it was then
considered necessary to undertake the assessment of impacts within the WLWA model.
6.14 The assessment of impacts within the WLWA model comprised the following scenarios:
WLWA 2031 Reference – 2031 WLWA Reference Case utilised during recent phases
of WDC Local Plan
WLWA 2031 Reference + 1000 dwellings – Reference Case plus demands extracted
from M40 model equivalent to 1000 dwellings
WLWA 2031 Reference + 2000 dwellings – Reference Case plus demands extracted
from M40 model (DS network) equivalent to 2000 dwellings
WLWA 2031 Reference + 3000 dwellings – Reference Case plus demands extracted
from M40 model (DS network) equivalent to 3000 dwellings
6.15 The initial network wide performance analysis, completed for the AM and PM model
periods, is presented within the following Table 16 and Table 17 for the AM and PM model
periods respectively:
Table 16: 2031 WLWA AM (07:00 to 10:00) Network Performance Indicators
2031 Ref
Do Nothing. 1000 dwell. 2000 dwell. 3000 dwell.
Model Stability 90.0% 80.0% 60.0% 50.0% Total Vehicles 122864 123872 124510 124859
Trip Completion Ratio 96.55% 96.33% 95.82% 95.10% Average Speed per Vehicle 34.4 33.8 32.6 32.3
Average Delay (s) 437 443 462 465
Table 17: 2031 Southam Dev Options PM (16:00 to 19:00) Network Performance Indicators
2031 Ref
Do Nothing. 1000 dwell. 2000 dwell. 3000 dwell.
Model Stability 80.0% 70.0% 70.0% 30.0% Total Vehicles 131524 132049 131874 132489
Trip Completion Ratio 96.24% 95.68% 94.63% 94.17% Average Speed per Vehicle 32.6 31.1 29.8 28.9
Average Delay (s) 445 465 490 506
6.16 Analysis of the previous tables reveals that at 3,000 dwellings the model stability is severely
impeded, particularly in the PM with less than one third of the model runs completing to a
satisfactory level. This is indicative of severe impacts and also reveals that a comprehensive
mitigation strategy would be essential if 3,000 dwellings were allocated in the Southam area.
6.17 The stability levels within the 2,000 dwelling scenario are also below a level that would be
considered acceptable in both AM and PM time periods, similarly the stability levels within
the 1,000 dwelling scenario are also poor.
6.18 All of this indicates that mitigation within the WLWA study area will be essential irrespective
of the number of dwellings allocated in the Southam area.
6.19 In addition to the observations of the model in operation, queue impact analysis plots have
been produced for the AM and PM peak periods and are presented within the accompanying
plots (MQ011 to MQ016) within Appendix D. Analysis of these plots reveals the following:
At 1,000 dwellings the impacts are relatively limited on the WLWA model area,
some queueing increases are noted in the area to the southwest but the rest of the
network appears to perform in a satisfactory manner.
At 2,000 dwellings the number of increases in queueing levels in the southwest
which occur as a result of the increase in traffic movements in this area. It should
be noted that the impacts identified are within the network which does not include
the WDC allocations or mitigation measures. Some of these mitigation measures
will reduce the amount of traffic in the area of Tachbrook Park Drive as they
encourage traffic to stay on Europa Way which will, in turn, lessen the impacts that
have been identified through the queueing analysis.
At 3,000 dwellings the increases in queueing observed within the 2,000 dwelling
scenario is exacerbated further with some severe increases in queueing identified
along Tachbrook Park Drive as well as Europa Way and around the Bath Street/High
Street area. In some of these areas WDC Local Plan mitigation already exists
although there will be a limit to the capacity unlocked by these schemes.
Warwick and Leamington Impact Analysis Summary
6.20 It should be acknowledged that the level of calibration around the Willes Road/Sydenham
Drive/Radford Road area is unlikely to reveal the true level of impact in this area. As such, a
more detailed assessment of this area is recommended.
6.21 Analysis of the model outputs, post allocation of the Southam housing within the WLWA,
indicates the following:
The impacts up to 1,000 dwellings are less discernible than 2,000 and 3,000 houses
but there are still impacts on journey times and speeds that indicate some
mitigation is likely.
The 2,000 and 3,000 dwelling scenarios will trigger the need for some of the WDC
mitigation measures to be delivered in advance of the WDC Local Plan sites and,
furthermore, may change the emphasis of that mitigation strategy. Previously the
mitigation strategy focussed on retaining trips along the Europa Way corridor by
ignoring impacts on Tachbrook Park Drive. Allocation of more development in
Southam may make this approach less feasible.
Southam Focussed Analysis – Conclusions
6.22 Analysis of the scenarios developed thus far reveal the following:
Below 1,000 dwellings it is likely that some mitigation measures may be required
around Southam and along the A425 between Southam and Warwick and
Leamington
At between 1,000 and 2,000 dwellings mitigation measures become essential at
most of the roundabouts to the east of Southam as well as at the Southam
Road/Fosse Way roundabout
At 3000 dwellings, mitigation measures are essential to the east of Southam and
also in the area of southwest Warwick/Leamington. Whereas 2,000 dwelling
impacts may be mitigated by widening and basic junction reconfiguration, the
3,000 dwelling options triggers much more substantial mitigation requirements.
The assessment of the impacts within the WLWA model reveals that, as the
quantum of development increases, a substantial number of junctions within
southwest Warwick/Leamington experience increases in queueing. Some of these
impacts would invariably be mitigated by the allocation of the WDC Local Plan
infrastructure schedule, however, given the prevalence of queueing increases in
the area of Tachbrook Road, there is a possibility that further mitigation may be
required in this area.
6.23 Thus it is reasonable to conclude that from early on in the development build out mitigation
measures will be required along the A423 to the east of Southam and along the A425
between Southam and Leamington with particular focus on the Fosse Way, Sydenham Drive
and Willes Road junctions.
6.24 If more development is built out then it is likely that contributions will be required towards
the delivery of a number of the WDC mitigation measures identified through the WDC Local
Plan testing, particularly those along Europa Way and in the Bath Street/Regent Street area.
Southam Focussed Analysis – Additional Considerations
6.25 It is recommended that further analysis is undertaken at the earliest opportunity should
substantial development be allocated in the Southam area to ensure that it does not
preclude the delivery of the proposals within the Bath Street and Regent Street area of south
Leamington.
6.26 The initial modelling for this area relies heavily on the M40 model which is a large model and
therefore suffers from poorer calibration in some areas than others. In order that the
conclusions and mitigation measures can be confirmed it is recommended that any detailed
assessments be undertaken in the Southam specific study area model due to be completed
in July 2015.
6.27 The analysis focuses only on the WLWA impacts relative to the reference case as this makes
them more easily determinable. A cumulative assessment would be considered desirable at
some stage should one or more of the options for housing in Southam be taken forward.
6.28 More analysis of the impacts of locating housing in specific parts of the study area as
opposed to a broad location is also considered desirable since this may alter, slightly, the
mitigation requirements at the strategic level. However, it is far more likely to exert an
impact on the more minor mitigation requirements not yet identified.

6.29 The extent of any future assessment should also consider the potential impact of trips
travelling northbound and eastbound from the sites to areas not currently considered within
the assessment.
7 SUMMARY AND CONCLUSIONS
Summary
7.1 Vectos Microsim (VM) has been commissioned by Stratford District Council (SDC) and
Warwickshire County Council (WCC) to update the recently completed Strategic Transport
Assessment work intended to look at the impacts of the allocation of various options
pertaining to the delivery of housing and employment within the Stratford-upon-Avon and
Southam areas.
7.2 The assessment was segregated into two sections:
A Stratford-upon-Avon focused assessment was completed which assessed the
potential impacts of a number of different local options for allocating employment
and housing within the area of Stratford-upon-Avon and also strategic options for
the allocation of housing across the study area.
A Southam focussed assessment which assesses the implications of allocating
housing in the Southam area based on increments of 1,000 dwellings.
7.3 In both cases the assessments are intended to serve as addendums to the previous Strategic
Transport Assessment work pertaining to the delivery of the SDC Core Strategy. It is
therefore considered appropriate that this report is read in conjunction with the historic STA
reports produced to inform the evidence base informing the Core Strategy decision making
process.
7.4 In addition, the opportunity has been taken to update the assessments in light of recent
developments in either modelling or planning terms, namely:
The approval of the Meon Vale and Codex Simms Metal housing developments to
the South of Stratford-upon-Aon and the associated mitigation measures.
The update, recalibration and revalidation of the M40 Paramics model to address
issues within the model concerning the assignment of traffic along the M40 and
also the profiling of trips associated with committed developments.

7.5 High level analysis of each of the scenarios, taking cognisance of the aforementioned
updates, was then completed to determine the potential implications that may arise as a
result of adopting one or more of the options identified through the assessment.
Scenarios – Stratford Focus
7.6 Two Stratford-upon-Avon Reference Cases were produced which are distinguished by the
inclusion of the Stratford Transport Package (STP). The STP measures are assumed to be an
essential mechanism for the delivery of growth and safeguarding the network operation in
light of the growth in housing and jobs anticipated for the area.
7.7 A staged approach to the production of the model scenarios of the Stratford-upon-Avon area
was undertaken whereby the key elements of growth were tested separately and, upon
completion of each individual assessment, some element of that growth was retained within
the next phase of the assessment.
7.8 Thus, the allocation of employment across three options was tested first. Depending upon
the composition of the residential assessments which followed, some element of the
employment was retained and then 4 options for the allocation of residential development
across the study area were tested.
7.9 Finally, with some localised housing and employment retained within the model network,
four options for the strategic allocation of housing within the study area were assessed. This
resulted in the development of the following scenarios:
2031 SuA Reference Case Updated – The original STA model scenario inclusive of
the Meon Vale and Codex Simms metal developments (930 dwellings in total)
2031 SuA Reference Case Updated + STP – The above scenario with the inclusion
of the 8 schemes identified as the Stratford Transport Package.
Employment Option 01 – 10 Ha of employment located in the area identified
through policy SUA.2 (100% B1) and the retention of employment in the area
identified as the Canal Quarter (CQ)
Employment Option 02 – 20 Ha of employment located in the area identified
through policy SUA.2 with a split of 10Ha (100% B1) to cover new employment and
10Ha to facilitate the relocation of existing employment from the CQ area (20% B1
30% B2, 30% B8 and 20% sui generis)

Employment Option 03 – 10 Ha of employment located in the area identified
through policy SUA.2 (100% B1) plus 10 Ha of land located to the south of
Stratford-upon-Avon, near Atherstone Airfield, to facilitate the relocation of
employment from the CQ area (20% B1, 30% B2, 30% B8 and 20% sui generis)
Residential Option 01 - 650 dwellings allocated north of the river and 650 dwellings
at SRZ
Residential Option 02 - 650 dwellings allocated to the south of the river and 650
dwellings at SRZ
Residential Option 03 - 650 dwellings allocated to the north of the river with SRZ
staying in employment use
Residential Option 04 - 650 dwellings allocated to the south of the river with SRZ
staying in employment use
Strategic Scenario 01 – Allocation of 500 dwellings to the North of Stratford in land
between the A46 and Bishopton Lane.
Strategic Scenario 02 - Allocation of 2,750 dwellings to the southeast of Stratford-
upon-Avon in land parcels around Banbury Road, Loxley Road and Trinity Way.
Strategic Scenario 03 - Allocation of 3,500 dwellings in the area of Long Marston
Airfield (LMA).
Strategic Scenario 04 - Allocation of 800 dwellings in the area of Meon Vale.
Strategic Scenario 05 - Allocation of 1,600 dwellings in the area of Wellesbourne
Airfield.
7.10 Strategic Scenario 01 was not assessed within the modelling since there was a broad
similarity between Strategic Scenario 01 and Residential Option 01 and 03 insofar as both
Residential options include an amount of housing delivered to the north of Stratford-upon-
Avon (albeit in broad locations) which is essentially mirrored within Strategic Scenario 01.
7.11 On that basis it was determined that the impacts likely to be identified in the analysis of this
strategic option would mirror those identified during the earlier phase of residential testing.
7.12 The Strategic Scenarios 02 to 04 were further amended on the following basis:
Do Nothing – assignment of the development demands only.
Do Minimum – The Do Nothing with the addition of the Eastern or South-Western
Relief Roads. (Scenario 02 & 03 only).
Do Something – The Do Minimum with additional, development specific,
mitigation.
Scenarios – Southam Focus
7.13 The Southam focussed assessment assessed the allocation of residential development
around the Southam area based on a 1,000, 2,000 or 3,000 dwellings quantum. Two
assessments were completed, the first focussed on the identification of Impacts within the
extended M40 Paramics model whilst the second reviewed the impacts within the Warwick
and Leamington Wide Are (WLWA) Paramics model.
7.14 The following scenarios were assessed within the M40 Paramics model:
M40 J14-J12 2031 Reference – 2031 Reference Case as adopted in recent core
strategy testing
M40 J14-J12 2031 Reference + 1000 dwellings – 2031 Reference Case plus
demands associated with 1000 dwellings
M40 J14-J12 2031 Reference + 2000 dwellings – 2031 Reference Case plus
demands associated with 2000 dwellings
M40 J14-J12 2031 Reference + 3000 dwellings – 2031 Reference Case plus
demands associated with 2000 dwellings
7.15 Focussed mitigation has been included in the 2,000 and 3,000 dwelling scenarios to alleviate
the issues highlighted in the original round of testing. This resulted in the production of the
following scenarios:
M40 J14-J12 2031 Reference + 2000 dwellings (Do Something Network) – 2000
dwellings plus mitigation
M40 J14-J12 2031 Reference + 3000 dwellings (Do Something Network) – 3000
dwellings plus mitigation
7.16 Upon completion of the Southam focussed testing, flows were then extracted from the M40
models and transposed into the WLWA models to produce the following scenarios:
WLWA 2031 Reference – 2028 WLWA Reference Case utilised during recent phases
of WDC core Strategy
WLWA 2031 Reference + 1000 dwellings – Reference Case plus demands extracted
from M40 model equivalent to 1,000 dwellings
WLWA 2031 Reference + 2000 dwellings – Reference Case plus demands extracted
from M40 model equivalent to 2,000 dwellings
WLWA 2031 Reference + 3000 dwellings – Reference Case plus demands extracted
from M40 model equivalent to 3,000 dwellings
Conclusion
7.17 The conclusions of this work are focussed either on the implications of allocating
development in close proximity to Stratford-upon-Avon or Southam and, as a result, are
presented separately as follows:
Stratford Focussed Assessment
7.18 When assessing the impacts of three different options for the allocation of employment
within the area of Stratford-upon-Avon, the following conclusions were drawn:
That the employment land to the north, near the A46/Alcester Road ‘Wildmoor’
roundabout will likely need to be accessed via a junction which caters for all
movements, any alternative option may unnecessarily increase the traffic
movements around the A46/Alcester Road ‘Wildmoor’ roundabout which is an area
already identified for mitigation as part of the STP.
Focussing the employment to the north, in an area close to the Strategic Road
Network, will result in improved network performance relative to the alternative
options which either retained some employment in the area known as the Canal
Quarter (CQ) or allocated some employment to the South of Stratford, close to
Atherstone Airfield.
Retaining some employment close to the town centre will have some negative
impacts due to the retention of traffic movements of this nature in this area.
Allocating employment south of the River will likely result in the greatest impacts,
in traffic terms, of any of the options. Potentially this option may expunge the
existing reserve capacity from the proposals for the ‘Waitrose’ junction which may,
in turn, trigger the need for larger mitigation measures in this area. This is
exacerbated by the location of the development in the testing which allocates the
employment on the A3400 south of the junction with Clifford Lane, increasing
conflicts with traffic moving between the A3400 and Clifford Lane.
7.19 Once the analysis of the employment options was completed, further analysis was
undertaken which focussed on the residential scenarios identified previously, the
conclusions drawn from this phase of assessment are outlined as follows:
Allocating housing to the north results in less impacts than allocating housing to the
south and, as such, should be considered favourable in traffic impact terms.
The network stability, during the PM, within Option 02 is such that it is considered
highly likely that additional mitigation measures would be required in this option.
This does not transpire within the alternative options and, therefore, it is
reasonable to conclude that, based on the current modelling evidence, Option 02 is
the least favourable in traffic impact terms.
Whilst Residential Option 04 does not suffer the same issues with instability,
network performance in this scenario is still lower in comparison to Option 01
despite Option 01 containing a higher level of housing. Thus, it is reasonable to
conclude that the lifespan of the exiting network and proposed STP measures will
be longer as a result of adopting either Option 01 or 03 when compared to Option
02 or 04.
These conclusions should be reviewed in conjunction with the supporting
sensitivity test outputs which reveal that delivery of between 500 and 650 houses
in the southeast will result in adverse impacts insofar as the new proposals for
Clopton Bridge are concerned. This further demonstrates that delivery of housing
to the north and in the region of the SRZ may be easier to realise than delivery of
housing to the Southeast.
7.20 Finally, the strategic options were also tested within the Stratford-upon-Avon Paramics
model which, when considering the performance of the model networks inclusive of
additional mitigation measures, revealed the following conclusions:
Scenario 02 performs most favourably in traffic impact terms. This is likely to be
because the location of a relief road to the east is, potentially, more beneficial to
the wider road users than the location of a relief road to the west.
Scenario 03 performs least favourably but this should be taken in context of the
fact that this option delivers the largest number of houses. Option 03 also provides
scope for the internalisation of movements which has not currently been factored
into the assessment in any way.
All scenarios will require additional mitigation focussed in the following areas:
Clifford Lane/Shipston Road as the proposed signals are unlikely to be
sufficient (potentially not applicable to Scenario 02)
Evesham Road/Evesham Place – additional highway land required to
accommodate vehicle movements whilst some movements may also need to
be restricted.
The A46/A439 roundabout will require additional mitigation, most likely in the
form of signalisation.
Scenario 03 is the only scenario that may require a smaller mitigation scheme at
the Evesham Place/Evesham Road junction
Journey times in Scenario 04 and 05 are only 5% faster than Scenario 03 which may
indicate that even these scenarios may require the delivery of a relief road if
network impacts are to be minimised.
The impacts identified through the analysis of Scenario 03 reveals that it would be
considered highly undesirable to allocate Scenario 03 in combination with either
Scenario 04 or Scenario 05 since both would inevitably compound the issues and
impacts that have been identified through the analysis of the performance of
Scenario 03.
7.21 When considering the appropriate status of either the ERR or the SWRR, there is no tipping
point at which the need for a relief road becomes clearly discernible, nor is there a succinct
definition of ‘severe’ at this stage to identify what would render an option undeliverable
without a relief road.
7.22 However, it is considered reasonable to conclude that a relief road could be required at the
point when journey times within the network begin to exceed those within the Reference
Case prior to the application of the STP measures. This is considered appropriate in part
because the STP focussed mitigation measures to the north of the river and the growth is
frequently located to the south. This means that whilst general increases in journey times
are present across the modelled averages, these increases must be far greater in the south
due to the presence of the developments and limited potential for mitigation measures to be
delivered in the south particularly due to the limited number of river crossings.
7.23 At the point at which the journey times in a scenario which includes the STP measures
exceeds the journey times in the reference case that occur prior to the STP being included, it
can be concluded that the additional capacity and benefits delivered by the STP have been
exhausted. If that is the case, the following options appear to indicate the need for
mitigation in addition to the STP and, were appropriate, development specific mitigation
measures, which would most likely comprise the delivery of an Eastern or South-Western
Relief Road:
Residential Options 02 & 04
Scenario 04 Do Something
Scenario 05 Do Something
Southam Focussed Assessment
7.24 Analysis of the scenarios developed thus far reveal the following:
Below 1,000 dwellings it is likely that some mitigation measures may be required
around Southam and along the A425 between Southam and Warwick and
Leamington
At between 1,000 and 2,000 dwellings mitigation measures become essential at
most of the roundabouts to the east of Southam as well as at the Southam
Road/Fosse Way roundabout
At 3000 dwellings, mitigation measures are essential to the east of Southam and
also in the area of Southwest Warwick/Leamington. Whereas 2,000 dwelling
impacts may be mitigated by widening and basic junction reconfiguration, the
3,000 dwelling options triggers much more substantial mitigation requirements.

The assessment of the impacts within the WLWA model reveals that, as the
quantum of development increases, a substantial number of junctions within
southwest Warwick/Leamington experience increases in queueing. Some of these
impacts would invariably be mitigated by the implementation of the WDC Local
Plan infrastructure schedule. However, given the prevalence of queueing increases
in the area of Tachbrook Road there is a possibility that further mitigation may be
required in this area.
7.25 Thus it is reasonable to conclude that from early on in the development build out mitigation
measures will be required along the A423 to the east of Southam and along the A425
between Southam and Leamington with particular focus on the Fosse Way, Sydenham Drive
and Willes Road junctions.
7.26 If more development is built out then it is likely that contributions will be required towards
the delivery of a number of the WDC mitigation measures identified through the WDC Local
Plan testing, particularly those along Europa Way and in the Bath Street/Regent Street area.
Recommendations and Additional Considerations
7.27 Throughout the course of the two assessments a number of recommendations and
additional considerations have been put forward which highlight elements which may need
to be considered during any more detailed assessments undertaken in relation to one or
more of the options assessed within this phase of the study.
7.28 It should also be acknowledged that not all of these issues may be addressed prior to the site
allocation and, furthermore, it may not be possible or appropriate to address certain issues
until the allocated sites are being promoted through the planning process.
Stratford Focus – Additional Considerations
7.29 Subsequent to the review of the results and the identification of the accompanying
conclusions, the following additional points of consideration have been identified based on
the Stratford Focussed Assessment:
The assessment includes some account of scheme proposals at both the
A3400/A46 Bishopton Island and A46/Alcester Road ‘Wildmoor’ roundabout. The
exact form of these junctions is currently still to be determined. However, the

strategic significance of these junctions may mean that additional sources of
funding for the junction improvements may be found to support their early delivery
to sustain economic growth within the area.
There is also a risk, that improvements at Wildmoor may require third party land.
Allocating employment and housing to the north increases the likelihood that a
larger mitigation scheme may be required at one, or both of the A46 junctions.
Conversely, there is a greater potential to deliver enhanced mitigation measures in
these areas than there are to the south where the network is heavily constrained
by the limited access to land due to the physical build out and reduced highway
boundary and limited points to cross the River Avon which constrains the
dissipation of the trips. Testing has already considered the updated proposals for
Clopton Bridge and it is understood that the potential to deliver further mitigation
in this area (other than the signalisation of the remaining gyratory entry arms) is
very limited.
Additional measures are also required at the Marraway roundabout to
accommodate the strategic scenario demands. It is not anticipated that there will
be the same difficulties delivering schemes at this junction as the land constraints
appear less than those around ‘Wildmoor’.
Further enhancements will likely be required in the area of Evesham
Road/Evesham.
This work is based on simplistic assumptions pertaining to trip generation and
mode share, it is also based on existing distribution information. All of which should
be reviewed during any detailed stage of testing should it be undertaken.
Similarly it would be beneficial for the assessment to be revisited once the updated
model becomes available since this model will cover the full AM and PM period and
allow the traffic dissipation period to be fully assessed (at times the model
currently cuts off at the point when traffic levels have plateaued) as opposed to the
two hour periods tested within the current assessment.
Further enhancements will likely be required in the area of Evesham
Road/Evesham Place – these require additional highway land and may be
contentious.
This work is based on simplistic assumptions pertaining to trip generation and
mode share, it is also based on existing distribution information. All of which should
be reviewed during any detailed stage of testing should it be undertaken.
Similarly it would be beneficial for the assessment to be revisited once the updated
Stratford-upon-Avon model becomes available since this model will cover the full
AM and PM period and allow the traffic dissipation period to be fully assessed (at
times the model currently cuts off at the point when traffic levels have plateaued)
as opposed to the two hour periods tested within the current assessment.
Southam Focus – Additional Considerations
7.30 It is recommended that further analysis is undertaken at the earliest opportunity should
development be allocated in the Southam area to ensure that it does not preclude the
delivery of the proposals within the Bath Street and Regent Street area of south Leamington.
7.31 The initial modelling for this area relies heavily on the M40 model which is a large model and
therefore suffers from poorer calibration in some areas than others. In order that the
conclusions and mitigation measures can be confirmed it is recommended that any detailed
assessments be undertaken in the Southam specific study area model due to be completed
in July 2015.
7.32 The analysis focuses only on the WLWA impacts relative to the reference case as this makes
them more easily determinable. A cumulative assessment would be considered desirable at
some stage should one or more of the options for housing in Southam be taken forward.
7.33 More analysis of the impacts of locating housing in specific parts of the study area as
opposed to a broad location is also considered desirable since this may alter, slightly, the
mitigation requirements at the strategic level. However, it is far more likely to exert an
impact on the more minor mitigation requirements not yet identified.
7.34 The extent of any future assessment should also consider the potential impact of trips
travelling northbound and eastbound from the sites to areas not currently considered within
the assessment.

Stratford-on-Avon Strategic Transport
Assessment: Further Focussed Options Analysis
May 2015


Southeast Stratford Threshold Testing – Modelling Outputs & Analysis
Introduction
1. Warwickshire County Council (WCC) and Stratford District Council (SDC) have requested Vectos Microsim (VM) undertake a threshold assessment to determine the level of housing that can likely be delivered within the area of Southeast Stratford within the confines of the current Clopton Bridge scheme proposals.
Background
2. During early 2015 a cordon model of the Tiddington Road and Stratford Gyratory model was developed, based specifically on 2015 survey data. The objective of the development of this model was to ensure that the vehicular movements across the cordon area were modelled in as much detail as possible and that this modelling was based on current observations of traffic conditions rather than historic observations which have then been subject to a forecasting procedure.
3. The coverage of the updated 2015 Tiddington Road/Stratford Gyratory model is illustrated within Figure 1.
Figure 1 – Cordon Model Extent
Page: 2
4. Updating a cordon model entails the revisiting of model assumptions in light of newly available traffic observations alongside a detailed review of how the model reflects the observed conditions as well as how the modelled flows, delays and queues match observations.
5. Thus, the production of cordon models can be both time consuming and costly. It is therefore only considered necessary to adopt such an approach in areas where the congestion effects are not fully realised within a wide area model or, alternatively, in areas where a clear answer cannot be obtained via an assessment undertaken only in a wide area traffic model.
6. As a result of the aforementioned modelling and analysis supported the Meon Vale proposals (550 dwellings and associated infrastructure), based on the assumption that the scheme at Clopton Bridge and Tiddington Road is delivered in full.
7. The scheme proposals centre on the reconfiguration of the Tiddington Road/Clopton Bridge priority junction to a signalised configuration. Introduction of the signals ensures that the right turn out of Tiddington Road towards Stratford-upon-Avon town centre can now be facilitated. By allowing this movement, the number of vehicles making a U-turn at the downstream Banbury Road/Shipston Road roundabout is reduced considerably.
8. The need for the U-turn is not removed completely since it is still not possible for vehicles travelling SB along Clopton Bridge to turn right into Swans Nest Lane and, therefore, these vehicles must continue south to the roundabout and complete the U-turn to access the car park.
9. The scheme proposals also include the reconfiguration of the northern end of Clopton Bridge to include signals and some widening so that traffic travelling SB along Bridgefoot can be segregated based on whether the vehicles are intending to turn left along Clopton Bridge or right towards the town centre.
10. Sketches of the proposals for the reconfiguration of the junctions to the north and south of Clopton Bridge have been provided within Figure 2 and Figure 3 on the following page.
Objective
11. The objective of this assessment is to understand the implications, on the scheme proposals and network operation within the study area, of delivering up to 650 additional dwellings in an area to the southeast of Stratford-upon-Avon and, specifically, to understand whether additional housing can be accommodated within the current extent of the scheme proposals.
12. At this stage, the purpose is to ascertain whether there are any significant barriers to the delivery of housing at the levels identified thus far and provide commentary on this where appropriate.
13. This work is not intended to provide a detailed impact analysis of the scenarios that have been assessed, rather it is intended to provide a high level overview of the network performance and identify whether there are any severe impacts that would render the level
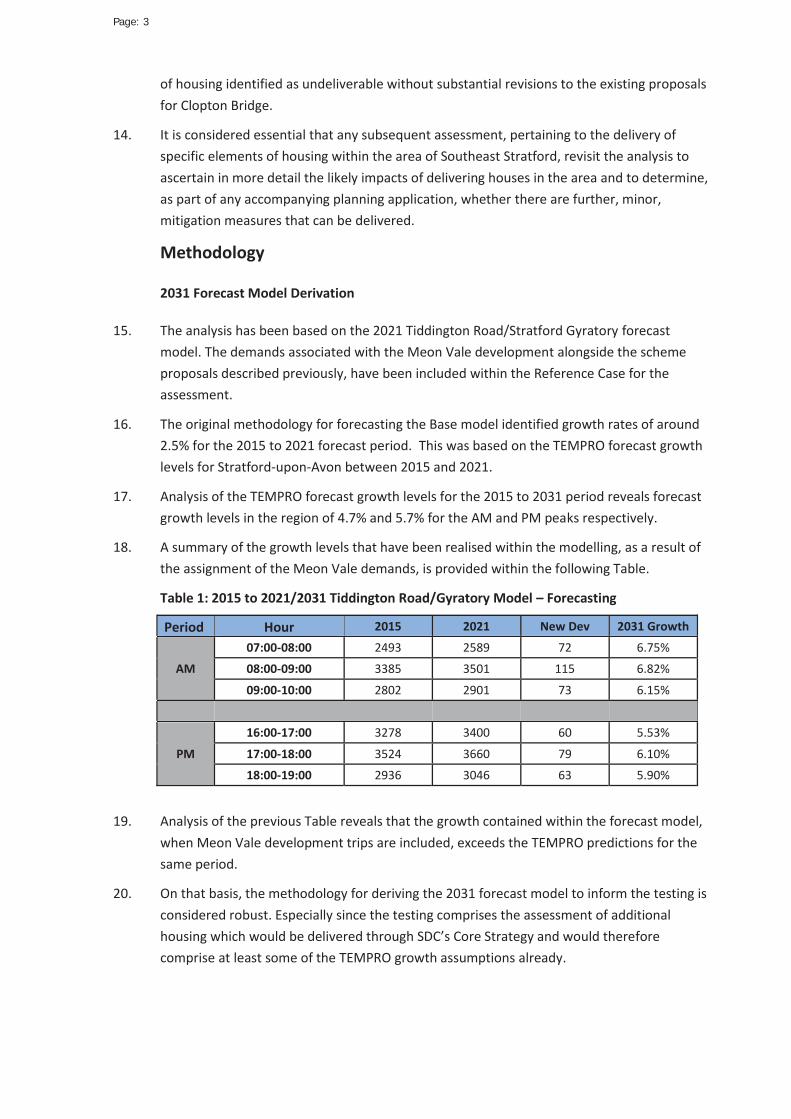
Page: 3
of housing identified as undeliverable without substantial revisions to the existing proposals for Clopton Bridge.
14. It is considered essential that any subsequent assessment, pertaining to the delivery of specific elements of housing within the area of Southeast Stratford, revisit the analysis to ascertain in more detail the likely impacts of delivering houses in the area and to determine, as part of any accompanying planning application, whether there are further, minor, mitigation measures that can be delivered.
Methodology
2031 Forecast Model Derivation
15. The analysis has been based on the 2021 Tiddington Road/Stratford Gyratory forecast model. The demands associated with the Meon Vale development alongside the scheme proposals described previously, have been included within the Reference Case for the assessment.
16. The original methodology for forecasting the Base model identified growth rates of around 2.5% for the 2015 to 2021 forecast period. This was based on the TEMPRO forecast growth levels for Stratford-upon-Avon between 2015 and 2021.
17. Analysis of the TEMPRO forecast growth levels for the 2015 to 2031 period reveals forecast growth levels in the region of 4.7% and 5.7% for the AM and PM peaks respectively.
18. A summary of the growth levels that have been realised within the modelling, as a result of the assignment of the Meon Vale demands, is provided within the following Table.
Table 1: 2015 to 2021/2031 Tiddington Road/Gyratory Model – Forecasting
Period Hour 2015 2021 New Dev 2031 Growth
AM
07:00-08:00 2493 2589 72 6.75%
08:00-09:00 3385 3501 115 6.82%
09:00-10:00 2802 2901 73 6.15%
PM
16:00-17:00 3278 3400 60 5.53%
17:00-18:00 3524 3660 79 6.10%
18:00-19:00 2936 3046 63 5.90%
19. Analysis of the previous Table reveals that the growth contained within the forecast model, when Meon Vale development trips are included, exceeds the TEMPRO predictions for the same period.
20. On that basis, the methodology for deriving the 2031 forecast model to inform the testing is considered robust. Especially since the testing comprises the assessment of additional housing which would be delivered through SDC’s Core Strategy and would therefore comprise at least some of the TEMPRO growth assumptions already.

Page: 4
21. In addition to the allocation of the forecast demands, it was also necessary to include the scheme proposals as identified in the recent planning application for the Meon Vale proposed development.
22. The scheme proposals comprise reconfiguration of the Tiddington Road/Clopton Bridge junction to enable signal control and to facilitate the right turn movement out of Tiddington Road. In addition, the Bridgefoot/Clopton Bridge junction to the northwest of Clopton Bridge also comes under formal signal control.
23. The configuration of the proposals for both the north-eastern and south-western ends of Clopton bridge are illustrated within Figure 2 and Figure 3 respectively:
Figure 2 – Clopton Bridge/Bridgefoot Scheme proposals
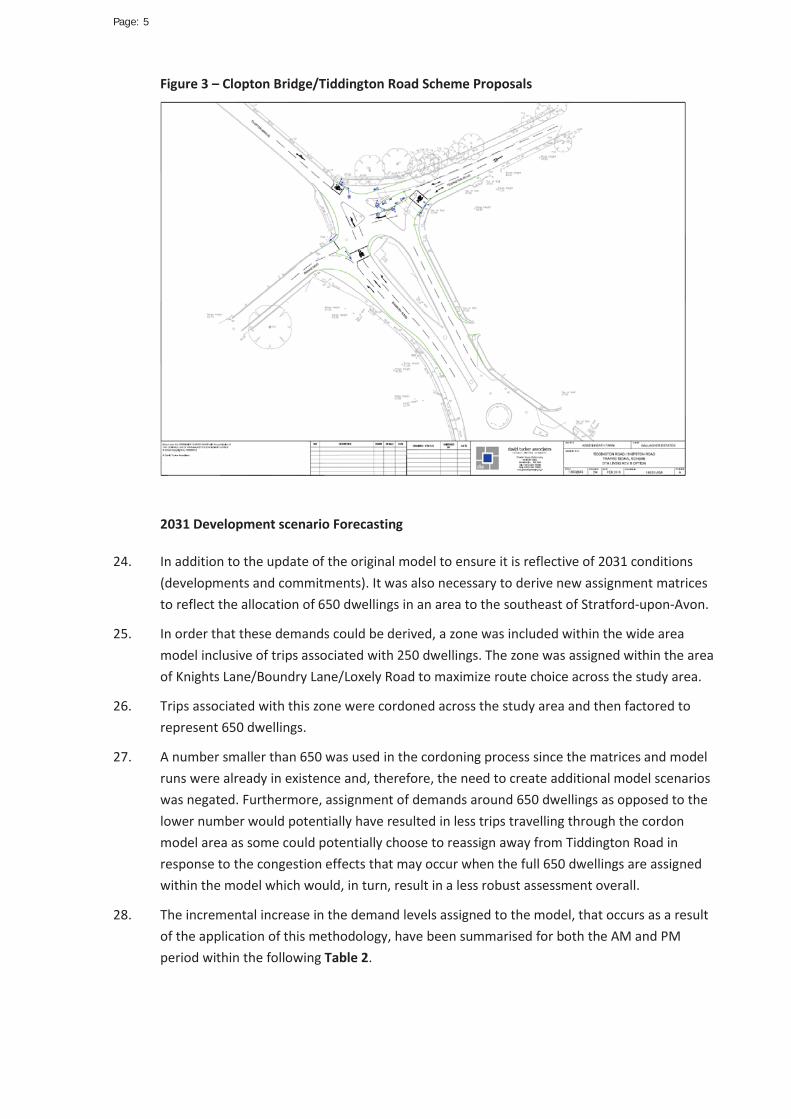
Page: 5
Figure 3 – Clopton Bridge/Tiddington Road Scheme Proposals
2031 Development scenario Forecasting
24. In addition to the update of the original model to ensure it is reflective of 2031 conditions (developments and commitments). It was also necessary to derive new assignment matrices to reflect the allocation of 650 dwellings in an area to the southeast of Stratford-upon-Avon.
25. In order that these demands could be derived, a zone was included within the wide area model inclusive of trips associated with 250 dwellings. The zone was assigned within the area of Knights Lane/Boundry Lane/Loxely Road to maximize route choice across the study area.
26. Trips associated with this zone were cordoned across the study area and then factored to represent 650 dwellings.
27. A number smaller than 650 was used in the cordoning process since the matrices and model runs were already in existence and, therefore, the need to create additional model scenarios was negated. Furthermore, assignment of demands around 650 dwellings as opposed to the lower number would potentially have resulted in less trips travelling through the cordon model area as some could potentially choose to reassign away from Tiddington Road in response to the congestion effects that may occur when the full 650 dwellings are assigned within the model which would, in turn, result in a less robust assessment overall.
28. The incremental increase in the demand levels assigned to the model, that occurs as a result of the application of this methodology, have been summarised for both the AM and PM period within the following Table 2.
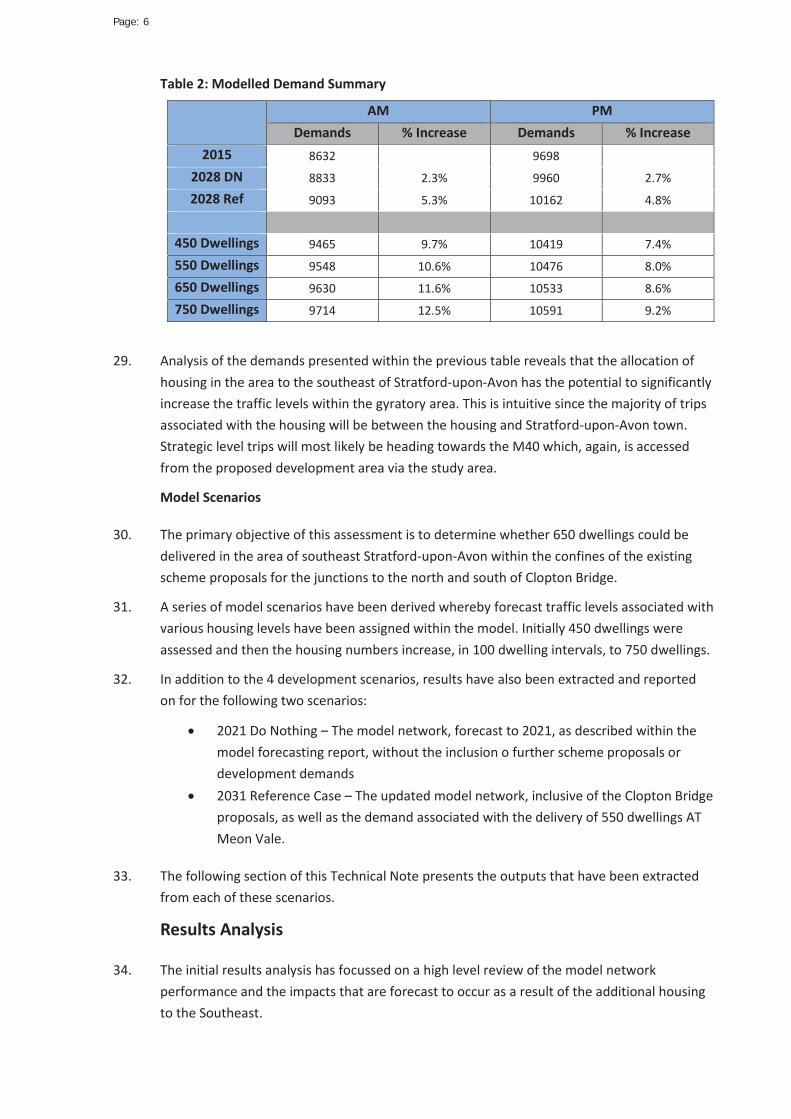
Page: 6
Table 2: Modelled Demand Summary
AM PM Demands % Increase Demands % Increase
2015 8632 9698
2028 DN 8833 2.3% 9960 2.7%
2028 Ref 9093 5.3% 10162 4.8%
450 Dwellings 9465 9.7% 10419 7.4%
550 Dwellings 9548 10.6% 10476 8.0%
650 Dwellings 9630 11.6% 10533 8.6%
750 Dwellings 9714 12.5% 10591 9.2%
29. Analysis of the demands presented within the previous table reveals that the allocation of housing in the area to the southeast of Stratford-upon-Avon has the potential to significantly increase the traffic levels within the gyratory area. This is intuitive since the majority of trips associated with the housing will be between the housing and Stratford-upon-Avon town. Strategic level trips will most likely be heading towards the M40 which, again, is accessed from the proposed development area via the study area.
Model Scenarios
30. The primary objective of this assessment is to determine whether 650 dwellings could be delivered in the area of southeast Stratford-upon-Avon within the confines of the existing scheme proposals for the junctions to the north and south of Clopton Bridge.
31. A series of model scenarios have been derived whereby forecast traffic levels associated with various housing levels have been assigned within the model. Initially 450 dwellings were assessed and then the housing numbers increase, in 100 dwelling intervals, to 750 dwellings.
32. In addition to the 4 development scenarios, results have also been extracted and reported on for the following two scenarios:
2021 Do Nothing – The model network, forecast to 2021, as described within the model forecasting report, without the inclusion o further scheme proposals or development demands
2031 Reference Case – The updated model network, inclusive of the Clopton Bridge proposals, as well as the demand associated with the delivery of 550 dwellings AT Meon Vale.
33. The following section of this Technical Note presents the outputs that have been extracted from each of these scenarios.
Results Analysis
34. The initial results analysis has focussed on a high level review of the model network performance and the impacts that are forecast to occur as a result of the additional housing to the Southeast.
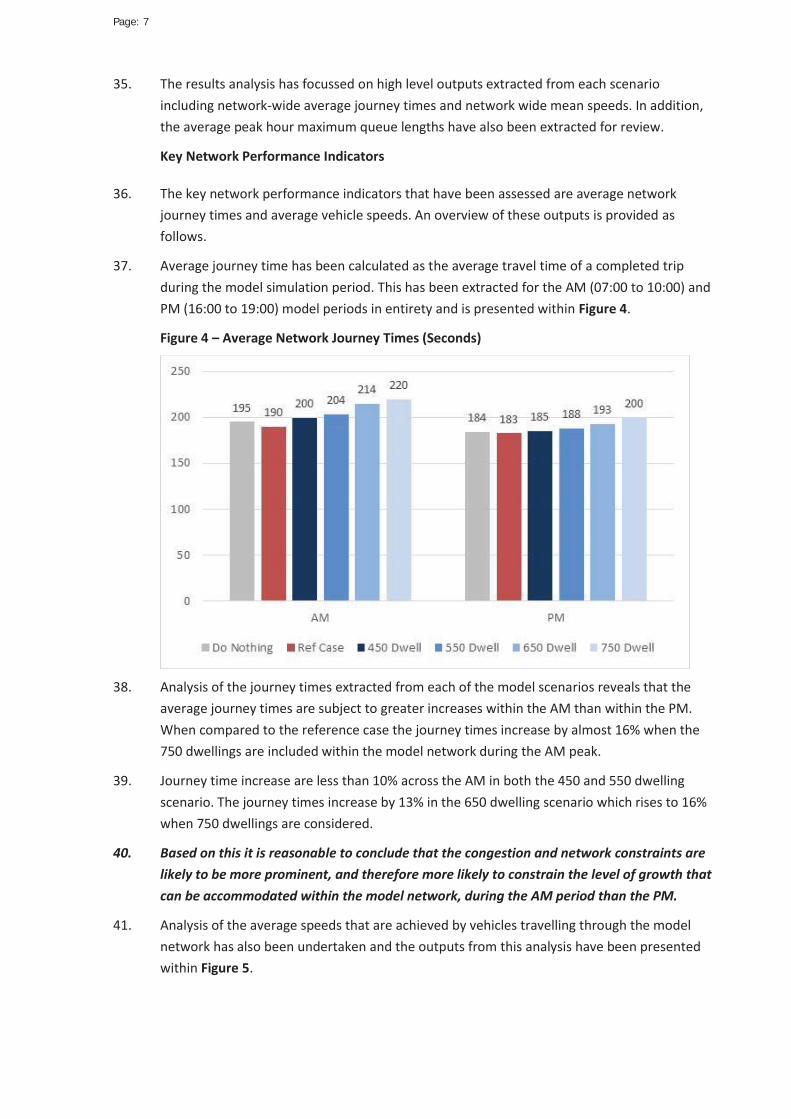
Page: 7
35. The results analysis has focussed on high level outputs extracted from each scenario including network-wide average journey times and network wide mean speeds. In addition, the average peak hour maximum queue lengths have also been extracted for review.
Key Network Performance Indicators
36. The key network performance indicators that have been assessed are average network journey times and average vehicle speeds. An overview of these outputs is provided as follows.
37. Average journey time has been calculated as the average travel time of a completed trip during the model simulation period. This has been extracted for the AM (07:00 to 10:00) and PM (16:00 to 19:00) model periods in entirety and is presented within Figure 4.
Figure 4 – Average Network Journey Times (Seconds)
38. Analysis of the journey times extracted from each of the model scenarios reveals that the
average journey times are subject to greater increases within the AM than within the PM. When compared to the reference case the journey times increase by almost 16% when the 750 dwellings are included within the model network during the AM peak.
39. Journey time increase are less than 10% across the AM in both the 450 and 550 dwelling scenario. The journey times increase by 13% in the 650 dwelling scenario which rises to 16% when 750 dwellings are considered.
40. Based on this it is reasonable to conclude that the congestion and network constraints are likely to be more prominent, and therefore more likely to constrain the level of growth that can be accommodated within the model network, during the AM period than the PM.
41. Analysis of the average speeds that are achieved by vehicles travelling through the model network has also been undertaken and the outputs from this analysis have been presented within Figure 5.

Page: 8
Figure 5 – Average Journey Speeds (KpH)
42. As with the analysis of the average journey times, average speeds have been extracted and
calculated for the full AM (07:00 to 10:00) and PM (16:00 to 19:00) model periods. This is based on the average speed travelled by all vehicles that complete a journey during the model simulation period.
43. In line with the analysis of the modelled journey times, analysis of the changes in the average speeds reveals that the speeds are comparable across the Ref Case and 450 and 550 dwelling options within the PM period and that, overall, the impacts on journey speeds are less pronounced during the PM period than the AM period.
44. During the AM period, average speeds are highest within the Reference Case. It should be noted that average speeds are higher in the Reference Case than the Do Nothing in spite of the allocation of an additional 5 to 6% growth in traffic levels. This is due to the inclusion of the signal proposals on Clopton Bridge.
45. During the AM, speeds are 10% lower in the 650 dwelling scenario than the Reference Case and this difference increases even further in the 750 dwelling scenario. Within the 450 and 550 scenarios the reduction is less than 10% when compared to the Reference Case.
46. Based on this analysis it is reasonable to conclude that the effects of the congestion which occurs as a result of the additional housing is likely to be more severe around the levels of traffic likely to be induced by the allocation of 650 dwellings and certainly at the 750 dwelling mark.
Average Maximum Queue Lengths
47. In addition to the analysis of the key network performance indicators, analysis of the average hourly maximum queue lengths, in vehicles, has also been undertaken. In light of the findings presented within the previous section of this note, the following analysis of the queue lengths has focused on the AM queueing levels.
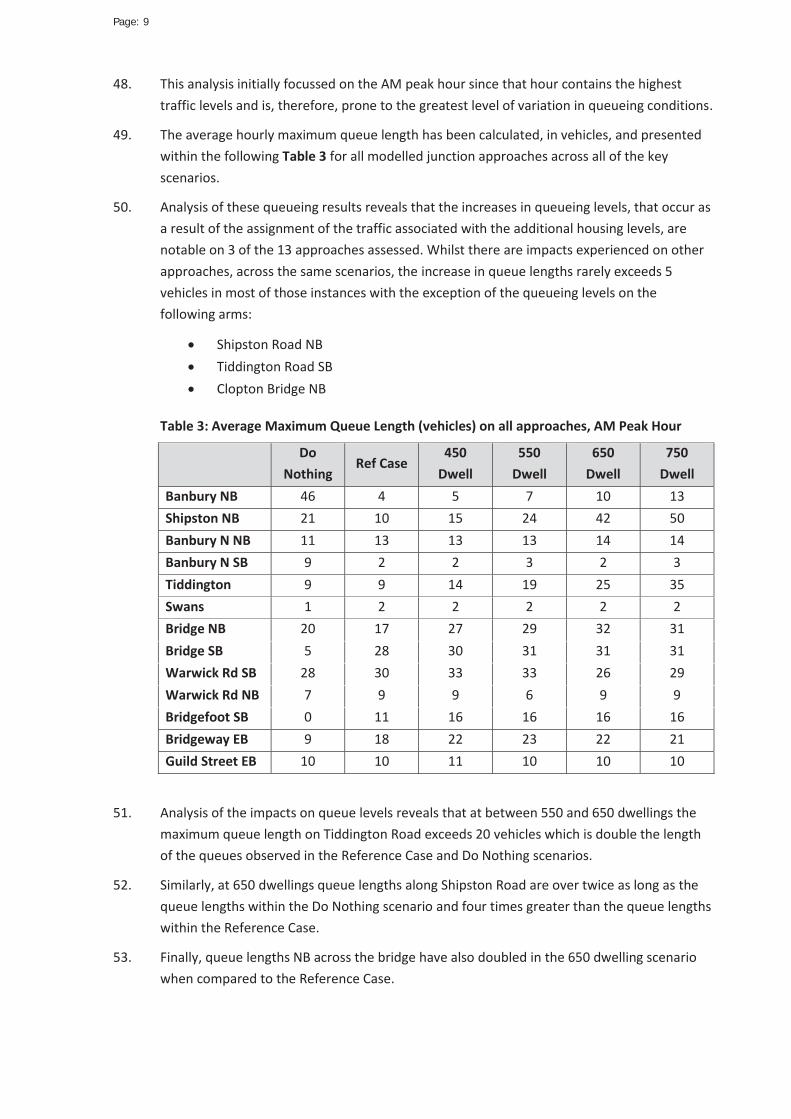
Page: 9
48. This analysis initially focussed on the AM peak hour since that hour contains the highest traffic levels and is, therefore, prone to the greatest level of variation in queueing conditions.
49. The average hourly maximum queue length has been calculated, in vehicles, and presented within the following Table 3 for all modelled junction approaches across all of the key scenarios.
50. Analysis of these queueing results reveals that the increases in queueing levels, that occur as a result of the assignment of the traffic associated with the additional housing levels, are notable on 3 of the 13 approaches assessed. Whilst there are impacts experienced on other approaches, across the same scenarios, the increase in queue lengths rarely exceeds 5 vehicles in most of those instances with the exception of the queueing levels on the following arms:
Shipston Road NB Tiddington Road SB Clopton Bridge NB
Table 3: Average Maximum Queue Length (vehicles) on all approaches, AM Peak Hour
Do
Nothing Ref Case
450 Dwell
550 Dwell
650 Dwell
750 Dwell
Banbury NB 46 4 5 7 10 13 Shipston NB 21 10 15 24 42 50 Banbury N NB 11 13 13 13 14 14 Banbury N SB 9 2 2 3 2 3 Tiddington 9 9 14 19 25 35 Swans 1 2 2 2 2 2 Bridge NB 20 17 27 29 32 31 Bridge SB 5 28 30 31 31 31 Warwick Rd SB 28 30 33 33 26 29 Warwick Rd NB 7 9 9 6 9 9 Bridgefoot SB 0 11 16 16 16 16 Bridgeway EB 9 18 22 23 22 21 Guild Street EB 10 10 11 10 10 10
51. Analysis of the impacts on queue levels reveals that at between 550 and 650 dwellings the maximum queue length on Tiddington Road exceeds 20 vehicles which is double the length of the queues observed in the Reference Case and Do Nothing scenarios.
52. Similarly, at 650 dwellings queue lengths along Shipston Road are over twice as long as the queue lengths within the Do Nothing scenario and four times greater than the queue lengths within the Reference Case.
53. Finally, queue lengths NB across the bridge have also doubled in the 650 dwelling scenario when compared to the Reference Case.

Page: 10
54. Whist queueing on the Bridge NB remains fairly static between the 650 and 750 dwelling scenarios, the queueing along Tiddington Road and Shipston Road increase by a further 25% compared to the levels experienced within the 650 dwelling scenario.
55. On that basis it is reasonable to conclude that, at between 550 and 650 dwellings, the queue increases within the study area are likely to become severe and, when considering Tiddington Road and Shipston Road, the magnitude of increasing queueing is rapid beyond 650 dwellings.
56. It should also be noted that Tiddington Road and Shiptson Road are prone to the greatest increases in queue levels and there is little that can be done to further mitigate the impacts of queueing along either of these approaches. The queueing on Shipston Road is intrinsically linked to the Clopton Bridge NB queue, and therefore it can be assumed that this queue is blocking back across Shipston Road in at least some of these scenarios. The queueing on Tiddington Road is a function of the need to maintain traffic flow levels across the bridge. Since traffic movements NB and SB across the bridge are prioritised at the expense of Tiddington road, through the signal proposals, there is little scope to further mitigate these impacts within the current extent of the scheme proposals.
Conclusions
57. Based on the analysis set out previously, the following conclusions have been drawn:
The congestion and network constraints are likely to be more prominent, and therefore more likely to constraint the level of growth that can be accommodated within the model network, during the AM period than the PM.
The effects of the congestion which occurs as a result of the additional housing is likely to be more severe around the levels of traffic likely to be induced by the allocation of 650 dwellings and certainly at the 750 dwelling mark.
Between 550 and 650 dwellings, the queue increases within the study area are likely to become more severe and the magnitude of increasing queueing is rapid beyond 650 dwellings.
Whilst 650 dwellings can be accommodated within the extent of the current scheme proposals there are likely to be substantial increases in queueing levels along Tiddington Road and there is little scope, within the extent of the current scheme proposals, to mitigate these impacts.
58. Based on the above it should be acknowledged that allocating a level of housing beyond 650 dwellings would likely result in very severe impacts, specifically in terms of impacts on Shipston Road and Tiddington Road queues.
59. It should also be acknowledged that allocating 650 dwellings southeast of Stratford town centre, will induce increases in the level of queued traffic on Tiddington road and that it is unlikely that these impacts can be mitigated without significant revisions to the mitigation proposals within the area.

Page: 11
60. Most likely any substantial mitigation would need to include the delivery of measures which serve to minimise the traffic levels along Clopton Bridge, and also Tiddington Road, as would be provided by an additional river crossing.
61. Interim measures that could also be delivered, over the proposals tested currently, include those measures identified as part of the Stratford Transport Package, specifically signalisation of the Bridge Street entry into the gyratory, rationalisation of the pedestrian crossing points across the junction and potential signalisation of the Warwick Road entry arm into the gyratory.


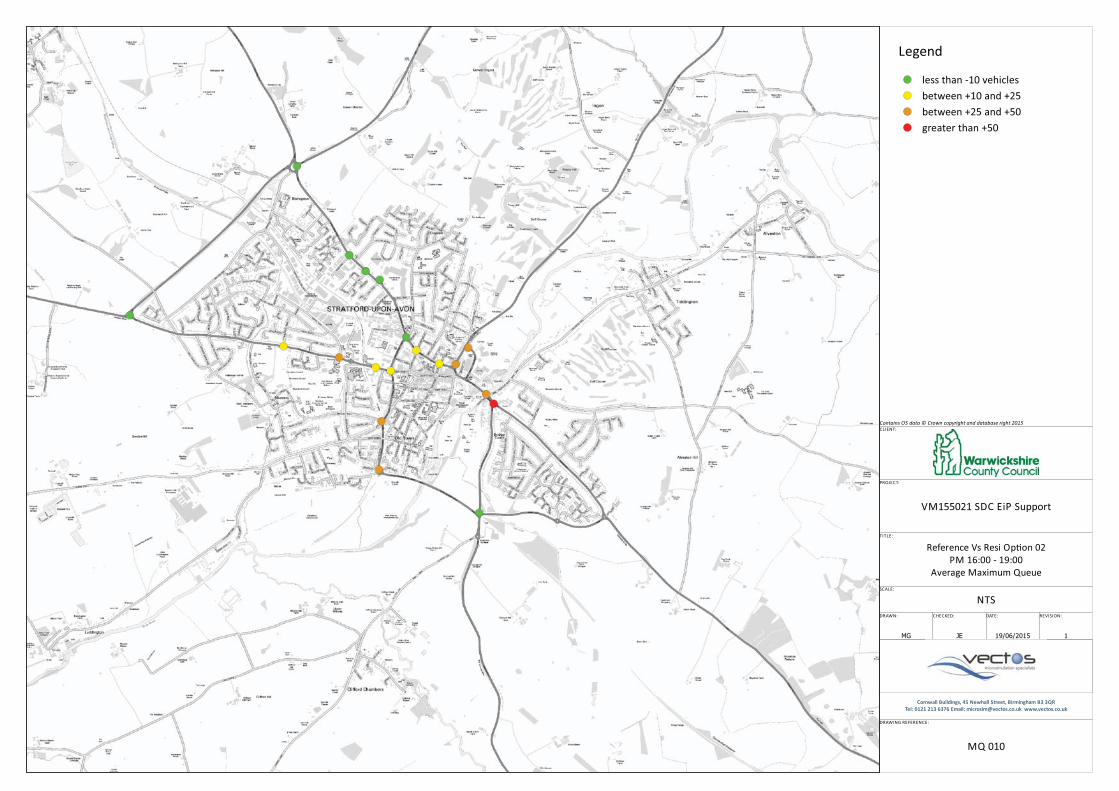


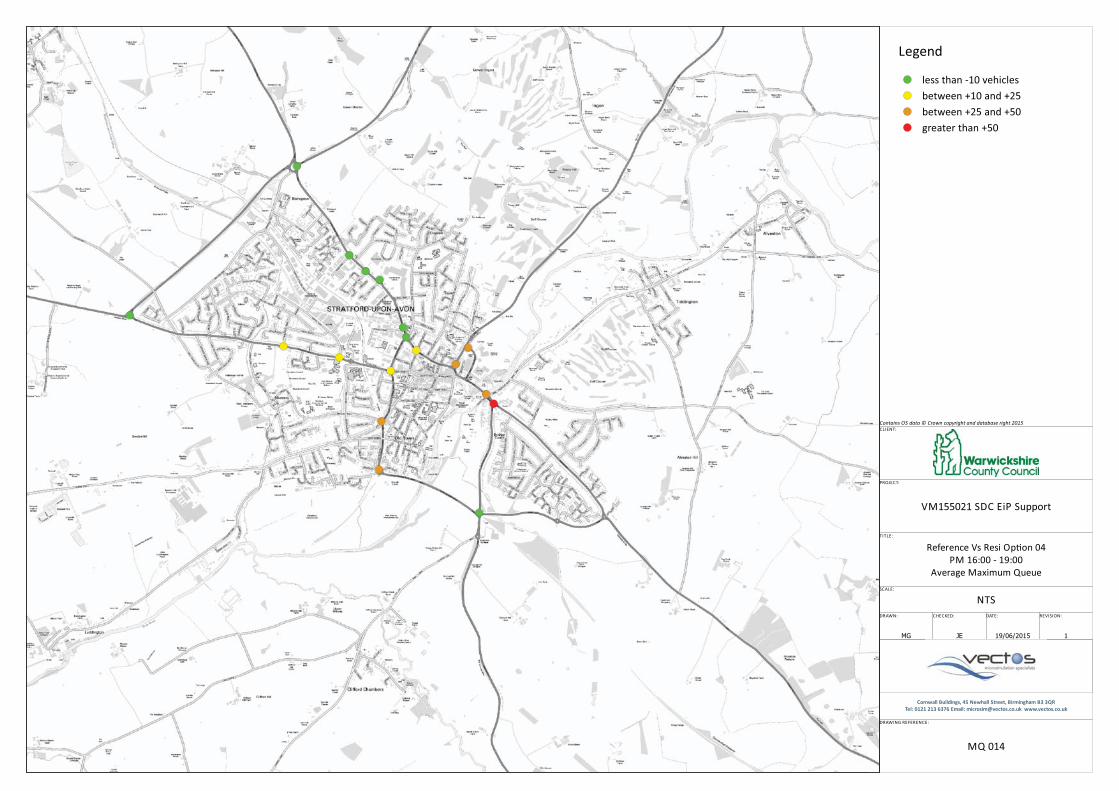
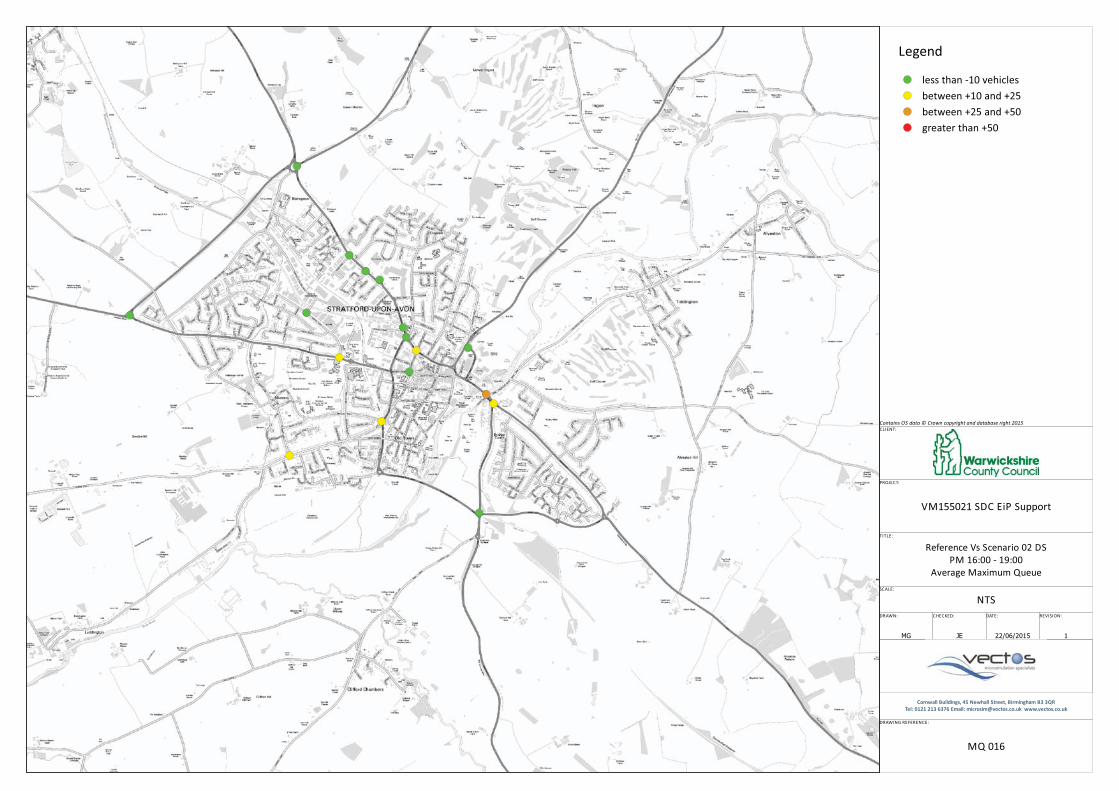


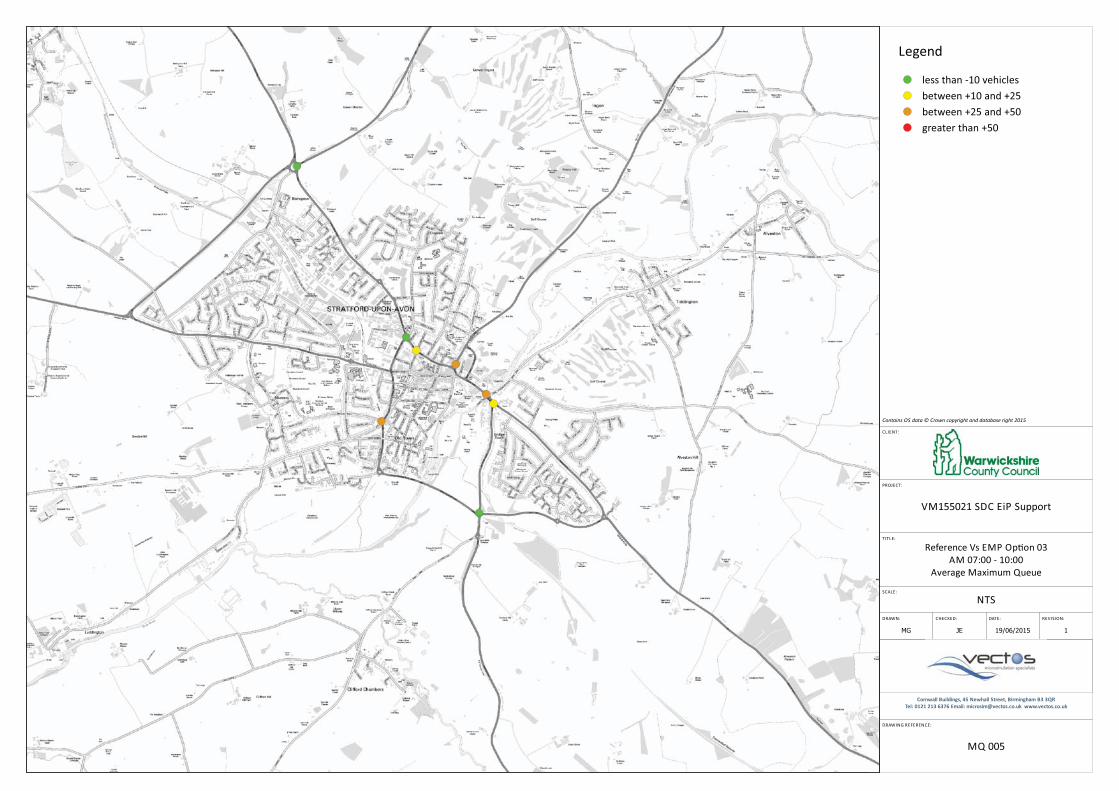

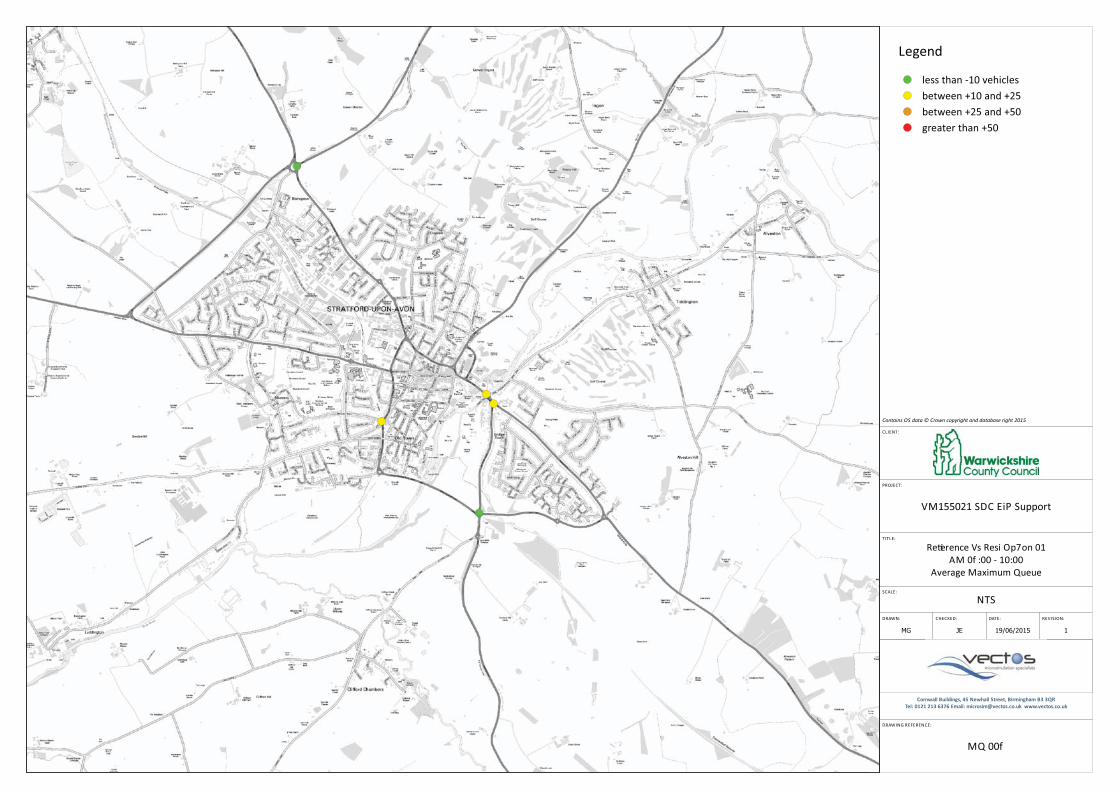
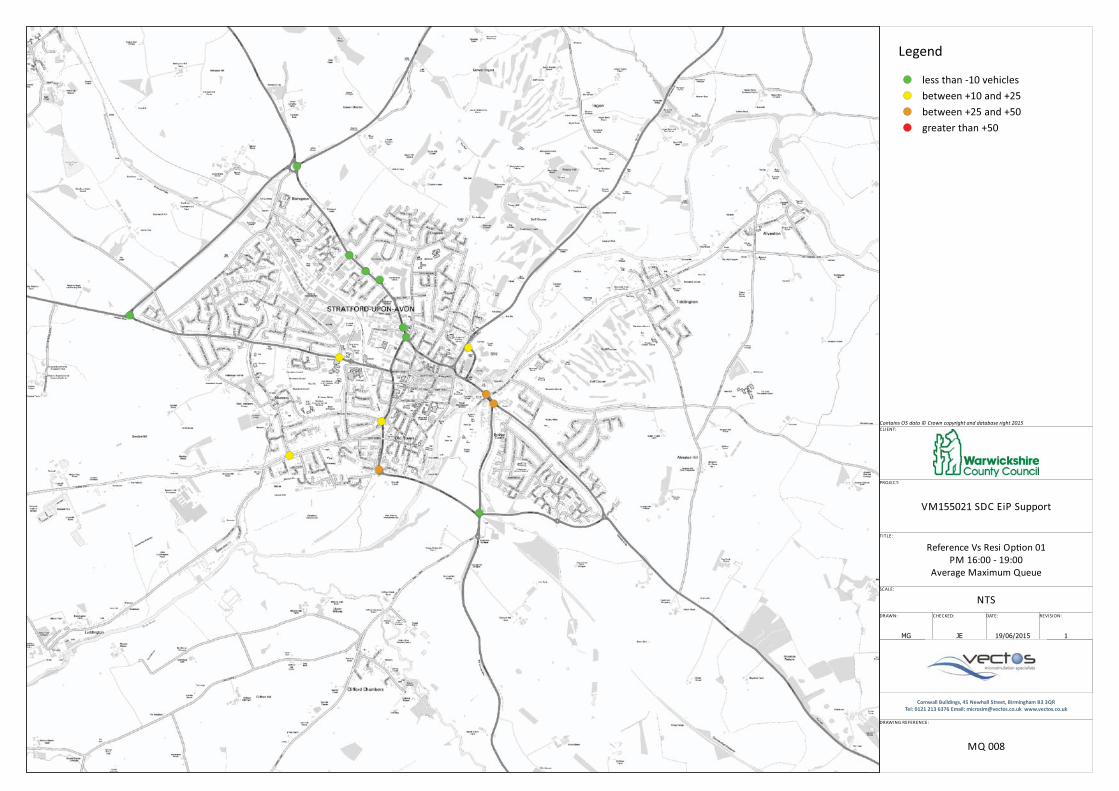
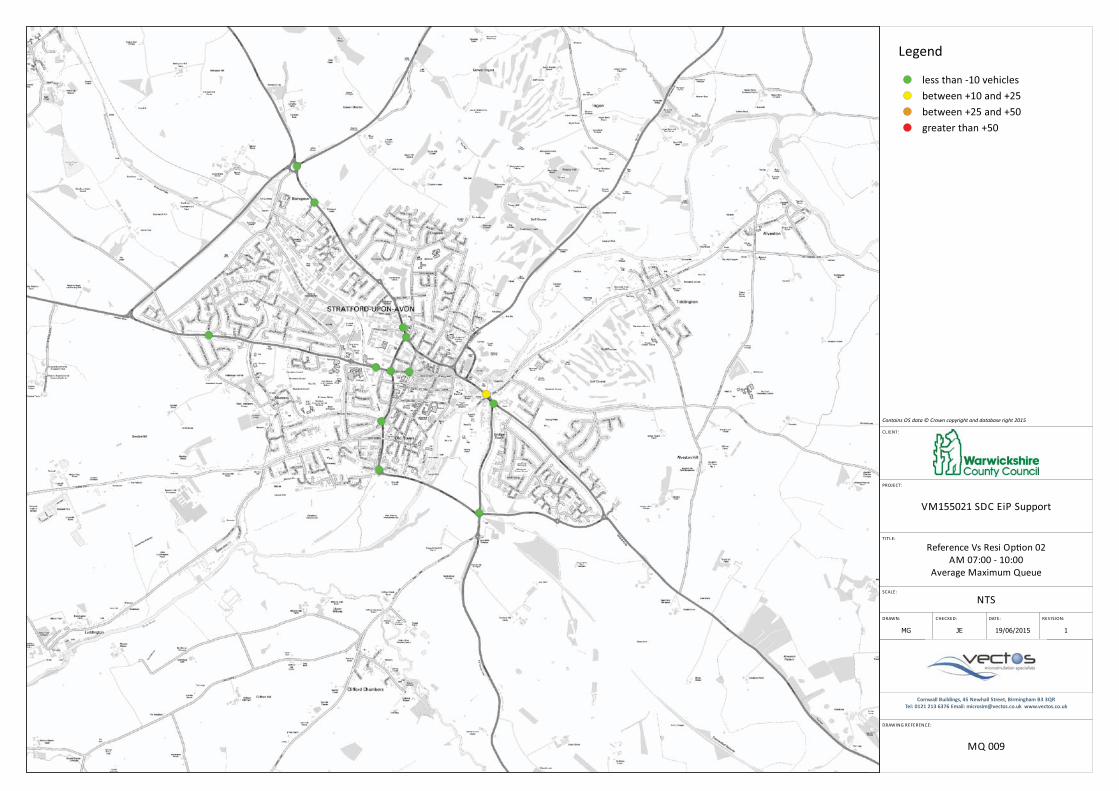


Scenario Period No. of Runs Successful %age Success
Peak (Veh)
Max Ave Max
Ref Case 01 AM 20 20 100% 3014 2819
PM 20 13 65% 3248 3136
Ref Case 02 AM 20 20 100% 2660 2592
PM 20 19 95% 2900 2730
Scenario 02 DN AM 20 19 95% 4379 4105
PM NA NA NA NA NA
Scenario 02 DM AM 20 20 100% 3470 3385
PM 20 19 95% 3666 3306
Scenario 02 DS AM 20 20 100% 2951 2883
PM 20 20 100% 3299 3170
Scenario 03 DN AM 20 18 90% 7525 5918
PM NA NA NA NA NA
Scenario 03 DM AM 20 18 90% 5277 5003
PM 20 18 90% 5997 5282
Scenario 03 DS AM 20 16 80% 3878 3756
PM 20 18 90% 5212 4623
Scenario 04 DN AM 20 19 95% 3539 3307
PM 20 18 90% 6028 5297
Scenario 04 DS AM 20 20 100% 3093 3023
PM 20 18 90% 4133 3843
Scenario 05 DN AM 20 19 95% 3196 3094
PM 20 12 60% 4341 3956
Scenario 05 DS AM 20 20 100% 3027 2878
PM 20 20 100% 4055 3779