Embed Size (px)
Citation preview
Stratford on Avon District
Tourism Economic Impact Assessment
2009
Prepared by: The Research Solution
Christine King, Director
FINAL REPORT
JANUARY 2011
the research solution

STRATFORD ON AVON TOURISM ECONOMIC IMPACT ASSESSMENT 2009
CONTENTS
Page
Introduction 1
1.0 VOLUME OF TOURISM
1.1 Introduction 6
1.2 Overnight Visits to Stratford on Avon 7
1.3 Purpose of Overnight Visits to Stratford on Avon 9
1.4 Bednights Generated by Purpose of Visit 10
1.5 Day and Overnight Visits to Stratford on Avon 11
1.6 Visitor Flows in Stratford on Avon 13
2.0 VALUE OF TOURISM
2.1 Introduction 14
2.2 Spend per Head 14
2.3 Overnight Visitor Spend 15
2.4 Day Visitor Spend 16
2.5 Total Expenditure by Market Sector 16
2.6 Distribution of Visitor Spending 17
2.7 Business Turnover 18
3.0 EMPLOYMENT
3.1 Introduction 19
3.2 Data Sources 19
3.3 Types of Job 19
3.4 Direct Full Time Job Equivalents 20
3.5 Actual/Indirect Job Equivalents 22
3.6 Total Employment related to tourism spending 23
(estimated actual)
3.7 Total Employment related to tourism spending (FTEs) 23
4.0 CONCLUSIONS 24
the research solution Final Report - Stratford on Avon Tourism Economic Impact Assessment 2009
1
Introduction
The Economic Impact Assessment of tourism in Stratford on Avon has been undertaken using a
model developed by Geoff Broom Associates in partnership with the Regional Tourist Boards
and has been compiled and written by The Research Solution, an independent market research
agency.
The assessment focuses upon the estimates of the overall volume of visits undertaken to the
district in 2009, expenditure in the local economy and the number of jobs that are dependent
upon tourism.
The Economic Impact Assessment considers localised data such as the average
accommodation occupancy levels and visitor numbers to the District’s tourism
attractions. Therefore, the assessment includes the most current localised
information available (primarily 2009). The national survey data that forms the
Cambridge Economic Impact Assessment Model’s key driver template is based on
2009 results.
This much more sophisticated version of the Cambridge Model features of a number of
enhancements. These include:
◊ inclusion of impact of second homes, marinas/ boat moorings and paying guests in private
homes e.g. language school host families
◊ analysis of impact of other types of ‘non-trip expenditure’ associated with tourism e.g.
spending by local residents hosting friends and relative stays, expenditure on second homes
and boats
◊ more detailed economic impact analysis
◊ use of more detailed data on local occupancies, wage rates etc to inform local data outputs
The Cambridge model is an estimate of trips / nights / spend by visitors to a specified area.
Throughout the report there are some references to ‘visitors’. This is purely for descriptive
purposes, outlining the type of visitors who make trips to the area. Visitors are in essence
making trips to the area, but of course these visitors can make more than one trip to any area
throughout the course of the year. It is important to remember that estimated volume (trips and
nights) to a specified destination IS NOT an estimate of visitor numbers but an indication of the
number of trips made and the number of nights spent in that area.

the research solution Final Report - Stratford on Avon Tourism Economic Impact Assessment 2009
2
Limitations of the Model
The methodology and accuracy of the above sources varies. The results of the model should
therefore be regarded as estimates which are indicative of the scale and importance of visitor
activity in the local area. It is important to note that in the national tourism surveys the sample
sizes for each area changes year on year. This is as a result of the random probability nature of
the methodology. As such, the results of the Cambridge Model are best viewed as a
snapshot in time and we would caution against year-on-year comparisons.
It should be noted that the model cannot take into account any leakage of expenditure from
tourists taking day trips out of the area in which they are staying. Whilst it is important to be
aware of these issues, we are confident that the estimates we have produced are as reliable as is
practically possible within the constraints of the information available.
Rounding
All figures used in this report have been rounded. In some tables there may therefore be a slight
discrepancy between totals and sub totals.
Data sources
The main national surveys used as data sources in stage one include:
• United Kingdom Tourism Survey (UKTS) providing information on tourism activity by
UK residents;
• International Passenger Survey (IPS) providing information on overseas visitors to the
United Kingdom;
• Day Visits in Great Britain Survey using information on visits lasting more than 3 hours
and taken on an irregular basis
• The New Earnings Survey (which provides information on wage levels by industry sector
and region);
These surveys provide information down to a regional level. In order to disaggregate data to a
local level the following information sources are used:
• Records of known local accommodation stock held by regional and sub-regional bodies;
• Surveys of Visits to Attractions, which provide data on the number of visitors to
individual tourist attractions within their area;
• Registrar General’s estimates of resident population as based on the 2001 Census of
Population
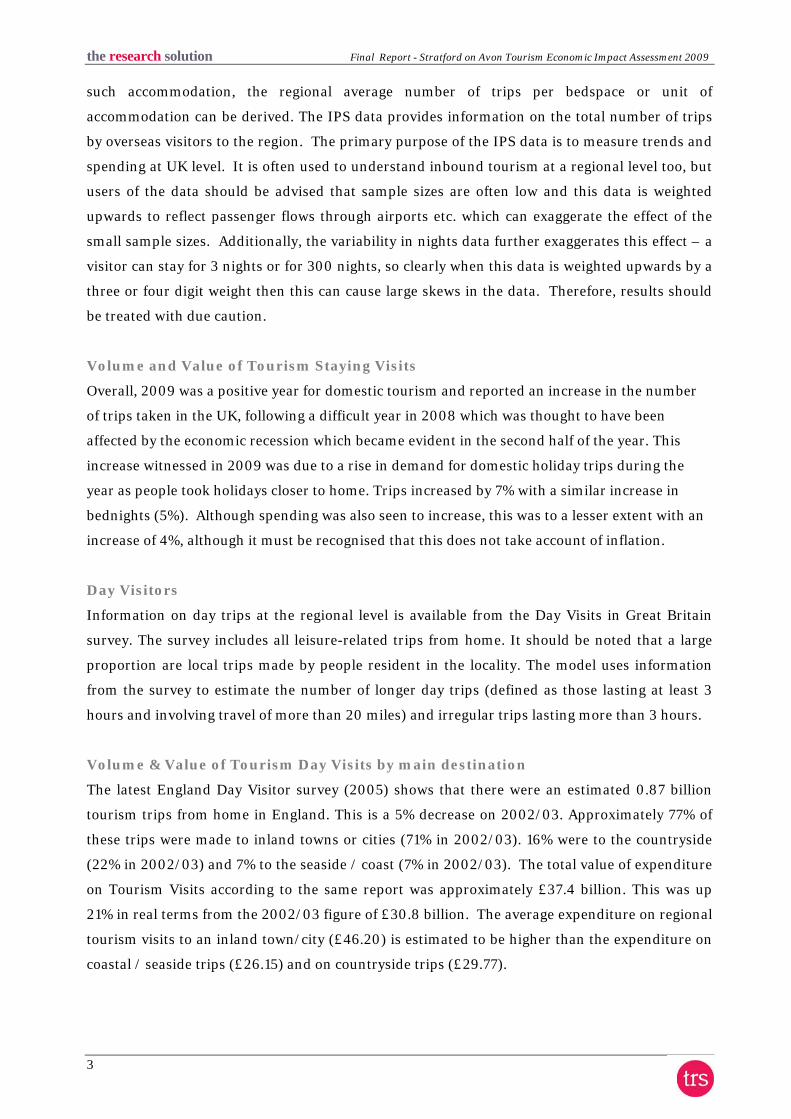
Staying Visitors
The UKTS data provides information on the total number of trips to the region and the relative
proportions using different types of accommodation. By matching these figures to the supply of
the research solution Final Report - Stratford on Avon Tourism Economic Impact Assessment 2009
3
such accommodation, the regional average number of trips per bedspace or unit of
accommodation can be derived. The IPS data provides information on the total number of trips
by overseas visitors to the region. The primary purpose of the IPS data is to measure trends and
spending at UK level. It is often used to understand inbound tourism at a regional level too, but
users of the data should be advised that sample sizes are often low and this data is weighted
upwards to reflect passenger flows through airports etc. which can exaggerate the effect of the
small sample sizes. Additionally, the variability in nights data further exaggerates this effect – a
visitor can stay for 3 nights or for 300 nights, so clearly when this data is weighted upwards by a
three or four digit weight then this can cause large skews in the data. Therefore, results should
be treated with due caution.
Volume and Value of Tourism Staying Visits
Overall, 2009 was a positive year for domestic tourism and reported an increase in the number
of trips taken in the UK, following a difficult year in 2008 which was thought to have been
affected by the economic recession which became evident in the second half of the year. This
increase witnessed in 2009 was due to a rise in demand for domestic holiday trips during the
year as people took holidays closer to home. Trips increased by 7% with a similar increase in
bednights (5%). Although spending was also seen to increase, this was to a lesser extent with an
increase of 4%, although it must be recognised that this does not take account of inflation.
Day Visitors
Information on day trips at the regional level is available from the Day Visits in Great Britain
survey. The survey includes all leisure-related trips from home. It should be noted that a large
proportion are local trips made by people resident in the locality. The model uses information
from the survey to estimate the number of longer day trips (defined as those lasting at least 3
hours and involving travel of more than 20 miles) and irregular trips lasting more than 3 hours.
Volume & Value of Tourism Day Visits by main destination
The latest England Day Visitor survey (2005) shows that there were an estimated 0.87 billion
tourism trips from home in England. This is a 5% decrease on 2002/03. Approximately 77% of
these trips were made to inland towns or cities (71% in 2002/03). 16% were to the countryside
(22% in 2002/03) and 7% to the seaside / coast (7% in 2002/03). The total value of expenditure
on Tourism Visits according to the same report was approximately £37.4 billion. This was up
21% in real terms from the 2002/03 figure of £30.8 billion. The average expenditure on regional
tourism visits to an inland town/city (£46.20) is estimated to be higher than the expenditure on
coastal / seaside trips (£26.15) and on countryside trips (£29.77).

the research solution Final Report - Stratford on Avon Tourism Economic Impact Assessment 2009
4
Impact of tourism expenditure
This model also examines the impact of the tourism expenditure in terms of the direct, indirect
and induced expenditure as well as an estimate of the actual jobs (both direct and indirect)
supported by tourism expenditure in the area.
Evidence from national studies suggests that some minor adjustments are required to match
visitor spend to business turnover – for example, some expenditure on food and drink actually
takes place in inns and hotels that fall in the accommodation sector and within attractions. More
significantly, expenditure on travel costs associated with individual trips is equally likely to take
place at the origin of the trip as the destination. Therefore the model assumes that only 40% of
travel expenditure accrues to the destination area.
Number of full time job equivalents
Having identified the value of turnover generated by visitor spending, it is possible to estimate
the employment associated with that spending. Wages for staff and drawings for the proprietors
will absorb a proportion of that turnover. By applying these proportions to the overall additional
turnover in each sector, the amount of money absorbed by employment costs can be calculated.
The New Earnings Survey provides data from which the average costs by business sector,
adjusted to take account of regional differences, can be calculated (the Visit Britain publication,
Employment Generated by Tourism in Britain was also used). After allowing for additional costs
such as National Insurance and pension costs, an average employment cost per full time
equivalent job can be estimated. The number of such jobs in the local area can then be estimated
by dividing the amount of business expenditure on wages and drawings by the average
employment cost per job.
Number of Actual Jobs
The model generates estimates of full time equivalent jobs based on visitor spending. However,
the total number of actual jobs will be higher when part time and seasonal working is taken into
account. The full time equivalent jobs arising directly from visitor spending are converted into
actual jobs using information from business surveys in the sectors receiving visitor spending. In
general, the conversion factor varies around 1.5 in those sectors.
The indirect and induced jobs arise across a much wider range of employment sectors.
Therefore, the average 1.16 for all sectors based on Census of Employment data has been
used to convert full time equivalent jobs in this sector to actual jobs.
The employment estimates generated by the model include both self employed and employed
people supported by visitor expenditure. The model also includes an estimate of the additional
the research solution Final Report - Stratford on Avon Tourism Economic Impact Assessment 2009
5
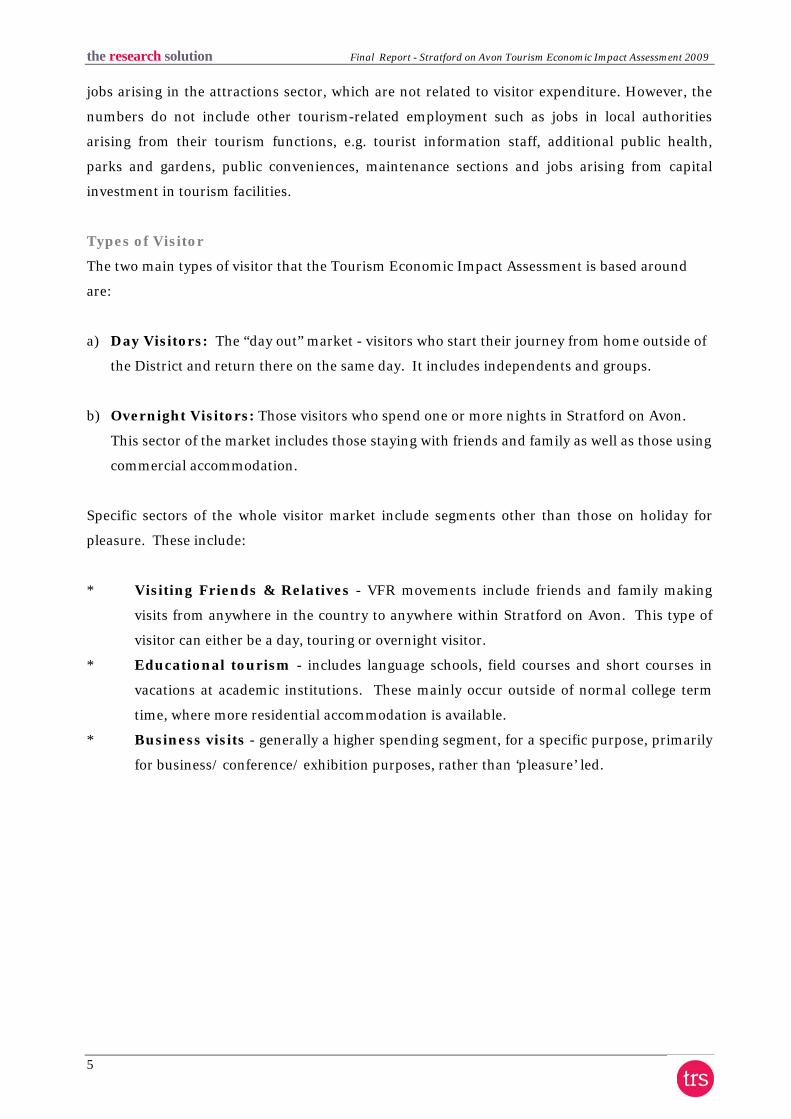
jobs arising in the attractions sector, which are not related to visitor expenditure. However, the
numbers do not include other tourism-related employment such as jobs in local authorities
arising from their tourism functions, e.g. tourist information staff, additional public health,
parks and gardens, public conveniences, maintenance sections and jobs arising from capital
investment in tourism facilities.
Types of Visitor
The two main types of visitor that the Tourism Economic Impact Assessment is based around
are:
a) Day Visitors: The “day out” market - visitors who start their journey from home outside of
the District and return there on the same day. It includes independents and groups.
b) Overnight Visitors: Those visitors who spend one or more nights in Stratford on Avon.
This sector of the market includes those staying with friends and family as well as those using
commercial accommodation.
Specific sectors of the whole visitor market include segments other than those on holiday for
pleasure. These include:
* Visiting Friends & Relatives - VFR movements include friends and family making
visits from anywhere in the country to anywhere within Stratford on Avon. This type of
visitor can either be a day, touring or overnight visitor.
* Educational tourism - includes language schools, field courses and short courses in
vacations at academic institutions. These mainly occur outside of normal college term
time, where more residential accommodation is available.
* Business visits - generally a higher spending segment, for a specific purpose, primarily
for business/ conference/ exhibition purposes, rather than ‘pleasure’ led.
the research solution Final Report - Stratford on Avon Tourism Economic Impact Assessment 2009
6
1.0 VOLUME OF TOURISM
1.1 Introduction
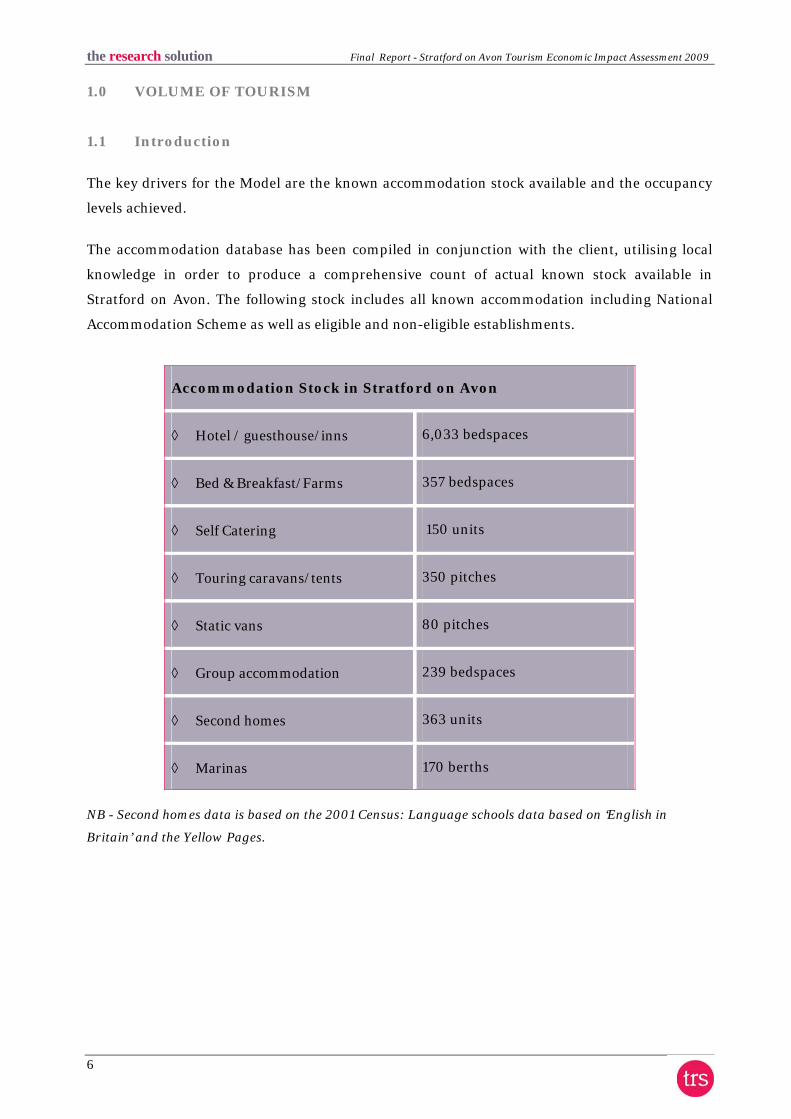
The key drivers for the Model are the known accommodation stock available and the occupancy
levels achieved.
The accommodation database has been compiled in conjunction with the client, utilising local
knowledge in order to produce a comprehensive count of actual known stock available in
Stratford on Avon. The following stock includes all known accommodation including National
Accommodation Scheme as well as eligible and non-eligible establishments.
Accommodation Stock in Stratford on Avon
◊ Hotel / guesthouse/inns 6,033 bedspaces
◊ Bed & Breakfast/Farms 357 bedspaces
◊ Self Catering 150 units
◊ Touring caravans/tents 350 pitches
◊ Static vans 80 pitches
◊ Group accommodation 239 bedspaces
◊ Second homes 363 units
◊ Marinas 170 berths
NB - Second homes data is based on the 2001 Census: Language schools data based on ‘English in
Britain’ and the Yellow Pages.
the research solution Final Report - Stratford on Avon Tourism Economic Impact Assessment 2009
7
1.2 Overnight Visits to Stratford on Avon
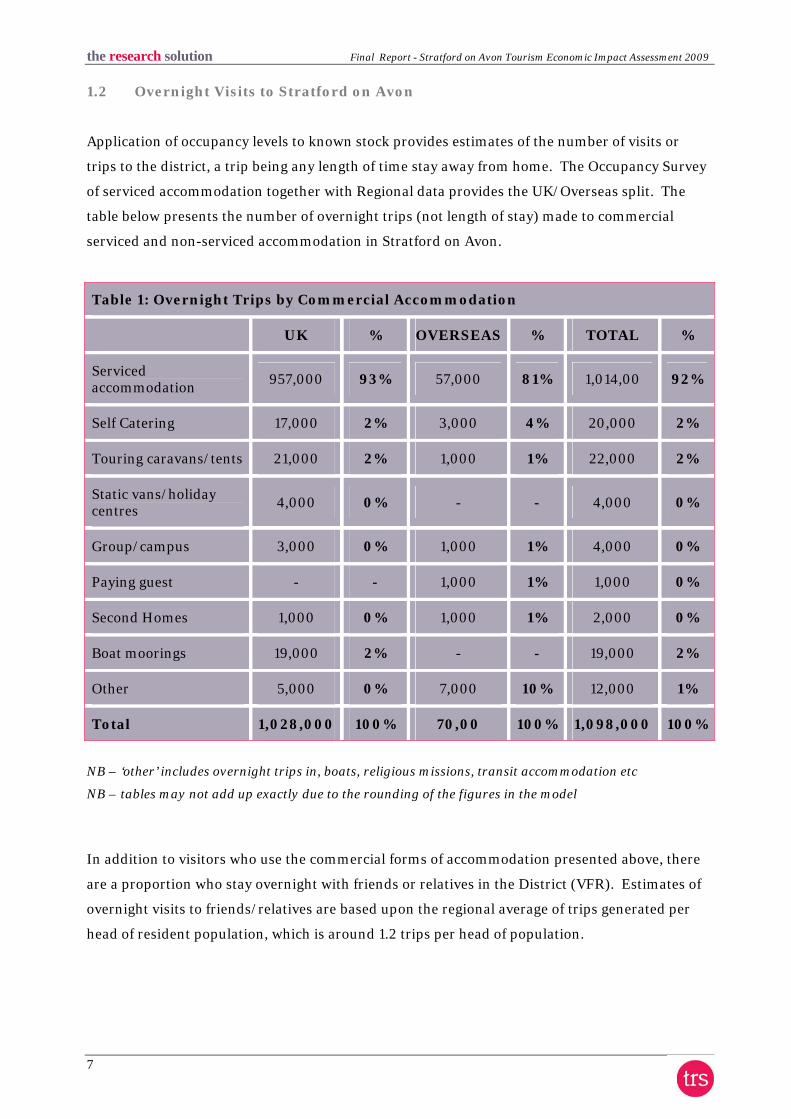
Application of occupancy levels to known stock provides estimates of the number of visits or
trips to the district, a trip being any length of time stay away from home. The Occupancy Survey
of serviced accommodation together with Regional data provides the UK/Overseas split. The
table below presents the number of overnight trips (not length of stay) made to commercial
serviced and non-serviced accommodation in Stratford on Avon.
Table 1: Overnight Trips by Commercial Accommodation
UK % OVERSEAS % TOTAL %
Serviced accommodation
957,000 93% 57,000 81% 1,014,00 92%
Self Catering 17,000 2% 3,000 4% 20,000 2%
Touring caravans/tents 21,000 2% 1,000 1% 22,000 2%
Static vans/holiday centres
4,000 0% - - 4,000 0%
Group/campus 3,000 0% 1,000 1% 4,000 0%
Paying guest - - 1,000 1% 1,000 0%
Second Homes 1,000 0% 1,000 1% 2,000 0%
Boat moorings 19,000 2% - - 19,000 2%
Other 5,000 0% 7,000 10% 12,000 1%
Total 1,028,000 100% 70,00 100% 1,098,000 100%
NB – ‘other’ includes overnight trips in, boats, religious missions, transit accommodation etc
NB – tables may not add up exactly due to the rounding of the figures in the model
In addition to visitors who use the commercial forms of accommodation presented above, there
are a proportion who stay overnight with friends or relatives in the District (VFR). Estimates of
overnight visits to friends/relatives are based upon the regional average of trips generated per
head of resident population, which is around 1.2 trips per head of population.
the research solution Final Report - Stratford on Avon Tourism Economic Impact Assessment 2009
8
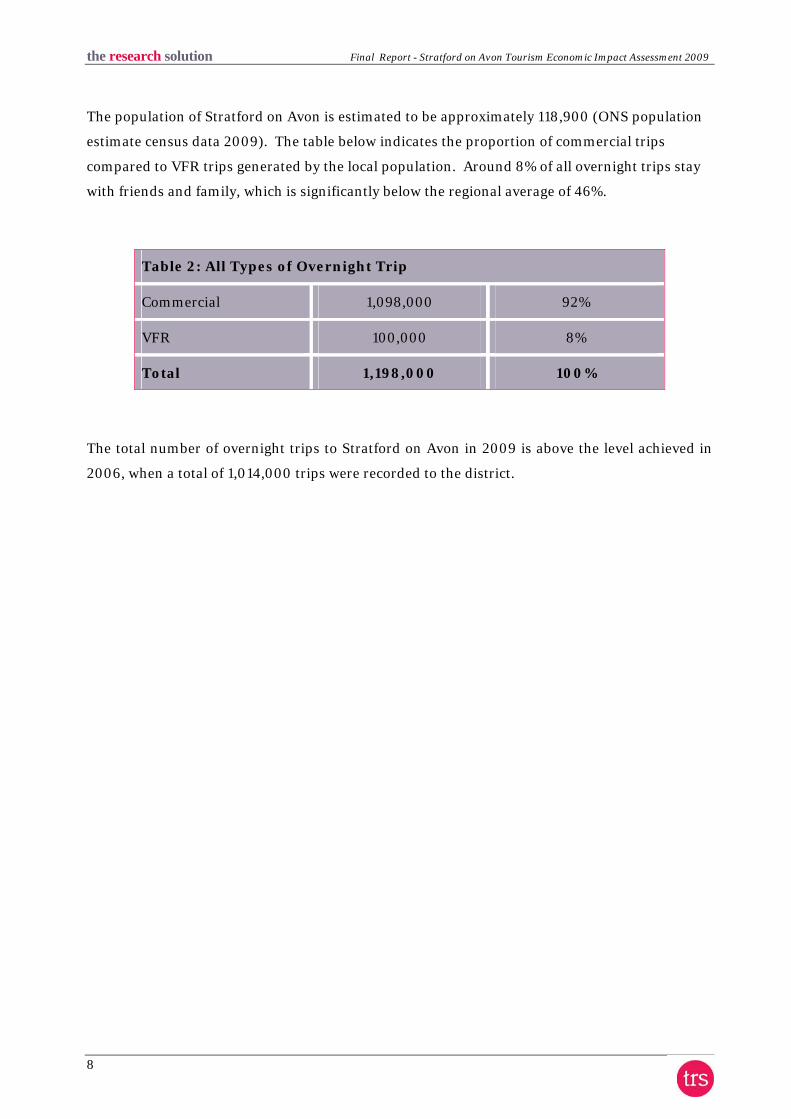
The population of Stratford on Avon is estimated to be approximately 118,900 (ONS population
estimate census data 2009). The table below indicates the proportion of commercial trips
compared to VFR trips generated by the local population. Around 8% of all overnight trips stay
with friends and family, which is significantly below the regional average of 46%.
Table 2: All Types of Overnight Trip
Commercial 1,098,000 92%
VFR 100,000 8%
Total 1,198,000 100%
The total number of overnight trips to Stratford on Avon in 2009 is above the level achieved in
2006, when a total of 1,014,000 trips were recorded to the district.

the research solution Final Report - Stratford on Avon Tourism Economic Impact Assessment 2009
9
1.3 Purpose of Overnight Visits to Stratford on Avon
The table and chart below indicate the breakdown of all 1,198,000 trips made to the area by
purpose of visit.
Table 3: Purpose of Overnight Visits to Stratford on Avon
Domestic % Overseas % Total %
Total holiday 956,000 86% 56,000 62% 1,01200 84%
Business 45,000 4% 15,000 17% 60,000 5%
VFR 98,000 9% 16,000 18% 114,000 10%
Other 9,000 1% 4,000 4% 13,000 1%
Total 1,108,000 100% 90,000 100% 1,198,000 100%
NB - tables may not add up exactly due to the rounding of the figures in the model
NB - ‘other’ includes study
Over the full year, overseas visits account for around 8% of all overnight trips to the District. For
the overnight visitor market as a whole, visitors on holiday accounts for 84% and those visiting
friends or relatives represent 10% of visits.
Figure 1: Purpose of Overnight Visits
Total Holiday, 84%
Business, 5%
VFR, 10%
Other, 1%
There is a variation between the purpose of trip and accommodation used in the case of VFR. Of
the 1,198,000 trips made to the District, 114,000 (10%) were for the primary purpose of visiting
friends/relatives. In terms of the potential accommodation used, the figure is lower at 100,000
showing that in Stratford more visitors have identified visiting friends/relatives as their prime
motivation but have used other methods of accommodation.
the research solution Final Report - Stratford on Avon Tourism Economic Impact Assessment 2009
10
1.4 Bednights Generated by Purpose of Visit
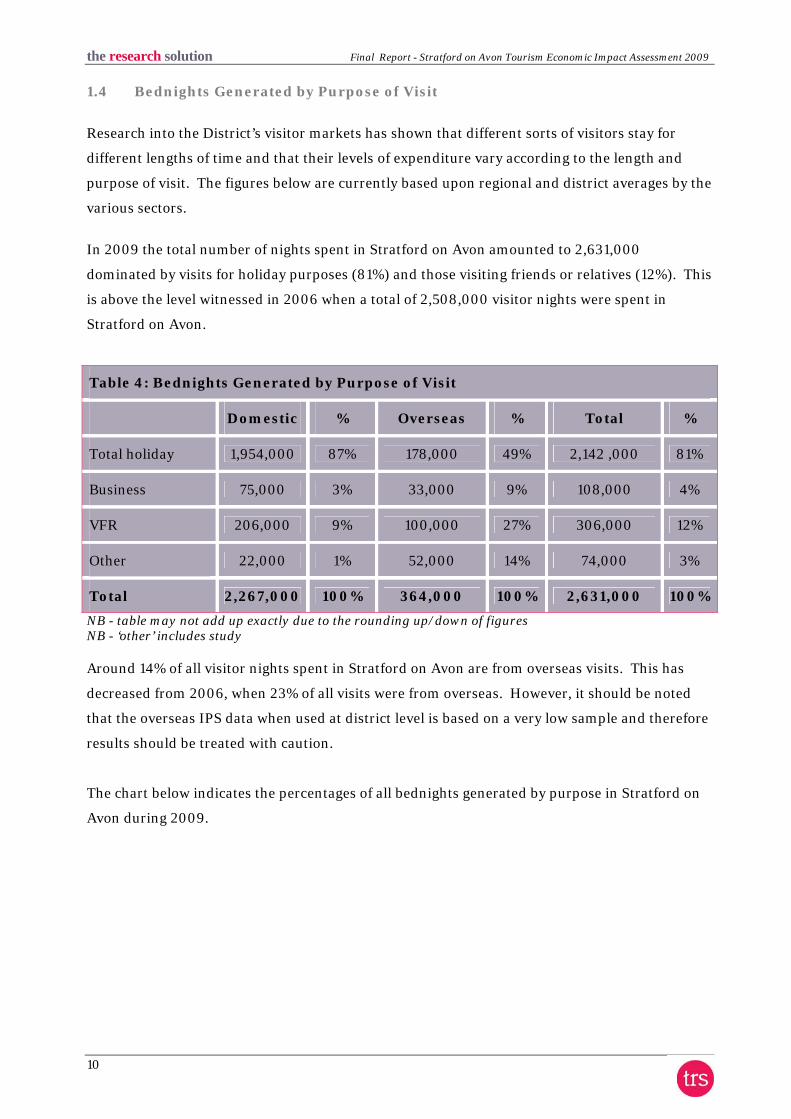
Research into the District’s visitor markets has shown that different sorts of visitors stay for
different lengths of time and that their levels of expenditure vary according to the length and
purpose of visit. The figures below are currently based upon regional and district averages by the
various sectors.
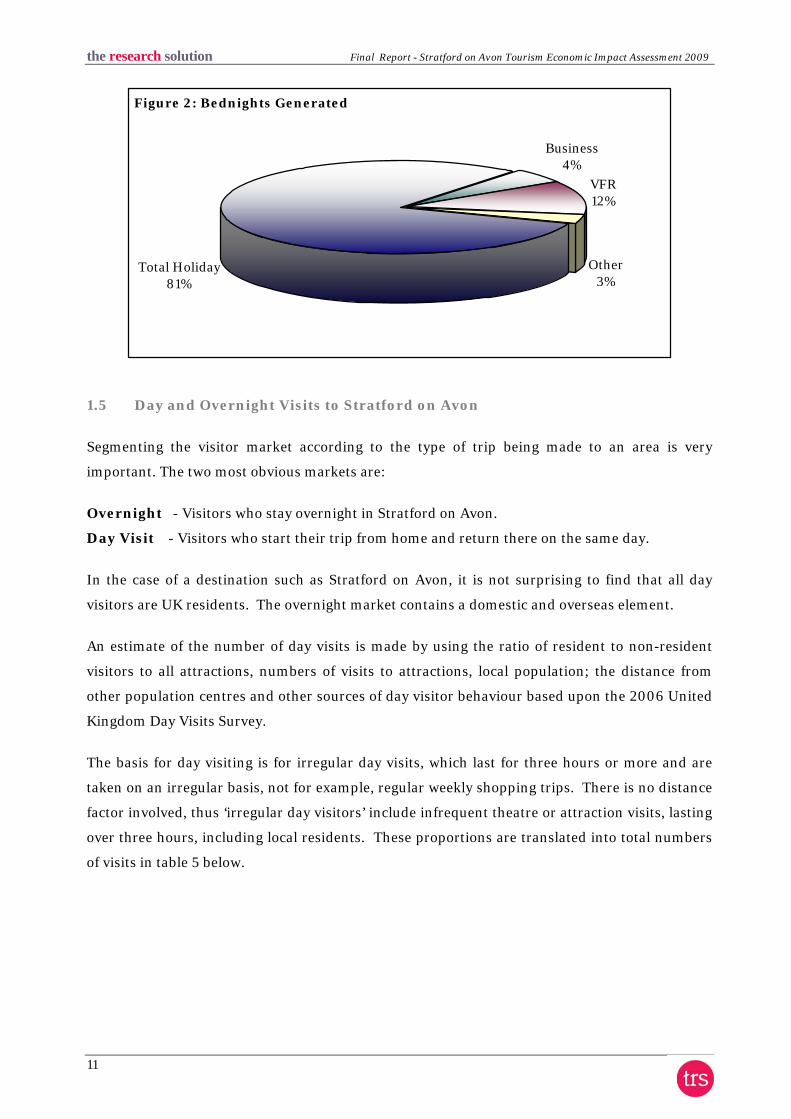
In 2009 the total number of nights spent in Stratford on Avon amounted to 2,631,000
dominated by visits for holiday purposes (81%) and those visiting friends or relatives (12%). This
is above the level witnessed in 2006 when a total of 2,508,000 visitor nights were spent in
Stratford on Avon.
Table 4: Bednights Generated by Purpose of Visit
Domestic % Overseas % Total %
Total holiday 1,954,000 87% 178,000 49% 2,142 ,000 81%
Business 75,000 3% 33,000 9% 108,000 4%
VFR 206,000 9% 100,000 27% 306,000 12%
Other 22,000 1% 52,000 14% 74,000 3%
Total 2,267,000 100% 364,000 100% 2,631,000 100%
NB - table may not add up exactly due to the rounding up/down of figures NB - ‘other’ includes study Around 14% of all visitor nights spent in Stratford on Avon are from overseas visits. This has
decreased from 2006, when 23% of all visits were from overseas. However, it should be noted
that the overseas IPS data when used at district level is based on a very low sample and therefore
results should be treated with caution.
The chart below indicates the percentages of all bednights generated by purpose in Stratford on
Avon during 2009.
the research solution Final Report - Stratford on Avon Tourism Economic Impact Assessment 2009
11
Figure 2: Bednights Generated
VFR12%
Other3%
Business4%
Total Holiday81%
1.5 Day and Overnight Visits to Stratford on Avon
Segmenting the visitor market according to the type of trip being made to an area is very
important. The two most obvious markets are:
Overnight - Visitors who stay overnight in Stratford on Avon.
Day Visit - Visitors who start their trip from home and return there on the same day.
In the case of a destination such as Stratford on Avon, it is not surprising to find that all day
visitors are UK residents. The overnight market contains a domestic and overseas element.
An estimate of the number of day visits is made by using the ratio of resident to non-resident
visitors to all attractions, numbers of visits to attractions, local population; the distance from
other population centres and other sources of day visitor behaviour based upon the 2006 United
Kingdom Day Visits Survey.
The basis for day visiting is for irregular day visits, which last for three hours or more and are
taken on an irregular basis, not for example, regular weekly shopping trips. There is no distance
factor involved, thus ‘irregular day visitors’ include infrequent theatre or attraction visits, lasting
over three hours, including local residents. These proportions are translated into total numbers
of visits in table 5 below.
the research solution Final Report - Stratford on Avon Tourism Economic Impact Assessment 2009
12
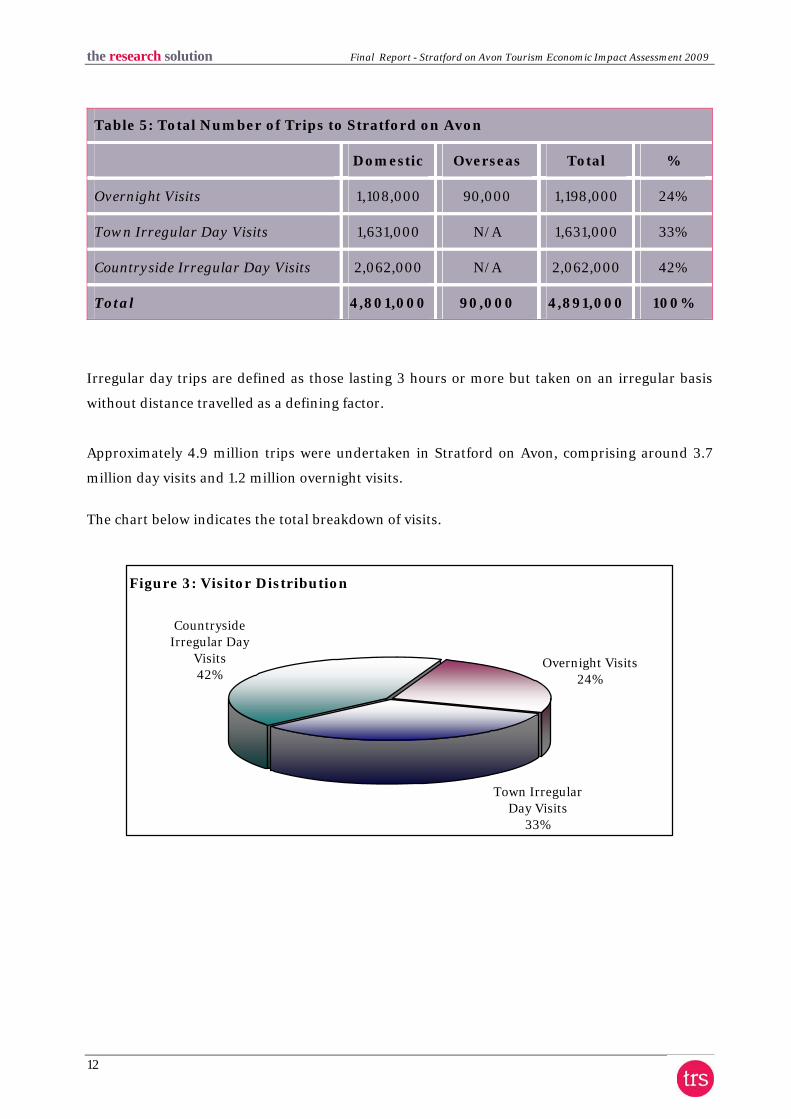
Table 5: Total Number of Trips to Stratford on Avon
Domestic Overseas Total %
Overnight Visits 1,108,000 90,000 1,198,000 24%
Town Irregular Day Visits 1,631,000 N/A 1,631,000 33%
Countryside Irregular Day Visits 2,062,000 N/A 2,062,000 42%
Total 4,801,000 90,000 4,891,000 100%
Irregular day trips are defined as those lasting 3 hours or more but taken on an irregular basis
without distance travelled as a defining factor.
Approximately 4.9 million trips were undertaken in Stratford on Avon, comprising around 3.7
million day visits and 1.2 million overnight visits.
The chart below indicates the total breakdown of visits.
Figure 3: Visitor Distribution
Countryside Irregular Day
Visits42%
Overnight Visits24%
Town Irregular Day Visits
33%

the research solution Final Report - Stratford on Avon Tourism Economic Impact Assessment 2009
13
1.6 Visitor Flows in Stratford on Avon
Taking the days spent by day visitors together with the expenditure from overnight trips provides
an overall figure for visitor flows. The 1.2 million staying trips in the area equate to
approximately 2.6 million nights spent in Stratford on Avon itself.
The breakdown of the visitor market by trips and days spent in Stratford on Avon is shown below
and is compared with the County trips and days.
Table 6: Visitors – Trips & Days
Trips made to Stratford on
Avon
Trips made to Warwickshire
Days Spent in Stratford on
Avon
Days Spent in Warwickshire
Day Visitors 3,693,000 10,492,000 3,693,000 10,492,000
Overnight Visitors 1,198,000 3,264,000 2,631,000 7,319,000
TOTAL 4,891,000 13,756,000 6,324,000 17,811,000

the research solution Final Report - Stratford on Avon Tourism Economic Impact Assessment 2009
14
2.0 VALUE OF TOURISM
2.1 Introduction
Having established the volume of visitor days to Stratford on Avon, it is possible to then estimate
the total value of tourism expenditure. The per head expenditure data is generated by national
tourism data (UKTS/IPS) disaggregated down to regional level. The regional data for 2009 has
been applied to the different types of visitor days spent in the District. The total expenditure
generated by visitor trips in 2009 is estimated to be £335 million, compared with £314 million
generated in 2006.
2.2 Spend per Head
The expenditure total for each party of visitors is divided by, the number of people concerned in
order to provide an average spend per head. The average spend per head per trip is shown in
table 7 below, showing the variations by purpose of visit and UK/Overseas, from the regional
sources of information.
Table 7: Spend per Head per Trip
Domestic Overseas
All Holidays £155.04 £234.82
Business £204.69 £257.07
VFR £87.38 £247.50
Other £912.89 £357.67
Study - £2,355.00
Irregular Day Town Visits £46.20 -
Irregular Day Countryside Visits £29.77 -
NB - ‘other’ includes holiday and business trips where the interviewee has not specified the
dominant factor for the trip.
the research solution Final Report - Stratford on Avon Tourism Economic Impact Assessment 2009
15
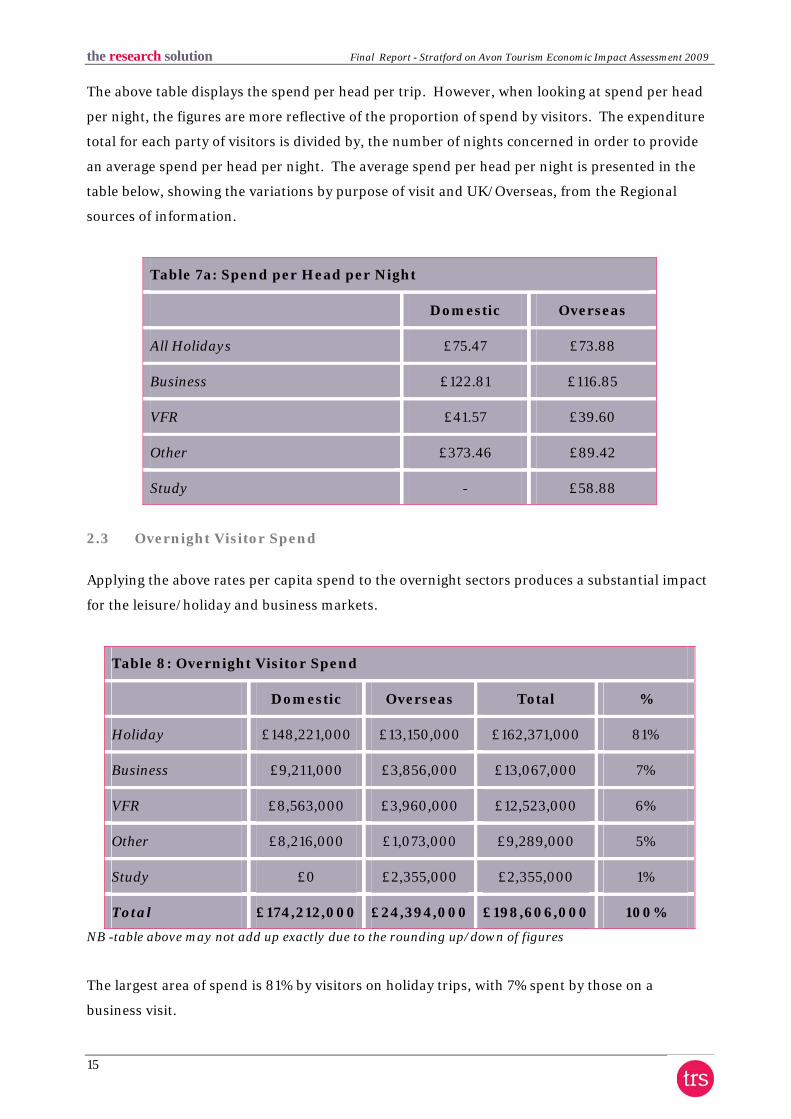
The above table displays the spend per head per trip. However, when looking at spend per head
per night, the figures are more reflective of the proportion of spend by visitors. The expenditure
total for each party of visitors is divided by, the number of nights concerned in order to provide
an average spend per head per night. The average spend per head per night is presented in the
table below, showing the variations by purpose of visit and UK/Overseas, from the Regional
sources of information.
Table 7a: Spend per Head per Night
Domestic Overseas
All Holidays £75.47 £73.88
Business £122.81 £116.85
VFR £41.57 £39.60
Other £373.46 £89.42
Study - £58.88
2.3 Overnight Visitor Spend
Applying the above rates per capita spend to the overnight sectors produces a substantial impact
for the leisure/holiday and business markets.
Table 8: Overnight Visitor Spend
Domestic Overseas Total %
Holiday £148,221,000 £13,150,000 £162,371,000 81%
Business £9,211,000 £3,856,000 £13,067,000 7%
VFR £8,563,000 £3,960,000 £12,523,000 6%
Other £8,216,000 £1,073,000 £9,289,000 5%
Study £0 £2,355,000 £2,355,000 1%
Total £174,212,000 £24,394,000 £198,606,000 100%
NB -table above may not add up exactly due to the rounding up/down of figures
The largest area of spend is 81% by visitors on holiday trips, with 7% spent by those on a
business visit.
the research solution Final Report - Stratford on Avon Tourism Economic Impact Assessment 2009
16
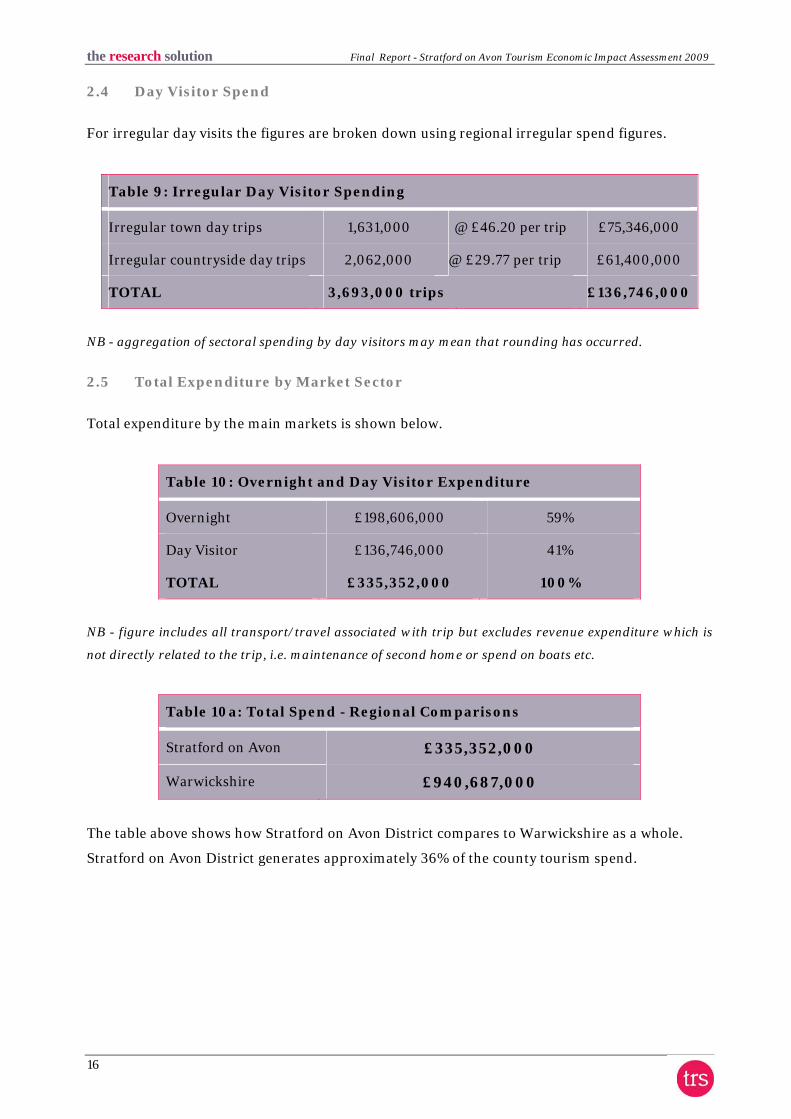
2.4 Day Visitor Spend
For irregular day visits the figures are broken down using regional irregular spend figures.
Table 9: Irregular Day Visitor Spending
Irregular town day trips 1,631,000 @ £46.20 per trip £75,346,000
Irregular countryside day trips 2,062,000 @ £29.77 per trip £61,400,000
TOTAL 3,693,000 trips £136,746,000
NB - aggregation of sectoral spending by day visitors may mean that rounding has occurred.
2.5 Total Expenditure by Market Sector
Total expenditure by the main markets is shown below.
Table 10: Overnight and Day Visitor Expenditure
Overnight £198,606,000 59%
Day Visitor £136,746,000 41%
TOTAL £335,352,000 100%
NB - figure includes all transport/travel associated with trip but excludes revenue expenditure which is
not directly related to the trip, i.e. maintenance of second home or spend on boats etc.
Table 10a: Total Spend - Regional Comparisons
Stratford on Avon £335,352,000
Warwickshire £940,687,000
The table above shows how Stratford on Avon District compares to Warwickshire as a whole.
Stratford on Avon District generates approximately 36% of the county tourism spend.
the research solution Final Report - Stratford on Avon Tourism Economic Impact Assessment 2009
17
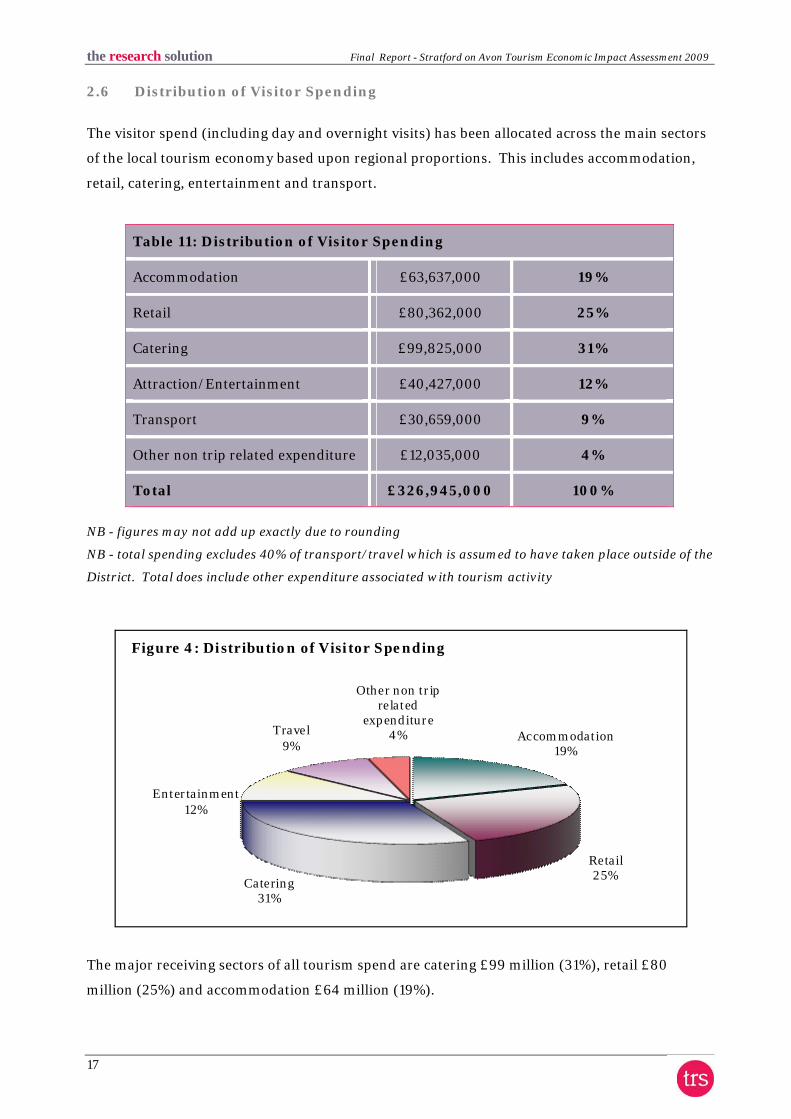
2.6 Distribution of Visitor Spending
The visitor spend (including day and overnight visits) has been allocated across the main sectors
of the local tourism economy based upon regional proportions. This includes accommodation,
retail, catering, entertainment and transport.
Table 11: Distribution of Visitor Spending
Accommodation £63,637,000 19%
Retail £80,362,000 25%
Catering £99,825,000 31%
Attraction/Entertainment £40,427,000 12%
Transport £30,659,000 9%
Other non trip related expenditure £12,035,000 4%
Total £326,945,000 100%
NB - figures may not add up exactly due to rounding
NB - total spending excludes 40% of transport/travel which is assumed to have taken place outside of the
District. Total does include other expenditure associated with tourism activity
Accommodation19%
Retail25%
Catering31%
Entertainment12%
Travel9%
Other non trip related
expenditure4%
Figure 4: Distribution of Visitor Spending
The major receiving sectors of all tourism spend are catering £99 million (31%), retail £80
million (25%) and accommodation £64 million (19%).
the research solution Final Report - Stratford on Avon Tourism Economic Impact Assessment 2009
18
2.7 Business Turnover
Visitor expenditure adds to the turnover in tourism related businesses in direct receipt of
tourism spending. Thus spending on accommodation will mainly benefit hotels, guest house,
caravan and camp sites and other commercial establishments. However, some spending on
shopping takes place in attractions, while a proportion of eating and drinking takes place in
hotels and pubs which fall within the accommodation sector and at attractions. Some loss of
spending also occurs in relation to travel in that a proportion of the visitor spending occurs at the
origin of the trip or en-route rather than at the destination, as for instance the purchase of train
or bus tickets.
Tourism related businesses in turn spend money on the purchase of supplies and services.
Insofar as these supply businesses are within the District, then additional business turnover is
created.
The total business turnover generated in Stratford on Avon is estimated to be £421,750,000 or,
turnover of over £421 million, including any additional business income arising from induced
effects arising from employee spending. If we exclude the additional effects from employee
spending the total business turnover generated is £326,945,000.
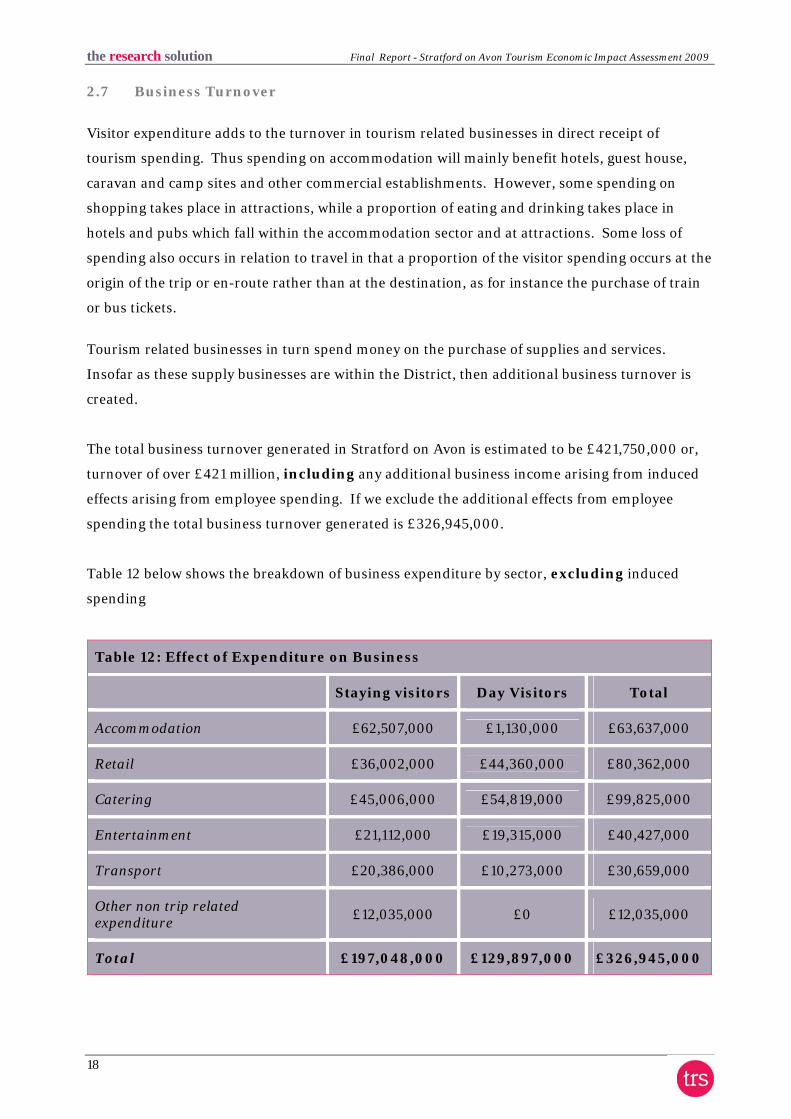
Table 12 below shows the breakdown of business expenditure by sector, excluding induced
spending
Table 12: Effect of Expenditure on Business
Staying visitors Day Visitors Total
Accommodation £62,507,000 £1,130,000 £63,637,000
Retail £36,002,000 £44,360,000 £80,362,000
Catering £45,006,000 £54,819,000 £99,825,000
Entertainment £21,112,000 £19,315,000 £40,427,000
Transport £20,386,000 £10,273,000 £30,659,000
Other non trip related expenditure
£12,035,000 £0 £12,035,000
Total £197,048,000 £129,897,000 £326,945,000
the research solution Final Report - Stratford on Avon Tourism Economic Impact Assessment 2009
19
3.0 EMPLOYMENT
3.1 Introduction
The £335 million spent by visitors directly results in increased turnover in those establishments
benefiting from visitor patronage, and therefore supports jobs and incomes in those
establishments. Some spending will take place outside the District, notably a proportion of
travel spending which will occur at the origin of the trip rather than the destinations. The Model
is able to provide an estimate of the jobs that result directly from that visitor expenditure and to
estimate the indirect and induced multiplier effects on local employment. Induced and
multiplier jobs are based on local impacts within Stratford on Avon.
It is estimated that from the tourism expenditure in Stratford on Avon of £335 million, a total of
8,002 jobs are supported by tourism spend, although these jobs are not all provided to residents
of the local authority. The following section sets out the different types of jobs, sources of
information and methodology used to establish tourism employment.
3.2 Data Sources
The estimates of volume and value of tourism to Stratford on Avon have been based upon
research undertaken at the local level, together with regional data from national surveys.
- The breakdown of visitor spending in the local economy by the five main industry
sectors is derived from regional analysis.
- The 2001 New Earnings Survey provides information on wage levels by industry
sector.
- The Consultants internal business database which includes data on the structure of
business expenditure, local linkages and multiplier ratios drawn from a wide range of
business and economic studies undertaken by Geoff Broom Associates, PA Cambridge
Economic Consultants and other researchers in the UK.
3.3 Type of Job
The Model identifies different types of jobs supported by tourism expenditure in each business
sector.
Full time job equivalents are established for the following:
- Direct
- Indirect
- Induced
the research solution Final Report - Stratford on Avon Tourism Economic Impact Assessment 2009
20
Having established the full time equivalents the Model then takes account of the part time and
seasonal employment to provide a total figure for actual jobs.
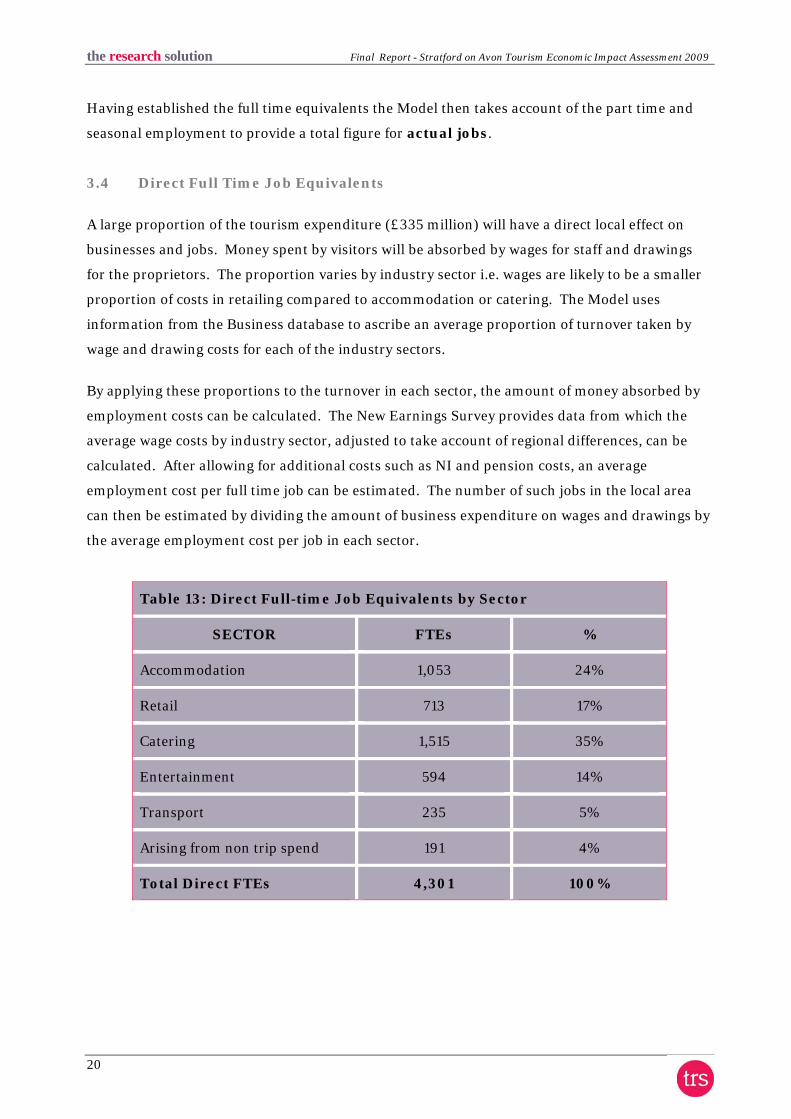
3.4 Direct Full Time Job Equivalents
A large proportion of the tourism expenditure (£335 million) will have a direct local effect on
businesses and jobs. Money spent by visitors will be absorbed by wages for staff and drawings
for the proprietors. The proportion varies by industry sector i.e. wages are likely to be a smaller
proportion of costs in retailing compared to accommodation or catering. The Model uses
information from the Business database to ascribe an average proportion of turnover taken by
wage and drawing costs for each of the industry sectors.
By applying these proportions to the turnover in each sector, the amount of money absorbed by
employment costs can be calculated. The New Earnings Survey provides data from which the
average wage costs by industry sector, adjusted to take account of regional differences, can be
calculated. After allowing for additional costs such as NI and pension costs, an average
employment cost per full time job can be estimated. The number of such jobs in the local area
can then be estimated by dividing the amount of business expenditure on wages and drawings by
the average employment cost per job in each sector.
Table 13: Direct Full-time Job Equivalents by Sector
SECTOR FTEs %
Accommodation 1,053 24%
Retail 713 17%
Catering 1,515 35%
Entertainment 594 14%
Transport 235 5%
Arising from non trip spend 191 4%
Total Direct FTEs 4,301 100%
the research solution Final Report - Stratford on Avon Tourism Economic Impact Assessment 2009
21
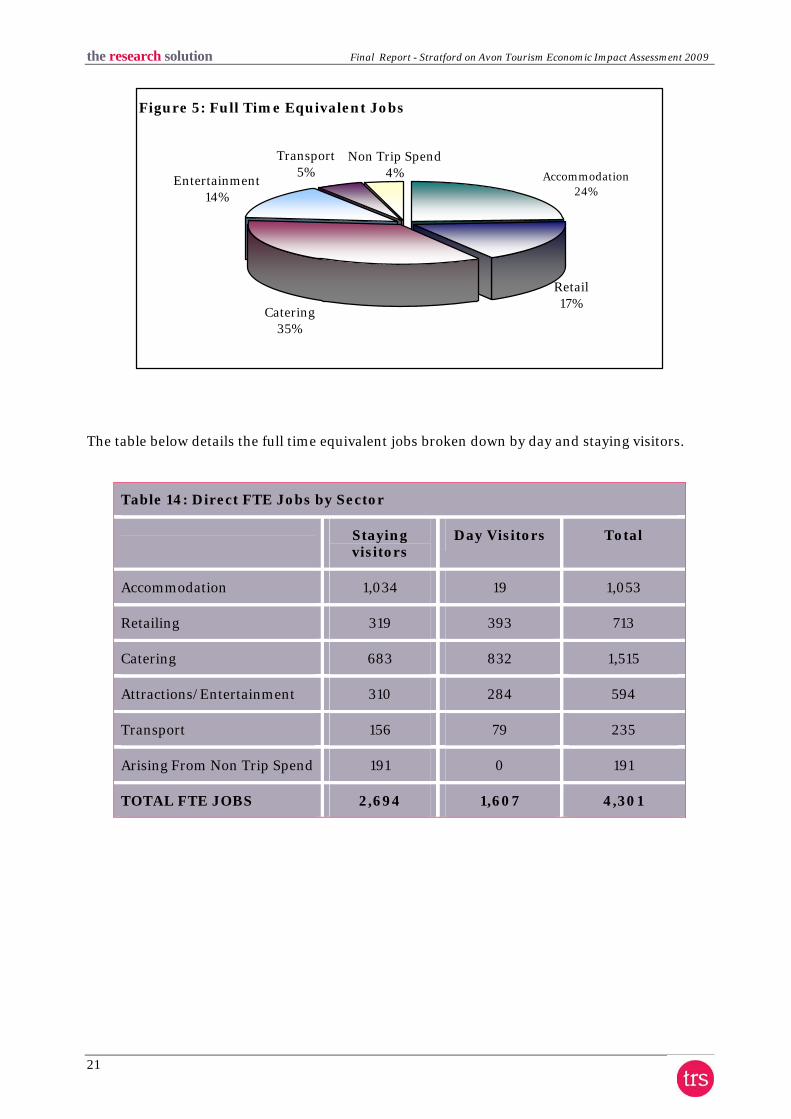
Figure 5: Full Time Equivalent Jobs
Retail17%
Entertainment14%
Transport5%
Catering35%
Non Trip Spend4% Accommodation
24%
The table below details the full time equivalent jobs broken down by day and staying visitors.
Table 14: Direct FTE Jobs by Sector
Staying visitors
Day Visitors Total
Accommodation 1,034 19 1,053
Retailing 319 393 713
Catering 683 832 1,515
Attractions/Entertainment 310 284 594
Transport 156 79 235
Arising From Non Trip Spend 191 0 191
TOTAL FTE JOBS 2,694 1,607 4,301
the research solution Final Report - Stratford on Avon Tourism Economic Impact Assessment 2009
22
3.5 Actual/Indirect Job Equivalents
In addition to the jobs directly supported by visitor spending there are local incomes and jobs
created in local suppliers of goods and services to the businesses receiving the visitors’ spending.
The number of additional jobs created in the area in this way will depend on the proportion of
such goods and services that are bought in Stratford on Avon District opposed to elsewhere in
the region or beyond. The additional jobs resulting from the purchase of goods and services are
termed indirect or linkage jobs.
Using the Business Database the average proportion of business turnover spent on local
purchases by sector has been estimated. By applying that proportion to the business turnover
arising from visitor spending, an estimate of the local spending on goods and services can be
made. Indirect or linkage jobs cover a wide range of sectors i.e. retailers, manufacturers, service
providers, banks etc. Examples include a guesthouse purchasing its food supplies from the local
grocery store or an attraction employing the services of local accountants or solicitors.
In addition to the direct and indirect linkage jobs are those generated by the income multiplier
effects. Income multiplier or induced jobs are those resulting from the expenditure of wages
earned in the direct and linkage jobs in Stratford on Avon District. Income multiplier jobs will
be spread across the local economy, including retailing, catering and transport as well as public
service jobs such as education, health and local government. For example, because a hotel
receptionist receives a direct salary from tourism spend, he or she can then ‘re-circulate’ this
money into the local economy by spending on purchases from local shops, or services from local
trades people.
Adjustments to the Model have been made to take account of local characteristics. Linkage
spending is known to vary by type of location and sector i.e. linkages are likely to be weakest in
rural areas and strongest in cities. The Model is set up in order that varying averages for the
proportion of spend on local linkages can be applied.
The Model generates estimates of Full-Time equivalent jobs based on visitor spending.
However, the total number of actual jobs will be higher when part-time and seasonal workers
are taken into account. One Full-Time Equivalent post may actually support three people, or
three jobs - in the form of one person working for 50% of the time and two other people working
for 25% of the FTE.

the research solution Final Report - Stratford on Avon Tourism Economic Impact Assessment 2009
23
Table 15: Estimated Actual Jobs by Sector
Staying visitors Day Visitors Total
Accommodation 1,531 28 1,559
Retailing 479 590 1,069
Catering 1,025 1,248 2,273
Attractions/Entertainment 437 400 838
Transport 220 111 331
Arising From Non Trip Spend 218 0 218
ESTIMATED ACTUAL JOBS 3,910 2,377 6,287
A total of approximately 6,287 actual direct tourism jobs are supported by the existence of the
£335 million tourism spend in the District. This spend supports a further 1,716 indirect and
induced non-tourism jobs (see below); therefore, making approximately 8,002 jobs supported by
the tourism spend in the District.
The Full-Time job equivalents created directly by the tourism expenditure are converted to
actual jobs using information from business surveys in the sectors receiving visitor spending
(accommodation, transport, etc). The conversion factor varies but is around 1.5 across the
sectors, with rather lower ratios with indirect and induced jobs. Thus each FTE job actually has
a knock-on effect with the creation of part-time and seasonal jobs.
3.6 Total employment related to tourism spending (estimated actual)
3.7 Total employment related to tourism spending (FTE’s)
TABLE 17 Staying tourists Day visitors Total Direct 2,694 1,607 4,301 Indirect 751 362 1,113 Induced 345 47 392 Totals 3,790 2,016 5,806
TABLE 16 Staying tourists Day visitors Total Direct 3,910 2,377 6,287 Indirect 856 412 1,269 Induced 393 54 447 Totals 5,159 2,843 8,002

the research solution Final Report - Stratford on Avon Tourism Economic Impact Assessment 2009
24
4.0 CONCLUSIONS
Review
The key volume and value results for Stratford on Avon are derived from the various sources as
described throughout the report. These include regional and District breakdowns from national
level data (United Kingdom Tourism Survey and International Passenger Survey) as well as jobs
and income information such as the New Earnings Survey.
At a local level, the occupancy survey provides accurate local occupancy levels and known
accommodation stock.
The key results of the Local Area Economic Impact Assessment for 2009 are:
4.9 million trips were undertaken in Stratford on Avon District – 3.7 million day trip, and
approximately 1.2 million overnight visits.
The overnight trips account for a total of 2.6 million nights in the area.
During their visit to Stratford on Avon, tourists spent approximately £335 million. On average,
about £28 million is spent in the local economy each month.
Overnight visits generated approximately £198.6 million in the area, compared with £136.7
million from irregular day trips.
The 4.9 million trips that occur in Stratford on Avon account for an approximate spend of £335
million on tourism in the Area supporting in the region of 8,002 jobs, both for local residents
from those living nearby. Approximately 6,287 direct tourism related jobs are supported
with an additional 1,716 non-tourism jobs dependent upon multiplier spend from tourism.