Embed Size (px)
Citation preview
STRATEGYto2010
Minister’s ForewordI am pleased to introduce the road policing strategic plan – Road Policing Strategy to 2010. The next three years will be important ones for New Zealand Police as we move to put into play the organisational and personal development required to help build a truly world class, modern police service.
The Police strategic plan, Policing with Confidence outlines the planning around fairness, inclusiveness, innovation, pride and recognition of the diversity this country embraces. The road policing strategic plan echoes these goals and aspirations and I have every confidence in New Zealand Police to support the actions and planning outlined in this document.
I recommend it to you and look forward to an exciting and rewarding three years as we work with all New Zealanders to save more lives on our roads and to reduce the pain and trauma to ordinary New Zealanders through unnecessary and avoidable road crashes.
Hon Annette King Minister of Police
Commissioner’s ForewordIt is my pleasure to present the Road Policing Strategy to 2010. Road Policing is a priority for me and this programme sets out the activities we will undertake to support the Road Safety to 2010 strategy goals of not exceeding 300 deaths and 2,200 hospitalisations for more than one day, and 1,400 hospitalisations for more than three days in the twelve months ending 31 December 2010. These activities will also contribute to the wider New Zealand Transport Strategy objectives by addressing a range of safety, social, economic and environmental outcomes.
Road Policing Strategy to 2010 sets out the road policing focus for the next three years as New Zealand Police works toward playing its part in reducing road trauma. Road Policing will support the wider strategic goals of NZ Police. Community reassurance, policing with confidence and organisational development will be targeted along with enforcement activity around the ‘fatal five’ areas of speed, drink/drug driving, restraints, dangerous/careless driving and high risk drivers.
Over the next three years, New Zealand Police will continue to implement the general deterrence model of road policing which aims to reduce road trauma for the whole population. We will also continue to support the National Road Safety Committee’s objectives by developing and implementing initiatives for ‘target areas’ and continue to work in partnership with a wide range of road safety practitioners.
Howard Broad Commissioner of Police
Contents 1
Strategic Overview 2
Strategic Context 3
Challenges and Opportunities 5
Focus on the ‘Fatal Five’ 8
Speeding 8
Drink/Drugged Driving 10
Restraints 12
Dangerous/Careless Driving 13
High-Risk Drivers 14
Fatal Five – Contribution to the New Zealand Transport Strategy Objectives 17
Strategic Goals 18
Performance Monitoring and Success Criteria 20
Contents
Front cover photo Desert Road – Tom Ludlow
1
Strategic OverviewJustice Sector Outcomes
Safer communities Effective justice systemTransport Sector Principles
Safe Sustainable Integrated Responsive
Crime Reduction Strategy NZ Transport Strategy
Road
Pol
icin
g St
rate
gy to
201
0
NZ Police Strategic Plan 2010Policing with Confidence – the NZ Way
Road Safety to 2010 StrategyNot more than 300 deaths and 2,200 hospitalisations
of more than one day by 2010
Safer Communities Together
To be a world class Police service working in partnership with citizens and communities to prevent crime and road trauma, enhance public safety and maintain law and order
Our Vision
Our Mission
Confident, safe & secure communities
Integrity Professionalism Respect Commitment to Ma-ori & Treaty
Less actual crime & road trauma, fewer victims A world class Police service
Community reassuranceProvide opportunity for participation
Set local prioritiesWork in partnershipProvide protection
Policing with confidenceEvidence-based proactive policing
Timely & effective response to calls for serviceThorough investigations
Effective resolutions
Organisational DevelopmentLeadership & people in policing
Integrity and accountabilityTechnology and innovation
Speeding Drink/Drugged Driving Restraints Dangerous/Careless Driving High-Risk Drivers
Outcomes
Strategic Goals
Our Values
Focus Areas
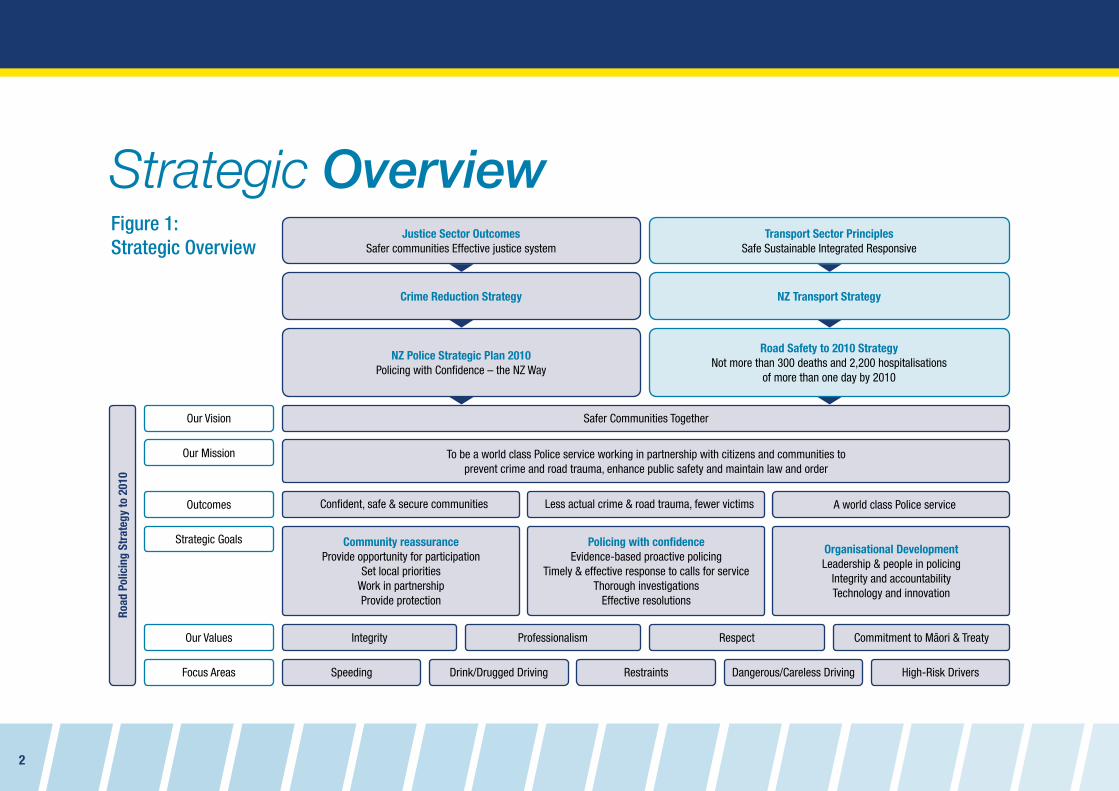
Figure 1: Strategic Overview
2
Road crashes result in more years of life being lost than any other source of injury. They are the leading cause of death to children, and of disability for 15–44 year olds. The impact on families, the community, and on the health system makes road safety a core public health, and injury prevention issue. The number of serious traffic offenders makes road policing and penalties key justice sector issues.
Strategic directionRoad policing (indeed, policing generally) is not done in isolation. As Figure 1 shows, it is undertaken in the context of a number of government strategies.
Government’s New Zealand Transport Strategy provides strategic direction within the transport sector.
It has four principles: safety; sustainability; integration and responsiveness. These principles flow down into the land transport sector, and guide decisions on priorities and activities. The principles are often complementary. For example, when people feel safe, they are more likely to walk and cycle. Similarly, sensible speeds result in lower fuel use and reduced emissions.
Underpinning the New Zealand Transport Strategy in the road safety area is the Road Safety to 2010 strategy. This strategy guides road safety activities, including road policing, towards achieving the Government’s goals of no more than 300 road deaths, 2,200 hospitalisations of more than one day and 1,400 hospitalisations of more than three days for the twelve months ending 31 December 2010.
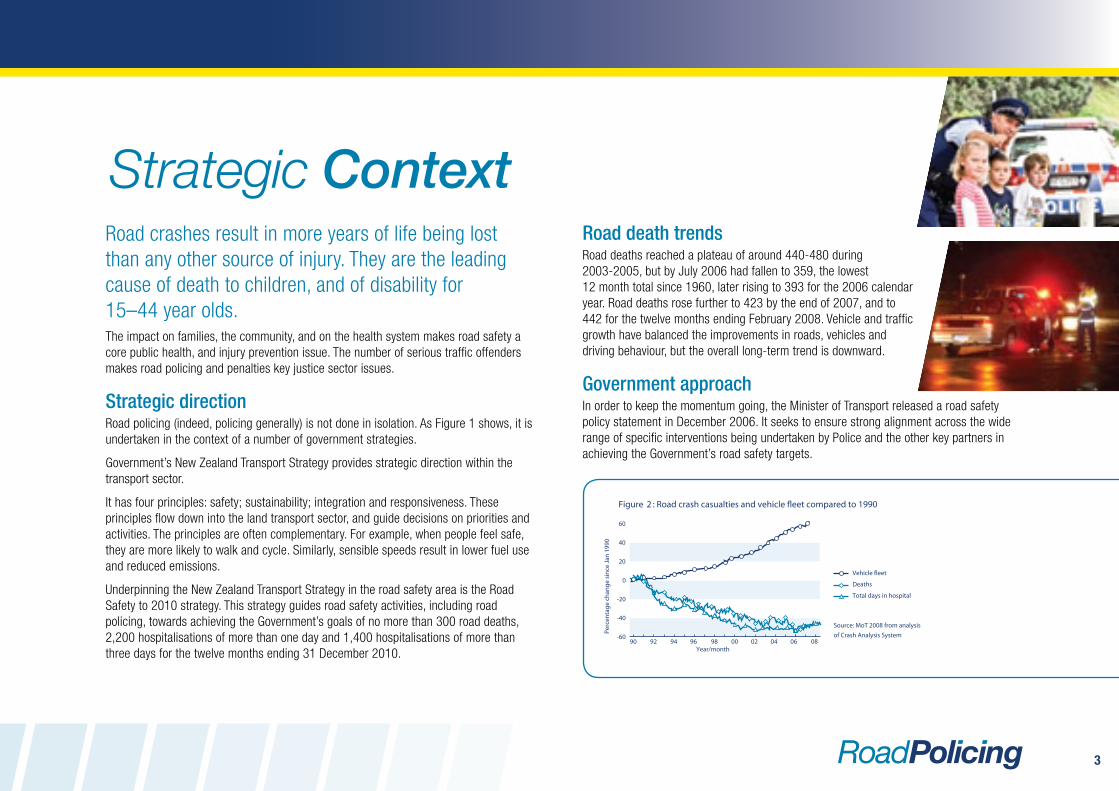
Road death trends Road deaths reached a plateau of around 440-480 during 2003-2005, but by July 2006 had fallen to 359, the lowest 12 month total since 1960, later rising to 393 for the 2006 calendar year. Road deaths rose further to 423 by the end of 2007, and to 442 for the twelve months ending February 2008. Vehicle and traffic growth have balanced the improvements in roads, vehicles and driving behaviour, but the overall long-term trend is downward.
Government approachIn order to keep the momentum going, the Minister of Transport released a road safety policy statement in December 2006. It seeks to ensure strong alignment across the wide range of specific interventions being undertaken by Police and the other key partners in achieving the Government’s road safety targets.
Strategic Context
3
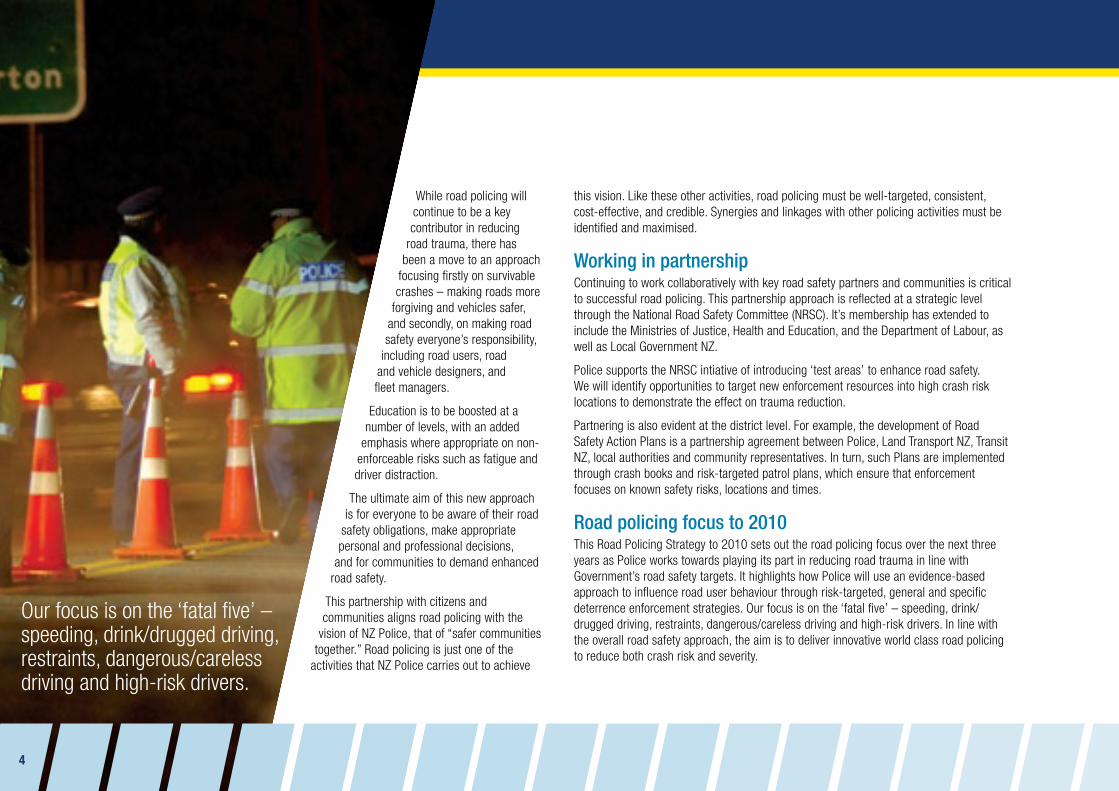
While road policing will continue to be a key contributor in reducing
road trauma, there has been a move to an approach
focusing firstly on survivable crashes – making roads more
forgiving and vehicles safer, and secondly, on making road safety everyone’s responsibility,
including road users, road and vehicle designers, and fleet managers.
Education is to be boosted at a number of levels, with an added
emphasis where appropriate on non-enforceable risks such as fatigue and driver distraction.
The ultimate aim of this new approach is for everyone to be aware of their road
safety obligations, make appropriate personal and professional decisions,
and for communities to demand enhanced road safety.
This partnership with citizens and communities aligns road policing with the
vision of NZ Police, that of “safer communities together.” Road policing is just one of the
activities that NZ Police carries out to achieve
this vision. Like these other activities, road policing must be well-targeted, consistent, cost-effective, and credible. Synergies and linkages with other policing activities must be identified and maximised.
Working in partnershipContinuing to work collaboratively with key road safety partners and communities is critical to successful road policing. This partnership approach is reflected at a strategic level through the National Road Safety Committee (NRSC). It’s membership has extended to include the Ministries of Justice, Health and Education, and the Department of Labour, as well as Local Government NZ.
Police supports the NRSC intiative of introducing ‘test areas’ to enhance road safety. We will identify opportunities to target new enforcement resources into high crash risk locations to demonstrate the effect on trauma reduction.
Partnering is also evident at the district level. For example, the development of Road Safety Action Plans is a partnership agreement between Police, Land Transport NZ, Transit NZ, local authorities and community representatives. In turn, such Plans are implemented through crash books and risk-targeted patrol plans, which ensure that enforcement focuses on known safety risks, locations and times.
Road policing focus to 2010 This Road Policing Strategy to 2010 sets out the road policing focus over the next three years as Police works towards playing its part in reducing road trauma in line with Government’s road safety targets. It highlights how Police will use an evidence-based approach to influence road user behaviour through risk-targeted, general and specific deterrence enforcement strategies. Our focus is on the ‘fatal five’ – speeding, drink/drugged driving, restraints, dangerous/careless driving and high-risk drivers. In line with the overall road safety approach, the aim is to deliver innovative world class road policing to reduce both crash risk and severity.
Our focus is on the ‘fatal five’ – speeding, drink/drugged driving, restraints, dangerous/careless driving and high-risk drivers.
4
It is essential that we have a firm grasp of the environment in which we deliver road policing – the challenges we face as well as the opportunities for us to enhance delivery. These include community confidence, resources, changing strategic road safety focus, and road safety related trends.
ChallengesCommunity Confidence
Public trust and confidence in road policing is critical. Our behaviours, attitudes and •actions must reflect expectations.
We must continue to debunk the revenue gathering myth through risk-targeted patrols •and credible general and specific deterrence activities.
ResourcesFunding• – road policing operating expenditure is funded from the National Land Transport Fund. When allocating this fund, road policing activities are assessed alongside other land transport activities such as road construction and maintenance, passenger transport, travel demand management, and promotion/information/education. Police therefore needs to develop innovative operational and technological solutions to make the best use of resources.
Sustainability• – the promotion of sustainability will require delivering more excessive vehicle noise and emissions enforcement.
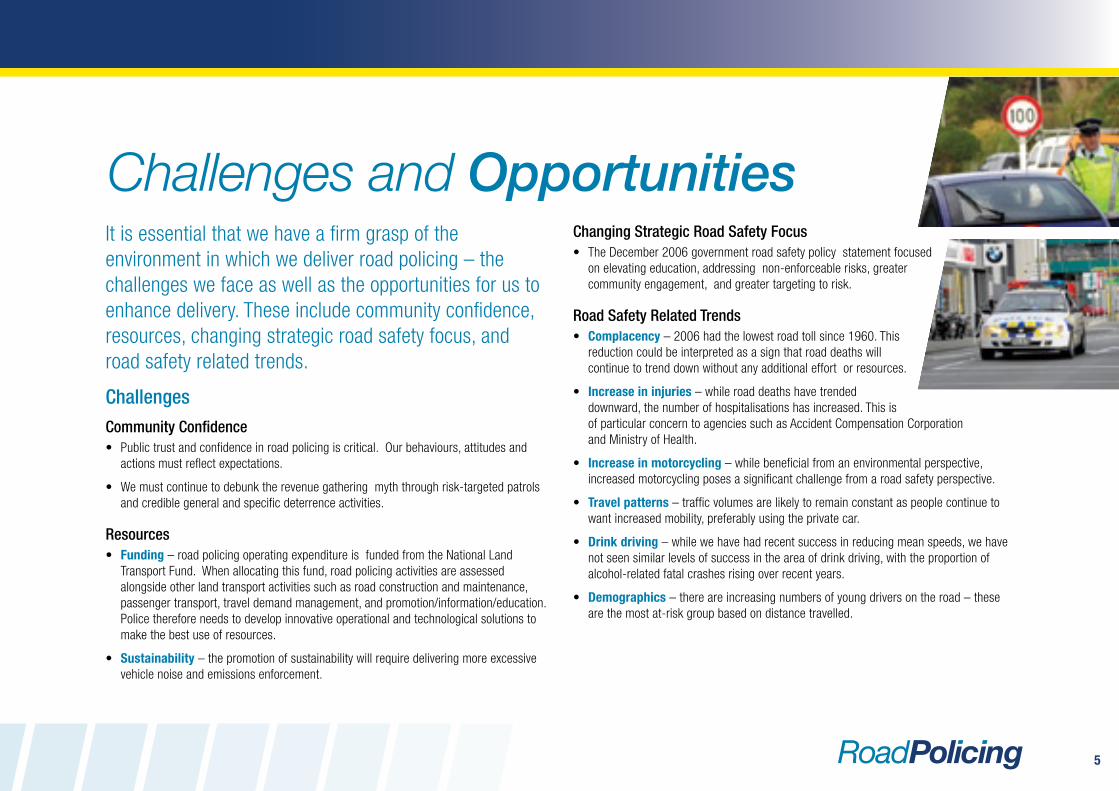
Changing Strategic Road Safety FocusThe December 2006 government road safety policy statement focused •on elevating education, addressing non-enforceable risks, greater community engagement, and greater targeting to risk.
Road Safety Related TrendsComplacency• – 2006 had the lowest road toll since 1960. This reduction could be interpreted as a sign that road deaths will continue to trend down without any additional effort or resources.
Increase in injuries• – while road deaths have trended downward, the number of hospitalisations has increased. This is of particular concern to agencies such as Accident Compensation Corporation and Ministry of Health.
Increase in motorcycling• – while beneficial from an environmental perspective, increased motorcycling poses a significant challenge from a road safety perspective.
Travel patterns• – traffic volumes are likely to remain constant as people continue to want increased mobility, preferably using the private car.
Drink driving• – while we have had recent success in reducing mean speeds, we have not seen similar levels of success in the area of drink driving, with the proportion of alcohol-related fatal crashes rising over recent years.
Demographics• – there are increasing numbers of young drivers on the road – these are the most at-risk group based on distance travelled.
Challenges and Opportunities
5
OpportunitiesCommunity Confidence
Positive public image• – we need to continue to build on the high public support we have for our efforts to reduce road trauma. A Ministry of Transport survey in 2007 showed that over 90% of the public surveyed wanted Police effort to catch people breaking road safety laws maintained or increased further.
ResourcesIncreased Police numbers• – road policing will benefit from the additional 1,250 sworn and non-sworn staff to be appointed from 2006/07.
Integrated funding• – new integrated funding arrangements provide the potential for new initiatives, such as Information and Technology improvements.
Ten-year forecasting• – the requirement to prepare a ten-year funding forecast for the Road Policing Programme will provide a more secure financial footing.
Problem-oriented policing• – road policing has good data. Continuing to invest in intelligence, research and the most effective methods of operation will enable us to achieve tactical excellence.
Technology• – new technological developments will enable us to carry out our duties more effectively and safely. For example, digital speed cameras, electronic ticketing, automatic number plate recognition, and in-car technologies such as mobile data terminals to support the ‘Police vehicles as Police stations’ initiative.
Changing Strategic Road Safety FocusPartnership approach• – a strong collaborative partnership approach is already in place, particularly through our commitment to Road Safety Action Planning. This can be built on, especially in terms of engaging with the community and making road safety everyone’s responsibility.
Whole of government approach• – we can leverage off other government strategies (such as the Crime Reduction Strategy and the Injury Prevention Strategy) to achieve road safety gains.
Road Safety Related TrendsReduced road toll• – in 2006 the road toll dropped below 400 for the first time in 47 years. Although this rose to 423 in 2007, it does give us confidence that further reductions can be achieved.
We can make a difference• – recent initiatives such as ‘Anytime Anywhere’ speed camera deployment and the award winning ‘Speed Kills Kids’ (Slow Down Near Schools) campaign have contributed positively to influencing driving behaviour.
In 2006 road deaths dropped below 400 for the first time in 47 years, but increased to 423 in 2007.
6
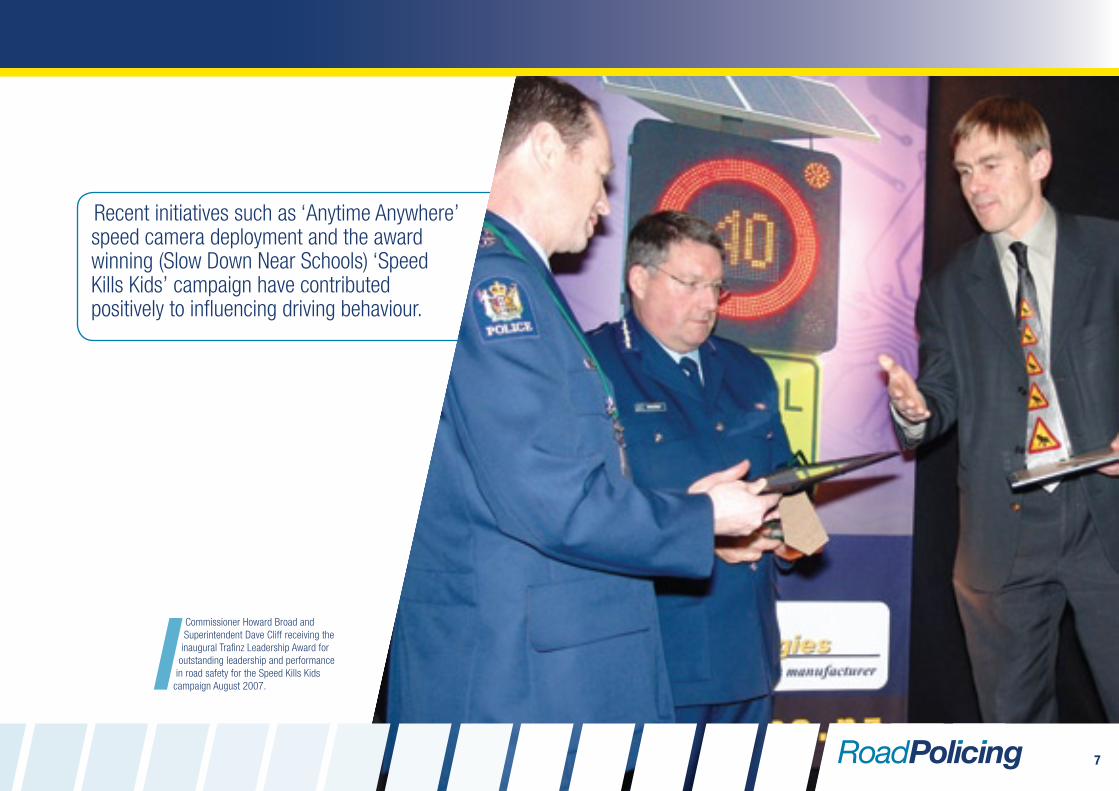
Recent initiatives such as ‘Anytime Anywhere’ speed camera deployment and the award winning (Slow Down Near Schools) ‘Speed Kills Kids’ campaign have contributed positively to influencing driving behaviour.
Commissioner Howard Broad and Superintendent Dave Cliff receiving the
inaugural Trafinz Leadership Award for outstanding leadership and performance
in road safety for the Speed Kills Kids campaign August 2007.
7
Specific activities and initiatives targeting the ‘fatal five’ will be outlined in the annual Road Policing Programme, and flow through into the national and district business planning process.
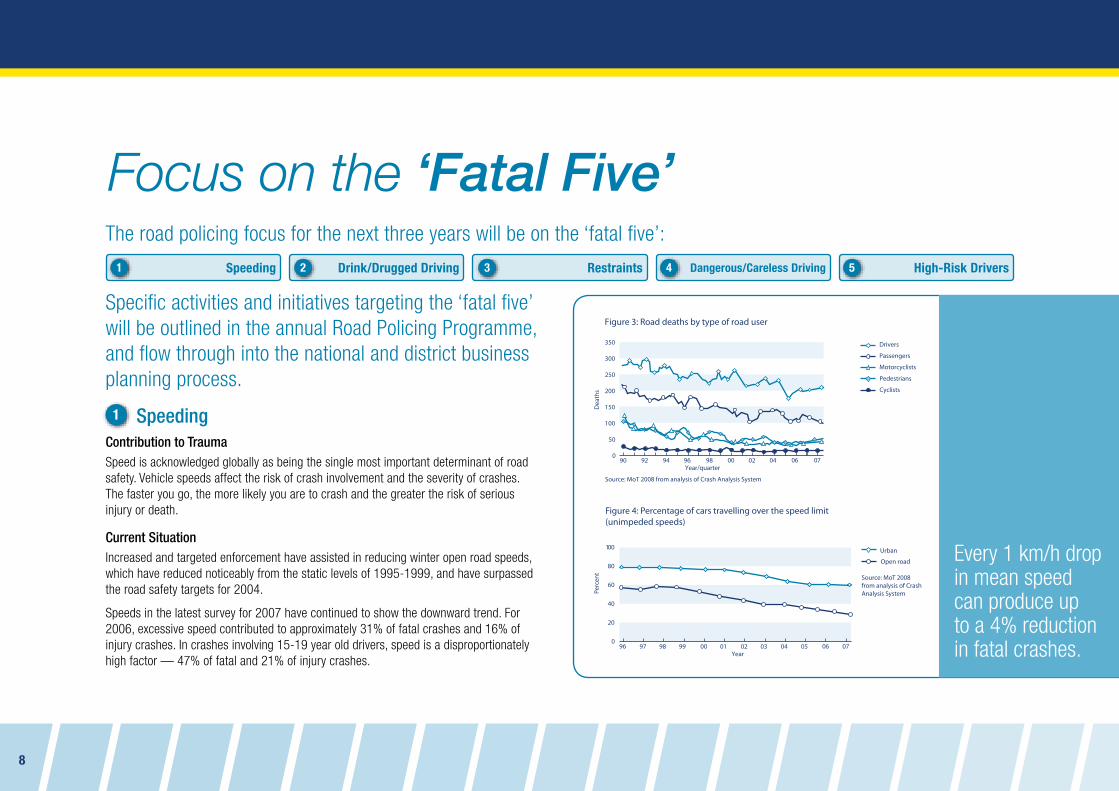
1 Speeding Contribution to TraumaSpeed is acknowledged globally as being the single most important determinant of road safety. Vehicle speeds affect the risk of crash involvement and the severity of crashes. The faster you go, the more likely you are to crash and the greater the risk of serious injury or death.
Current SituationIncreased and targeted enforcement have assisted in reducing winter open road speeds, which have reduced noticeably from the static levels of 1995-1999, and have surpassed the road safety targets for 2004.
Speeds in the latest survey for 2007 have continued to show the downward trend. For 2006, excessive speed contributed to approximately 31% of fatal crashes and 16% of injury crashes. In crashes involving 15-19 year old drivers, speed is a disproportionately high factor — 47% of fatal and 21% of injury crashes.
Focus on the ‘Fatal Five’The road policing focus for the next three years will be on the ‘fatal five’:
Speeding Drink/Drugged Driving Restraints Dangerous/Careless Driving High-Risk Drivers
Every 1 km/h drop in mean speed can produce up to a 4% reduction in fatal crashes.
1 2 3 4 5
8
We Will be Successful if, by 2010:open and urban road speeds continue to drop; •
fewer vehicles exceed 100km/h (open road) and •50 km/h (urban speed limits);
there are fewer speed-related fatal crashes;•
there is a reduction in the proportion of speed-related •injury crashes;
there is a reduction in the number of at fault speed-related heavy motor vehicle •crashes; and
more people believe there is a high probability of being detected speeding.•
We Will Achieve This Through:enhancing the already successful (Slow Down Near Schools) ‘Speed Kills Kids’ initiative;•
focusing on both excess speed (over the speed limit) and inappropriate speed (under the •speed limit but too fast for the conditions);
seeking ways and means to progressively lower speeds; •
working with partner agencies to advocate for effective speed-related sanctions;•
working closely with the community to ensure that speed enforcement remains risk and •evidence-based;
encouraging local authorities to reduce speed limits using variable speed limit signs •near schools;
encouraging the use of speed feedback signs as a positive way of encouraging •compliance;
replacing the current wet film speed cameras with digital speed cameras;•
expanding the speed camera programme;•
investigating the benefits of time-over-distance speed cameras;•
upgrading speed detection equipment; and•
increasing enforcement of heavy vehicles exceeding their speed limits.•
A Ministry of Transport survey in 2007 showed that over 90% of the public surveyed wanted Police effort to catch people breaking road safety laws maintained or increased further.
9
2 Drink/Drugged DrivingContribution to Trauma
AlcoholAlcohol increases both the likelihood of a crash occurring and the seriousness of the •injury sustained. As the blood alcohol level rises, the risk of crash involvement rapidly increases.
In fact, if you drink and drive (with a blood alcohol level over 80mg per 100ml) you are •sixteen times more likely to be involved in a fatal crash than a sober driver. If you are aged 15-19 years, you are 86 times more likely to be involved in a fatal crash. People with a high blood alcohol level are more likely to be injured or killed in a crash than those who are sober.
Drink driving is largely a male problem. Over 82% of alcohol affected drivers in fatal •crashes are male. Only 15% of female drivers in fatal crashes are affected by alcohol, compared to 21% of male drivers.
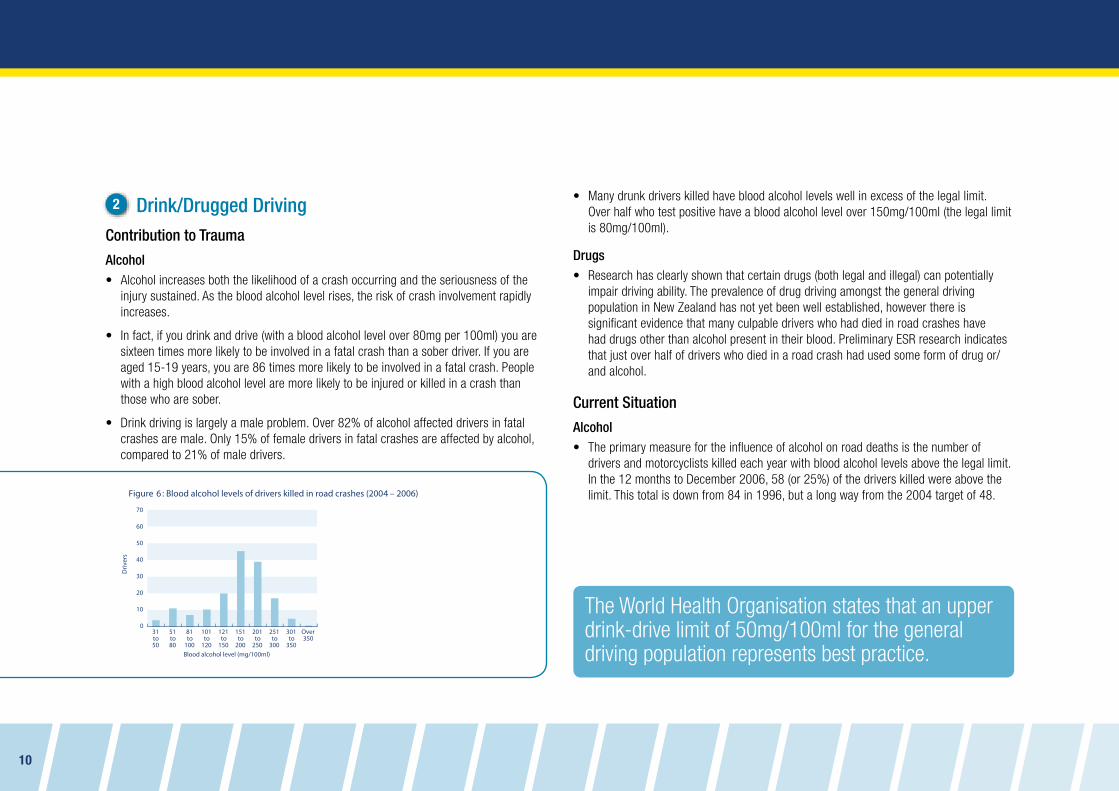
Many drunk drivers killed have blood alcohol levels well in excess of the legal limit. •Over half who test positive have a blood alcohol level over 150mg/100ml (the legal limit is 80mg/100ml).
DrugsResearch has clearly shown that certain drugs (both legal and illegal) can potentially •impair driving ability. The prevalence of drug driving amongst the general driving population in New Zealand has not yet been well established, however there is significant evidence that many culpable drivers who had died in road crashes have had drugs other than alcohol present in their blood. Preliminary ESR research indicates that just over half of drivers who died in a road crash had used some form of drug or/and alcohol.
Current Situation
AlcoholThe primary measure for the influence of alcohol on road deaths is the number of •drivers and motorcyclists killed each year with blood alcohol levels above the legal limit. In the 12 months to December 2006, 58 (or 25%) of the drivers killed were above the limit. This total is down from 84 in 1996, but a long way from the 2004 target of 48.
The World Health Organisation states that an upper drink-drive limit of 50mg/100ml for the general driving population represents best practice.
10
In past years, over 40% of fatal crashes and over 20% of all reported injury crashes •featured drivers affected by alcohol. After a marked reduction since 1996, attributed in part to enhanced policing and advertising, alcohol-related crashes have increased since 2001. In 2006, alcohol-affected drivers contributed to 28% of fatal crashes, and 14% of all injury crashes.
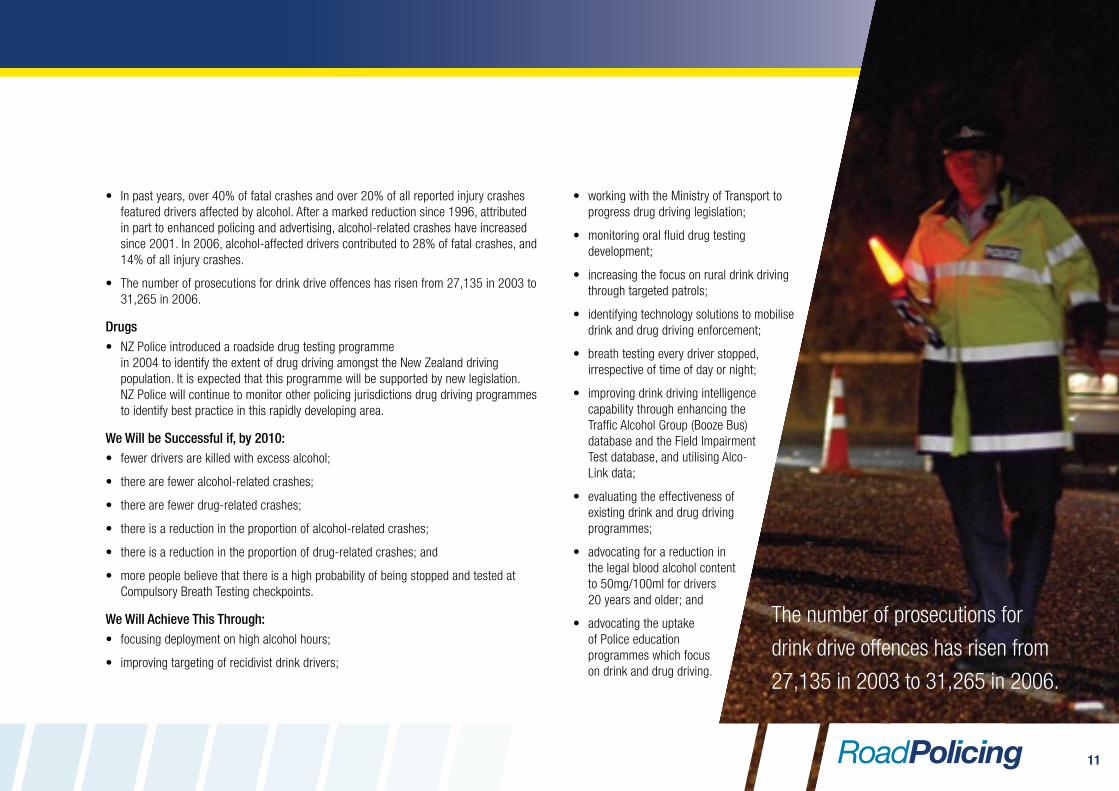
The number of prosecutions for drink drive offences has risen from 27,135 in 2003 to •31,265 in 2006.
DrugsNZ Police introduced a roadside drug testing programme •in 2004 to identify the extent of drug driving amongst the New Zealand driving population. It is expected that this programme will be supported by new legislation. NZ Police will continue to monitor other policing jurisdictions drug driving programmes to identify best practice in this rapidly developing area.
We Will be Successful if, by 2010:fewer drivers are killed with excess alcohol;•
there are fewer alcohol-related crashes;•
there are fewer drug-related crashes;•
there is a reduction in the proportion of alcohol-related crashes;•
there is a reduction in the proportion of drug-related crashes; and•
more people believe that there is a high probability of being stopped and tested at •Compulsory Breath Testing checkpoints.
We Will Achieve This Through:focusing deployment on high alcohol hours;•
improving targeting of recidivist drink drivers;•
working with the Ministry of Transport to •progress drug driving legislation;
monitoring oral fluid drug testing •development;
increasing the focus on rural drink driving •through targeted patrols;
identifying technology solutions to mobilise •drink and drug driving enforcement;
breath testing every driver stopped, •irrespective of time of day or night;
improving drink driving intelligence •capability through enhancing the Traffic Alcohol Group (Booze Bus) database and the Field Impairment Test database, and utilising Alco-Link data;
evaluating the effectiveness of •existing drink and drug driving programmes;
advocating for a reduction in •the legal blood alcohol content to 50mg/100ml for drivers 20 years and older; and
advocating the uptake •of Police education programmes which focus on drink and drug driving.
The number of prosecutions for
drink drive offences has risen from
27,135 in 2003 to 31,265 in 2006.
11
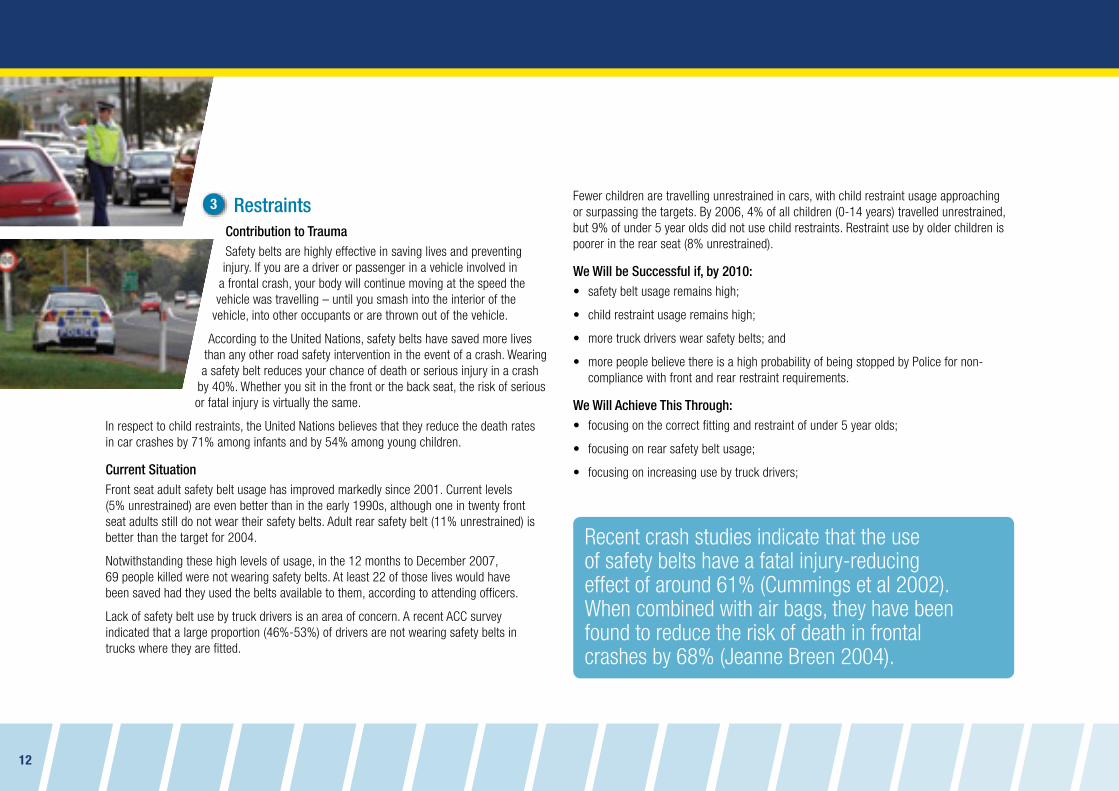
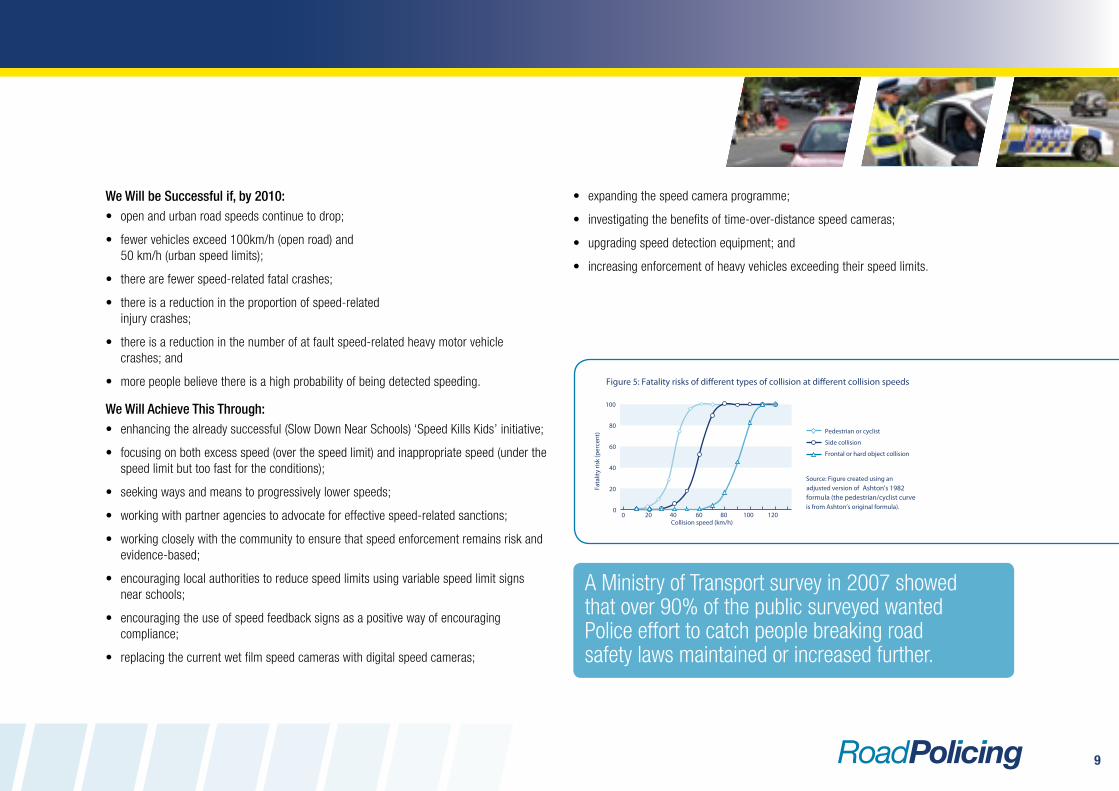
3 Restraints Contribution to TraumaSafety belts are highly effective in saving lives and preventing injury. If you are a driver or passenger in a vehicle involved in
a frontal crash, your body will continue moving at the speed the vehicle was travelling – until you smash into the interior of the
vehicle, into other occupants or are thrown out of the vehicle.
According to the United Nations, safety belts have saved more lives than any other road safety intervention in the event of a crash. Wearing a safety belt reduces your chance of death or serious injury in a crash
by 40%. Whether you sit in the front or the back seat, the risk of serious or fatal injury is virtually the same.
In respect to child restraints, the United Nations believes that they reduce the death rates in car crashes by 71% among infants and by 54% among young children.
Current SituationFront seat adult safety belt usage has improved markedly since 2001. Current levels (5% unrestrained) are even better than in the early 1990s, although one in twenty front seat adults still do not wear their safety belts. Adult rear safety belt (11% unrestrained) is better than the target for 2004.
Notwithstanding these high levels of usage, in the 12 months to December 2007, 69 people killed were not wearing safety belts. At least 22 of those lives would have been saved had they used the belts available to them, according to attending officers.
Lack of safety belt use by truck drivers is an area of concern. A recent ACC survey indicated that a large proportion (46%-53%) of drivers are not wearing safety belts in trucks where they are fitted.
Fewer children are travelling unrestrained in cars, with child restraint usage approaching or surpassing the targets. By 2006, 4% of all children (0-14 years) travelled unrestrained, but 9% of under 5 year olds did not use child restraints. Restraint use by older children is poorer in the rear seat (8% unrestrained).
We Will be Successful if, by 2010:safety belt usage remains high;•
child restraint usage remains high;•
more truck drivers wear safety belts; and•
more people believe there is a high probability of being stopped by Police for non-•compliance with front and rear restraint requirements.
We Will Achieve This Through:focusing on the correct fitting and restraint of under 5 year olds;•
focusing on rear safety belt usage;•
focusing on increasing use by truck drivers;•
Recent crash studies indicate that the use of safety belts have a fatal injury-reducing effect of around 61% (Cummings et al 2002). When combined with air bags, they have been found to reduce the risk of death in frontal crashes by 68% (Jeanne Breen 2004).
12
educating groups who are less likely to comply; •
targeting enforcement to non-complying groups if education does not improve •compliance;
advocating legislative change to remove taxi and courier driver safety belt •exemptions; and
advocating for the use of demerit points for non-wearing of safety belt offences.•
4 Dangerous/Careless DrivingThis focus includes areas such as:
intersections•
failing to keep left•
driving while fatigued or drowsy•
driver distraction.•
Contribution to Trauma
Intersections and Failing to Keep LeftThese two areas target trauma-promoting offences such as failing to give way or stop at intersections, and failing to keep left on the open road. These types of offences are basic non-compliance with the road code. They increase the risk of a traffic crash or the severity of injuries received in a crash. They feature in the top six causes of fatal or injury crashes.
These types of crashes are of particular concern to motorcyclists. Statistics indicate that the two most common crash situations involving motorcyclists are:
intersection crashes which usually involve the motorcyclist with legal right of way being •hit by a vehicle; and
single vehicle crashes where a motorcyclist loses control and runs off the road.•
Fatigue and Driver DistractionFatigue is a physiological condition which can occur long before you fall asleep at the wheel and has negative impacts on your reaction times, ability to concentrate and your general understanding of the road and traffic around you.
Loss of control and head-on crashes are the most common types of fatigue-related fatal crashes. Fatigue-related collisions are more likely to be serious because they are characterised by the absence of avoidance actions such as braking or steering.
Distraction can occur from in-vehicle activities such as cellphone use, interacting with passengers, drinking and eating, or adjusting the stereo; and external factors such as passers by, other vehicles, and roadside activities.
Current Situation
Intersections In 2006, crashes where the driver failed to give way or stop, accounted for 2634 injury crashes (23% of all injury crashes) with 48 deaths, 513 serious injuries and 3091 minor injuries.
Failing to keep left In 2006, crashes where one of the drivers failed to keep left accounted for 484 injury crashes.
Fatigue In 2006, fatigue was identified as a contributing factor in 38 fatal crashes (11%) and 632 injury crashes. These crashes resulted in 41 deaths, 219 serious injuries and 682 minor injuries.
However, fatigue is difficult to identify as a factor in crashes, and research suggests that the role of fatigue in crashes is under-estimated.
Around 23% of crashes where fatigue is a factor also have alcohol as a contributing factor.
13
Distraction In 2006, crashes where a driver was inattentive or diverted accounted for 2115 injury crashes.
We Will be Successful if, by 2010:there are fewer intersection crashes;•
there are fewer crashes caused by a driver failing to keep left or give way;•
more people are aware of the dangers of driving while fatigued;•
there are fewer fatigue-related crashes;•
more people are aware of the dangers of being distracted while driving; and•
there are fewer distraction-related crashes.•
We Will Achieve This Through: innovative enforcement campaigns to target high-risk intersections;•
assisting in the implementation of a red light camera programme at high-risk •intersections;
demerits for intersection related offences;•
developing best practice enforcement tactics to improve driver compliance;•
working with partners to raise general awareness of distraction or driving while •using a mobile phone;
working with partners to improve the base information on the nature and extent of •driver fatigue;
including fatigue and driver distraction in the young novice driver education programme;•
supporting partner agency fatigue initiatives; •
continuing to enforce driving hour limits on commercial vehicle drivers;•
working with partner agencies to raise general awareness of the need to remain •attentive while driving;
advocating corporate safe driving policies; and•
advocating the uptake of Police education programmes which focus on driver distraction •and fatigue.
5 High-Risk DriversThis focus includes areas such as:
driving while unlicensed or disqualified•
young drivers•
motorcyclists•
illegal street racing •
recidivists.•
Contribution to Trauma
Driving While Unlicensed or DisqualifiedUnlicensed and disqualified drivers undermine the driver licensing and court systems. They are often linked to high-risk driving such as drink driving and speeding – and are often repeat offenders.
For example, disqualified and never licensed drivers in fatal crashes are much more likely to be speeding (56% and 57% respectively) than drivers with a full licence (14%). Together, disqualified and never licensed drivers comprise 14% of all drivers in speeding-related fatal crashes.
Similarly, disqualified and never licensed drivers in fatal crashes are much more likely to be affected by alcohol (60% and 40% respectively) than drivers with a full licence (13%).
14
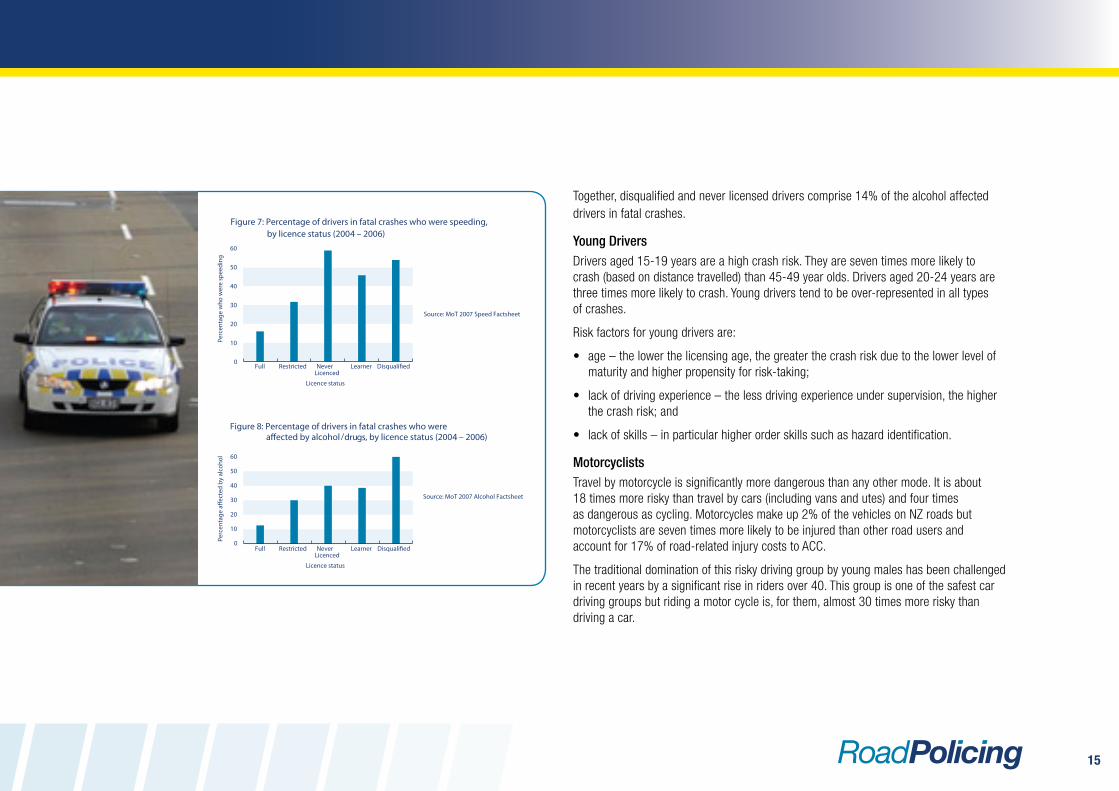
Together, disqualified and never licensed drivers comprise 14% of the alcohol affected drivers in fatal crashes.
Young DriversDrivers aged 15-19 years are a high crash risk. They are seven times more likely to crash (based on distance travelled) than 45-49 year olds. Drivers aged 20-24 years are three times more likely to crash. Young drivers tend to be over-represented in all types of crashes.
Risk factors for young drivers are:
age – the lower the licensing age, the greater the crash risk due to the lower level of •maturity and higher propensity for risk-taking;
lack of driving experience – the less driving experience under supervision, the higher •the crash risk; and
lack of skills – in particular higher order skills such as hazard identification.•
MotorcyclistsTravel by motorcycle is significantly more dangerous than any other mode. It is about 18 times more risky than travel by cars (including vans and utes) and four times as dangerous as cycling. Motorcycles make up 2% of the vehicles on NZ roads but motorcyclists are seven times more likely to be injured than other road users and account for 17% of road-related injury costs to ACC.
The traditional domination of this risky driving group by young males has been challenged in recent years by a significant rise in riders over 40. This group is one of the safest car driving groups but riding a motor cycle is, for them, almost 30 times more risky than driving a car.
15
Current Situation
Driving While Unlicensed or DisqualifiedSince 2003, each year around 160 unlicensed or disqualified drivers are involved in fatal or serious injury crashes, although the number is down from more than 300 prior to 1996. During 2006, 88% of these drivers were at fault in fatal and serious injury crashes, a much higher percentage than the 53% of full licence holders who were at fault.
Young Drivers Despite recent improvements, in 2006 young drivers (those aged 15-24) were involved in 121 fatal traffic crashes, 813 serious injury crashes and 3768 minor injury crashes. Of these crashes, the 15 to 24 year old drivers were at fault in 92 of the fatal crashes, 628 of the serious injury crashes and 2894 of the minor injury crashes, resulting in 108 deaths, 821serious injuries and 4329 minor injuries.
The total social cost of crashes in which 15-24 year old drivers were at fault was about $1 billion, which is more than one third of the social cost associated with all injury crashes.
Despite restrictions on driving after 10pm at night for those on a restricted licence, over a third of fatal crashes involving 15-24 year old drivers occur after 10pm. This trend of being most at risk in the late evening/early morning is also apparent for young drivers on their full licence (39% of all fatal crashes involving full licence holders), and learner licence (28%).
MotorcyclistsCrashes involving motorcycles fell more than 50% between 1995 and 2001, but have been increasing sharply again since mid-2004. Around 30% of these crashes are motorcycle only crashes.
We Will be Successful if, by 2010:there are fewer unlicensed or disqualified drivers involved in crashes;•
there are fewer young drivers involved in crashes;•
there is greater compliance with Graduated Driver Licensing System (GDLS) •conditions; and
there are fewer motorcyclists involved in crashes; and•
there is less illegal street racing.•
We Will Achieve This Through:checking licence status at roadside stops;•
targeting the night curfew GDLS condition given the number of young driver fatal •crashes in the late evening/early morning;
advocating for improved GDLS sanctions (such as having a lower fine but higher demerit •points for GDLS breaches);
targeting the GDLS power restriction for motorcyclists given the number of crashes •involving novice riders on powerful motorcycles;
targeting recidivist offenders; and•
advocating the uptake of Police education programmes which focus on young novice •drivers and their attitudes to risk taking behaviour.
The total social cost of crashes in which 15-24 year-old drivers were at fault was about $1 billion. This is more than one-third of the social cost associated with all injury crashes.
16
Fatal Five – Contribution to the New Zealand Transport Strategy ObjectivesBy addressing road safety through road policing activities, NZ Police also directly targets the wider New Zealand Transport Strategy (NZTS) objectives through environmental enforcement (such as noisy and smoky vehicles) and economic enforcement (such as road user charges enforcement).
Road policing activities contribute to the wider NZTS objectives by:
Ensuring environmental sustainability• – speed enforcement lowers speeds, leading to reduced fuel use, lower emission levels, and smoother flowing traffic; all School Road Safety Education programmes include sustainability messages about walking and cycling being good for the environment.
Improving access and mobility• – a safer land transport system means people are more likely to access the system and be more mobile.
Protecting and promoting public health• – safer school zones can lead to lower child obesity through encouraging children to walk or cycle to/from school; alcohol enforcement produces enhanced health outcomes, which in turn bring about a notable national micro-economic benefit.
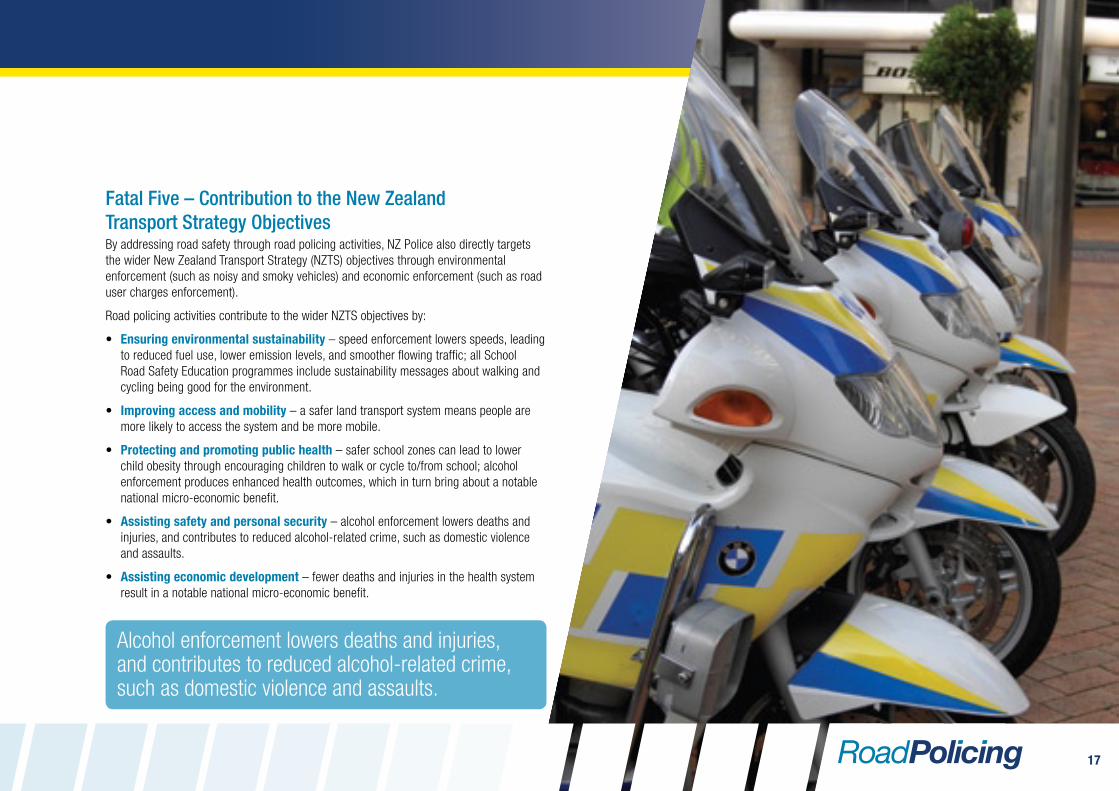
Assisting safety and personal security• – alcohol enforcement lowers deaths and injuries, and contributes to reduced alcohol-related crime, such as domestic violence and assaults.
Assisting economic development• – fewer deaths and injuries in the health system result in a notable national micro-economic benefit.
Alcohol enforcement lowers deaths and injuries, and contributes to reduced alcohol-related crime, such as domestic violence and assaults.
17
Community ReassuranceIn working with and for the community, road policing will focus on participation, priorities, partnerships and protection.
Actions will include:
engaging directly through community road safety liaison and consultation, involvement •in the development of locally focused Road Safety Action Plans, and participation in the Community Road Safety Programme;
identifying local concerns, perceptions and expectations, and being seen to be targeting •these through Risk Targeted Patrol Plans and credible general deterrence enforcement strategies;
focusing on the highest priorities – the fatal five – as a means of protecting everyone in •the community;
working with our partners to effectively raise the awareness, knowledge and •understanding of all road users of the risks on the road;
working with our partners and communities to develop and implement new initiatives •and technologies;
assisting in the implementation of the Road Safety Education Strategic Framework, and •through that, the School Road Safety Education Strategy;
delivering credible education programmes targeted to schools and their communities;•
working with our partners and communities to promote positive compliance;•
being highly visible in known local ‘hot spots’;•
seeking to effectively integrate enforcement with engineering and education initiatives;•
seeking greater integration of crime reduction and road policing activities;•
seeking ways of improving the interaction between partner agencies, for example, •maximising the operator safety rating system as a means of targeting unsafe transport operators; and
ensuring that road policing investment produces benefits to partner agencies, such as •ACC, Land Transport NZ and Transit NZ.
Strategic GoalsOver the next three years, road policing will focus on three strategic goals and outcomes:
• CommunityReassurance–leadingtoconfident,safeandsecurecommunities• PolicingwithConfidence–lessroadtrauma,fewervictims,lessactualcrime• OrganisationalDevelopment–worldclassroadpolicing
“The whole purpose of community reassurance is to ensure that we have a bedrock of community support, and deal with small but significant issues.”– Howard Broad, Commissioner of Police
18
Policing with ConfidenceCommunity reassurance is supported by road policing activities which aim to prevent road trauma. The focus will be on evidence-based proactive policing, timely and effective response to calls for service, thorough investigations, and effective resolutions.
Actions will include:
working with our partners on the delivery of effective national and local •advertising campaigns;
targeting recidivist and persistent offenders;•
producing a tactical excellence manual to assist targeting of local problems;•
working with our partners to promote evidence-based road safety policies •and legislation;
deterring offending through intelligence-led enforcement strategies and patrols, •including the use of Risk Targeted Patrol Plans and Crash Books;
improving road policing intelligence through greater consistency, better performance •monitoring, and robust crash reporting;
enhancing crash investigation techniques (particular emphasis on reporting all crash •injuries); and
continually revising crash investigation capability.•
Organisational DevelopmentOur mission to be a world class Police service requires strong organisational development. The focus will be on:
leadership and people in policing;•
integrity and accountability; and•
technology and innovation.•
Actions will include:
enhancing and strengthening the leadership, supervisory and management development •capability, including the development of career pathways, succession planning, qualifications and structures;
recruiting and training additional road policing staff;•
ensuring new police recruits receive high quality initial road policing training;•
providing clear guidance on road policing expectations;•
ensuring staff have the skills to professionally discuss road safety issues with local •authorities and community leaders;
implementing the final phase of the Professional Police Driver Programme;•
enhancing staff health and safety through effective procedures and equipment;•
delivering credible enforcement by being seen to target known local hot spots;•
identifying and sharing best practice, including tactical excellence; and•
continuing to monitor technology that can make delivery of road policing more efficient, •effective and safe (eg digital speed cameras).
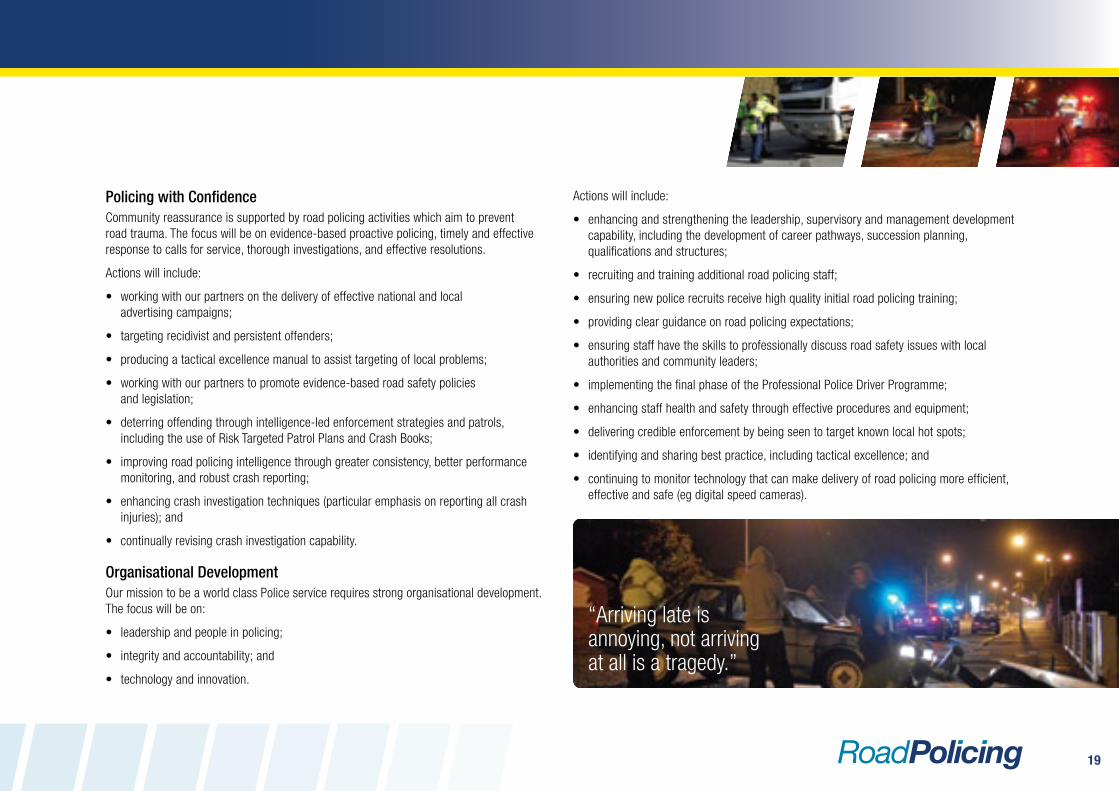
“Arriving late is annoying, not arriving at all is a tragedy.”
19
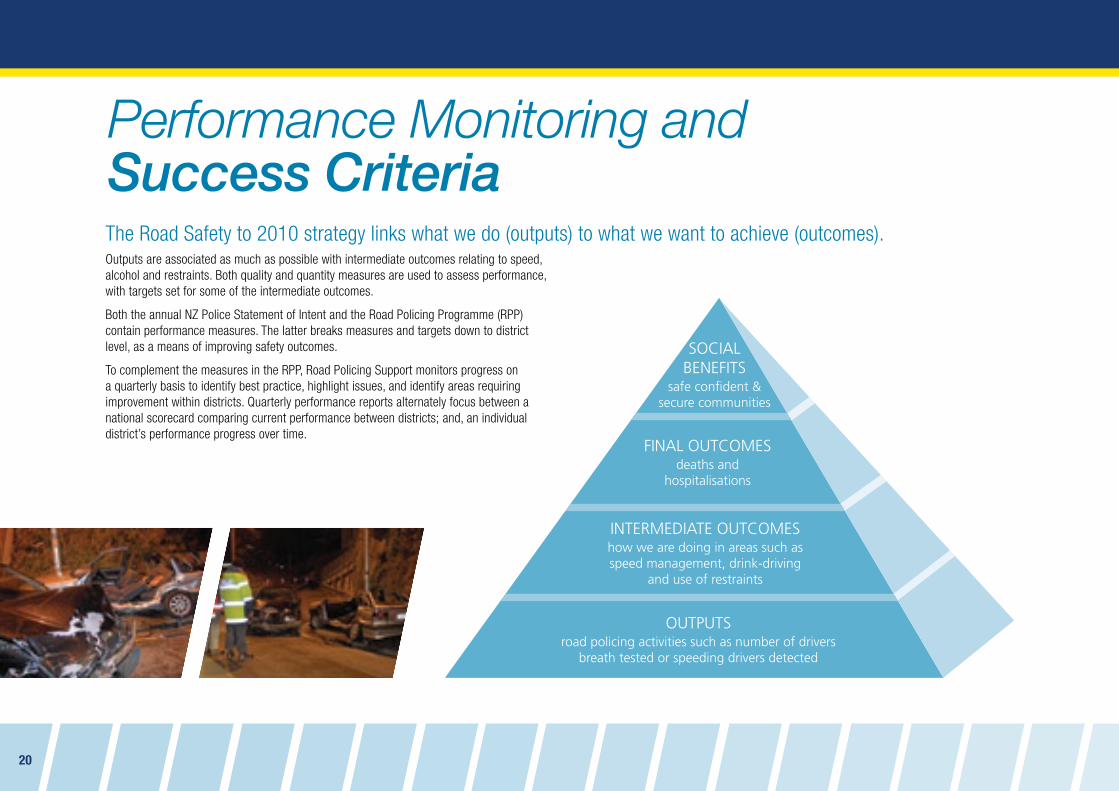
Outputs are associated as much as possible with intermediate outcomes relating to speed, alcohol and restraints. Both quality and quantity measures are used to assess performance, with targets set for some of the intermediate outcomes.
Both the annual NZ Police Statement of Intent and the Road Policing Programme (RPP) contain performance measures. The latter breaks measures and targets down to district level, as a means of improving safety outcomes.
To complement the measures in the RPP, Road Policing Support monitors progress on a quarterly basis to identify best practice, highlight issues, and identify areas requiring improvement within districts. Quarterly performance reports alternately focus between a national scorecard comparing current performance between districts; and, an individual district’s performance progress over time.
Performance Monitoring and Success CriteriaThe Road Safety to 2010 strategy links what we do (outputs) to what we want to achieve (outcomes).
SOCIAL BENEFITS
safe confident & secure communities
FINAL OUTCOMESdeaths and
hospitalisations
INTERMEDIATE OUTCOMEShow we are doing in areas such as speed management, drink-driving
and use of restraints
OUTPUTSroad policing activities such as number of drivers
breath tested or speeding drivers detected
20
21


![IN THE HIGH COURT OF NEW ZEALAND CHRISTCHURCH …...JACKSON v POLICE [2018] NZHC 2297 [3 September 2018] IN THE HIGH COURT OF NEW ZEALAND CHRISTCHURCH REGISTRY I TE KŌTI MATUA O AOTEAROA](https://img.pdfslide.us/doc/110x75/5f0d25fa7e708231d438e9b6/in-the-high-court-of-new-zealand-christchurch-jackson-v-police-2018-nzhc-2297.jpg)
![MINISTERIAL MEETING PANEL #6 – NEW ZEALAND · 2018-09-27 · MINISTERIAL MEETING -PANEL #6 – NEW ZEALAND - 3 - [Slide Six] Police is now embarking on a new period of improvement](https://img.pdfslide.us/doc/110x75/5f97be8b39a631130d6e3efa/ministerial-meeting-panel-6-a-new-zealand-2018-09-27-ministerial-meeting-panel.jpg)

![IN THE COURT OF APPEAL OF NEW ZEALAND I TE …...WOODS v NEW ZEALAND POLICE [2019] NZCA 446 [20 September 2019] IN THE COURT OF APPEAL OF NEW ZEALAND I TE KŌTI PĪRA O AOTEAROA CA572/2018](https://img.pdfslide.us/doc/110x75/5e565c1f1d5675403968c58f/in-the-court-of-appeal-of-new-zealand-i-te-woods-v-new-zealand-police-2019.jpg)
![IN THE HIGH COURT OF NEW ZEALAND HAMILTON REGISTRY CIV ... · PDF fileThe Commissioner of Police v de Wys [2015] NZHC 540 [24 March 2015] IN THE HIGH COURT OF NEW ZEALAND HAMILTON](https://img.pdfslide.us/doc/110x75/5a79367f7f8b9a51548cba14/in-the-high-court-of-new-zealand-hamilton-registry-civ-commissioner-of-police.jpg)