Embed Size (px)
DESCRIPTION
How strategy can be implemented with the help of SWOT,Value Chain Analysis
Citation preview
Implementation of strategy

Session objectives
Implementation of strategy
though
SWOT Analysis Focus on Execution Value chain analysis Balanced Score Card

Amazon.com
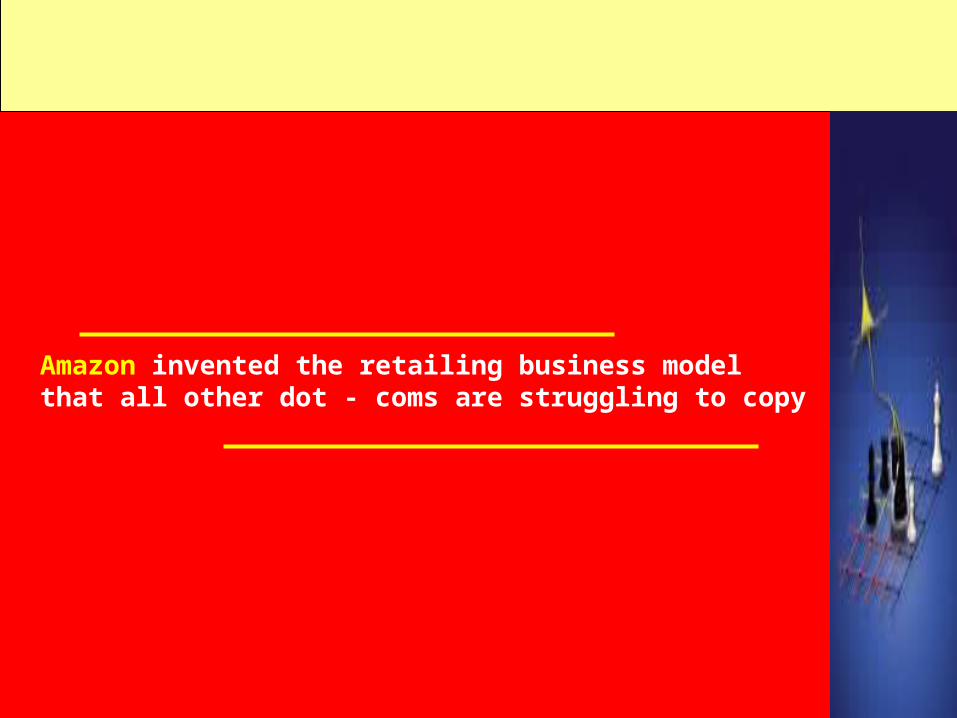
Amazon invented the retailing business modelthat all other dot - coms are struggling to copy
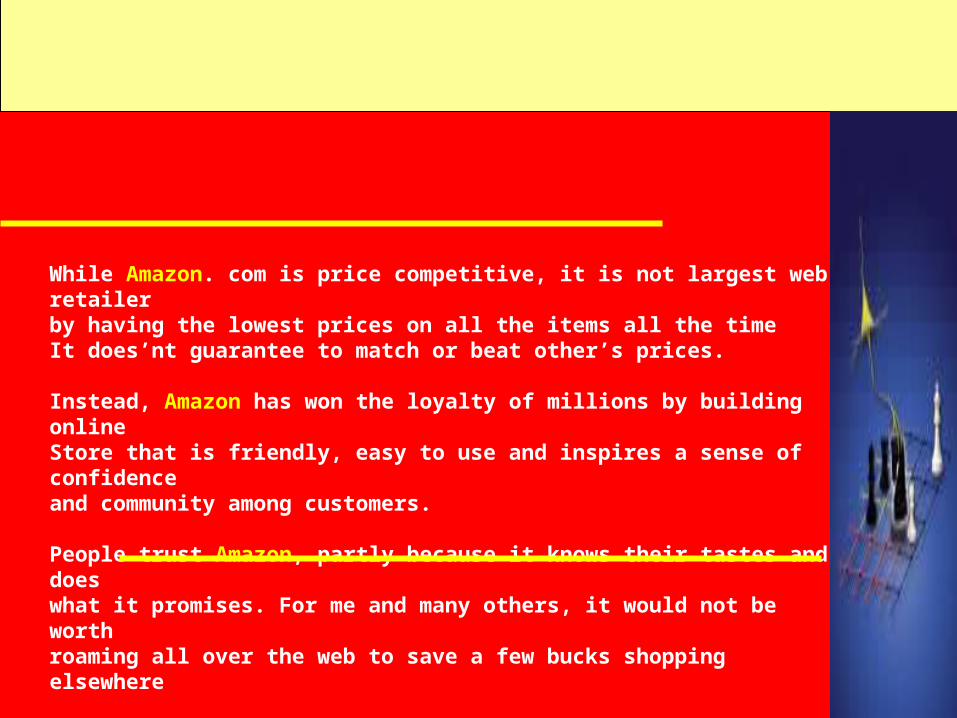
While Amazon. com is price competitive, it is not largest web retailerby having the lowest prices on all the items all the timeIt does’nt guarantee to match or beat other’s prices.
Instead, Amazon has won the loyalty of millions by building onlineStore that is friendly, easy to use and inspires a sense of confidenceand community among customers.
People trust Amazon, partly because it knows their tastes and does what it promises. For me and many others, it would not be worth roaming all over the web to save a few bucks shopping elsewhere
Walter Mossberg -technology commentator for The wall Street Journal
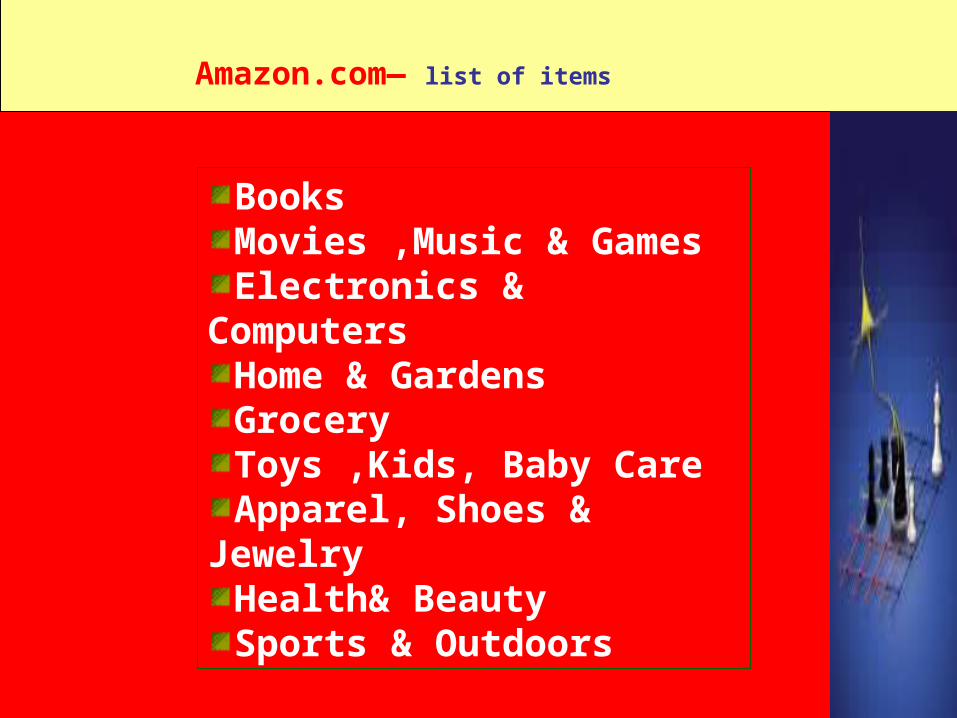
Amazon.com— list of items
BooksMovies ,Music & GamesElectronics & ComputersHome & GardensGroceryToys ,Kids, Baby CareApparel, Shoes & JewelryHealth& BeautySports & Outdoors
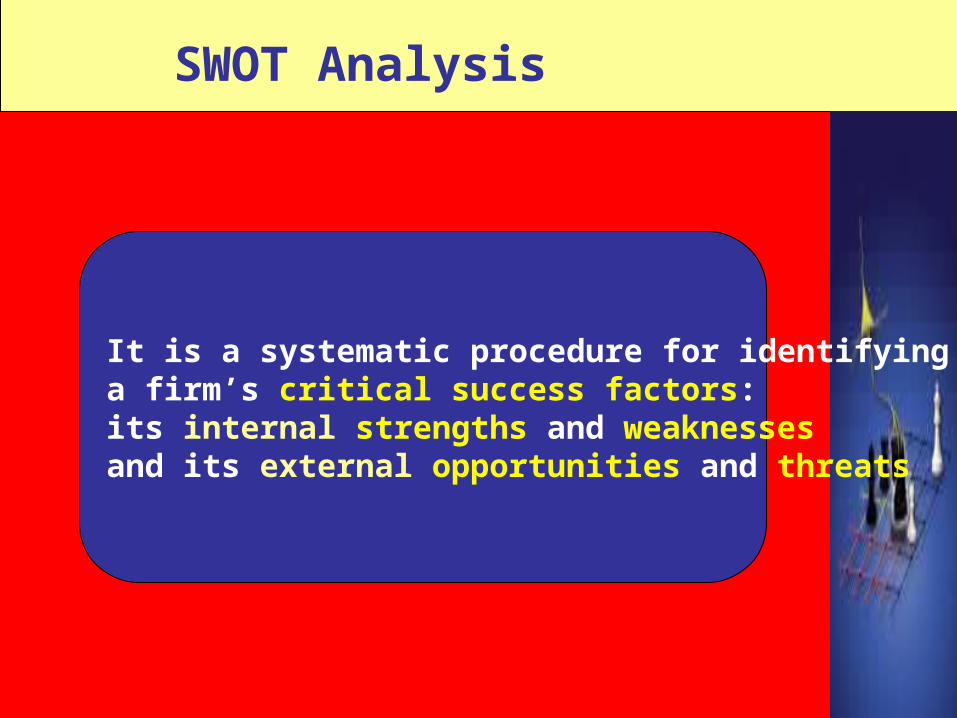
SWOT Analysis
It is a systematic procedure for identifying a firm’s critical success factors:its internal strengths and weaknesses and its external opportunities and threats
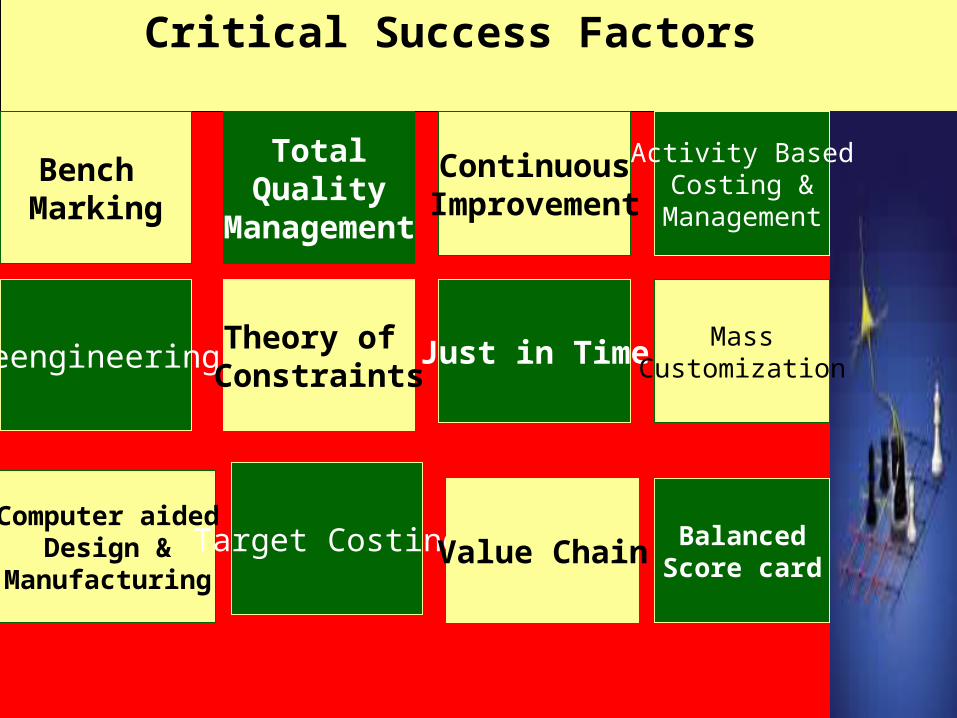
Critical Success Factors
Computer aidedDesign &
Manufacturing
Target Costing Value ChainBalanced
Score card
Bench Marking
TotalQuality
Management
ContinuousImprovement
Activity BasedCosting &
Management
ReengineeringTheory of
ConstraintsJust in Time
MassCustomization
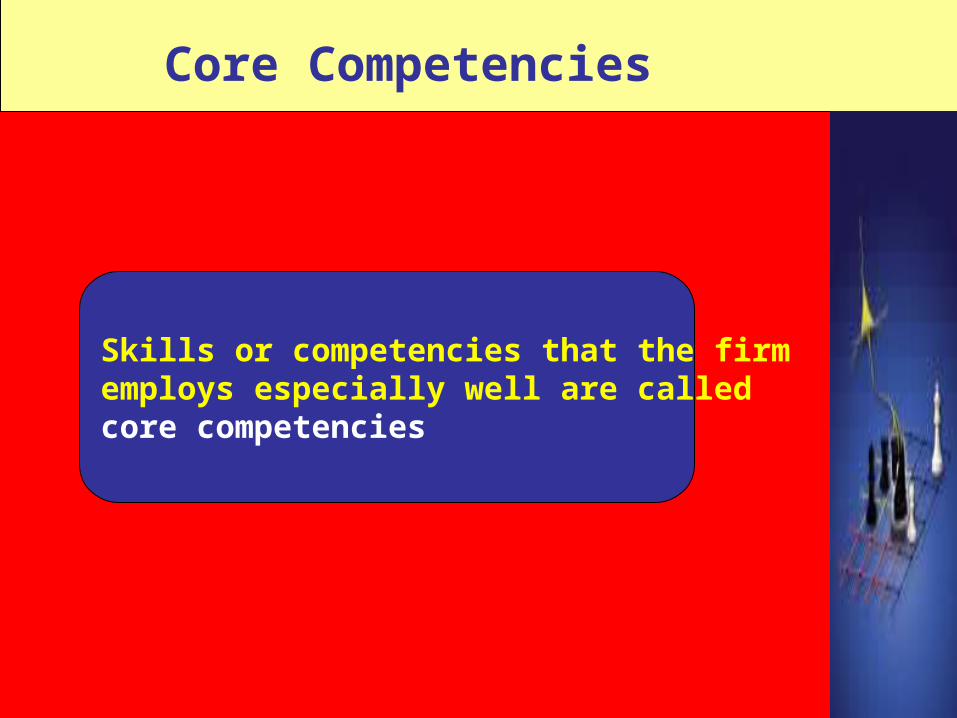
Core Competencies
Skills or competencies that the firm employs especially well are calledcore competencies
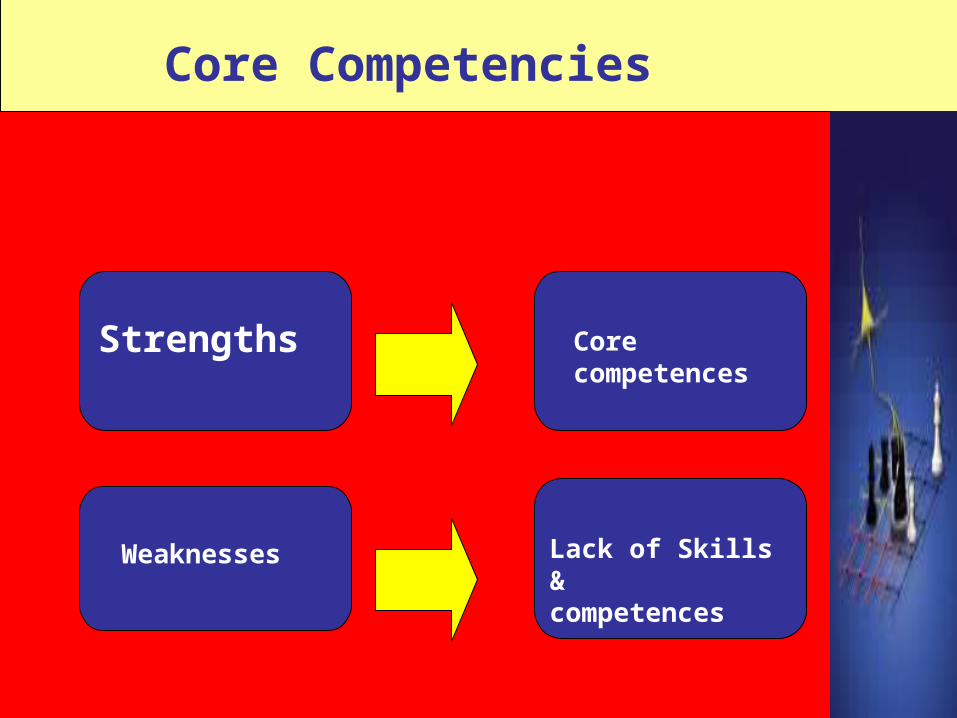
Core Competencies
Strengths
Weaknesses
Core competences
Lack of Skills&competences
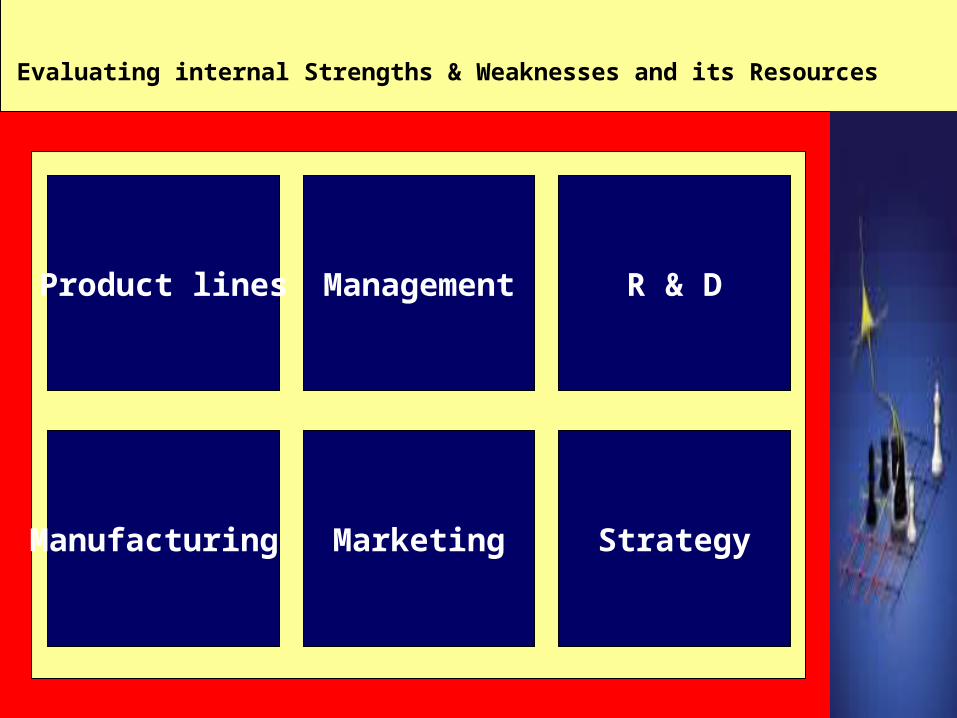
Product lines Management R & DProduct lines Management R & D
Manufacturing Marketing Strategy
Evaluating internal Strengths & Weaknesses and its Resources
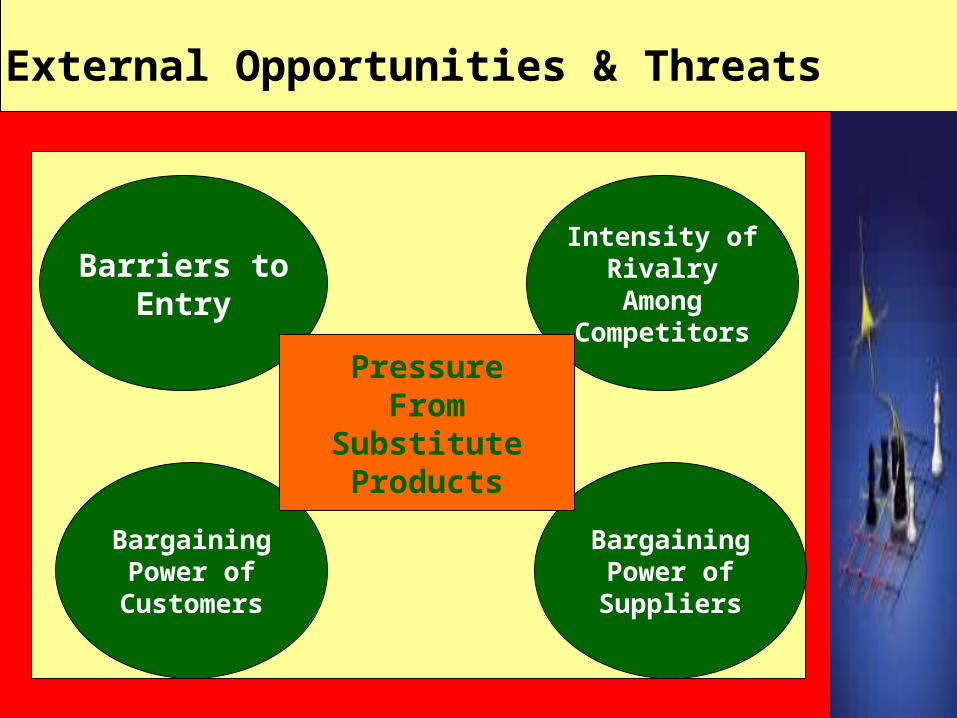
External Opportunities & Threats
Barriers toEntry
BargainingPower of
Customers
Intensity ofRivalryAmong
Competitors
BargainingPower ofSuppliers
PressureFrom
SubstituteProducts
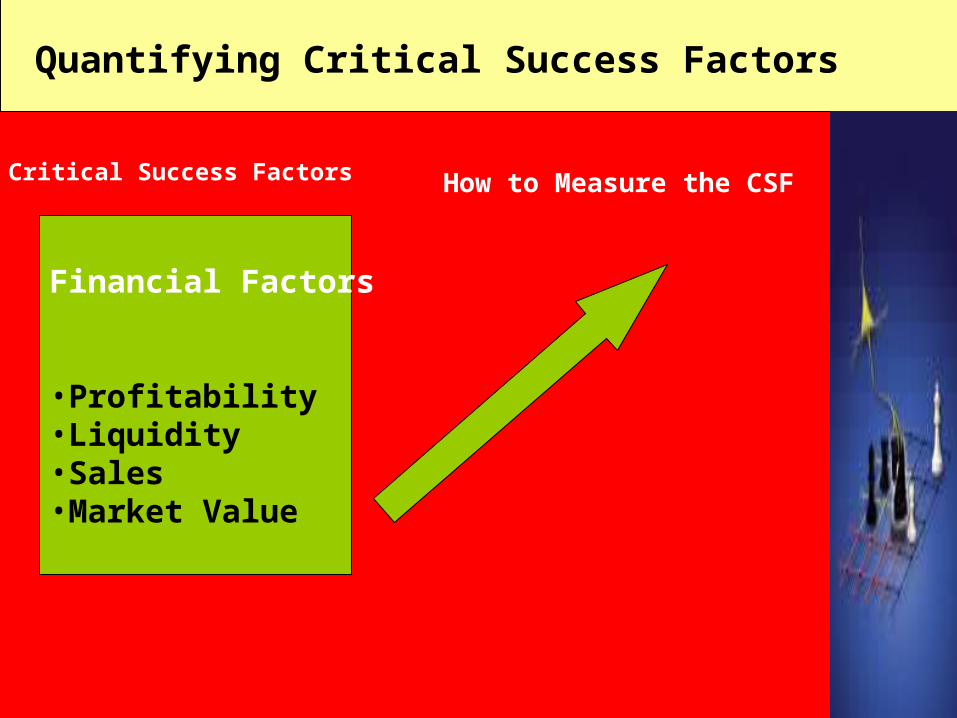
Quantifying Critical Success Factors
Financial Factors
•Profitability•Liquidity•Sales•Market Value
Critical Success Factors How to Measure the CSF
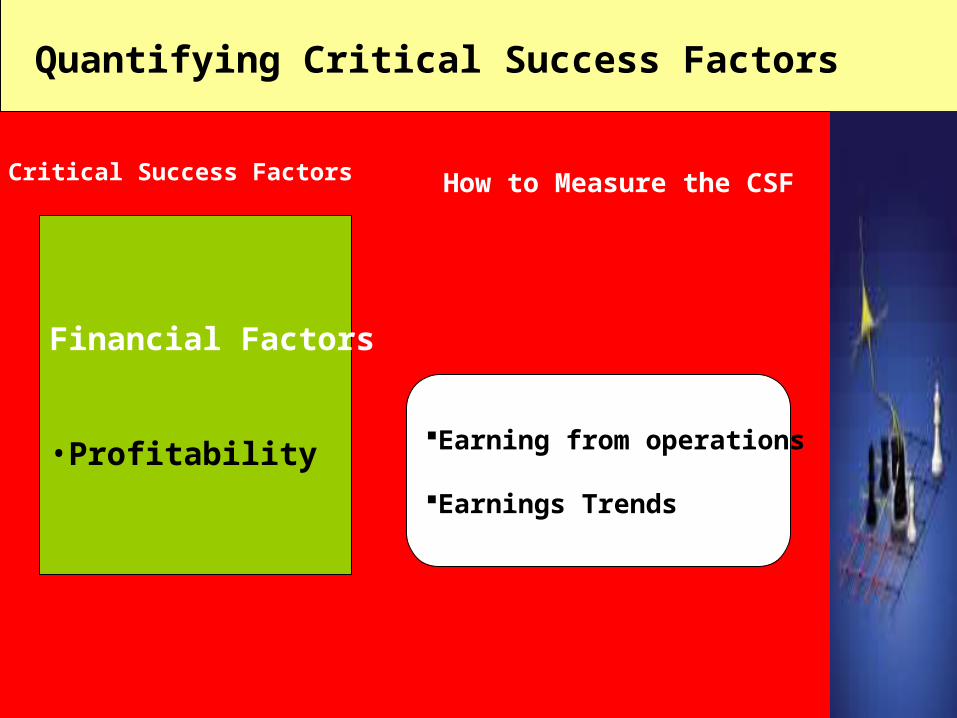
Quantifying Critical Success Factors
Financial Factors
•Profitability
Critical Success Factors How to Measure the CSF
Earning from operations
Earnings Trends
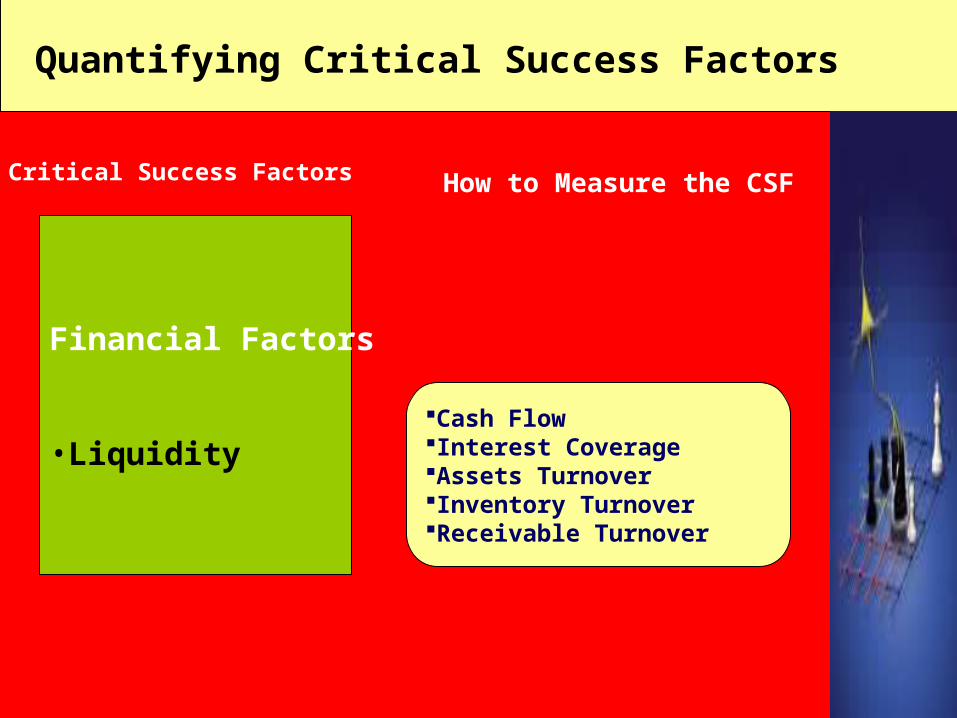
Quantifying Critical Success Factors
Financial Factors
•Liquidity
Critical Success Factors How to Measure the CSF
Cash FlowInterest CoverageAssets TurnoverInventory TurnoverReceivable Turnover
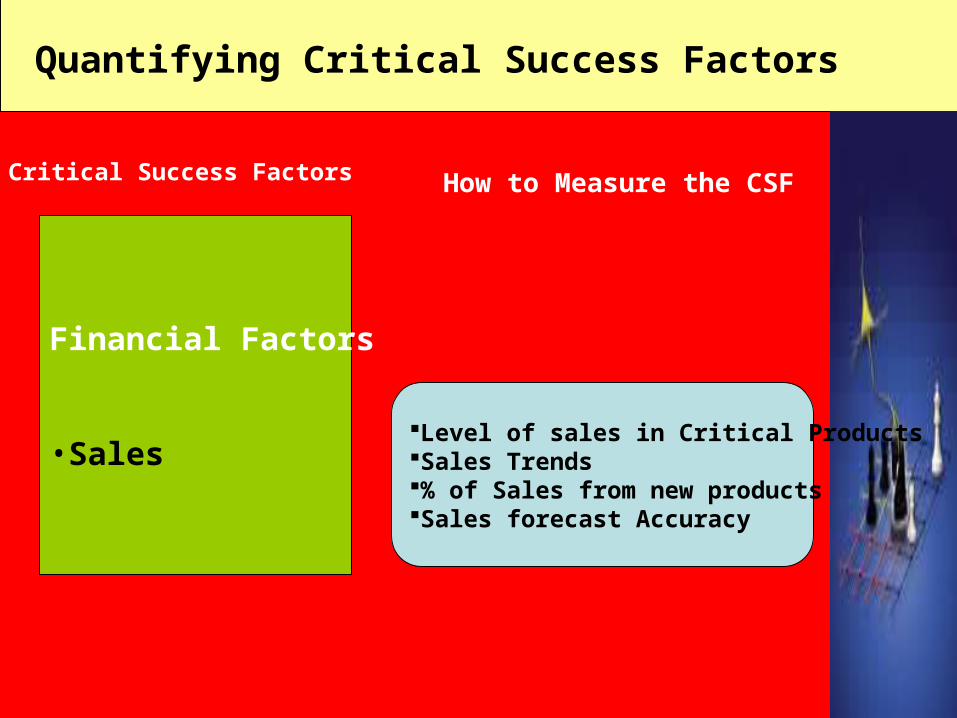
Quantifying Critical Success Factors
Financial Factors
•Sales
Critical Success Factors How to Measure the CSF
Level of sales in Critical ProductsSales Trends% of Sales from new productsSales forecast Accuracy
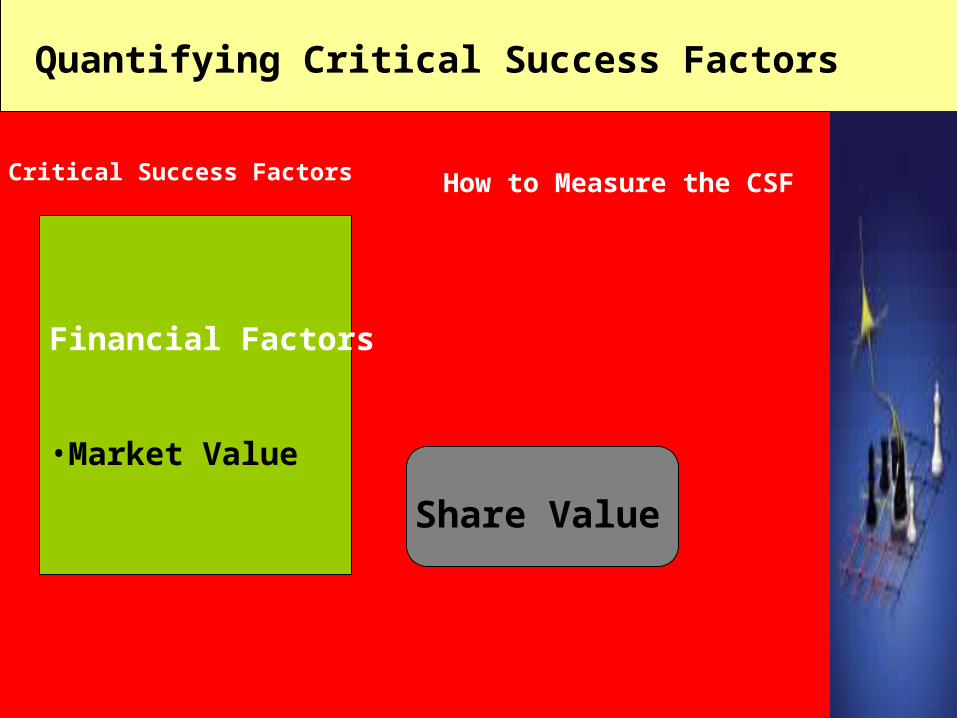
Quantifying Critical Success Factors
Financial Factors
•Market Value
Critical Success Factors How to Measure the CSF
Share Value
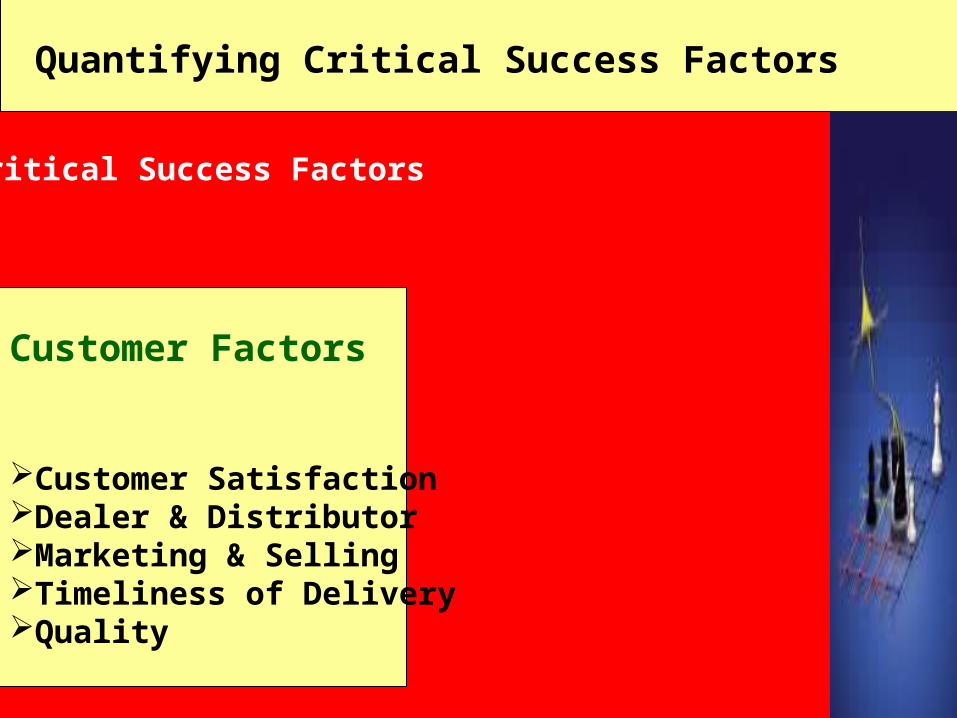
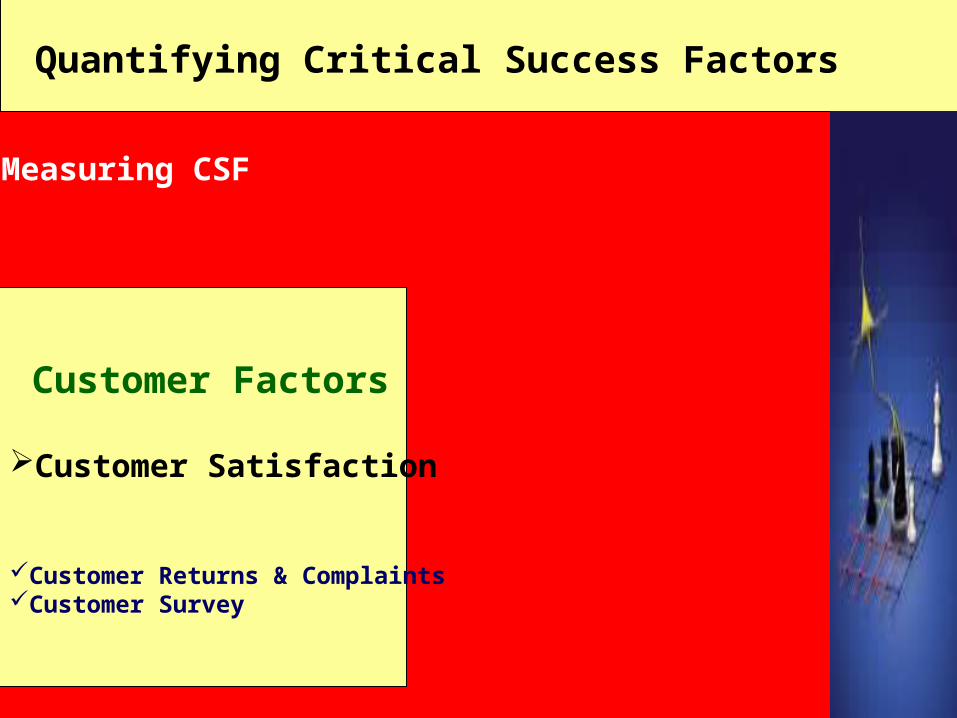
Quantifying Critical Success Factors
Customer Factors
Customer SatisfactionDealer & DistributorMarketing & SellingTimeliness of DeliveryQuality
Critical Success Factors
Quantifying Critical Success Factors
Customer Factors
Customer Satisfaction
Customer Returns & ComplaintsCustomer Survey
Measuring CSF
Quantifying Critical Success Factors
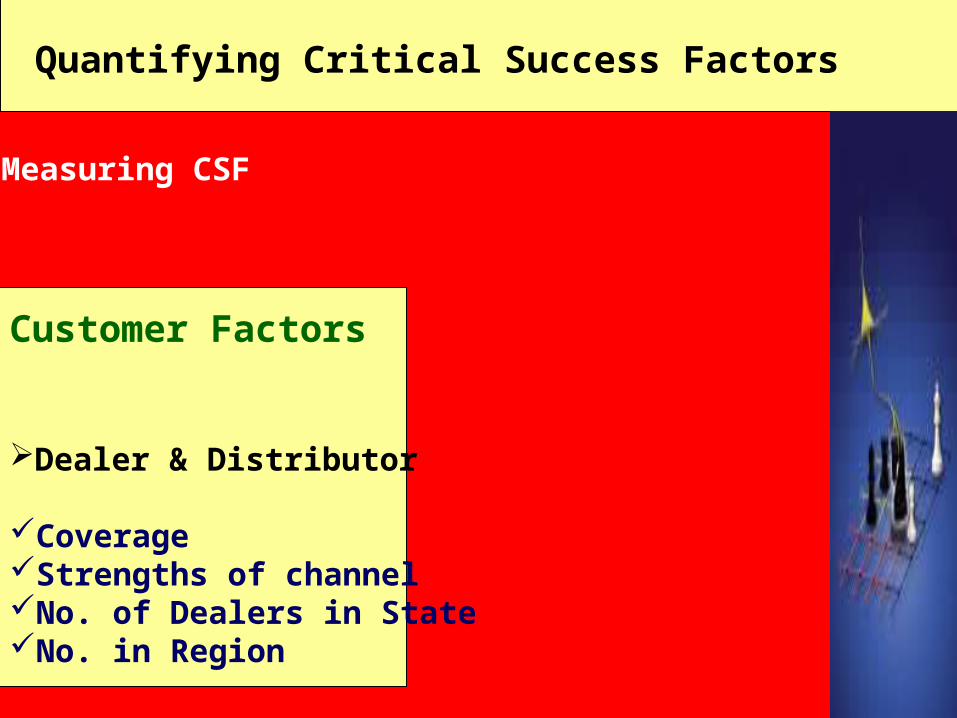
Customer Factors
Dealer & Distributor
Coverage Strengths of channelNo. of Dealers in StateNo. in Region
Measuring CSF
Quantifying Critical Success Factors
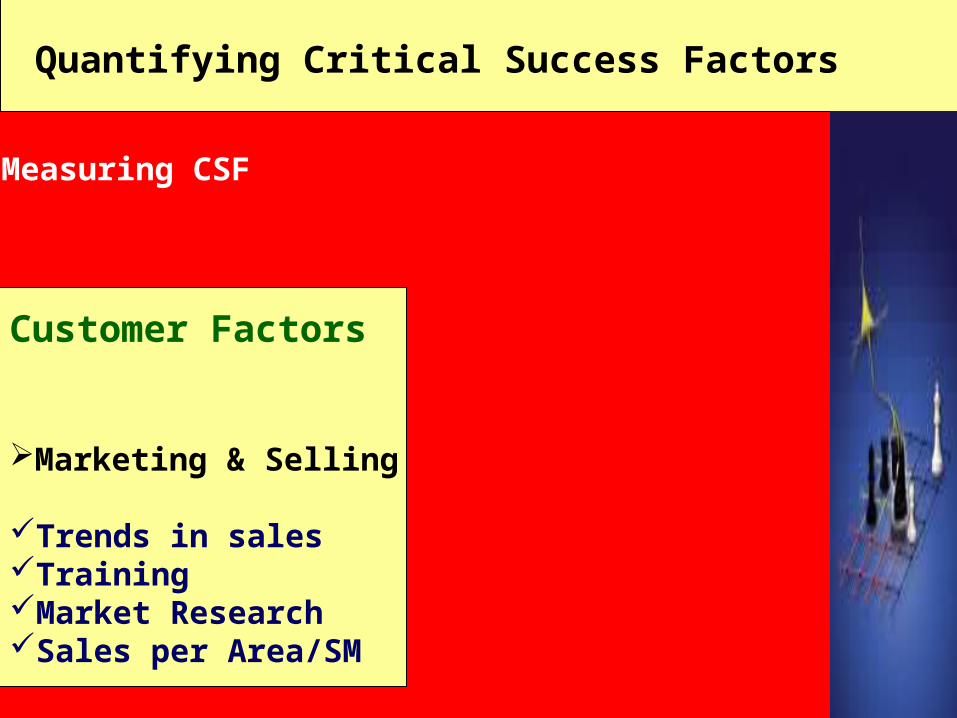
Customer Factors
Marketing & Selling
Trends in salesTrainingMarket ResearchSales per Area/SM
Measuring CSF
Quantifying Critical Success Factors
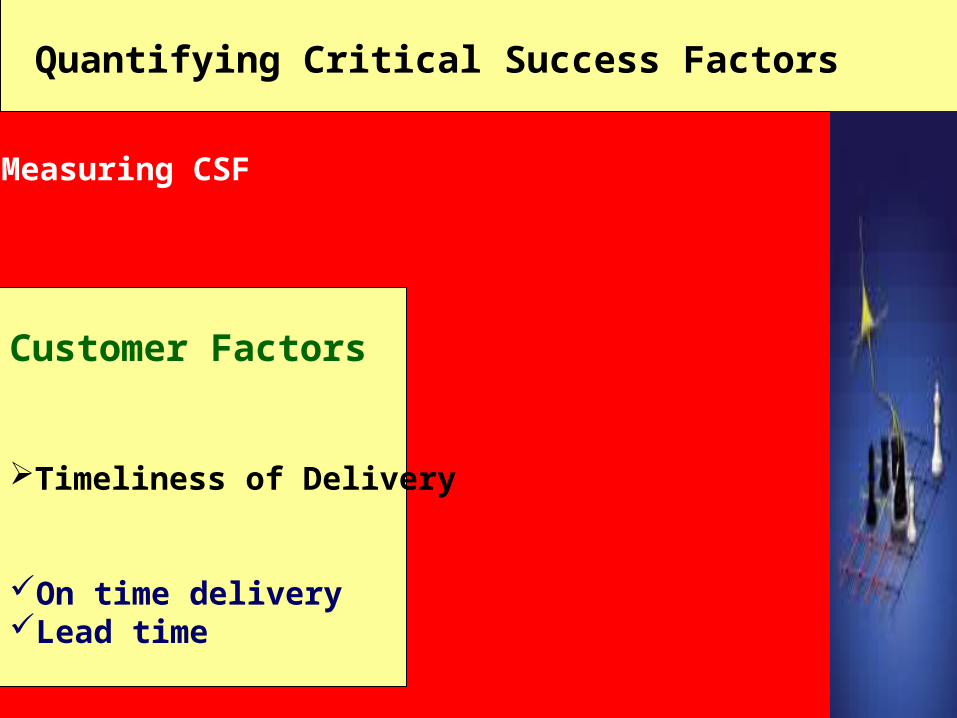
Customer Factors
Timeliness of Delivery
On time deliveryLead time
Measuring CSF
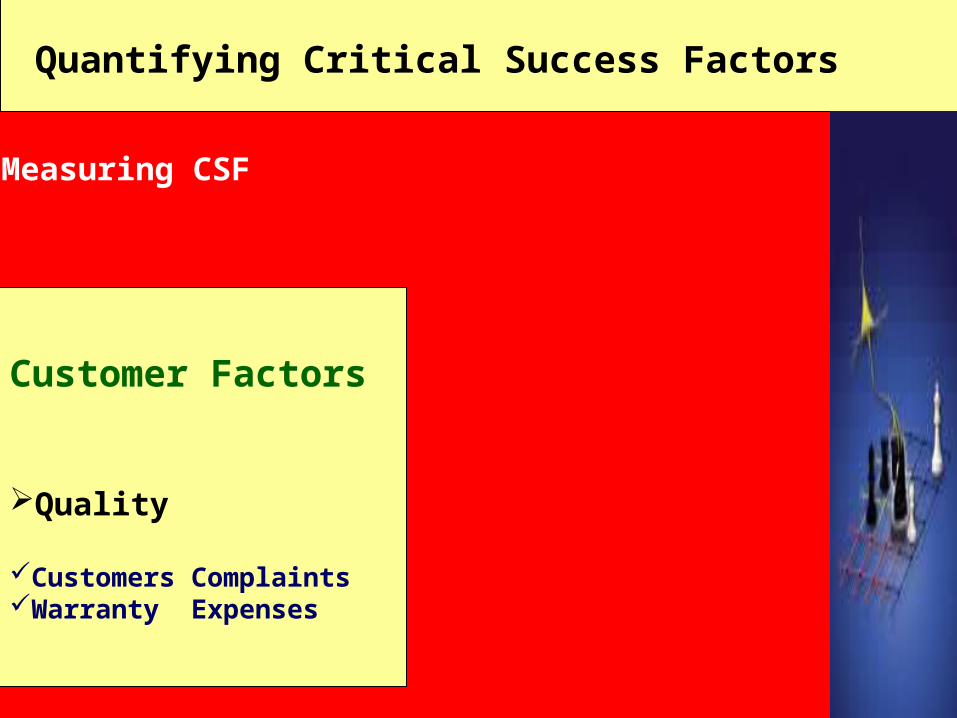
Quantifying Critical Success Factors
Customer Factors
Quality
Customers ComplaintsWarranty Expenses
Measuring CSF
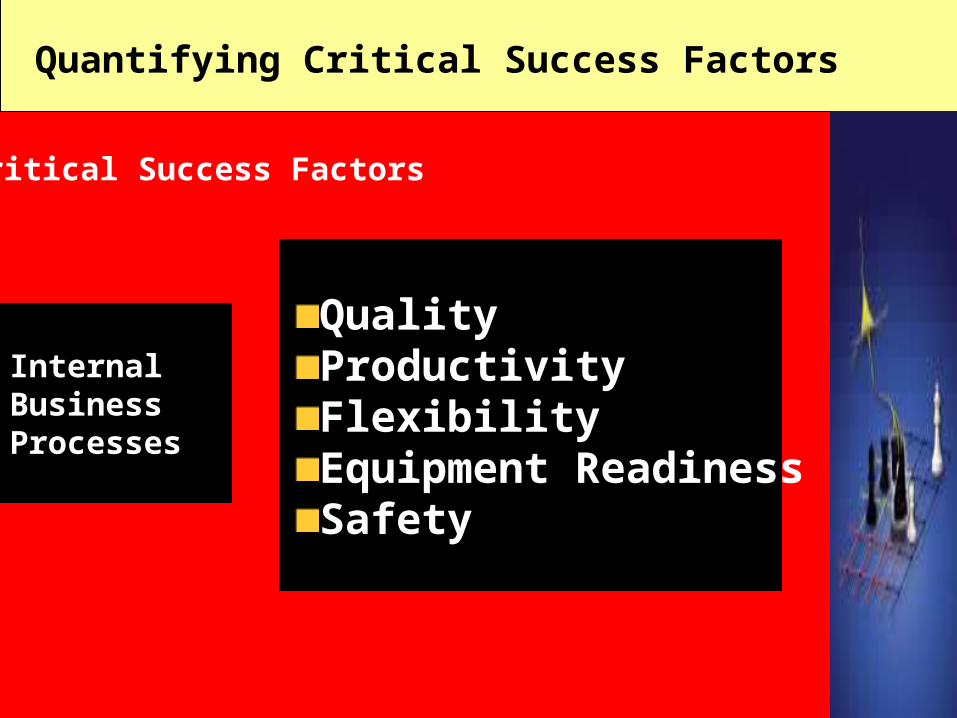
Quantifying Critical Success Factors
Critical Success Factors
Internal BusinessProcesses
QualityProductivityFlexibilityEquipment ReadinessSafety
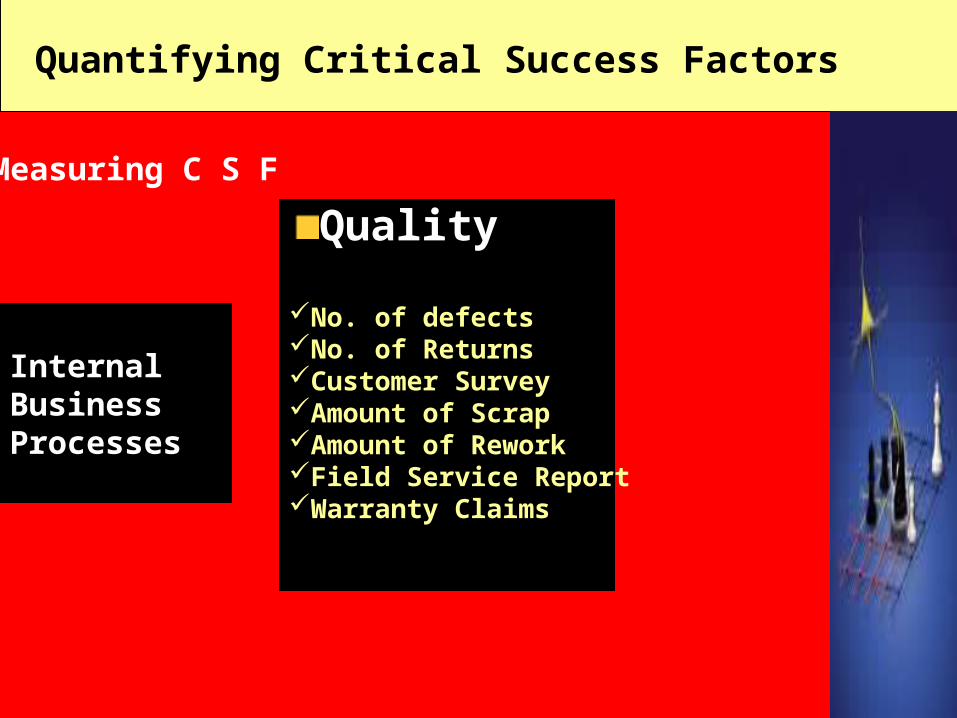
Quantifying Critical Success Factors
Measuring C S F
Internal BusinessProcesses
Quality
No. of defectsNo. of ReturnsCustomer SurveyAmount of ScrapAmount of ReworkField Service ReportWarranty Claims
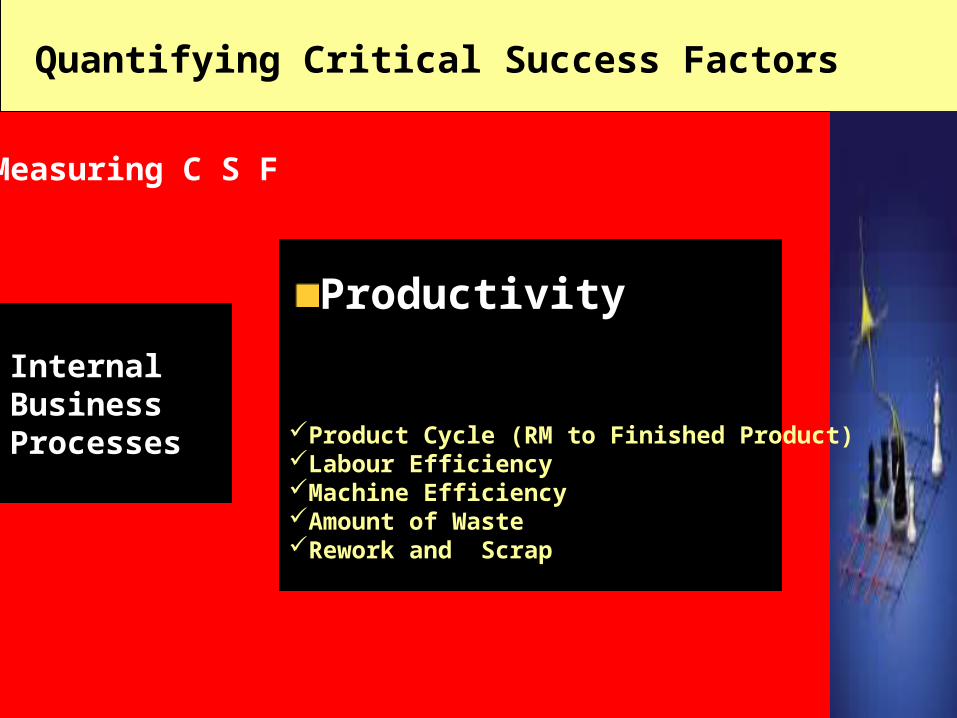
Quantifying Critical Success Factors
Measuring C S F
Internal BusinessProcesses
Productivity
Product Cycle (RM to Finished Product)Labour EfficiencyMachine EfficiencyAmount of WasteRework and Scrap
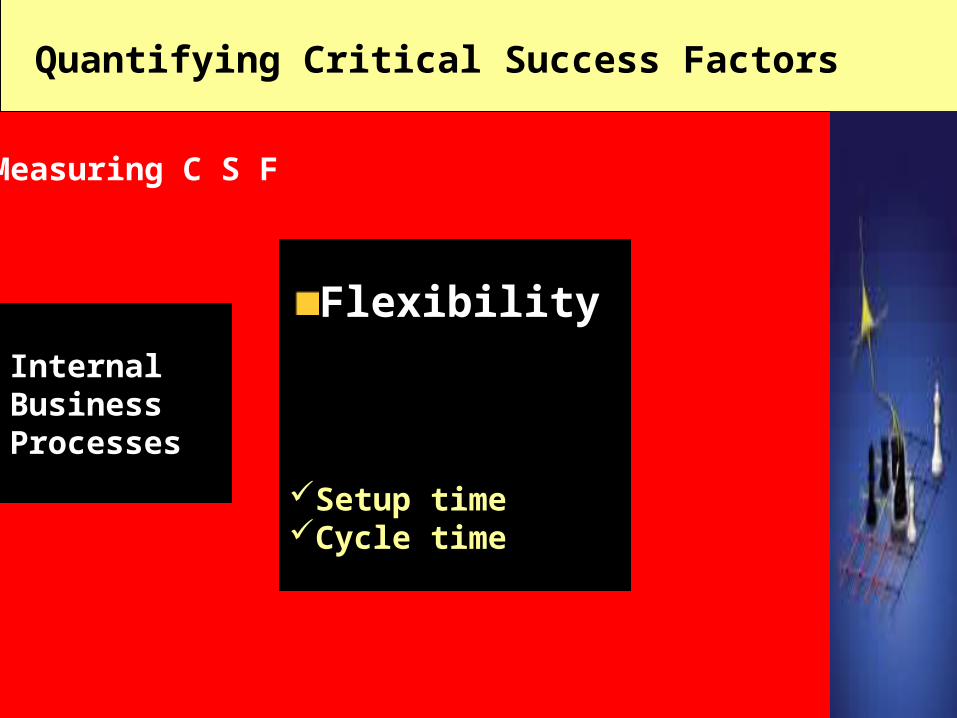
Quantifying Critical Success Factors
Measuring C S F
Internal BusinessProcesses
Flexibility
Setup timeCycle time
Quantifying Critical Success Factors
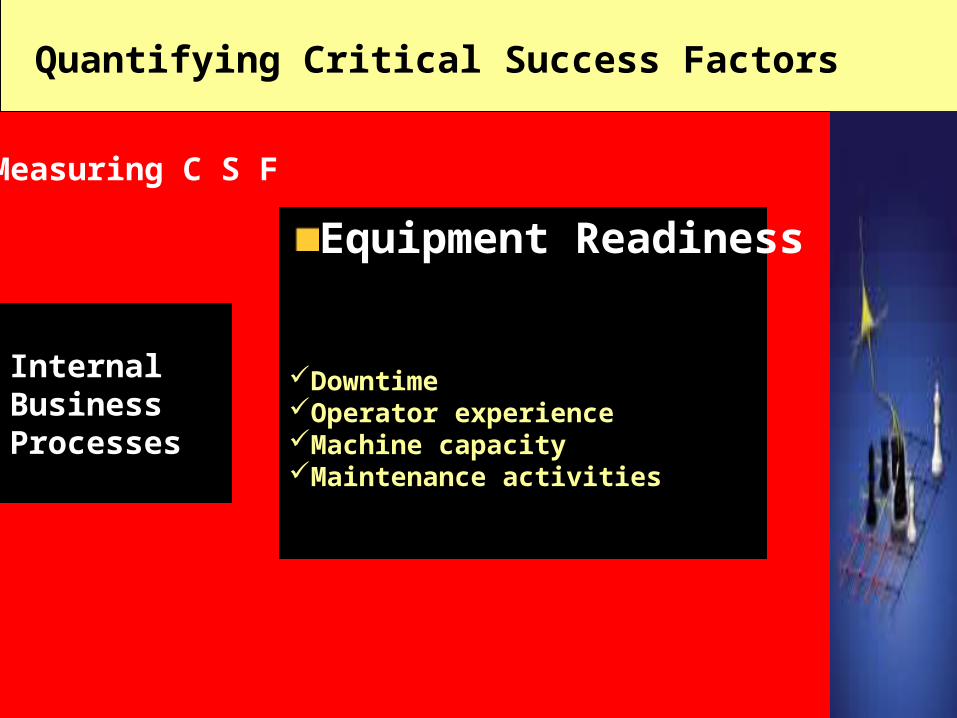
Measuring C S F
Internal BusinessProcesses
Equipment Readiness
DowntimeOperator experienceMachine capacityMaintenance activities
Quantifying Critical Success Factors
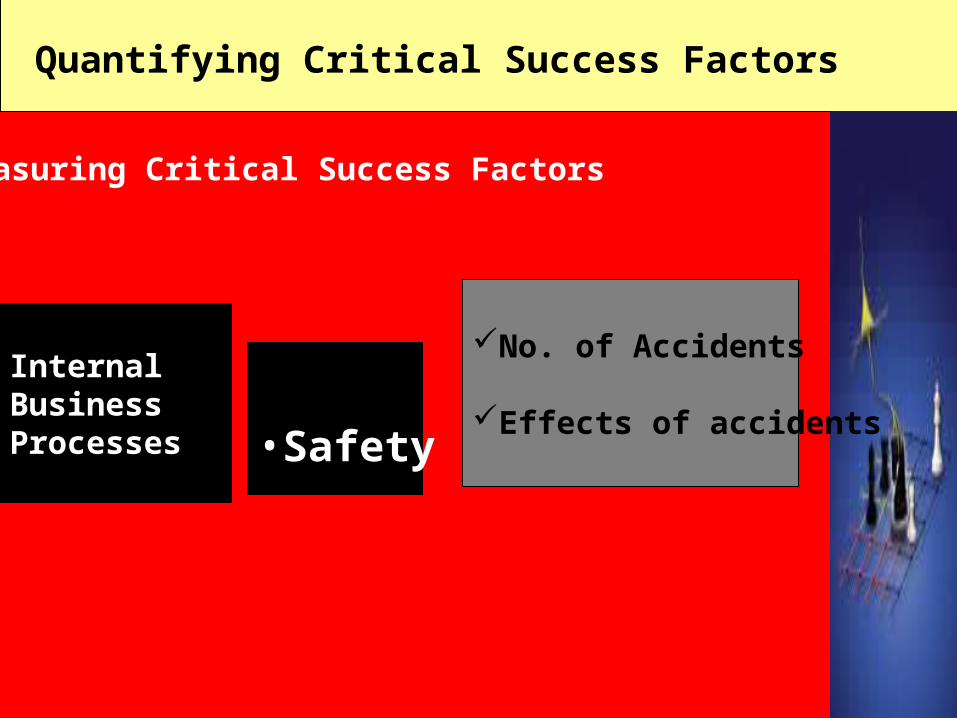
Measuring Critical Success Factors
Internal BusinessProcesses •Safety
No. of Accidents
Effects of accidents
Quantifying Critical Success Factors
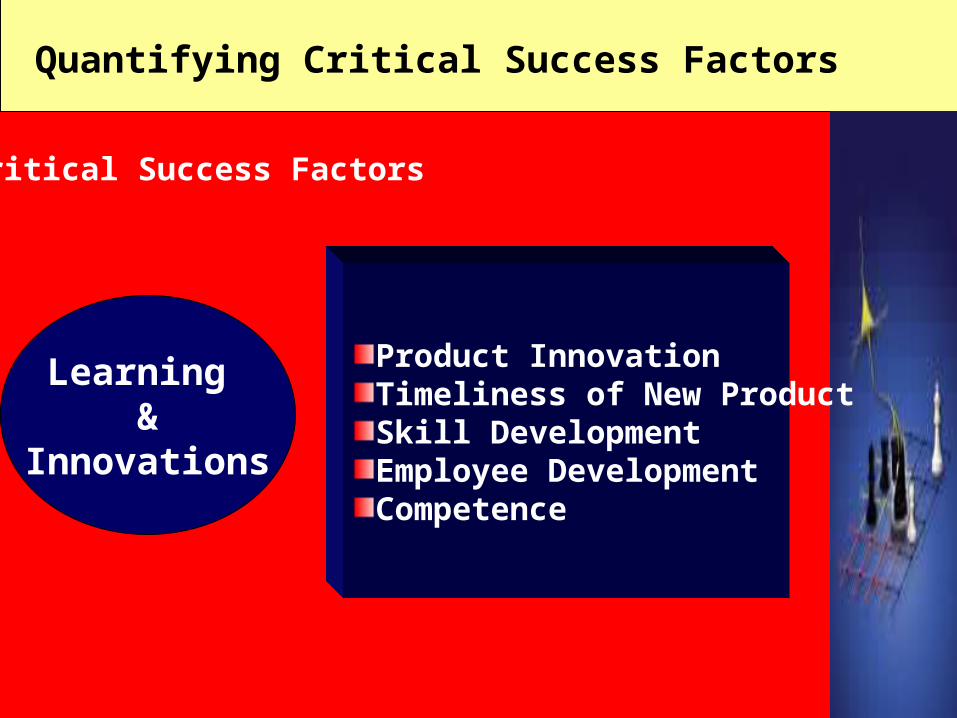
Critical Success Factors
Learning &
Innovations
Product InnovationTimeliness of New ProductSkill DevelopmentEmployee DevelopmentCompetence
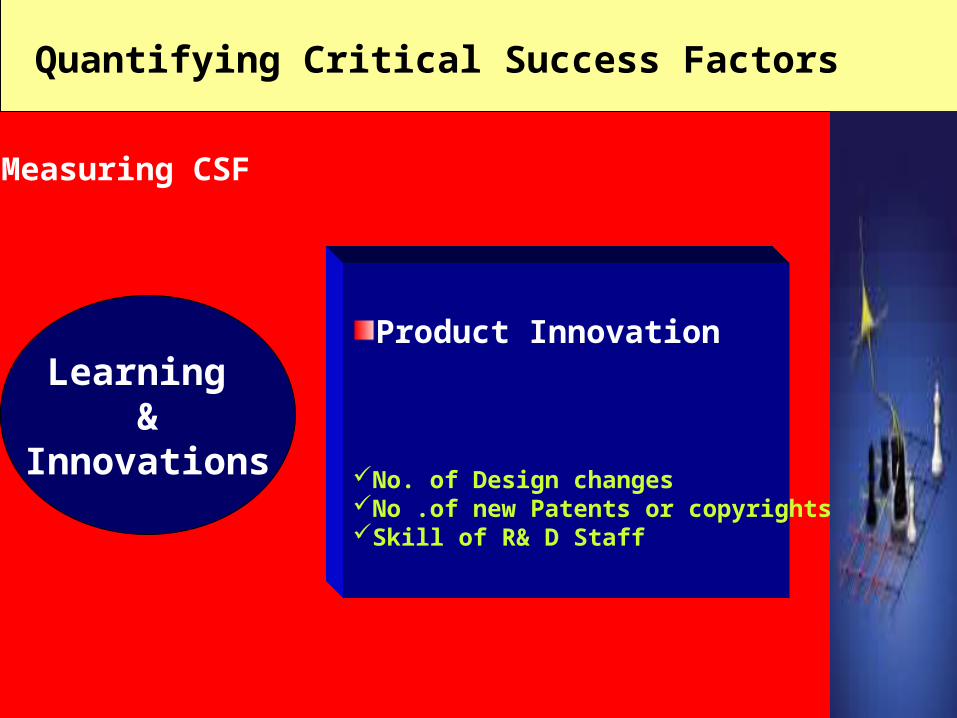
Quantifying Critical Success Factors
Measuring CSF
Learning &
Innovations
Product Innovation
No. of Design changesNo .of new Patents or copyrightsSkill of R& D Staff
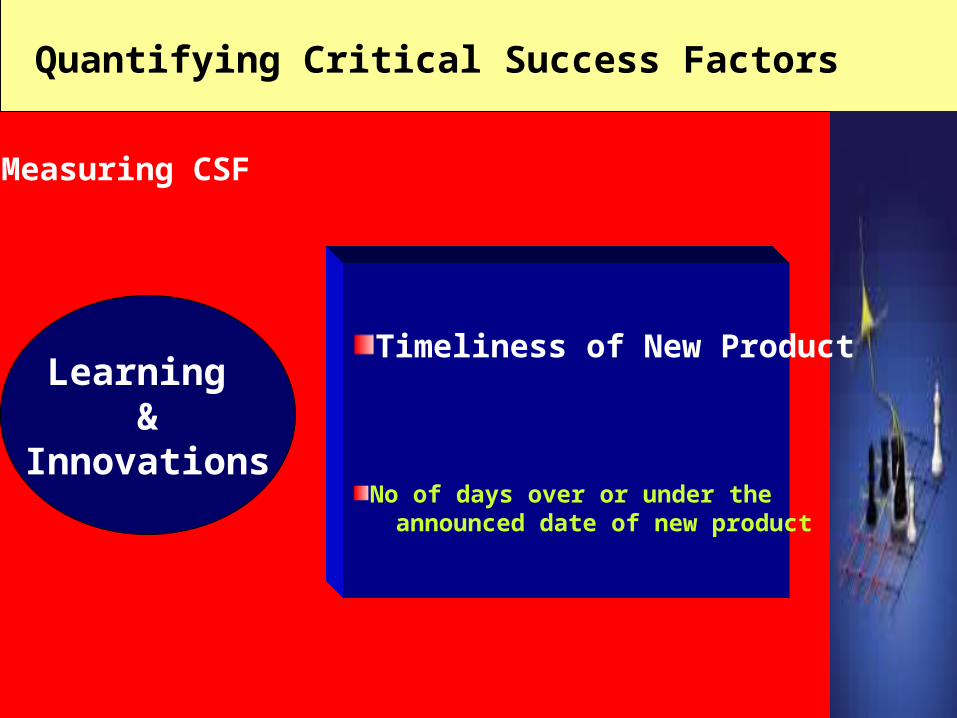
Quantifying Critical Success Factors
Measuring CSF
Learning &
Innovations
Timeliness of New Product
No of days over or under the announced date of new product
Quantifying Critical Success Factors
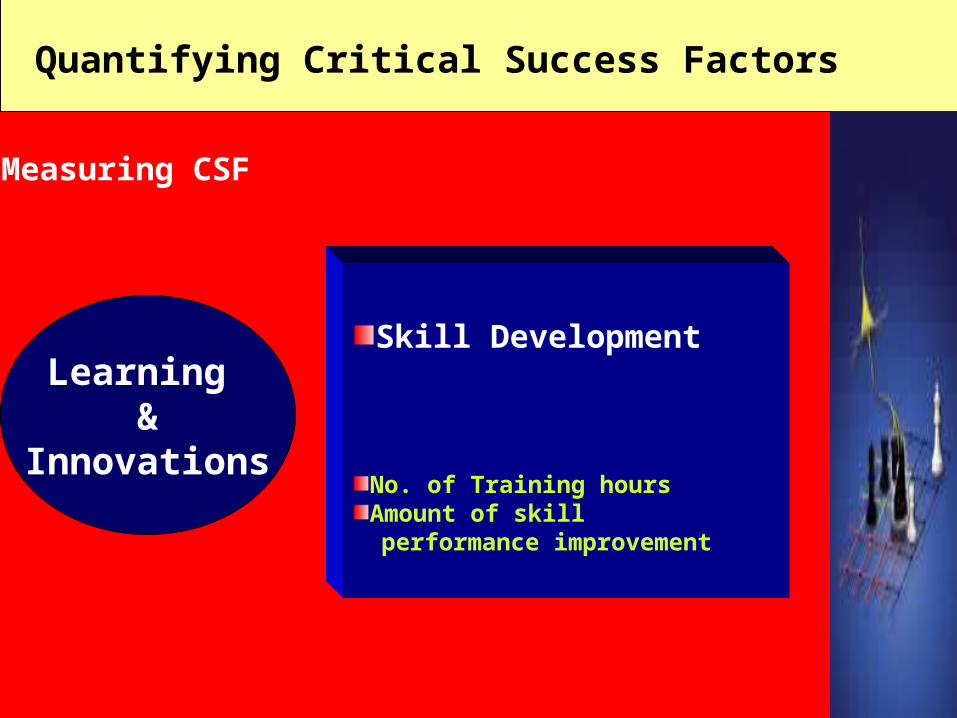
Measuring CSF
Learning &
Innovations
Skill Development
No. of Training hoursAmount of skill
performance improvement
Quantifying Critical Success Factors
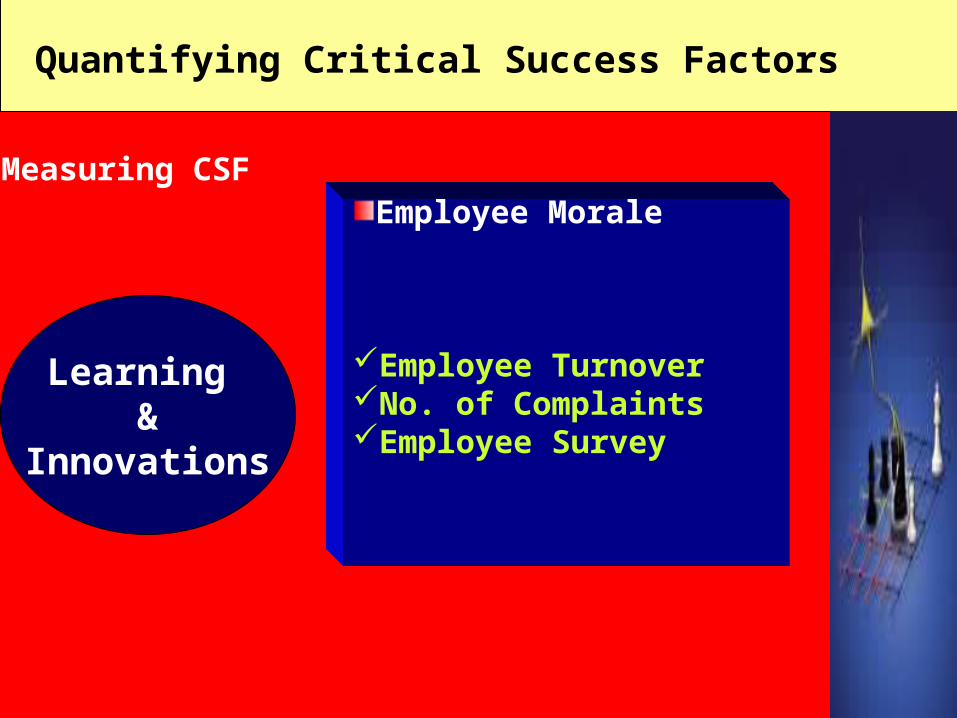
Measuring CSF
Learning &
Innovations
Employee Morale
Employee TurnoverNo. of ComplaintsEmployee Survey
Quantifying Critical Success Factors
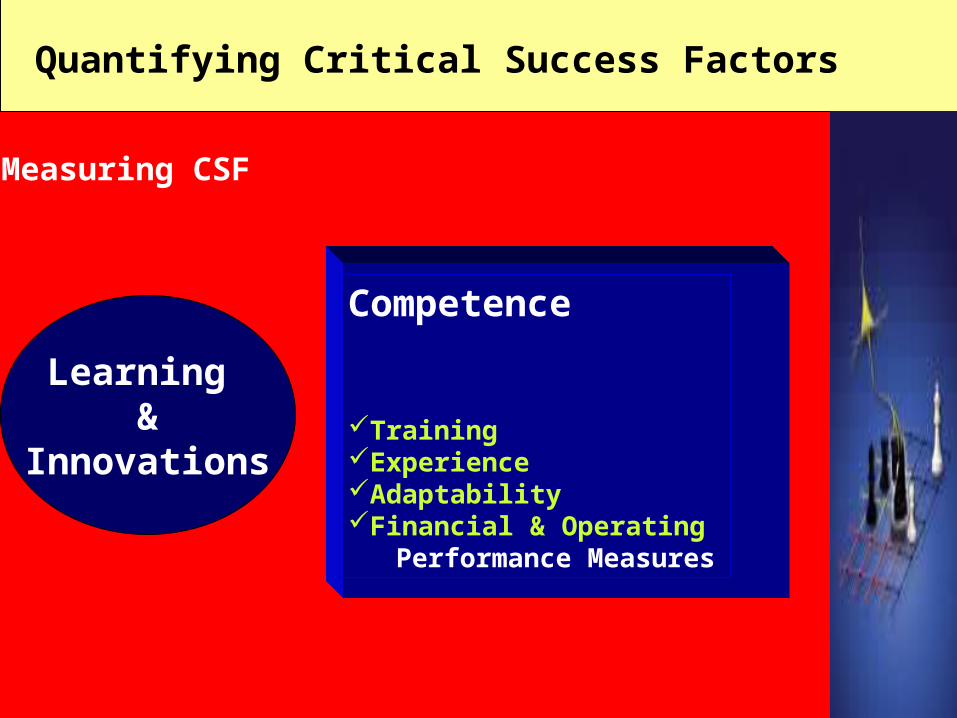
Measuring CSF
Learning &
Innovations
Competence
TrainingExperienceAdaptabilityFinancial & Operating Performance Measures
Execution of Goals
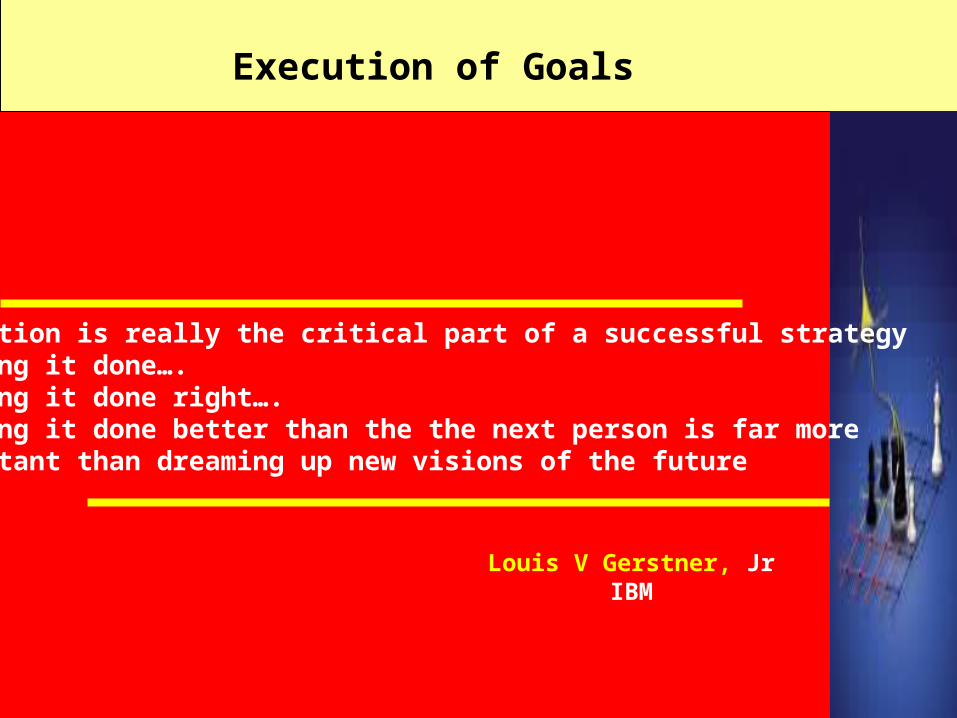
Execution is really the critical part of a successful strategyGetting it done….Getting it done right….Getting it done better than the the next person is far moreImportant than dreaming up new visions of the future
Louis V Gerstner, JrIBM
Execution of Goals
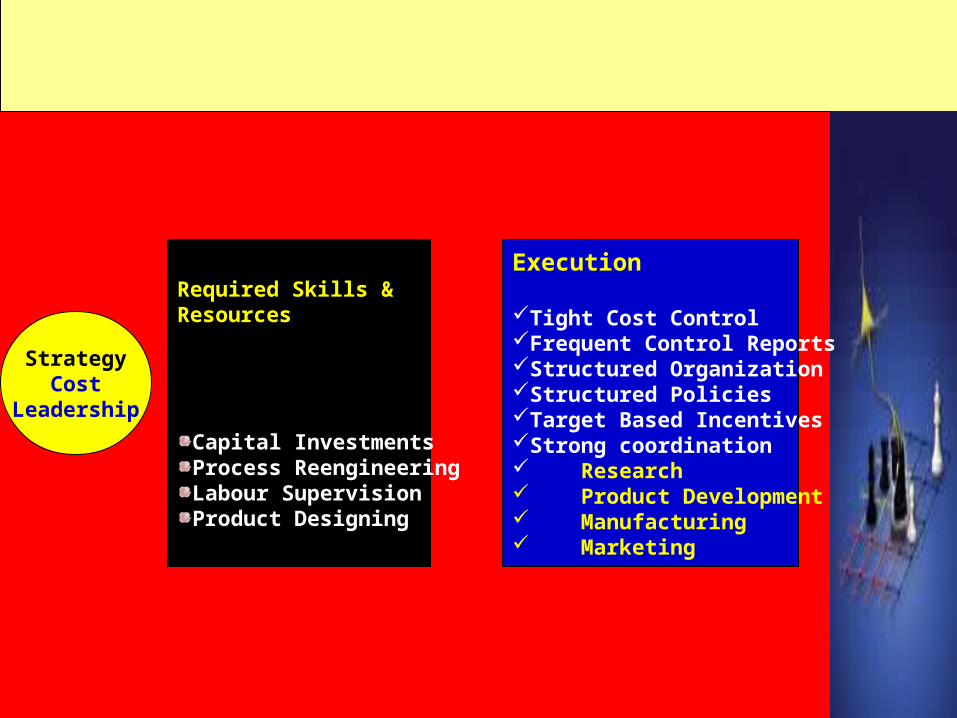
StrategyCost
Leadership
Required Skills &Resources
Capital InvestmentsProcess ReengineeringLabour SupervisionProduct Designing
Execution
Tight Cost ControlFrequent Control ReportsStructured OrganizationStructured PoliciesTarget Based IncentivesStrong coordination Research Product Development Manufacturing Marketing
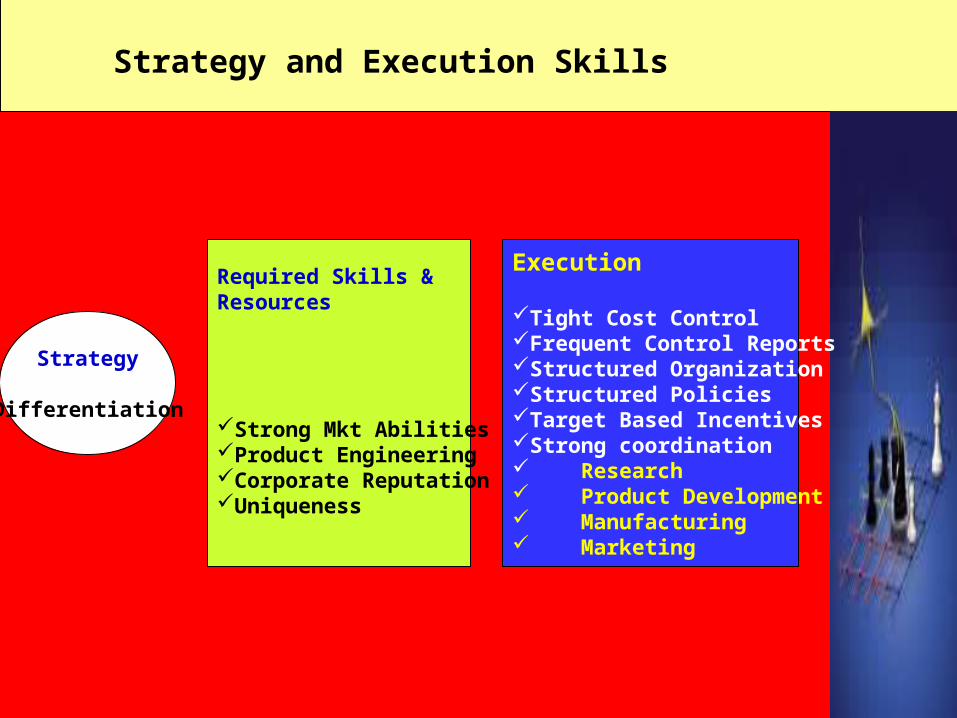
Strategy
Differentiation
Required Skills &Resources
Strong Mkt AbilitiesProduct EngineeringCorporate ReputationUniqueness
Execution
Tight Cost ControlFrequent Control ReportsStructured OrganizationStructured PoliciesTarget Based IncentivesStrong coordination Research Product Development Manufacturing Marketing
Strategy and Execution Skills
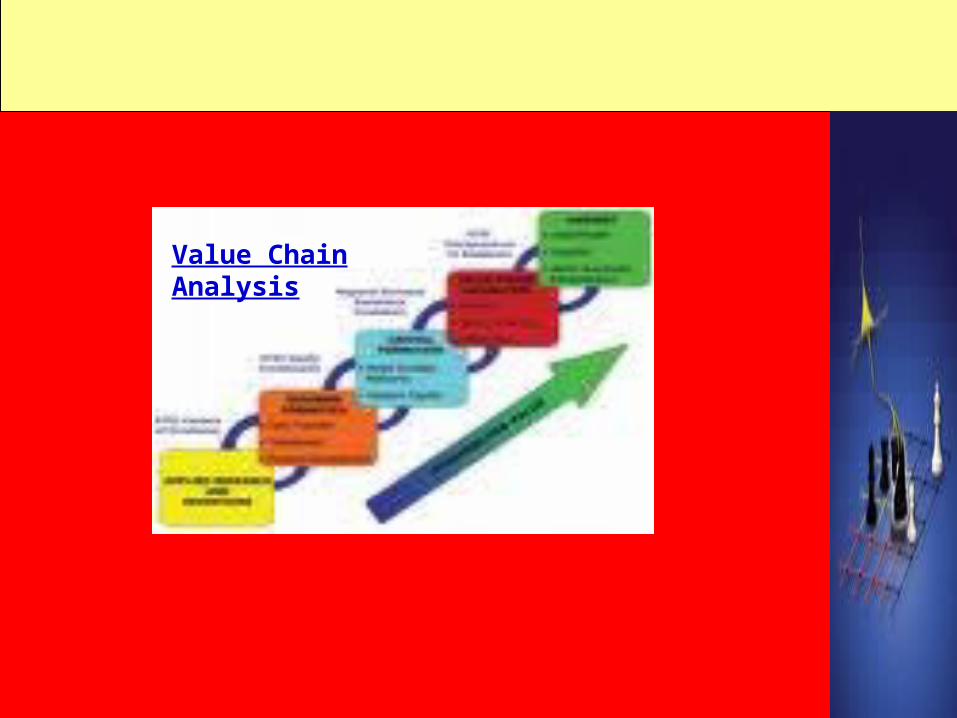
Value ChainAnalysis
Value ChainAnalysis
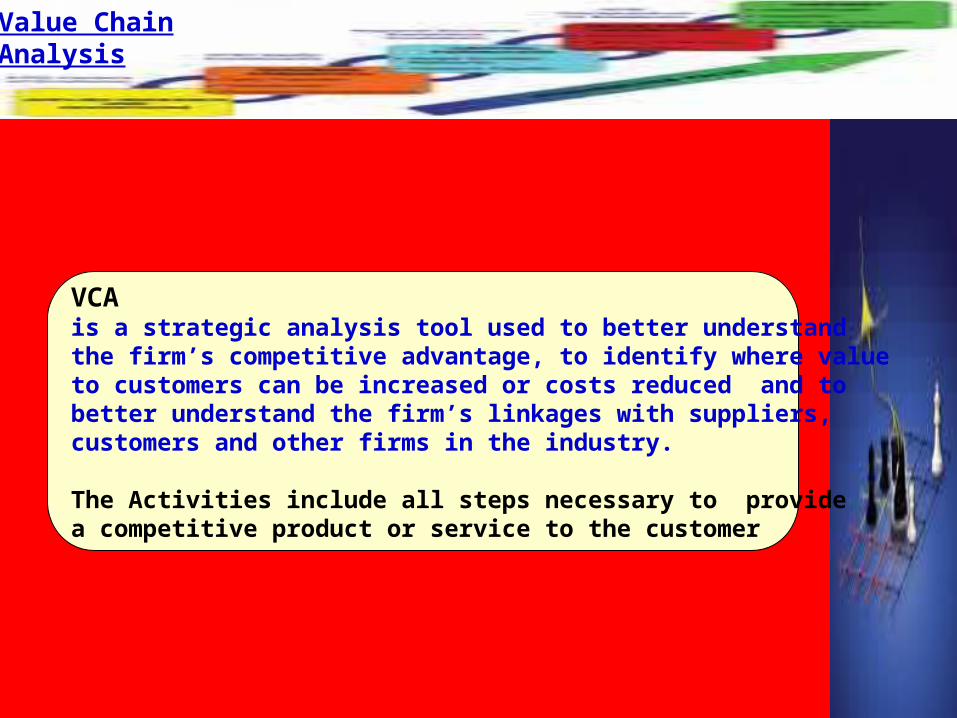
VCA is a strategic analysis tool used to better understandthe firm’s competitive advantage, to identify where valueto customers can be increased or costs reduced and to better understand the firm’s linkages with suppliers, customers and other firms in the industry.
The Activities include all steps necessary to provide a competitive product or service to the customer
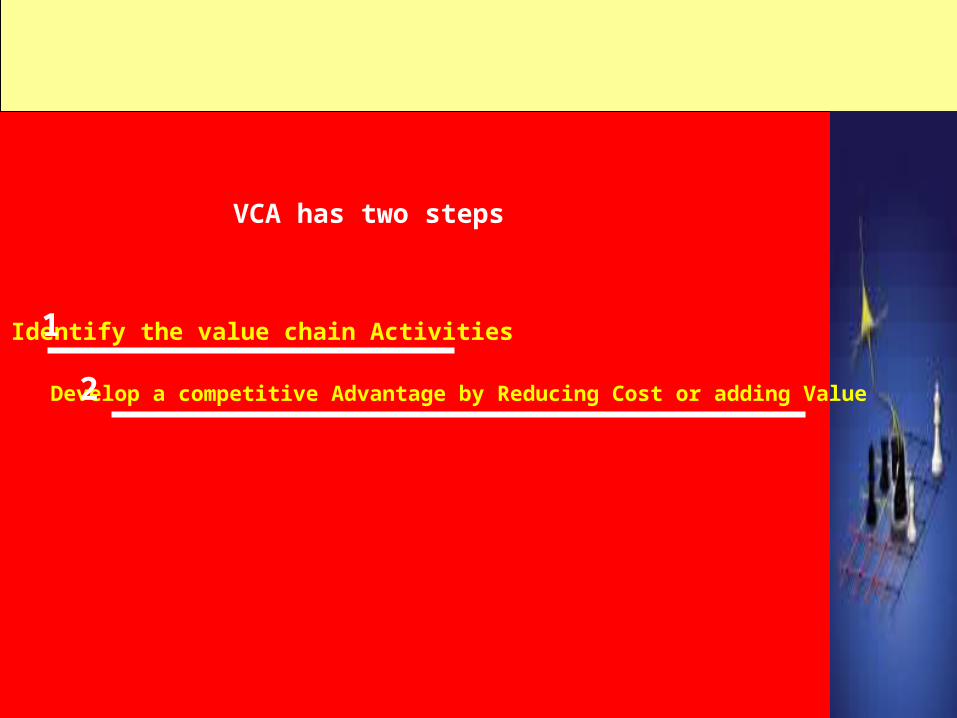
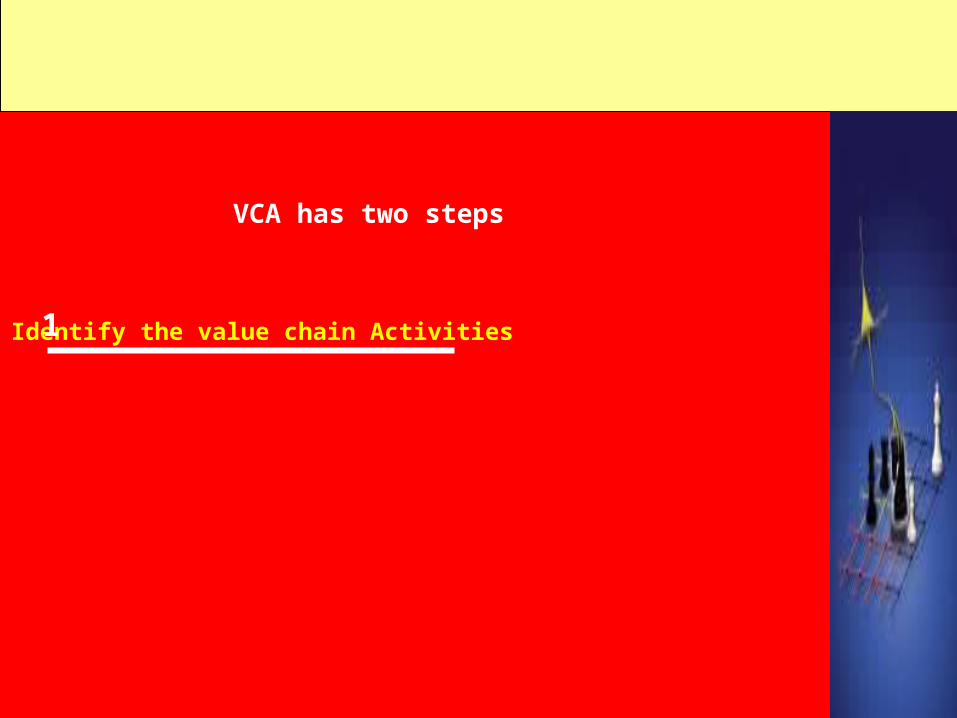
VCA has two steps
Identify the value chain Activities
Develop a competitive Advantage by Reducing Cost or adding Value
1
2
VCA has two steps
Identify the value chain Activities1
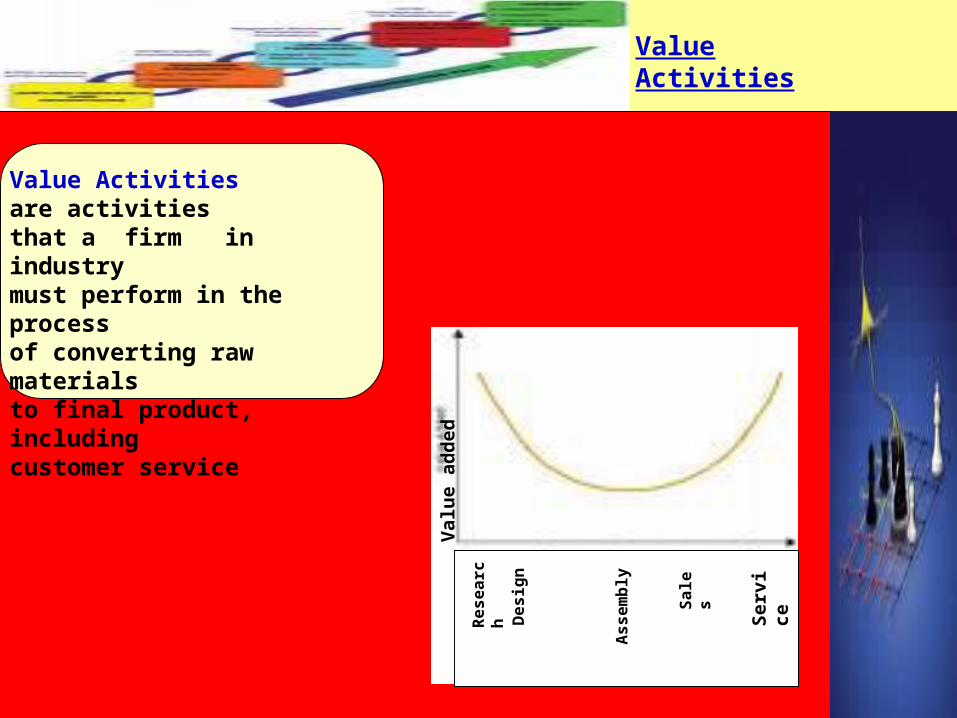
ValueActivities
Value Activities are activities that a firm in industrymust perform in the processof converting raw materialsto final product, including customer service
Val
ue
add
ed
Re
se
arc
h De
sig
n
As
se
mb
ly
Sa
les
Ser
vice
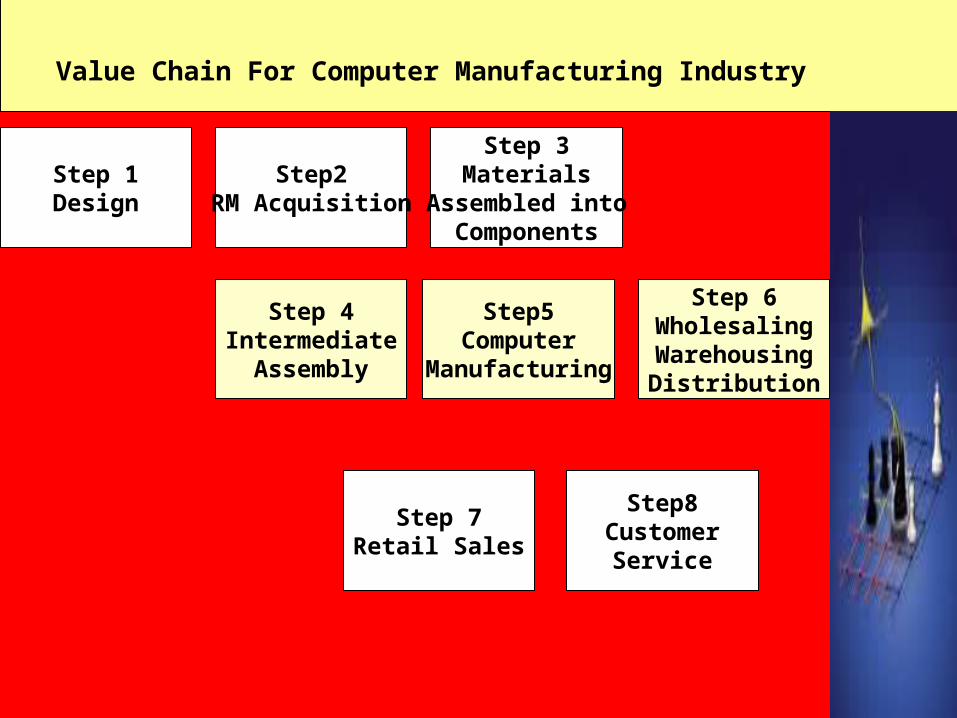
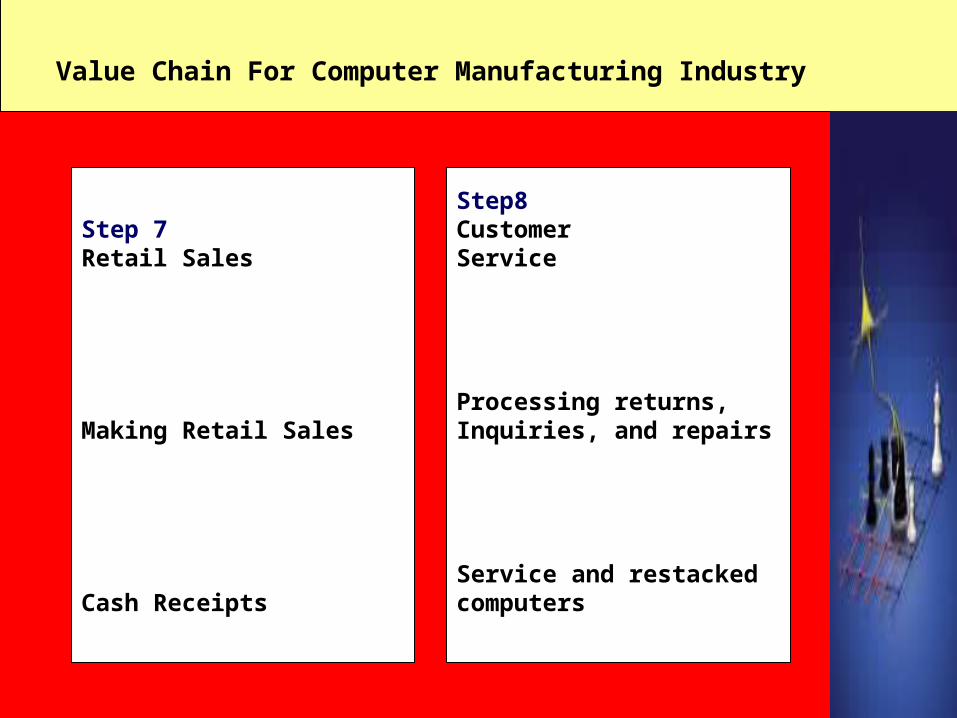
Value Chain For Computer Manufacturing Industry
Step2RM Acquisition
Step 3Materials
Assembled intoComponents
Step 1Design
Step8Customer
Service
Step 6WholesalingWarehousingDistribution
Step 7Retail Sales
Step5Computer
Manufacturing
Step 4Intermediate
Assembly

Value Chain For Computer Manufacturing Industry
Step2RM Acquisition
Mining, developmentand Refining
Silicon, Plastic,Various metals
Step 3MaterialsAssembled intoComponents
Converting RM intoComponents andParts to makeComputers
Desired componentsand parts
Step 1Design
Activities
Performing Research andDevelopment
Expected OutputOf Activities
Completed ProductDesign
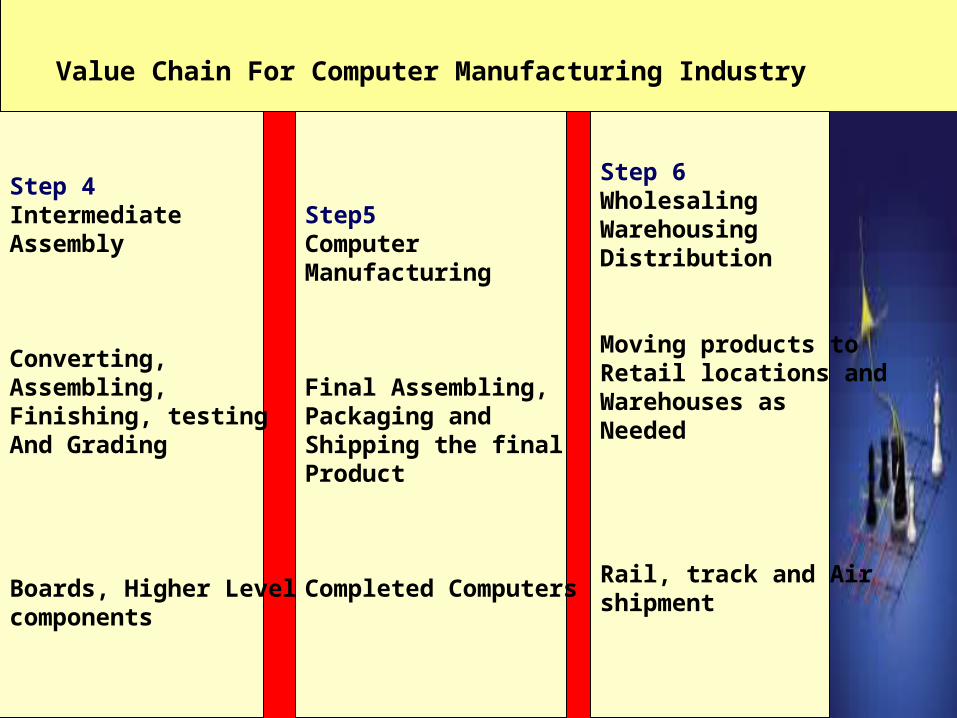
Value Chain For Computer Manufacturing Industry
Step 6WholesalingWarehousingDistribution
Moving products toRetail locations andWarehouses asNeeded
Rail, track and Airshipment
Step5ComputerManufacturing
Final Assembling,Packaging andShipping the finalProduct
Completed Computers
Step 4IntermediateAssembly
Converting,Assembling,Finishing, testingAnd Grading
Boards, Higher Levelcomponents
Value Chain For Computer Manufacturing Industry
Step8CustomerService
Processing returns,Inquiries, and repairs
Service and restackedcomputers
Step 7Retail Sales
Making Retail Sales
Cash Receipts
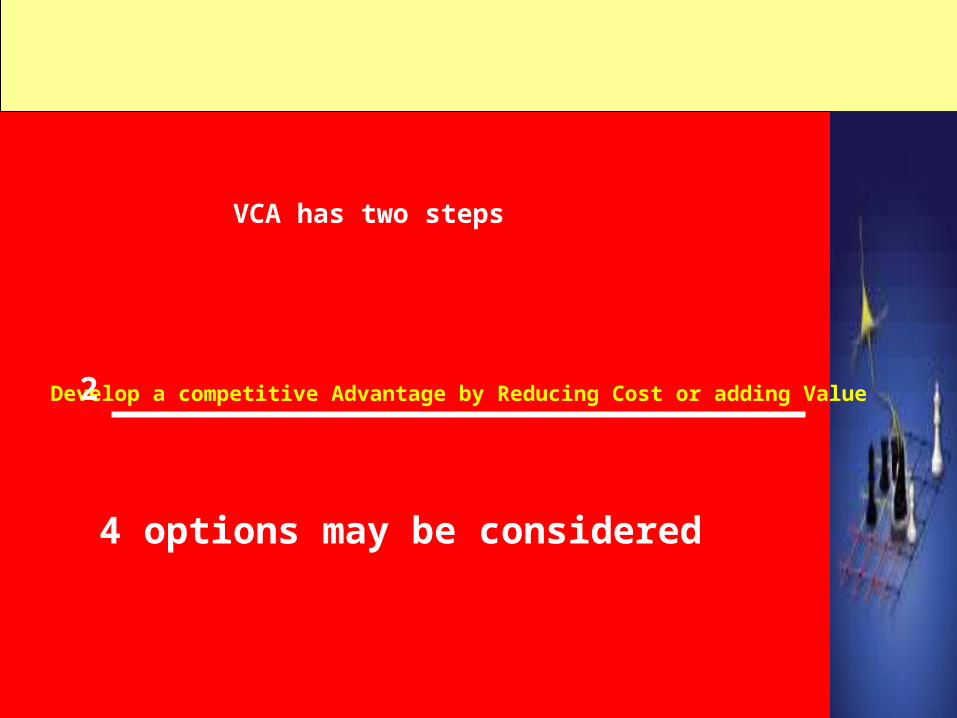
VCA has two steps
Develop a competitive Advantage by Reducing Cost or adding Value2
4 options may be considered
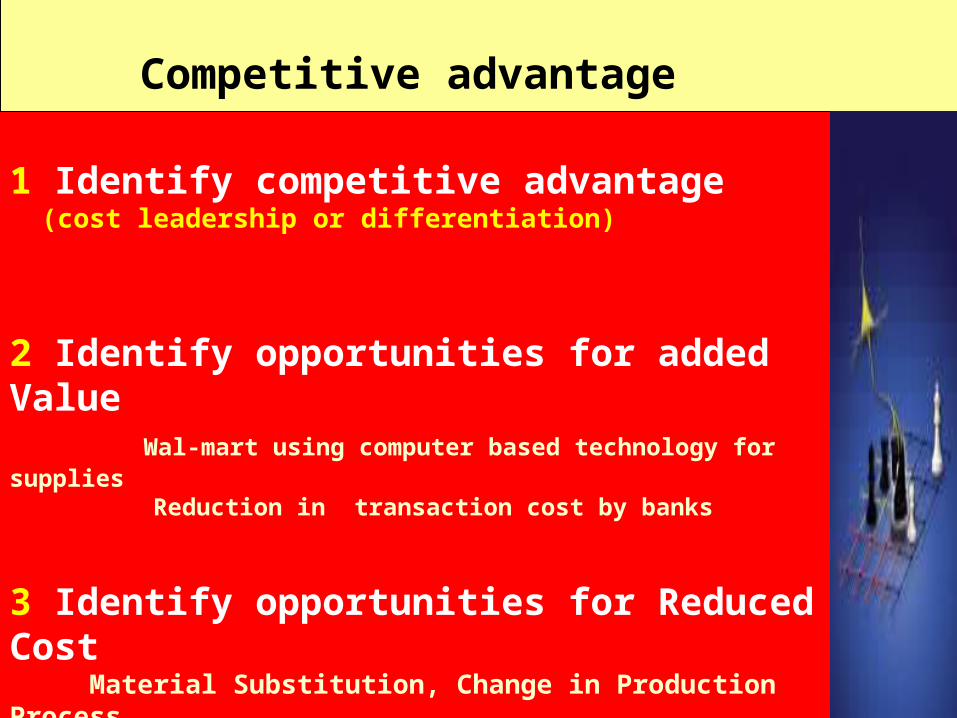
Competitive advantage
1 Identify competitive advantage (cost leadership or differentiation)
2 Identify opportunities for added Value Wal-mart using computer based technology for supplies Reduction in transaction cost by banks
3 Identify opportunities for Reduced Cost Material Substitution, Change in Production Process
4 Exploit Linkages among activities in the value-chain Changing location of Factory near to suppliers
scorecardbalanced
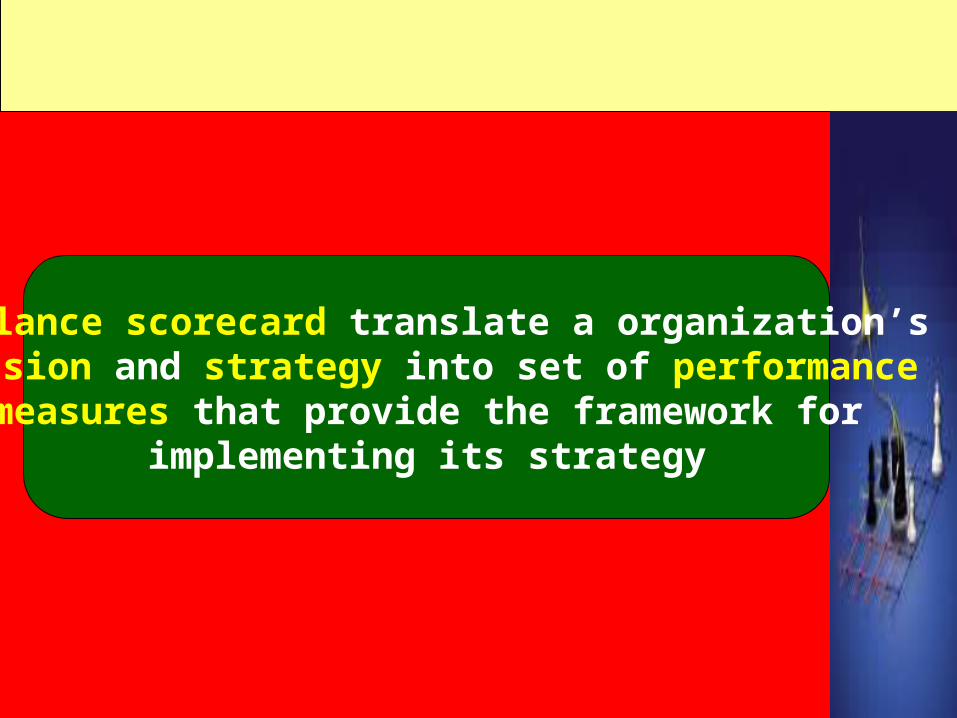
A balance scorecard translate a organization’s mission and strategy into set of performance measures that provide the framework for
implementing its strategy
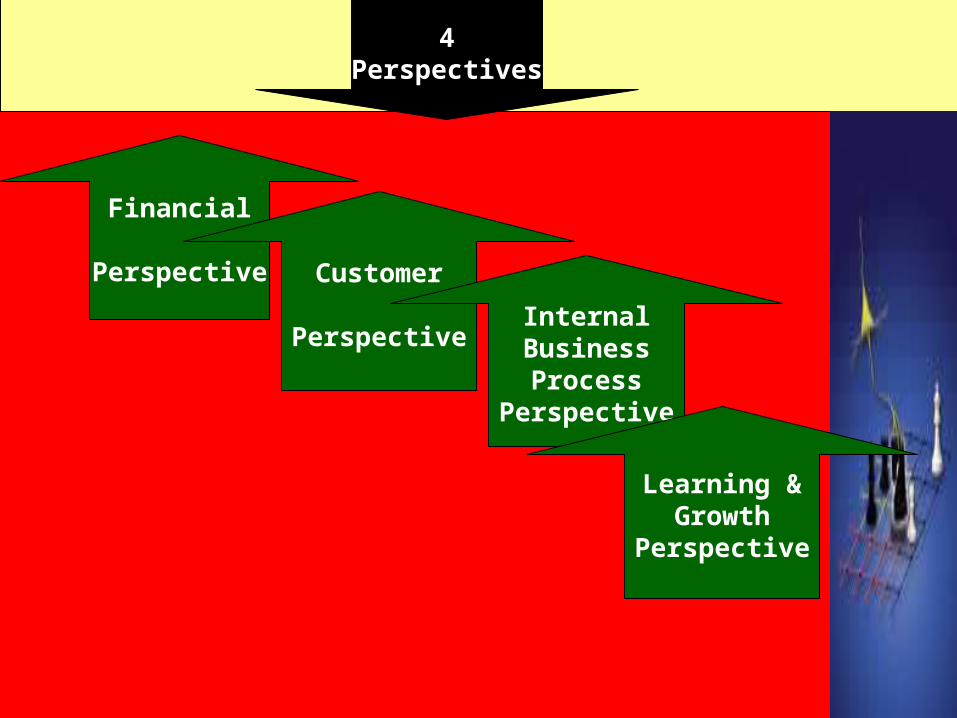
4Perspectives
Financial
Perspective Customer
PerspectiveInternal
BusinessProcess
Perspective
Learning &Growth
Perspective
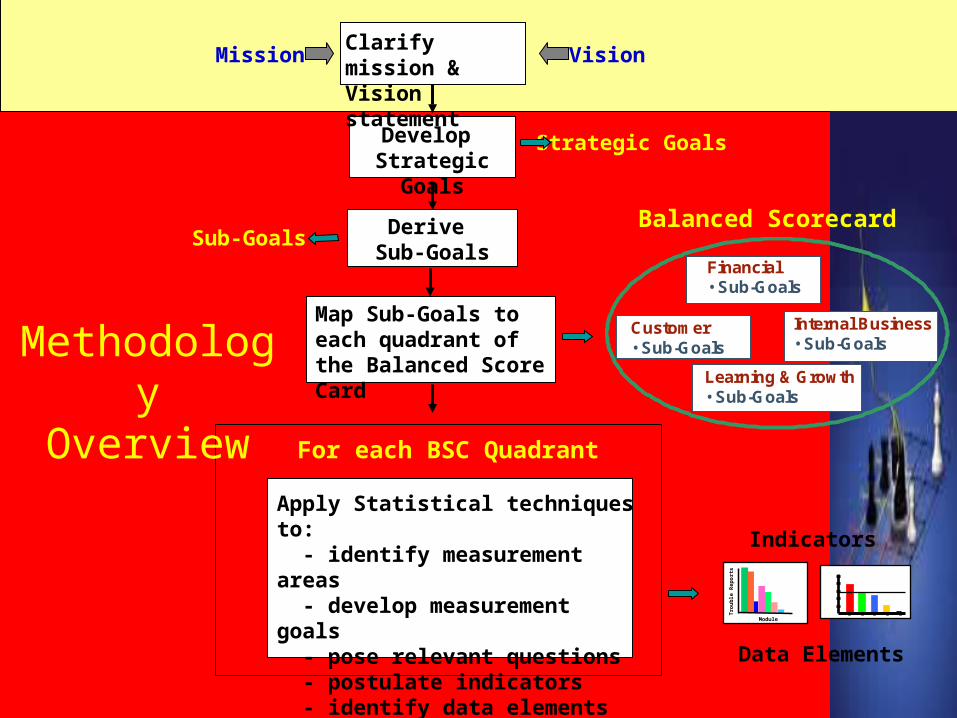
Develop Strategic Goals
Mission VisionClarify mission & Vision statement
Strategic Goals
Derive Sub-Goals
Sub-Goals
Map Sub-Goals to each quadrant of the Balanced Score Card
Apply Statistical techniques to: - identify measurement areas - develop measurement goals - pose relevant questions - postulate indicators - identify data elements
For each BSC Quadrant
Data Elements
Module
Tro
ub
le R
epo
rts
Indicators
Balanced Scorecard
Internal Business• Sub-Goals
Learning & Growth• Sub-Goals
Customer• Sub-Goals
Financial• Sub-Goals
Internal Business• Sub-Goals
Learning & Growth• Sub-Goals
Customer• Sub-Goals
Financial• Sub-Goals
MethodologyOverview
Ob
ject
ive
Me
asu
res
Ta
rge
tsIn
itia
tive
sCUSTOMER
How do our customers see us?
Ob
ject
ive
Me
asu
res
Ta
rge
tsIn
itia
tive
sLEARNING andGROWTH
Can we continue to improve and create value?
Ob
ject
ive
Me
asu
res
Ta
rge
tsIn
itia
tive
sFINANCIAL
How do we look to shareholders?
Ob
ject
ive
Me
asu
res
Ta
rge
tsIn
itia
tive
s
INTERNAL BUSINESSPROCESS
What must we excel at?
Visionand
Strategy
Ob
ject
ive
Me
asu
res
Ta
rge
tsIn
itia
tive
sCUSTOMER
How do our customers see us?
Ob
ject
ive
Me
asu
res
Ta
rge
tsIn
itia
tive
sLEARNING andGROWTH
Can we continue to improve and create value?
Ob
ject
ive
Me
asu
res
Ta
rge
tsIn
itia
tive
sFINANCIAL
How do we look to shareholders?
Ob
ject
ive
Me
asu
res
Ta
rge
tsIn
itia
tive
s
INTERNAL BUSINESSPROCESS
What must we excel at?
Visionand
Strategy
Visionand
Strategy
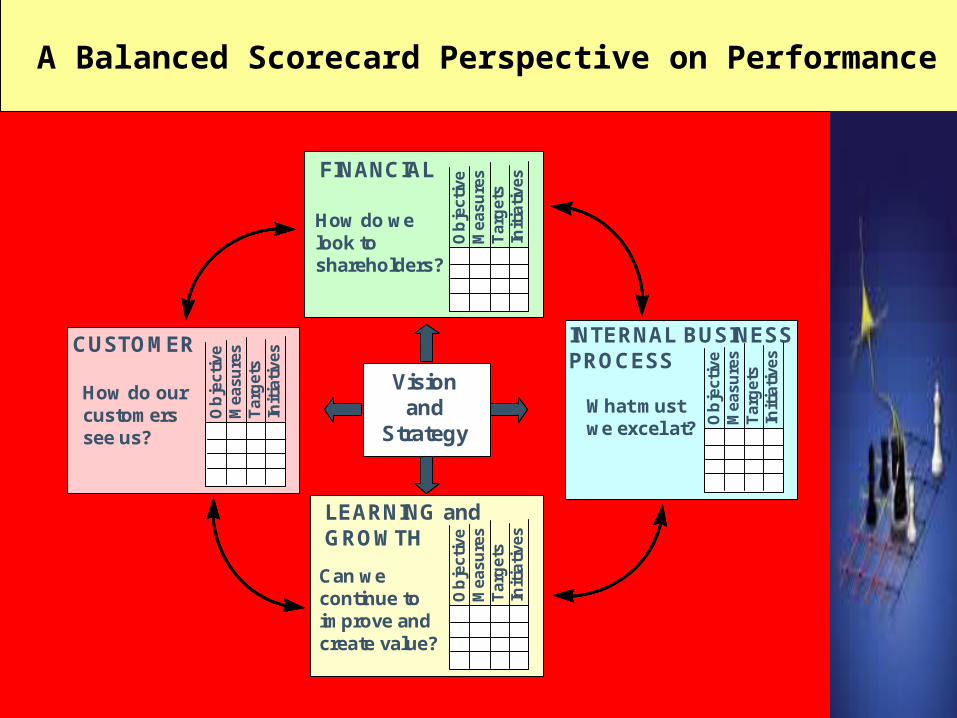
A Balanced Scorecard Perspective on Performance
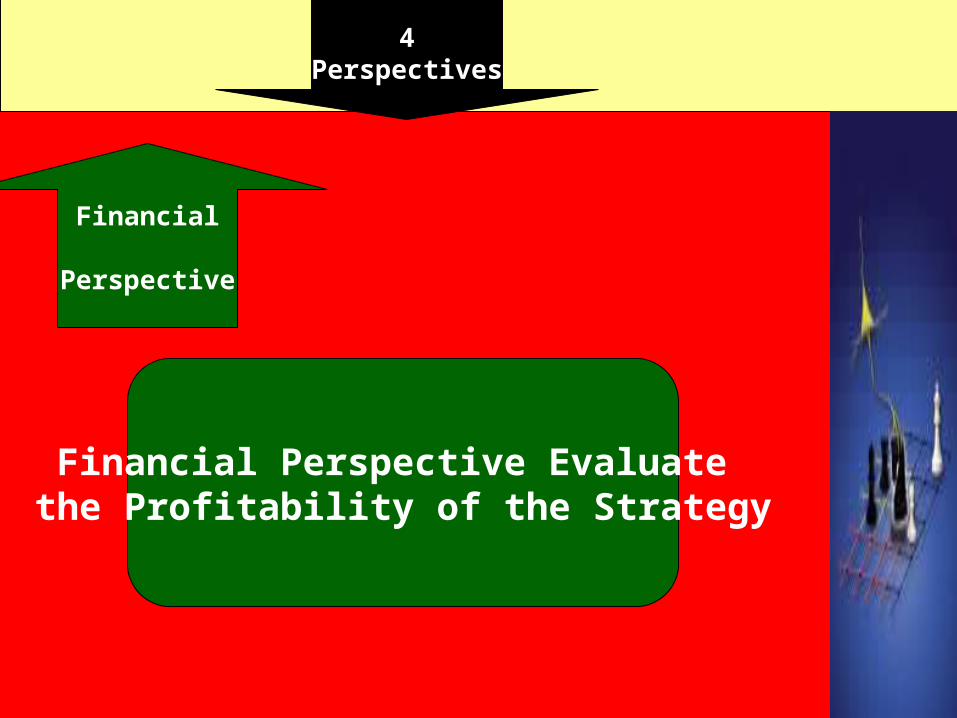
4Perspectives
Financial
Perspective
Financial Perspective Evaluate the Profitability of the Strategy
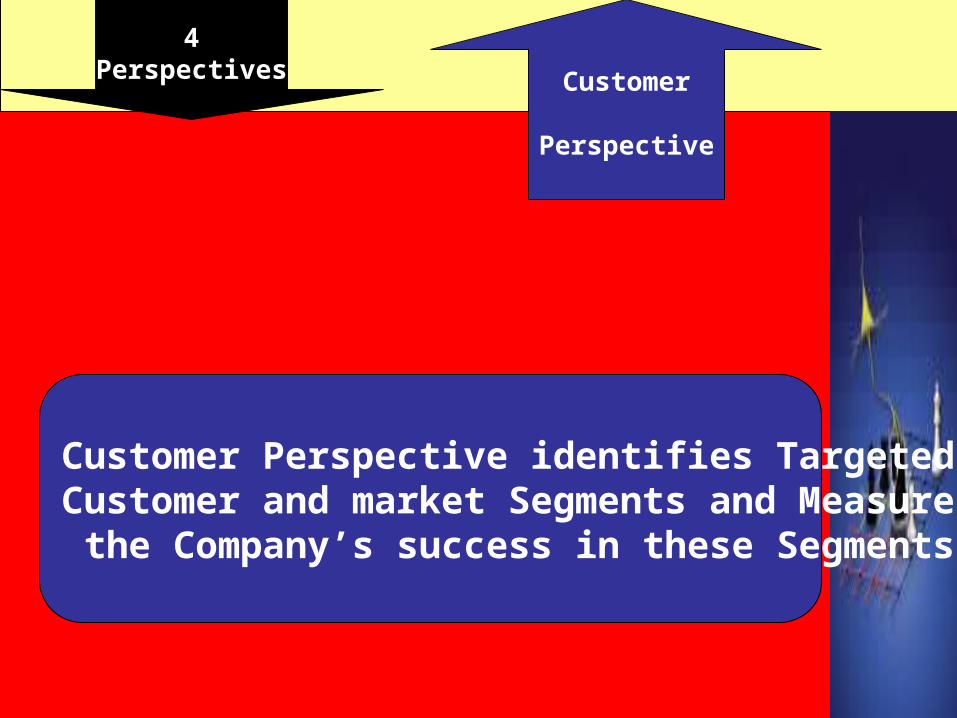
4Perspectives Customer
Perspective
Customer Perspective identifies Targeted Customer and market Segments and Measures the Company’s success in these Segments
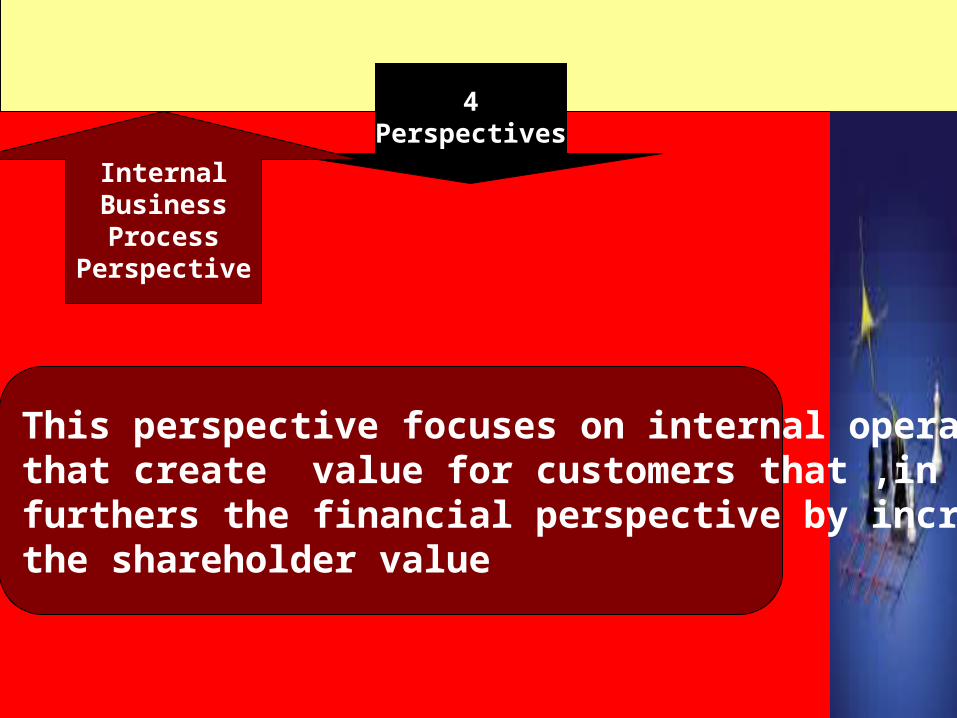
4Perspectives
InternalBusinessProcess
Perspective
This perspective focuses on internal operationsthat create value for customers that ,in turn,furthers the financial perspective by increasingthe shareholder value
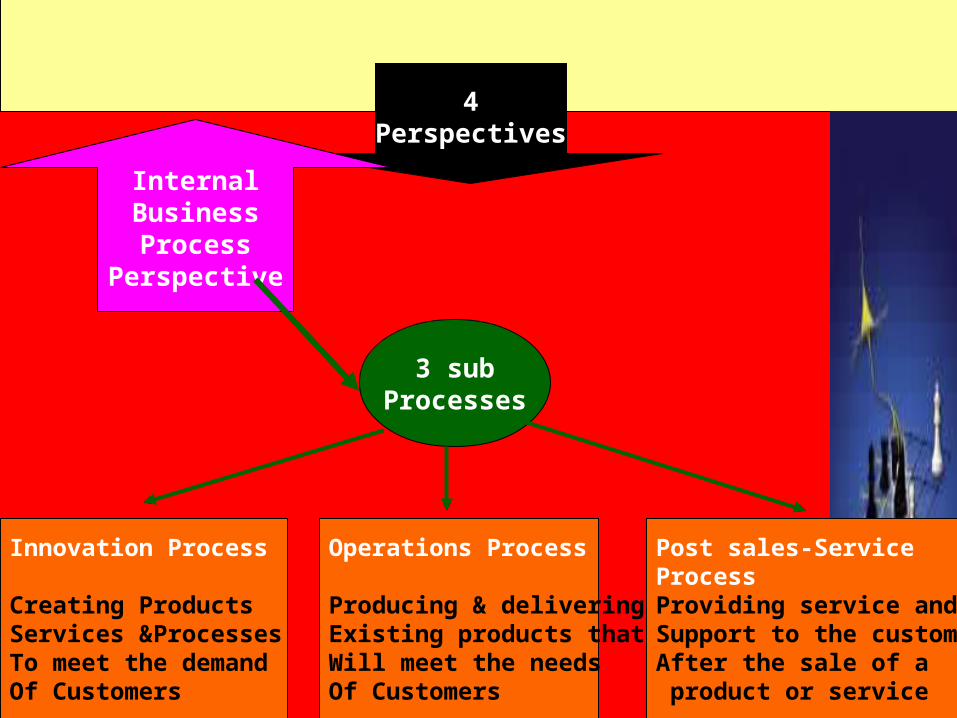
4Perspectives
InternalBusinessProcess
Perspective
3 subProcesses
Innovation Process
Creating ProductsServices &ProcessesTo meet the demandOf Customers
Operations Process
Producing & deliveringExisting products thatWill meet the needs Of Customers
Post sales-ServiceProcessProviding service andSupport to the customerAfter the sale of a product or service
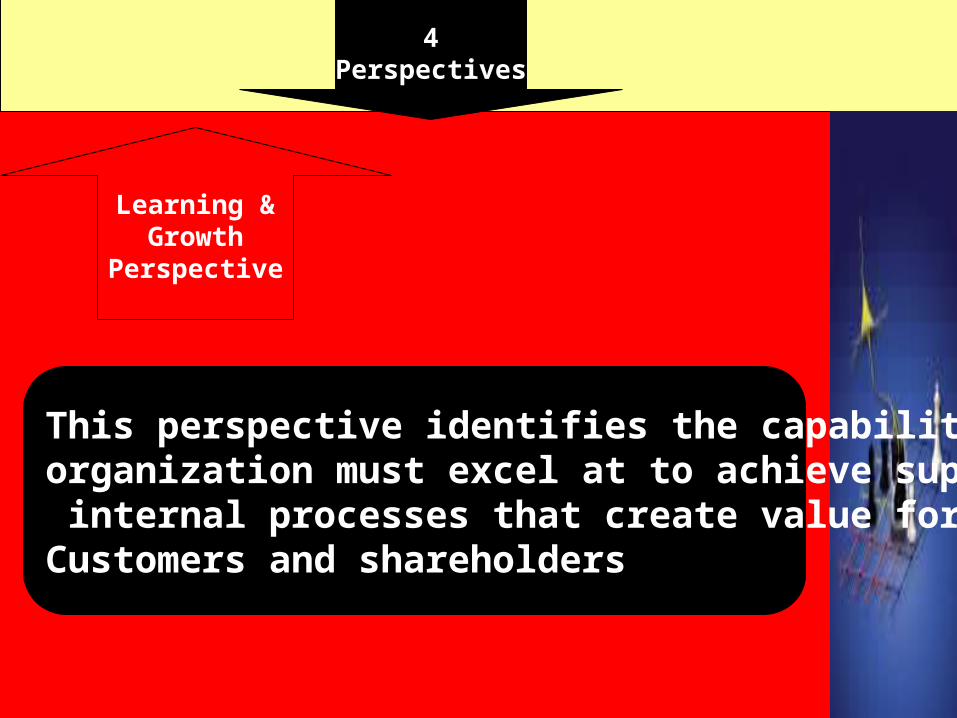
4Perspectives
Learning &Growth
Perspective
This perspective identifies the capabilities theorganization must excel at to achieve superior internal processes that create value for Customers and shareholders
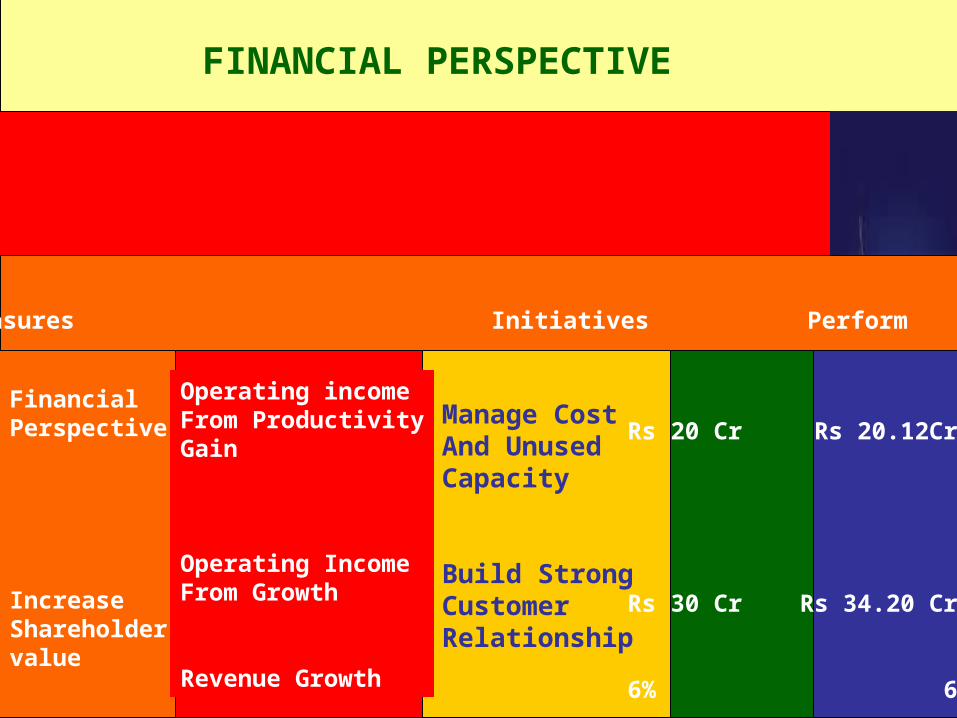
Target ActualObjective Measures Initiatives Perform Perform
FinancialPerspective
IncreaseShareholdervalue
Operating incomeFrom ProductivityGain
Operating IncomeFrom Growth
Revenue Growth
Manage CostAnd UnusedCapacity
Build StrongCustomerRelationship
Rs 20 Cr Rs 20.12Cr
Rs 30 Cr Rs 34.20 Cr
6% 6.48%
FINANCIAL PERSPECTIVE
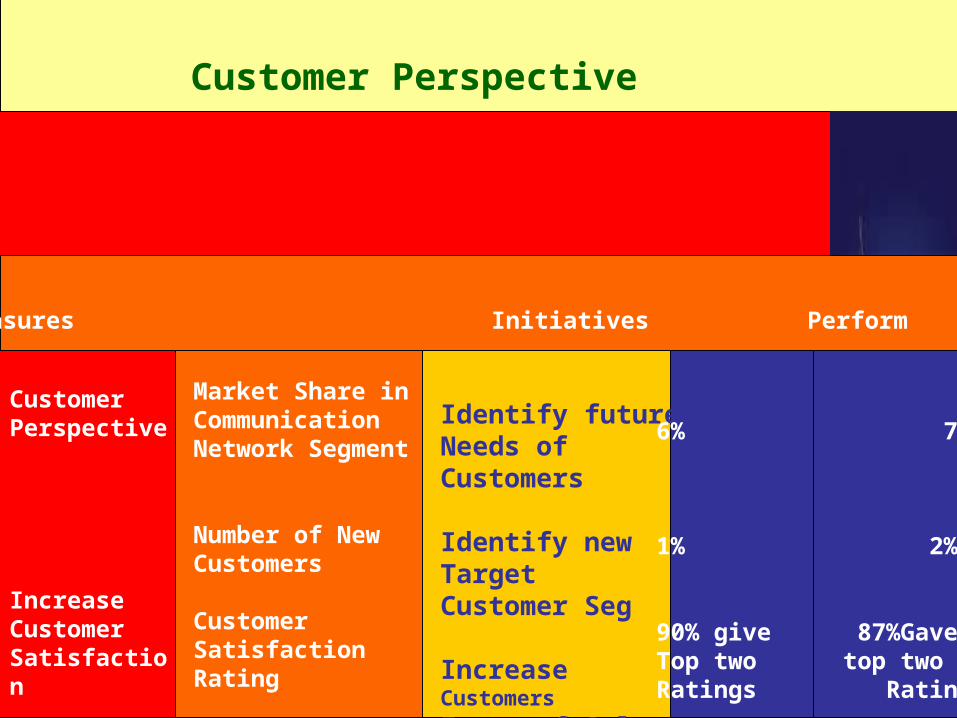
Target ActualObjective Measures Initiatives Perform Perform
CustomerPerspective
IncreaseCustomerSatisfaction
Market Share inCommunicationNetwork Segment
Number of NewCustomers
CustomerSatisfactionRating
Identify futureNeeds ofCustomers
Identify newTargetCustomer Seg
Increase Customers
Focus of Sales
6% 7%
1% 2%
90% give 87%Gave Top two top twoRatings Rating
Customer Perspective
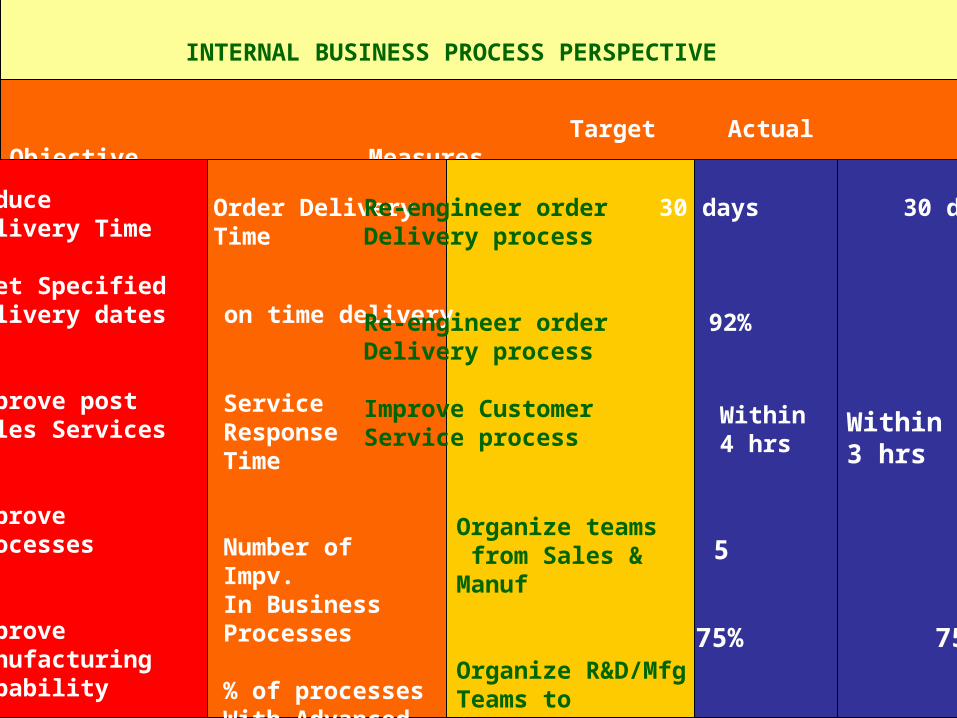
Target ActualObjective Measures Initiatives Perform Perform
ReduceDelivery Time
Meet SpecifiedDelivery dates on time delivery
Improve postSales Services
ImproveProcesses
ImproveManufacturingCapability
Order DeliveryTime
Re-engineer orderDelivery process
Re-engineer order 92% 90%Delivery process
Improve CustomerService process
30 days 30 days
Service ResponseTime
Number of Impv.In BusinessProcesses
% of processesWith AdvancedControls
Within4 hrs
Within3 hrs
Organize teams from Sales & Manuf
Organize R&D/MfgTeams to implementAdv. control
5 5
75% 75%
INTERNAL BUSINESS PROCESS PERSPECTIVE
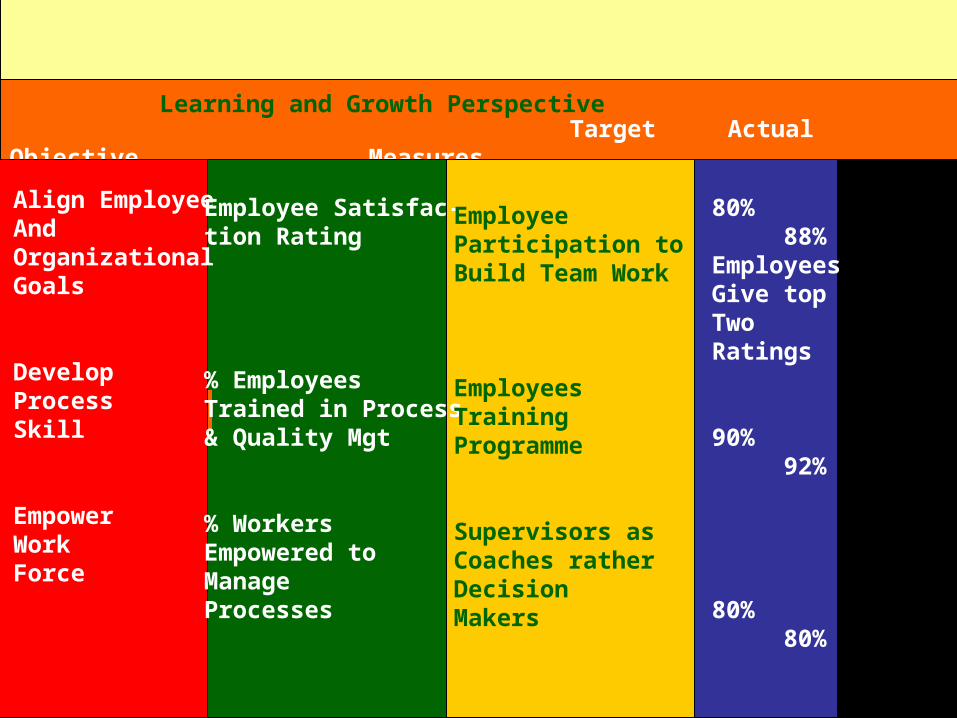
Target ActualObjective Measures Initiatives Perform Perform
Align EmployeeAndOrganizationalGoals
DevelopProcessSkill
EmpowerWorkForce
Learning and Growth Perspective
Employee Satisfac-tion Rating
% Employees Trained in Process& Quality Mgt
% WorkersEmpowered to ManageProcesses
EmployeeParticipation toBuild Team Work
EmployeesTrainingProgramme
Supervisors asCoaches ratherDecisionMakers
80% 88%EmployeesGive topTwoRatings
90% 92%
80% 80%
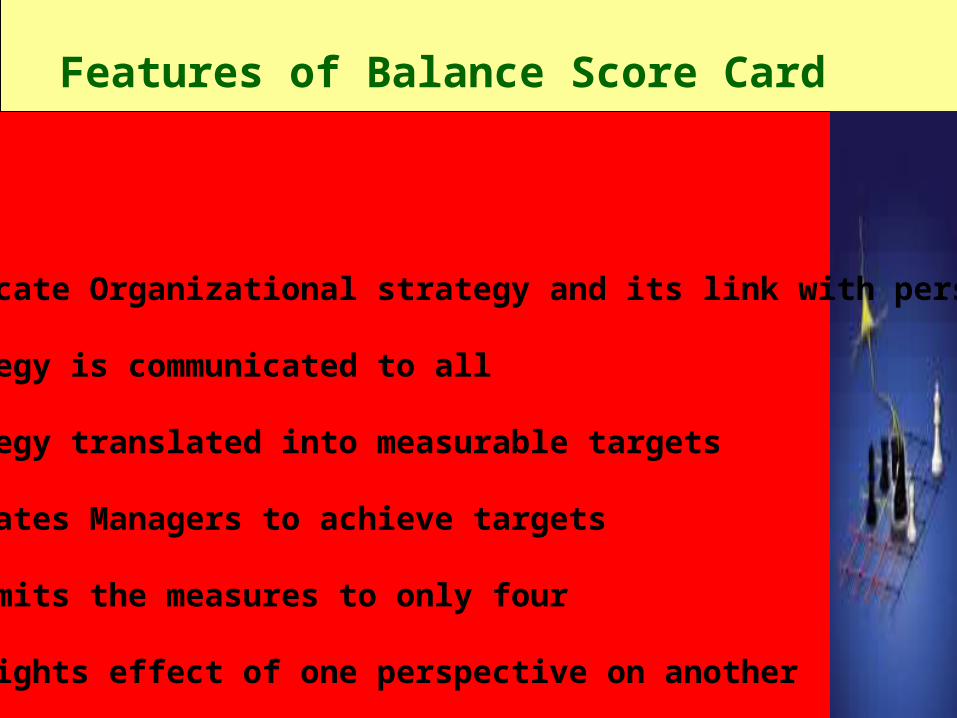
Features of Balance Score Card
Indicate Organizational strategy and its link with perspectives
Strategy is communicated to all
Strategy translated into measurable targets
Motivates Managers to achieve targets
BS limits the measures to only four
Highlights effect of one perspective on another
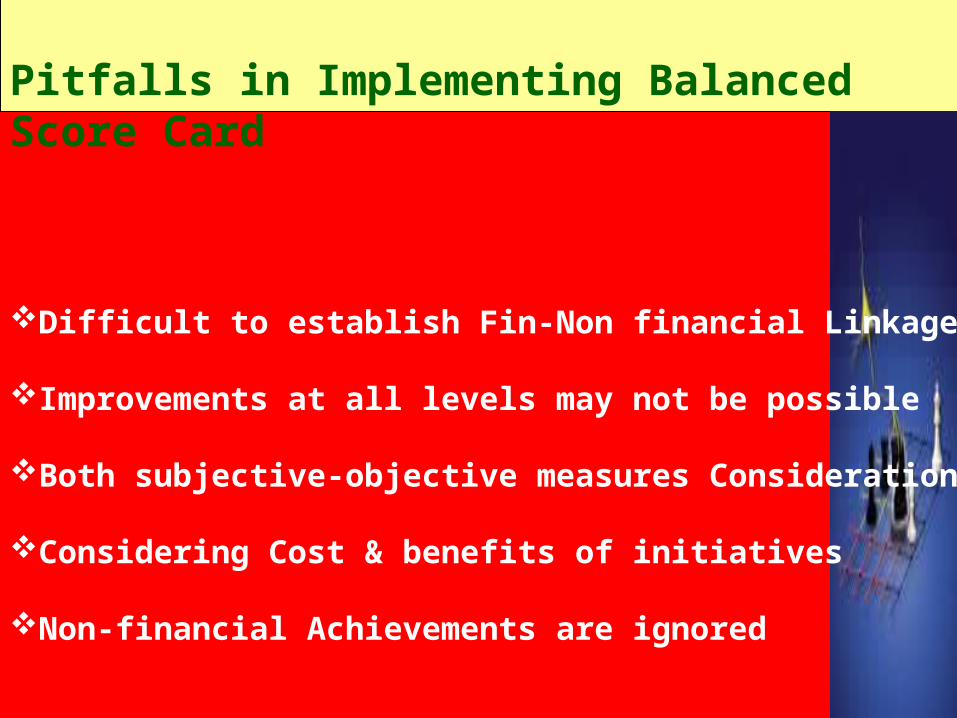
Pitfalls in Implementing Balanced Score Card
Difficult to establish Fin-Non financial Linkages
Improvements at all levels may not be possible
Both subjective-objective measures Consideration
Considering Cost & benefits of initiatives
Non-financial Achievements are ignored
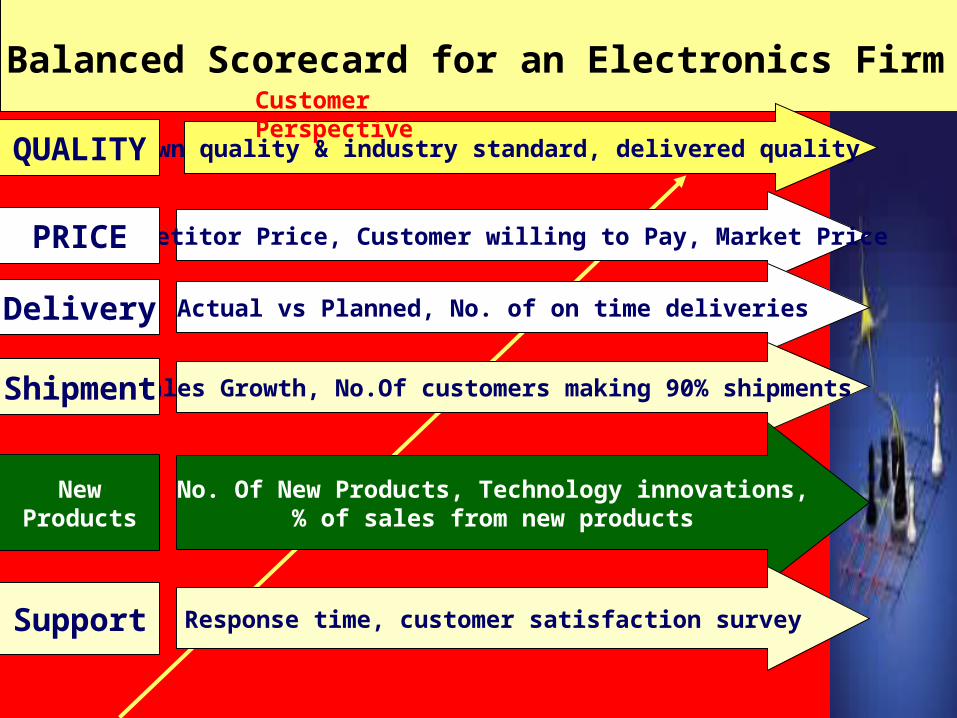
Balanced Scorecard for an Electronics Firm
Own quality & industry standard, delivered qualityQUALITY
Competitor Price, Customer willing to Pay, Market PricePRICE
Actual vs Planned, No. of on time deliveriesDelivery
Sales Growth, No.Of customers making 90% shipmentsShipment
No. Of New Products, Technology innovations,% of sales from new products
NewProducts
Shipment
Response time, customer satisfaction surveySupport
Customer Perspective
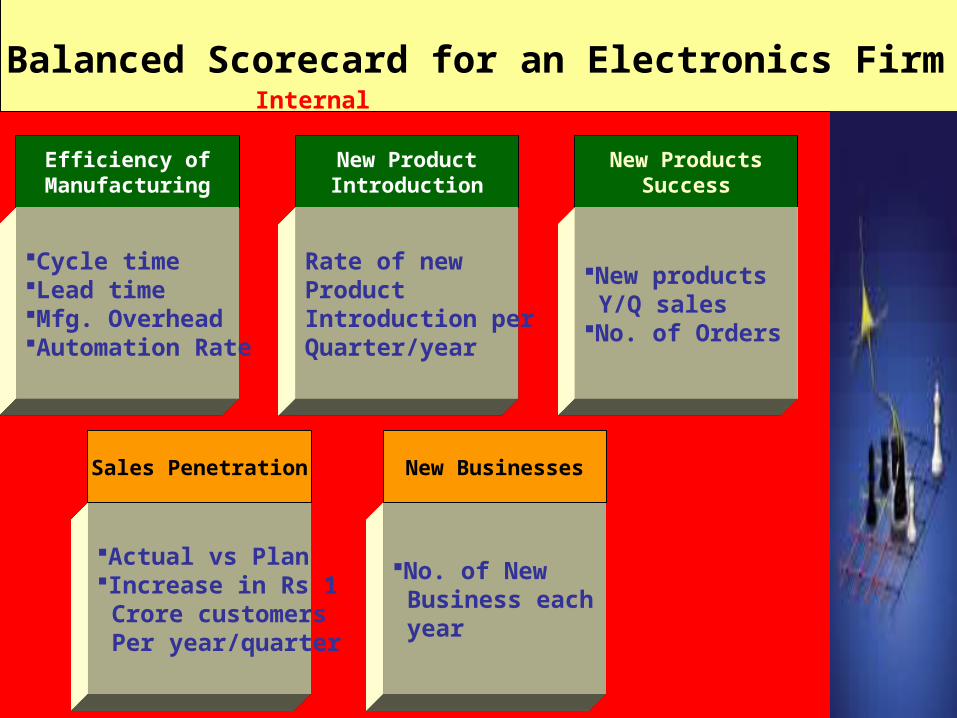
Balanced Scorecard for an Electronics FirmInternal Capabilities
Efficiency ofManufacturing
Cycle timeLead timeMfg. OverheadAutomation Rate
New ProductIntroduction
Rate of new ProductIntroduction perQuarter/year
New ProductsSuccess
New products Y/Q salesNo. of Orders
Sales Penetration
Actual vs PlanIncrease in Rs 1 Crore customers Per year/quarter
New Businesses
No. of New Business each year
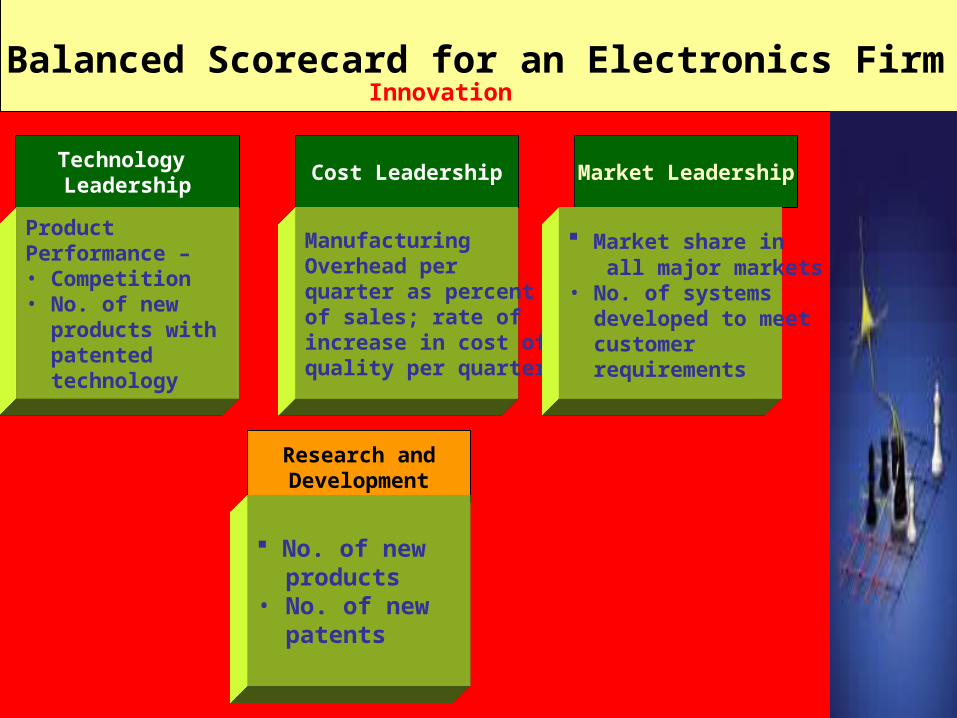
Balanced Scorecard for an Electronics FirmInnovation
Technology Leadership
Product Performance –• Competition• No. of new products with patented technology
Cost Leadership
Manufacturing Overhead per quarter as percent of sales; rate of increase in cost of quality per quarter
Market Leadership
Market share in all major markets• No. of systems developed to meet customer requirements
Research andDevelopment
No. of new products• No. of new patents
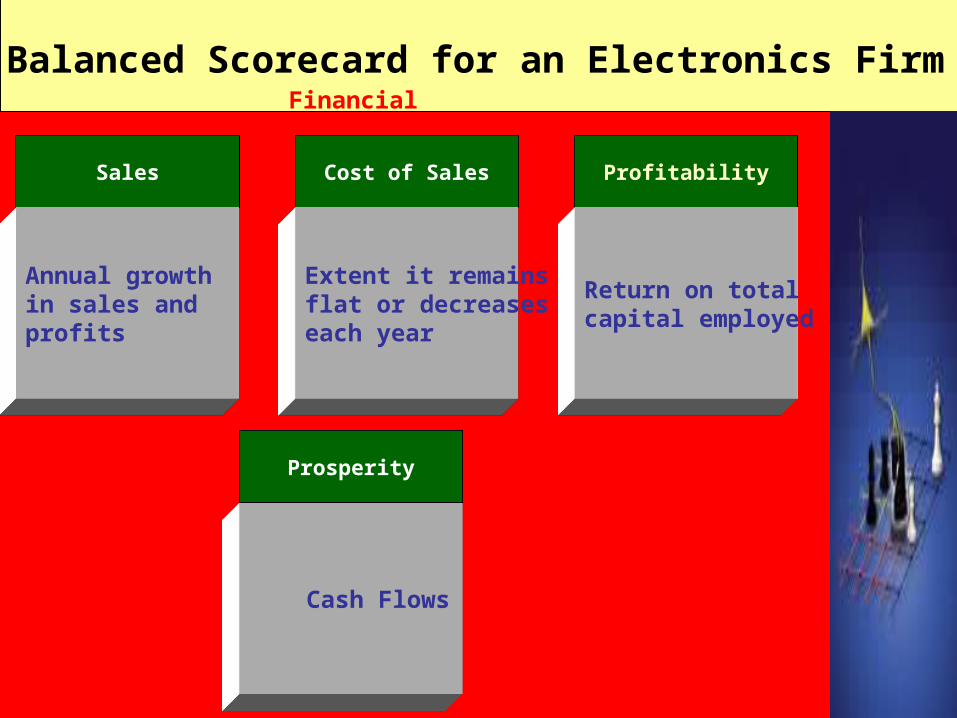
Balanced Scorecard for an Electronics FirmFinancial Perspective
Sales
Annual growth in sales and profits
Cost of Sales
Extent it remainsflat or decreases each year
Profitability
Return on totalcapital employed
Prosperity
Cash Flows
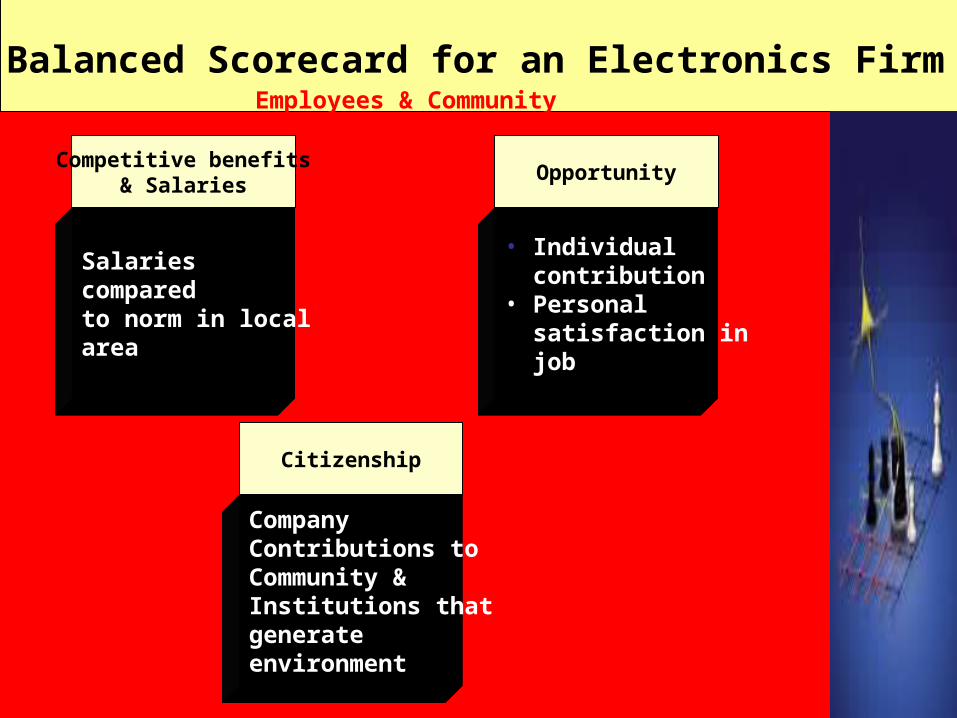
Balanced Scorecard for an Electronics FirmEmployees & Community Perspective
Competitive benefits& Salaries
Salaries comparedto norm in local area
Opportunity
• Individual contribution• Personal satisfaction in job
Citizenship
Company Contributions to Community & Institutions thatgenerate environment
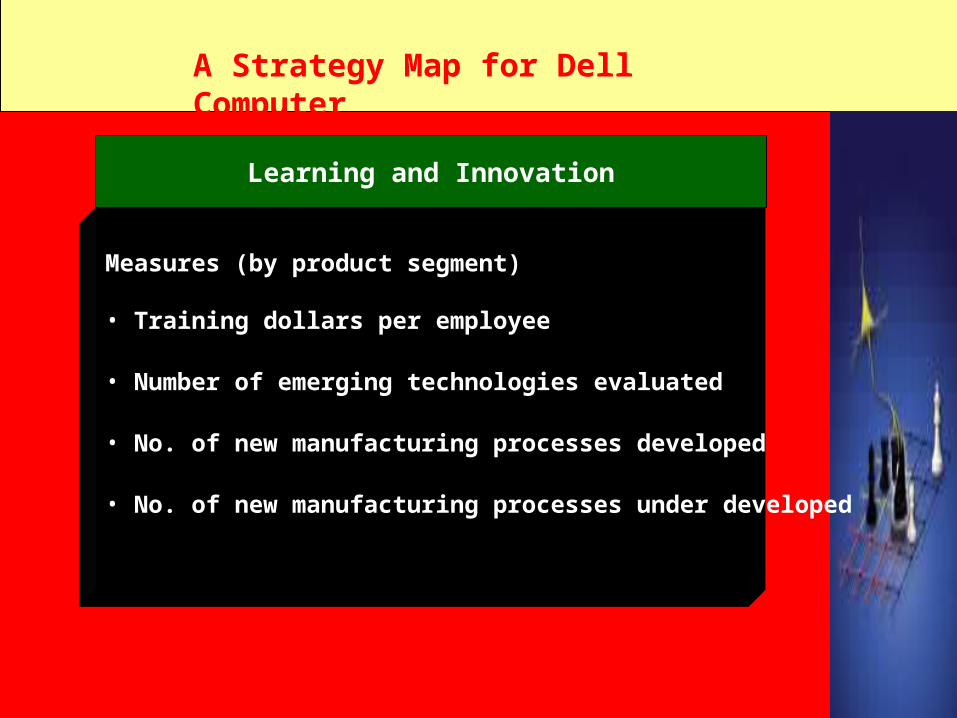
A Strategy Map for Dell Computer
Learning and Innovation
Measures (by product segment)
• Training dollars per employee
• Number of emerging technologies evaluated
• No. of new manufacturing processes developed
• No. of new manufacturing processes under developed
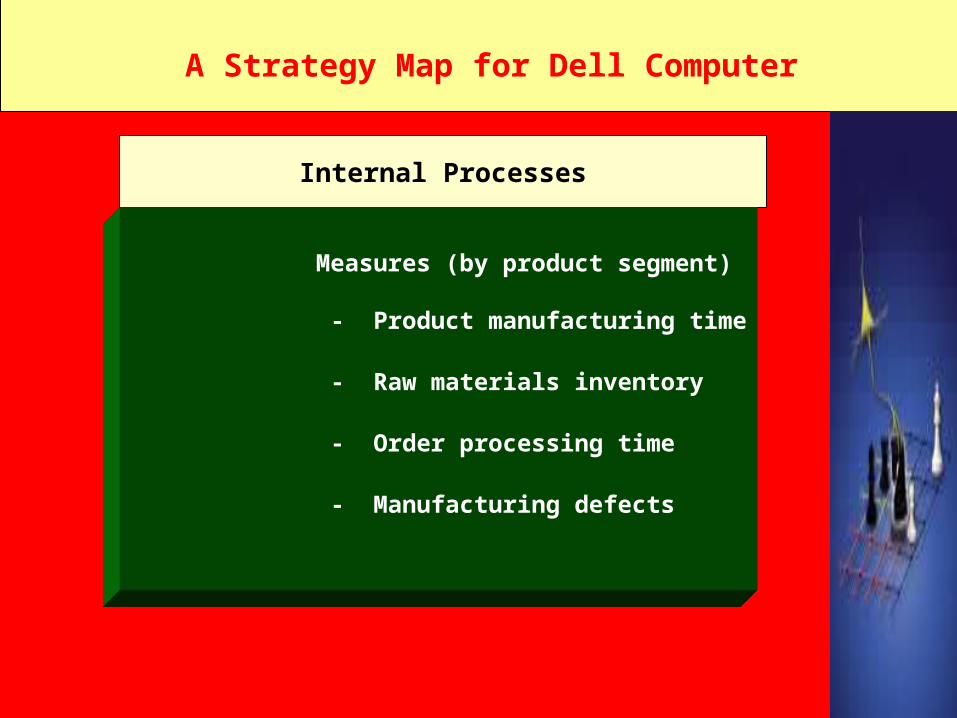
A Strategy Map for Dell Computer
Internal Processes
Measures (by product segment)
- Product manufacturing time
- Raw materials inventory
- Order processing time
- Manufacturing defects
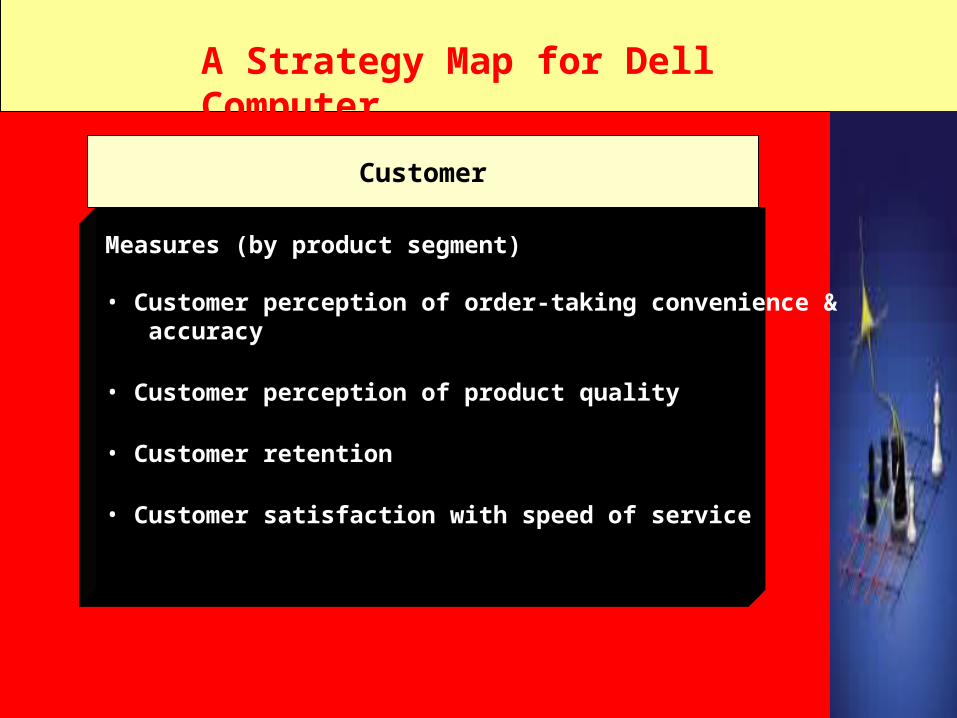
A Strategy Map for Dell Computer
Customer
Measures (by product segment)
• Customer perception of order-taking convenience & accuracy
• Customer perception of product quality
• Customer retention
• Customer satisfaction with speed of service
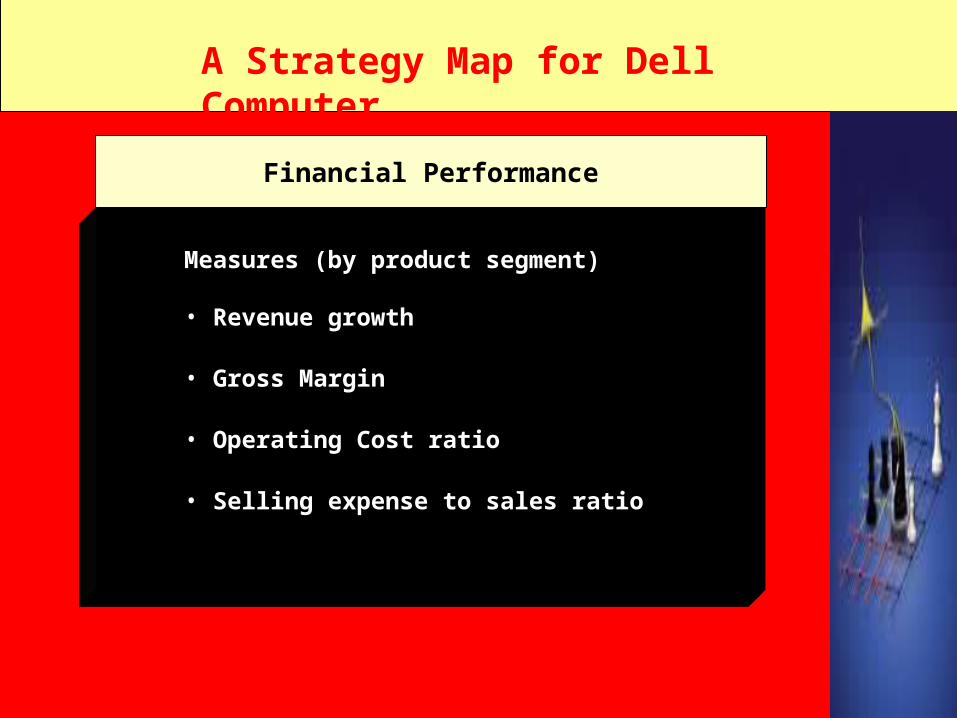
A Strategy Map for Dell Computer
Financial Performance
Measures (by product segment)
• Revenue growth
• Gross Margin
• Operating Cost ratio
• Selling expense to sales ratio


![Chapter [6] Strategy Implementation and Control Strategy Implementation and Control](https://img.pdfslide.us/doc/110x75/56649cdb5503460f949a5895/chapter-6-strategy-implementation-and-control-strategy-implementation-and.jpg)
