Embed Size (px)
Citation preview
Strategy for Success
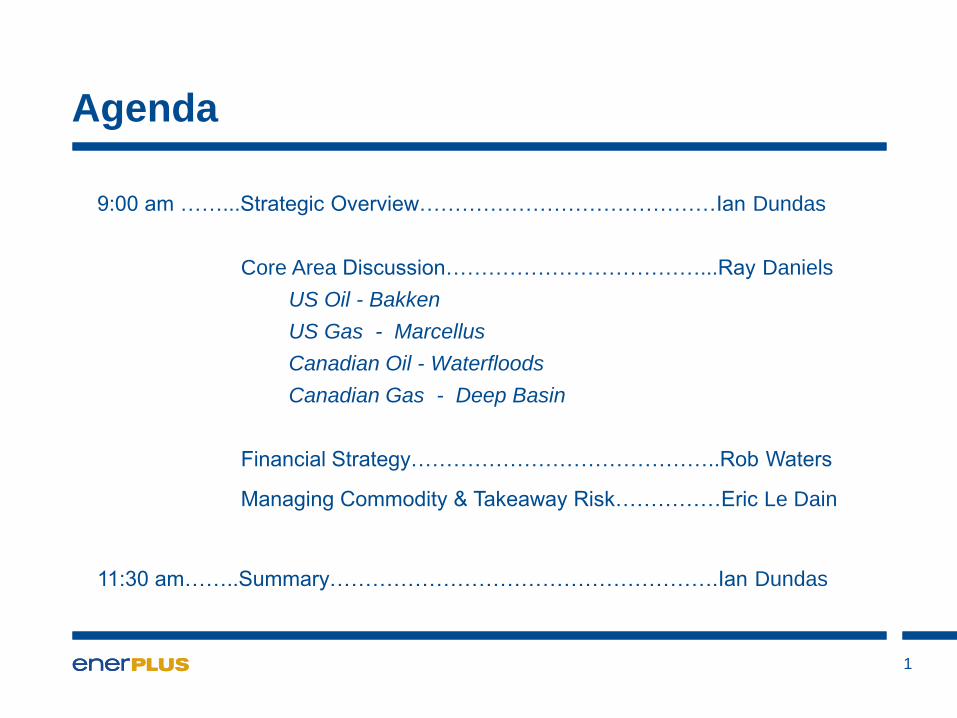
Agenda
1
9:00 am ……...Strategic Overview……………………………………Ian Dundas
Core Area Discussion………………………………...Ray Daniels
US Oil - Bakken
US Gas - Marcellus
Canadian Oil - Waterfloods
Canadian Gas - Deep Basin
Financial Strategy……………………………………..Rob Waters
Managing Commodity & Takeaway Risk……………Eric Le Dain
11:30 am……..Summary……………………………………………….Ian Dundas
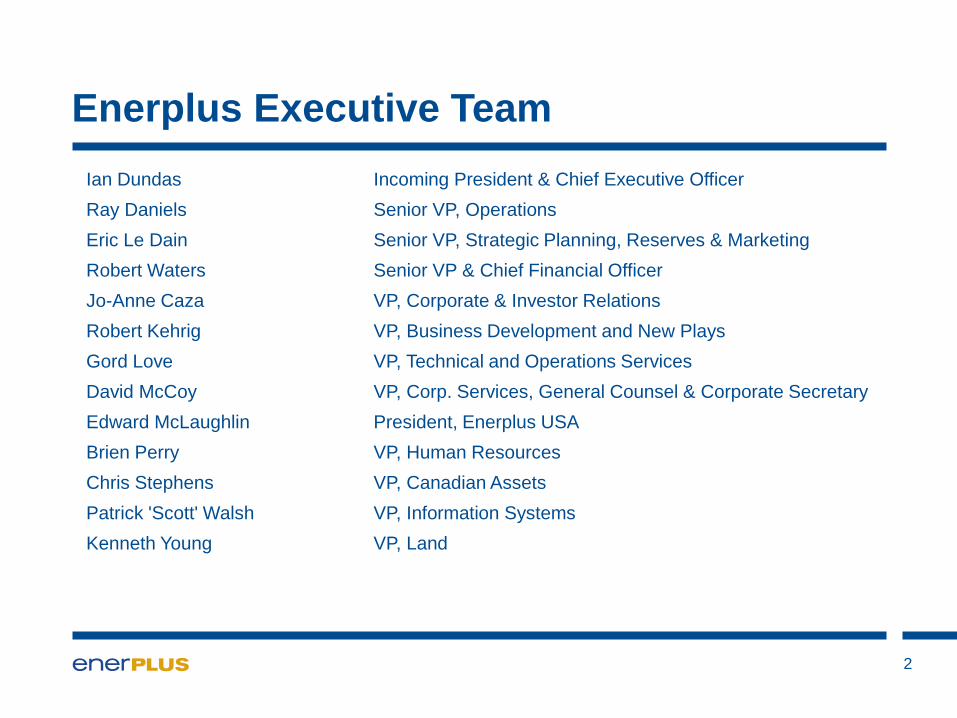
Enerplus Executive Team
2
Ian Dundas Incoming President & Chief Executive Officer
Ray Daniels Senior VP, Operations
Eric Le Dain Senior VP, Strategic Planning, Reserves & Marketing
Robert Waters Senior VP & Chief Financial Officer
Jo-Anne Caza VP, Corporate & Investor Relations
Robert Kehrig VP, Business Development and New Plays
Gord Love VP, Technical and Operations Services
David McCoy VP, Corp. Services, General Counsel & Corporate Secretary
Edward McLaughlin President, Enerplus USA
Brien Perry VP, Human Resources
Chris Stephens VP, Canadian Assets
Patrick 'Scott' Walsh VP, Information Systems
Kenneth Young VP, Land
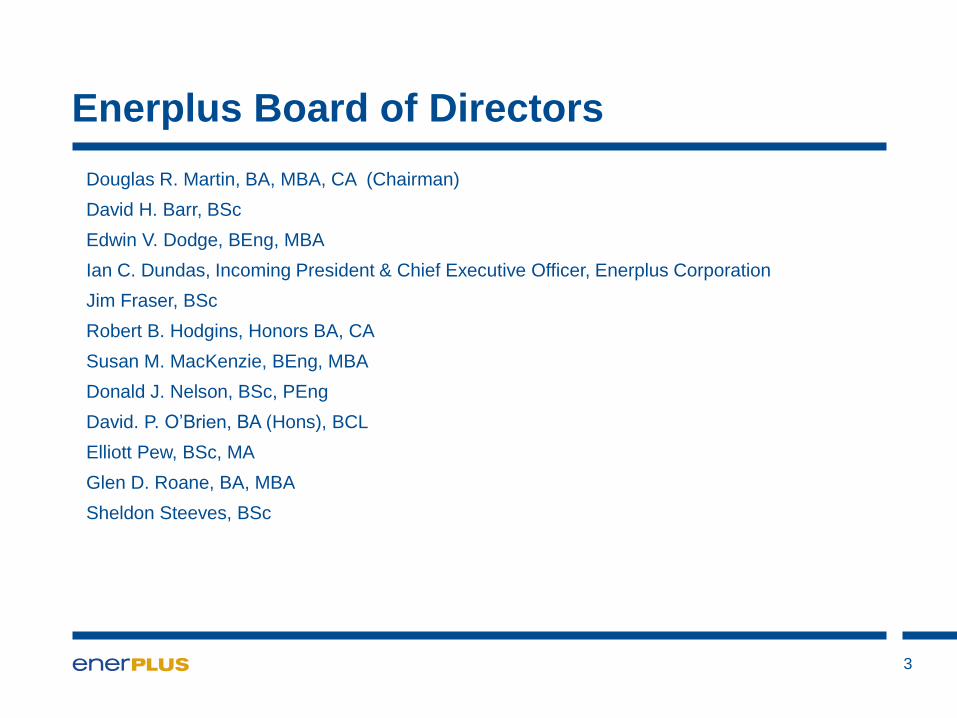
Enerplus Board of Directors
3
Douglas R. Martin, BA, MBA, CA (Chairman)
David H. Barr, BSc
Edwin V. Dodge, BEng, MBA
Ian C. Dundas, Incoming President & Chief Executive Officer, Enerplus Corporation
Jim Fraser, BSc
Robert B. Hodgins, Honors BA, CA
Susan M. MacKenzie, BEng, MBA
Donald J. Nelson, BSc, PEng
David. P. O’Brien, BA (Hons), BCL
Elliott Pew, BSc, MA
Glen D. Roane, BA, MBA
Sheldon Steeves, BSc
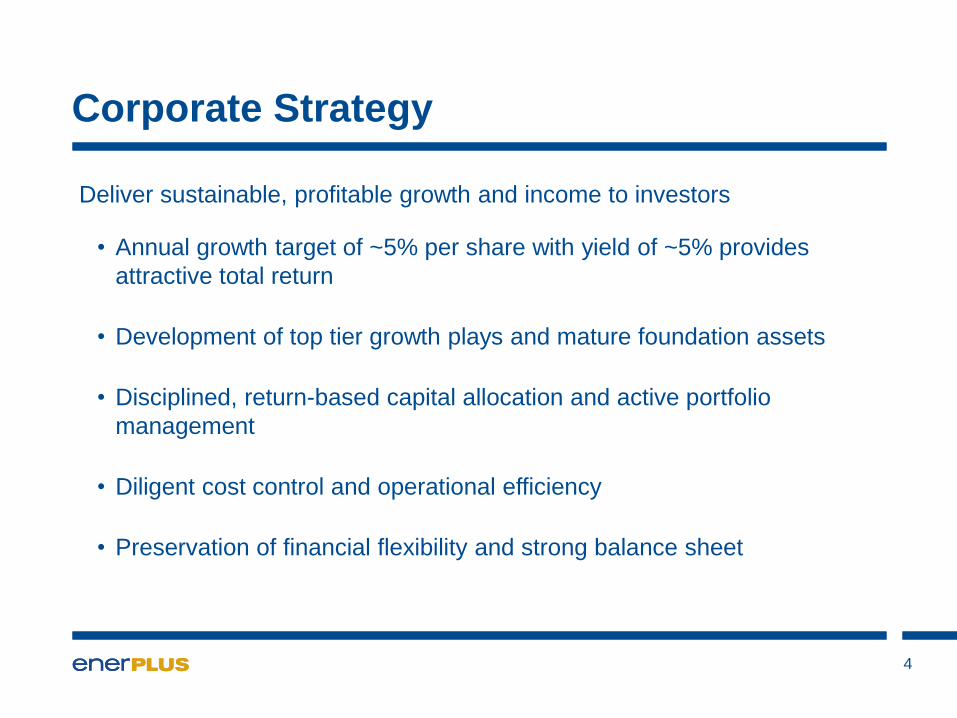
Corporate Strategy
Deliver sustainable, profitable growth and income to investors
• Annual growth target of ~5% per share with yield of ~5% provides
attractive total return
• Development of top tier growth plays and mature foundation assets
• Disciplined, return-based capital allocation and active portfolio
management
• Diligent cost control and operational efficiency
• Preservation of financial flexibility and strong balance sheet
4
5
Focus
Profitability
Sustainability
6
Focus
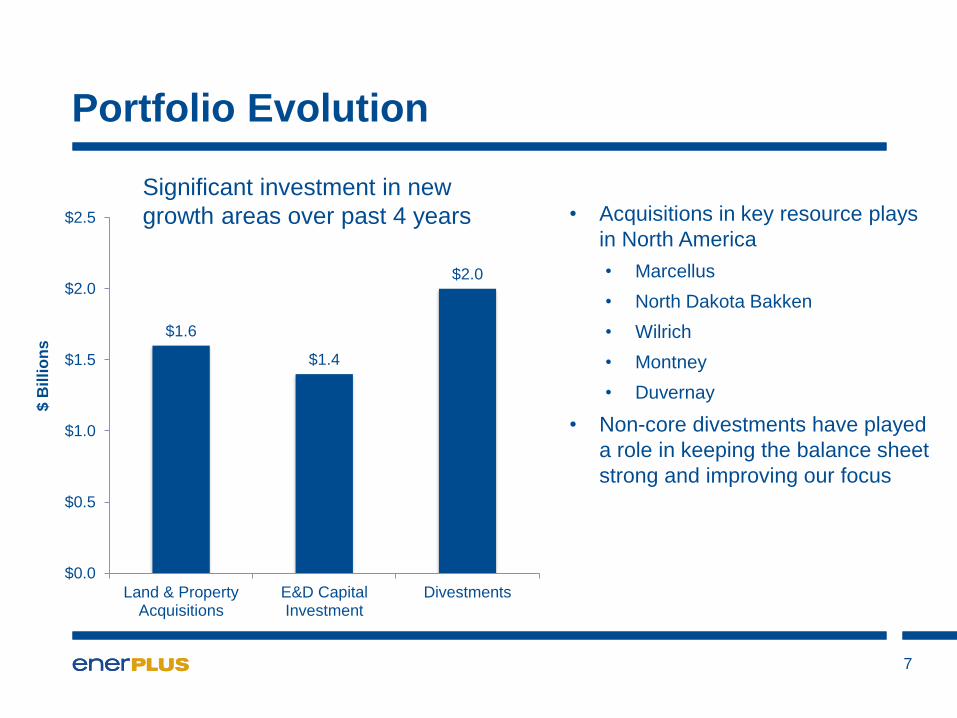
Portfolio Evolution
• Acquisitions in key resource plays
in North America
• Marcellus
• North Dakota Bakken
• Wilrich
• Montney
• Duvernay
• Non-core divestments have played
a role in keeping the balance sheet
strong and improving our focus
7
$1.6
$1.4
$2.0
$0.0
$0.5
$1.0
$1.5
$2.0
$2.5
Land & PropertyAcquisitions
E&D CapitalInvestment
Divestments
$ B
illi
on
s
Significant investment in new
growth areas over past 4 years
8
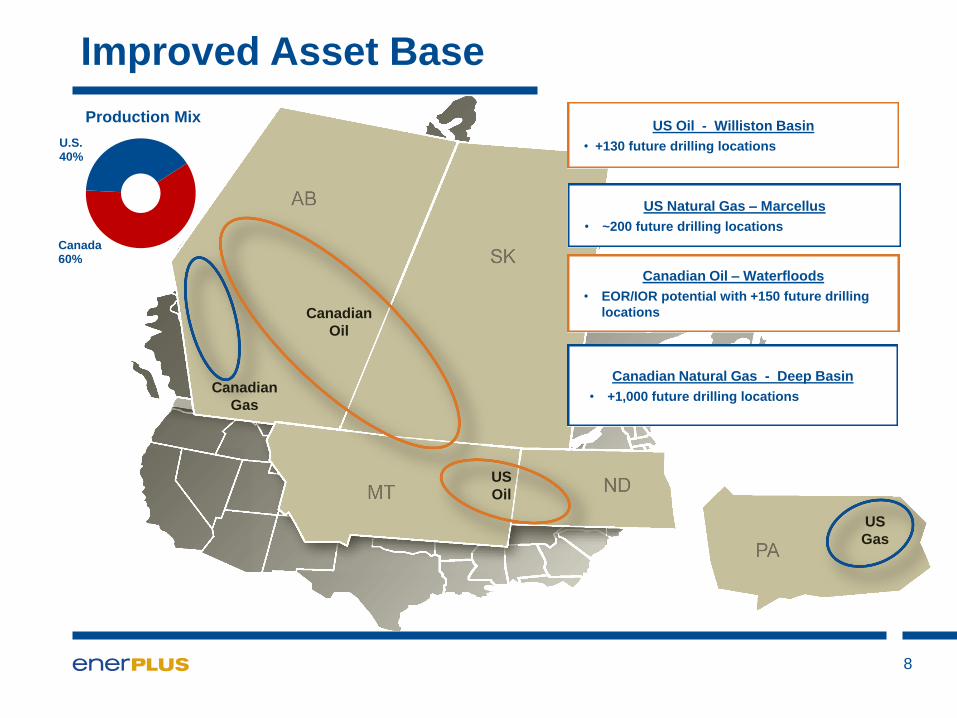
Improved Asset Base
Canadian Oil – Waterfloods
• EOR/IOR potential with +150 future drilling
locations
Canadian Natural Gas - Deep Basin
• +1,000 future drilling locations
US Natural Gas – Marcellus
• ~200 future drilling locations
Canada 60%
U.S. 40%
US
Oil
US
Gas
Canadian
Gas
Canadian
Oil
US Oil - Williston Basin
• +130 future drilling locations
Production Mix
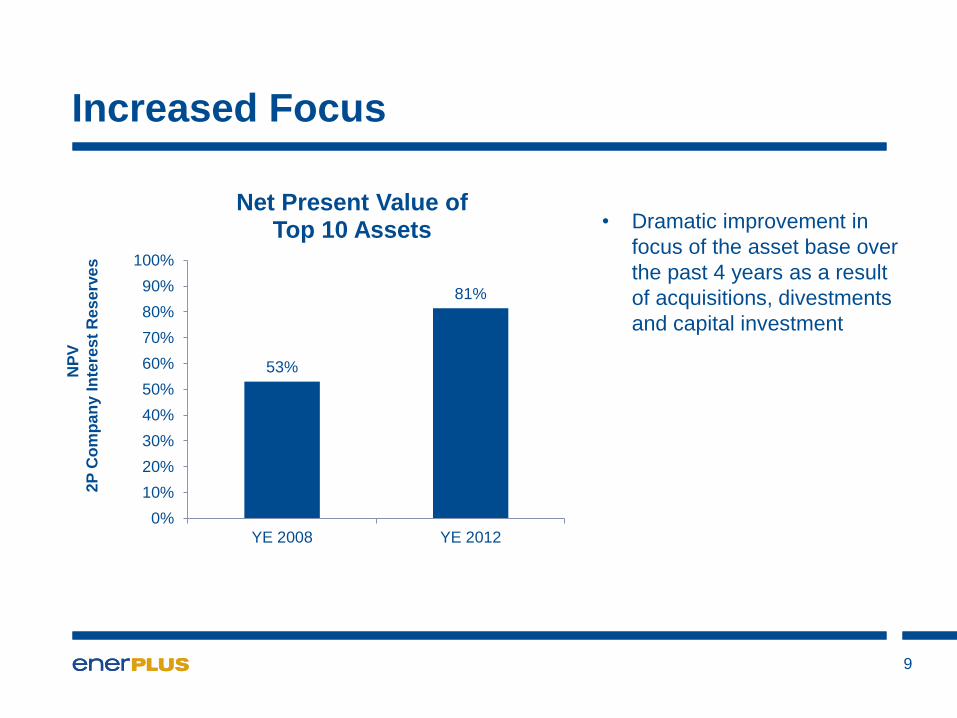
Increased Focus
9
NP
V
2P
Co
mp
an
y I
nte
res
t R
es
erv
es
• Dramatic improvement in
focus of the asset base over
the past 4 years as a result
of acquisitions, divestments
and capital investment
53%
81%
0%
10%
20%
30%
40%
50%
60%
70%
80%
90%
100%
YE 2008 YE 2012
Net Present Value of Top 10 Assets
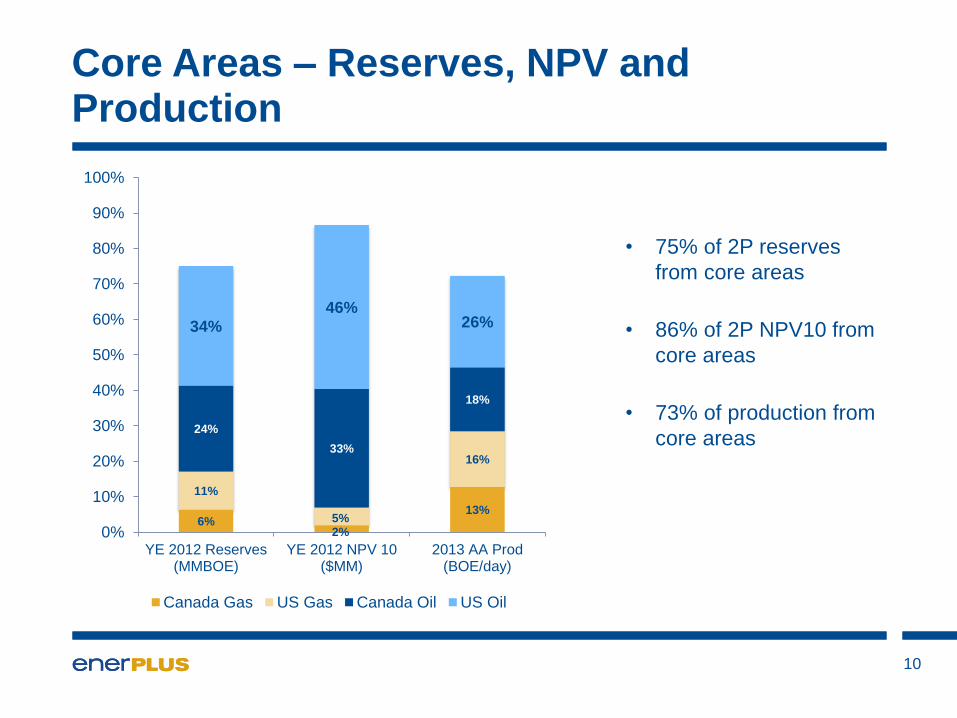
Core Areas – Reserves, NPV and Production
10
6% 2%
13%
11%
5%
16%
24%
33%
18%
34%
46% 26%
0%
10%
20%
30%
40%
50%
60%
70%
80%
90%
100%
YE 2012 Reserves(MMBOE)
YE 2012 NPV 10($MM)
2013 AA Prod(BOE/day)
Canada Gas US Gas Canada Oil US Oil
• 75% of 2P reserves
from core areas
• 86% of 2P NPV10 from
core areas
• 73% of production from
core areas
How Do We Continue to Improve Our Portfolio?
11
• Continued sale of non-strategic assets
• Accelerating the pace, but at the right valuation
• Shallow gas assets are not part of the core
• Small amount of conventional oil production in Canada is not part of
the core
• Divestments will provide a funding source for de-risking and
development of our early stage assets
• Will continue to add to our existing core areas where we already
possess internal technical and operational strengths
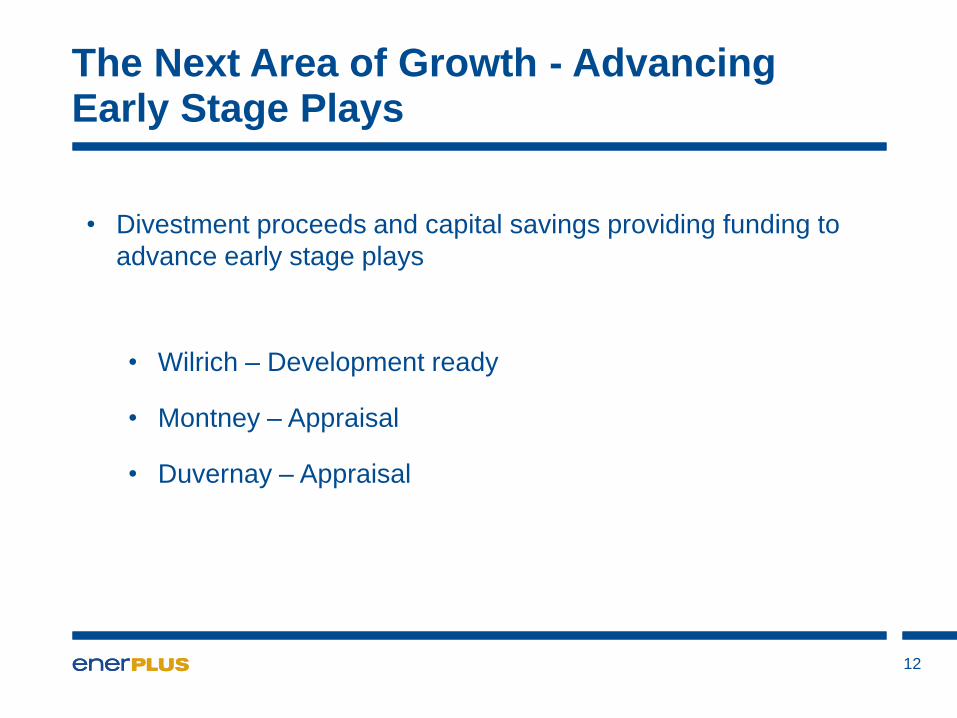
The Next Area of Growth - Advancing Early Stage Plays
12
• Divestment proceeds and capital savings providing funding to
advance early stage plays
• Wilrich – Development ready
• Montney – Appraisal
• Duvernay – Appraisal
13
Profitability
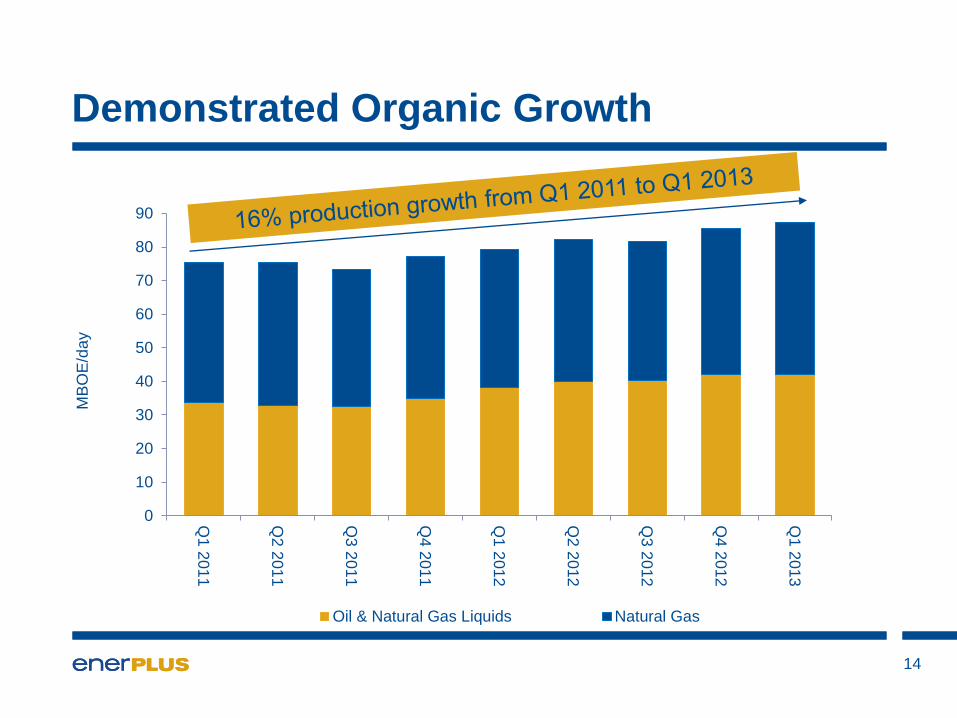
0
10
20
30
40
50
60
70
80
90
Q1 2
01
1
Q2 2
01
1
Q3 2
01
1
Q4 2
01
1
Q1 2
01
2
Q2 2
01
2
Q3 2
01
2
Q4 2
01
2
Q1 2
01
3
MB
OE
/da
y
Oil & Natural Gas Liquids Natural Gas
Demonstrated Organic Growth
14
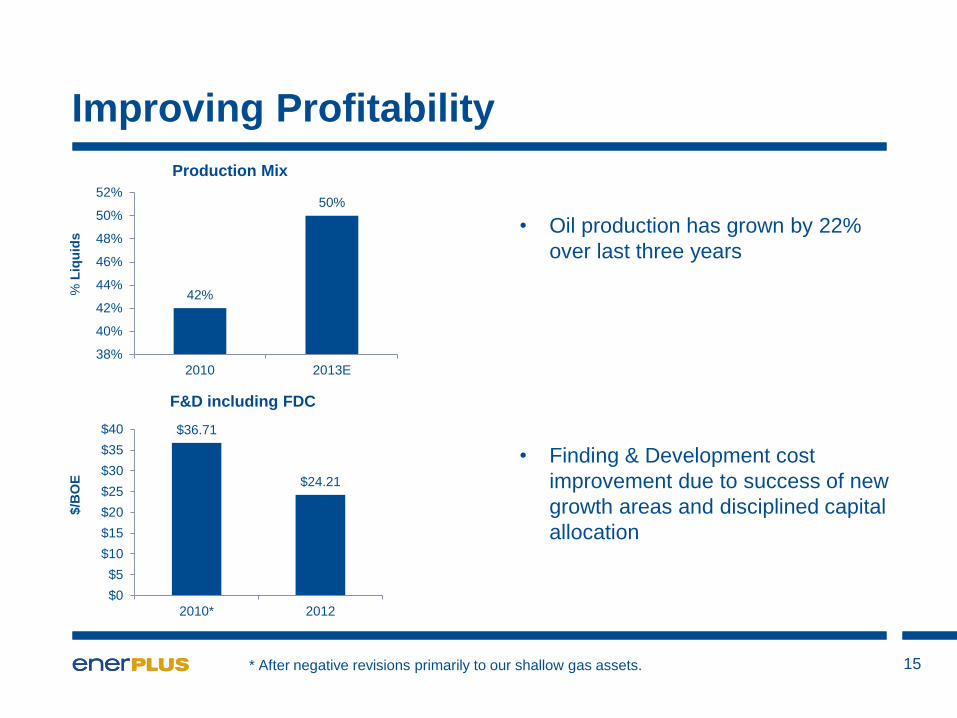
Improving Profitability
15
Production Mix
42%
50%
38%
40%
42%
44%
46%
48%
50%
52%
2010 2013E
* After negative revisions primarily to our shallow gas assets.
$36.71
$24.21
$0
$5
$10
$15
$20
$25
$30
$35
$40
2010* 2012
F&D including FDC
$/B
OE
%
Liq
uid
s • Oil production has grown by 22%
over last three years
• Finding & Development cost
improvement due to success of new
growth areas and disciplined capital
allocation
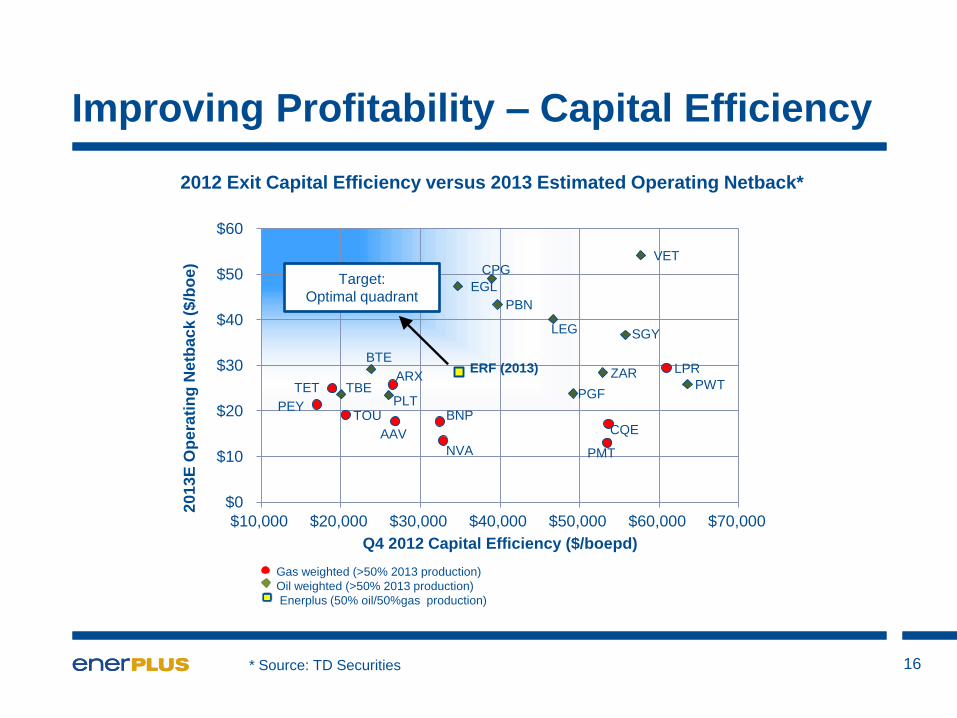
Improving Profitability – Capital Efficiency
16
AAV
ARX
BNP
BTE
CPG
CQE
EGL
ERF (2013)
LEG
LPR
NVA
PBN
PEY PGF
PLT
PMT
PWT TBE
SGY
TET
TOU
VET
ZAR
$0
$10
$20
$30
$40
$50
$60
$10,000 $20,000 $30,000 $40,000 $50,000 $60,000 $70,000
20
13
E O
pe
rati
ng
Netb
ac
k (
$/b
oe
)
Q4 2012 Capital Efficiency ($/boepd)
Target:
Optimal quadrant
Gas weighted (>50% 2013 production)
Oil weighted (>50% 2013 production)
Enerplus (50% oil/50%gas production)
2012 Exit Capital Efficiency versus 2013 Estimated Operating Netback*
* Source: TD Securities
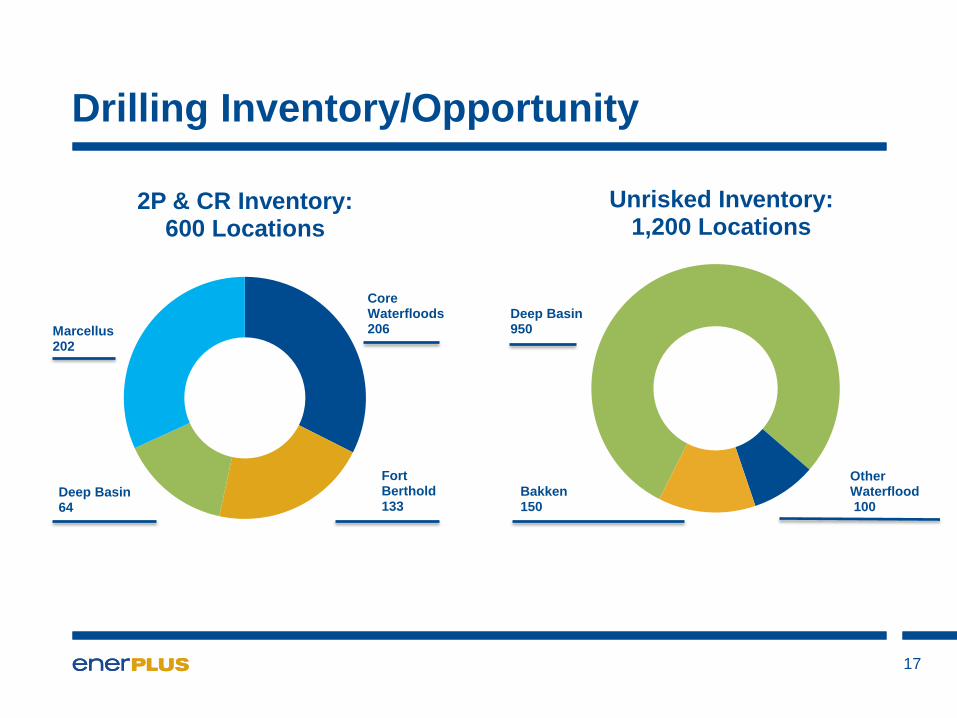
Drilling Inventory/Opportunity
17
Core Waterfloods 206
Fort Berthold 133
Deep Basin 64
Marcellus 202
2P & CR Inventory: 600 Locations
Deep Basin 950
Other Waterflood 100
Bakken 150
Unrisked Inventory: 1,200 Locations
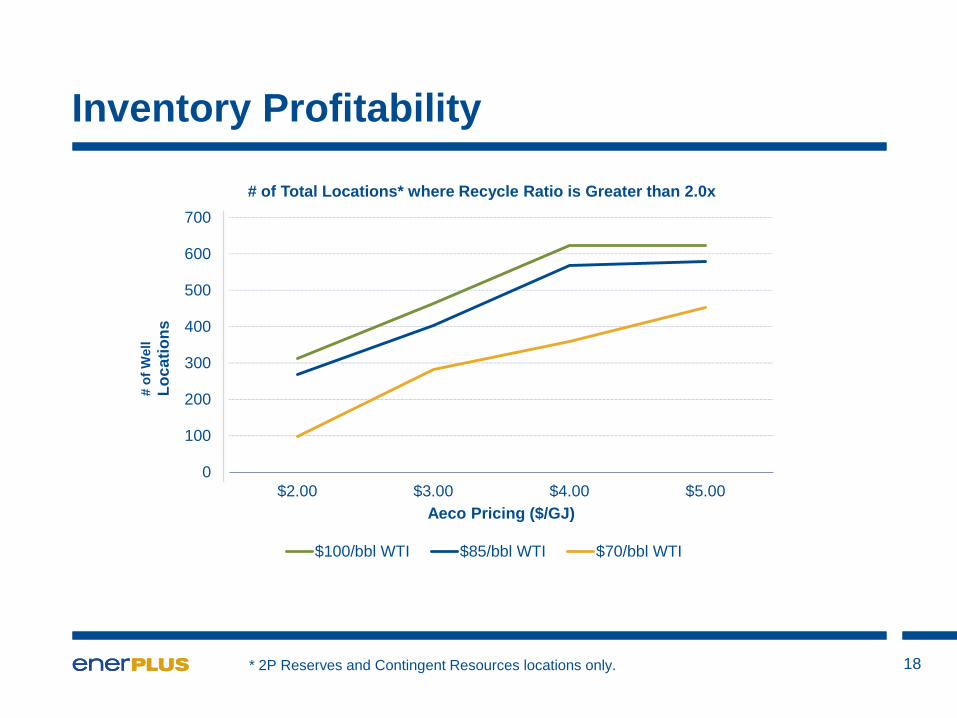
Inventory Profitability
18
0
100
200
300
400
500
600
700
$2.00 $3.00 $4.00 $5.00
Aeco Pricing ($/GJ)
# of Total Locations* where Recycle Ratio is Greater than 2.0x
$100/bbl WTI $85/bbl WTI $70/bbl WTI
# o
f W
ell
Lo
ca
tio
ns
* 2P Reserves and Contingent Resources locations only.
19
Sustainability
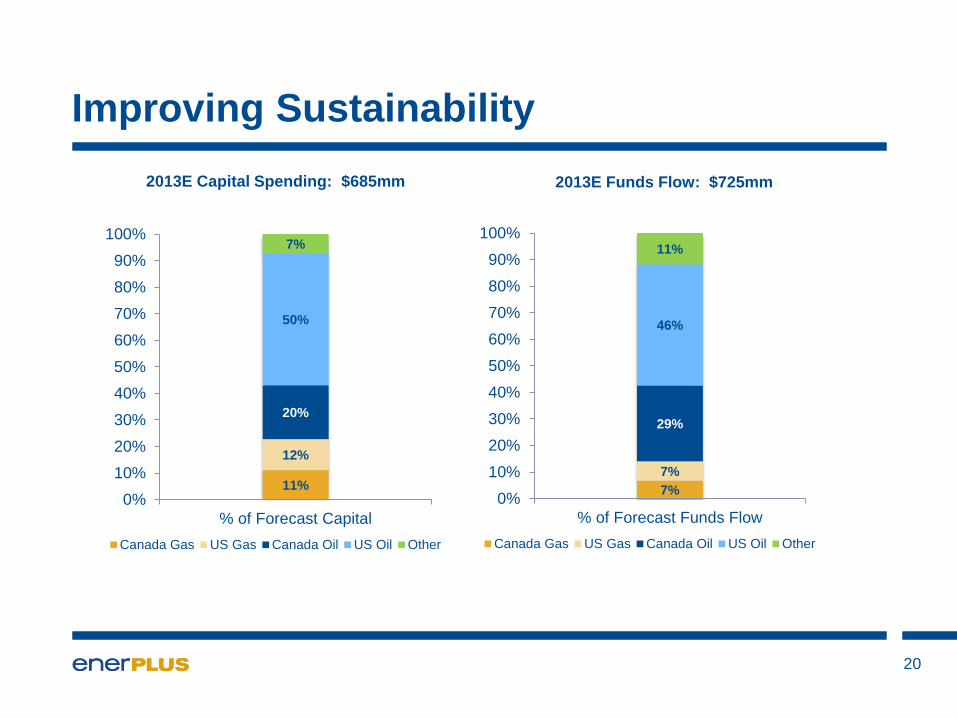
Improving Sustainability
20
2013E Capital Spending: $685mm 2013E Funds Flow: $725mm
7%
7%
29%
46%
11%
0%
10%
20%
30%
40%
50%
60%
70%
80%
90%
100%
% of Forecast Funds Flow
Canada Gas US Gas Canada Oil US Oil Other
11%
12%
20%
50%
7%
0%
10%
20%
30%
40%
50%
60%
70%
80%
90%
100%
% of Forecast Capital
Canada Gas US Gas Canada Oil US Oil Other
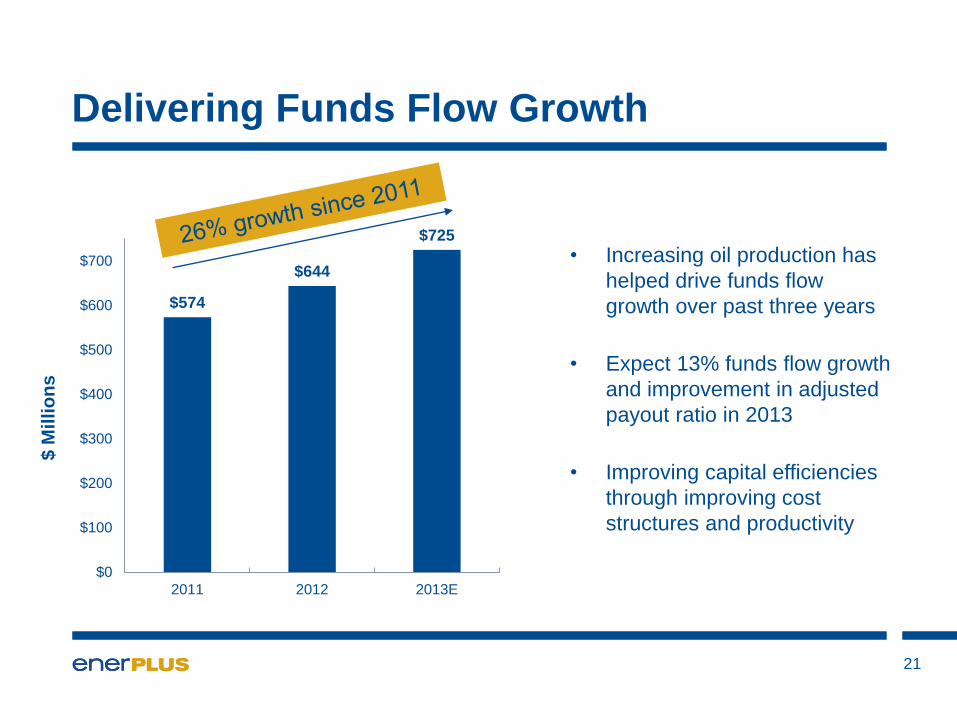
Delivering Funds Flow Growth
• Increasing oil production has
helped drive funds flow
growth over past three years
• Expect 13% funds flow growth
and improvement in adjusted
payout ratio in 2013
• Improving capital efficiencies
through improving cost
structures and productivity
$574
$644
$725
$0
$100
$200
$300
$400
$500
$600
$700
2011 2012 2013E
$ M
illio
ns
21
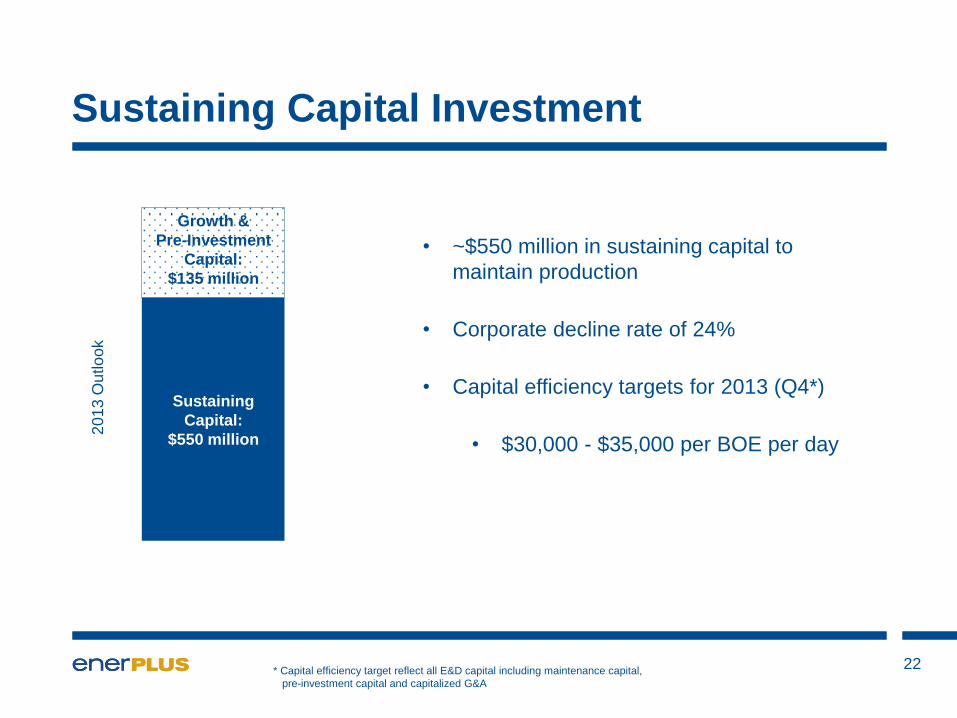
Sustaining Capital Investment
22
Sustaining
Capital:
$550 million
Growth &
Pre-Investment
Capital:
$135 million
• ~$550 million in sustaining capital to
maintain production
• Corporate decline rate of 24%
• Capital efficiency targets for 2013 (Q4*)
• $30,000 - $35,000 per BOE per day
20
13
Ou
tlo
ok
* Capital efficiency target reflect all E&D capital including maintenance capital,
pre-investment capital and capitalized G&A
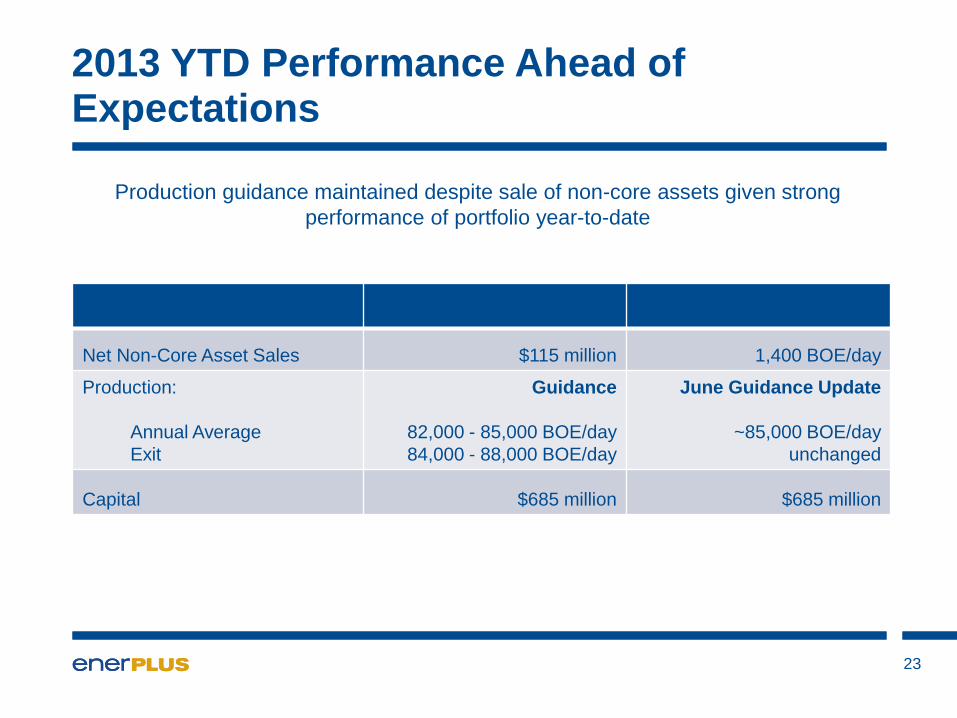
2013 YTD Performance Ahead of Expectations
23
Net Non-Core Asset Sales $115 million 1,400 BOE/day
Production:
Annual Average
Exit
Guidance
82,000 - 85,000 BOE/day
84,000 - 88,000 BOE/day
June Guidance Update
~85,000 BOE/day
unchanged
Capital $685 million $685 million
Production guidance maintained despite sale of non-core assets given strong
performance of portfolio year-to-date