Embed Size (px)
Citation preview

General rights Copyright and moral rights for the publications made accessible in the public portal are retained by the authors and/or other copyright owners and it is a condition of accessing publications that users recognise and abide by the legal requirements associated with these rights.
Users may download and print one copy of any publication from the public portal for the purpose of private study or research.
You may not further distribute the material or use it for any profit-making activity or commercial gain
You may freely distribute the URL identifying the publication in the public portal If you believe that this document breaches copyright please contact us providing details, and we will remove access to the work immediately and investigate your claim.
Downloaded from orbit.dtu.dk on: Jan 30, 2022
Strategy for nuclear-magnetic-resonance-based metabolomics of human feces
Lamichhane, Santosh; Yde, Christian Clement; Schmedes, Mette Søndergaard; Max Jensen, Henrik;Meier, Sebastian; Bertram, Hanne Christine
Published in:Analytical Chemistry
Link to article, DOI:10.1021/acs.analchem.5b00977
Publication date:2015
Document VersionPeer reviewed version
Link back to DTU Orbit
Citation (APA):Lamichhane, S., Yde, C. C., Schmedes, M. S., Max Jensen, H., Meier, S., & Bertram, H. C. (2015). Strategy fornuclear-magnetic-resonance-based metabolomics of human feces. Analytical Chemistry, 87(12), 5930-5937.https://doi.org/10.1021/acs.analchem.5b00977
1
Strategy for nuclear-magnetic-resonance-based metabolomics of human feces
Santosh Lamichhane1, Christian C. Yde1, Mette Søndergård Schmedes1, Henrik Max Jensen2,
Sebastian Meier3, and Hanne Christine Bertram1*
1Department of Food Science, Aarhus University, Kirstinebjergvej 10, DK-5792 Aarslev, Denmark.
2DuPont Nutrition Biosciences ApS, Edwin Rahrsvej 38, 8220 Brabrand, Aarhus, Denmark
3 Technical University of Denmark, Department of Chemistry, Kemitorvet, Building 201, DK-
2800 Kgs. Lyngby, Denmark
* Corresponding author. Email: [email protected]

2
Abstract: 1
Metabolomic analyses of fecal material are gaining increasing attention because the gut microbial 2
ecology and activity have an impact on the human phenotype and regulate host metabolism. Sample 3
preparation is a crucial step, and in this study we recommend a methodology for extraction and 4
analysis of fresh feces by NMR-based metabolomics. The evaluation of extraction solvents showed 5
that buffer extraction is a suitable approach to extract metabolic information in feces. So, the effects 6
of weight-to-buffer (Wf:Vb) combinations and the effect of sonication and freeze-thaw cycles on 7
the reproducibility, chemical shift variability, and signal to noise ratio (SNR) of the 1H NMR 8
spectra were evaluated. Based on our results, we suggest that fresh fecal extraction with a Wf:Vb 9
ratio of 1:2 may be the optimum choice to determine the overall metabolite composition of feces. In 10
fact, more than 60 metabolites have been assigned in the NMR spectra obtained from the fresh fecal 11
buffer extract, and assignments of the lipophilic signals are also presented. To our knowledge, some 12
of the metabolites are reported here for the very first time employing 1H NMR spectroscopy on 13
human fecal extracts. 14
15
Keywords: Nuclear magnetic resonance, metabolomics, gut, human feces, metabolites 16
17

3
Introduction 18
Metabolomics is a holistic approach to study systematic metabolic changes in biological samples. In 19
general, nuclear magnetic resonance (NMR) and mass spectrometry (MS) are the analytical 20
techniques used to observe and quantify metabolites from biological samples, and each technique 21
has its own advantages and disadvantages. NMR-based metabolomics has emerged as a reliable 22
high throughput analytical technique that has been extensively applied to a variety of biological 23
samples such as urine, plasma, tissues, saliva, milk, seminal fluid, and sputum.1-4 Presently, urine 24
and plasma are the most common sample types included in metabolomics studies. However, 25
metabolomics on fecal material is gaining increased attention because gut ecology has an impact on 26
the human phenotype and gut-microbe cross talk is regarded as one of the key determinants in the 27
regulation of host metabolism.5-11 Because feces comes into direct contact with the colon and 28
sample collection is non-invasive, feces is the most biologically most relevant sample material for 29
metabolomics studies aiming to explore gut microbial activity and thereby gut health status. To 30
date, NMR studies focused on fecal metabolomics have been applied to gain insight into metabolic 31
effects involved in dietary interventions 12,13 and to study gut diseases such as inflammatory bowel 32
disease, 14,15 ulcerative colitis, 14 and colorectal cancer.16 An increased understanding of the 33
metabolic activity in the colon may contribute to the identification of new biomarkers that could be 34
related to health or disease status and molecular regulation of the complex gut system. 35
36
In order to extract as much information as possible from a complex fecal sample, optimization and 37
standardization of an analytical methodology are essential. Although several studies have been 38
reported on fecal metabolomics, 12,14-16 few studies have focused on optimizing the NMR 39
methodology for fecal extracts and detailed spectral assignments have rarely been reported. 17-19 40
Two of the most important factors to consider in the optimization of an extraction method are (i) the 41

4
production of reproducible NMR spectra with low inter-sample chemical shift variability and (ii) 42
high signal-to-noise ratio (SNR). In addition, the extraction method should preferably be rapid, 43
robust, (and suitable) and compatible with high-throughput analyses. Previously, fecal sample 44
extractions have been performed by centrifugation, 20 D2O, 21 distilled water, 16 buffers, 14,22 and 45
mixed solvent extractions on lyophilized samples.18 Lyophilization is advantageous, as it minimizes 46
the effect of solvent dilution (water content) on the feces. However, lyophilization affects the 47
concentration of volatile metabolites, such as short chain fatty acids and succinate.18,19 Therefore, to 48
reduce the loss of volatile metabolites and minimize the steps required during extraction; fresh fecal 49
samples are considered the preferred choice for fecal metabolomics studies. Buffer extraction might 50
be the most suitable approach to extract metabolic information as it reduces inter-sample pH 51
variation during extraction. In order to obtain reproducible NMR spectra with lower inter-sample 52
chemical shift variability and high SNR, the choice of extraction solvents must be evaluate and the 53
fecal weight-to-buffer volume (Wf:Vb) must therefore be optimized. 54
55
In previous studies, different extraction solvents were implied for extraction16,18-20 and Wf:Vb ratios 56
of 1:50,14 1:516, 1:10,23 1:2 and an unknown ratio 15,17,22 have been applied, but none of the studies 57
report the rationale for their choice of solvent and the weight-to-buffer volume. Wu et al. 24 have 58
recommended the use of a Wf:Vb ratio of 1:10 and the pooling of the first two extracts. It is also 59
noteworthy that the recommendation (Wf:Vb of 1:10) was solely based on evaluation of chemical 60
shift inconsistency and the experiment was conducted in fecal material from mice. Saric et al. 61
showed that the fecal metabolome varies between species and, more specifically, the human 62
metabolome contained lower levels of lactate and amino acids compared to mice and rats.19 63
Thereby, this finding urges further investigation of the choice of fecal weight-to-buffer ratio to 64
extract metabolites from fresh human feces in metabolomic analyses. Besides that, the fecal 65
5
metabolomics studies have focused on the analysis of intracellular bacterial metabolites; therefore, 66
different sample pretreatment techniques have been used to homogenize fecal samples. However, 67
the presence of different residual food components in the feces might affect the extraction. 68
Therefore, it is of interest to compare the effects of sample pre-treatment and the choice of weight-69
to-buffer ratio during metabolic profiling from fresh human samples. In the present study we aimed 70
to compare the effect of different solvents during extraction, weight-to-buffer combinations on the 71
reproducibility, chemical shift variability, overall metabolite composition and SNR of the NMR 72
spectra from healthy human feces. In addition, we analyzed the consistency of fecal metabolite 73
composition upon different sample treatment techniques (sonication and freeze-thaw cycles) and 74
suggest an optimized protocol for NMR-based metabolomics analyses of human feces. 75
6
Materials and methods 76
77
Sampling and sample material 78
Fecal material from nine healthy volunteers was used for the study. The study protocol was 79
approved by the Ethics and Research Committee and conducted according to the guidelines in the 80
Declaration of Helsinki. The fecal material was collected from all subjects in a falcon tube 81
immediately after defecation. The samples were then stored at -20 °C prior to analysis. Initially, 82
fecal samples from four healthy volunteers were used to optimize the fecal-to-water buffer ratio 83
during extraction. Samples from an additional five subjects were included to elucidate the 84
reproducibility of the method and the stability over time. 85
86
Fecal metabolite extraction 87
Fecal water was extracted to ratios of 1:2, 1:5, and 1:10 (weight of fresh feces-to-buffer) in 0.75 M 88
phosphate buffered saline (PBS, pH 7.4). The samples were homogenized by whirl mixing for 2 89
min, and then aliquots were centrifuged at 10,000 g for 15 minutes at 4 °C (Eppendorf 5471, USA). 90
The supernatants were carefully removed and stored in Eppendorf tubes at -80 °C until analysis. To 91
determine recovery, feces from one individual (n = 3) was spiked with 100 µL of standards maleic 92
acid, dimethyl sulfone, and succinic acid (0.05 M). Fecal water was extracted to ratios of 1:2, 1:5, 93
and 1:10 (w/v) as described earlier. The recovery values of dimethyl sulfone, and succinic acid were 94
referenced to maleic acid. In addition, to investigate the influence of solvent during fecal 95
metabolites extraction, feces from one individual has been extracted in duplicate with distilled 96
water, D2O extraction, (adapted from Monleón et al.16) and using combination of 97
methanol/chloroform/water (section A, supplementary information). 98

7
Freeze thaw and sonication treatment 99
To compare the effect of sample pretreatment on the fecal NMR profile; we extracted feces 100
simultaneously with/without freeze-thaw and sonication treatment. During freeze thaw whirl-mixed 101
samples were frozen to −18 °C for 10 minutes and immediately thawed at 4 °C for 10 min in 102
Eppendorf tubes (Eppendorf 5471, USA). This treatment was replicated for 3 cycles. Sonication 103
was conducted between each freeze thaw cycle (Branson 5210, USA). The samples were placed in 104
Eppendorf tubes and sonicated for three consecutive cycles of 2 min on and off between each freeze 105
thaw cycle. 106
pH measurement 107
The pH values of the fecal extracts diluted to 1:2, 1:5, and 1:10 (w/v) in 0.75 M phosphate buffered 108
saline (PBS, pH 7.4) were measured at room temperature (22 °C) before NMR analysis, using pH 109
electrodes for NMR sample tubes (IKATRON®, Germany). 110
1H NMR spectroscopic analyses 111
Fecal water samples extracted in PBS were thawed and centrifuged at 10,000 g for 15 minutes at 112
4°C (Eppendorf 5471, USA). A volume of 500 µL of clear supernatant was transferred to a 5 mm 113
NMR tube, and 100 µL of deuterium oxide (D2O) containing 0.025 mg/mL of 3-(Trimethylsilyl) 114
propionic acid-d4 sodium salt (TSP) was added as a lock solvent. One-dimensional NMR 115
experiments were carried out using a Bruker Avance III 600 MHz spectrometer (Bruker, 116
Rheinstetten, Germany) equipped with a 5 mm triple resonance (TXI) probe at 298 K. A standard 117
Bruker noesypr1d (90°-t1-90°-dmix-90°-FID) sequence was used to suppress signals from water 118
molecules, where t1 is a 4 µs delay time and dmix is the mixing time. Acquisition parameters for the 119
spectra were 64 scans, a spectral width of 7288 Hz collected into 32K data points, an acquisition 120
time of 2.24 s and an inter-scan relaxation delay of 5 s. The Free Induction Decay (FID) obtained 121

8
was multiplied by 0.3 Hz of exponential line broadening before Fourier transformation. The spectra 122
were referenced to TSP (chemical shift 0 ppm), phased, and baseline corrected in Topspin 3.0 123
software (Bruker, Rheinstetten, Germany). SNR was measured using the built-in graphical interface 124
in Topspin 3.0, where alanine (1.47 ppm) was considered to be the signal, and spectra at lower 125
frequency than 0 ppm were considered to represent the noise region. Relative quantification of 126
selected 1H resonance was performed by integration of peak areas using Topspin 3.0 (Bruker). 127
Assignments of 1H NMR signals were carried out using Chenomx NMR Suite 7.7 (Chenomx, 128
Canada) according to the Human Metabolome Database,25 and literature.14,18,26 In addition, 129
heteronuclear single quantum coherence (HSQC) and total correlation spectroscopy (TOCSY) 2D 130
NMR techniques were applied to confirm the identity of the assigned metabolites (see Figures S1 to 131
S6 in supplementary material). The HSQC experiment was acquired with a spectral width of 7288 132
Hz in the 1H dimension and 27164 Hz in the 13C dimension, a matrix with size of 4096×1024, 512 133
transients per increment and a relaxation delay of 2 s. The TOCSY spectrum was acquired with 134
acquired with a spectral width of 7288 Hz in the both 1H dimension, a matrix with size of 135
2048×512, and an inter-scan relaxation delay of 2s. In addition, two-dimensional NMR 136
experiments were carried out using a Bruker Avance III 800 MHz spectrometer equipped with a 5-137
mm 1H observe cryoprobe (Bruker Biospin, Rheinstetten, Germany). The HSQC experiment was 138
acquired with a spectral width of 11961 Hz in the 1H dimension and 33276 Hz in the 13C dimension, 139
a matrix with a size of 4096×4096, 512 transients per increment and a relaxation delay of 1.5 s. The 140
TOCSY spectrum was acquired with a spectral width of 9578 Hz in both 1H dimensions, a matrix 141
with a size of 8192×1536, and an inter-scan relaxation delay of 1.8 s. 142
143
9
Multivariate Data analysis 144
1H NMR spectra were imported to Matlab R2010b (The Mathworks, Inc., USA), and the 145
misalignments of the spectra were corrected using the icoshift algorithm, based on the correlational 146
shifting of spectral intervals.27 The spectrum with the highest correlation to the rest of the spectra in 147
the matrix was used as a reference. The 9.5 to 12 ppm and 0.5 to -1.2 ppm regions and the region 148
containing residual water resonance (4.8. to 4.7 ppm) were removed from the aligned spectra. The 149
spectra were normalized to unit area and pareto-scaled before principal component analysis (PCA) 150
using the PLS Toolbox (Eigenvector Research, USA) in MATLAB20010b. 151
152
10
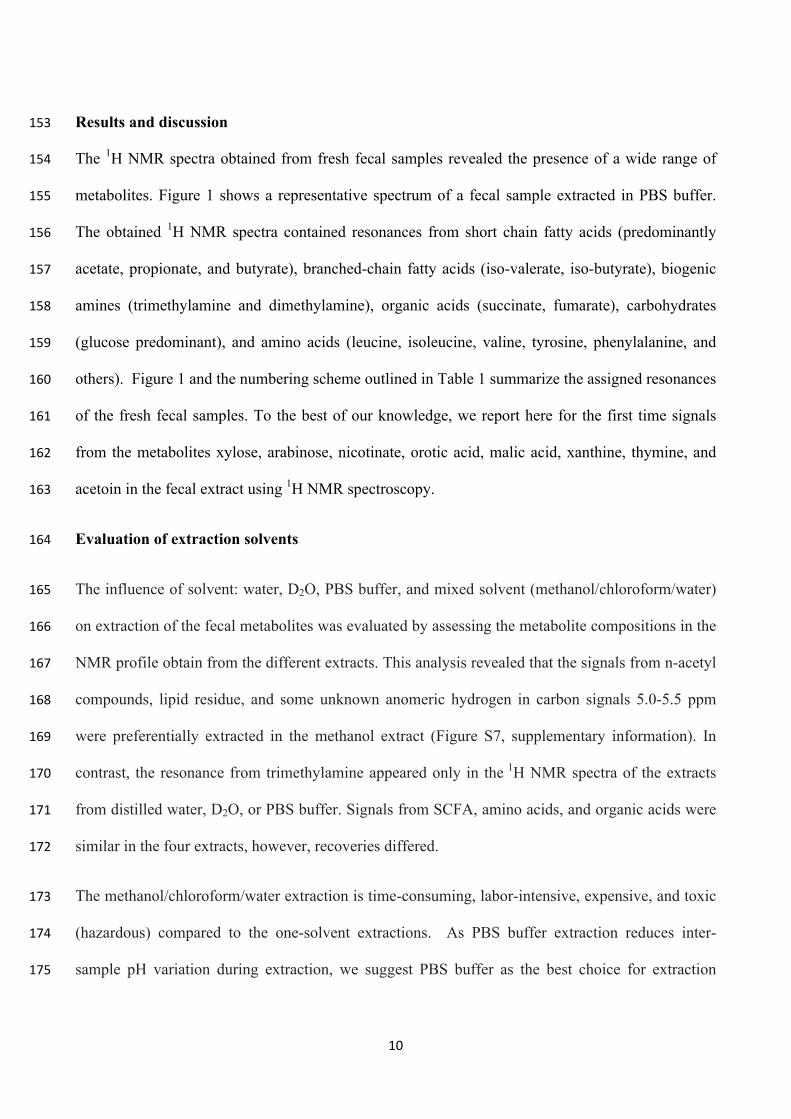
Results and discussion 153
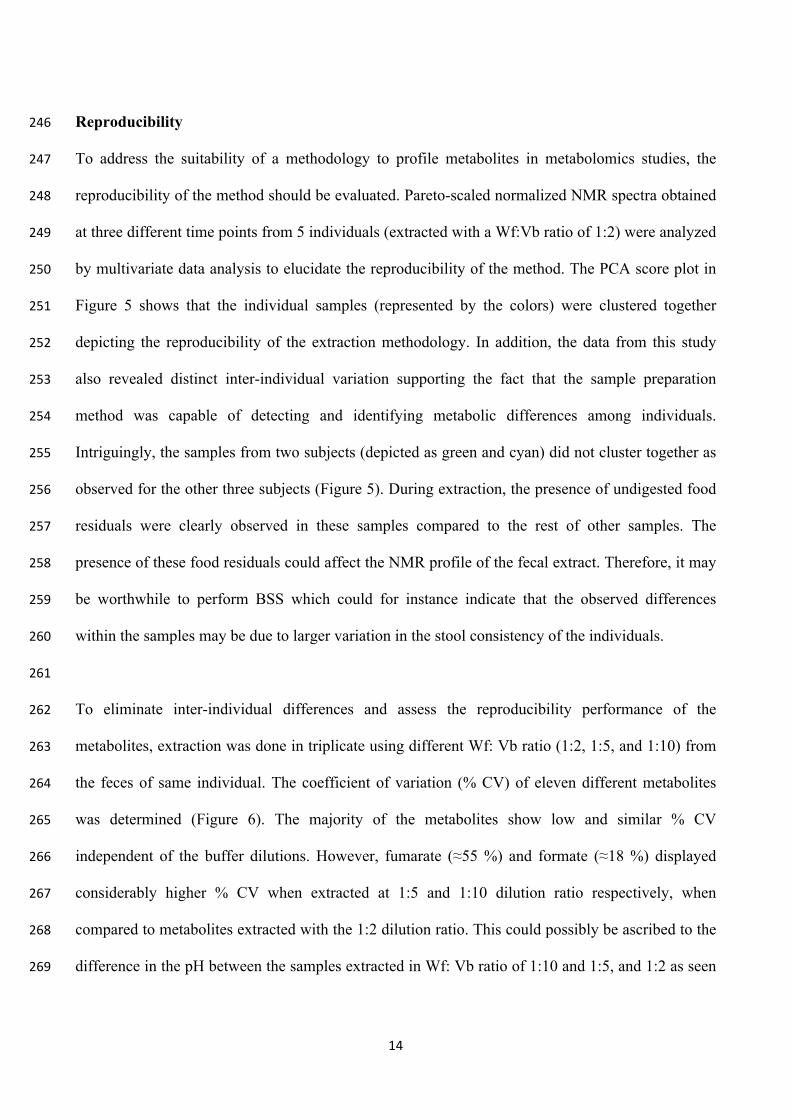
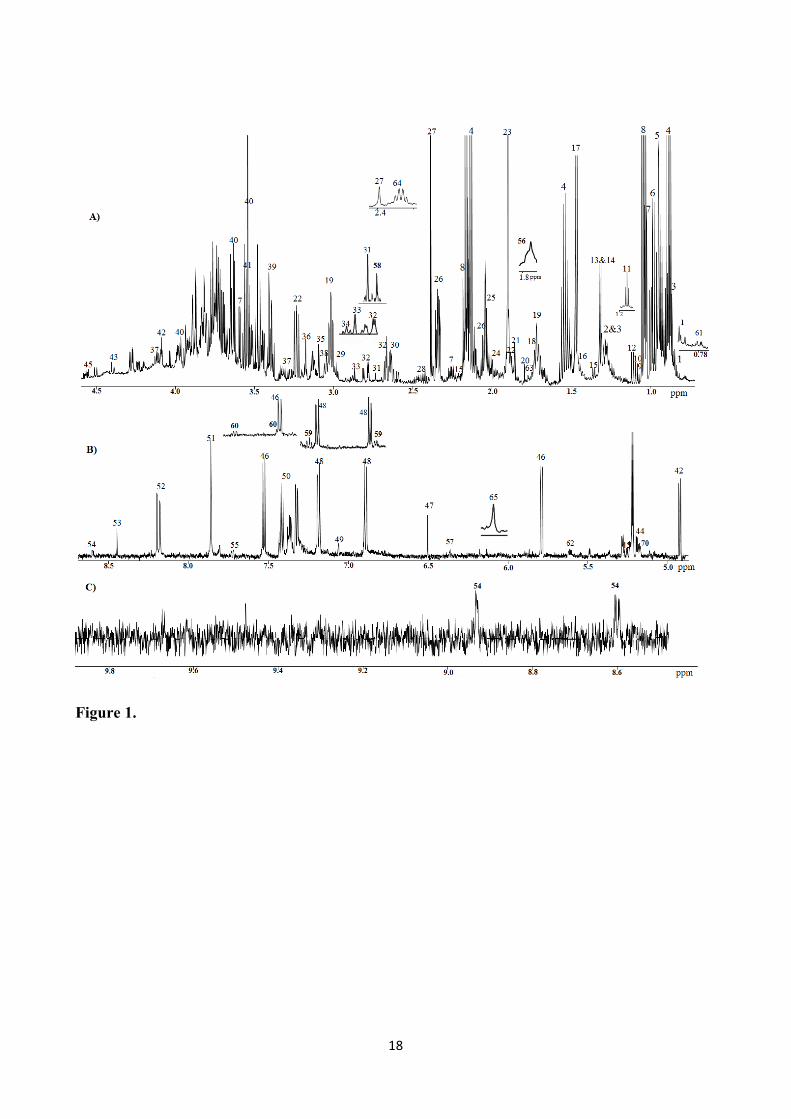
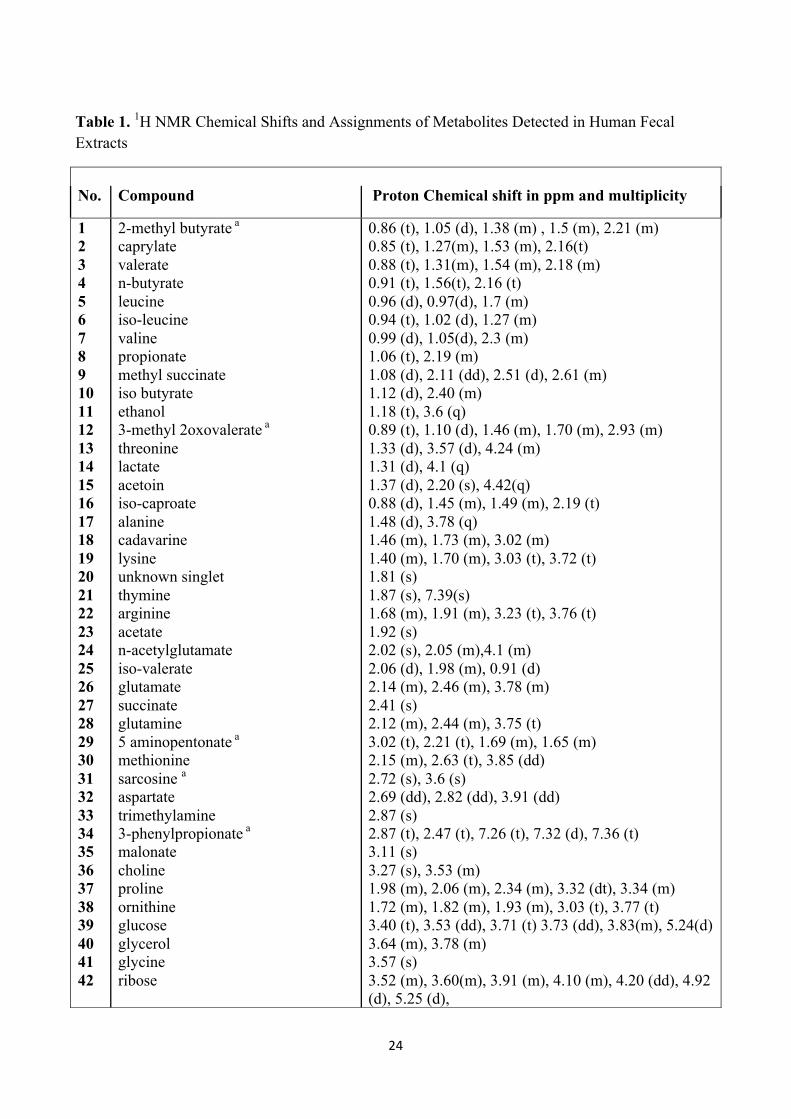
The 1H NMR spectra obtained from fresh fecal samples revealed the presence of a wide range of 154
metabolites. Figure 1 shows a representative spectrum of a fecal sample extracted in PBS buffer. 155
The obtained 1H NMR spectra contained resonances from short chain fatty acids (predominantly 156
acetate, propionate, and butyrate), branched-chain fatty acids (iso-valerate, iso-butyrate), biogenic 157
amines (trimethylamine and dimethylamine), organic acids (succinate, fumarate), carbohydrates 158
(glucose predominant), and amino acids (leucine, isoleucine, valine, tyrosine, phenylalanine, and 159
others). Figure 1 and the numbering scheme outlined in Table 1 summarize the assigned resonances 160
of the fresh fecal samples. To the best of our knowledge, we report here for the first time signals 161
from the metabolites xylose, arabinose, nicotinate, orotic acid, malic acid, xanthine, thymine, and 162
acetoin in the fecal extract using 1H NMR spectroscopy. 163
Evaluation of extraction solvents 164
The influence of solvent: water, D2O, PBS buffer, and mixed solvent (methanol/chloroform/water) 165
on extraction of the fecal metabolites was evaluated by assessing the metabolite compositions in the 166
NMR profile obtain from the different extracts. This analysis revealed that the signals from n-acetyl 167
compounds, lipid residue, and some unknown anomeric hydrogen in carbon signals 5.0-5.5 ppm 168
were preferentially extracted in the methanol extract (Figure S7, supplementary information). In 169
contrast, the resonance from trimethylamine appeared only in the 1H NMR spectra of the extracts 170
from distilled water, D2O, or PBS buffer. Signals from SCFA, amino acids, and organic acids were 171
similar in the four extracts, however, recoveries differed. 172
The methanol/chloroform/water extraction is time-consuming, labor-intensive, expensive, and toxic 173
(hazardous) compared to the one-solvent extractions. As PBS buffer extraction reduces inter-174
sample pH variation during extraction, we suggest PBS buffer as the best choice for extraction 175
11
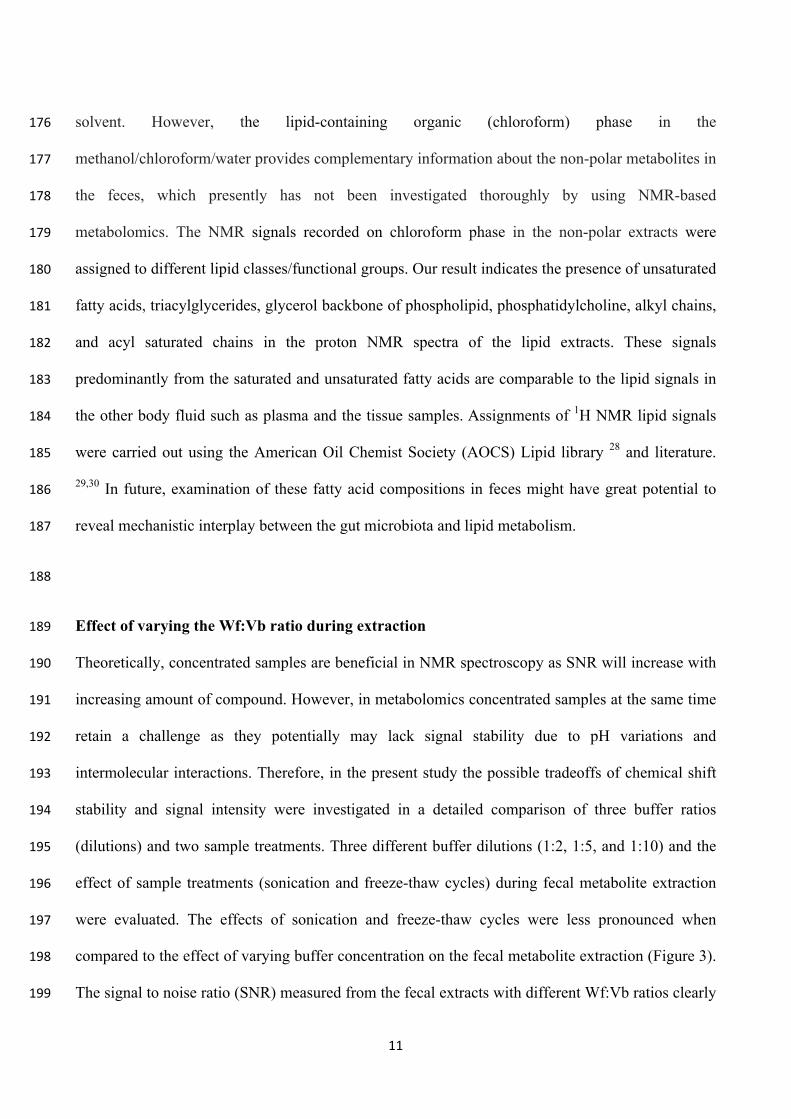
solvent. However, the lipid-containing organic (chloroform) phase in the 176
methanol/chloroform/water provides complementary information about the non-polar metabolites in 177
the feces, which presently has not been investigated thoroughly by using NMR-based 178
metabolomics. The NMR signals recorded on chloroform phase in the non-polar extracts were 179
assigned to different lipid classes/functional groups. Our result indicates the presence of unsaturated 180
fatty acids, triacylglycerides, glycerol backbone of phospholipid, phosphatidylcholine, alkyl chains, 181
and acyl saturated chains in the proton NMR spectra of the lipid extracts. These signals 182
predominantly from the saturated and unsaturated fatty acids are comparable to the lipid signals in 183
the other body fluid such as plasma and the tissue samples.Assignments of 1H NMR lipid signals 184
were carried out using the American Oil Chemist Society (AOCS) Lipid library 28 and literature. 185
29,30 In future, examination of these fatty acid compositions in feces might have great potential to 186
reveal mechanistic interplay between the gut microbiota and lipid metabolism. 187
188
Effect of varying the Wf:Vb ratio during extraction 189
Theoretically, concentrated samples are beneficial in NMR spectroscopy as SNR will increase with 190
increasing amount of compound. However, in metabolomics concentrated samples at the same time 191
retain a challenge as they potentially may lack signal stability due to pH variations and 192
intermolecular interactions. Therefore, in the present study the possible tradeoffs of chemical shift 193
stability and signal intensity were investigated in a detailed comparison of three buffer ratios 194
(dilutions) and two sample treatments. Three different buffer dilutions (1:2, 1:5, and 1:10) and the 195
effect of sample treatments (sonication and freeze-thaw cycles) during fecal metabolite extraction 196
were evaluated. The effects of sonication and freeze-thaw cycles were less pronounced when 197
compared to the effect of varying buffer concentration on the fecal metabolite extraction (Figure 3). 198
The signal to noise ratio (SNR) measured from the fecal extracts with different Wf:Vb ratios clearly 199
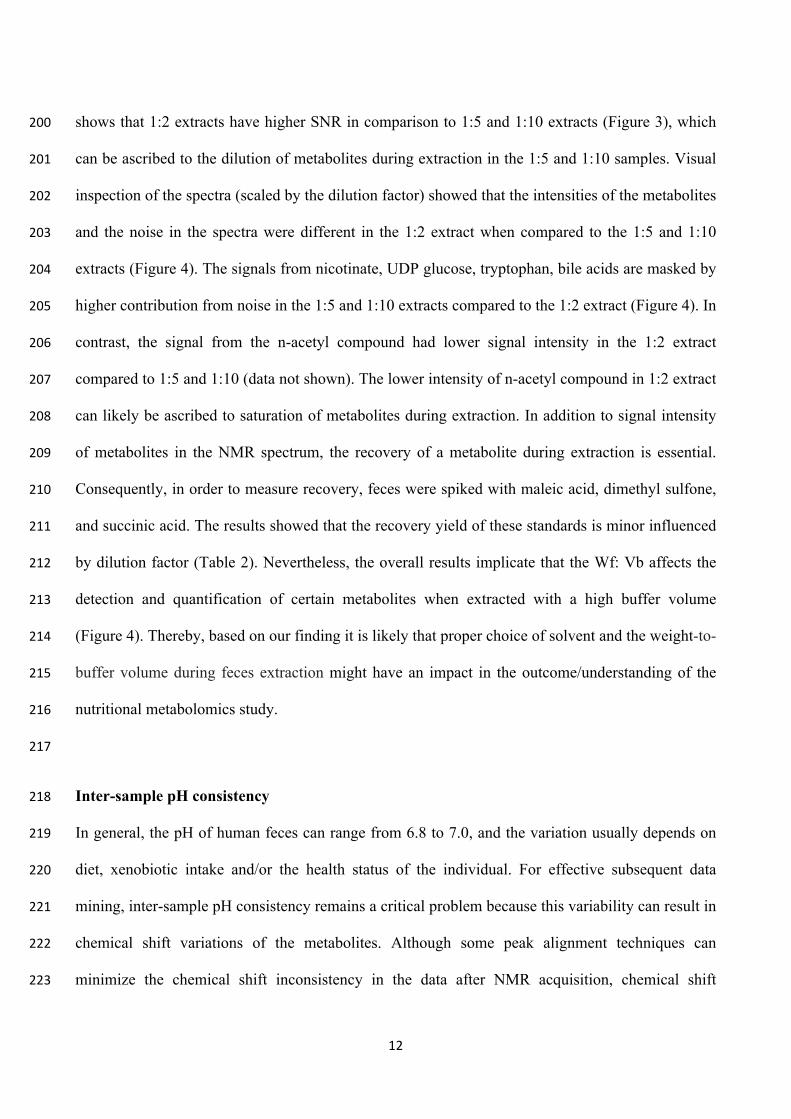
12
shows that 1:2 extracts have higher SNR in comparison to 1:5 and 1:10 extracts (Figure 3), which 200
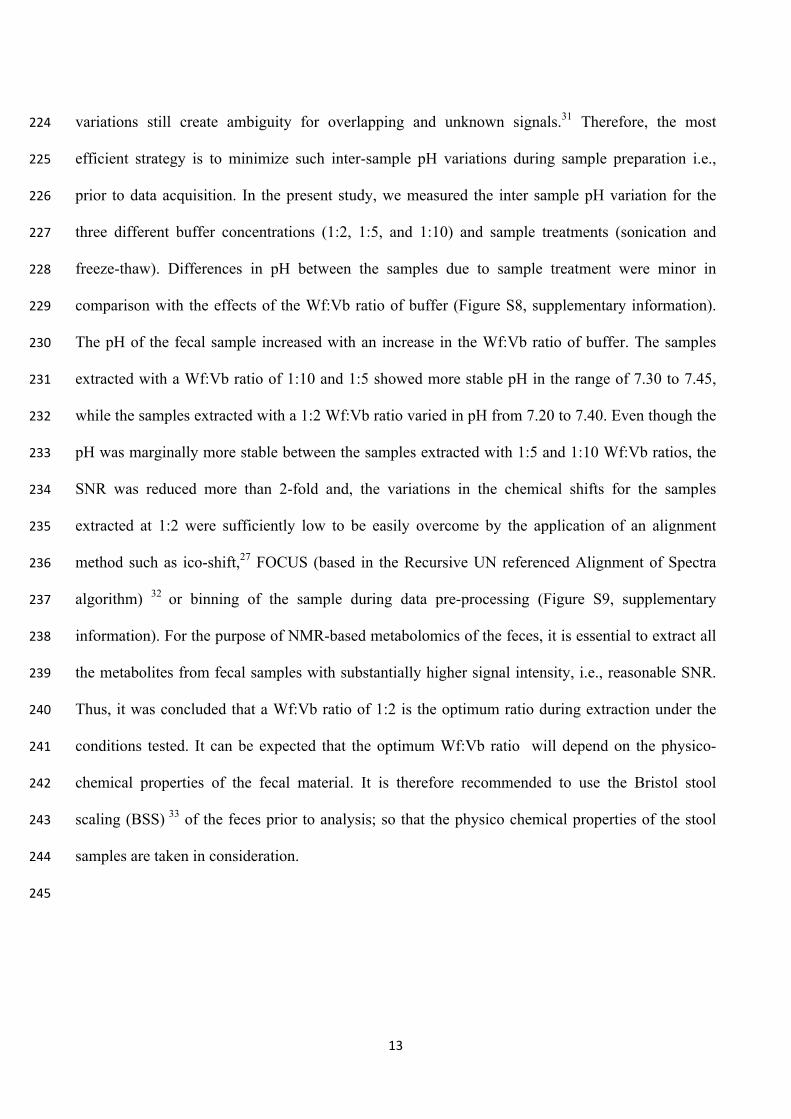
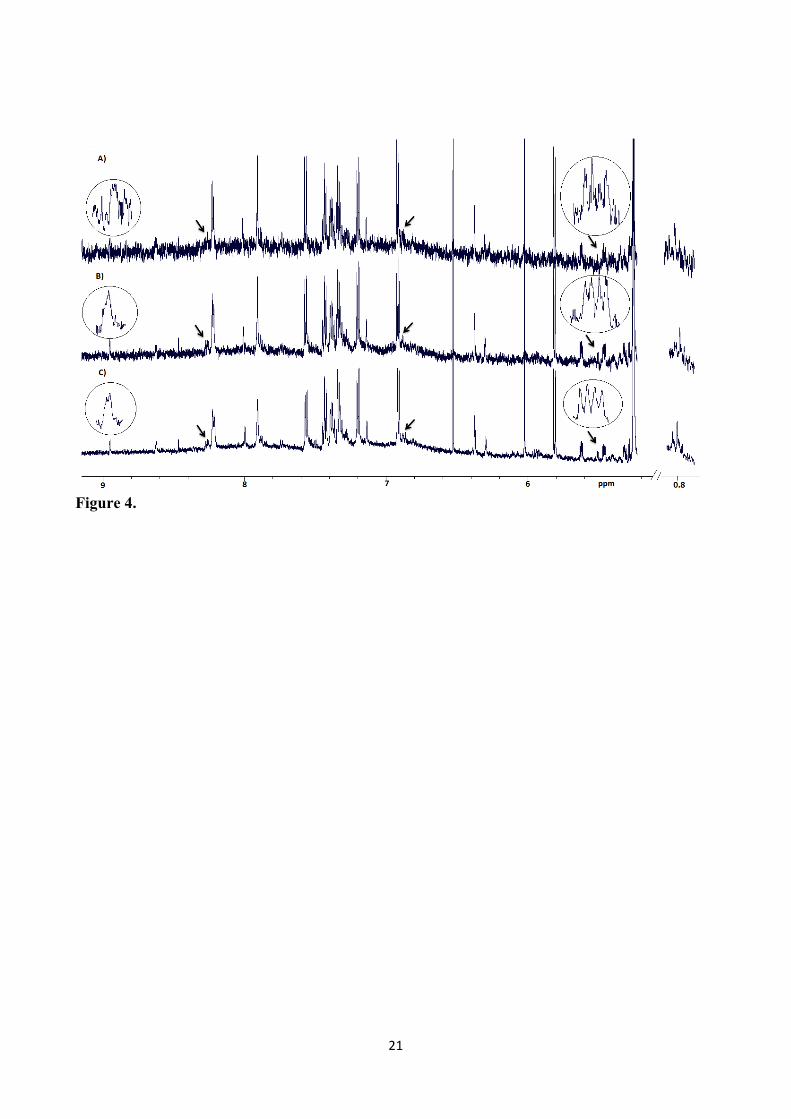
can be ascribed to the dilution of metabolites during extraction in the 1:5 and 1:10 samples. Visual 201
inspection of the spectra (scaled by the dilution factor) showed that the intensities of the metabolites 202
and the noise in the spectra were different in the 1:2 extract when compared to the 1:5 and 1:10 203
extracts (Figure 4). The signals from nicotinate, UDP glucose, tryptophan, bile acids are masked by 204
higher contribution from noise in the 1:5 and 1:10 extracts compared to the 1:2 extract (Figure 4). In 205
contrast, the signal from the n-acetyl compound had lower signal intensity in the 1:2 extract 206
compared to 1:5 and 1:10 (data not shown). The lower intensity of n-acetyl compound in 1:2 extract 207
can likely be ascribed to saturation of metabolites during extraction. In addition to signal intensity 208
of metabolites in the NMR spectrum, the recovery of a metabolite during extraction is essential. 209
Consequently, in order to measure recovery, feces were spiked with maleic acid, dimethyl sulfone, 210
and succinic acid. The results showed that the recovery yield of these standards is minor influenced 211
by dilution factor (Table 2). Nevertheless, the overall results implicate that the Wf: Vb affects the 212
detection and quantification of certain metabolites when extracted with a high buffer volume 213
(Figure 4). Thereby, based on our finding it is likely that proper choice of solvent and the weight-to-214
buffer volume during feces extraction might have an impact in the outcome/understanding of the 215
nutritional metabolomics study.216
217
Inter-sample pH consistency 218
In general, the pH of human feces can range from 6.8 to 7.0, and the variation usually depends on 219
diet, xenobiotic intake and/or the health status of the individual. For effective subsequent data 220
mining, inter-sample pH consistency remains a critical problem because this variability can result in 221
chemical shift variations of the metabolites. Although some peak alignment techniques can 222
minimize the chemical shift inconsistency in the data after NMR acquisition, chemical shift 223
13
variations still create ambiguity for overlapping and unknown signals.31 Therefore, the most 224
efficient strategy is to minimize such inter-sample pH variations during sample preparation i.e., 225
prior to data acquisition. In the present study, we measured the inter sample pH variation for the 226
three different buffer concentrations (1:2, 1:5, and 1:10) and sample treatments (sonication and 227
freeze-thaw). Differences in pH between the samples due to sample treatment were minor in 228
comparison with the effects of the Wf:Vb ratio of buffer (Figure S8, supplementary information). 229
The pH of the fecal sample increased with an increase in the Wf:Vb ratio of buffer. The samples 230
extracted with a Wf:Vb ratio of 1:10 and 1:5 showed more stable pH in the range of 7.30 to 7.45, 231
while the samples extracted with a 1:2 Wf:Vb ratio varied in pH from 7.20 to 7.40. Even though the 232
pH was marginally more stable between the samples extracted with 1:5 and 1:10 Wf:Vb ratios, the 233
SNR was reduced more than 2-fold and, the variations in the chemical shifts for the samples 234
extracted at 1:2 were sufficiently low to be easily overcome by the application of an alignment 235
method such as ico-shift,27 FOCUS (based in the Recursive UN referenced Alignment of Spectra 236
algorithm) 32 or binning of the sample during data pre-processing (Figure S9, supplementary 237
information). For the purpose of NMR-based metabolomics of the feces, it is essential to extract all 238
the metabolites from fecal samples with substantially higher signal intensity, i.e., reasonable SNR. 239
Thus, it was concluded that a Wf:Vb ratio of 1:2 is the optimum ratio during extraction under the 240
conditions tested. It can be expected that the optimum Wf:Vb ratio will depend on the physico-241
chemical properties of the fecal material. It is therefore recommended to use the Bristol stool 242
scaling (BSS) 33 of the feces prior to analysis; so that the physico chemical properties of the stool 243
samples are taken in consideration. 244
245
14
Reproducibility 246
To address the suitability of a methodology to profile metabolites in metabolomics studies, the 247
reproducibility of the method should be evaluated. Pareto-scaled normalized NMR spectra obtained 248
at three different time points from 5 individuals (extracted with a Wf:Vb ratio of 1:2) were analyzed 249
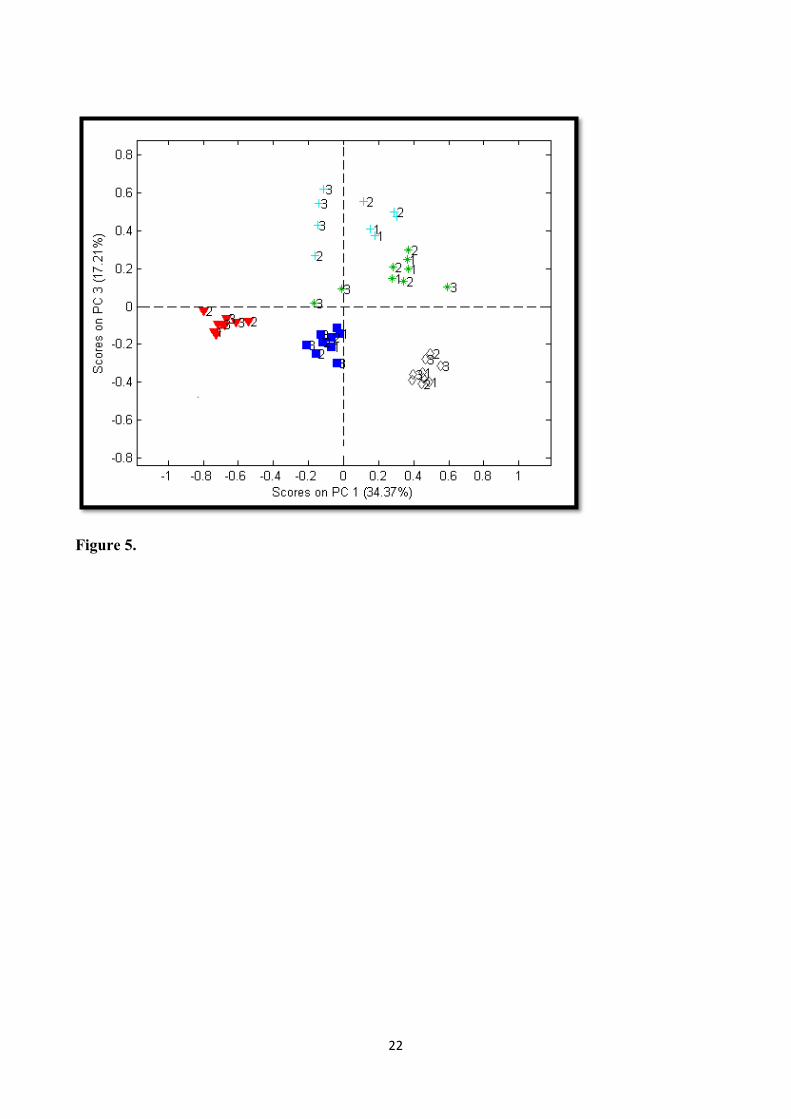
by multivariate data analysis to elucidate the reproducibility of the method. The PCA score plot in 250
Figure 5 shows that the individual samples (represented by the colors) were clustered together 251
depicting the reproducibility of the extraction methodology. In addition, the data from this study 252
also revealed distinct inter-individual variation supporting the fact that the sample preparation 253
method was capable of detecting and identifying metabolic differences among individuals. 254
Intriguingly, the samples from two subjects (depicted as green and cyan) did not cluster together as 255
observed for the other three subjects (Figure 5). During extraction, the presence of undigested food 256
residuals were clearly observed in these samples compared to the rest of other samples. The 257
presence of these food residuals could affect the NMR profile of the fecal extract. Therefore, it may 258
be worthwhile to perform BSS which could for instance indicate that the observed differences 259
within the samples may be due to larger variation in the stool consistency of the individuals. 260
261
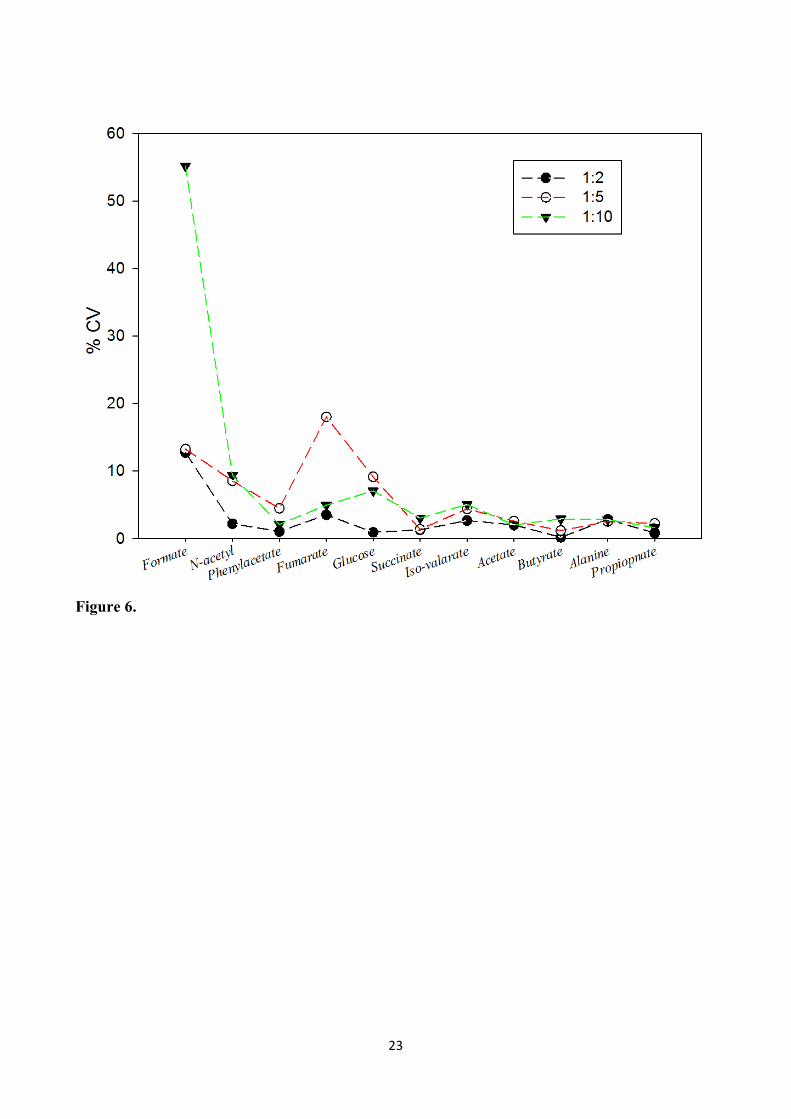
To eliminate inter-individual differences and assess the reproducibility performance of the 262
metabolites, extraction was done in triplicate using different Wf: Vb ratio (1:2, 1:5, and 1:10) from 263
the feces of same individual. The coefficient of variation (% CV) of eleven different metabolites 264
was determined (Figure 6). The majority of the metabolites show low and similar % CV 265
independent of the buffer dilutions. However, fumarate (≈55 %) and formate (≈18 %) displayed 266
considerably higher % CV when extracted at 1:5 and 1:10 dilution ratio respectively, when 267
compared to metabolites extracted with the 1:2 dilution ratio. This could possibly be ascribed to the 268
difference in the pH between the samples extracted in Wf: Vb ratio of 1:10 and 1:5, and 1:2 as seen 269

15
previously. This difference most probably affected the recoveries of fumarate and formate, 270
indicating they were preferentially extracted in lower pH. Considering the recovery would be 271
different for specific class of compound, the main purpose for metabolic profiling/metabolomics 272
study is to obtain reproducible spectra that can be on compared with each other. Intriguingly, based 273
on our results, it is also noteworthy that Wf: Vb ratio of 1:2 showed reproducible result during 274
extraction under the conditions tested. Thus, we suggest that the Wf: Vb ratio affects the 275
reproducibility of certain metabolites when extracted with a diluted buffer. 276
277
Fecal NMR profile stability study 278
The NMR experiments may last from a few minutes to hours of acquisition time. During NMR 279
acquisition, the metabolites might change over time due to either enzymatic or non-enzymatic 280
processes. Thus, it is essential to elucidate spectral changes that might occur over time. Therefore, 281
1H NMR spectra were acquired over a period of 12 hours by repeating the acquisition at regular 282
intervals of 2 hours (Figure S10 and S11). The obtained spectra were analyzed by overlaying the 283
spectra from all acquired time points. The results showed that the metabolite profile of the fecal 284
extracts remained stable over the 12 h period. 285
286
Conclusions 287
Fecal-based metabolomics is a rapidly emerging discipline. An optimized sample preparation is 288
crucial for metabolomics studies, and here we suggest buffer extraction might be the most suitable 289
approach to extract metabolic information in the feces. The study demonstrates that a Wf:Vb ratio 290
of 1:2 might be optimal quality for 1H NMR spectroscopic data for metabolomics data of human 291
feces, while the effects of sonication and freeze-thaw were less pronounced of the condition tested. 292

16
More than 60 metabolites have been assigned from the 1H NMR spectra obtained, and to our 293
knowledge, some of the metabolites are reported here for the very first time using NMR spectra 294
acquired on fecal extracts. 295
296
Acknowledgement 297
The present study is part of the Ph.D. work of Santosh Lamichhane and was financially supported 298
by DuPont, Food Future Innovation (FFI), and Aarhus University. The authors also wish to thank 299
the Danish research council FTP for financial support through the project ‘Advances in food and 300
nutrition research through implementation of metabolomics technologies’ (#274-09-0107)’. The 301
800 MHz spectra NMR spectra were obtained at the Danish Instrument Center for NMR 302
spectroscopy of Biological Macromolecules. 303
Supporting Information Available 304
Supplementary method section on metabolite extraction methods and Figure S1 to S11. This 305information is available free of charge via the Internet at http://pubs.acs.org/ 306
307
17
Figure Captions
Figure 1. Representative 1H NMR spectrum of a human fecal sample extracted in PBS buffer. A)
0.7 to 4.55 ppm; B) 4.9 to 8.55 ppm C) 8.6 to 9.8 ppm. The aromatic region in the spectrum (8.6 to
9.8 ppm) has been magnified three times as compared to the region B. The inserts show additional
signals detected in spectra obtained on other human fecal samples. Keys to the figure are given in
Table 2.
Figure 2. Representative 1H NMR spectrum of a human fecal sample extracted in organic (chloroform) phase in the methanol/chloroform/water extract. A) 5.7 to 4.7, double bond section; UFA = unsaturated fatty acids; TAG = triacylglycerides, Glyc-B = glycerol backbone of phospholipid. B) 4.4 to 2.8 regions; PC = phosphatidylcholine. C) Alkyl and Acyl saturated chains
Figure 3. Average SNR ratios from the fecal extracts with different Wf: Vb and obtained with sonication and without sonication, respectively (n=4). The alanine signal at 1.44 ppm was used for the calculation of SNR. Error bars show standard deviations. Figure 4. Representative 1H NMR spectra of human fecal extracts with varying Wf: Vb ratios A) 1:10 B) 1:5 C) 1:2.
Figure 5. PCA scores plot showing reproducibility for fecal extracts with Wf: Vb ratio 1:2. Each symbol represents an individual. The number 1, 2, 3 illustrates the samples from same individual collected during 3 different time periods.
Figure 6. The coefficient of variation (% CV) of eleven different metabolites from NMR measurement of the fecal extract (three different buffer dilutions 1:2, 1:5, and 1:10).
18
Figure 1.

19
Figure 2.

20
Figure 3.
21
Figure 4.
22
Figure 5.
23
Figure 6.
24
Table 1. 1H NMR Chemical Shifts and Assignments of Metabolites Detected in Human Fecal Extracts
No. Compound Proton Chemical shift in ppm and multiplicity
1 2 3 4 5 6 7 8 9 10 11 12 13 14 15 16 17 18 19 20 21 22 23 24 25 26 27 28 29 30 31 32 33 34 35 36 37 38 39 40 41 42
2-methyl butyrate a caprylate valerate n-butyrate leucine iso-leucine valine propionate methyl succinate iso butyrate ethanol 3-methyl 2oxovalerate a threonine lactate acetoin iso-caproate alanine cadavarine lysine unknown singlet thymine arginine acetate n-acetylglutamate iso-valerate glutamate succinate glutamine 5 aminopentonate a methionine sarcosine a aspartate trimethylamine 3-phenylpropionate a malonate choline proline ornithine glucose glycerol glycine ribose
0.86 (t), 1.05 (d), 1.38 (m) , 1.5 (m), 2.21 (m) 0.85 (t), 1.27(m), 1.53 (m), 2.16(t) 0.88 (t), 1.31(m), 1.54 (m), 2.18 (m) 0.91 (t), 1.56(t), 2.16 (t) 0.96 (d), 0.97(d), 1.7 (m) 0.94 (t), 1.02 (d), 1.27 (m) 0.99 (d), 1.05(d), 2.3 (m) 1.06 (t), 2.19 (m) 1.08 (d), 2.11 (dd), 2.51 (d), 2.61 (m) 1.12 (d), 2.40 (m) 1.18 (t), 3.6 (q) 0.89 (t), 1.10 (d), 1.46 (m), 1.70 (m), 2.93 (m) 1.33 (d), 3.57 (d), 4.24 (m) 1.31 (d), 4.1 (q) 1.37 (d), 2.20 (s), 4.42(q) 0.88 (d), 1.45 (m), 1.49 (m), 2.19 (t) 1.48 (d), 3.78 (q) 1.46 (m), 1.73 (m), 3.02 (m) 1.40 (m), 1.70 (m), 3.03 (t), 3.72 (t) 1.81 (s) 1.87 (s), 7.39(s) 1.68 (m), 1.91 (m), 3.23 (t), 3.76 (t) 1.92 (s) 2.02 (s), 2.05 (m),4.1 (m) 2.06 (d), 1.98 (m), 0.91 (d) 2.14 (m), 2.46 (m), 3.78 (m) 2.41 (s) 2.12 (m), 2.44 (m), 3.75 (t) 3.02 (t), 2.21 (t), 1.69 (m), 1.65 (m) 2.15 (m), 2.63 (t), 3.85 (dd) 2.72 (s), 3.6 (s) 2.69 (dd), 2.82 (dd), 3.91 (dd) 2.87 (s) 2.87 (t), 2.47 (t), 7.26 (t), 7.32 (d), 7.36 (t) 3.11 (s) 3.27 (s), 3.53 (m) 1.98 (m), 2.06 (m), 2.34 (m), 3.32 (dt), 3.34 (m) 1.72 (m), 1.82 (m), 1.93 (m), 3.03 (t), 3.77 (t) 3.40 (t), 3.53 (dd), 3.71 (t) 3.73 (dd), 3.83(m), 5.24(d) 3.64 (m), 3.78 (m) 3.57 (s) 3.52 (m), 3.60(m), 3.91 (m), 4.10 (m), 4.20 (dd), 4.92 (d), 5.25 (d),

25
a Assignment with best matched signals
43 44 45 46 47 48 49 50 51 52 53 54 55 56 57 58 59 60 61 62 63 64 65 66 67 68 69 70
dihydroxyacetone xylose galactose uracil fumarate tyrosine histidine phenylalanine xanthine hypoxanthine formate nicotinate p-cresol putresine urocanic acid a dimethylamine 3 hydoxyphenlyacetate a tryptophan bile acid UDP glucose a glutarate malic acid orotic acid n-acetyl group’s ethanolamine allantion a glycerophosphocholine arabinose
4.41(s) 5.19 (d), 4.57 (d), 3.92(dd), 3.89(dd), 5.18(d), 3.31(d) 3.54(dd), 3.65(dd), 3.72(m), 3.82(m), 4.06(t), 5.26(d) 5.78 (d), 7. 49 (d) 6.52 (s) 6.91 (d), 7.20 (d) 3.16 (dd), 3.23 (dd), 3.98 (dd), 6..99 (d), 7.83 (s) 3.54 (s), 7.31 (m), 7.37 (m) 7.94 (s) 8.12 (s), 8.21 (s) 8.46 (s) 7.56 (dd), 8.28 (m), 8.66 (dd), 8.94 (d) 2.25 (s), 6.87 (m), 7.18(d), 1.77 (m), 3.06 (m) 6.38 (d), 7.27 (d), 7.87 (s) 2.74 (s) 3.56 (s), 6.93 (m), 7.21 (m) 7.19 (m), 7.31 (m), 7.53 (d), 7.76 (d) 0.78 (m) 5.62 (dd), 6.0 (m), 1.8 (t), 2.19 (t) 2.33 (dd), 2.65 (dd), 4.28(dd) 6.19 (s) 2.04 (s).7,88 (s) 3.12 (t), 3.80 (t) 5.38 (s) 3.19 (s) 5.24(d), 4.52 (d), 3.95(m), 3.89(m), 3.52(dd)

26
Table 2. Comparison of Yields of Standard Compounds with Different Wf: Vb during Extraction
308
309
310
311
Means (±) SD determined from the integrals of the compounds relative to that of maleic acid
Standards Wf:Vb Wf:Vb Wf:Vb
1:2 1:5 1:10
Sucincate 3.06±0.02 3.11±0.04 3.06±0.09
Dimthylsulphone 3.51±0.05 3.48±0.02 3.50±0.05
27
References
(1) Averna, T. A.; Kline, E. E.; Smith, A. Y.; Sillerud, L. O. J. Urol. 2005, 173, 433-438.
(2) Beckonert, O.; Keun, H. C.; Ebbels, T. M.; Bundy, J.; Holmes, E.; Lindon, J. C.; Nicholson, J.
K. Nat. Protoc 2007, 2, 2692-2703.
(3) Bertram, H. C.; Eggers, N.; Eller, N. Anal. Chem 2009, 81, 9188-9193.
(4) Bertram, H. C.; Malmendal, A.; Petersen, B. O.; Madsen, J. C.; Pedersen, H.; Nielsen, N. C.;
Hoppe, C.; Mølgaard, C.; Michaelsen, K. F.; Duus, J. Ø. Anal. Chem 2007, 79, 7110-7115.
(5) Bäckhed, F.; Ding, H.; Wang, T.; Hooper, L. V.; Gou, Y. K.; Nagy, A.; Semenkovich, C. F.;
Gordon, J. I. PNAS 2004, 101, 15718-15723.
(6) Gao, X.; Pujos-Guillot, E.; Sebedio, J. L. Anal. Chem 2010, 82, 6447-6456.
(7) Hooper, L. V.; Midwedt, T.; Gordon, J. I. In Ann. Rev. Nutr., 2002, pp 283-307.
(8) Nicholson, J. K.; Holmes, E.; Kinross, J.; Burcelin, R.; Gibson, G.; Jia, W.; Pettersson, S.
Science 2012, 336, 1262-1267.
(9) Turnbaugh, P. J.; Ley, R. E.; Mahowald, M. A.; Magrini, V.; Mardis, E. R.; Gordon, J. I. Nature
2006, 444, 1027-1031.
(10) Rath, C. M.; Alexandrov, T.; Higginbottom, S. K.; Song, J.; Milla, M. E.; Fischbach, M. A.;
Sonnenburg, J. L.; Dorrestein, P. C. Anal. Chem 2012, 84, 9259-9267.
(11) Gregory, K. E.; Bird, S. S.; Gross, V. S.; Marur, V. R.; Lazarev, A. V.; Walker, W. A.; Kristal,
B. S. Anal. Chem 2013, 85, 1114-1123.
(12) Rezzi, S.; Ramadan, Z.; Fay, L. B.; Kochhar, S. J. Proteome Res. 2007, 6, 513-525.
(13) Lamichhane, S.; Yde, C. C.; Forssten, S.; Ouwehand, A. C.; Saarinen, M.; Jensen, H. M.;
Gibson, G. R.; Rastall, R.; Fava, F.; Bertram, H. C. J Agri Food Chem 2014, 62, 9944-9951.
(14) Le Gall, G.; Noor, S. O.; Ridgway, K.; Scovell, L.; Jamieson, C.; Johnson, I. T.; Colquhoun, I.
J.; Kemsley, E. K.; Narbad, A. J. Proteome Res. 2011, 10, 4208-4218.
28
(15) Marchesi, J. R.; Holmes, E.; Khan, F.; Kochhar, S.; Scanlan, P.; Shanahan, F.; Wilson, I. D.;
Wang, Y. J. Proteome Res. 2007, 6, 546-551.
(16) Monleón, D.; Morales, J. M.; Barrasa, A.; López, J. A.; Vázquez, C.; Celda, B. NMR Biomed.
2009, 22, 342-348.
(17) Martin, F. P. J.; Sprenger, N.; Montoliu, I.; Rezzi, S.; Kochhar, S.; Nicholson, J. K. J.
Proteome Res. 2010, 9, 5284-5295.
(18) Jacobs, D. M.; Deltimple, N.; van Velzen, E.; van Dorsten, F. A.; Bingham, M.; Vaughan, E.
E.; van Duynhoven, J. NMR Biomed. 2008, 21, 615-626.
(19) Saric, J.; Wang, Y.; Li, J.; Coen, M.; Utzinger, J.; Marchesi, J. R.; Keiser, J.; Veselkov, K.;
Lindon, J. C.; Nicholson, J. K.; Holmes, E. J. Proteome Res. 2008, 7, 352-360.
(20) Pettersson, J.; Karlsson, P. C.; Choi, Y. H.; Verpoorte, R.; Rafter, J. J.; Bohlin, L. Biol. Pharm.
Bullet. 2008, 31, 1192-1198.
(21) Ndagijimana, M.; Laghi, L.; Vitali, B.; Placucci, G.; Brigidi, P.; Guerzoni, M. E. Int. J. Food
Microbiol. 2009, 134, 147-153.
(22) Romick-Rosendale, L. E.; Goodpaster, A. M.; Hanwright, P. J.; Patel, N. B.; Wheeler, E. T.;
Chona, D. L.; Kennedy, M. A. Magn. Reson. Chem. 2009, 47, S36-S46.
(23) Zhao, Y.; Wu, J.; Li, J. V.; Zhou, N. Y.; Tang, H.; Wang, Y. J. Proteome Res. 2013, 12, 2987-
2999.
(24) Wu, J.; An, Y.; Yao, J.; Wang, Y.; Tang, H. Analyst 2010, 135, 1023-1030.
(25) Wishart, D. S.; Knox, C.; Guo, A. C.; Eisner, R.; Young, N.; Gautam, B.; Hau, D. D.;
Psychogios, N.; Dong, E.; Bouatra, S.; Mandal, R.; Sinelnikov, I.; Xia, J.; Jia, L.; Cruz, J. A.; Lim,
E.; Sobsey, C. A.; Shrivastava, S.; Huang, P.; Liu, P.; Fang, L.; Peng, J.; Fradette, R.; Cheng, D.;
Tzur, D.; Clements, M.; Lewis, A.; de souza, A.; Zuniga, A.; Dawe, M.; Xiong, Y.; Clive, D.;

29
Greiner, R.; Nazyrova, A.; Shaykhutdinov, R.; Li, L.; Vogel, H. J.; Forsythei, I. Nucleic Acids Res.
2009, 37, D603-D610.
(26) Bojstrup, M.; Petersen, B. O.; Beeren, S. R.; Hindsgaul, O.; Meier, S. Anal. Chem. 2013, 85,
8802-8808.
(27) Savorani, F.; Tomasi, G.; Engelsen, S. B. J. Magn. Reson. 2010, 202, 190-202.
(28) Harwood L.J ; Weselake J. R, 1H NMR spectroscopy of fatty acids and their derivatives
[Online] 2005, http://lipidlibrary.aocs.org/nmr/1NMRintr/index.htm (accessed Feb 26, 2015).
(29) Willker, W.; Leibfritz, D. Magn. Reson. Chem 1998, 36, S79-S84.
(30) Pulkkinen, M. O.; Nyman, S.; Hamalainen, M. M.; Mattinen, J. Gynecolo Obstet Invest 1998,
46, 220-224.
(31) Vu, T. N.; Laukens, K. Metabolites 2013, 3, 259-276.
(32) Alonso, A.; Rodriguez, M. A.; Vinaixa, M.; Tortosa, R.; Correig, X.; Julia, A.; Marsal, S. Anal.
Chem 2014, 86, 1160-1169.
(33) Lewis, S. J.; Heaton, K. W. Scand. J Gastro. 1997, 32, 920-924