Embed Size (px)
Citation preview
FUCAPE WORKING PAPERS
Strategy Disclosure in the Annual Reports of
Brazilian Companies
Marcelo Sanches Pagliarussi (FUCAPE Business School)
Antonio Carlos Aguiar Gagno Junior (FUCAPE Business School)
Antonio Thadeu Mattos da Luz (FUCAPE Business School)
WWW.WATSONWYATT.COMNo.28 / (Dezembro) 2010
© Copyright 2008 Autores http://www.fucape.br/texto_discussao.asp
1
Strategy Disclosure in the Annual Reports of Brazilian Companies
Marcelo Sanches Pagliarussi Associate Professor Fucape Business School Av. Fernando Ferrari, 1358, Boa Vista Vitória – ES 29075-010 Brazil E-mail address: [email protected] Antonio Carlos Aguiar Gagno Junior Fucape Business School Av. Fernando Ferrari, 1358, Boa Vista Vitória – ES 29075-010 Brazil E-mail address: [email protected] Antonio Thadeu Mattos da Luz Fucape Business School Av. Fernando Ferrari, 1358, Boa Vista Vitória – ES 29075-010 Brazil E-mail address: [email protected]
Summary
In this study we describe how listed Brazilian companies disclose information about their
strategy in annual reports. From the literature on operations strategy, we developed eight
proxies and their respective keywords for strategy disclosure. Keyword frequencies were
measured using an automatic procedure. We used cluster analysis to identify strategic groups
and multinomial logistic regression to discriminate the groups using economic performance
variables. From a sample of 450 annual reports, we obtained four groups of companies. Only
two of them have clearly defined strategic positioning. We concluded that the quality of
strategy disclosure offered by Brazilian companies is low.
2
1 – Introduction
Despite its relevance for investors, the disclosure of a company’s strategy may
represent a cost, as it can potentially reveal proprietary information. In this sense, companies
have to choose to what extent they want to reveal their strategy. On the one hand, investment
analysts and individual or institutional investors need information to evaluate a company’s
potential for generating value. On the other hand, competitors may benefit from information
disclosed and anticipate a company’s strategic moves.
This study aimed to investigate the disclosure of strategic information in the annual
reports of companies listed on the São Paulo Stock Exchange (BOVESPA). We found only
one previous study focused on the disclosure of strategic information. Santema & Van de Rijt
(2001) analyzed Dutch companies’ annual reports and found that companies provided little
information about their goals, plans or future actions.
We offer two contributions to the literature. First, we introduce eight dimensions
derived from the literature on operations strategy to analyze strategy disclosure in annual
reports. Second, we have developed a process to quantify strategy disclosure by means of
computerized thematic content analysis.
The resulting process allowed us to describe how listed Brazilian companies disclose
information about their strategies in eight dimensions, namely: product cost; operational
process cost; quality compliance; design for quality; volume flexibility; product mix
flexibility; new product launch speed; and new product development speed.
To assess the robustness of our process for strategy disclosure quantification, we used
cluster analysis to identify strategic groups. We used keyword frequencies for the eight
strategy disclosure dimensions mentioned. We also applied multinomial logistic regression to
discriminate the identified groups relative to their economic performance, according to the
3
propositions of Ward & Duray (2000), who stated that there is a positive relationship between
a firm’s strategic orientation for quality and its performance.
The results obtained allowed identification of two groups with a clear-cut strategic
positioning, one competing through low cost and another through consistent quality. A third
group presents an inclination towards differentiation, although without a clearly identifiable
positioning. And a fourth group was identified, formed by companies that do not disclose
their competitive strategy in annual reports.
The robustness of the procedure introduced here is reinforced by the fact that the
groups identified by means of the measures of strategic disclosure match those theoretically
foreseen by the literature. Additionally, the analysis using observable performance variables
confirmed the results obtained in previous studies that relate competitive positioning through
an emphasis on quality to superior economic performance.
2 – Strategy disclosure in corporate annual reports
Studies on disclosure using annual reports have been motivated by the importance of
this instrument in communicating the financial performance of companies and in the
reduction of information asymmetry, bringing together common interests of stakeholders and
managers (Arrows, 1984; Beretta & Bozzolan, 2008).
The complex (Healy & Palepu, 2001) and multifarious (beattie et al., 2004) nature of
disclosure quality has prompted a number of studies about effective ways to establish
guidelines for its evaluation (Beattie et al., 2004; Beretta & Bozzolan, 2008).
Santema and Van de Rijt (2001) analyzed Dutch companies’ annual reports and found
that their strategy disclosure quality was poor, providing little information about goals, plans
or future actions. Santema, Hoekert, Van de Rijt and Van Oijen (2005) examined the
influence of national differences, corporate governance and culture on the extent of strategy
disclosure. Narrative sections of annual reports of a hundred companies in the United
4
Kingdom, France, Germany, Poland and the Netherlands were analyzed and the results
indicated that national differences do influence the extent to which firms disclose strategies in
their annual reports.
3 – Strategy
Strategy is an administrative technique to achieve results consistent with the mission
and goals of the organization (Wright, Kroll & Parnell, 1998). To be effective, strategy must
be clear, focused and should define the competitive priorities adopted by a company (Skinner,
1969).
The present study is based on the proposition that strategy comprises a set of actions
taken and also the procedures whereby the actions are implemented (Chaffee, 1985). Using
Porter’s generic competitive strategy as a starting point, Thompson & Strickland (2000)
identified five competitive stances. The first is low-cost orientation, which seeks to minimize
the general cost of products and services in order to attract a wide range of buyers. The
second uses a strategy of major differentiation, in which companies seek to make it easy to
distinguish between their products and those of competitors. The third is the strategic
positioning of a supplier offering the best cost, where a company seeks to offer its clients the
best value for their money. It combines an emphasis on low cost with differentiation. The
fourth strategic position is that of market niche combined with low costs. The fifth and last
type is the strategy of focus or market niche based on differentiation.
Functional strategies are assumed to support the overall business strategy and operate
as a competitive tool for a company (Slack, Chambers & Johnston, 2007). The present work
will tackle operational functional strategy – also known as manufacturing or production
strategy.
Schroeder (1986) postulated that production strategy is a particular vision of the
production function that takes overall directions into consideration. The production strategy
5
should result in a consistent pattern of decisions for production and competitive advantage for
the organization. The manufacturing strategy should establish production techniques, physical
arrangements and types of industrial plants, machinery and equipment that fulfill the needs of
efficient production (Skinner, 1969).
The following section discusses competitive priorities and the dimensions of
operations strategy.
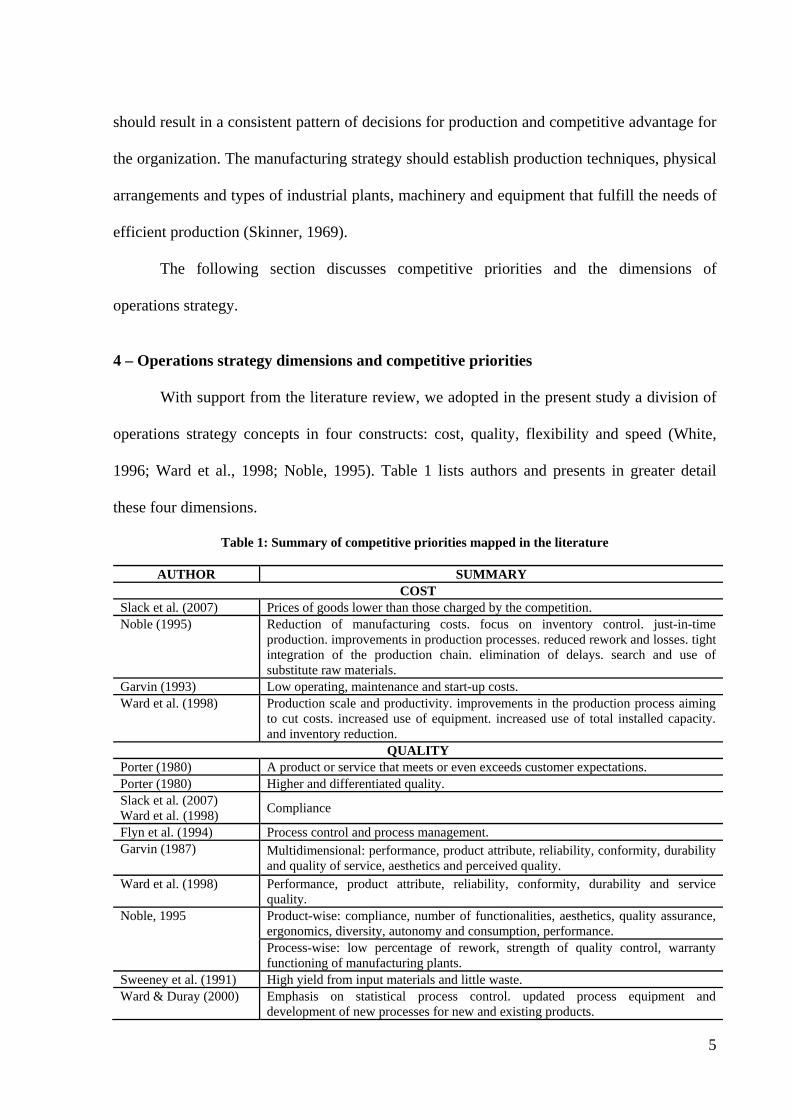
4 – Operations strategy dimensions and competitive priorities
With support from the literature review, we adopted in the present study a division of
operations strategy concepts in four constructs: cost, quality, flexibility and speed (White,
1996; Ward et al., 1998; Noble, 1995). Table 1 lists authors and presents in greater detail
these four dimensions.
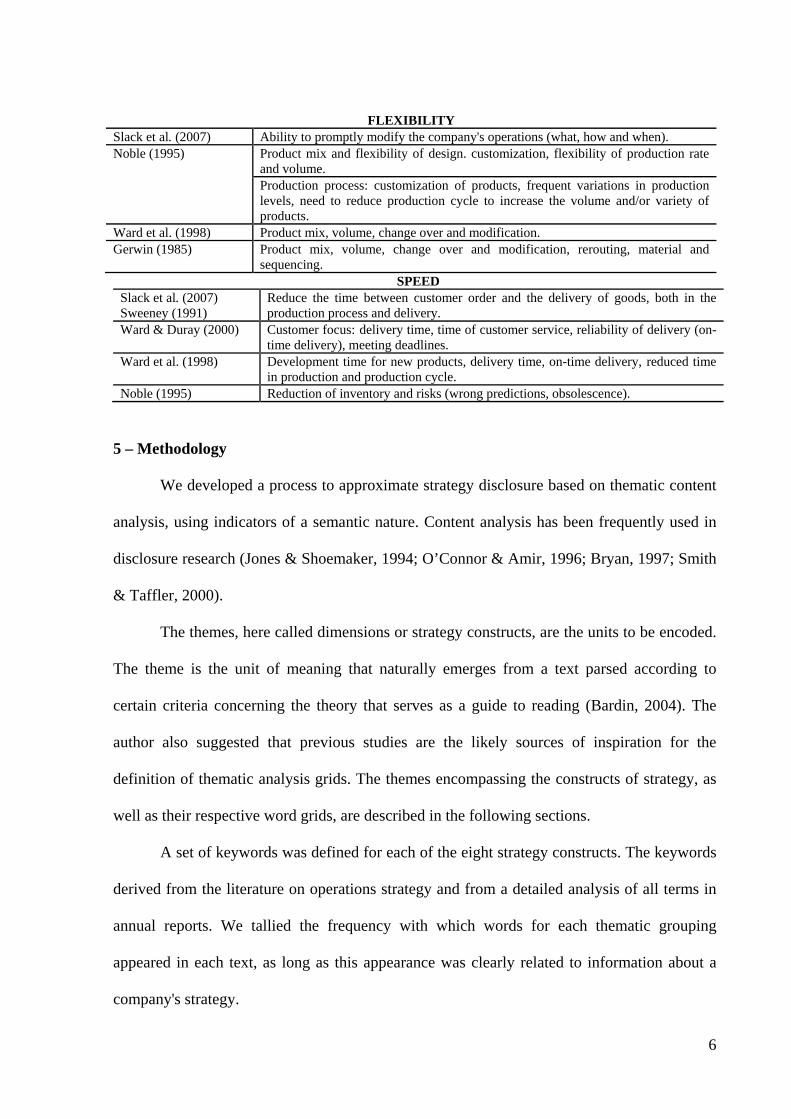
Table 1: Summary of competitive priorities mapped in the literature
AUTHOR SUMMARYCOST
Slack et al. (2007) Prices of goods lower than those charged by the competition. Noble (1995) Reduction of manufacturing costs. focus on inventory control. just-in-time
production. improvements in production processes. reduced rework and losses. tight integration of the production chain. elimination of delays. search and use of substitute raw materials.
Garvin (1993) Low operating, maintenance and start-up costs. Ward et al. (1998) Production scale and productivity. improvements in the production process aiming
to cut costs. increased use of equipment. increased use of total installed capacity. and inventory reduction.
QUALITYPorter (1980) A product or service that meets or even exceeds customer expectations. Porter (1980) Higher and differentiated quality.Slack et al. (2007) Ward et al. (1998) Compliance
Flyn et al. (1994) Process control and process management.Garvin (1987)
Multidimensional: performance, product attribute, reliability, conformity, durability and quality of service, aesthetics and perceived quality.
Ward et al. (1998) Performance, product attribute, reliability, conformity, durability and service quality.
Noble, 1995 Product-wise: compliance, number of functionalities, aesthetics, quality assurance, ergonomics, diversity, autonomy and consumption, performance. Process-wise: low percentage of rework, strength of quality control, warranty functioning of manufacturing plants.
Sweeney et al. (1991) High yield from input materials and little waste.Ward & Duray (2000) Emphasis on statistical process control. updated process equipment and
development of new processes for new and existing products.
6
SPEEDSlack et al. (2007) Sweeney (1991)
Reduce the time between customer order and the delivery of goods, both in the production process and delivery.
Ward & Duray (2000) Customer focus: delivery time, time of customer service, reliability of delivery (on-time delivery), meeting deadlines.
Ward et al. (1998) Development time for new products, delivery time, on-time delivery, reduced time in production and production cycle.
Noble (1995) Reduction of inventory and risks (wrong predictions, obsolescence).
5 – Methodology
We developed a process to approximate strategy disclosure based on thematic content
analysis, using indicators of a semantic nature. Content analysis has been frequently used in
disclosure research (Jones & Shoemaker, 1994; O’Connor & Amir, 1996; Bryan, 1997; Smith
& Taffler, 2000).
The themes, here called dimensions or strategy constructs, are the units to be encoded.
The theme is the unit of meaning that naturally emerges from a text parsed according to
certain criteria concerning the theory that serves as a guide to reading (Bardin, 2004). The
author also suggested that previous studies are the likely sources of inspiration for the
definition of thematic analysis grids. The themes encompassing the constructs of strategy, as
well as their respective word grids, are described in the following sections.
A set of keywords was defined for each of the eight strategy constructs. The keywords
derived from the literature on operations strategy and from a detailed analysis of all terms in
annual reports. We tallied the frequency with which words for each thematic grouping
appeared in each text, as long as this appearance was clearly related to information about a
company's strategy.
FLEXIBILITYSlack et al. (2007) Ability to promptly modify the company's operations (what, how and when).Noble (1995) Product mix and flexibility of design. customization, flexibility of production rate
and volume. Production process: customization of products, frequent variations in production levels, need to reduce production cycle to increase the volume and/or variety of products.
Ward et al. (1998) Product mix, volume, change over and modification.Gerwin (1985) Product mix, volume, change over and modification, rerouting, material and
sequencing.
7
5.1 – Constructs of competitive operations strategy
The four operations strategy constructs selected from the literature were:
differentiation by cost, differentiation by quality, differentiation by flexibility and
differentiation by speed (White 1996, Ward et al., 1998; Noble 1995).
We also noted that authors such as Ward & McCreery (1998), Garvin (1993),
Shawnee & Vickery (1994), Ward, Bickford & Leong (1995), Ward & McCreery (1998) and
Frohilch & Dixon (2001) subdivided competitive operations strategies into several
competitive capacities, allowing subdividing these four strategies in eight categories. These
eight resulting constructs can be defined as:
- Low product cost (PDC),
- Low process cost (PRC),
- Differentiation by quality of design (QOD),
- Differentiation by quality of conformity (QOC),
- Differentiation by flexibility of design (DFB),
- Differentiation by flexibility of volume (VOF),
- Differentiation by speed of distribution (SPD) and
- Differentiation by speed of development and launch of new products (SPL).
5.2 – Keywords
The literature review allowed us to identify keywords related to each pre-defined
competitive operations strategy dimension. The keywords formed the basis for the elaboration
of a standard table for individual analysis of each annual report. Reasons of space prevent the
presentation here of all the keywords used in the content analysis procedure, but they are
available upon request to the authors.
8
To expedite the search of the annual reports, we developed a computer program to
count the frequency of exact words (with more than four characters), using a simple logic and
the Python language. The Python programming language is an-open source language
developed and maintained by the Python Software Foundation, a non-profit entity.
The program performs search by proximity of keywords and pre-defined
complements. The count was scored when the complement occurred up to three words after
the keyword without being separated by punctuation marks like full stops, colons,
exclamation and question marks. For example: "Automation made possible significant and
important reduction in the cost of certain production processes ..." In this case, a hit was
recorded for the pre-defined compound word "reduction&cost&process", associated with the
dimension of process cost competitive strategy, because they are found up to three words
apart in the same sentence.
This parameter is adjustable, but several tests, using a sub-sample of thirty annual
reports, revealed that this distance gives the best results. Distances of less than three words
failed to capture several evidence and distances exceeding three words led to incorrect
associations.
5.3 – Cluster analysis
The thematic content analysis generated the frequency of simple and compound
keywords associated with each strategy construct. With these measures at hand, we developed
variables based on the observed frequencies for the eight constructs of operations strategy.
Then we applied a sequence of hierarchical and non-hierarchical clustering procedures to the
variables, in order to identify groups with distinct strategic orientation within the 450 annual
reports analyzed
9
The groups were defined by analysis of the incremental variation of the agglomeration
coefficient (ketchen & schook, 1996). The resulting dendograms, which are tree-like
graphical representations of the hierarchical procedure results, were also examined.
We employed two of many possible procedures for validation of grouping to ascertain
the reliability and effectiveness of the results. First, the data were randomly separated into two
groups, forming new separate collations, and these groups were compared. Afterwards,
variables were randomly deleted, the agglomeration method was once again applied to the
remaining ones, and the results were compared (Malhotra, 2001).
5.4 – Multinomial logistic regression
After defining groups with distinct strategic orientation, we used multinomial logit
regression to discriminate groups according to economic performance variables. The
multinomial logit model corresponds to the simultaneous estimation of binary logit models
involving all possible comparisons between categories (Long, 2001). Formally, the model is
written as (Long, 2001):
(1)
In equation (1), b is the base category or comparison group. The beta coefficient of the
base category is zero, as it represents the logarithm of the probability of that category’
occurrence in relation to itself. In the same equation, x represents one of the independent
variables selected to discriminate groups. The result for the model is (Long, 2001):
(2)
10
Equation (2) returns the probability that any given element y to belongs to category m,
given a value of x, in relation to base category b. Statistical software packages typically select
the most numerous as the base category, but the user can change this specification.
The multinomial logistic model was applied using the groups obtained (numbered 1 to
4) as the dependent variable, against the performance variables net margin (NM), gross
margin (GM), return on assets (ROA) and total assets (TA).
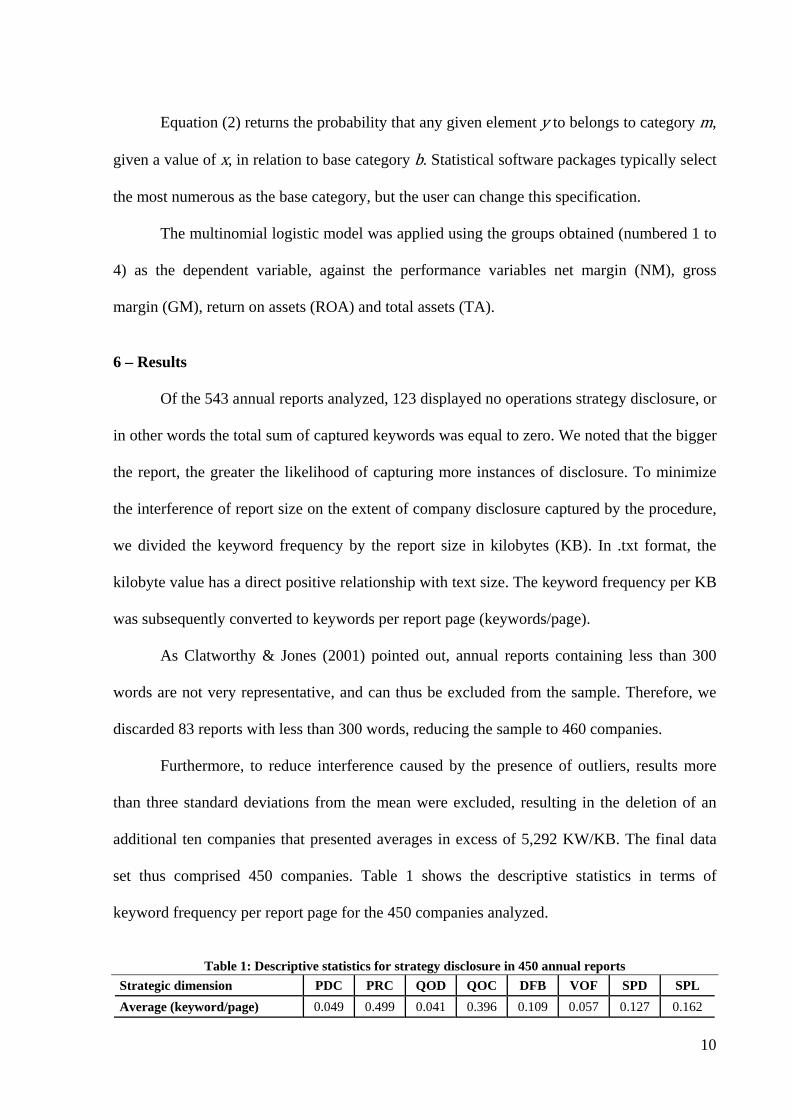
6 – Results
Of the 543 annual reports analyzed, 123 displayed no operations strategy disclosure, or
in other words the total sum of captured keywords was equal to zero. We noted that the bigger
the report, the greater the likelihood of capturing more instances of disclosure. To minimize
the interference of report size on the extent of company disclosure captured by the procedure,
we divided the keyword frequency by the report size in kilobytes (KB). In .txt format, the
kilobyte value has a direct positive relationship with text size. The keyword frequency per KB
was subsequently converted to keywords per report page (keywords/page).
As Clatworthy & Jones (2001) pointed out, annual reports containing less than 300
words are not very representative, and can thus be excluded from the sample. Therefore, we
discarded 83 reports with less than 300 words, reducing the sample to 460 companies.
Furthermore, to reduce interference caused by the presence of outliers, results more
than three standard deviations from the mean were excluded, resulting in the deletion of an
additional ten companies that presented averages in excess of 5,292 KW/KB. The final data
set thus comprised 450 companies. Table 1 shows the descriptive statistics in terms of
keyword frequency per report page for the 450 companies analyzed.
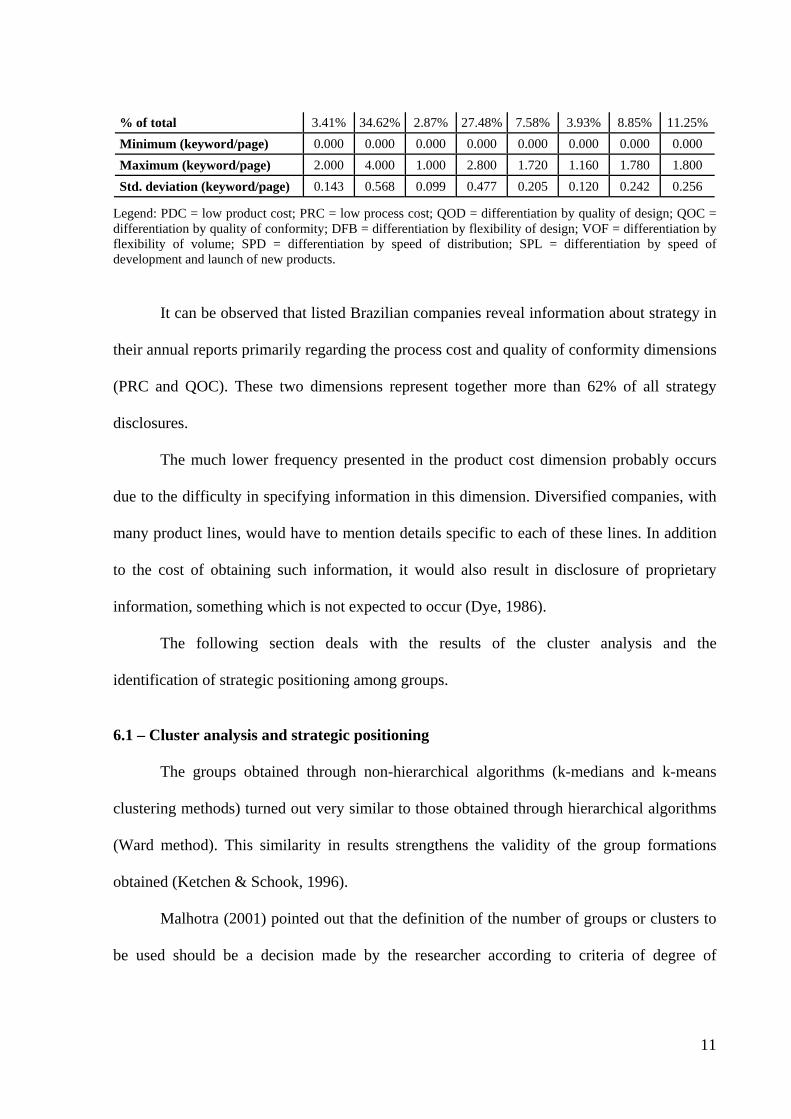
Table 1: Descriptive statistics for strategy disclosure in 450 annual reports
Strategic dimension PDC PRC QOD QOC DFB VOF SPD SPL
Average (keyword/page) 0.049 0.499 0.041 0.396 0.109 0.057 0.127 0.162
11
% of total 3.41% 34.62% 2.87% 27.48% 7.58% 3.93% 8.85% 11.25%
Minimum (keyword/page) 0.000 0.000 0.000 0.000 0.000 0.000 0.000 0.000
Maximum (keyword/page) 2.000 4.000 1.000 2.800 1.720 1.160 1.780 1.800
Std. deviation (keyword/page) 0.143 0.568 0.099 0.477 0.205 0.120 0.242 0.256
Legend: PDC = low product cost; PRC = low process cost; QOD = differentiation by quality of design; QOC = differentiation by quality of conformity; DFB = differentiation by flexibility of design; VOF = differentiation by flexibility of volume; SPD = differentiation by speed of distribution; SPL = differentiation by speed of development and launch of new products.
It can be observed that listed Brazilian companies reveal information about strategy in
their annual reports primarily regarding the process cost and quality of conformity dimensions
(PRC and QOC). These two dimensions represent together more than 62% of all strategy
disclosures.
The much lower frequency presented in the product cost dimension probably occurs
due to the difficulty in specifying information in this dimension. Diversified companies, with
many product lines, would have to mention details specific to each of these lines. In addition
to the cost of obtaining such information, it would also result in disclosure of proprietary
information, something which is not expected to occur (Dye, 1986).
The following section deals with the results of the cluster analysis and the
identification of strategic positioning among groups.
6.1 – Cluster analysis and strategic positioning
The groups obtained through non-hierarchical algorithms (k-medians and k-means
clustering methods) turned out very similar to those obtained through hierarchical algorithms
(Ward method). This similarity in results strengthens the validity of the group formations
obtained (Ketchen & Schook, 1996).
Malhotra (2001) pointed out that the definition of the number of groups or clusters to
be used should be a decision made by the researcher according to criteria of degree of
12
representation of the groups formed and identification of internal homogeneity and external
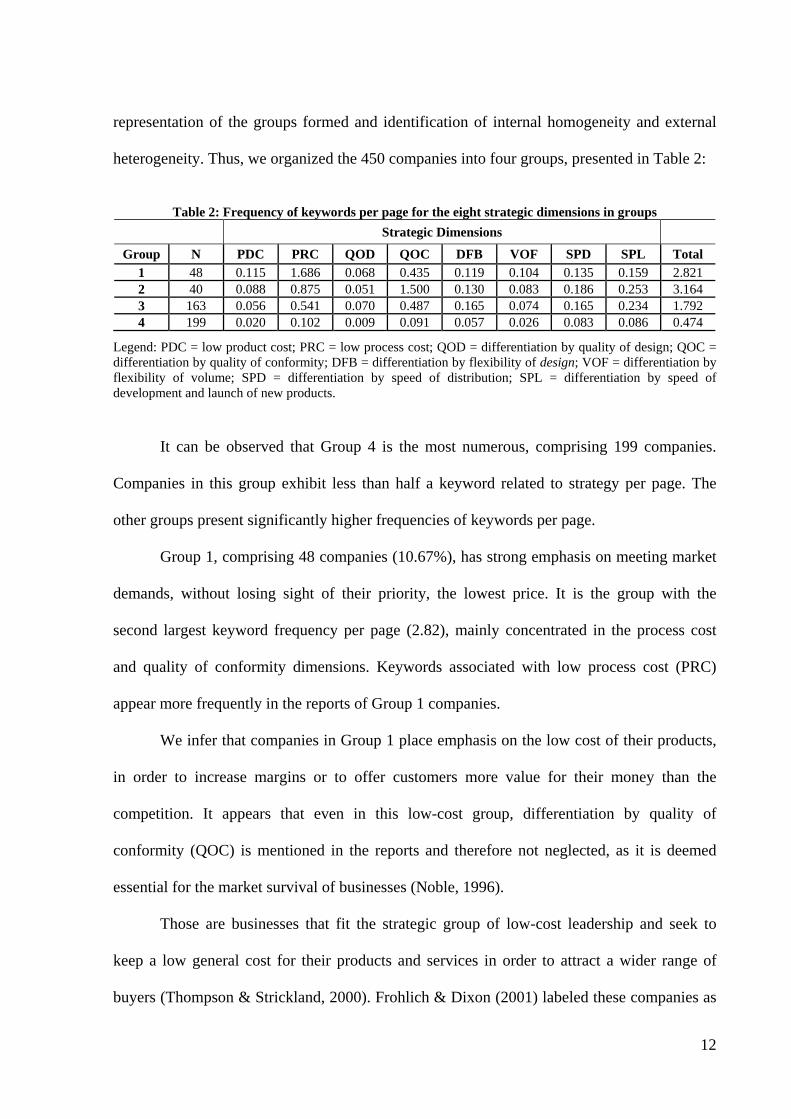
heterogeneity. Thus, we organized the 450 companies into four groups, presented in Table 2:
Table 2: Frequency of keywords per page for the eight strategic dimensions in groups
Strategic Dimensions
Group N PDC PRC QOD QOC DFB VOF SPD SPL Total
1 48 0.115 1.686 0.068 0.435 0.119 0.104 0.135 0.159 2.821 2 40 0.088 0.875 0.051 1.500 0.130 0.083 0.186 0.253 3.164 3 163 0.056 0.541 0.070 0.487 0.165 0.074 0.165 0.234 1.792 4 199 0.020 0.102 0.009 0.091 0.057 0.026 0.083 0.086 0.474
Legend: PDC = low product cost; PRC = low process cost; QOD = differentiation by quality of design; QOC = differentiation by quality of conformity; DFB = differentiation by flexibility of design; VOF = differentiation by flexibility of volume; SPD = differentiation by speed of distribution; SPL = differentiation by speed of development and launch of new products.
It can be observed that Group 4 is the most numerous, comprising 199 companies.
Companies in this group exhibit less than half a keyword related to strategy per page. The
other groups present significantly higher frequencies of keywords per page.
Group 1, comprising 48 companies (10.67%), has strong emphasis on meeting market
demands, without losing sight of their priority, the lowest price. It is the group with the
second largest keyword frequency per page (2.82), mainly concentrated in the process cost
and quality of conformity dimensions. Keywords associated with low process cost (PRC)
appear more frequently in the reports of Group 1 companies.
We infer that companies in Group 1 place emphasis on the low cost of their products,
in order to increase margins or to offer customers more value for their money than the
competition. It appears that even in this low-cost group, differentiation by quality of
conformity (QOC) is mentioned in the reports and therefore not neglected, as it is deemed
essential for the market survival of businesses (Noble, 1996).
Those are businesses that fit the strategic group of low-cost leadership and seek to
keep a low general cost for their products and services in order to attract a wider range of
buyers (Thompson & Strickland, 2000). Frohlich & Dixon (2001) labeled these companies as
13
caretakers, which are organizations seeking cost reductions as a way to offer products at a
low price while achieving high quality and reliable delivery.
Porter (1985) proposed that the low-price strategy is typical of only a small number of
enterprises, but that once implemented becomes a powerful source of competitive strategy.
According to Porter (1985), in this type of lowest price strategy there is not enough room for
everyone, but only for the few most competent in that aspect. As a result, most companies
seek a place in the market competing through differentiation or focus.
Group 2 is formed of 40 companies (8.89% of the total), showing the highest average
disclosure levels, with 3,164 keywords per report page. In general, this group is formed of
companies seeking high differentiation by quality of conformity (QOC), but also concerned
with costs (PRC). These companies are regarded as geared towards strategies of quality
differentiation, flexibility and speed, and seek to differentiate their products in respect to that
of competitors' to attract a wide range of customers or even specific niches (Thompson &
Strickland, 2000). This is the group of marketeers or designers, which offer products
differentiated under various aspects, as a way to add value recognizable by the customer,
striving for rapid development of new products (Frohlich & Dixon, 2001).
Group 3, consisting of 163 companies (36.22% of the total), contains a large number
of enterprises relying on multiple types of manufacturing strategies. The disclosure of
information about quality of conformity (QOC) and process cost (PRC) predominates in this
group, though at lower levels than those present in businesses belonging to Groups 1 and 2
(differences were significant at 1%). The single dimension where Group 3 companies show
greater disclosure levels than the other groups is that of design flexibility (DFB) (significant
at 1% when compared to the frequency of Group 2).
Companies in Group 3 show comparatively high levels of disclosure in the dimensions
of quality of design (QOD), flexibility of volume (VOF), speed of distribution (SPD) and
14
speed of development and launch of new products (SPL). However, levels of disclosure for
these dimensions were much lower than those found for the process cost (PRC) and quality of
conformity (QOC) dimensions.
We infer that companies in Group 3 seek to obtain competitive advantages in multiple
dimensions, without reliance on any specific strategic positioning. Porter (1985) and Noble
(1996) claimed that greater sustainable competitive advantage can be achieved by using many
different operations strategies, originating from multiple sources, instead of relying on just
one or two factors. Porter (1985) also suggested that there is no limit restricting the number of
companies competing through differentiation, because each company focuses on its own
consumer audience, trying to answer their expectations in particular ways.
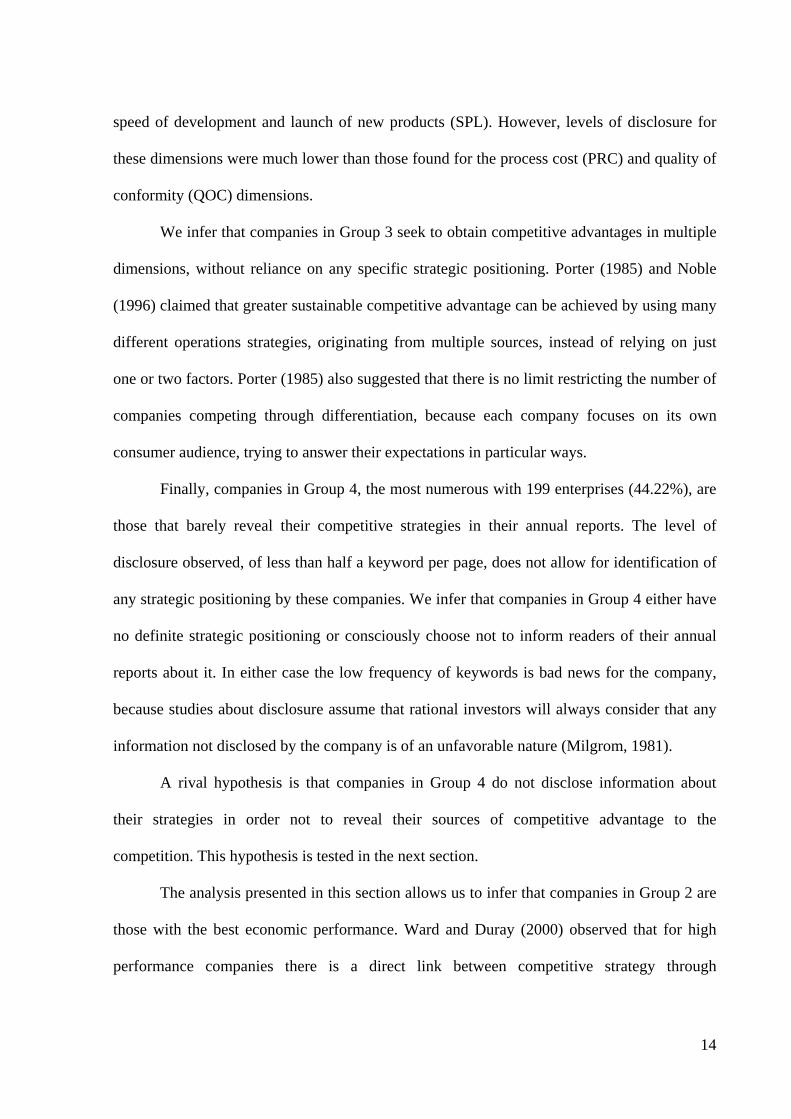
Finally, companies in Group 4, the most numerous with 199 enterprises (44.22%), are
those that barely reveal their competitive strategies in their annual reports. The level of
disclosure observed, of less than half a keyword per page, does not allow for identification of
any strategic positioning by these companies. We infer that companies in Group 4 either have
no definite strategic positioning or consciously choose not to inform readers of their annual
reports about it. In either case the low frequency of keywords is bad news for the company,
because studies about disclosure assume that rational investors will always consider that any
information not disclosed by the company is of an unfavorable nature (Milgrom, 1981).
A rival hypothesis is that companies in Group 4 do not disclose information about
their strategies in order not to reveal their sources of competitive advantage to the
competition. This hypothesis is tested in the next section.
The analysis presented in this section allows us to infer that companies in Group 2 are
those with the best economic performance. Ward and Duray (2000) observed that for high
performance companies there is a direct link between competitive strategy through
15
differentiation, manufacturing strategy based on quality and economic performance. This
hypothesis is also tested in the next section.
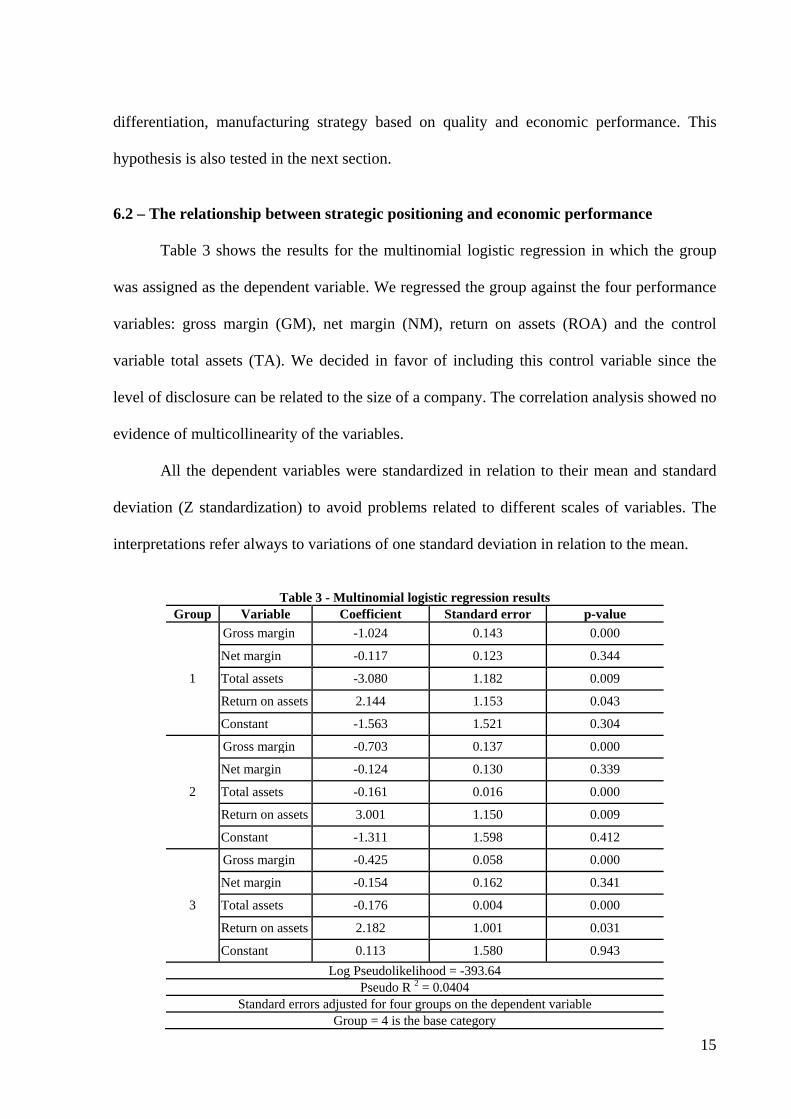
6.2 – The relationship between strategic positioning and economic performance
Table 3 shows the results for the multinomial logistic regression in which the group
was assigned as the dependent variable. We regressed the group against the four performance
variables: gross margin (GM), net margin (NM), return on assets (ROA) and the control
variable total assets (TA). We decided in favor of including this control variable since the
level of disclosure can be related to the size of a company. The correlation analysis showed no
evidence of multicollinearity of the variables.
All the dependent variables were standardized in relation to their mean and standard
deviation (Z standardization) to avoid problems related to different scales of variables. The
interpretations refer always to variations of one standard deviation in relation to the mean.
Table 3 - Multinomial logistic regression results
Group Variable Coefficient Standard error p-value
1
Gross margin -1.024 0.143 0.000
Net margin -0.117 0.123 0.344
Total assets -3.080 1.182 0.009
Return on assets 2.144 1.153 0.043
Constant -1.563 1.521 0.304
2
Gross margin -0.703 0.137 0.000
Net margin -0.124 0.130 0.339
Total assets -0.161 0.016 0.000
Return on assets 3.001 1.150 0.009
Constant -1.311 1.598 0.412
3
Gross margin -0.425 0.058 0.000
Net margin -0.154 0.162 0.341
Total assets -0.176 0.004 0.000
Return on assets 2.182 1.001 0.031
Constant 0.113 1.580 0.943
Log Pseudolikelihood = -393.64 Pseudo R 2 = 0.0404
Standard errors adjusted for four groups on the dependent variable Group = 4 is the base category
16
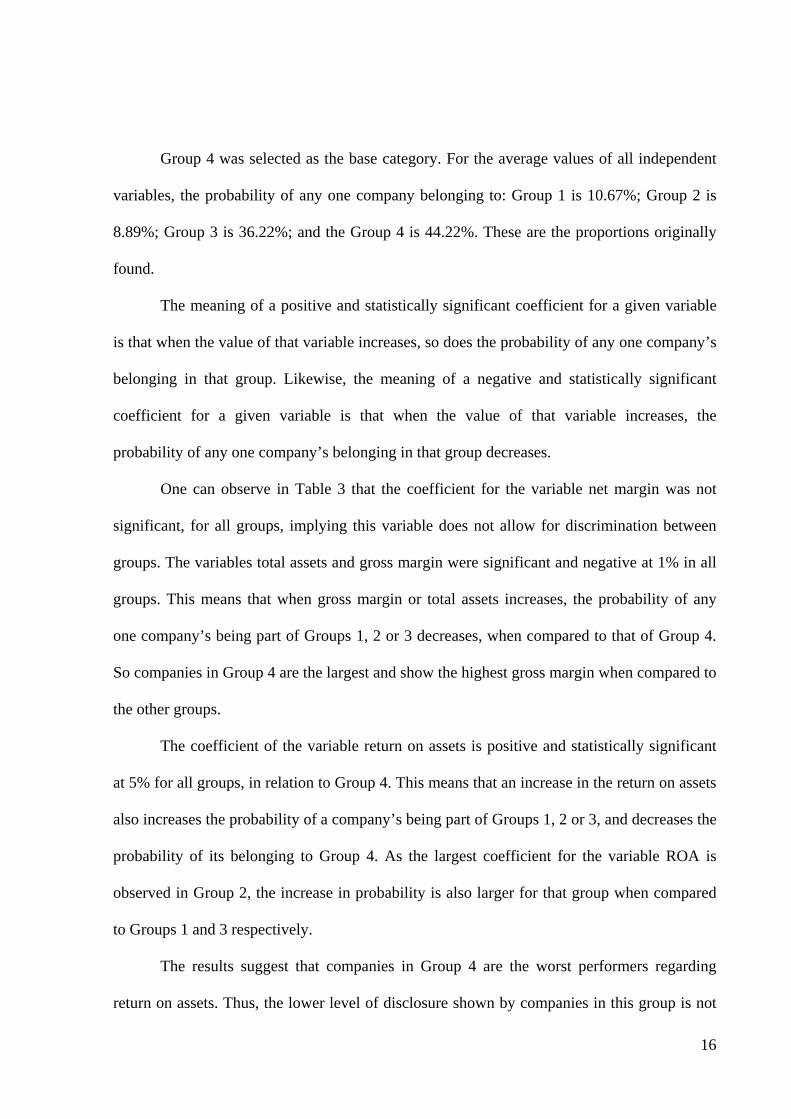
Group 4 was selected as the base category. For the average values of all independent
variables, the probability of any one company belonging to: Group 1 is 10.67%; Group 2 is
8.89%; Group 3 is 36.22%; and the Group 4 is 44.22%. These are the proportions originally
found.
The meaning of a positive and statistically significant coefficient for a given variable
is that when the value of that variable increases, so does the probability of any one company’s
belonging in that group. Likewise, the meaning of a negative and statistically significant
coefficient for a given variable is that when the value of that variable increases, the
probability of any one company’s belonging in that group decreases.
One can observe in Table 3 that the coefficient for the variable net margin was not
significant, for all groups, implying this variable does not allow for discrimination between
groups. The variables total assets and gross margin were significant and negative at 1% in all
groups. This means that when gross margin or total assets increases, the probability of any
one company’s being part of Groups 1, 2 or 3 decreases, when compared to that of Group 4.
So companies in Group 4 are the largest and show the highest gross margin when compared to
the other groups.
The coefficient of the variable return on assets is positive and statistically significant
at 5% for all groups, in relation to Group 4. This means that an increase in the return on assets
also increases the probability of a company’s being part of Groups 1, 2 or 3, and decreases the
probability of its belonging to Group 4. As the largest coefficient for the variable ROA is
observed in Group 2, the increase in probability is also larger for that group when compared
to Groups 1 and 3 respectively.
The results suggest that companies in Group 4 are the worst performers regarding
return on assets. Thus, the lower level of disclosure shown by companies in this group is not
17
associated with increases in competitive advantage. On the other hand, companies in Group 2
are the best performers regarding return on assets, as expected by the analysis of their
strategic positioning.
7 – Conclusions
This study aimed to evaluate the quality of strategic information disclosure in the
annual reports of listed Brazilian companies. We developed a procedure based on thematic
content analysis to approximate measures regarding the disclosure of strategic information in
corporate annual reports.
Our results suggest that the quality of strategic disclosure in annual reports can be
improved significantly: 199 out of the 450 companies analyzed do not reveal information that
allows inferring their strategic positioning. Moreover, these 199 companies were the ones
showing the worst economic performance in the sample. Therefore, these companies do not
report to investors and other stakeholders how they intend to improve their performance.
The process of approximation of strategy disclosure developed here generated
encouraging results. Despite the limitations of the semi-objective approximation of strategy
disclosure, which required some discretionary decision on our part, the list of keywords used
in the content analysis was completely derived from the literature on strategy and validated in
the sample.
The measures of disclosure in eight strategic dimensions allowed us to identify four
groups of companies. The fact that the groups identified by means of their strategic
orientation match the theoretical propositions found in literature increases the confidence in
the process of content analysis.
The results of the multinomial logistic regression analysis further increase the
confidence in the robustness of the process. Convergent with results from other studies, which
were based on questionnaires, companies that showed competitive positioning with emphasis
18
on quality turned out to be those presenting superior economic performance in the present
study.
A remaining limitation to the present study concerns the possible existence of spurious
correlations between strategic positioning of the identified groups and the economic
performance variables. It is usually presumed that strategic positioning involves long-term
decisions and varies little over time. However, future studies could focus on longitudinal
analyses with the aim of proving causation between positioning with emphasis on quality and
superior performance.
References
ARROWS, K. J. (1984) The Economics of Information Collected Papers. Harvard University
Press, Cambridge.
BARDIN, L. (2004) Análise de Conteúdo. Lisboa: Edições 70.
BEATTIE, V., MCINNES, W. & FEARNLEY, S. (2004) A methodology for analyzing and
evaluating narratives in annual reports: A comprehensive descriptive profile and metrics for
disclosure quality attributes. Accounting Forum 28(3), pp. 205-236.
BERETTA, S. & BOZZOLAN. S. (2008) Quality versus Quantity: The Case of Forward-
Looking Disclosure, Journal of Accounting, Auditing and Finance, 3, pp. 333–375.
BRYAN, S. H. (1997) Incremental information content of required disclosures contained in
management discussion and analysis. The Accounting Review, 72(2), pp. 285-301.
CHAFFEE, E. E. (1985) Three models of strategy. The Academy of Management Review,
10(1), pp. 89-98.
CLATWORTHY, M.A. & JONES, M.J. (2001) The effect of thematic structure on the
variability of annual report readability, Accounting, Auditing & Accountability Journal, 14,
(3), pp. 311-26.
19
DYE, R. A. (1986) Proprietary and nonproprietary disclosures. The Journal of Business,
59(2), pp. 331-66.
FROHLICH, M.T. & DIXON, J.R. (2001) A taxonomy of manufacturing strategies revisited.
Journal of Operations Management, 19, pp.541-558.
GARVIN, D.A. (1987) Competing on the Eight Dimensions of Quality. Harvard Business
Review 65(6), pp.101-109.
GERWIN, D. (1993) Manufacturing flexibility: a strategic perspective. Management Science,
39(4), pp.395-410.
HAIR, J. F., R. E. ANDERSON, R. L. TATHAM & W. C. BLACK (1998) Multivariate Data
Analysis. Prentice Hall, Upper Saddle River, New Jersey.
HEALY, P. M., & PALEPU, K. G. (2001) Information asymmetry, corporate disclosure, and
the capital markets: A review of the empirical disclosure literature. Journal of Accounting and
Economics, 31(3), pp. 405–440.
HILL, T. (1993) Manufacturing Strategy: The Strategic Management of the Manufacturing
Function 2nd Ed., Macmillan, London
JONES, M. J. & SHOEMAKER, P.A. (1994) Accounting narratives: a review of empirical
studies of content and readability. Journal of Accounting Literature, 13, pp. 142.
KETCHEN, D. & SHOOK, C. L. (1996) The application of cluster analysis in strategic
management research: an analysis and critique, Strategic Management Journal, 17, pp. 441-
458.
LONG, J. S. (2001) Regression Models for Categorical and Limited Dependent Variables
Using STATA. Texas: STATA Corporation.
MALHOTRA, N. K. (2007) Marketing Research: An applied orientation. Essex: Pearson
Education Ltd.
20
MILGROM, P. R. (1981) Good News and Bad News: Representation Theorems and
Applications. The Bell Journal of Economics, 12(2), pp. 380-391.
NOBLE, M.A. (1995) Manufacturing strategy: Testing the cumulative model in a multiple
country context. Decision Sciences, 26(5), pp. 693-721.
PORTER, M. E. (1980) Competitive Strategy: Techniques for Analyzing Industries and
Competitors, The Free Press, New York.
PORTER, M.E. (1985) Competitive Advantage. New York: Free Press.
SANTEMA, S. & VAN DE RIJT, J. (2001) Strategy disclosure in Dutch annual reports.
European Management Journal, 19(1), pp. 101-108.
SANTEMA, S., HOEKERT, M.,; VAN DE RIJT, J. & VAN OIJEN, A. (2005) Strategy
disclosure in annual reports across Europe: A study on differences between five countries.
European Business Review, 17(4), Pp. 352-366.
SCHROEDER, R. G., ANDERSON, J. C., & CLEVELAND, G. (1986) The content of
manufacturing strategy: An empirical study. Journal of Operations Managemen,6 (3), pp.
405-416.
SKINNER, W. (1969) Manufacturing: Missing link in corporate strategy. Harvard Business
Review, 47(3), pp. 136-145.
SLACK, N., CHAMBERS, S. & JOHNSTON, R. (2007) Operations Management, 5th
edition. Trans-Atlantic Publications, Inc.
VICKERY, S. K., DROGE, C. & MARKLAND, R.E. (1994) Strategic production
competence: convergent, discriminant, and predictive validity. Production and Operations
Management, 3(4), pp. 308-318.
SWEENEY, M.T. (1991) Towards a Unified Theory of Strategic Manufacturing
Management, International Journal of Operations & Production Management, 11(8), pp. 6-
22.
21
THOMPSON JR. A.A. & STRICKLAND III, A. J. (2000) Planejamento Estratégico:
elaboração, implementação e execução. São Paulo: Pioneira; 2000.
WARD, P. T.; BICKFORD, D. J.; LEONG, G. K. (1996) Configurations of manufacturing
strategy, business strategy, environment and structure. Journal of Management, 22(4), pp.
597-626.
WARD, P. T. & DURAY, R. (2000) Manufacturing strategy in context: Environment,
competitive strategy and manufacturing strategy. Journal of Operations Management, 18, pp.
123-138.
WARD, P. T., McCREERY, J, RITZMAN, L. P. & SHARMA, D. (1998) Competitive
priorities in operations management. Decision Sciences, 29, (4), pp. 1037-1048.
WHEELWRIGHT, S. C. (1984) Manufacturing strategy: defining the missing link. Strategic
Management Journal, 5, pp. 77-91.
WHITE, G.P. (1996) A survey and taxonomy of strategy-related performance measures for
manufacturing. International Journal of Operations & Production Management, 16(3), pp.
42-61.
WRIGHT, P. L., KROLL, M. J. & PARNELL, J. (1998) Strategic management: concepts and
cases. New Jersey: Prentice Hall