Embed Size (px)
Citation preview

Strategy and FY17/18 Performance
30 May 2018

Forward Looking Statements
This presentation may contain forward-looking statements regarding,
among other things, the Company's outlook, business and strategy which
are current as of the date they are made. These forward-looking
statements are based largely on the current assumptions, expectations
and projections of the directors and management of SATS about our
business, and the industry and markets in which we operate. These
statements are not guarantees of SATS’ future performance and are
subject to a number of risks and uncertainties, some of which are beyond
the Company's control and are difficult to predict. Future developments
and actual results could differ materially from those expressed in the
forward-looking statements. In light of these risks and uncertainties, there
can be no assurance that the forward-looking information will prove to be
accurate. SATS does not undertake to update these forward-looking
statements to reflect events or circumstances which arise after publication.
2

• Strategy
• Five-Year Performance Trend
• FY17/18 Financial Performance
• Outlook
3
Agenda

4
Key Highlights
1. We adopt a two-prong
approach to executing our strategy – locations and platforms.
2. Growing profitability
through scale
opportunities in key
markets and hub
partnerships –
Singapore Airlines in
Singapore , AirAsia in
Malaysia, HKIA in
Hong Kong, and Cargo
Services Centre in
Mumbai.
3. Growing connectivity
across SATS network
through digital
platforms
Strategy: Feeding and Connecting Asia
Food Solutions - Locations
5
Strategy: Feeding and Connecting Asia
5
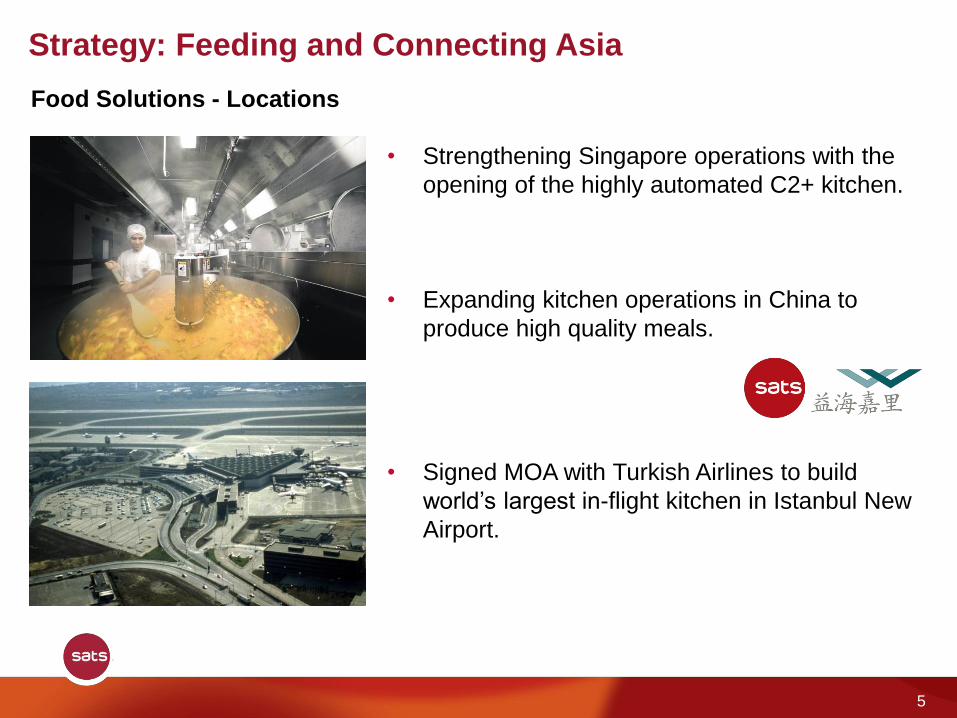
• Strengthening Singapore operations with the
opening of the highly automated C2+ kitchen.
• Expanding kitchen operations in China to
produce high quality meals.
• Signed MOA with Turkish Airlines to build
world’s largest in-flight kitchen in Istanbul New
Airport.

• Expanding our culinary expertise and
combining it with innovative product
development to launch new products.
Food Solutions - Platforms
6
Strategy: Feeding and Connecting Asia
6
• Integrated supply chain that will integrate
aviation with non-aviation.
7
Strategy: Feeding and Connecting Asia
7
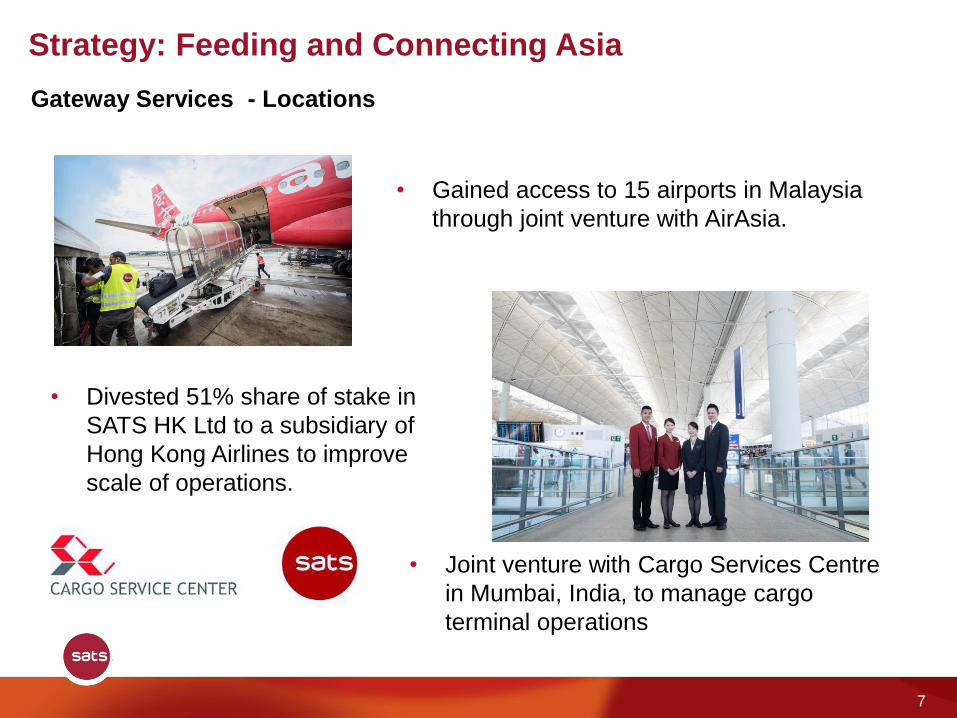
• Joint venture with Cargo Services Centre
in Mumbai, India, to manage cargo
terminal operations
• Divested 51% share of stake in
SATS HK Ltd to a subsidiary of
Hong Kong Airlines to improve
scale of operations.
• Gained access to 15 airports in Malaysia
through joint venture with AirAsia.
Gateway Services - Locations

8
Strategy: Feeding and Connecting Asia
8
• Launched COSYS for greater connectivity
across all markets.
• Launched baggage reconciliation system.
• Launched Tracer for piece-level tracking of
packages.
Gateway Services - Platforms

9
Value Added Per Employment Cost
increases 11.2% over a 5-year period T
imes

10
PATMI and PATMI margin increase year-on-year
due to higher contribution from overseas joint
ventures and associates
180.4195.7
220.6
257.9 261.5
10.1%11.2%
13.0%
14.9% 15.2%
0
50
100
150
200
250
300
FY13/14 FY14/15 FY15/16 FY16/17 FY17/18
$M

11
Delivering a creditable Return-on-Equity (%
)

12
Proposed final dividend of 12 cents*.
Total dividends to increase by 1 cent to 18 cents, estimated dividend payout of $201.1M.
Payment of final dividend is on 17 August 2018. Book closure date is 3 August 2018.
*Subject to shareholders’ approval at AGM to be held on 19 July 2018
Progressive Sustainable Dividends
Ce
nts
Dividend Per share

FY17/18 Financial Performance
13

• Group revenue was $1.725B
• Operating profit dipped 1.8% to $226.4M
• Share of results from associates and JVs rose 9.2% to $71.2M
• PATMI grew 1.4% to $261.5M
• ROE remained creditable at 16.2%
• Free cash flow generated was $146.3M
• EPS improved by 0.9% to 23.4 cents
• Proposed final dividend of 12 cents per share will increase full
year dividend by 1 cent to a total of 18 cents
14
Executive Summary: FY17/18 Performance

15
Operating Statistics for SATS Group
2H
FY17/18
2H
FY16/17
Change
(%)FY17/18 FY16/17
Change
(%)
Passengers Handled ('M) 28.34 26.35 7.6 54.30 51.53 5.4
Flights Handled ('000) 80.66 87.50 (7.8) 165.94 171.38 (3.2)
Cargo/Mail Processed ('000 tonnes) 923.97 876.78 5.4 1,828.85 1,717.42 6.5
Gross Meals Produced ('M) 35.61 33.40 6.6 70.51 67.61 4.3
Ship Calls Handled 156 125 24.8 189 147 28.6
* The above operating data cover SATS and its subsidiaries, but does not include JVs and associates. * Passengers handled comprises full service and low cost carrier as well as cruise ship passengers. * Gross meals include both inflight and institutional catering meals.
Flights and Passengers Handled by SATS HK Ltd have been excluded from the
above operating statistics since August 2017.

16
Revenue • Group revenue decreased 0.3%. Food Solutions’ revenue
declined 2.7%, while Gateway Services’ revenue improved
2.9% despite the deconsolidation of SHK. $1,724.6M -0.3%
Operating profit • Group expenditure decreased marginally from $1,498.8M to
$1,498.2M, despite an increase of $16.7M in licence fees due
to the cessation of rebates by Changi Airport. Staff costs fell
$23.4M mainly due to the deconsolidation of SHK. $226.4M -1.8%
Share of results of
Associates/JVs, net of tax
• Share of after-tax profits from associates/JVs increased $6.0M
(9.2%), underpinned by better performance from Gateway
Services’ associates/joint ventures, and partly offset by a
reduction in Food Solutions’ associates/joint ventures’
performance. $71.2M 9.2%
PATMI • Underlying net profit was $236.1M, 0.8% higher y-o-y.
• EPS increased from 23.2 cents to 23.4 cents. $261.5M 1.4%
Debt-to-equity • Debt-to-equity ratio remained healthy at 0.07 times.
• Cash and short-term deposits stood at $373.3M.
• Free cash flow generated was $146.3M. 0.07 times -
FY17/18 Highlights

17
4Q and FY17/18 Financials
$M 4Q17/18 4Q16/17Fav/(Unfav)
Change (%) FY17/18 FY16/17
Fav/(Unfav)
Change (%)
Revenue 423.5 425.8 (0.5) 1,724.6 1,729.4 (0.3)
Expenditure (377.4) (380.0) 0.7 (1,498.2) (1,498.8) 0.0
Operating Profit 46.1 45.8 0.7 226.4 230.6 (1.8)
Share of Results of Associates/JVs, Net of Tax 24.0 28.8 (16.7) 71.2 65.2 9.2
Other non-operating income, net 8.9 0.7 n.m. 20.7 9.9 n.m.
PBT 79.7 76.4 4.3 321.6 309.1 4.0
PATMI 65.4 66.6 (1.8) 261.5 257.9 1.4
Underlying Net Profit* 51.5 51.6 (0.2) 236.1 234.3 0.8
n.m. – not meaningful
* Underlying net profit refers to profit attributable to owners of the Company excluding one-off items

18
% 4Q17/18 4Q16/17
Change
ppt/% FY17/18 FY16/17
Change
ppt/%
Operating Margin 10.9 10.8 0.1 13.1 13.3 (0.2)
Underlying Net Margin 12.2 12.1 0.1 13.7 13.5 0.2
Return on Equity 4.1 4.2 n.m. 16.2 16.7 n.m.
Basic EPS (cents) 5.9 6.0 -1.7% 23.4 23.2 0.9%
Dividend Per Share (cents) 12.0 11.0 9.1% 18.0 17.0 5.9%
31 MAR 18 31 MAR 17
NAV Per Share ($) 1.46 1.44
Debt / Equity 0.07 0.07
Financial Indicators

19
$M 4Q17/18 4Q16/17 Change (%) FY17/18 FY16/17 Change (%)
By Business*:
Food Solutions 228.3 234.0 (2.4) 946.6 973.3 (2.7)
Gateway Services 194.7 191.4 1.7 776.5 754.6 2.9
Others 0.5 0.4 25.0 1.5 1.5 0.0
Total 423.5 425.8 (0.5) 1,724.6 1,729.4 (0.3)
By Industry*:
Aviation 361.6 367.4 (1.6) 1,488.6 1,499.9 (0.8)
Non-Aviation 61.4 58.0 5.9 234.5 228.0 2.9
Others 0.5 0.4 25.0 1.5 1.5 0.0
Total 423.5 425.8 (0.5) 1,724.6 1,729.4 (0.3)
By Geographical Location:
Singapore 353.7 345.5 2.4 1,423.0 1,381.6 3.0
Japan 58.3 59.5 (2.0) 239.4 259.5 (7.7)
Others 11.5 20.8 (44.7) 62.2 88.3 (29.6)
Total 423.5 425.8 (0.5) 1,724.6 1,729.4 (0.3)
* Certain revenue in 4Q16/17 and FY16/17 have been reclassified in conformity with the current year’s
presentation.
Group Segmental Revenue

20
$M 4Q17/18 4Q16/17Fav/(Unfav)
Change (%)FY17/18 FY16/17
Fav/(Unfav)
Change (%)
Staff Costs 206.4 217.3 5.0 833.3 856.7 2.7
Cost of Raw Materials 63.6 60.9 (4.4) 252.5 257.9 2.1
Licence Fees 20.6 16.1 (28.0) 84.2 67.5 (24.7)
Depreciation &
Amortisation charges21.0 19.4 (8.2) 78.5 73.5 (6.8)
Company Premise
& Utilities Expenses25.1 28.3 11.3 103.5 109.6 5.6
Other Costs 40.7 38.0 (7.1) 146.2 133.6 (9.4)
Group Expenditure 377.4 380.0 0.7 1,498.2 1,498.8 0.0
Group Revenue 423.5 425.8 (0.5) 1,724.6 1,729.4 (0.3)
Group expenditure increased in most expense categories except for staff costs,
company premises and utilities expenses due to SHK’s deconsolidation. Licence fees
were significantly higher with the cessation of rebates.
Group Expenditure
21
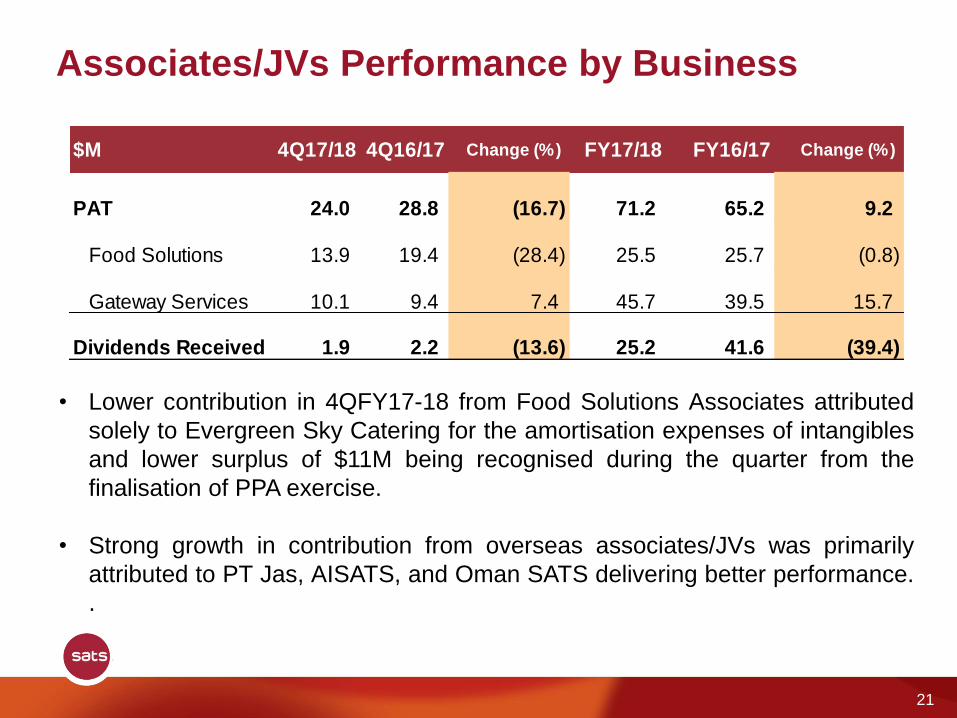
$M 4Q17/18 4Q16/17 Change (%) FY17/18 FY16/17 Change (%)
PAT 24.0 28.8 (16.7) 71.2 65.2 9.2
Food Solutions 13.9 19.4 (28.4) 25.5 25.7 (0.8)
Gateway Services 10.1 9.4 7.4 45.7 39.5 15.7
Dividends Received 1.9 2.2 (13.6) 25.2 41.6 (39.4)
• Lower contribution in 4QFY17-18 from Food Solutions Associates attributed
solely to Evergreen Sky Catering for the amortisation expenses of intangibles
and lower surplus of $11M being recognised during the quarter from the
finalisation of PPA exercise.
• Strong growth in contribution from overseas associates/JVs was primarily
attributed to PT Jas, AISATS, and Oman SATS delivering better performance.
.
Associates/JVs Performance by Business

22
$M As at 31 MAR 18 As at 31 MAR 17
Total Equity 1,766.6 1,691.2
Long-Term Liabilities 179.1 193.1
Current Liabilities 402.6 395.1
Total Equity & Liabilities 2,348.3 2,279.4
Fixed Assets & Investment Properties 569.0 549.1
Associates / JVs 848.8 670.8
Intangible Assets 157.5 157.9
Other Non-Current Assets & Long-Term Investments 38.0 45.1
Current Assets
Cash & short-term deposits 373.3 505.8
Debtors & other current assets 361.7 350.7
Total Assets 2,348.3 2,279.4
Strong Balance Sheet
Total equity stood at $1.8 billion with total assets of $2.3 billion as of 31 Mar 18.

23
* Free Cash Flow refers to net cash from operating activities less cash purchases of capital expenditure.
• Net cash used in investing activities was higher mainly due to higher
capital expenditure, investment in associates/joint-ventures and lower
dividends received from associates/joint-ventures.
• These were partly compensated by an increase in proceeds from disposal
of assets held for sale, coupled with the absence of long-term investment
made in last financial year.
$M FY17/18 FY16/17 Difference
Net Cash From Operating Activities 245.5 308.9 (63.4)
Net Cash Used In Investing Activities (182.2) (119.6) (62.6)
Net Cash Used In Financing Activities (196.8) (172.8) (24.0)
Net decrease In Cash & Cash Equivalents (133.5) 16.5 (150.0)
Cash & Cash Equivalents At End Of Financial Period 373.3 508.4 (135.1)
Free Cash Flow* 146.3 220.8 (74.5)
Group Cash Flow Statement

Outlook
24

25
Our business strategy is gaining traction.
Our financial performance, despite margin
pressures, has been creditable driven by
higher contributions from our overseas
associates. At Changi, the deployment of
technology has enabled us to handle the
growing traffic with increased productivity
and helped to offset ongoing price
pressure.
Looking ahead, the robust growth in
passenger and cargo traffic and increased
demand for high-quality food across Asia
will present exciting opportunities for SATS.
We will continue to improve service and
productivity to strengthen the Singapore air
hub and grow with our customers and
business partners.
Outlook
26
Beyond Singapore, we will expand our
network of 60 airports, to support our
customers with world class service
standards. As we expand to more locations,
we are digitising our operations to provide
new services that will link these locations
together into one seamless network. These
new services will benefit airlines, their
passengers, air freight shippers and
eCommerce customers.
We are also connecting our aviation and non-
aviation food solutions across the region,
with a single supply chain, and shared
culinary innovation and technology across all
our kitchens. Our technology-driven, people-
led approach ensures that we will continue to
innovate and develop the talent that will
sustain our success.
Outlook

END