Embed Size (px)
Citation preview
Strategies LLCTaxonomy
September 28, 2005 Copyright 2005 Taxonomy Strategies LLC. All rights reserved.
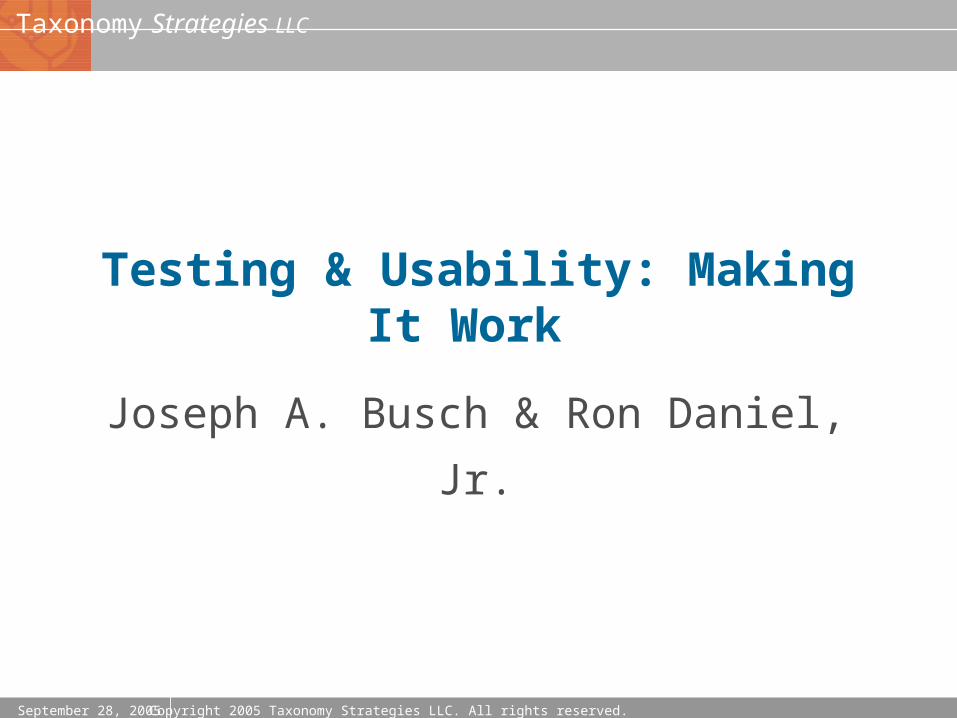
Testing & Usability: Making It Work
Joseph A. Busch & Ron Daniel, Jr.
2Taxonomy Strategies LLC The business of organized information
Agenda
Qualitative methods Quantitative methods
3Taxonomy Strategies LLC The business of organized information
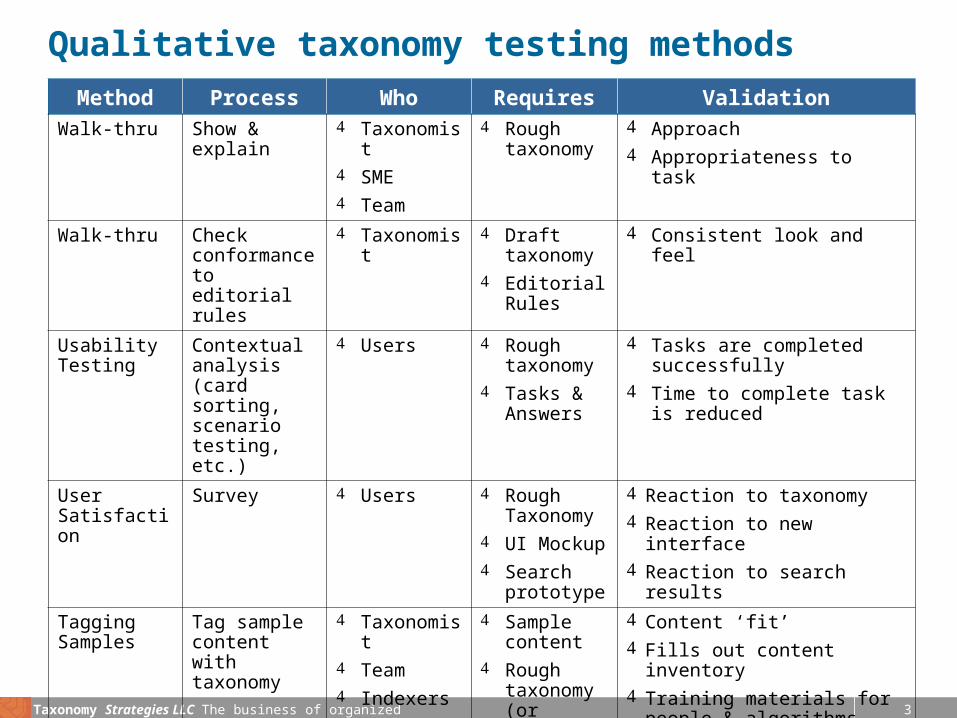
Qualitative taxonomy testing methods
Method Process Who Requires Validation
Walk-thru Show & explain
Taxonomist SME Team
Rough taxonomy
Approach Appropriateness to task
Walk-thru Check conformance to editorial rules
Taxonomist Draft taxonomy
Editorial Rules
Consistent look and feel
Usability Testing
Contextual analysis (card sorting, scenario testing, etc.)
Users Rough taxonomy
Tasks & Answers
Tasks are completed successfully
Time to complete task is reduced
User Satisfaction
Survey Users Rough Taxonomy
UI Mockup Search
prototype
Reaction to taxonomy Reaction to new interface Reaction to search results
Tagging Samples
Tag sample content with taxonomy
Taxonomist Team Indexers
Sample content
Rough taxonomy (or better)
Content ‘fit’ Fills out content inventory Training materials for people &
algorithms Basis for quantitative
methods
4Taxonomy Strategies LLC The business of organized information
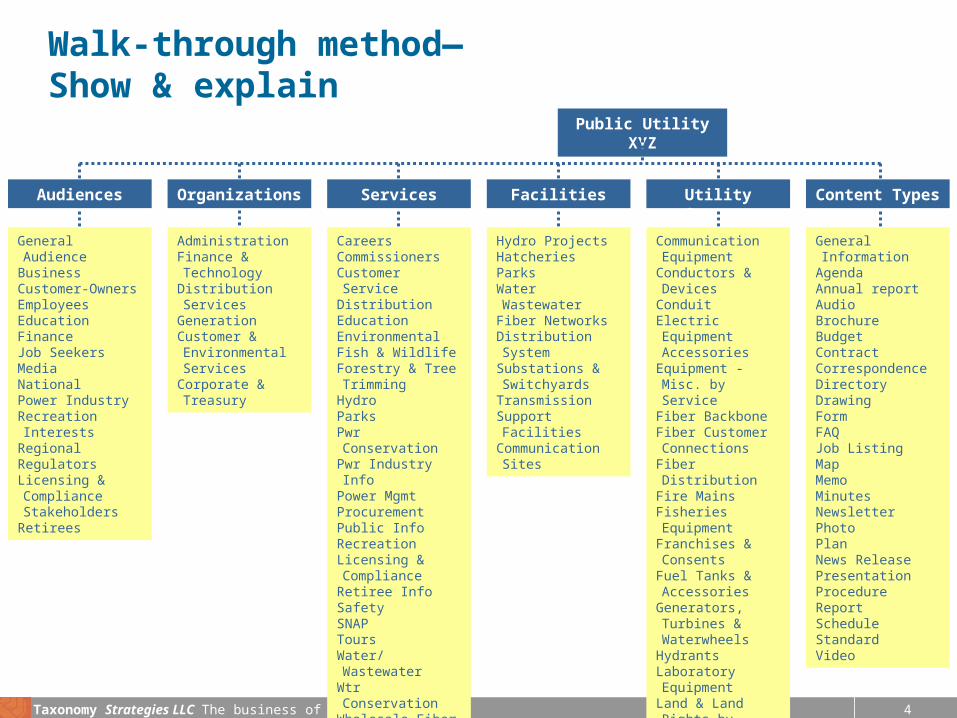
Walk-through method—Show & explain
Audiences
General AudienceBusinessCustomer-OwnersEmployeesEducationFinanceJob SeekersMediaNationalPower IndustryRecreation InterestsRegionalRegulatorsLicensing & Compliance Stakeholders
Retirees
CareersCommissionersCustomer ServiceDistributionEducationEnvironmentalFish & WildlifeForestry & Tree Trimming
HydroParksPwr ConservationPwr Industry InfoPower MgmtProcurementPublic InfoRecreationLicensing & Compliance
Retiree InfoSafetySNAPToursWater/WastewaterWtr ConservationWholesale FiberOther Services
AdministrationFinance & Technology
Distribution ServicesGenerationCustomer & Environmental Services
Corporate & Treasury
General InformationAgendaAnnual reportAudioBrochureBudgetContractCorrespondenceDirectoryDrawingFormFAQJob ListingMapMemoMinutesNewsletterPhotoPlanNews ReleasePresentationProcedureReportScheduleStandardVideo
Organizations Services Facilities Utility Systems Content Types
Public Utility XYZ
Hydro ProjectsHatcheriesParksWater WastewaterFiber NetworksDistribution SystemSubstations & Switchyards
TransmissionSupport FacilitiesCommunication Sites
Communication Equipment
Conductors & Devices
ConduitElectric Equipment Accessories
Equipment - Misc. by Service
Fiber BackboneFiber Customer Connections
Fiber DistributionFire MainsFisheries EquipmentFranchises & Consents
Fuel Tanks & Accessories
Generators, Turbines & Waterwheels
HydrantsLaboratory Equipment
Land & Land Rights by Service
etc.
5Taxonomy Strategies LLC The business of organized information
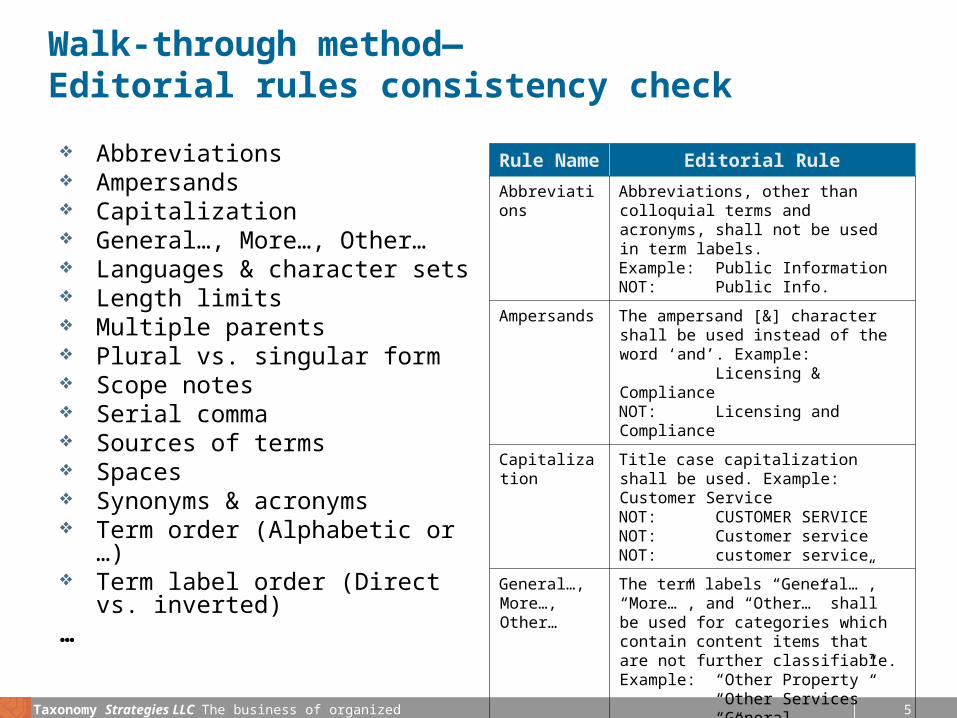
Walk-through method— Editorial rules consistency check
Abbreviations Ampersands Capitalization General…, More…, Other… Languages & character sets Length limits Multiple parents Plural vs. singular form Scope notes Serial comma Sources of terms Spaces Synonyms & acronyms Term order (Alphabetic or …) Term label order (Direct vs.
inverted)…
Rule Name Editorial Rule
Abbreviations Abbreviations, other than colloquial terms and acronyms, shall not be used in term labels.Example: Public InformationNOT: Public Info.
Ampersands The ampersand [&] character shall be used instead of the word ‘and’. Example: Licensing & ComplianceNOT: Licensing and Compliance
Capitalization Title case capitalization shall be used. Example: Customer ServiceNOT: CUSTOMER SERVICENOT: Customer serviceNOT: customer service
General…, More…, Other…
The term labels “General…”, “More…”, and “Other…” shall be used for categories which contain content items that are not further classifiable. Example: “Other Property”
“Other Services”“General Information”“General Audience”
… …
6Taxonomy Strategies LLC The business of organized information
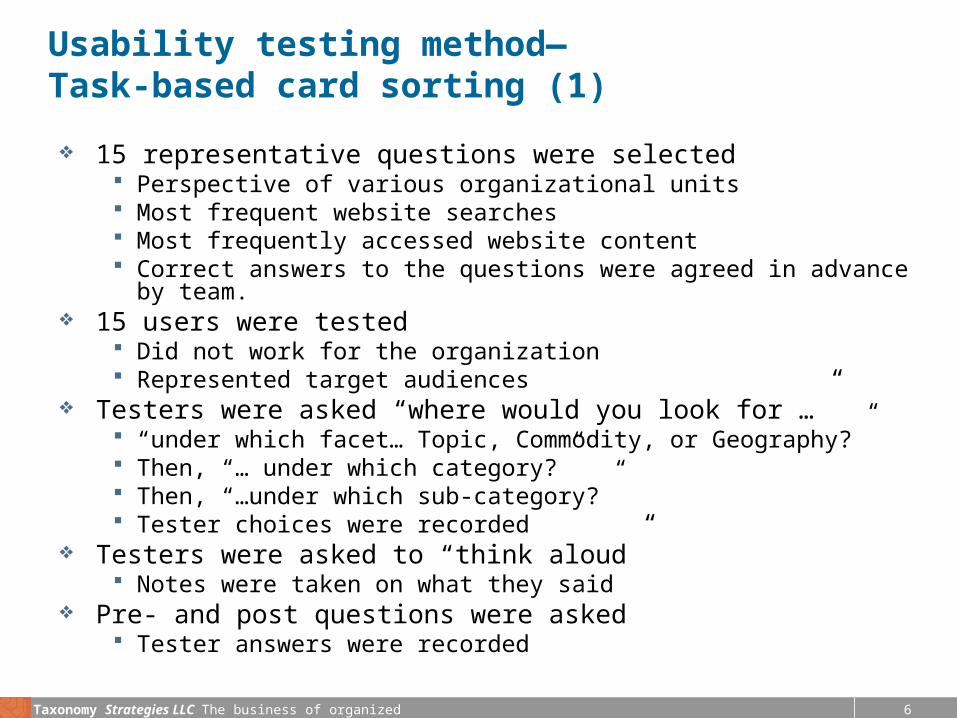
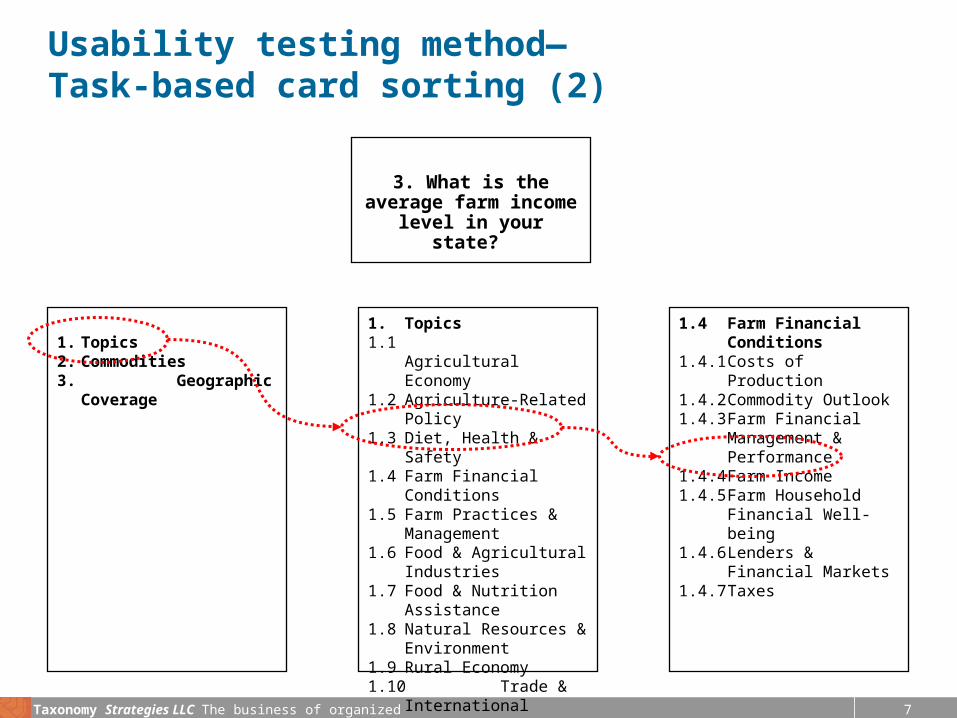
Usability testing method—Task-based card sorting (1)
15 representative questions were selected Perspective of various organizational units Most frequent website searches Most frequently accessed website content Correct answers to the questions were agreed in advance by team.
15 users were tested Did not work for the organization Represented target audiences
Testers were asked “where would you look for …” “under which facet… Topic, Commodity, or Geography?” Then, “… under which category?” Then, “…under which sub-category?” Tester choices were recorded
Testers were asked to “think aloud” Notes were taken on what they said
Pre- and post questions were asked Tester answers were recorded
7Taxonomy Strategies LLC The business of organized information
Usability testing method—Task-based card sorting (2)
3. What is the average farm income level in
your state?
1. Topics2. Commodities3. Geographic Coverage
1. Topics1.1 Agricultural Economy1.2 Agriculture-Related
Policy1.3 Diet, Health & Safety1.4 Farm Financial
Conditions1.5 Farm Practices &
Management1.6 Food & Agricultural
Industries1.7 Food & Nutrition
Assistance1.8 Natural Resources &
Environment1.9 Rural Economy1.10 Trade & International
Markets
1.4 Farm Financial Conditions
1.4.1 Costs of Production1.4.2 Commodity Outlook1.4.3 Farm Financial
Management & Performance
1.4.4 Farm Income1.4.5 Farm Household
Financial Well-being1.4.6 Lenders & Financial
Markets1.4.7 Taxes
Analysis of task-based card sorting (1)
Find-it Tasks User 1 User 2 User 3 User 4 User 5
1. Cotton Cotton Cotton Asia Cotton Cotton
2. Mad cow Cattle Food Safety Cattle Cattle Cattle
3. Farm income Farm Income Farm Income US States Farm Income Farm Income
4. Fast foodFood Consumption
Diet Quality & Nutrition
Food Expenditures
Diet Quality & Nutrition
Diet Quality & Nutrition
5. WIC WIC Program WIC Program WIC Program WIC Program WIC Program
6. GE Corn Corn Corn Corn Corn Corn
7. Foodborne illnessFoodborne Disease
Foodborne Disease
Consumer Food Safety
Foodborne Disease
Foodborne Disease
8. Food costs Food Prices Market Structure Market AnalysisFood Expenditures
Retailing & Wholesaling
9. Tobacco Tobacco Tobacco Tobacco Tobacco Tobacco
10. Small Farms Farm Structure Farm Structure Farm Structure Farm Structure Farm Structure
11. Traceability Food System Labeling PolicyFood Safety Innovations
Food Safety Policy Food Prices
12. Hunger Food Security Food Security Food Security Food Security Food Security
13. Trade balanceCommodity Trade
Trade & Intl Markets
Commodity Trade Market Analysis
Commodity Trade
14. ConservationsCropping Practices
Conservation Policy
Conservation Policy
Conservation Policy
Conservation Policy
15. Trade restrictions Trade PolicyFood Safety & Trade WTO Market Analysis
Commodity Trade
9Taxonomy Strategies LLC The business of organized information
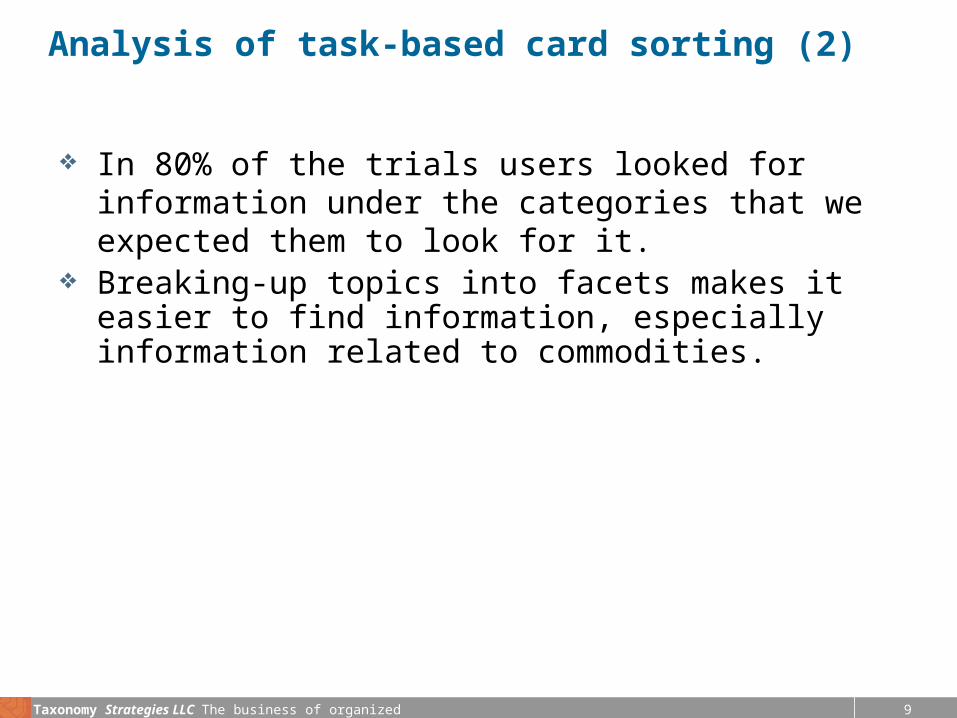
Analysis of task-based card sorting (2)
In 80% of the trials users looked for information under the categories that we expected them to look for it.
Breaking-up topics into facets makes it easier to find information, especially information related to commodities.
10Taxonomy Strategies LLC The business of organized information
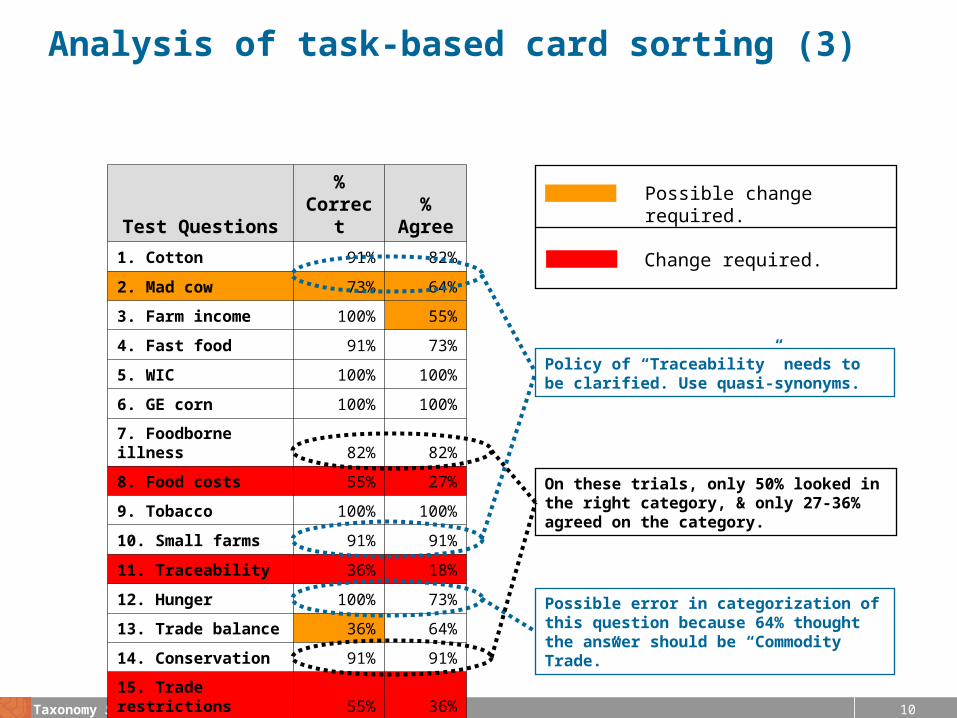
Analysis of task-based card sorting (3)
Test Questions%
Correct%
Agree
1. Cotton 91% 82%
2. Mad cow 73% 64%
3. Farm income 100% 55%
4. Fast food 91% 73%
5. WIC 100% 100%
6. GE corn 100% 100%
7. Foodborne illness 82% 82%
8. Food costs 55% 27%
9. Tobacco 100% 100%
10. Small farms 91% 91%
11. Traceability 36% 18%
12. Hunger 100% 73%
13. Trade balance 36% 64%
14. Conservation 91% 91%
15. Trade restrictions 55% 36%
Possible change required.
Change required.
Possible error in categorization of this question because 64% thought the answer should be “Commodity Trade.”
On these trials, only 50% looked in the right category, & only 27-36% agreed on the category.
Policy of “Traceability” needs to be clarified. Use quasi-synonyms.
11Taxonomy Strategies LLC The business of organized information
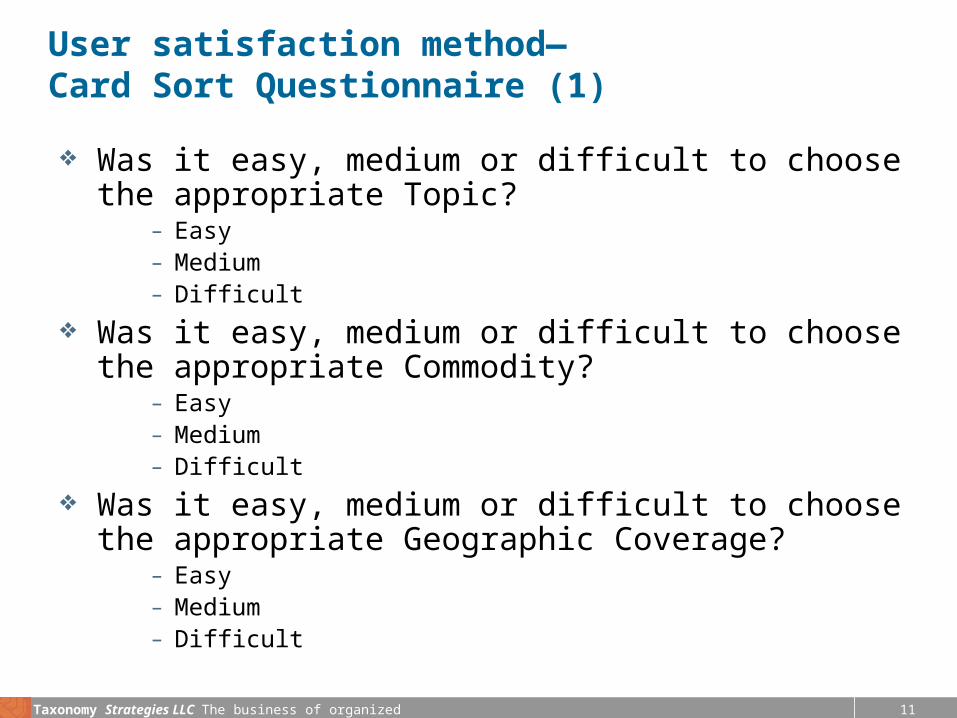
User satisfaction method—Card Sort Questionnaire (1)
Was it easy, medium or difficult to choose the appropriate Topic?
– Easy – Medium– Difficult
Was it easy, medium or difficult to choose the appropriate Commodity?
– Easy – Medium– Difficult
Was it easy, medium or difficult to choose the appropriate Geographic Coverage?
– Easy – Medium– Difficult
12Taxonomy Strategies LLC The business of organized information
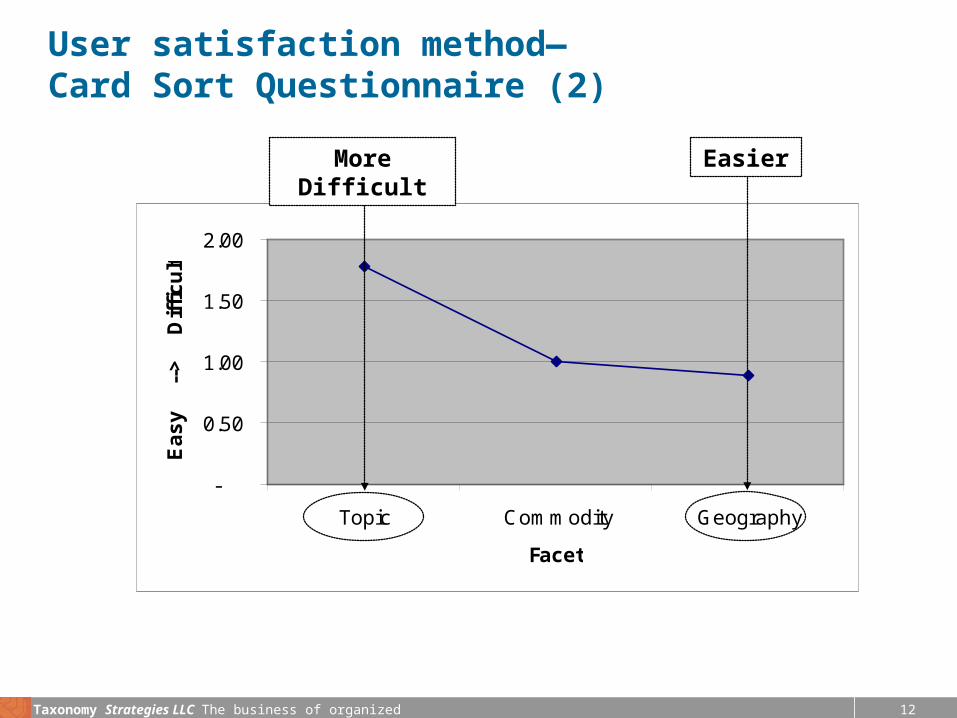
User satisfaction method—Card Sort Questionnaire (2)
-
0.50
1.00
1.50
2.00
Topic Commodity Geography
Facet
Ea
sy
-
->
Dif
fic
ult
EasierMore Difficult
13Taxonomy Strategies LLC The business of organized information
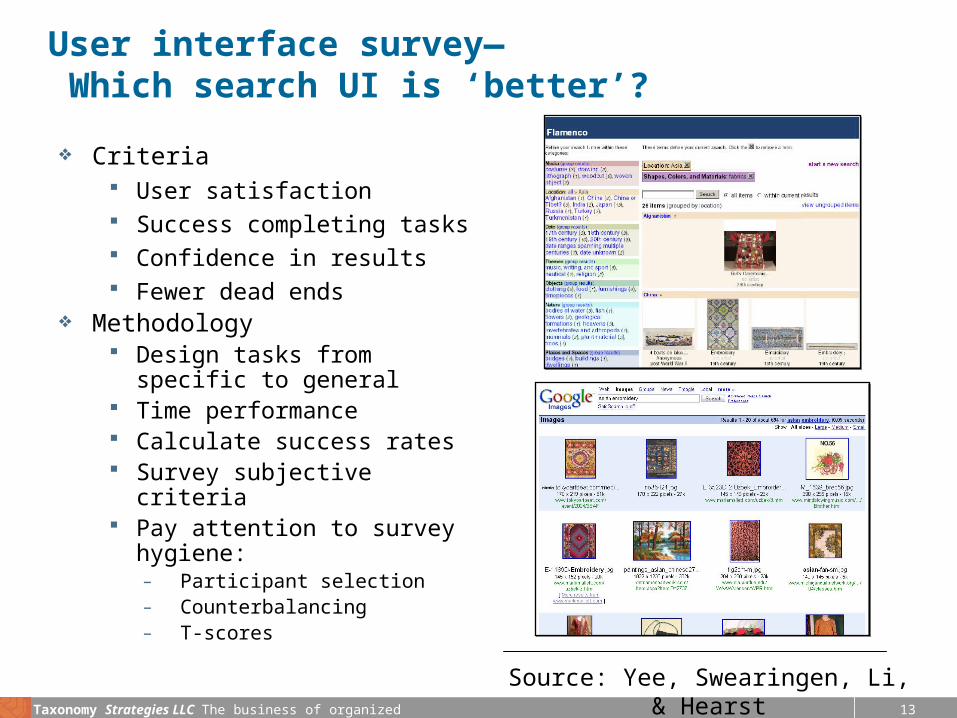
User interface survey— Which search UI is ‘better’?
Criteria User satisfaction Success completing tasks Confidence in results Fewer dead ends
Methodology Design tasks from specific to
general Time performance Calculate success rates Survey subjective criteria Pay attention to survey
hygiene:– Participant selection– Counterbalancing– T-scores
Source: Yee, Swearingen, Li, & Hearst
14Taxonomy Strategies LLC The business of organized information
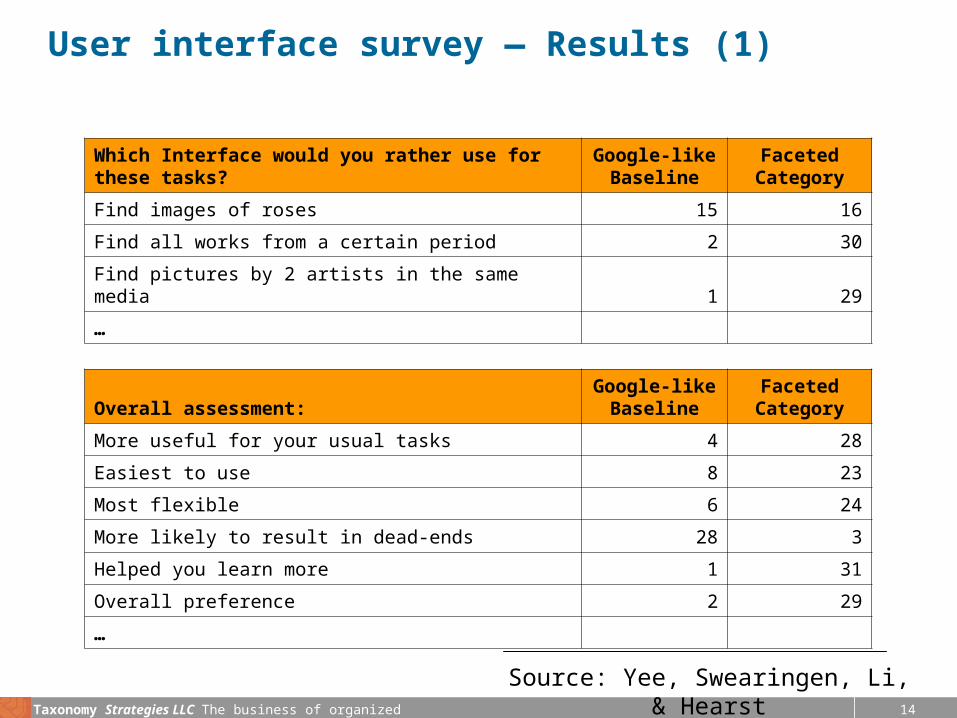
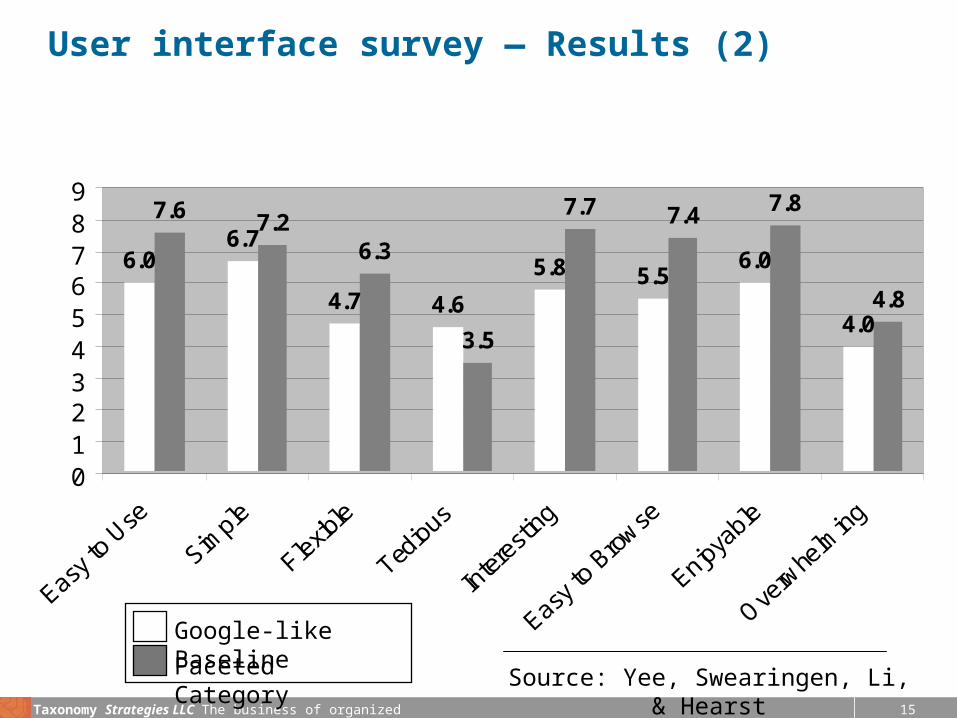
User interface survey — Results (1)
Which Interface would you rather use for these tasks?
Google-like Baseline
Faceted Category
Find images of roses 15 16
Find all works from a certain period 2 30
Find pictures by 2 artists in the same media 1 29
…
Overall assessment:Google-like
BaselineFaceted
Category
More useful for your usual tasks 4 28
Easiest to use 8 23
Most flexible 6 24
More likely to result in dead-ends 28 3
Helped you learn more 1 31
Overall preference 2 29
…
Source: Yee, Swearingen, Li, & Hearst
15Taxonomy Strategies LLC The business of organized information
User interface survey — Results (2)
6.06.7
4.7 4.6
5.8 5.56.0
4.0
7.26.3
3.5
7.7 7.4 7.8
4.8
7.6
0123456789
Faceted Category
Google-like Baseline
Source: Yee, Swearingen, Li, & Hearst
16Taxonomy Strategies LLC The business of organized information
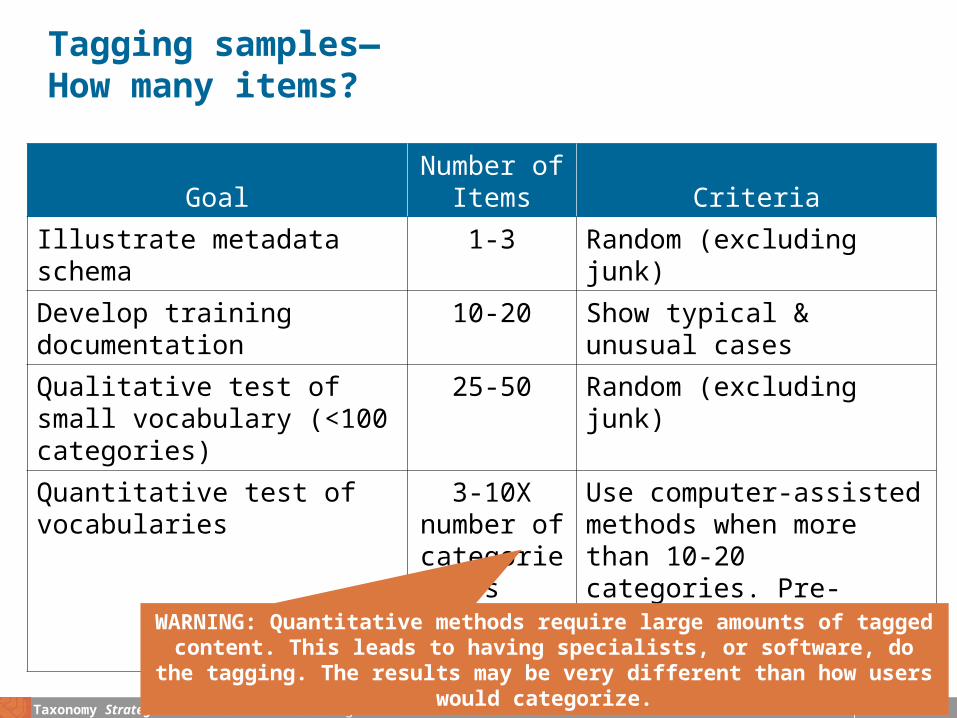
Tagging samples—How many items?
GoalNumber of
Items Criteria
Illustrate metadata schema 1-3 Random (excluding junk)
Develop training documentation
10-20 Show typical & unusual cases
Qualitative test of small vocabulary (<100 categories)
25-50 Random (excluding junk)
Quantitative test of vocabularies
3-10X number of categories
Use computer-assisted methods when more than 10-20 categories. Pre-existing metadata is the most meaningful.
WARNING: Quantitative methods require large amounts of tagged content. This leads to having specialists, or software, do the tagging. The results may
be very different than how users would categorize.
17Taxonomy Strategies LLC The business of organized information
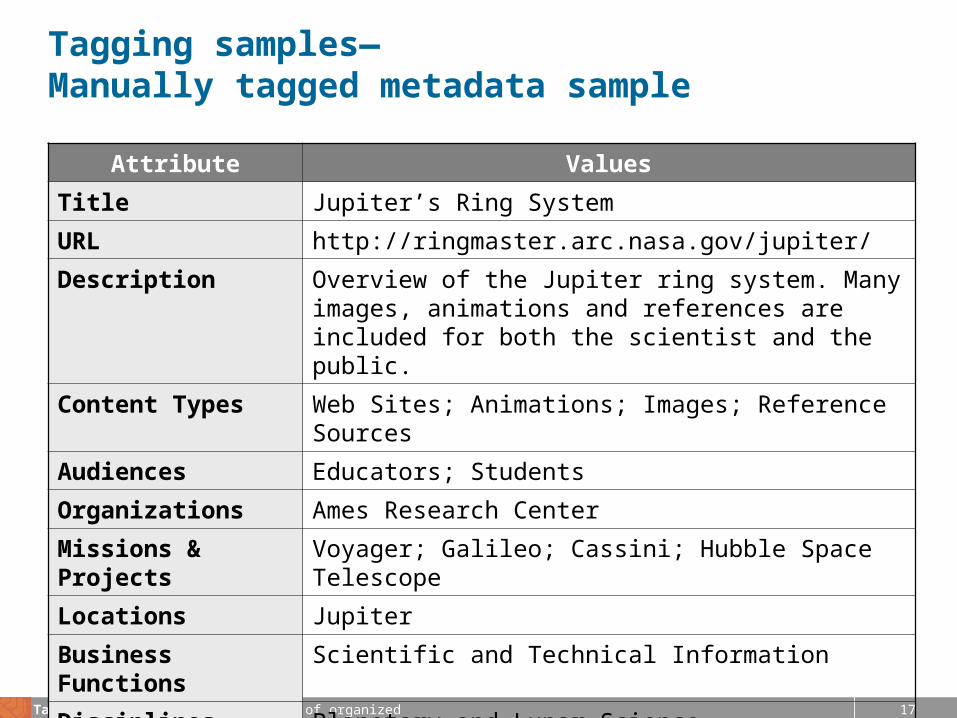
Tagging samples—Manually tagged metadata sample
Attribute Values
Title Jupiter’s Ring System
URL http://ringmaster.arc.nasa.gov/jupiter/
Description Overview of the Jupiter ring system. Many images, animations and references are included for both the scientist and the public.
Content Types Web Sites; Animations; Images; Reference Sources
Audiences Educators; Students
Organizations Ames Research Center
Missions & Projects Voyager; Galileo; Cassini; Hubble Space Telescope
Locations Jupiter
Business Functions Scientific and Technical Information
Disciplines Planetary and Lunar Science
Time Period 1979-1999
18Taxonomy Strategies LLC The business of organized information
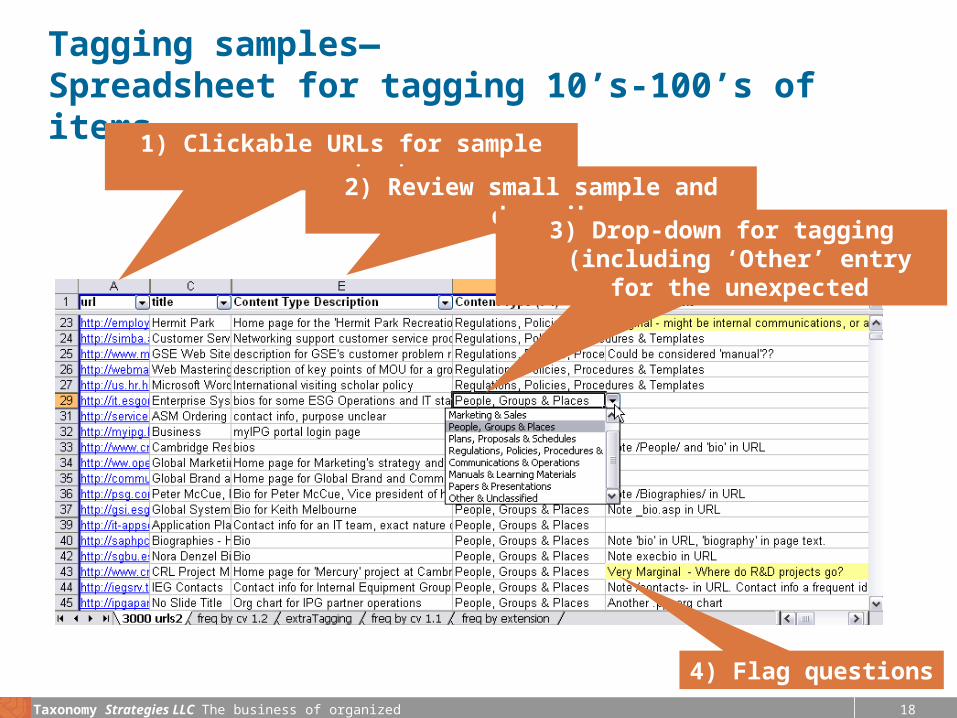
Tagging samples—Spreadsheet for tagging 10’s-100’s of items
1) Clickable URLs for sample content
2) Review small sample and describe
3) Drop-down for tagging (including ‘Other’ entry for the unexpected
4) Flag questions
19Taxonomy Strategies LLC The business of organized information
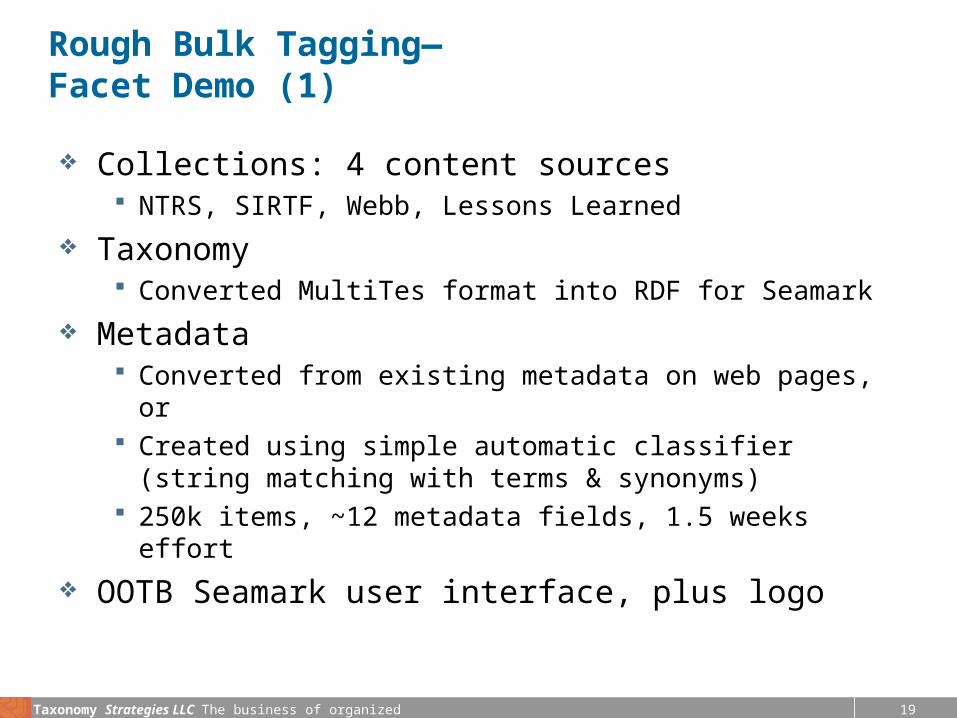
Rough Bulk Tagging—Facet Demo (1)
Collections: 4 content sources NTRS, SIRTF, Webb, Lessons Learned
Taxonomy Converted MultiTes format into RDF for Seamark
Metadata Converted from existing metadata on web pages, or Created using simple automatic classifier (string matching with
terms & synonyms) 250k items, ~12 metadata fields, 1.5 weeks effort
OOTB Seamark user interface, plus logo
20Taxonomy Strategies LLC The business of organized information
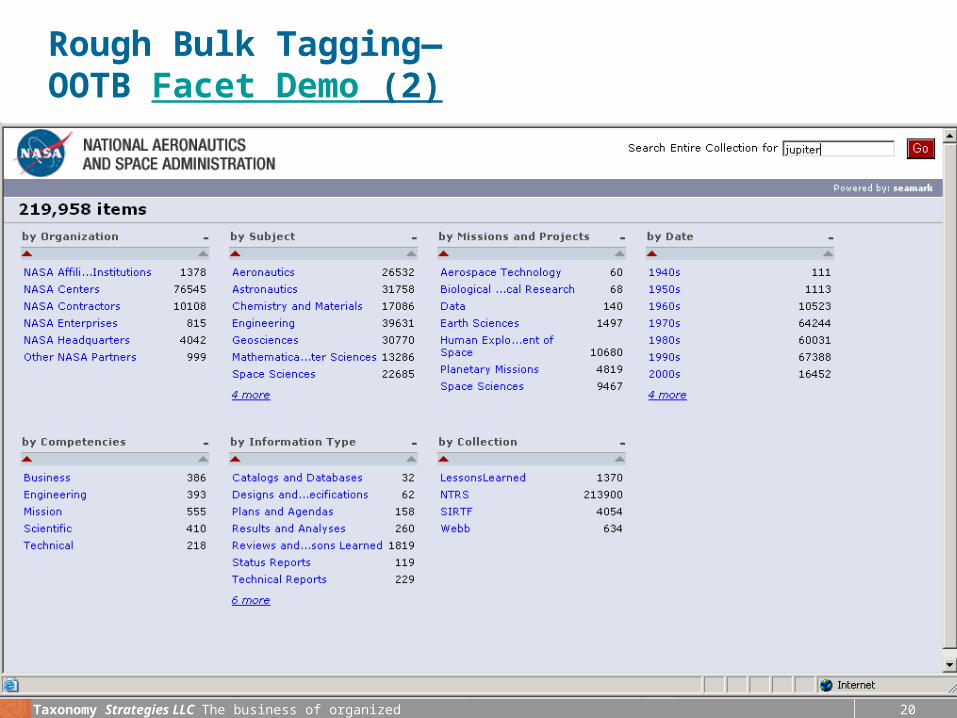
Rough Bulk Tagging— OOTB Facet Demo (2)
21Taxonomy Strategies LLC The business of organized information
Agenda
Qualitative methods Quantitative methods
22Taxonomy Strategies LLC The business of organized information
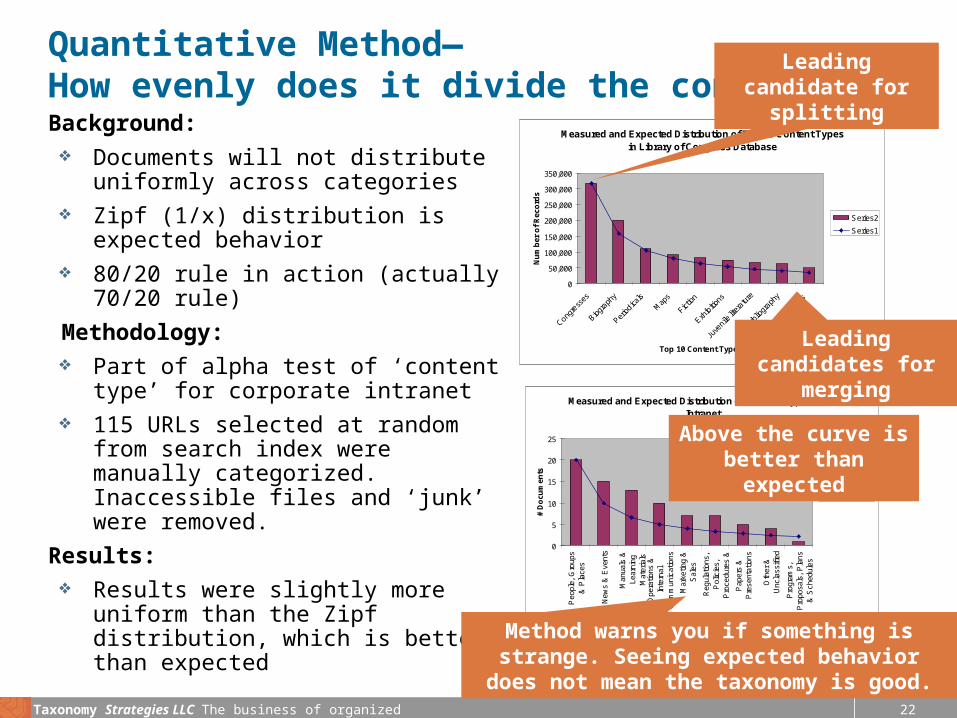
Quantitative Method—How evenly does it divide the content?Background: Documents will not distribute uniformly
across categories Zipf (1/x) distribution is expected
behavior 80/20 rule in action (actually 70/20
rule)
Methodology: Part of alpha test of ‘content type’ for
corporate intranet 115 URLs selected at random from
search index were manually categorized. Inaccessible files and ‘junk’ were removed.
Results: Results were slightly more uniform
than the Zipf distribution, which is better than expected
Measured and Expected Distribution of Top 10 Content Types in Library of Congress Database
0
50,000
100,000
150,000
200,000
250,000
300,000
350,000
Congre
sses
Biogra
phy
Period
icals
Map
s
Fiction
Exhib
itions
Juve
nile l
itera
ture
Bibliog
raph
y
Statis
tics
Top 10 Content Types
Nu
mb
er o
f R
eco
rds
Series2
Series1
Measured and Expected Distribution of Content Types in an Intranet
0
5
10
15
20
25
Peo
ple,
Gro
ups
& P
lace
s
New
s &
Eve
nts
Man
uals
&Le
arni
ngM
ater
ials
Ope
ratio
ns &
Inte
rnal
Com
mun
icat
ions
Mar
ketin
g &
Sal
es
Reg
ulat
ions
,P
olic
ies,
Pro
cedu
res
&
Pap
ers
&P
rese
ntat
ions
Oth
er &
Unc
lass
ified
Pro
gram
s,P
ropo
sals
, P
lans
& S
ched
ules
Content Type
# D
ocu
men
ts
Measured
Expected
Leading candidate for splitting
Leading candidates for merging
Above the curve is better than expected
Method warns you if something is strange. Seeing expected behavior does not mean the
taxonomy is good.
23Taxonomy Strategies LLC The business of organized information
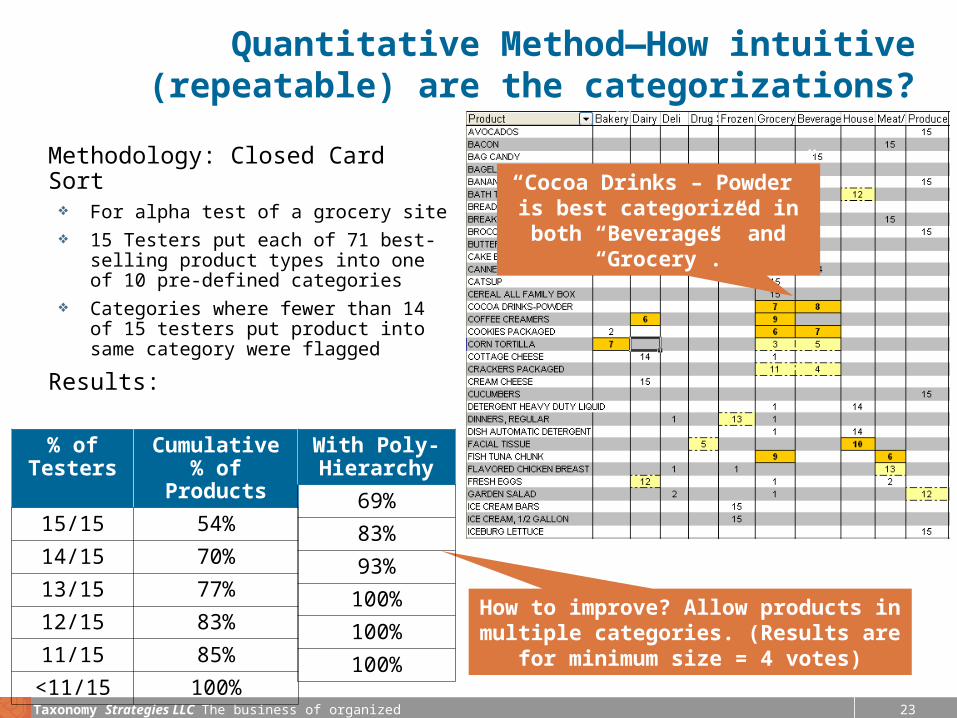
Quantitative Method—How intuitive (repeatable) are the categorizations?
Methodology: Closed Card Sort For alpha test of a grocery site 15 Testers put each of 71 best-selling
product types into one of 10 pre-defined categories
Categories where fewer than 14 of 15 testers put product into same category were flagged
Results:
% of Testers
Cumulative % of Products
15/15 54%
14/15 70%
13/15 77%
12/15 83%
11/15 85%
<11/15 100%
“Cocoa Drinks – Powder” is best categorized in both
“Beverages” and “Grocery”.
How to improve? Allow products in multiple categories. (Results are for
minimum size = 4 votes)
With Poly-Hierarchy
69%
83%
93%
100%
100%
100%
24Taxonomy Strategies LLC The business of organized information
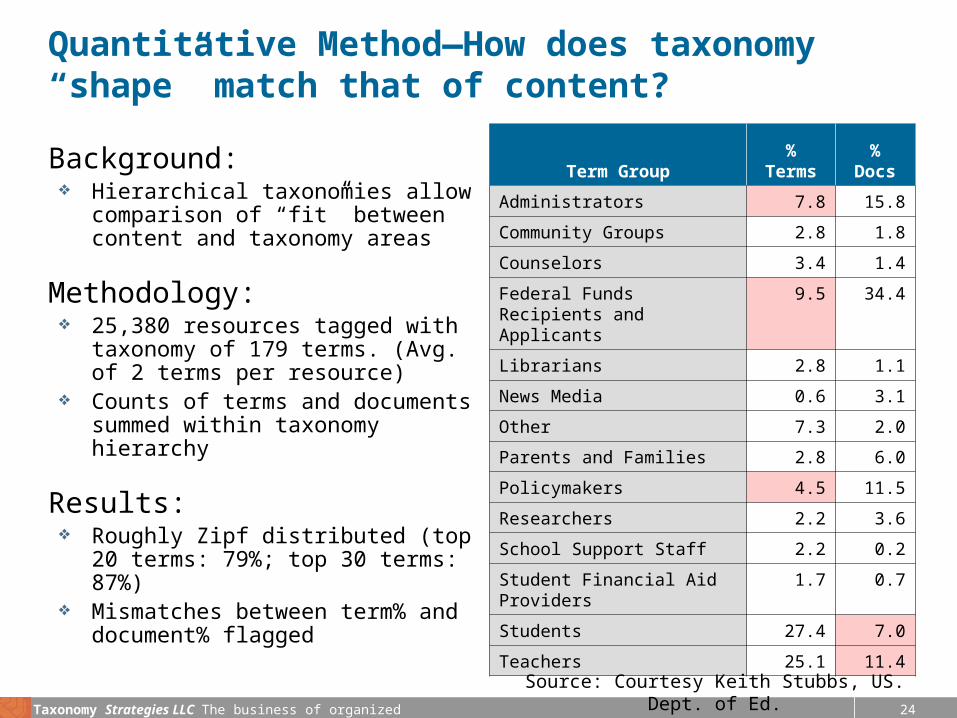
Quantitative Method—How does taxonomy “shape” match that of content?
Background: Hierarchical taxonomies allow
comparison of “fit” between content and taxonomy areas
Methodology: 25,380 resources tagged with
taxonomy of 179 terms. (Avg. of 2 terms per resource)
Counts of terms and documents summed within taxonomy hierarchy
Results: Roughly Zipf distributed (top 20
terms: 79%; top 30 terms: 87%) Mismatches between term% and
document% flagged
Term Group%
Terms%
Docs
Administrators 7.8 15.8
Community Groups 2.8 1.8
Counselors 3.4 1.4
Federal Funds Recipients and Applicants
9.5 34.4
Librarians 2.8 1.1
News Media 0.6 3.1
Other 7.3 2.0
Parents and Families 2.8 6.0
Policymakers 4.5 11.5
Researchers 2.2 3.6
School Support Staff 2.2 0.2
Student Financial Aid Providers
1.7 0.7
Students 27.4 7.0
Teachers 25.1 11.4
Source: Courtesy Keith Stubbs, US. Dept. of Ed.
25Taxonomy Strategies LLC The business of organized information
Pop Quiz
What is the #1 underused source of quantitative information on how to improve your taxonomy?
26Taxonomy Strategies LLC The business of organized information
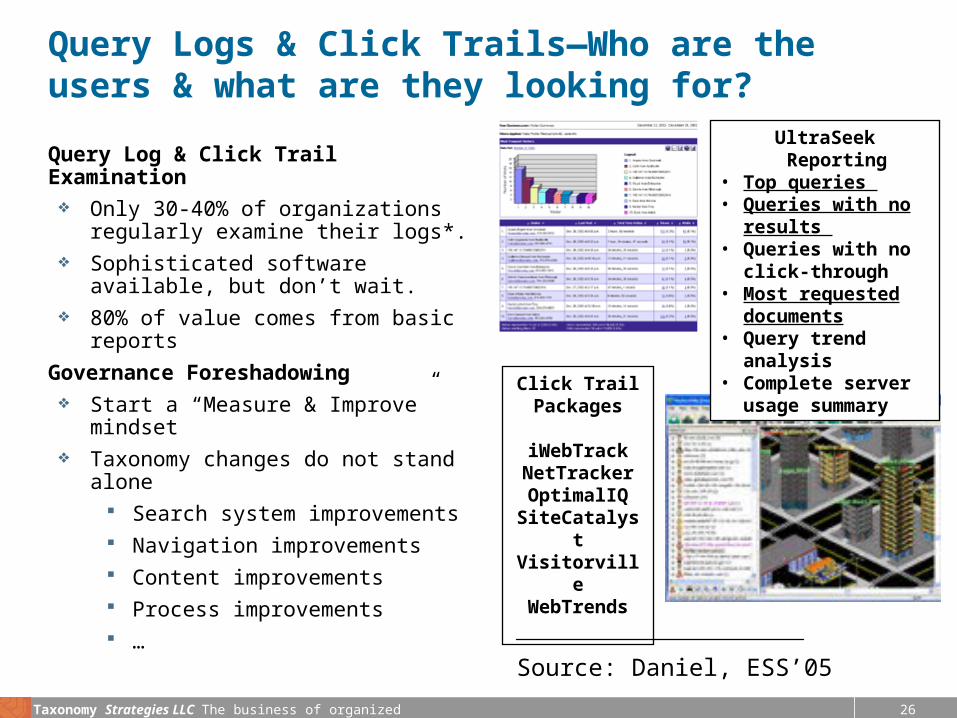
Query Logs & Click Trails—Who are the users & what are they looking for?
Query Log & Click Trail Examination Only 30-40% of organizations
regularly examine their logs*. Sophisticated software available,
but don’t wait. 80% of value comes from basic
reports
Governance Foreshadowing Start a “Measure & Improve”
mindset Taxonomy changes do not stand
alone Search system improvements Navigation improvements Content improvements Process improvements …
Click Trail Packages
iWebTrackNetTrackerOptimalIQ
SiteCatalystVisitorvilleWebTrends
Source: Daniel, ESS’05
UltraSeek Reporting
• Top queries • Queries with no
results • Queries with no
click-through • Most requested
documents • Query trend
analysis • Complete server
usage summary
Strategies LLCTaxonomy
September 28, 2005 Copyright 2005 Taxonomy Strategies LLC. All rights reserved.
QuestionsJoseph A. Busch
Ron Daniel, [email protected]
http://ww.taxonomystrategies.com
28Taxonomy Strategies LLC The business of organized information
Bibliography
K. Yee, K. Swearingen, K. Li, M. Hearst. "Searching and organizing: Faceted metadata for image search and browsing." Proceedings of the Conference on Human Factors in Computing Systems (April 2003) http://bailando.sims.berkeley.edu/papers/flamenco-chi03.pdf
R. Daniel and J. Busch. "Benchmarking Your Search Function: A Maturity Model.” http://www.taxonomystrategies.com/presentations/maturity-2005-05-17%28as-presented%29.ppt