Embed Size (px)
Citation preview

1
5/8/20085/8/2008
Strategies for Improving Chronic Disease Care
Paul E. Johnson
Department of Information and Decision Sciences
5/8/2008 2
Medical Industry Leadership Institute
Research Support

2
5/8/2008
Collaborators
Patrick O‟Connor, MD, MPH
JoAnn Sperl-Hillen, MD
William Rush, PhD
Heidi Ekstrom, MA
George Biltz, MD
Gedas Adomavicius, PhD
Jaideep Srivastava, PhD
Steve Parente, PhD
Todd Gilmer, PhD
Pradyumna (Autri) Dutta
Greg Ramsey
Ryan McCabe
3
5/8/2008 4
Background
• Past Work
• Knowledge for Practice
• Intervention Research
• Translational Research
• Knowledge for Science and Practice
• Interdisciplinary Framework
• Mode 2 Research – Gibbons, et al (1994)

3
5/8/2008
“It can be said with complete confidence that any scientist
of any age who wants to make important discoveries must
study important problems. Dull or piffling problems yield
dull or piffling answers. It is not enough that a problem
should be „interesting‟– almost any problem is interesting if
it is studied in sufficient depth. A problem must be such that
it matters what the answer is– whether to science generally
or to mankind.
P.B. Medawar
Nobel Laureate in
Medicine and Physiology
1979
5
5/8/2008
The Problem
• 18.2 million people – 6.3% of the population – have diabetes.
• Diabetes is the 5th leading cause of death by disease.
• Direct medical and indirect expenditures attributable to diabetes in 2002 were estimated at $132 billion.
- American Diabetes Association
6

4
5/8/2008 7
More Diabetes Facts
• Approximately 65% of deaths among people
with diabetes are due to heart disease and
stroke.
• Diabetes is the leading cause of new cases of
blindness among adults 20-74 years old.
• In most practice settings, only a minority of
adults with diabetes have achieved evidence-
based goals.
7
- American Diabetes Association
5/8/2008 8
… the acute care paradigm is no longer adequate for a
world, in which chronic illness is a major health challenge
facing all countries. In the U.S. alone, the Centers for
Disease Control and Prevention has recently estimated that
chronic illness is responsible for 70 percent of all health-
related deaths and 75 percent of all health care costs. The
aging of the U.S. population and increases in risk factors
such as obesity ensures that chronic illness will be an even
greater problem in future years.
Innovative Care for Chronic Conditions
World Health Organization, 2002

5
5/8/2008
Strategies for More Effective Diabetes Care
9
• Question – Science / Practice
• Data – Lab / Field
• Simulation Tools
• Testing – Practice / Policy
5/8/2008
P5
P4
P3
P2
P1
A
B1
B
C
D
G1 G2 G3
A = Expert
B = Experienced Non-Expert
B1 = Redesigned Non-Expert
C = Consensus Guidelines
D = RCTPower
(Performance)
Generality
10
Issues for Theory and Practice
Newell, A. (1990). Heuristic Programming:
Ill Structured Problems.
Progress in Operations Research, vol. 3.
6
5/8/2008
Role of Theory
• Medicine –Understanding the Task
• Decision Science and Organization Theory –
Decision Making and Policy Practices
• Cognitive Science – Explanation for Success and
Failure / Methodology for Investigation
11
5/8/2008
The Task
• Select evidence-based clinical goals
• Initiate therapy
• Titrate therapy to achieve goals
• Assess and manage co-morbid conditions
12

7
5/8/2008
• Modify Physician Decisions Through Case Based
Learning-(SimCare Project- AHRQ)
• Personalized Information for Physicians and
Patients - (Project MOVES - NIH)
• Modify Physician Decisions Through Personalized
Case Based Learning and Real Time Decision
Support- (Clinical Inertia Project-NIH)
Background of Empirical Work
13
5/8/2008
Success and Failure in
Chronic Disease Care
• Limited Experience (Lack of Expertise)
• Delay of Feedback
• Cognitive Bias / “First Do No Harm”
• Clinical Inertia
• Nature‟s Solution – A. Clark, 1998
14

8
5/8/2008
Knowledge in a Low
Base-Rate World
• Knowledge Production Problem
• Knowledge Transfer Problem
• Arbitrage: The Alternative Solution
15
5/8/2008
Information Arbitrage
• “The Lexus and the Olive Tree”
- Thomas Friedman
• A Strategy of Knowledge Production
- Gibbons et al
• A Strategy for Usable/Actionable Knowledge
- Lindbloom & Cohen
16

9
5/8/2008 17
Arbitrage for the
Personalization of Care
5/8/2008
I II III
P1
P2
P3
P4
P5
c a b
c c c
c b c
a a b
b b b
Patients
Treatments
The Personalization of Care Problem
a=optimal
b=moderate
c=weak
Outcomes:
18

10
5/8/2008
Treatments
I II III
Patient
Types
A b a C
B a c b
C c b a
Ashby‟s Law of Requisite Variety*
a=optimal
b=moderate
c=weak Outcomes:
19
W.R. Ashby, (1956). Introduction to Cybernetics.
5/8/2008 20
Some Example Patient Types
(categories) for Type II Diabetes
“Don‟t Worry Be Happy”
“Walking Time Bomb”
“Train Wreck”
11
5/8/2008
Decision Policies for a Low Base-Rate World
21
5/8/2008
Physician
Problem
Solver
Record of Problem Solving
Activity with Panel of Real
Patient Cases
22

12
5/8/2008
Physician
Problem
Solver
Record of Problem Solving
Activity with Panel of Real
Patient Cases
Record of Problem Solving
Activity with Sample of
Synthetic Patient Cases
23
5/8/2008
Physician
Problem
Solver
Record of Problem Solving
Activity with Panel of Real
Patient Cases
Record of Problem Solving
Activity with Sample of
Synthetic Patient Cases
Models of
Physician
Problem Solvers
Record of Problem
Solving Activity on
Population of Synthetic
Patient Data
24

13
5/8/2008
Physician
Problem
Solver
Record of Problem Solving
Activity with Population of
Real Patient Cases
Record of Problem Solving
Activity with Sample of
Synthetic Patient Cases
Models of
Physician
Problem Solvers
Record of Problem Solving
Activity on Population of
Synthetic Patient Data
Development of
Prediction Tools
25
5/8/2008 26
Record of
Physician
Treating
Cases
Patient Case Library
Patient Simulation
Physician
Simcare UI
Patient Model
- SimCare Patient Simulation -
14
5/8/2008 27
Diet &
Exercise
Weight
Adherence
Depression
Zoloft
HgbA1c
Sulfonylureas
Metformin
TZDs
Insulin
Blood
Pressure
Am
lod
ipin
e
Hyd
roch
loro
thia
z
ide
Lis
ino
pril
Ate
no
lol
Ca
rdiz
em
Fibrates
StatinsLDL
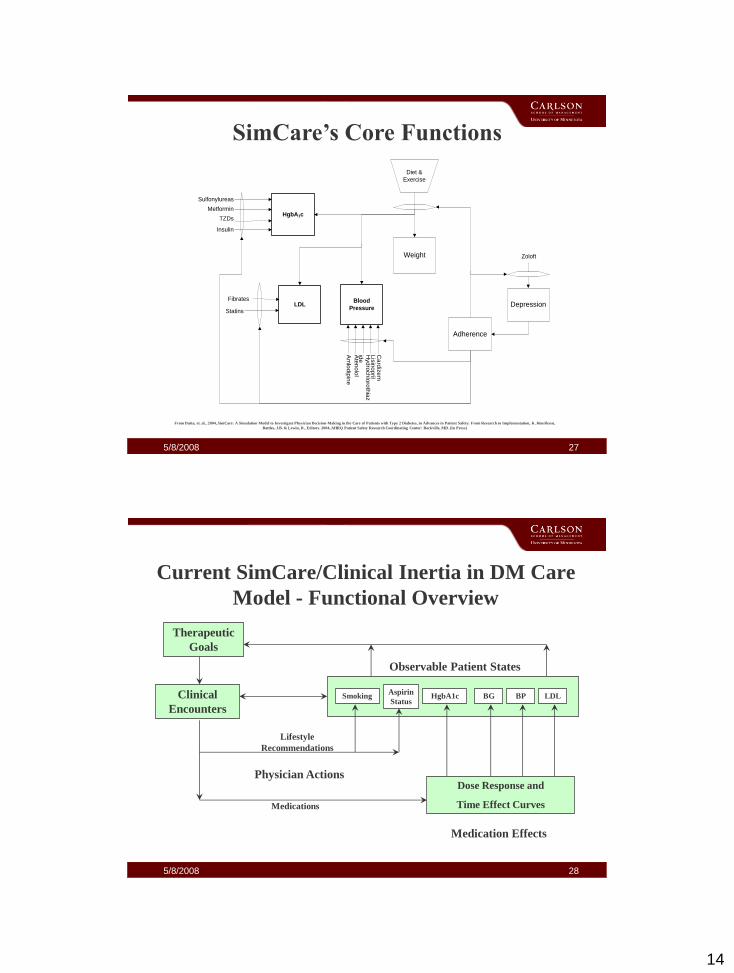
SimCare‟s Core Functions
From Dutta, et. al., 2004, SimCare: A Simulation Model to Investigate Physician Decision-Making in the Care of Patients with Type 2 Diabetes, in Advances in Patient Safety: From Research to Implementation, K. Henriksen,
Battles, J.B. & Lewin, D., Editors. 2004, AHRQ Patient Safety Research Coordinating Center: Rockville, MD. (In Press)
5/8/2008 28
Current SimCare/Clinical Inertia in DM Care
Model - Functional Overview
Aspirin
StatusHgbA1cSmoking BG BP LDL
Observable Patient States
Therapeutic
Goals
Clinical
Encounters
Physician ActionsDose Response and
Time Effect CurvesMedications
Lifestyle
Recommendations
Medication Effects

15
5/8/2008 29
The SimCare Study
40 Physicians
3 Simulated Patients
5/8/2008 30
SimCare Patient Cases
• Case 1: Initiate & titrate oral medications to
reach evidence- based goals
• Case 2: Detect & treat depression, stop
contraindicated metformin, adjust insulin
once depression is treated
• Case 3: Recognize that metformin & glipizide are
contraindicated, initiate & titrate insulin to
reach evidence-based goal

16
5/8/2008
Errors in the Treatment of Chronic Disease
• Omission
Failure to collect information
Failure to start medication
Failure to titrate to goal
• Commission
Contra indications
31
5/8/2008
Health Outcome (A1c) vs. Cost vs. Frequency of Errors (Total) for
Selected Physicians on Synthetic Patient 15 (Case 1)
32
0
5
10
0
500
1000
1500
2000
2500
7.0 7.3 7.5 7.5 8.2 8.3
Om
iss
ion
Err
ors
Co
st ($
)
Total Costs
ErrorsTotal Cost=Pharmacy+Referral+Lab Test
91 days8 enctrs
120 days8 enctrs
126 days4 enctrs
309 days9 enctrs
42 days5 enctrs
360 days6 enctrs

17
5/8/2008
Current A1c – Previous A1c
Less Frequent
Less Intensive
Titration
More Frequent
More Intensive
Titration
Non-Expert Physician Expert Physician
Process
(Feedback)
Current A1c – Expected A1c
Process
(Feedforward)
Physician Decision Making Methods
33
5/8/2008
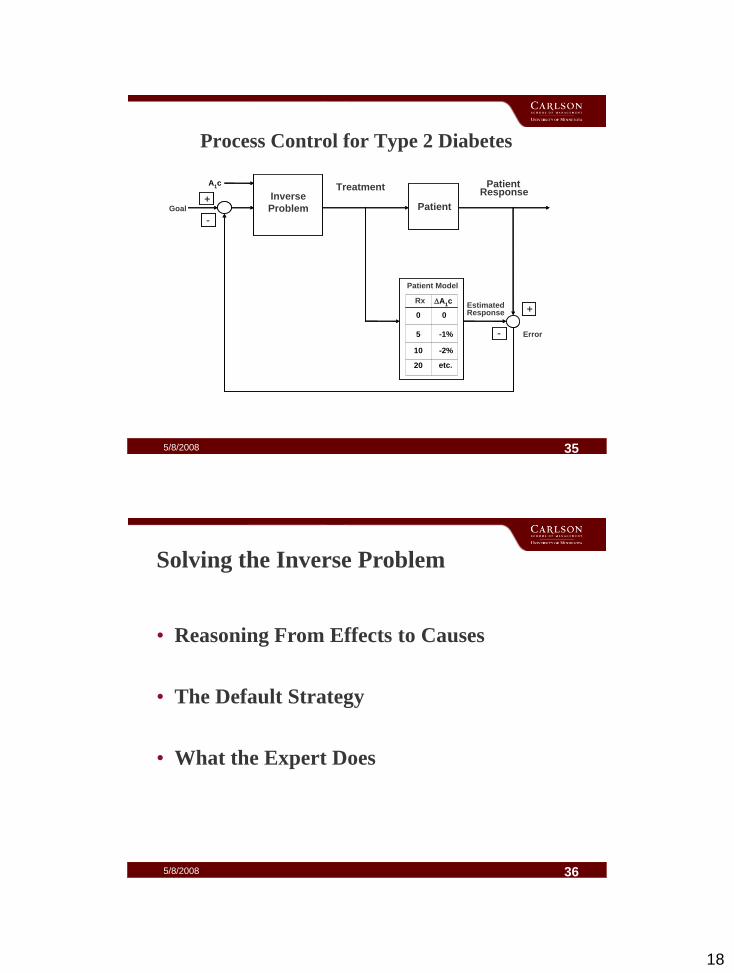
Decision Making as Process Control
• Series of Decisions
• Decisions are Interdependent
• The environment changes, both
autonomously and as a consequence of previous
decisions
34
18
5/8/2008
Process Control for Type 2 Diabetes
Goal Patient
PatientResponse
Treatment
Patient Model
Rx A1c
0 0
5 -1%
10 -2%
20 etc
EstimatedResponse
Error
+
-
-
+ Inverse
Problem Patient
Patient Model
+
-
-
+
Rx
0
5
10
20
0
-1%
-2%
etc.
A1c
A1c
35
5/8/2008
Solving the Inverse Problem
• Reasoning From Effects to Causes
• The Default Strategy
• What the Expert Does
36

19
5/8/2008
Expert‟s Solution: Solving the Inverse Problem
Treatment
MoveDistance to Goal X
Current Treatment:
No treatment
Oral Medication
Insulin
Treatment needed to get the desired effect
3
Current Medications Treatment Move
3
3
No treatment
Oral med
Oral - max dose
Start 2 oral medications
Increase dose, introduce 2nd oral medication
Start Insulin, adjust quickly
Distance to
Goal
37
5/8/2008
Explaining Success
• Process Control
• The Patient Model
• Solving the Inverse Problem
38

20
5/8/2008
Explaining Failure
• Slips and Mistakes
• Lack of Knowledge
• Inert Knowledge
• Mind Bugs
39
5/8/2008
T
R
D E
T
R
D E
Feed Forward
Feedback
Decision Making as Process Control
40
W.R. Ashby (1956). Introduction to Cybernetics

21
5/8/2008
Feedback Strategy(Anchoring & Adjustment)
• Determine Anchor (Goal or Desired Decrease in
A1c)
• Determine Distance to Goal
• Select Move (Medication & Dose)
• Compare Observed A1c with Anchor
• Iterate to Goal
41
5/8/2008
Feed Forward Strategy
• Determine Distance and Time to Achieve Goal
• Determine Rate of Change (Slope) Needed to Achieve Goal
• Select Move (Medication & Dose)
• Compare Observed & Expected A1c
• Iterate to Goal
42

22
5/8/2008
Expert‟s Strategy
• Determine Distance & Time to Achieve Goal
• Determine Rate of Change (Slope) Needed to Achieve Goal
• Select Move (Medication & Dose)
• Compare Observed & Expected A1c
• Determine Adjustments in Slope Needed to Achieve Goal
• Iterate to Goal
43
5/8/2008 4444
Comparison of Expert and Expert‟s
Method on Synthetic Patient 15
5
6
7
8
9
10
11
0 100 200 300 400 500
Number of Treatment Days Elapsed
A1
c Method
Expert

23
5/8/2008
Performance of Physician Models
on 13 Synthetic Patients
Patient
Characteristics
(A1c)
Feedback Feedforward
Physician Physician
4011 4018 5008 5005 4023 Expert
7 < A1c < 12 (13 total)
3 3 5 10 12 13
A1c >9 (6 total)
2 0 0 3 5 6
A1c <9 (7 total)
1 3 5 7 7 7
45
5/8/2008 46
Effect of Physician Treatment Strategies
on Populations of Simulated Patients

24
5/8/2008
Target Population of Simulated Patients
Initial A1c
Adherence Total
High Low
A1c > 10% 458 153 611
8 < A1c < 10% 1394 284 1678
A1c < 8% 6687 1024 7711
Total 8539 1461 10000
(Number of Patients Per Cell Reflects
Distribution in Real Patient Population)
47
5/8/2008 48
Treatment Strategies for Effective
Diabetes Care
Feedback Feedforward
Weak WeakStrong Strong

25
5/8/2008 49
Decision Rules(Far From Goal)
Monitor A1c level: increase meds when patient not at goal and A1c not decreasing
Monitor A1c level: increase meds when patient not at goal
Monitor Rate of Change (slope) in A1c level: increase meds and/or reduce time between visits to maintain minimum rate of reduction in A1c (e.g., 0.5% per month*)
Monitor Change in Slope: increase meds and/or reduce time between visits to maintain minimum rate of reduction in A1c to meet time goal (e.g., 1 yr.)
Feedback Weak
Feedback Strong
Feedforward Weak
Feedforward Strong
Expert
*compute as monthly decrease in A1c required to reach goal
within a specified period of time, e.g., 1 yr.
5/8/2008 50
Decision Rules(Near Goal A1c = 7.5)
Increase dose when A1c has stopped decreasing (Nature‟s Solution)
Increase dose when Avg. SMBG has stopped decreasing (Nature‟s Solution)
Increase dose when A1c above goal (Org. scaffolding)
Increase dose when A1c above goal & prescribed meds estimated insufficient to reach goal (adding dose response curves)
Feedback Weak
Feedback Strong
Feedforward Weak
Feedforward Strong
Expert

26
5/8/2008 51
Decision Rules(Maintaining Goal)
Increase med dose when A1c above “recidivism threshold”
Increase med dose when A1c or avg. SMBG above “recidivism threshold”
Increase dose when prior avg. SMBG above goal and avg. SMBG values have upward slope.
Feedback Weak
Feedback Strong
Feedforward Weak
Feedforward Strong
Expert
A1c Recidivism threshold = 7.5%
SMBG Recidivism threshold = 165 mg/dL
5/8/2008 52
Effect of 1 Year of Treatment
Initial A1c > 10%
6
7
8
9
10
11
12
0 1
Years in Treatment
Avera
ge A
1c (
%) FBW
FBS
FFW
FFS
HP
Guidelines
* Staged Diabetes Mgmt (SDM) Guidelines, 2005.
Effect of 1 Year of Treatment by Models,
Physicians and Clinical Guidelines
P
N= 611 for Models, N= 438 for Physicians

27
5/8/2008 53
Effect of 1 Year of Treatment by Models,
Physicians and Clinical Guidelines
N= 1687 for Models, N= 1207 for Physicians
P
5/8/2008
Years in Treatment
Aver
age
A1c
(%)
Effect of Treatment Strategies over Time
54
N= 611
Average A1cInitial A1c > 10%
6
7
8
9
10
11
12
0 1 2 3 4
Years in Treatment
Avera
ge A
1c (
%)
FBW
FBS
FFW
FFS
Guidelines

28
5/8/2008
Treatment Strategy
Sta
nd
ard
Dev
iati
on
of
A1
c
Treatment Strategies and Variation in Patient State
(Initial A1c Values > 10%)
(Average A1c Value in Bars)
55
N= 611
5/8/2008 56
Cost to Bring Patients to A1c Goal - Year 1
Strategy
Pt Type
(# Pts) % of Pts at Goal PMPM
FBW
LH (6687)
88 186
FBS 95 179
FFW 100 180
FFS 100 191
EXP 100 192
FBW
MH (1394)
11 2822
FBS 43 831
FFW 76 509
FFS 94 504
EXP 98 502
FBW
HH (458)
FBS 3 14660
FFW 15 3094
FFS 65 1014
EXP 93 821
PMPM =
Per Member
Per Month
$

29
5/8/2008 57
Cost to Bring Patients to A1c Goal - Year 2
Strategy
Pt Type
(# Pts) % of Pts @ Goal PMPM
FBW
LH (6687)
95 712
FBS 100 542
FFW 100 718
FFS 100 548
EXP 100 553
FBW
MH (1394)
41 3958
FBS 84 2230
FFW 95 3492
FFS 100 2355
EXP 100 2206
FBW
HH (458)
2 33146
FBS 30 5234
FFW 67 3216
FFS 95 2877
EXP 99 2960
PMPM =
Per Member
Per Month
$
5/8/2008 58
Cost to Reduce A1c by 0.5% - Year 1
Strategy
Pt Type
(# Pts)
% of Pts with 0.5%
Change PMPM
FBW
LH (6687)
6 2807
FBS 10 1745
FFW 13 1410
FFS 16 1160
EXP 17 1140
FBW
MH (1394)
63 503
FBS 86 419
FFW 96 407
FFS 96 494
EXP 97 507
FBW
HH (458)
74 466
FBS 91 458
FFW 98 474
FFS 100 663
EXP 100 767
PMPM =
Per Member
Per Month
$
30
5/8/2008 59
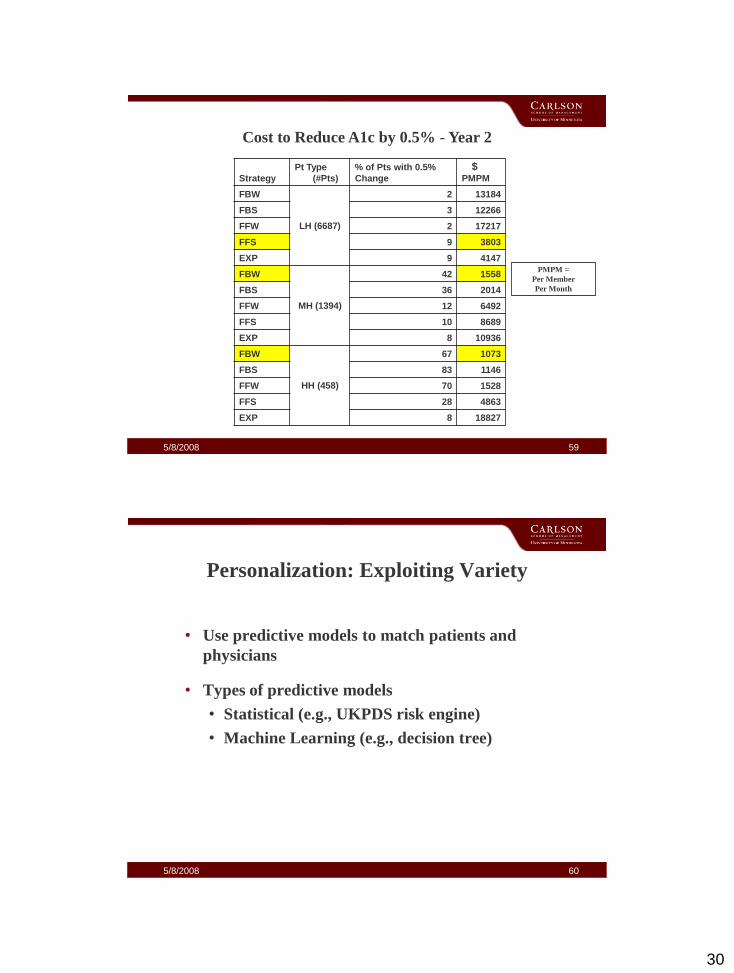
Cost to Reduce A1c by 0.5% - Year 2
Strategy
Pt Type
(#Pts)
% of Pts with 0.5%
Change PMPM
FBW
LH (6687)
2 13184
FBS 3 12266
FFW 2 17217
FFS 9 3803
EXP 9 4147
FBW
MH (1394)
42 1558
FBS 36 2014
FFW 12 6492
FFS 10 8689
EXP 8 10936
FBW
HH (458)
67 1073
FBS 83 1146
FFW 70 1528
FFS 28 4863
EXP 8 18827
PMPM =
Per Member
Per Month
$
5/8/2008 60
Personalization: Exploiting Variety
• Use predictive models to match patients and
physicians
• Types of predictive models
• Statistical (e.g., UKPDS risk engine)
• Machine Learning (e.g., decision tree)

31
5/8/2008 61
Experiment: Switch Patients to Low Cost FBW
Strategy for Maintenance
• Treat patients A1c > 10% and A1c < 8% with FBS,
FFW, FFS, Expert strategies for 1 year
• For all patients that reached goal at end of 1 year:
• maintain by using existing strategies
• maintain by switching to FBW strategy
5/8/2008 62
Experiment: Number of Patients at Goal
by Year 1
Strategy
Pt Type
(# pts) Pt Count
FBS
LH (6687)
6344
FFW 6666
FFS 6682
EXP 6686
FBS
HH (458)
13
FFW 69
FFS 299
EXP 428

32
5/8/2008 63
Experiment: Cost to Treat
Year 2
Strategy
Pt Type
(# pts)
Avg Monthly Cost to
Maintain Tracked Pts
Maintained
by Initiating
Strategy ($)
Maintained by
FBW Strategy
($)
FBS
LH (6687)
312 301
FFW 331 325
FFS 354 339
EXP 355 340
FBS
HH (458)
1083 1078
FFW 1097 1095
FFS 1234 1232
EXP 1443 1448
5/8/2008 64
Cost Savings Associated with Switching
Treatment Strategies in Year 2
Initial Strategy
(# pts at goal)
Pt Type
(# pts)
Cost* Savings per
Year ($) when
switched to FBW
Strategy
FBS (6344)
LH (6687)
837,408
FFW (6666) 479,952
FFS (6682) 1,202,760
EXP (6686) 1,203,480
FBS (13)
HH (458)
780
FFW (69) 1,656
FFS (299) 7,176
EXP (428) (25,680)
*Cost = Cost of year 2 treatment for tracked patients minus cost of year 2 treatments for those same pts when
tested in year 2 with FBW strategy.

33
5/8/2008 65
The Problem of Risk
5/8/2008 66
The UKPDS (Prospective Diabetes Study)
Risk Engine*
• Model for predicting absolute risk of CHD
• Based on RCT of 4540 newly diagnosed Type 2 diabetes patients followed for 10 years.
• Independent variables: age, gender, ethnicity, smoking, A1c, SBP, cholesterol
• Statistical model composed of survival probability equations
*Stevens et al., (2001). The UKPDS risk engine: a model for the risk of coronary heart
Disease in Type II diabetes (UKPDS 56). Clinical Science, 101:671-679.

34
5/8/2008 67
Risk of Coronary Heart Disease (CHD): 1 Year of Treatment
Strategy
Pt. Type (#
pts)
% Risk of Adverse Event within 10 Yrs
CHD Event Fatal CHD
Untreated
LH (6687)
22 18
FBW 20 16
FBS 19 15
FFW 19 15
FFS 19 15
EXP 19 15
Untreated
MH (1394)
29 24
FBW 23 19
FBS 21 17
FFW 19 15
FFS 18 15
EXP 18 15
Untreated
HH (458)
42 37
FBW 32 28
FBS 30 25
FFW 23 19
FFS 19 15
EXP 19 15
5/8/2008 68
Best Practice Strategies: Low Risk (of CHD)
and Lowest (PMPM) Cost
• A1c < 8% – Expert
• A1c between 8% and 10% – Feedforward Weak
• A1c > 10% – Feedback Strong

35
5/8/2008 69
Explaining Best Practice Strategies
• A1c < 8%: Expert – makes more moves than other strategies, identifies patients for moves via slope and level of average SMBG.
• A1c between 8% and 10%: Feedforward Weak –Makes more moves than feedback models because of scheduling practices (higher # patients with 0.5% decrease) and fewer than other feedforward models (lower cost than these models) because of smooth landing rule.
• A1c > 10%: Feedback Strong – This strategy has lower costs because it starts fewer patients on insulin (compared to oral meds insulin is costly)
5/8/2008
Issues for Requisite Variety in the Treatment of Chronic Illness
70
• Regulation (with Respect Patient Categories)
• Personalization (with Respect to outcome, cost, risk)
• Converting Theory into Practice

36
5/8/2008
P5
P4
P3
P2
P1
A
B1
B
C
D
G1 G2 G3
A = Expert
B = Experienced Non-Expert
B1 = Redesigned Non-Expert
C = Consensus Guidelines
D = RCTPower
(Performance)
Generality
71
Issues for Theory and Practice
5/8/2008 72
Summary and Conclusions
• Modeling for Decision Making & Treatment Outcomes
•Comparative Effectiveness Studies
•Prioritization of Care
•Policy Development
• Personalization of Care
•Explanatory vs Predictive Modeling
•Changing Practice- Training vs Decision Support
•Redesign of Treatment Policies
• Unsolved Problems

37
5/8/2008
… To address the rising rates of chronic conditions, an
evolution in health care systems is imperative. Acute
care will always be necessary (even chronic conditions
have acute episodes), but at the same time health care
systems must embrace the concept of caring for long-
term health problems.
Patients, health care organizations and decision-
makers have to recognize the need to expand systems to
include new concepts…
Innovative Care for Chronic Conditions
World Health Organization, 2002
73
The Way Forward
5/8/2008
It remains to be seen whether work that
combines knowledge from fields as
diverse as computer science, decision
making and the management of clinical
care, can contribute to the development
of such concepts.
But as Sherlock Holmes said to Watson
“… the game is afoot…”
74


![Improving Chronic Disease Management€¦ · Congestive Heart Failure disease management initiative in British Columbia [see Appendix A for Collaborative members]. Background information](https://img.pdfslide.us/doc/110x75/5f48ede45760ae07f21c474d/improving-chronic-disease-management-congestive-heart-failure-disease-management.jpg)