Embed Size (px)
Citation preview
Strategies for Containing Costsin Higher Education
Michael F. MiddaughAssistant Vice President – Institutional Research and Planning
University of [email protected]
www.udel.edu/ir
10+ Years of Criticism for Higher Education
“[The academic ratchet] is a term to describe the steady, irreversible shift of faculty allegiance away from the goals of a given institution, toward those of an academic specialty. The ratchet denotes the advance of an entrepreneurial spirit among faculty nationwide, leading to increased emphasis on research and publication, and on teaching one’s specialty in favor of general introduction courses, often at the expense of coherence in an academic curriculum. Institutions seeking to enhance their own prestige may contribute to the ratchet by reducing faculty teaching and advising responsibilities across the board, enabling faculty to pursue their individual research and publication with fewer distractions. The academic ratchet raises an institution’s costs, and it results in undergraduates paying more to attend institutions in which they receive less attention than in previous decades.
(Robert Zemsky and William Massy, 1990)
10+ Years of Criticism for Higher Education
“To an overwhelming degree, they [American research universities] have furnished the cultural, intellectual, economic, and political leadership of the nation. Nevertheless, the research universities have too often failed, and continue to fail, their undergraduate populations…Again and again, universities are guilty of advertising practices they would condemn in the commercial world. Recruitment materials display proudly the world-famous professors, the splendid facilities and ground breaking research that goes on within them, but thousands of students graduate without ever seeing the world-famous professors or tasting genuine research. Some of their instructors are likely to be badly trained or untrained teaching assistants who are groping their way toward a teaching technique; some others may be tenured drones who deliver set lectures from yellowed notes, making no effort to engage the bored minds of the students in front of them.
(Boyer Commission on Educating Undergraduates in the Research University, 1998)
10+Years of Criticism for Higher Education
“The trouble is that higher education remains a labor-intensive industry made up of thousands of stubbornly independent and mutually jealous units that must support expensive and vastly underused facilities. It is a more than $200 billion-a-year economic enterprise – many of whose leaders oddly disdain economic enterprise and often regard efficiency, productivity, and commercial opportunity with the same hauteur with which Victorian aristocrats viewed those in “trade”…The net result is a hideously inefficient system that, for all its tax advantages and public and private subsidies, still extracts a larger share of family income than almost anywhere else on the planet.
(America’s Best Colleges, 1996, p. 91.)
10+ Years of Criticism for Higher Education“A few weeks ago, Chairman [House Committee on Education and the Workforce] Boehner and I released a report called “The College Cost Crisis” which declared that the nation’s higher education system is in crisis as a result of exploding cost increase that threaten to put college out of reach for low and middle income students and families. The report concluded that decades of cost increases, in both good economic times and bad, have caused America’s higher education system to reach a crisis point. It also concluded that students and parents are losing patience with higher education “sticker shock” and that institutions of higher education are not accountable enough to parents, students, and taxpayers – the consumers of higher education….
The following statistic is one I’ve repeated many times, and will continue to repeat it until we can find a solution and interested parties start taking this issue seriously. The fact is, according to the Advisory Committee on Student Financial Assistance, cost factors prevent 48 percent of all college-qualified, low income high school graduates from attending a four-year college and 22 percent from pursuing any college at all. The statistics are similarly bleak for moderate income families. At the rate we are going, by the end of the decade, more than two million college-qualified students will miss out on the opportunity to go to college.”
(Representative Howard P. “Buck” McKeon, 2003)

Cost Versus Price
What Do We Know About Price?
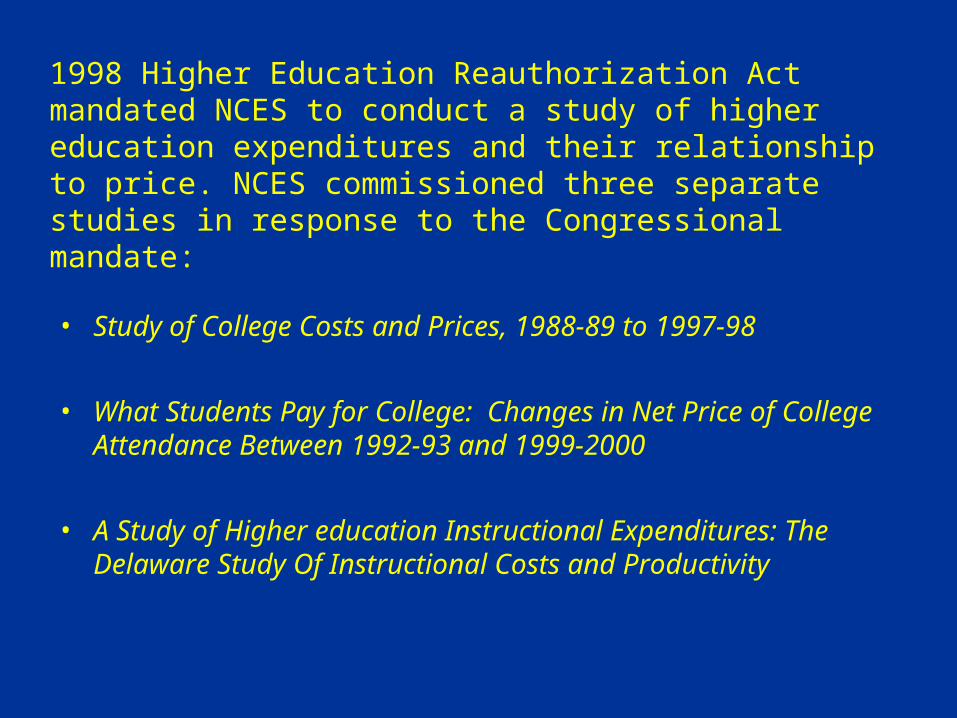
1998 Higher Education Reauthorization Act mandated NCES to conduct a study of higher education expenditures and their relationship to price. NCES commissioned three separate studies in response to the Congressional mandate:
• Study of College Costs and Prices, 1988-89 to 1997-98
• What Students Pay for College: Changes in Net Price of College Attendance Between 1992-93 and 1999-2000
• A Study of Higher education Instructional Expenditures: The Delaware Study Of Instructional Costs and Productivity

What Do We Know About College Prices?
Study of College Costs and Prices, 1988-89 to 1997-98
• Tuition increased at both public and private institutions at a rate exceeding the Consumer Price Index, and growth in tuition exceeded most other expenditure categories at most institutions.
• The study found virtually no relationship between financial aid and tuition increases at both public and private institutions across the Carnegie classification spectrum.
Study of College Costs and Prices, 1988-89 to 1997-98
• The study found other non-financial variables to be more closely associated with increases in tuition.
• Decreasing revenue from government appropriations – in particular, state appropriations – was the single most important variable associated with tuition increases at public four-year institutions during the time frame studied. Although increases in instructional expenditures were associated with tuition increases at those institutions, the correlation was far weaker than that with the decline in state support for higher education.
• Multiple factors at private four-year institutions are more strongly associated with tuition increases than is an infusion of Federal financial aid. Among the internal factors are the availability of institutional aid and faculty compensation levels, as well as return on endowment, gift income, and contract/grant revenue. A number of external factors were also strongly associated with the magnitude of tuition increases including competitor tuition rates, particularly at neighboring public institutions, and per capita income in the state where the institution is located.
What Students Pay for College: Changes in Net Price of College Attendance Between 1992-93 and 1999-2000
• It is important to clearly distinguish between “sticker price,” i.e., the published schedule of tuition and fees that appear in a college or university catalog, and “net price,” i.e., what a student actually pays for a college education after financial aid is factored in.
• After adjusting for inflation, there is a perceptible increase in average total tuition and average total cost of attending a college or university from 1992-93 to 1999-2000. However, when grant aid was subtracted from tuition to arrive at “net tuition,” there was no change in the average amount paid by full time undergraduates during the time frame under analysis.
• When housing, food, books, and other non-tuition living expenses are added to tuition, grants are insufficient to cover the increase over time in the total cost of attending a college or university. However, not all students were affected by the increase in total cost in comparable ways. Grant aid did, in fact, cover total cost for students from the lowest income brackets, i.e., those who could least afford to pay an increase. Students in higher income brackets borrowed to meet the increase.

Some Final Words About Price
• There is no pure cause and effect relationship between price (tuition) and cost (what institutions expend in delivering a college education).
• This is due in no small measure to the fact that institutions have multiple revenue streams available to them, and each revenue stream contributes to varying degrees to meeting institutional costs.
• Moreover, colleges and universities make choices about how they spend revenues. The balance between and among teaching, research, and service reflect an institution’s mission and values. It would be foolish to suggest that tuition dollars contribute only to instructional expenditures at a college or university.
• That said, it is demonstrable that higher education institutions have been responsible fiscal stewards in containing instructional costs, and to the extent that tuition dollars contribute to the creation of knowledge through pure and applied research or extension and other service activity, the common good of society is served.
What Do We Know About Costs in Higher Education?
Delaware Study of Instructional Costs and Productivity
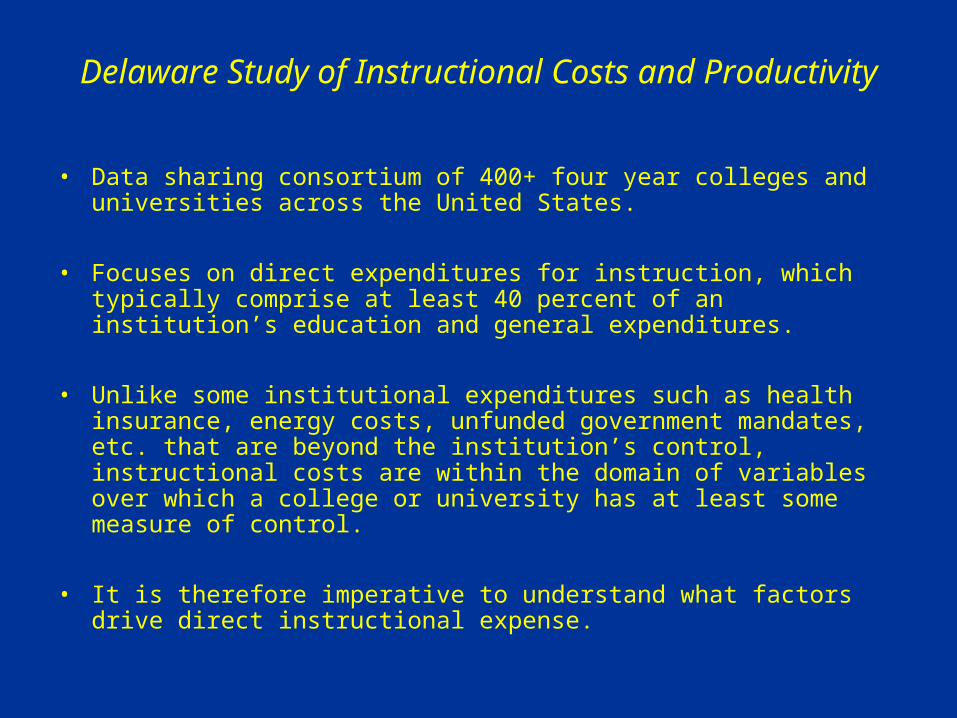
• Data sharing consortium of 400+ four year colleges and universities across the United States.
• Focuses on direct expenditures for instruction, which typically comprise at least 40 percent of an institution’s education and general expenditures.
• Unlike some institutional expenditures such as health insurance, energy costs, unfunded government mandates, etc. that are beyond the institution’s control, instructional costs are within the domain of variables over which a college or university has at least some measure of control.
• It is therefore imperative to understand what factors drive direct instructional expense.
Delaware Study of Instructional Costs and Productivity
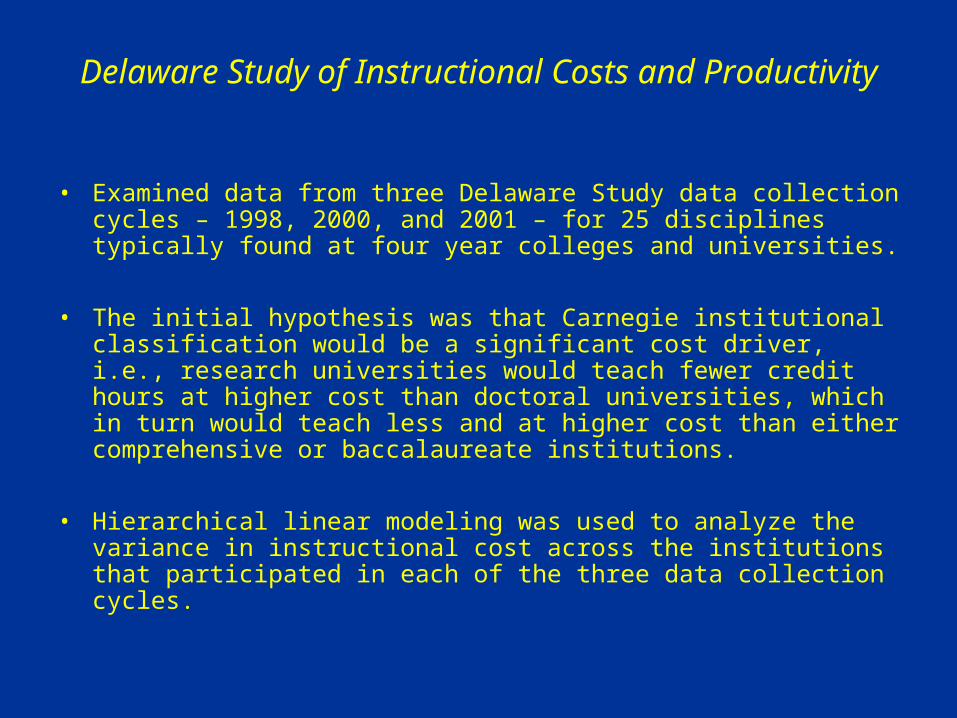
• Examined data from three Delaware Study data collection cycles – 1998, 2000, and 2001 – for 25 disciplines typically found at four year colleges and universities.
• The initial hypothesis was that Carnegie institutional classification would be a significant cost driver, i.e., research universities would teach fewer credit hours at higher cost than doctoral universities, which in turn would teach less and at higher cost than either comprehensive or baccalaureate institutions.
• Hierarchical linear modeling was used to analyze the variance in instructional cost across the institutions that participated in each of the three data collection cycles.
Delaware Study of Instructional Costs and Productivity
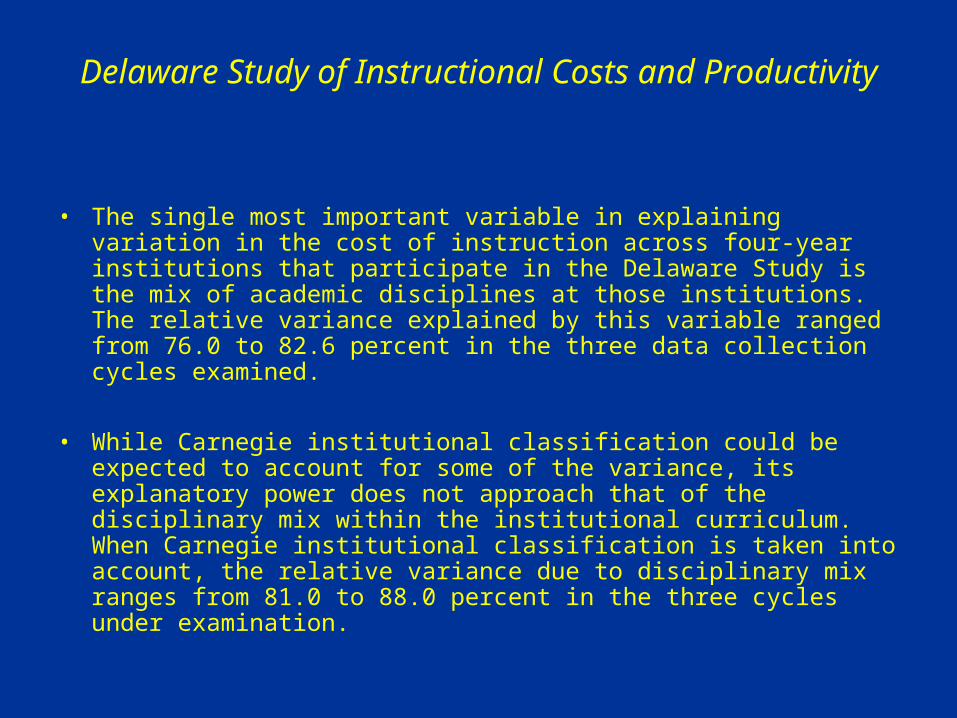
• The single most important variable in explaining variation in the cost of instruction across four-year institutions that participate in the Delaware Study is the mix of academic disciplines at those institutions. The relative variance explained by this variable ranged from 76.0 to 82.6 percent in the three data collection cycles examined.
• While Carnegie institutional classification could be expected to account for some of the variance, its explanatory power does not approach that of the disciplinary mix within the institutional curriculum. When Carnegie institutional classification is taken into account, the relative variance due to disciplinary mix ranges from 81.0 to 88.0 percent in the three cycles under examination.
Delaware Study of Instructional Costs and Productivity
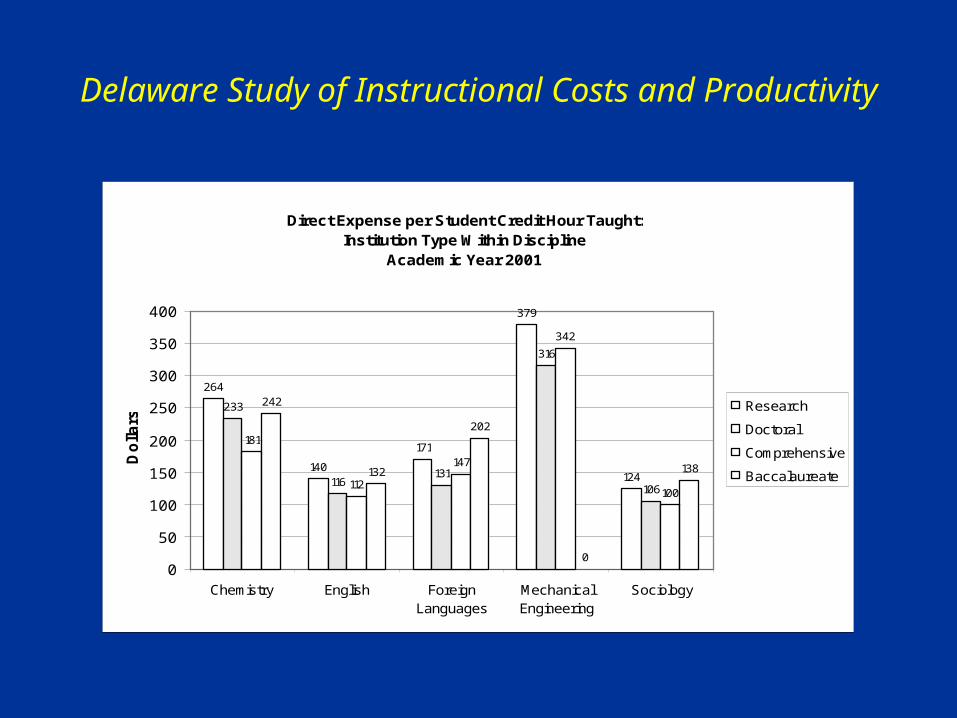
Direct Expense per Student Credit Hour Taught:Institution Type Within Discipline
Academic Year 2001
264
140
171
379
124
233
116131
316
106
181
112
147
342
100
242
132
202
0
138
0
50
100
150
200
250
300
350
400
Chemistry English ForeignLanguages
MechanicalEngineering
Sociology
Do
llars
Research
Doctoral
Comprehensive
Baccalaureate
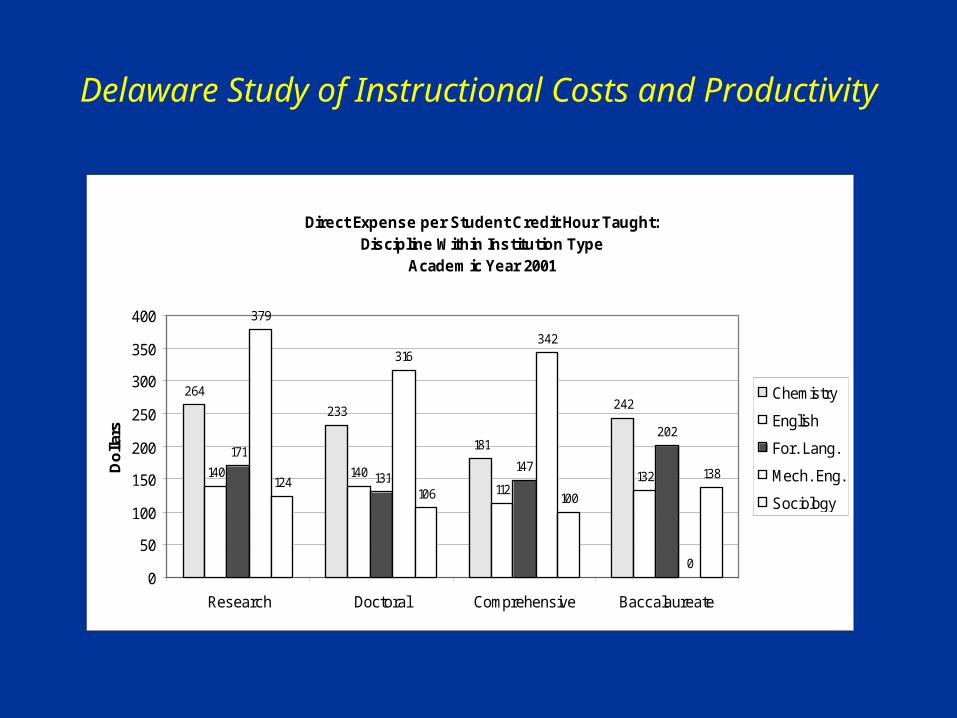
Delaware Study of Instructional Costs and Productivity
Direct Expense per Student Credit Hour Taught: Discipline Within Institution Type
Academic Year 2001
264
233
181
242
140 140112
132
171
131147
202
379
316342
0
124106 100
138
0
50
100
150
200
250
300
350
400
Research Doctoral Comprehensive Baccalaureate
Do
llars
Chemistry
English
For. Lang.
Mech. Eng.
Sociology
If disciplinary mix plays such an important role in determining overall instructional expense at an institution, have instructional costs within specific disciplines grown inordinately over time, and is it possible to identify those factors that are statistically most closely associated with direct instructional expenditures? The Delaware Study data set again helps to provide answers to these questions.
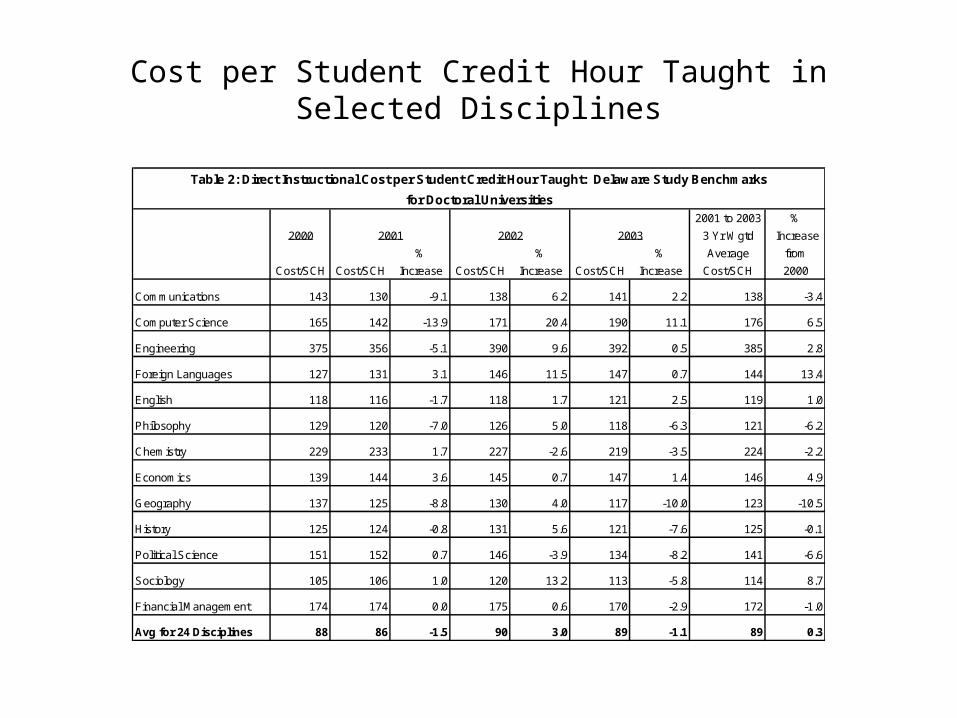
Let’s first look at cost patterns over time in those 25 disciplines.
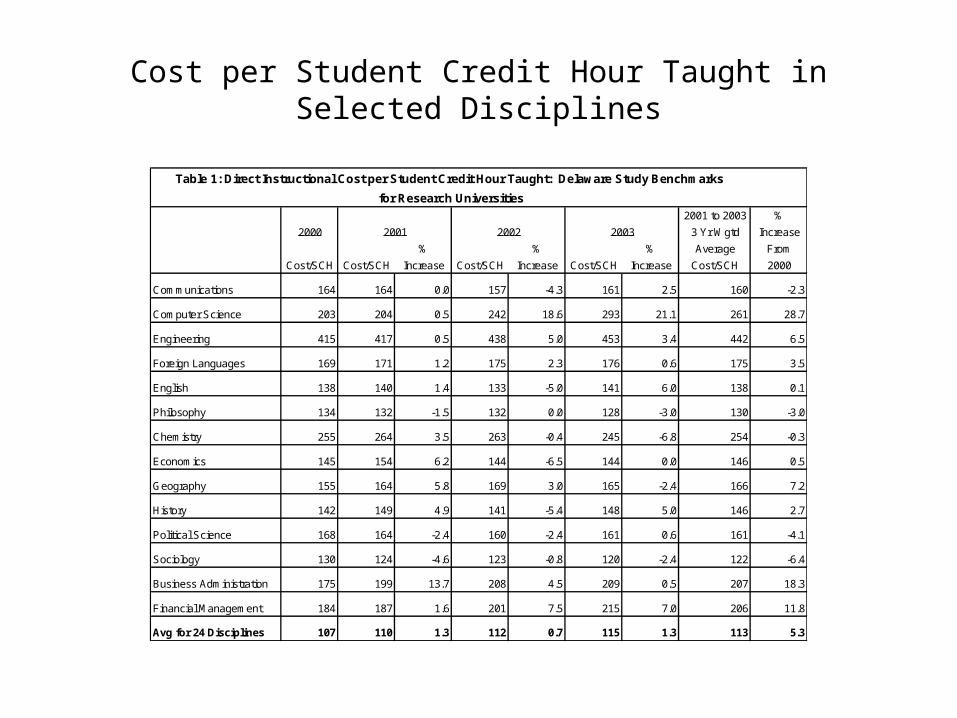
Cost per Student Credit Hour Taught in Selected Disciplines
2001 to 2003 %
3 Yr Wgtd Increase
% % % Average From
Cost/SCH Cost/SCH Increase Cost/SCH Increase Cost/SCH Increase Cost/SCH 2000
Communications 164 164 0.0 157 -4.3 161 2.5 160 -2.3
Computer Science 203 204 0.5 242 18.6 293 21.1 261 28.7
Engineering 415 417 0.5 438 5.0 453 3.4 442 6.5
Foreign Languages 169 171 1.2 175 2.3 176 0.6 175 3.5
English 138 140 1.4 133 -5.0 141 6.0 138 0.1
Philosophy 134 132 -1.5 132 0.0 128 -3.0 130 -3.0
Chemistry 255 264 3.5 263 -0.4 245 -6.8 254 -0.3
Economics 145 154 6.2 144 -6.5 144 0.0 146 0.5
Geography 155 164 5.8 169 3.0 165 -2.4 166 7.2
History 142 149 4.9 141 -5.4 148 5.0 146 2.7
Political Science 168 164 -2.4 160 -2.4 161 0.6 161 -4.1
Sociology 130 124 -4.6 123 -0.8 120 -2.4 122 -6.4
Business Administration 175 199 13.7 208 4.5 209 0.5 207 18.3
Financial Management 184 187 1.6 201 7.5 215 7.0 206 11.8
Avg for 24 Disciplines 107 110 1.3 112 0.7 115 1.3 113 5.3
Table 1: Direct Instructional Cost per Student Credit Hour Taught: Delaware Study Benchmarks
for Research Universities
2000 2001 2002 2003
Cost per Student Credit Hour Taught in Selected Disciplines
2001 to 2003 %
3 Yr Wgtd Increase
% % % Average from
Cost/SCH Cost/SCH Increase Cost/SCH Increase Cost/SCH Increase Cost/SCH 2000
Communications 143 130 -9.1 138 6.2 141 2.2 138 -3.4
Computer Science 165 142 -13.9 171 20.4 190 11.1 176 6.5
Engineering 375 356 -5.1 390 9.6 392 0.5 385 2.8
Foreign Languages 127 131 3.1 146 11.5 147 0.7 144 13.4
English 118 116 -1.7 118 1.7 121 2.5 119 1.0
Philosophy 129 120 -7.0 126 5.0 118 -6.3 121 -6.2
Chemistry 229 233 1.7 227 -2.6 219 -3.5 224 -2.2
Economics 139 144 3.6 145 0.7 147 1.4 146 4.9
Geography 137 125 -8.8 130 4.0 117 -10.0 123 -10.5
History 125 124 -0.8 131 5.6 121 -7.6 125 -0.1
Political Science 151 152 0.7 146 -3.9 134 -8.2 141 -6.6
Sociology 105 106 1.0 120 13.2 113 -5.8 114 8.7
Financial Management 174 174 0.0 175 0.6 170 -2.9 172 -1.0
Avg for 24 Disciplines 88 86 -1.5 90 3.0 89 -1.1 89 0.3
Table 2: Direct Instructional Cost per Student Credit Hour Taught: Delaware Study Benchmarks
for Doctoral Universities
2000 2001 2002 2003
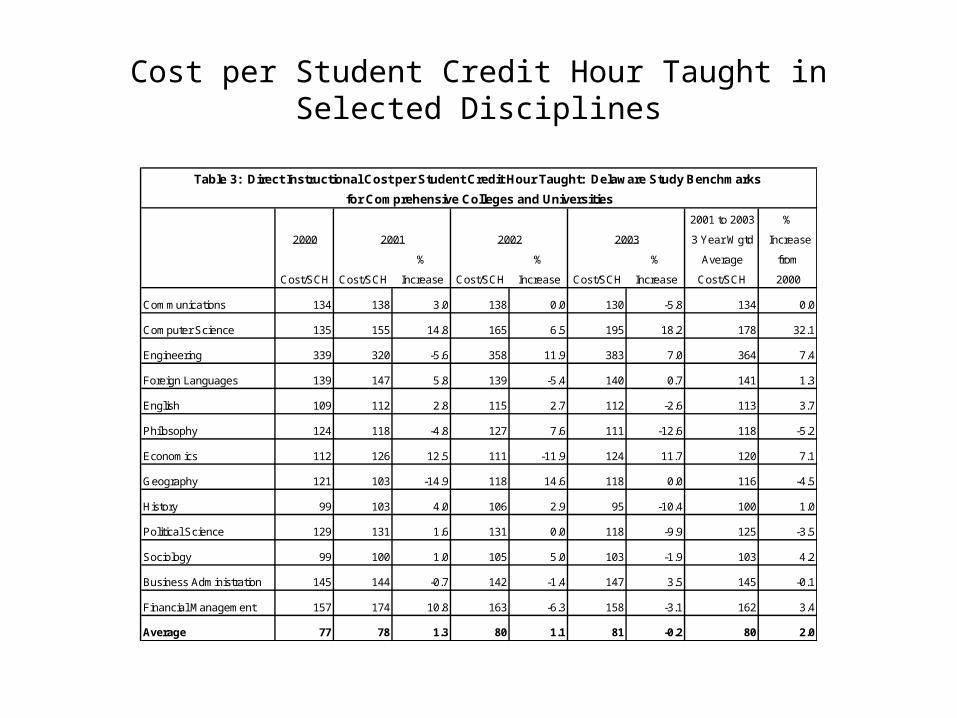
Cost per Student Credit Hour Taught in Selected Disciplines
2001 to 2003 %
3 Year Wgtd Increase
% % % Average from
Cost/SCH Cost/SCH Increase Cost/SCH Increase Cost/SCH Increase Cost/SCH 2000
Communications 134 138 3.0 138 0.0 130 -5.8 134 0.0
Computer Science 135 155 14.8 165 6.5 195 18.2 178 32.1
Engineering 339 320 -5.6 358 11.9 383 7.0 364 7.4
Foreign Languages 139 147 5.8 139 -5.4 140 0.7 141 1.3
English 109 112 2.8 115 2.7 112 -2.6 113 3.7
Philosophy 124 118 -4.8 127 7.6 111 -12.6 118 -5.2
Economics 112 126 12.5 111 -11.9 124 11.7 120 7.1
Geography 121 103 -14.9 118 14.6 118 0.0 116 -4.5
History 99 103 4.0 106 2.9 95 -10.4 100 1.0
Political Science 129 131 1.6 131 0.0 118 -9.9 125 -3.5
Sociology 99 100 1.0 105 5.0 103 -1.9 103 4.2
Business Administration 145 144 -0.7 142 -1.4 147 3.5 145 -0.1
Financial Management 157 174 10.8 163 -6.3 158 -3.1 162 3.4
Average 77 78 1.3 80 1.1 81 -0.2 80 2.0
Table 3: Direct Instructional Cost per Student Credit Hour Taught: Delaware Study Benchmarks
for Comprehensive Colleges and Universities
2000 2001 2002 2003
With a basic sense of the dynamics of cost growth over three years in 24 specific disciplines, the question then becomes one which asks which variables within disciplines are most closely associated with the magnitude of instructional expenditures.
After examining multiple cycles of Delaware Study data, it was determined that between 60 and 75 percent of the variation in direct instructional expense within a given discipline or groups of related disciplines are associated with discrete and identifiable cost factors.
Delaware Study of Instructional Costs and Productivity
The volume of teaching activity, as measured by student credit hours taught, is a major expense factor. As one might expect, given a relatively constant faculty size, expense decreases as the volume of teaching increases.
Department size, as measured in terms of total number of faculty, is consistently associated with expense. The larger the department, the higher the cost.
The proportion of a departmental faculty holding tenure is associated with expense. Since tenured faculty are “fixed costs,” not surprisingly the higher the proportion of tenured faculty, the higher the cost.
Delaware Study of Instructional Costs and Productivity
A surprising finding was that, while the presence of graduate level instruction is associated with higher expense, the measured effect of this variable on the magnitude of cost is smaller than teaching volume, department size, and tenure rate.
It is frequently assumed that disciplines such as engineering and the physical sciences are expensive, in part, owing to the equipment-intensive nature of those disciplines. While measurable, the extent to which expense is associated with personnel cost, as opposed to equipment cost, has less impact on the magnitude of expense than teaching volume, department size, and tenure rate.
Delaware Study of Instructional Costs and Productivity
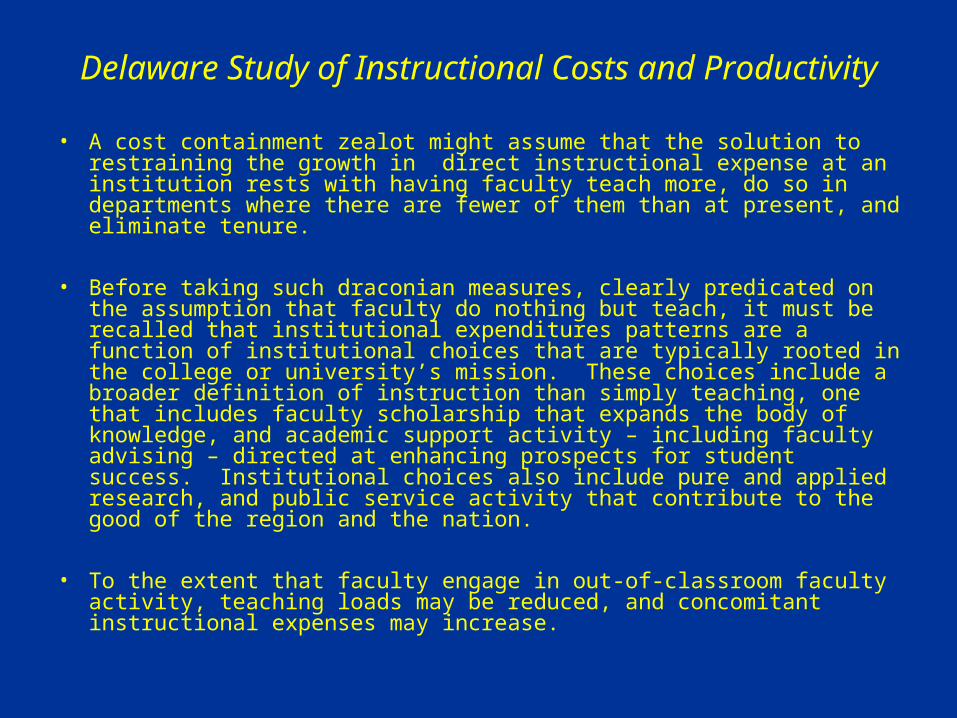
• A cost containment zealot might assume that the solution to restraining the growth in direct instructional expense at an institution rests with having faculty teach more, do so in departments where there are fewer of them than at present, and eliminate tenure.
• Before taking such draconian measures, clearly predicated on the assumption that faculty do nothing but teach, it must be recalled that institutional expenditures patterns are a function of institutional choices that are typically rooted in the college or university’s mission. These choices include a broader definition of instruction than simply teaching, one that includes faculty scholarship that expands the body of knowledge, and academic support activity – including faculty advising – directed at enhancing prospects for student success. Institutional choices also include pure and applied research, and public service activity that contribute to the good of the region and the nation.
• To the extent that faculty engage in out-of-classroom faculty activity, teaching loads may be reduced, and concomitant instructional expenses may increase.
Delaware Study of Instructional Costs and Productivity
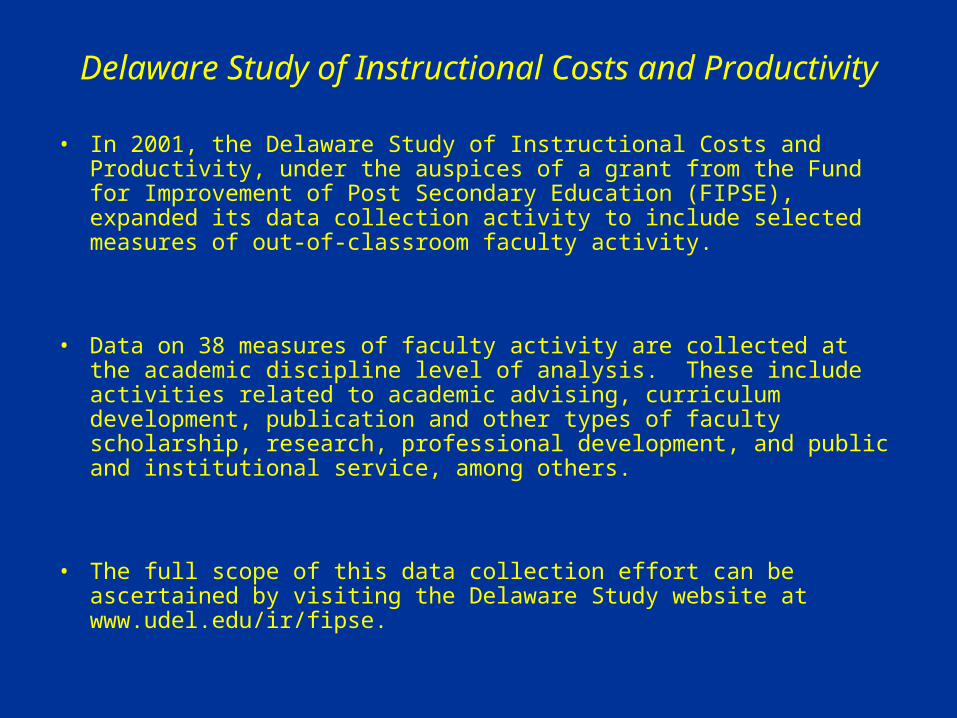
• In 2001, the Delaware Study of Instructional Costs and Productivity, under the auspices of a grant from the Fund for Improvement of Post Secondary Education (FIPSE), expanded its data collection activity to include selected measures of out-of-classroom faculty activity.
• Data on 38 measures of faculty activity are collected at the academic discipline level of analysis. These include activities related to academic advising, curriculum development, publication and other types of faculty scholarship, research, professional development, and public and institutional service, among others.
• The full scope of this data collection effort can be ascertained by visiting the Delaware Study website at www.udel.edu/ir/fipse.
Delaware Study of Instructional Costs and Productivity
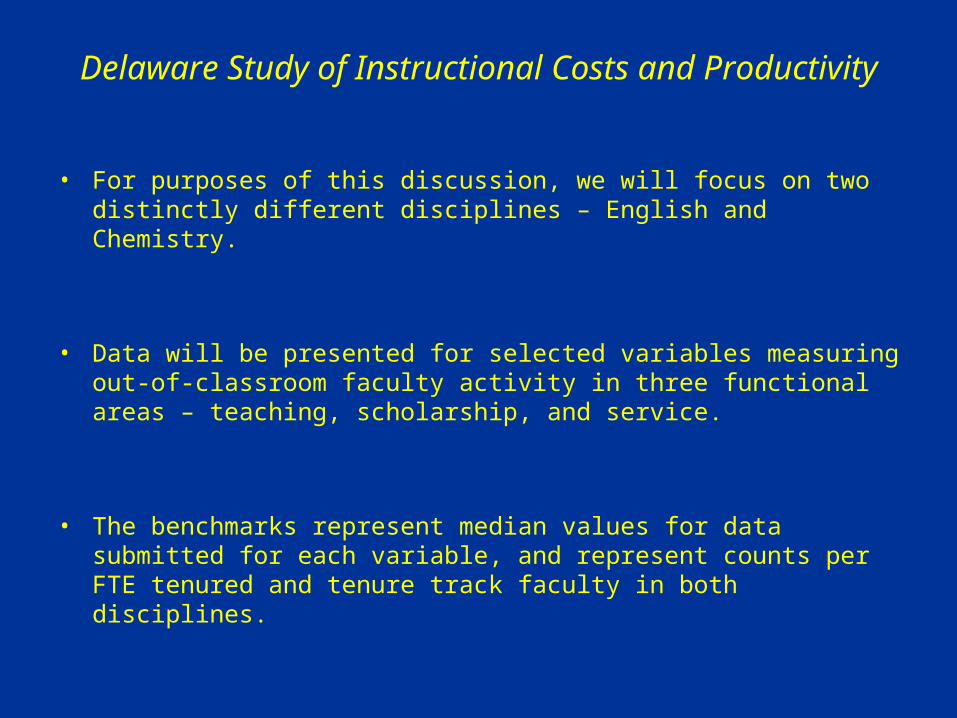
• For purposes of this discussion, we will focus on two distinctly different disciplines – English and Chemistry.
• Data will be presented for selected variables measuring out-of-classroom faculty activity in three functional areas – teaching, scholarship, and service.
• The benchmarks represent median values for data submitted for each variable, and represent counts per FTE tenured and tenure track faculty in both disciplines.
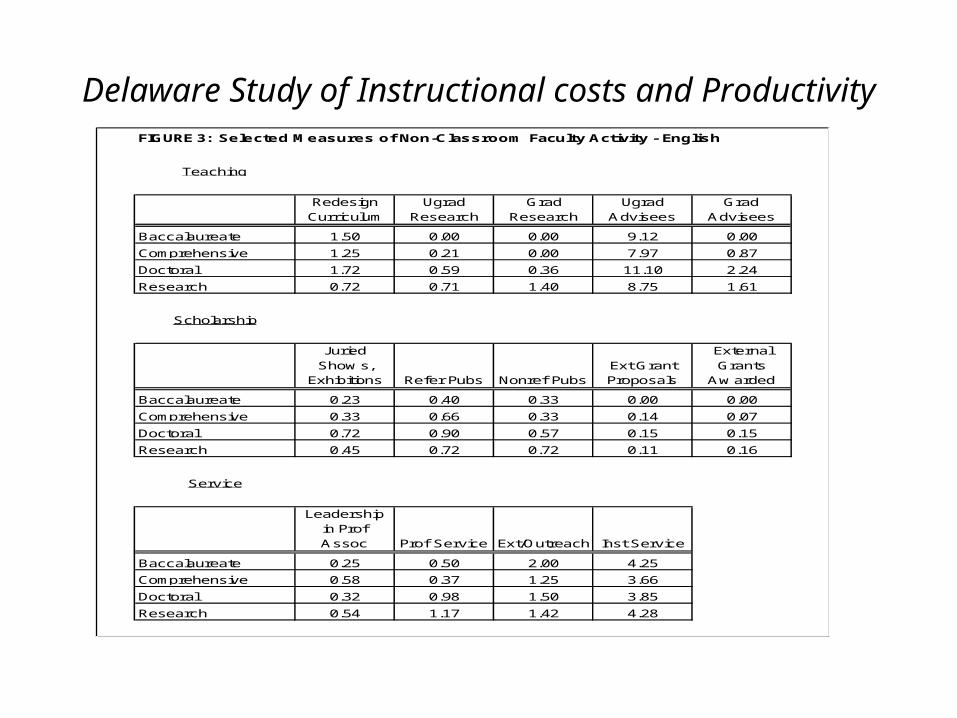
Delaware Study of Instructional costs and ProductivityFIGURE 3: Selected Measures of Non-Classroom Faculty Activity - English
Teaching
Redesign Curriculum
Ugrad Research
Grad Research
Ugrad Advisees
Grad Advisees
Baccalaureate 1.50 0.00 0.00 9.12 0.00
Comprehensive 1.25 0.21 0.00 7.97 0.87
Doctoral 1.72 0.59 0.36 11.10 2.24
Research 0.72 0.71 1.40 8.75 1.61
Scholarship
Juried Show s,
Exhibitions Refer Pubs Nonref PubsExt Grant Proposals
External Grants
Aw arded
Baccalaureate 0.23 0.40 0.33 0.00 0.00
Comprehensive 0.33 0.66 0.33 0.14 0.07
Doctoral 0.72 0.90 0.57 0.15 0.15
Research 0.45 0.72 0.72 0.11 0.16
Service
Leadership in Prof Assoc Prof Service Ext/Outreach Inst Service
Baccalaureate 0.25 0.50 2.00 4.25
Comprehensive 0.58 0.37 1.25 3.66
Doctoral 0.32 0.98 1.50 3.85
Research 0.54 1.17 1.42 4.28
Delaware Study of Instructional Costs and Productivity
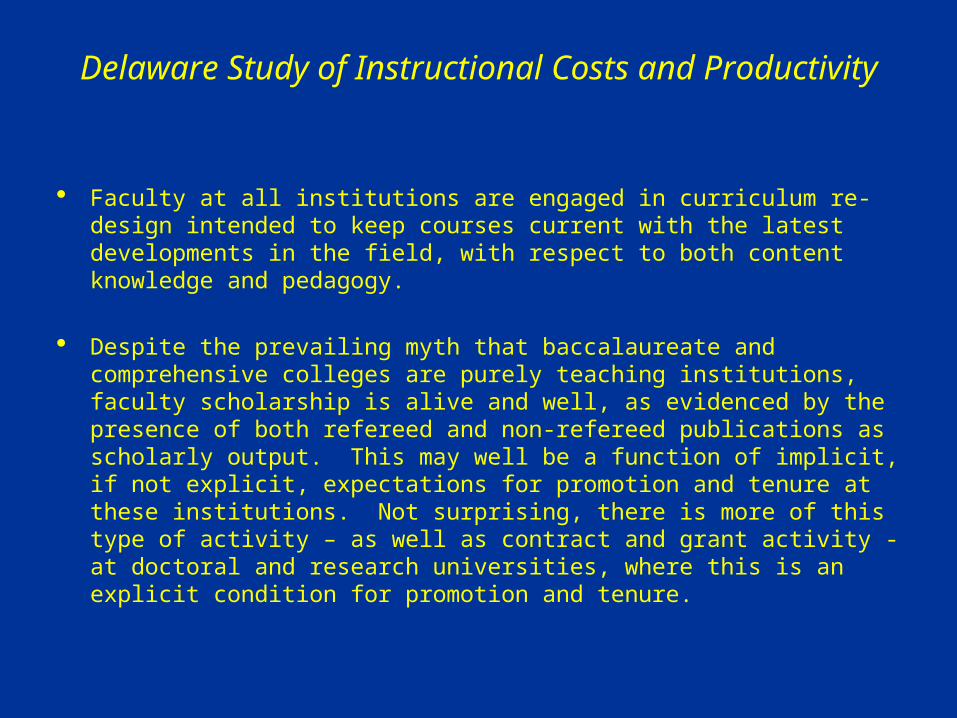
Faculty at all institutions are engaged in curriculum re-design intended to keep courses current with the latest developments in the field, with respect to both content knowledge and pedagogy.
Despite the prevailing myth that baccalaureate and comprehensive colleges are purely teaching institutions, faculty scholarship is alive and well, as evidenced by the presence of both refereed and non-refereed publications as scholarly output. This may well be a function of implicit, if not explicit, expectations for promotion and tenure at these institutions. Not surprising, there is more of this type of activity – as well as contract and grant activity -at doctoral and research universities, where this is an explicit condition for promotion and tenure.
Delaware Study of Instructional Costs and Productivity
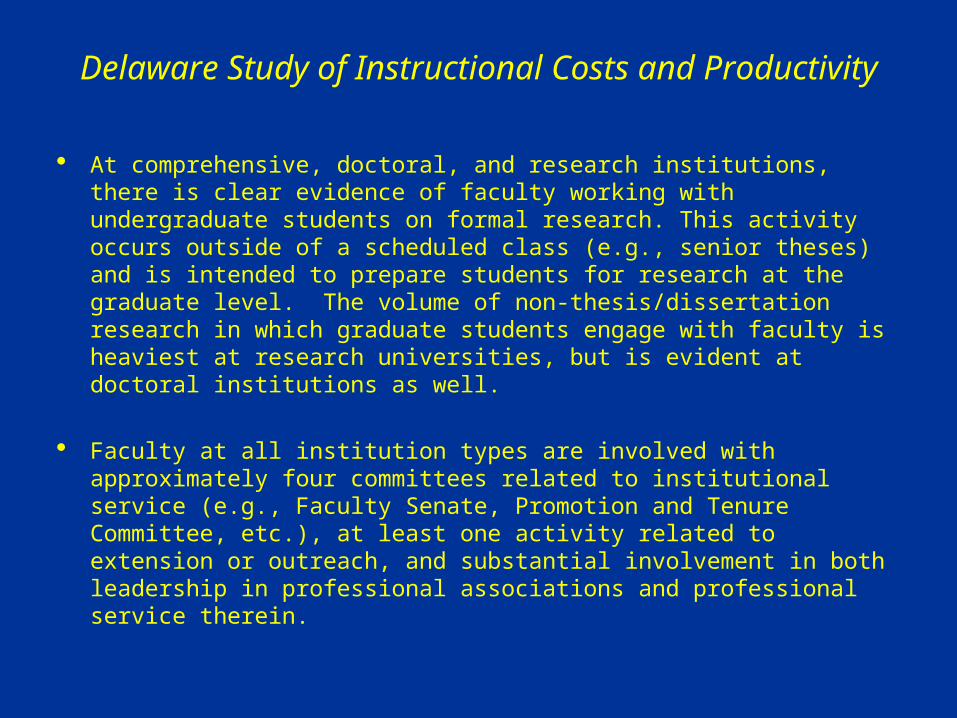
At comprehensive, doctoral, and research institutions, there is clear evidence of faculty working with undergraduate students on formal research. This activity occurs outside of a scheduled class (e.g., senior theses) and is intended to prepare students for research at the graduate level. The volume of non-thesis/dissertation research in which graduate students engage with faculty is heaviest at research universities, but is evident at doctoral institutions as well.
Faculty at all institution types are involved with approximately four committees related to institutional service (e.g., Faculty Senate, Promotion and Tenure Committee, etc.), at least one activity related to extension or outreach, and substantial involvement in both leadership in professional associations and professional service therein.
Delaware Study of Instructional costs and Productivity
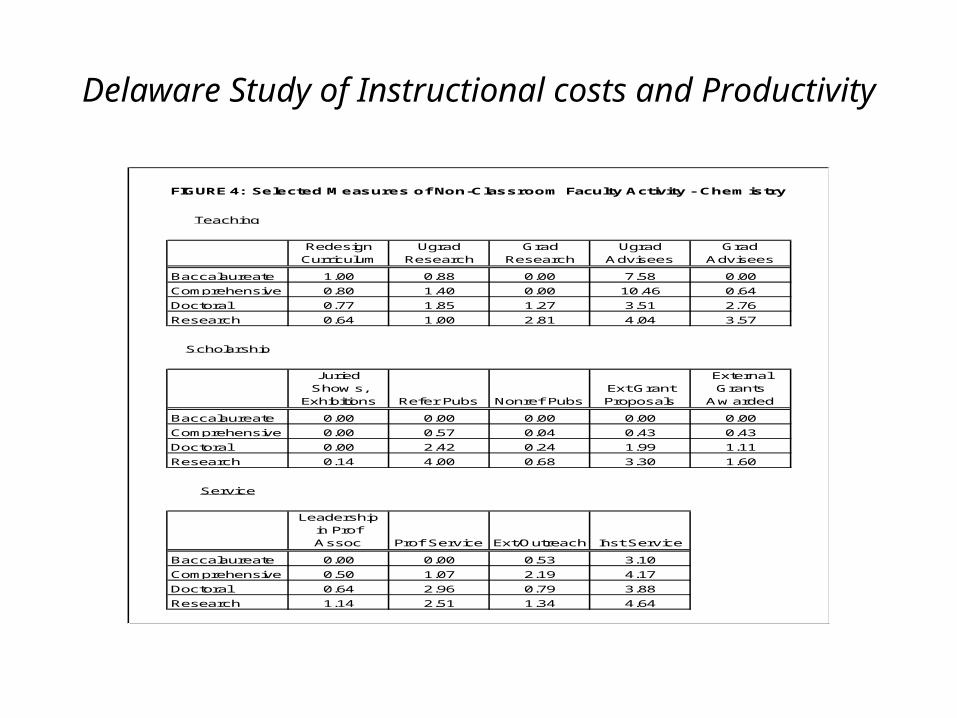
FIGURE 4: Selected Measures of Non-Classroom Faculty Activity - Chemistry
Teaching
Redesign Curriculum
Ugrad Research
Grad Research
Ugrad Advisees
Grad Advisees
Baccalaureate 1.00 0.88 0.00 7.58 0.00
Comprehensive 0.80 1.40 0.00 10.46 0.64
Doctoral 0.77 1.85 1.27 3.51 2.76
Research 0.64 1.00 2.81 4.04 3.57
Scholarship
Juried Show s,
Exhibitions Refer Pubs Nonref PubsExt Grant Proposals
External Grants
Aw arded
Baccalaureate 0.00 0.00 0.00 0.00 0.00
Comprehensive 0.00 0.57 0.04 0.43 0.43
Doctoral 0.00 2.42 0.24 1.99 1.11
Research 0.14 4.00 0.68 3.30 1.60
Service
Leadership in Prof Assoc Prof Service Ext/Outreach Inst Service
Baccalaureate 0.00 0.00 0.53 3.10
Comprehensive 0.50 1.07 2.19 4.17
Doctoral 0.64 2.96 0.79 3.88
Research 1.14 2.51 1.34 4.64
Delaware Study of Instructional Costs and Productivity
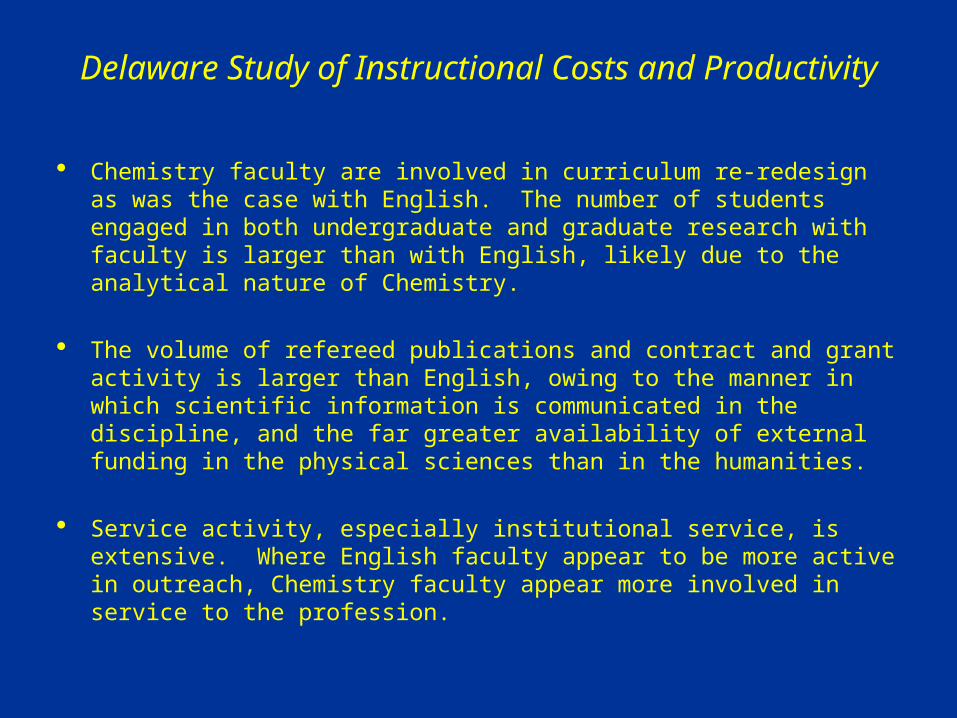
Chemistry faculty are involved in curriculum re-redesign as was the case with English. The number of students engaged in both undergraduate and graduate research with faculty is larger than with English, likely due to the analytical nature of Chemistry.
The volume of refereed publications and contract and grant activity is larger than English, owing to the manner in which scientific information is communicated in the discipline, and the far greater availability of external funding in the physical sciences than in the humanities.
Service activity, especially institutional service, is extensive. Where English faculty appear to be more active in outreach, Chemistry faculty appear more involved in service to the profession.
Summarizing the Research
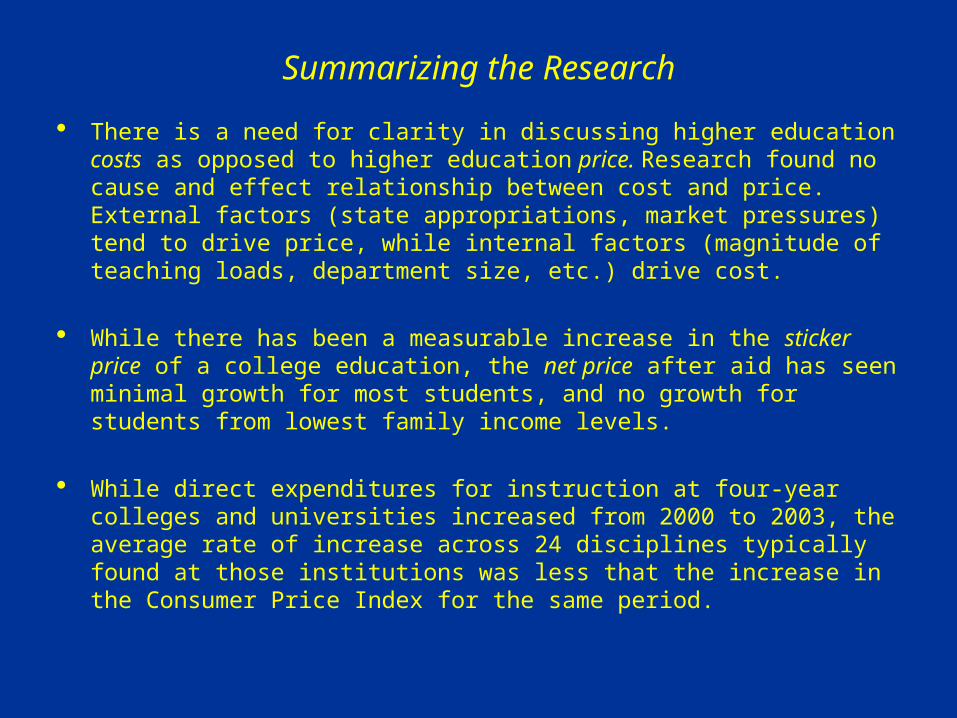
There is a need for clarity in discussing higher education costs as opposed to higher education price. Research found no cause and effect relationship between cost and price. External factors (state appropriations, market pressures) tend to drive price, while internal factors (magnitude of teaching loads, department size, etc.) drive cost.
While there has been a measurable increase in the sticker price of a college education, the net price after aid has seen minimal growth for most students, and no growth for students from lowest family income levels.
While direct expenditures for instruction at four-year colleges and universities increased from 2000 to 2003, the average rate of increase across 24 disciplines typically found at those institutions was less that the increase in the Consumer Price Index for the same period.
Summarizing the Research
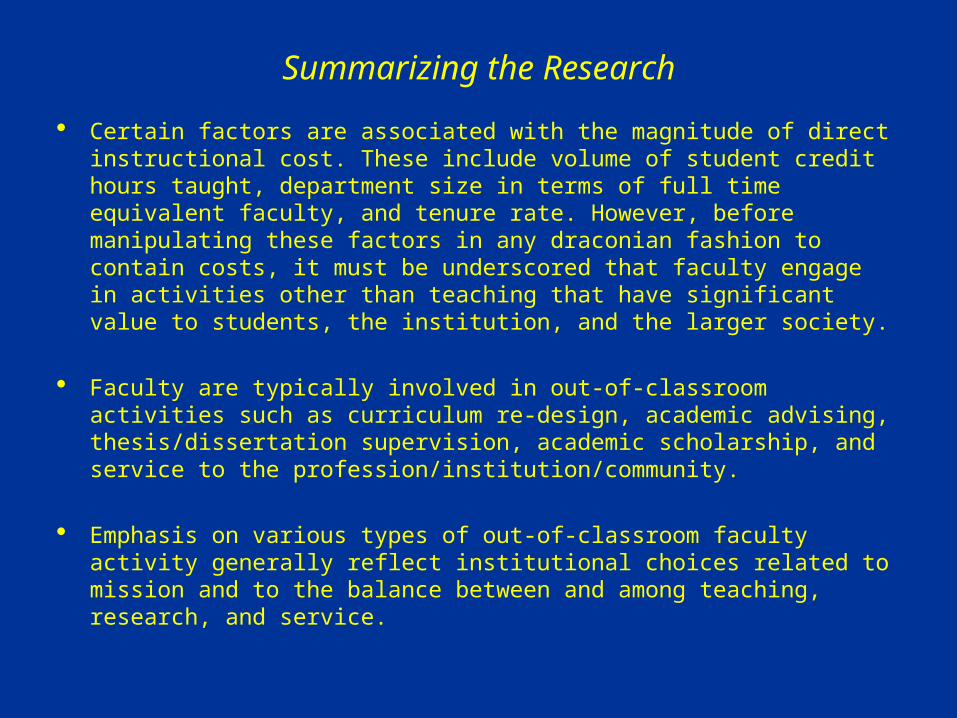
Certain factors are associated with the magnitude of direct instructional cost. These include volume of student credit hours taught, department size in terms of full time equivalent faculty, and tenure rate. However, before manipulating these factors in any draconian fashion to contain costs, it must be underscored that faculty engage in activities other than teaching that have significant value to students, the institution, and the larger society.
Faculty are typically involved in out-of-classroom activities such as curriculum re-design, academic advising, thesis/dissertation supervision, academic scholarship, and service to the profession/institution/community.
Emphasis on various types of out-of-classroom faculty activity generally reflect institutional choices related to mission and to the balance between and among teaching, research, and service.
Conclusions
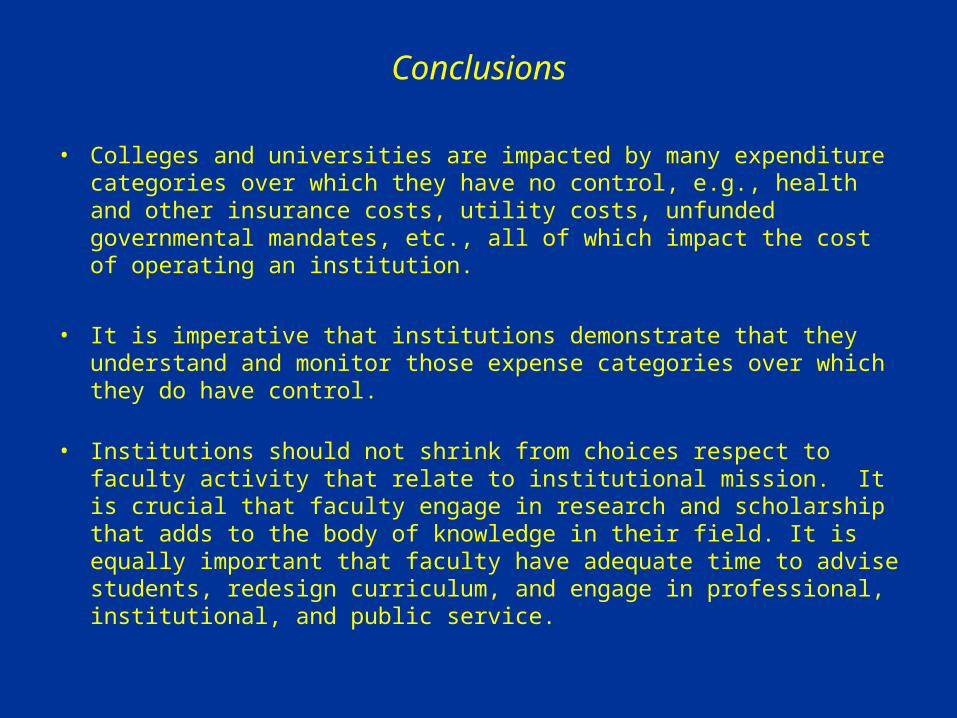
• Colleges and universities are impacted by many expenditure categories over which they have no control, e.g., health and other insurance costs, utility costs, unfunded governmental mandates, etc., all of which impact the cost of operating an institution.
• It is imperative that institutions demonstrate that they understand and monitor those expense categories over which they do have control.
• Institutions should not shrink from choices respect to faculty activity that relate to institutional mission. It is crucial that faculty engage in research and scholarship that adds to the body of knowledge in their field. It is equally important that faculty have adequate time to advise students, redesign curriculum, and engage in professional, institutional, and public service.
Conclusions
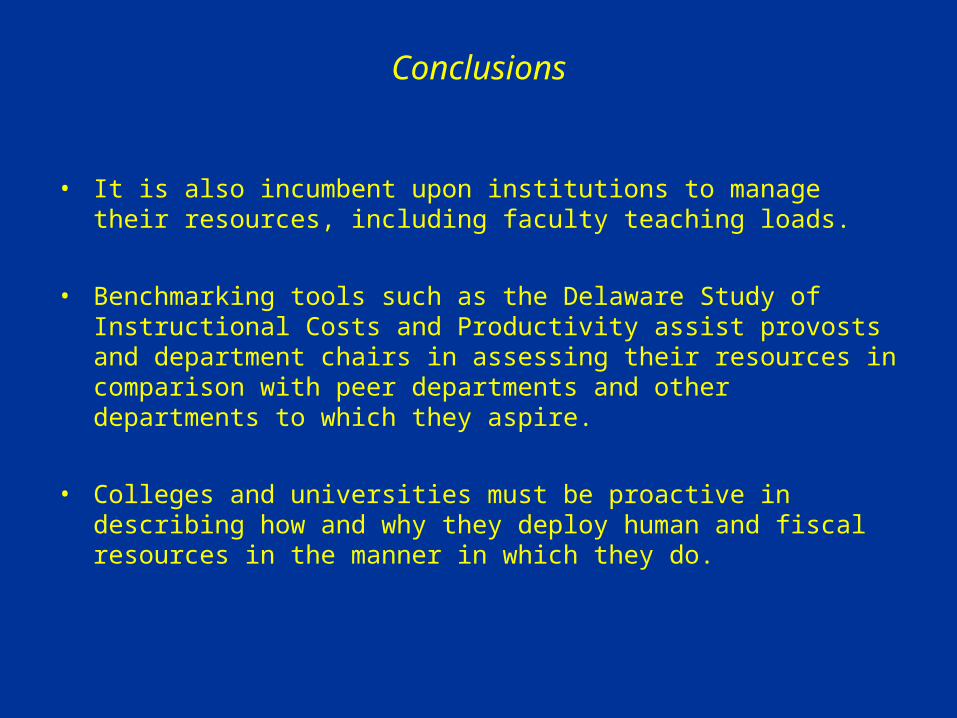
• It is also incumbent upon institutions to manage their resources, including faculty teaching loads.
• Benchmarking tools such as the Delaware Study of Instructional Costs and Productivity assist provosts and department chairs in assessing their resources in comparison with peer departments and other departments to which they aspire.
• Colleges and universities must be proactive in describing how and why they deploy human and fiscal resources in the manner in which they do.
A fuller discussion of this topic can be found in an article that I wrote which appears in the Spring 2005 issue of Planning for Higher Education, the Journal of the Society for College and University Planning.(www.scup.org)
Questions????