Embed Size (px)
Citation preview

D D R C O R P.
STRATEGIC TRANSFORMATIONNAREIT UPDATEJUNE 2018
2ddr corp. // s t r at e g i c t r a n s f o r m at i o n n a r e i t u p d at e
safe harbor
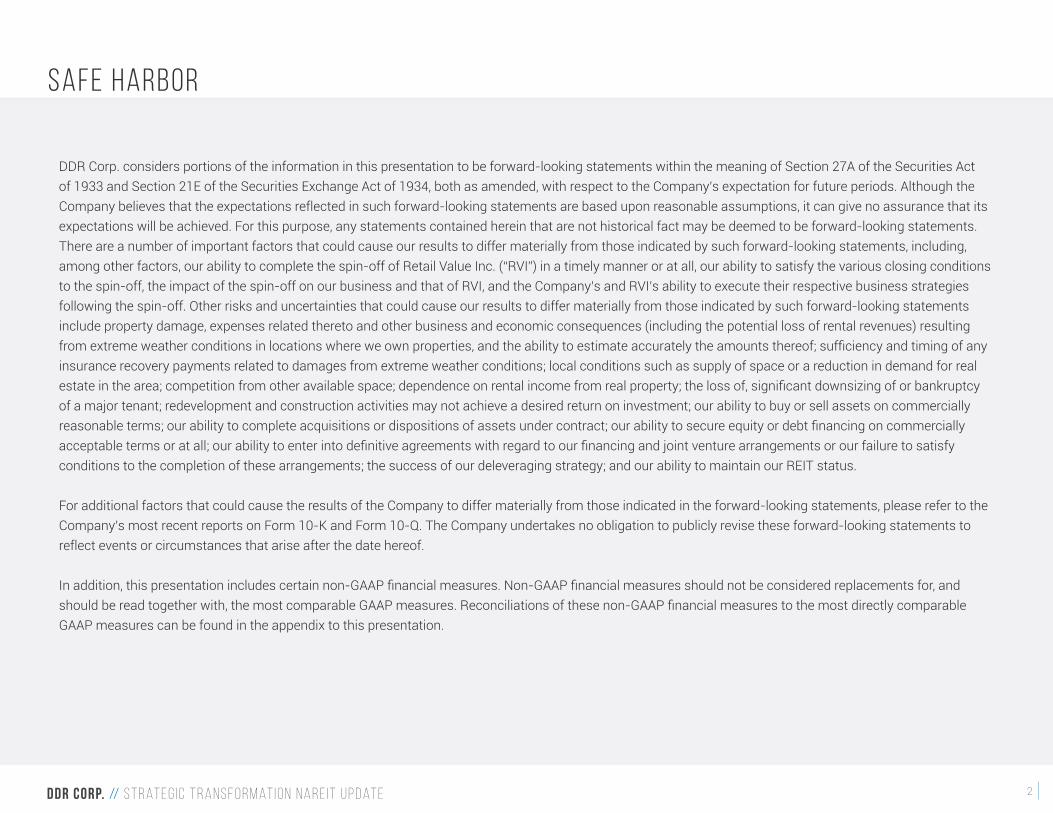
DDR Corp. considers portions of the information in this presentation to be forward-looking statements within the meaning of Section 27A of the Securities Act of 1933 and Section 21E of the Securities Exchange Act of 1934, both as amended, with respect to the Company’s expectation for future periods. Although the Company believes that the expectations reflected in such forward-looking statements are based upon reasonable assumptions, it can give no assurance that its expectations will be achieved. For this purpose, any statements contained herein that are not historical fact may be deemed to be forward-looking statements. There are a number of important factors that could cause our results to differ materially from those indicated by such forward-looking statements, including, among other factors, our ability to complete the spin-off of Retail Value Inc. (“RVI”) in a timely manner or at all, our ability to satisfy the various closing conditions to the spin-off, the impact of the spin-off on our business and that of RVI, and the Company’s and RVI’s ability to execute their respective business strategies following the spin-off. Other risks and uncertainties that could cause our results to differ materially from those indicated by such forward-looking statements include property damage, expenses related thereto and other business and economic consequences (including the potential loss of rental revenues) resulting from extreme weather conditions in locations where we own properties, and the ability to estimate accurately the amounts thereof; sufficiency and timing of any insurance recovery payments related to damages from extreme weather conditions; local conditions such as supply of space or a reduction in demand for real estate in the area; competition from other available space; dependence on rental income from real property; the loss of, significant downsizing of or bankruptcy of a major tenant; redevelopment and construction activities may not achieve a desired return on investment; our ability to buy or sell assets on commercially reasonable terms; our ability to complete acquisitions or dispositions of assets under contract; our ability to secure equity or debt financing on commercially acceptable terms or at all; our ability to enter into definitive agreements with regard to our financing and joint venture arrangements or our failure to satisfy conditions to the completion of these arrangements; the success of our deleveraging strategy; and our ability to maintain our REIT status.
For additional factors that could cause the results of the Company to differ materially from those indicated in the forward-looking statements, please refer to the Company’s most recent reports on Form 10-K and Form 10-Q. The Company undertakes no obligation to publicly revise these forward-looking statements to reflect events or circumstances that arise after the date hereof.
In addition, this presentation includes certain non-GAAP financial measures. Non-GAAP financial measures should not be considered replacements for, and should be read together with, the most comparable GAAP measures. Reconciliations of these non-GAAP financial measures to the most directly comparable GAAP measures can be found in the appendix to this presentation.
3ddr corp. // s t r at e g i c t r a n s f o r m at i o n n a r e i t u p d at e
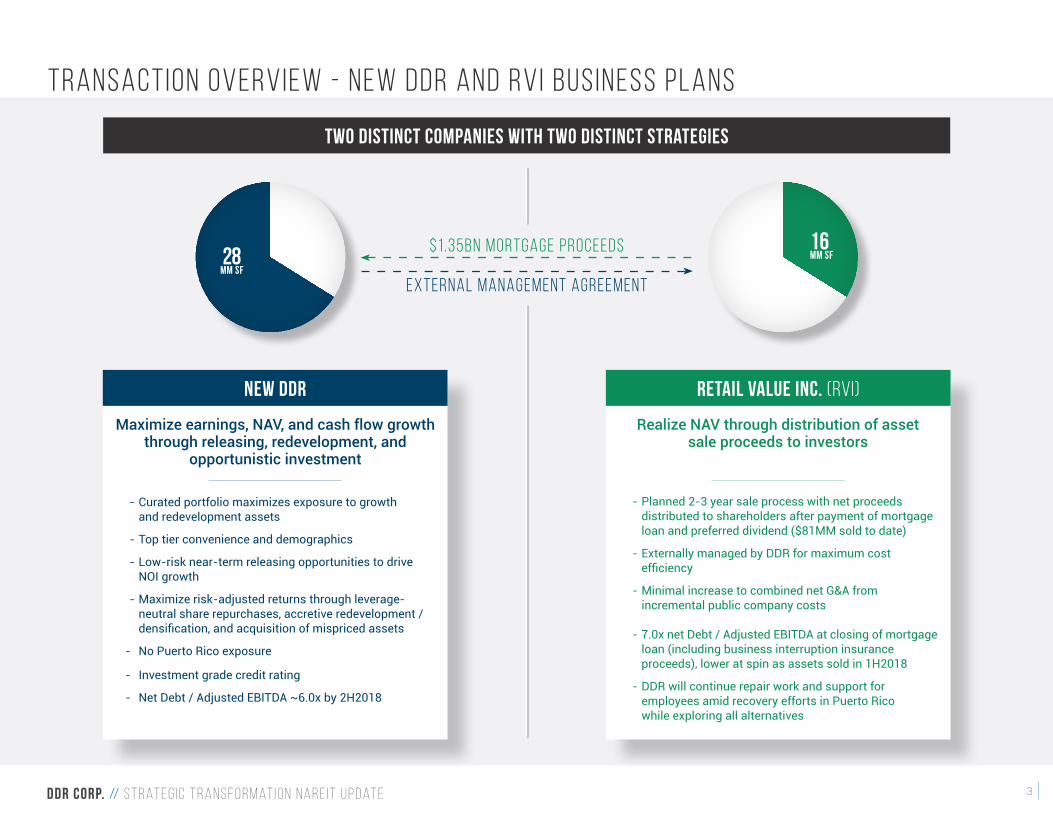
Transaction Overview - new ddr and RVI Business Plans
Realize NAV through distribution of assetsale proceeds to investors
Maximize earnings, NAV, and cash flow growththrough releasing, redevelopment, and
opportunistic investment
Retail Value Inc. (RVI)new ddr
- Planned 2-3 year sale process with net proceeds distributed to shareholders after payment of mortgage loan and preferred dividend ($81MM sold to date) - Externally managed by DDR for maximum cost efficiency - Minimal increase to combined net G&A from incremental public company costs
- 7.0x net Debt / Adjusted EBITDA at closing of mortgage loan (including business interruption insurance proceeds), lower at spin as assets sold in 1H2018
- DDR will continue repair work and support for employees amid recovery efforts in Puerto Rico while exploring all alternatives
- Curated portfolio maximizes exposure to growth and redevelopment assets
- Top tier convenience and demographics
- Low-risk near-term releasing opportunities to drive NOI growth
- Maximize risk-adjusted returns through leverage- neutral share repurchases, accretive redevelopment / densification,andacquisitionofmispricedassets
- No Puerto Rico exposure
- Investment grade credit rating
- Net Debt / Adjusted EBITDA ~6.0x by 2H2018
two distinct companies with two distinct strategies
$1 .35bn mortgage proceeds
external management agreement
28MM SF
16 MM SF
4ddr corp. // s t r at e g i c t r a n s f o r m at i o n n a r e i t u p d at e
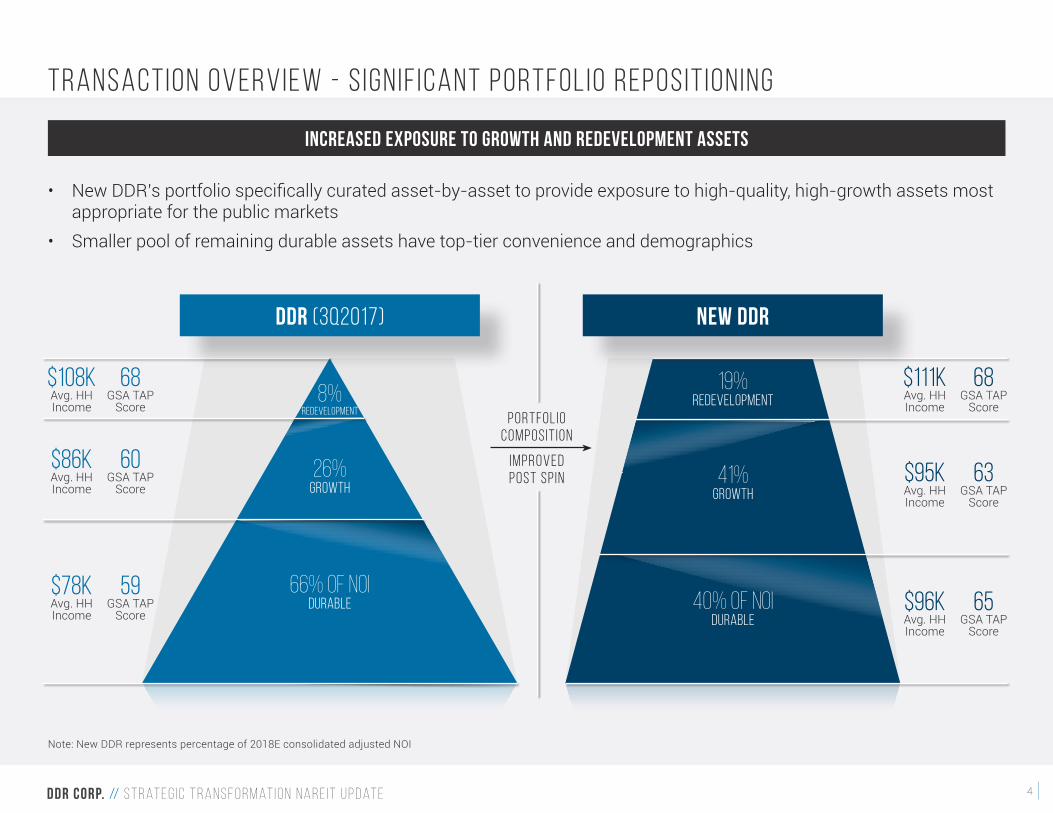
Transaction Overview - S ignif icant Portfolio Reposit ioning
Increased exposure to growth and redevelopment assets
41%GROWTH
19%REDEVELOPMENT
66% of noidurable 40% of noi
durable
26%GROWTH
8%REDEVELOPMENT
$78KAvg. HHIncome
$96KAvg. HHIncome
$86KAvg. HHIncome
$95KAvg. HHIncome
$108KAvg. HHIncome
$111KAvg. HHIncome
59GSA TAP
Score65
GSA TAPScore
60GSA TAP
Score63
GSA TAPScore
68GSA TAP
Score
68GSA TAP
ScorePORTFOLIO
COMPOSIT ION
IMPROVEDPOST SPIN
Note: New DDR represents percentage of 2018E consolidated adjusted NOI
• New DDR’s portfolio specifically curated asset-by-asset to provide exposure to high-quality, high-growth assets most appropriate for the public markets
• Smaller pool of remaining durable assets have top-tier convenience and demographics
ddr (3Q2017) NEW ddr
5ddr corp. // s t r at e g i c t r a n s f o r m at i o n n a r e i t u p d at e
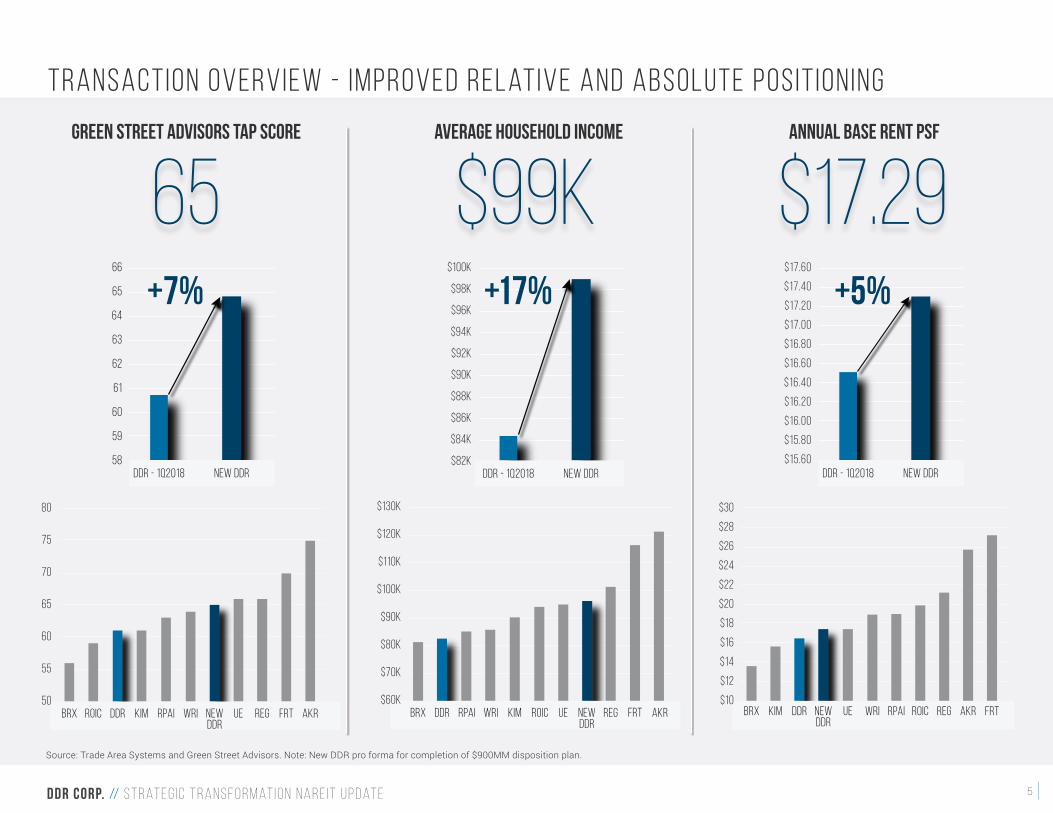
Transaction Overview - Improved Relative and Absolute Posit ioning
akrfrtreguewrirpaikimddrroicbrx new ddr
80
75
70
65
60
55
50akrfrtregroic uekimwrirpaiddrbrx new
ddr
$130k
$120k
$110k
$100k
$90k
$80K
$70K
$60K
Green Street Advisors TAP Score average Household income
frtakrregroicrpaiwriueddrkimbrx newddr
$30
$28
$26
$24
$22
$20
$18
$16
$14
$12
$10
aNNUAL bASE rENT psf
6566
65
64
63
62
61
60
59
58ddr - 1Q2018 new DDR
+7%$100K
$98k
$96k
$94k
$92k
$90k
$88K
$86K
$84K
$82Kddr - 1Q2018 new ddr
+17%$17.60
$17.40
$17.20
$17.00
$16.80
$16.60
$16.40
$16.20
$16.00
$15.80
$15.60ddr - 1Q2018 new ddr
$99K $17.29
Source: Trade Area Systems and Green Street Advisors. Note: New DDR pro forma for completion of $900MM disposition plan.
+5%

6ddr corp. // s t r at e g i c t r a n s f o r m at i o n n a r e i t u p d at e
transaction overview - New DDR and RVI operating metrics
1Q2018 Properties (Including JVs) 132 (258) 82 (208) 50
1Q2018 Pro-Rata Real Estate Gross Book Value (2) $8.6BN $5.8BN $2.8BN
1Q2018 Adjusted NOI (3) $156MM $101MM $56MM
Consolidated ABR PSF (4) $16.49 $17.29 $15.32
FY 2016 / 2017 Blended Leasing Spreads 9.1% / 6.0% 12.5% / 8.4% 3.9% / 2.6%
Consolidated Leased Rate (4) 92.9% 93.7% 91.7%
Consolidated Green Street Advisors TAP Score (5) 61 65 53
Consolidated Avg. HH Income (3-Mile) $84,294 $98,675 $61,378
Consolidated Population (3-Mile) 99,476 110,007 80,814
New DDR(1)DDR retail Value Inc.
Transaction separates highest growth Continental U.S. assets from a pool of highly saleable properties currently being discounted by the public markets
(1) New DDR operating metrics (ABR PSF, leasing spreads, leased rate) and demographics pro forma for completion of $900MM disposition plan(2) Includes DDR’s pro-rata share of JV Real Estate Gross Book Value ($610MM)(3) Includes DDR share of JV NOI. Excludes lease termination fees, NOI from assets sold in 1Q2018, and net hurricane-related losses. See calculation, definition and reconciliation in Appendix for non-GAAP financial measures. Numbers may not add due to rounding(4) As of 1Q2018(5) Continental U.S. only. GSA TAP scores unavailable for Puerto Rico
28MM SF
(PRO-RATA)
44MM SF
(PRO-RATA)
16 MM SF
7ddr corp. // s t r at e g i c t r a n s f o r m at i o n n a r e i t u p d at e
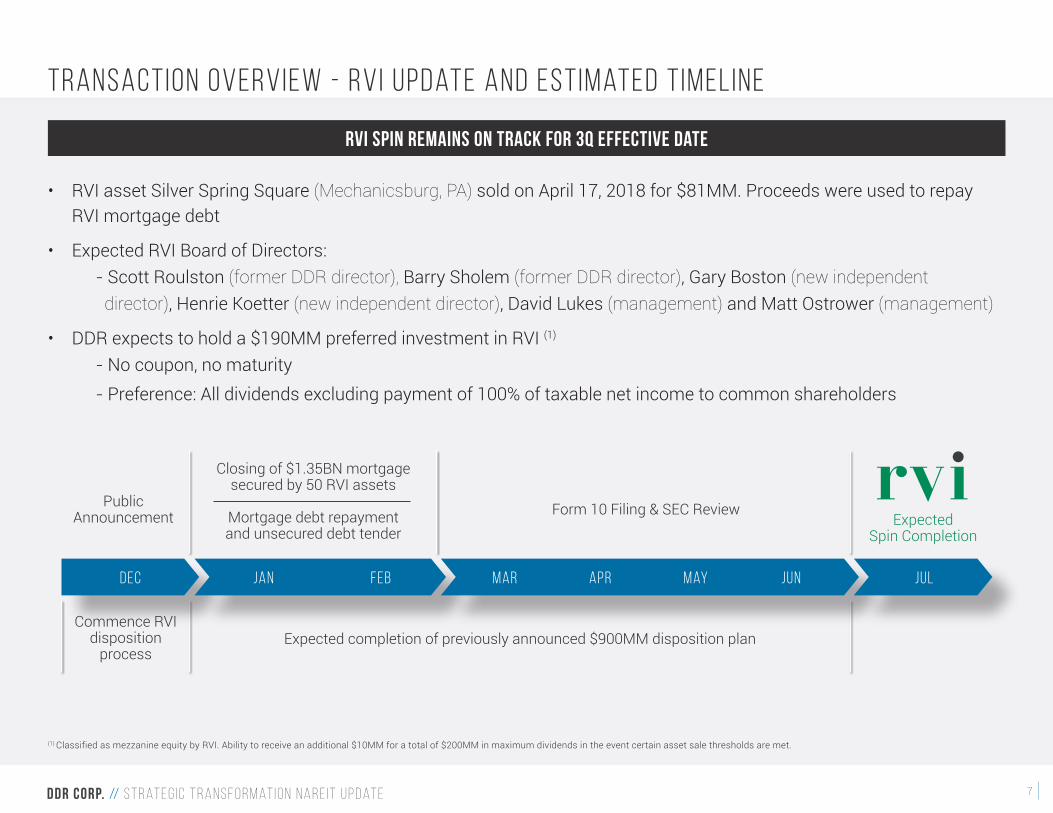
transaction overview - RVI Update and estimated T imeline
dec jan
PublicAnnouncement Expected
Spin Completion
Closing of $1.35BN mortgagesecured by 50 RVI assets
Mortgage debt repayment and unsecured debt tender
Form 10 Filing & SEC Review
mayaprmarfeb jul
Expected completion of previously announced $900MM disposition planCommence RVI
disposition process
jun
RVI spin remains on track for 3Q effective date
• RVI asset Silver Spring Square (Mechanicsburg, PA) sold on April 17, 2018 for $81MM. Proceeds were used to repay RVI mortgage debt
• Expected RVI Board of Directors: - Scott Roulston (former DDR director), Barry Sholem (former DDR director), Gary Boston (new independent director), Henrie Koetter (new independent director), David Lukes (management) and Matt Ostrower (management)
• DDR expects to hold a $190MM preferred investment in RVI (1)
- No coupon, no maturity - Preference: All dividends excluding payment of 100% of taxable net income to common shareholders
(1) Classified as mezzanine equity by RVI. Ability to receive an additional $10MM for a total of $200MM in maximum dividends in the event certain asset sale thresholds are met.
NEW DDR OVERVIEW

9ddr corp. // s t r at e g i c t r a n s f o r m at i o n n a r e i t u p d at e
new ddr - S ignif icant portfolio reposit ioning
Increased exposure to growth and redevelopment assets
41%GROWTH
19%REDEVELOPMENT
66% of noidurable 40% of noi
durable
26%GROWTH
8%REDEVELOPMENT
$78KAvg. HHIncome
$96KAvg. HHIncome
$86KAvg. HHIncome
$95KAvg. HHIncome
$108KAvg. HHIncome
$111KAvg. HHIncome
59GSA TAP
Score65
GSA TAPScore
60GSA TAP
Score63
GSA TAPScore
68GSA TAP
Score
68GSA TAP
ScorePORTFOLIO
COMPOSIT ION
IMPROVEDPOST SPIN
Note: New DDR represents percentage of 2018E consolidated adjusted NOI
New DDR’s portfolio specifically curated asset-by-asset to provide exposure to high-quality, high-growth assets most appropriate for the public markets
Smaller pool of remaining durable assets have top-tier convenience and demographics
ddr (3Q2017) NEW ddr
10ddr corp. // s t r at e g i c t r a n s f o r m at i o n n a r e i t u p d at e
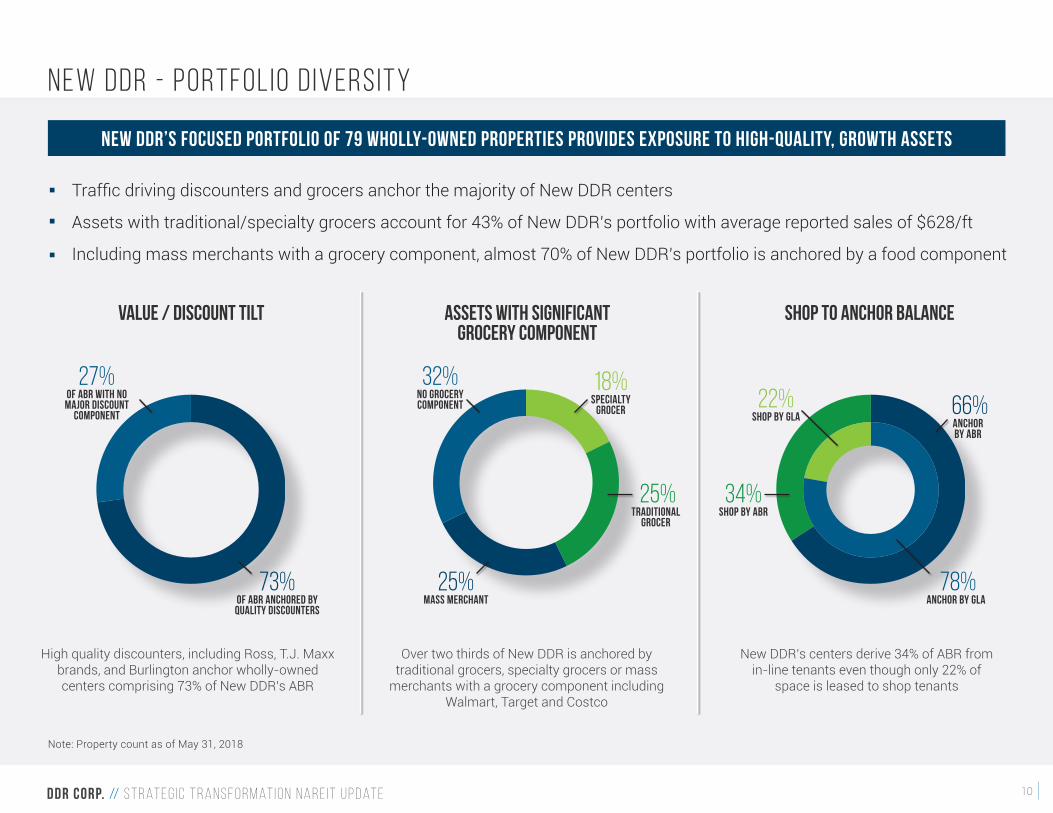
25%Mass Merchant
18%Specialty
Grocer 66%anchorby abr
25%Traditional
Grocer
27%of abr with no
Major DiscountComponent
32%No GroceryComponent 22%
shop by GLA
value / discount tilt assets with significantgrocery component
shop to anchor balance
73%of abr anchored by Quality discounters
78%anchor by gla
34%shop by ABR
High quality discounters, including Ross, T.J. Maxx brands, and Burlington anchor wholly-owned centers comprising 73% of New DDR’s ABR
Over two thirds of New DDR is anchored by traditional grocers, specialty grocers or mass
merchants with a grocery component including Walmart, Target and Costco
New DDR’s centers derive 34% of ABR from in-line tenants even though only 22% of
space is leased to shop tenants
new ddr - portfolio d iversity
New DDR’s focused portfolio of 79 wholly-owned properties provides exposure to high-quality, growth assets
Traffic driving discounters and grocers anchor the majority of New DDR centers
Assets with traditional/specialty grocers account for 43% of New DDR’s portfolio with average reported sales of $628/ft
Including mass merchants with a grocery component, almost 70% of New DDR’s portfolio is anchored by a food component
Note: Property count as of May 31, 2018

11ddr corp. // s t r at e g i c t r a n s f o r m at i o n n a r e i t u p d at e
new ddr - Portfolio map
New York, NY 8%
Washington, DC 3%
Orlando, FL 5%
Phoenix, AZ 7%
Denver, CO 6%
Charlotte, NC 6%
Miami, FL 5%MSA % of Consolidated Adjusted NOI
Columbus, OH 6%
Boston, MA 6%
Top 12 Markets Account for 70% of Consolidated adjusted 2018E NOI
Consolidated New DDR Assets
Chicago, IL 7%
Los Angeles, CA 4%Atlanta, GA 8%
Note: Pro forma for completion of $900MM disposition plan

12ddr corp. // s t r at e g i c t r a n s f o r m at i o n n a r e i t u p d at e
new ddr - Substantially improved operating metrics
1Q2018 Properties (Including JVs) 132 (258) 82 (208)
1Q2018 Pro-Rata Real Estate Gross Book Value (2) $8.6BN $5.8BN
1Q2018 Adjusted NOI (3) $156MM $101MM
Consolidated ABR PSF (4) $16.49 $17.29
FY 2016 / 2017 Blended Leasing Spreads 9.1% / 6.0% 12.5% / 8.4%
Consolidated Leased Rate (4) 92.9% 93.7%
Consolidated Green Street Advisors TAP Score 61 65
Consolidated Avg. HH Income (3-Mile) $84,294 $98,675
Consolidated Population (3-Mile) 99,476 110,007
DDR New DDR(1)
28MM SF
(PRO-RATA)
44MM SF
(PRO-RATA)
(1) New DDR operating metrics (ABR PSF, leasing spreads, SSNOI, leased rate) and demographics pro forma for completion of $900MM disposition plan(2) Includes DDR’s pro-rata share of JV Real Estate Gross Book Value ($610MM)(3) Includes DDR share of JV NOI. Excludes lease termination fees, NOI from assets sold in 1Q2018, and net hurricane-related losses. See calculation, definition and reconciliation in Appendix for non-GAAP financial measures(4) As of 1Q2018
13ddr corp. // s t r at e g i c t r a n s f o r m at i o n n a r e i t u p d at e
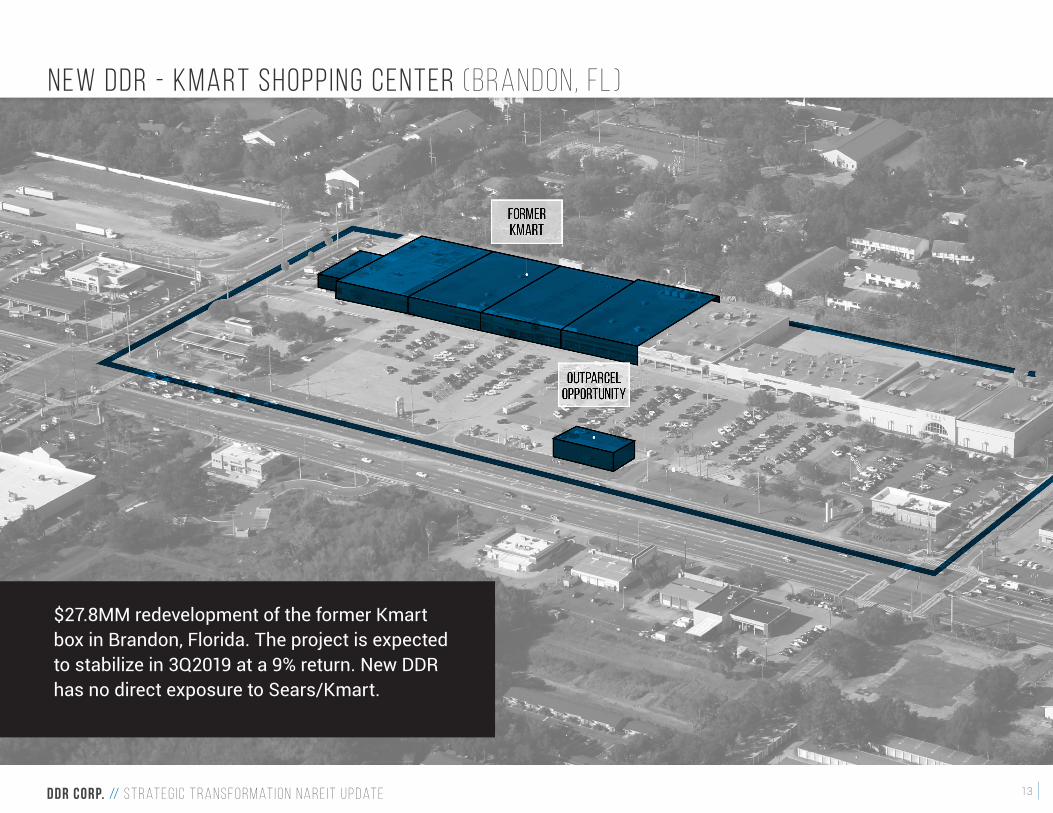
$27.8MM redevelopment of the former Kmart box in Brandon, Florida. The project is expected to stabilize in 3Q2019 at a 9% return. New DDR has no direct exposure to Sears/Kmart.
new ddr - Kmart Shopping Center (Brandon, FL )
14ddr corp. // s t r at e g i c t r a n s f o r m at i o n n a r e i t u p d at e
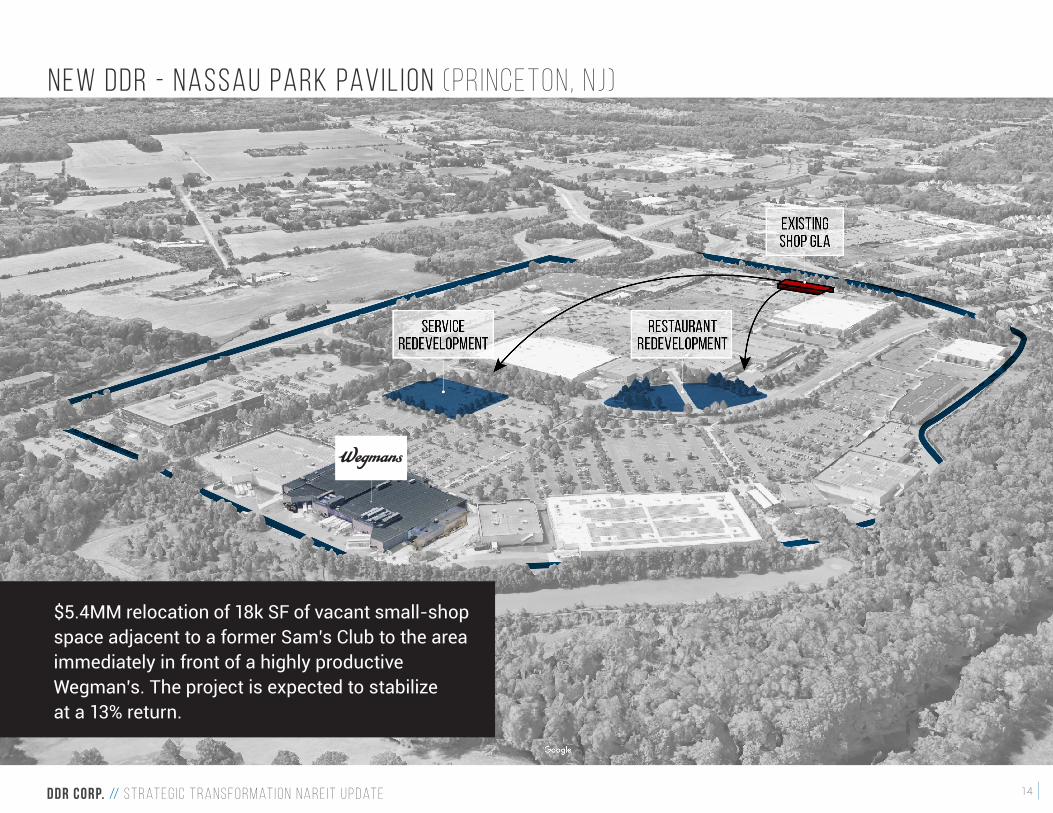
$5.4MM relocation of 18k SF of vacant small-shop space adjacent to a former Sam’s Club to the area immediately in front of a highly productive Wegman’s. The project is expected to stabilize at a 13% return.
new ddr - Nassau Park Pavil ion (Pr inceton, NJ)

15ddr corp. // s t r at e g i c t r a n s f o r m at i o n n a r e i t u p d at e
Commitment to Investment-Grade Credit Rating
Larger and higher quality unencumbered pool with no Puerto Rico exposure
Minimal consolidated secured debt
Improvement to all public bond covenants
RVI mortgage does not impact DDR covenant compliance
Transaction Expected to Result in a Stronger DDR Balance Sheet
Net Debt / Adjusted EBITDA (excluding preferred stock) of ~6.0x in 2H2018
Weighted average maturity of 10.7 years including preferred stock (6.3 years excluding)
No unsecured maturities until 2022
Expected to have full availability under the company’s $1.0BN Line of Credit at YE2018
Capacity to fund 6 years of maturities
new ddr - Further balance sheet improvements
$1000
$900
$800
$700
$600
$500
$400
$300
$200
$100
$020272025 202620242023202220212019 20202018
Note: As of 1Q2018 pro forma for the RVI spin and $900MM disposition program.
LEVERAGE / PUBLIC BOND COVENANTS DDR 1Q2018E NEW DDR 4Q2018E
Pro-Rata Net Debt / Adjusted EBITDA 6.5x ~6.0x
Total Debt to RE Assets 45% ~40%
Secured Debt to Assets Ratio 17% ~3%
Unencumbered Assets to Unsecured Debt 213% ~240%
Fixed Charge Coverage (Ex. Prepayment Penalties) 3.0x ~3.0x
Note: Preliminary estimate subject to change
16ddr corp. // s t r at e g i c t r a n s f o r m at i o n n a r e i t u p d at e
Source: Green Street Advisors. DDR data as of 1Q2018 and pro forma for the RVI spin and $900MM disposition program. Peer data as of 1Q2018.
Source: Company details. DDR data as of 1Q2018 and pro forma for the RVI spin and $900MM disposition program. Peer data as of 1Q2018.
0 10% 20% 30%
brx
akr
reg
wri
rpai
frt
kim
new ddr
ue
roic
2018 2019 20200 2 4 6 8 10 12
brx
rpai
adr
aat
wri
roic
new ddr
ue
reg
kim
frt
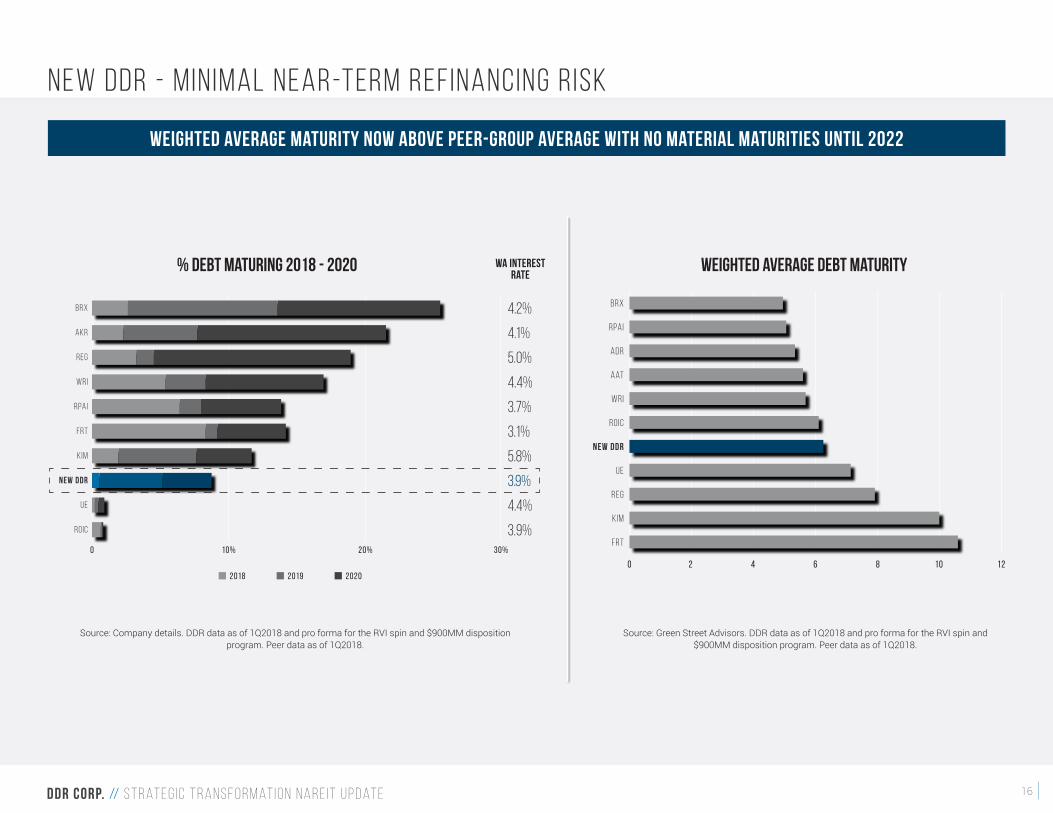
% debt maturing 2018 - 2020 WA Interestrate
weighted average debt maturity
4.2%
4.1%
5.0%
4.4%
3.7%
3.1%
5.8%
4.4%
3.9%
3.9%
new ddr - Min imal near-term refinancing r isk
Weighted average maturity now above peer-group average with no material maturities until 2022

17ddr corp. // s t r at e g i c t r a n s f o r m at i o n n a r e i t u p d at e
8%
7%
6%
5%
4%
3%
2%
1%
0%
140%
120%
100%
80%
60%
40%
20%
0%
dividend yield (%)2018 AFFO Payout ratio (%)
newddr
kimbrx rpai frt roic akruereg wri
2018
AFF
O Pa
yout
Rat
io
Divi
dend
Yie
ld
Source: Green Street Advisors. Price as of May 25, 2018. New DDR represents targeted payout ratio.
NEW DDR - Attractive d iv idend y ield, sector leading payout ratio
New DDR quarterly dividend rate expected to be at least $0.20/sh
Enhanced cash retention for redevelopment and opportunistic investments
Reset payout ratio expected to be among the most conservative in the peer group, positioned for growth
Using the current share price, unadjusted for the spin of RVI, and the reset dividend rate, DDR offers an attractive dividendyield relative to the peer group
18ddr corp. // s t r at e g i c t r a n s f o r m at i o n n a r e i t u p d at e
$450
$400
$350
$300
$250
$200
$150
$100
$50
$0
preferred equity preferred equity repayment
1Q16 2Q16 3Q16 4Q16 1Q17 2Q17 3Q17 4Q17 1Q18
$9
$8
$7
$6
$5
$4
interest income
1Q16 2Q16 3Q16 4Q16 1Q17 2Q17 3Q17 4Q17 1Q18
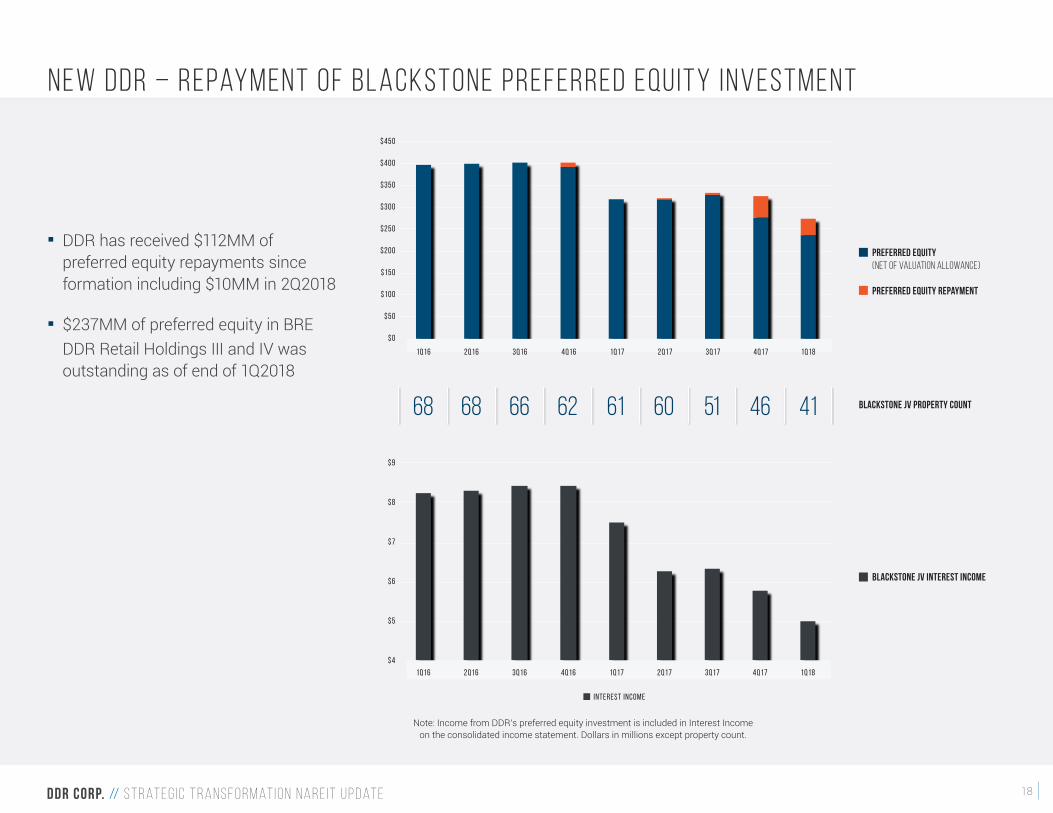
DDR has received $112MM of preferred equity repayments since formation including $10MM in 2Q2018
$237MM of preferred equity in BRE DDR Retail Holdings III and IV was outstanding as of end of 1Q2018
68 68 66 62 61 60 51 46 41 Blackstone JV Property Count
Blackstone JV Interest Income
Preferred Equity(net of valuation allowance)
Preferred equity repayment
Note: Income from DDR’s preferred equity investment is included in Interest Incomeon the consolidated income statement. Dollars in millions except property count.
New DDR – Repayment of Blackstone preferred equity investment
19ddr corp. // s t r at e g i c t r a n s f o r m at i o n n a r e i t u p d at e
$0.70
$0.60
$0.50
$0.40
$0.30
$0.20
$0.10
$0.00
$0.02
$0.04 $0.01$0.01 $0.30
$0.30
$0.02$0.02
$0.45
$0.12$0.53 $0.02
ddrdisposition
program
DDRDisposition
Program
Pro-Rata Interest Expense
2Q18eoffo
Pro-Rata Interest Expense
rvi feeincome
rviincome
G&A &other
3Q18Eoffo
jv fee &interest
income
jv fee &interest
income
1Q18offo
Note: The company has no intention to provide quarterly FFO guidance going forward. Numbers may not add due to rounding.
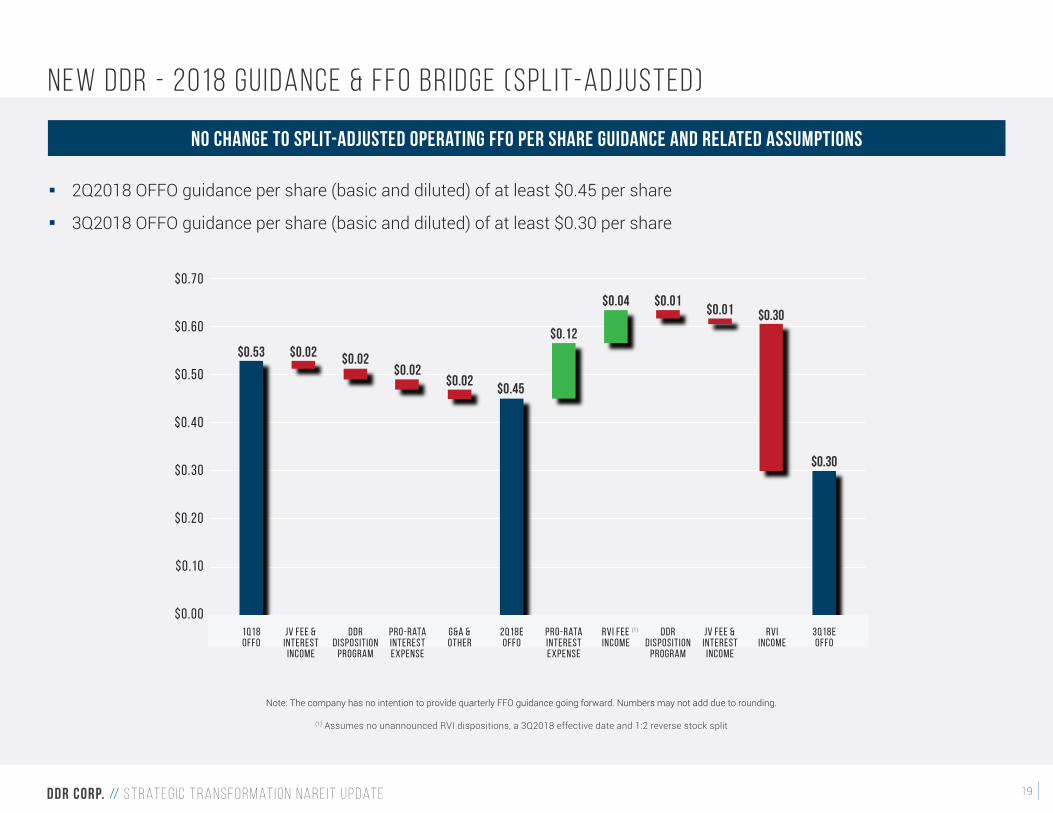
NEW DDR - 2018 Guidance & FFO bridge (Spl it-adjusted)
No Change to Split-Adjusted Operating FFO Per Share Guidance and Related Assumptions
2Q2018 OFFO guidance per share (basic and diluted) of at least $0.45 per share
3Q2018 OFFO guidance per share (basic and diluted) of at least $0.30 per share
(1) Assumes no unannounced RVI dispositions, a 3Q2018 effective date and 1:2 reverse stock split
(1)

20ddr corp. // s t r at e g i c t r a n s f o r m at i o n n a r e i t u p d at e
NEW DDR - Components of NAV
1Q2018 Adjusted NOI (2) $101
Construction in Progress and Land $68
Land Adjacent to Existing Centers $31
Cost Basis of HQ Building $41
Total Land and Development $140
Cash and Cash Equivalents (3) $18
Notes Receivable $20
Preferred Equity Interests, Net $237
RVI Preferred $190
Total Cash and Investments $465
Receivables (4) $72
Other Assets, Net $28
Total Other $100
Consolidated Debt (5) $2,426
Pro-Rata Share of JV Debt (5) $335
Total Debt $2,761
Preferred Stock $525
Total Preferred Stock $525
Dividends Payable $79
Other Liabilities (6) $149
Total Other $228
New DDR Assets (1) New DDR Liabilities & Preferred Stock (1)
(1) All figures other than $40MM receivable from RVI and RVI Preferred as of 1Q2018. Dollars in millions.(2) Includes DDR share of JV NOI. Excludes lease termination fees and NOI from assets sold in 1Q2018. See calculation, definition and reconciliation in Appendix for non-GAAP financial measures(3) Includes restricted cash(4) Excludes straight-line rents receivable, net. Includes $40MM RVI receivable(5) Excludes RVI mortgage, loan costs and fair market value adjustments(6) Excludes below-market leases, net

RETAIL VALUE INC.OVERVIEW
22ddr corp. // s t r at e g i c t r a n s f o r m at i o n n a r e i t u p d at e
16 MM SF
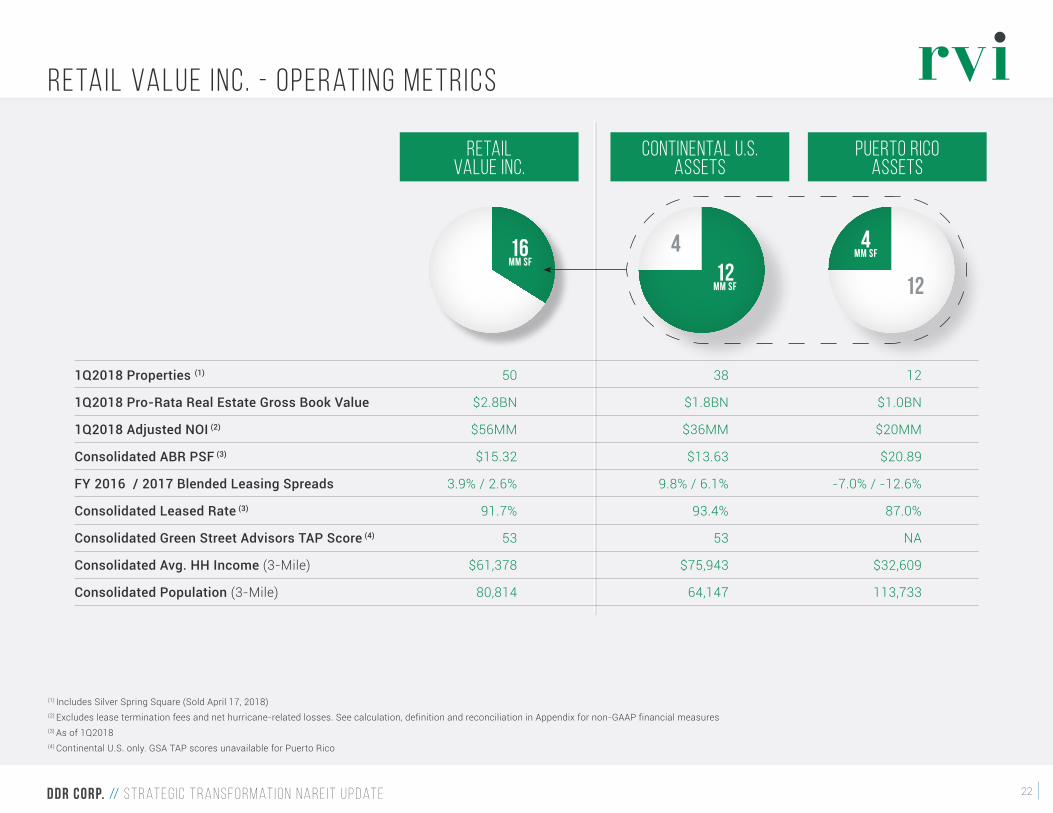
Retail Value Inc. - Operating metrics
1Q2018 Properties (1) 50 38 12
1Q2018 Pro-Rata Real Estate Gross Book Value $2.8BN $1.8BN $1.0BN
1Q2018 Adjusted NOI (2) $56MM $36MM $20MM
Consolidated ABR PSF (3) $15.32 $13.63 $20.89
FY 2016 / 2017 Blended Leasing Spreads 3.9% / 2.6% 9.8% / 6.1% -7.0% / -12.6%
Consolidated Leased Rate (3) 91.7% 93.4% 87.0%
Consolidated Green Street Advisors TAP Score (4) 53 53 NA
Consolidated Avg. HH Income (3-Mile) $61,378 $75,943 $32,609
Consolidated Population (3-Mile) 80,814 64,147 113,733
puerto ricoassets
retailValue Inc.
continental U.S.Assets
412
MM SF
4MM SF
12
(1) Includes Silver Spring Square (Sold April 17, 2018)(2) Excludes lease termination fees and net hurricane-related losses. See calculation, definition and reconciliation in Appendix for non-GAAP financial measures(3) As of 1Q2018(4) Continental U.S. only. GSA TAP scores unavailable for Puerto Rico
23ddr corp. // s t r at e g i c t r a n s f o r m at i o n n a r e i t u p d at e
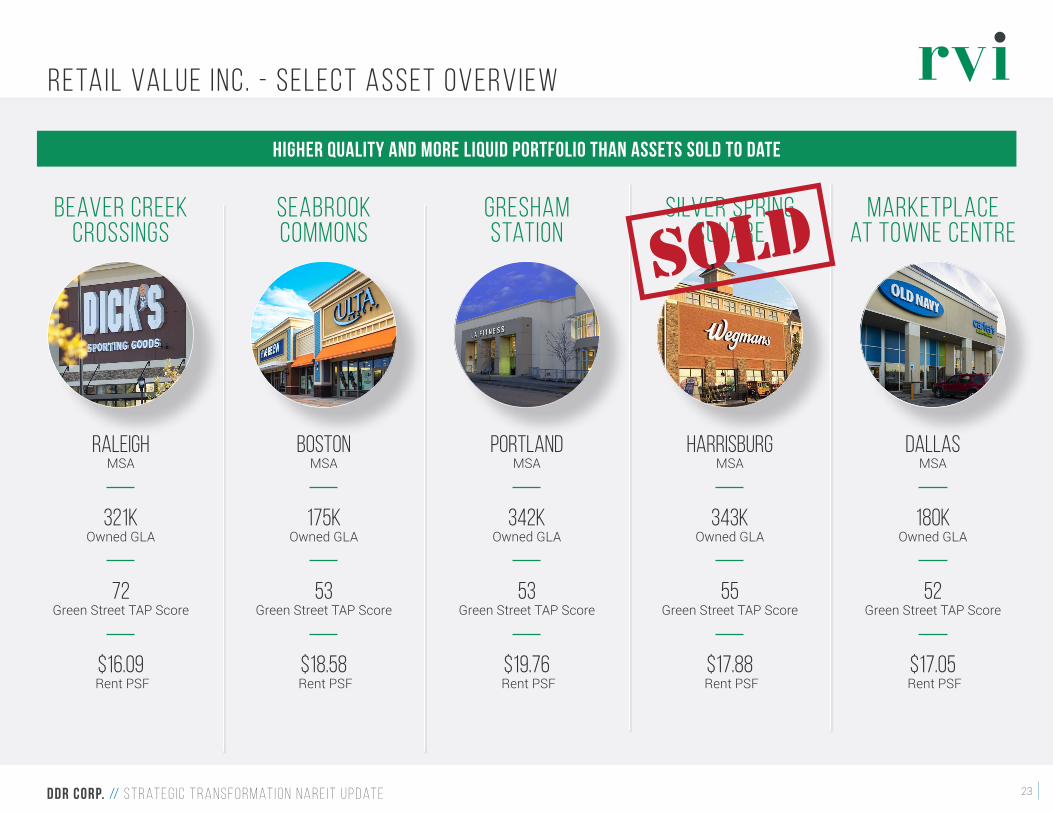
RaleighMSA
321kOwned GLA
72Green Street TAP Score
$16.09 Rent PSF
beaver creekcrossings
bostonMSA
175kOwned GLA
53Green Street TAP Score
$18.58 Rent PSF
seabrookcommons
portlandMSA
342kOwned GLA
53Green Street TAP Score
$19.76 Rent PSF
greshamstation
harrisburgMSA
343kOwned GLA
55Green Street TAP Score
$17.88 Rent PSF
silver springsquare
dallasMSA
180kOwned GLA
52Green Street TAP Score
$17.05 Rent PSF
marketplaceat towne centre
Higher Quality and More Liquid Portfolio Than Assets Sold to Date
Retail Value Inc. - Select Asset Overview
24ddr corp. // s t r at e g i c t r a n s f o r m at i o n n a r e i t u p d at e
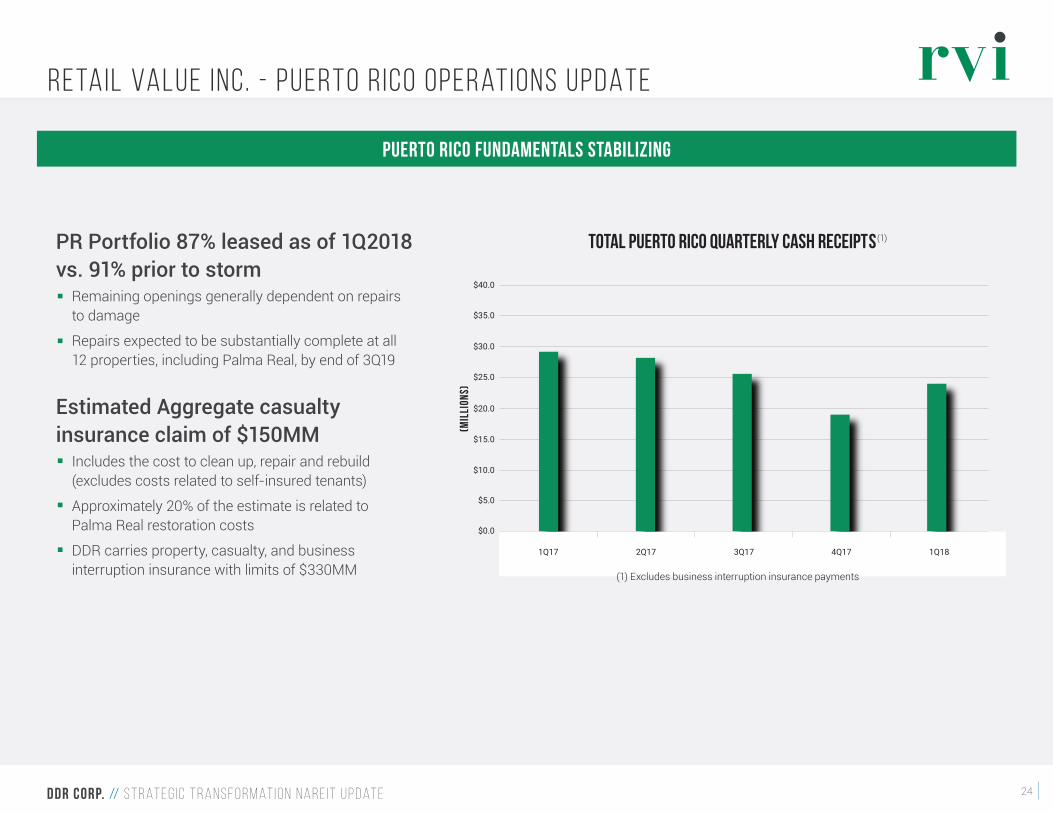
Total Puerto Rico Quarterly Cash Receipts(1)
$0.0
$5.0
$10.0
$15.0
$20.0
$25.0
$30.0
$35.0
$40.0
(MILLIONs)
1Q17 2Q17 3Q17 4Q17 1Q18
(1) Excludes business interruption insurance payments
PR Portfolio 87% leased as of 1Q2018 vs. 91% prior to storm
Remaining openings generally dependent on repairs to damage
Repairs expected to be substantially complete at all 12 properties, including Palma Real, by end of 3Q19
Estimated Aggregate casualty insurance claim of $150MM
Includes the cost to clean up, repair and rebuild (excludes costs related to self-insured tenants)
Approximately 20% of the estimate is related to Palma Real restoration costs
DDR carries property, casualty, and business interruption insurance with limits of $330MM
Retail Value Inc. - PUERTO R ICO operations UPDATE
PUERTO RICO FUNDAMENTALS stabilizing

25ddr corp. // s t r at e g i c t r a n s f o r m at i o n n a r e i t u p d at e
Geographically diverse and financeable pool of assets
Retail Value Inc. - Portfolio map
RVI Assets

26ddr corp. // s t r at e g i c t r a n s f o r m at i o n n a r e i t u p d at e
proceeds
Characteristics
additionaldetails
• Transaction demonstrates financing availability and quality of RVI asset pool:
- Cross-collateralized
- Rate: L + 315bp (LIBOR subject to a 3.0% cap)
- Term: 5-years fully extended
• RVI disposition proceeds used to repay mortgage debt and preferred dividends with excess proceeds distributed to shareholders subject to loan compliance
• See the Form 10 Information Statement filed by Retail Value Inc. with the Securities and Exchange Commission for further information
• $1.35BN mortgage financing
Retail Value Inc. - F inancing Details

27ddr corp. // s t r at e g i c t r a n s f o r m at i o n n a r e i t u p d at e
Retail Value Inc. - Components of NAV
1Q2018 Adjusted NOI (2) $56
Construction in Progress and Land $9
Land Adjacent to Existing Centers $0
Total Land and Development $9
Cash and Cash Equivalents (3) $48
Total Cash and Investments $48
Receivables (4) $76
Other Assets, Net $20
Total Other $96
RVI Assets (1) RVI Liabilities & Preferred Stock (1)
(1) All figures other than $40MM payable to DDR and DDR Preferred as of 1Q2018. Dollars in millions.(2) Excludes lease termination fees and net hurricane-related losses. See calculation, definition and reconciliation in Appendix for non-GAAP financial measures(3) Includes restricted cash(4) Excludes straight-line rents receivable, net. Includes Casualty insurance receivable.(5) Excludes loan costs(6) Excludes below-market leases, net. Includes $40MM payable to DDR
Consolidated Debt (5) $1,350
Pro-Rata Share of JV Debt $0
Total Debt $1,350
DDR Mezzanine Equity (Preferred Stock) $190
Total Preferred Stock $190
Dividends Payable $0
Other Liabilities (6) $85
Total Other $85

APPENDIX

29ddr corp. // s t r at e g i c t r a n s f o r m at i o n n a r e i t u p d at e
Retail Value Inc. Property L ist (GLA in thousands, as of 1Q2018)
CONTINENTAL U.S. 100% DDR OWNERSHIP
# Center MSA Location ST Owned GLA Total GLA ABR PSF Key Tenants
1 Palm Valley Pavilions West Phoenix Goodyear AZ 233 277 $18.16 Barnes & Noble, Best Buy, Ross Dress for Less, Total Wine & More
2 Tucson Spectrum Tucson Tucson AZ 717 970 $14.61 Bed Bath & Beyond, Best Buy, Food City, Harkins Theatres, Home Depot (U), JCPenney, LA Fitness, Marshalls, Michaels, OfficeMax, Old Navy, Party City, PetSmart, Ross Dress for Less, Target (U)
3 Brandon Boulevard Shoppes Tampa Valrico FL 86 89 $15.50 LA Fitness
4 Homestead Pavilion Miami Homestead FL 300 391 $18.49 Bed Bath & Beyond, Kohl’s (U), Michaels, Ross Dress for Less
5 International Drive Value Center Orlando Orlando FL 186 192 $10.42 Bed Bath & Beyond, dd’s Discounts, Ross Dress for Less, T.J. Maxx
6 Lake Walden Square Tampa Plant City FL 245 245 $11.97 Marshalls, Premiere Cinemas, Ross Dress for Less, Winn Dixie
7 Mariner Square Tampa Spring Hill FL 194 519 $9.60 Bealls, Ross Dress for Less, Sam’s Club (U), Walmart (U)
8 Millenia Plaza Orlando Orlando FL 412 412 $10.82 BJ’s Wholesale Club, Dick’s Sporting Goods, Home Depot, Ross Dress for Less, Total Wine & More, Toys “R” Us/Babies “R” Us
9 Tequesta Shoppes Miami Tequesta FL 110 110 $11.65 Marshalls
10 The Walk at Highwoods Preserve Tampa Tampa FL 138 232 $15.95 Best Buy, HomeGoods, Michaels, Muvico (U)
11 Douglasville Pavilion Atlanta Douglasville GA 266 369 $12.19 Big Lots, Marshalls, Michaels, OfficeMax, PetSmart, Ross Dress for Less, Target (U)
12 Newnan Crossing Atlanta Newnan GA 223 453 $8.37 Hobby Lobby, Lowe’s, Walmart (U)
13 East Lloyd Commons Evansville Evansville IN 160 160 $13.86 Best Buy, Michaels, Dick’s Sporting Goods
14 Grandville Marketplace Grand Rapids Grandville MI 224 372 $10.84 Hobby Lobby, Lowe’s (U), OfficeMax
15 Green Ridge Square Grand Rapids Grand Rapids MI 216 407 $13.50 Bed Bath & Beyond, Best Buy, Michaels, T.J. Maxx, Target (U), Toys “R” Us (U)
16 Maple Grove Crossing Minneapolis Maple Grove MN 262 350 $13.35 Barnes & Noble, Bed Bath & Beyond, Cub Foods (U), Kohl’s, Michaels
17 Midway Marketplace Minneapolis St. Paul MN 324 487 $8.65 Cub Foods, Herberger’s (U), LA Fitness, T.J. Maxx, Walmart
18 Riverdale Village Minneapolis Coon Rapids MN 788 968 $15.52 Bed Bath & Beyond, Best Buy, Costco (U), Dick’s Sporting Goods, DSW, JCPenney, Jo-Ann, Kohl’s, Old Navy, T.J. Maxx
19 Big Oaks Crossing Tupelo Tupelo MS 348 348 $6.13 Jo-Ann, Sam’s Club, Walmart
20 Crossroads Center Gulfport Gulfport MS 555 591 $11.62 Academy Sports, Barnes & Noble, Belk, Burke’s Outlet, Cinemark, Forever 21, Michaels, Ross Dress for Less, T.J. Maxx
21 Seabrook Commons Boston Seabrook NH 175 393 $18.58 Dick’s Sporting Goods, Walmart (U)
22 Hamilton Commons Atlantic City Mays Landing NJ 397 397 $16.73 Bed Bath & Beyond, Marshalls, Regal Cinemas, Ross Dress for Less, Hobby Lobby
23 Wrangleboro Consumer Square Atlantic City Mays Landing NJ 842 842 $13.41 Babies “R” Us, Best Buy, BJ’s Wholesale Club, Books-A-Million, Christmas Tree Shops, Dick’s Sporting Goods, Just Cabinets, Kohl’s, Michaels, PetSmart, Staples, Target
24 Beaver Creek Crossings Raleigh Apex NC 321 321 $16.09 Burke’s Outlet, Dick’s Sporting Goods, Regal Beaver Creek 12, T.J. Maxx
CONTINUED TO NEXT PAGE >>>
30ddr corp. // s t r at e g i c t r a n s f o r m at i o n n a r e i t u p d at e
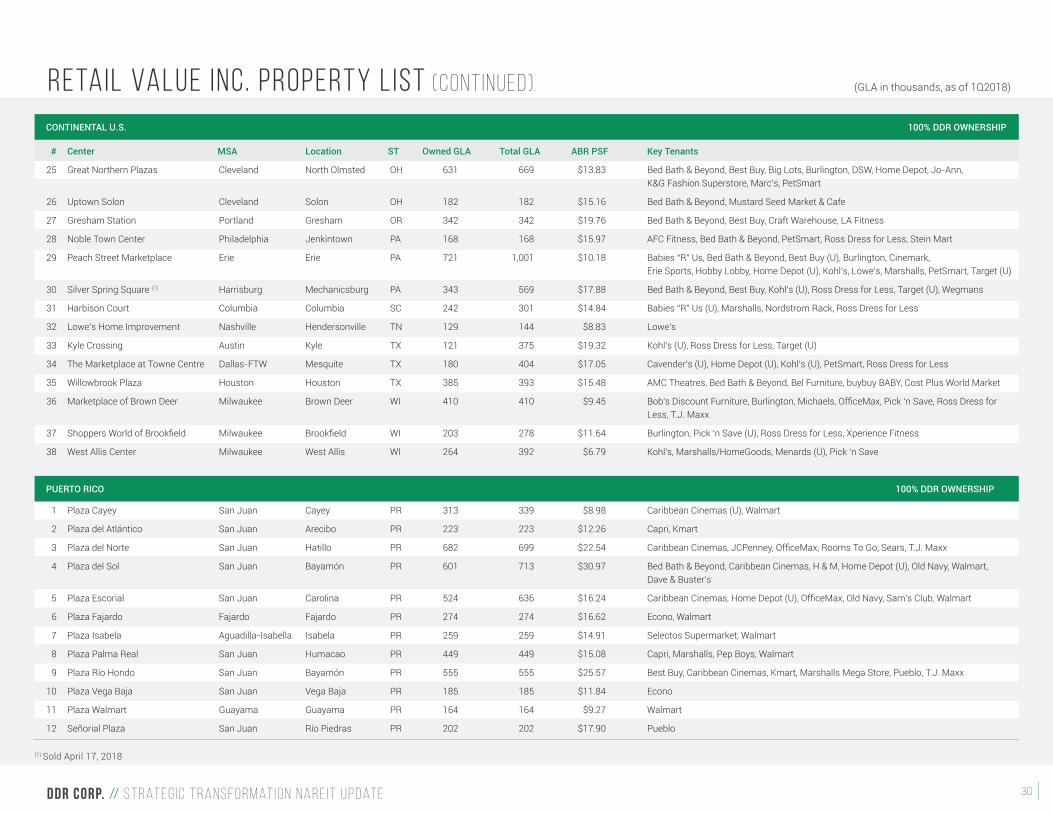
Retail Value Inc. Property L ist (CONT INUED) (GLA in thousands, as of 1Q2018)
CONTINENTAL U.S. 100% DDR OWNERSHIP
# Center MSA Location ST Owned GLA Total GLA ABR PSF Key Tenants
25 Great Northern Plazas Cleveland North Olmsted OH 631 669 $13.83 Bed Bath & Beyond, Best Buy, Big Lots, Burlington, DSW, Home Depot, Jo-Ann, K&G Fashion Superstore, Marc’s, PetSmart
26 Uptown Solon Cleveland Solon OH 182 182 $15.16 Bed Bath & Beyond, Mustard Seed Market & Cafe
27 Gresham Station Portland Gresham OR 342 342 $19.76 Bed Bath & Beyond, Best Buy, Craft Warehouse, LA Fitness
28 Noble Town Center Philadelphia Jenkintown PA 168 168 $15.97 AFC Fitness, Bed Bath & Beyond, PetSmart, Ross Dress for Less, Stein Mart
29 Peach Street Marketplace Erie Erie PA 721 1,001 $10.18 Babies “R” Us, Bed Bath & Beyond, Best Buy (U), Burlington, Cinemark, Erie Sports, Hobby Lobby, Home Depot (U), Kohl’s, Lowe’s, Marshalls, PetSmart, Target (U)
30 Silver Spring Square (1) Harrisburg Mechanicsburg PA 343 569 $17.88 Bed Bath & Beyond, Best Buy, Kohl’s (U), Ross Dress for Less, Target (U), Wegmans
31 Harbison Court Columbia Columbia SC 242 301 $14.84 Babies “R” Us (U), Marshalls, Nordstrom Rack, Ross Dress for Less
32 Lowe’s Home Improvement Nashville Hendersonville TN 129 144 $8.83 Lowe’s
33 Kyle Crossing Austin Kyle TX 121 375 $19.32 Kohl’s (U), Ross Dress for Less, Target (U)
34 The Marketplace at Towne Centre Dallas-FTW Mesquite TX 180 404 $17.05 Cavender’s (U), Home Depot (U), Kohl’s (U), PetSmart, Ross Dress for Less
35 Willowbrook Plaza Houston Houston TX 385 393 $15.48 AMC Theatres, Bed Bath & Beyond, Bel Furniture, buybuy BABY, Cost Plus World Market
36 Marketplace of Brown Deer Milwaukee Brown Deer WI 410 410 $9.45 Bob’s Discount Furniture, Burlington, Michaels, OfficeMax, Pick ‘n Save, Ross Dress for Less, T.J. Maxx
37 Shoppers World of Brookfield Milwaukee Brookfield WI 203 278 $11.64 Burlington, Pick ‘n Save (U), Ross Dress for Less, Xperience Fitness
38 West Allis Center Milwaukee West Allis WI 264 392 $6.79 Kohl’s, Marshalls/HomeGoods, Menards (U), Pick ‘n Save
PUERTO RICO 100% DDR OWNERSHIP
1 Plaza Cayey San Juan Cayey PR 313 339 $8.98 Caribbean Cinemas (U), Walmart
2 Plaza del Atlántico San Juan Arecibo PR 223 223 $12.26 Capri, Kmart
3 Plaza del Norte San Juan Hatillo PR 682 699 $22.54 Caribbean Cinemas, JCPenney, OfficeMax, Rooms To Go, Sears, T.J. Maxx
4 Plaza del Sol San Juan Bayamón PR 601 713 $30.97 Bed Bath & Beyond, Caribbean Cinemas, H & M, Home Depot (U), Old Navy, Walmart, Dave & Buster’s
5 Plaza Escorial San Juan Carolina PR 524 636 $16.24 Caribbean Cinemas, Home Depot (U), OfficeMax, Old Navy, Sam’s Club, Walmart
6 Plaza Fajardo Fajardo Fajardo PR 274 274 $16.62 Econo, Walmart
7 Plaza Isabela Aguadilla-Isabella Isabela PR 259 259 $14.91 Selectos Supermarket, Walmart
8 Plaza Palma Real San Juan Humacao PR 449 449 $15.08 Capri, Marshalls, Pep Boys, Walmart
9 Plaza Río Hondo San Juan Bayamón PR 555 555 $25.57 Best Buy, Caribbean Cinemas, Kmart, Marshalls Mega Store, Pueblo, T.J. Maxx
10 Plaza Vega Baja San Juan Vega Baja PR 185 185 $11.84 Econo
11 Plaza Walmart Guayama Guayama PR 164 164 $9.27 Walmart
12 Señorial Plaza San Juan Río Piedras PR 202 202 $17.90 Pueblo
(1) Sold April 17, 2018
31ddr corp. // s t r at e g i c t r a n s f o r m at i o n n a r e i t u p d at e
Non-GAAP F inancial Measures - Def in it ions
FFO is a supplemental non-GAAP financial measure used as a standard in the real estate industry and is a widely accepted measure of real estate investment trust (“REIT”) performance. Management believes that both FFO and Operating FFO provide additional indicators of the financial performance of a REIT. The Company also believes that FFO and Operating FFO more appropriately measure the core operations of the Company and provide benchmarks to its peer group. FFO is generally defined and calculated by the Company as net income (loss), adjusted to exclude: (i) preferred share dividends, (ii) gains and losses from disposition of depreciable real estate property and related investments, which are presented net of taxes, (iii) impairment charges on depreciable real estate property and related investments and (iv) certain non-cash items. These non-cash items principally include real property depreciation and amortization of intangibles, equity income (loss) from joint ventures and equity income (loss) from non-controlling interests and adding the Company’s proportionate share of FFO from its unconsolidated joint ventures and non-controlling interests, determined on a consistent basis. The Company’s calculation of FFO is consistent with the NAREIT definition. The Company calculates Operating FFO by excluding certain non-operating charges and gains. Operating FFO is useful to investors as the Company removes non-comparable charges and gains to analyze the results of its operations and assess performance of the core operating real estate portfolio. Other real estate companies may calculate FFO and Operating FFO in a different manner. The Company also uses Net Operating Income (“NOI”), a non-GAAP financial measure, as a supplemental performance measure. NOI is calculated herein as property revenues less property expenses and excludes all non-property and corporate level revenue and expenses. The Company believes NOI provides useful information to investors regarding the Company’s financial condition and results of operations because it reflects only those income and expense items that are incurred at the property level and, when compared across periods, reflects the impact on operations from trends in occupancy rates, rental rates, operating costs and acquisition and disposition activity on an unleveraged basis. The Company has further adjusted NOI to exclude lease termination fees, net hurricane-related losses and NOI associated with all properties sold during the first quarter ended March 31, 2018 (“Adjusted NOI”). The Company believes that FFO, OFFO and Adjusted NOI are not, and are not intended to be, presentations in accordance with GAAP. FFO, OFFO and Adjusted NOI information have their limitations as they exclude any capital expenditures associated with the re-leasing of tenant space or as needed to operate the assets. FFO, OFFO and Adjusted NOI do not represent amounts available for dividends, capital replacement or expansion, debt service obligations or other commitments and uncertainties. Management does not use FFO, OFFO and Adjusted NOI as indicators of the Company’s cash obligations and funding requirements for future commitments, acquisitions or development activities. FFO, OFFO and Adjusted NOI do not represent cash generated from operating activities in accordance with GAAP, and are not necessarily indicative of cash available to fund cash needs. FFO, OFFO and Adjusted NOI should not be considered as alternatives to net income (computed in accordance with GAAP), as indicators of operating performance or as alternatives to cash flow as a measure of liquidity. Reconciliations of these measures to the most directly comparable GAAP measure of net income (loss) has been provided herein.
32ddr corp. // s t r at e g i c t r a n s f o r m at i o n n a r e i t u p d at e
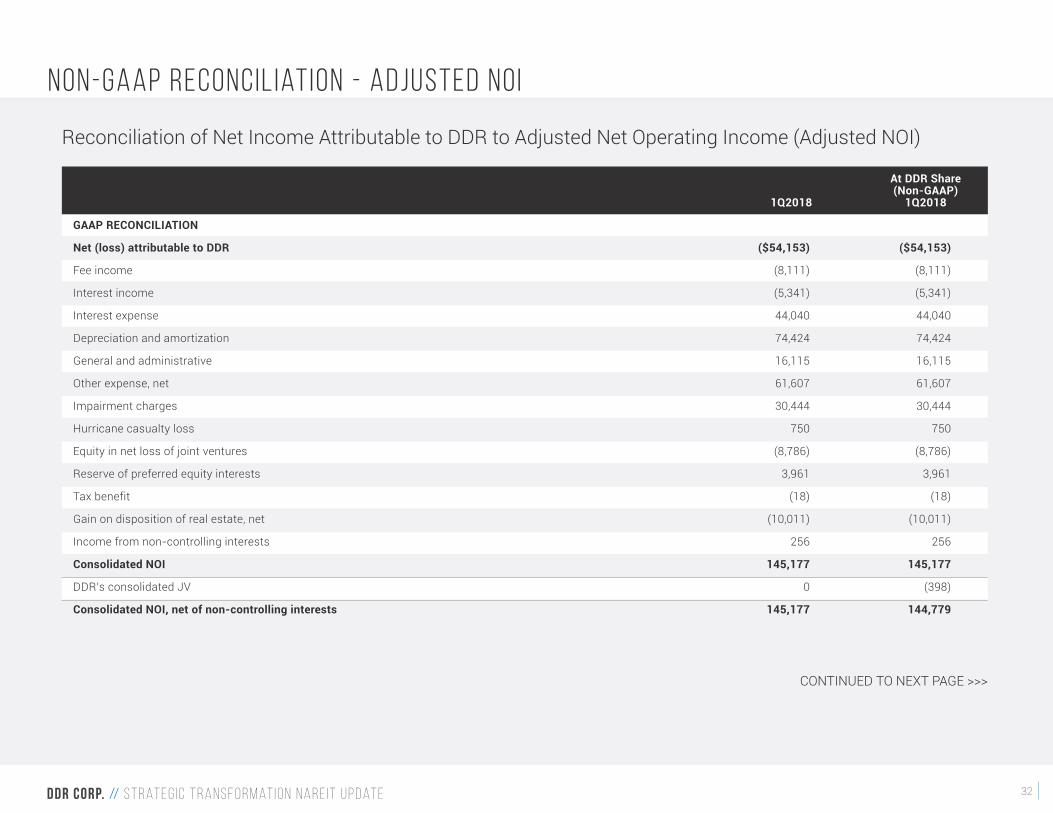
At DDR Share (Non-GAAP) 1Q2018 1Q2018
GAAP RECONCILIATION
Net (loss) attributable to DDR ($54,153) ($54,153)
Fee income (8,111) (8,111)
Interest income (5,341) (5,341)
Interest expense 44,040 44,040
Depreciation and amortization 74,424 74,424
General and administrative 16,115 16,115
Other expense, net 61,607 61,607
Impairment charges 30,444 30,444
Hurricane casualty loss 750 750
Equity in net loss of joint ventures (8,786) (8,786)
Reserve of preferred equity interests 3,961 3,961
Tax benefit (18) (18)
Gain on disposition of real estate, net (10,011) (10,011)
Income from non-controlling interests 256 256
Consolidated NOI 145,177 145,177
DDR’s consolidated JV 0 (398)
Consolidated NOI, net of non-controlling interests 145,177 144,779
CONTINUED TO NEXT PAGE >>>
Non-GAAP Reconcil iation - Adjusted NOI
Reconciliation of Net Income Attributable to DDR to Adjusted Net Operating Income (Adjusted NOI)
33ddr corp. // s t r at e g i c t r a n s f o r m at i o n n a r e i t u p d at e
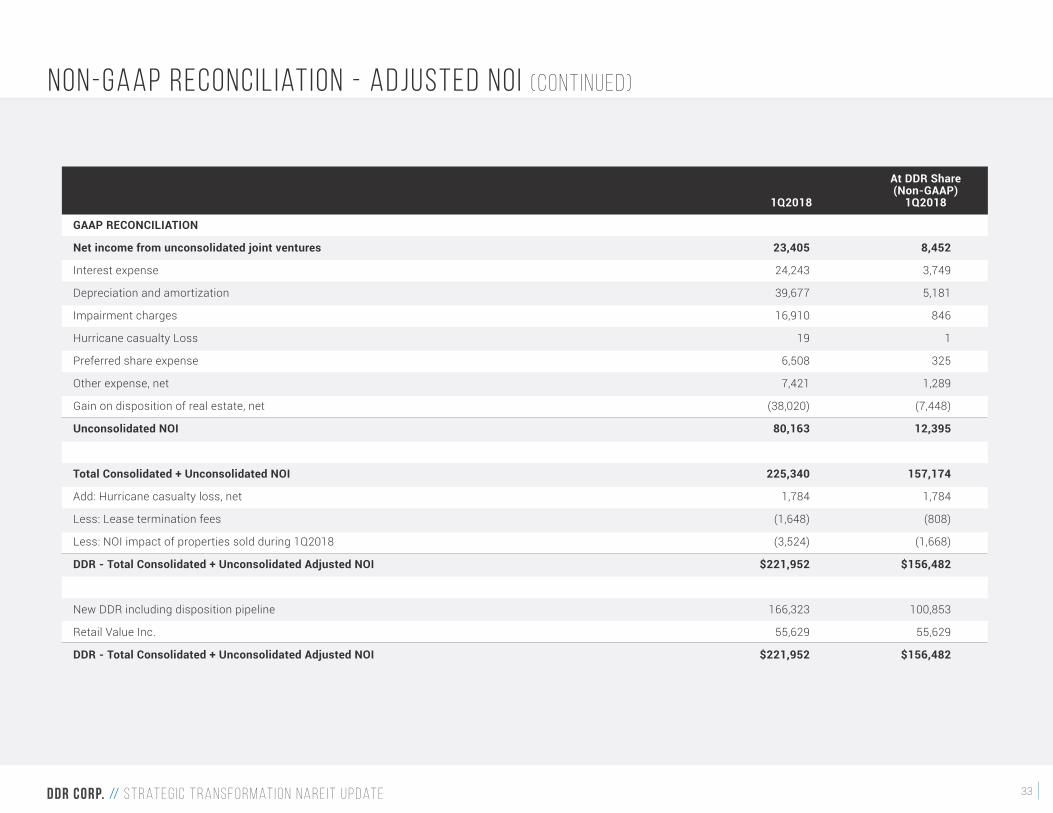
Non-GAAP Reconcil iation - Adjusted NOI (CONTINUED)
At DDR Share (Non-GAAP) 1Q2018 1Q2018
GAAP RECONCILIATION
Net income from unconsolidated joint ventures 23,405 8,452
Interest expense 24,243 3,749
Depreciation and amortization 39,677 5,181
Impairment charges 16,910 846
Hurricane casualty Loss 19 1
Preferred share expense 6,508 325
Other expense, net 7,421 1,289
Gain on disposition of real estate, net (38,020) (7,448)
Unconsolidated NOI 80,163 12,395
Total Consolidated + Unconsolidated NOI 225,340 157,174
Add: Hurricane casualty loss, net 1,784 1,784
Less: Lease termination fees (1,648) (808)
Less: NOI impact of properties sold during 1Q2018 (3,524) (1,668)
DDR - Total Consolidated + Unconsolidated Adjusted NOI $221,952 $156,482
New DDR including disposition pipeline 166,323 100,853
Retail Value Inc. 55,629 55,629
DDR - Total Consolidated + Unconsolidated Adjusted NOI $221,952 $156,482

34ddr corp. // s t r at e g i c t r a n s f o r m at i o n n a r e i t u p d at e
Reconciliation of Net Income Attributable to Common Shareholders to FFO and Operating FFO estimate
Non-GAAP Reconcil iation - oFFO
Per Share - Diluted
2Q2018E 3Q2018E Net (loss) income attributable to Common Shareholders ($0.19) - ($0.16) $0.04 - $0.06
Depreciation and amortization of real estate 0.38 - 0.41 0.23 - 0.26
Equity in net income of JVs (0.02) (0.02)
JVs’ FFO 0.04 0.04
FFO (NAREIT) $0.24 $0.29
Transaction and debt extinguishment costs 0.21 - 0.24 0.01
Operating FFO $0.45 $0.30