Embed Size (px)
Citation preview

Together with you, we make a house a home.
NAREIT Presentation
November 12 - 13, 2019

DisclaimerThis presentation contains forward-looking statements within the meaning of Section 27A of the Securities Act of 1933, as amended (the "Securities Act") and Section 21E of the Securities Exchange Act of 1934, as amended (the "Exchange Act"), which include, but are not limited to, statements related to the Company’s expectations regarding the anticipated benefits of the merger with Starwood Waypoint Homes, the performance of the Company’s business, its financial results, its liquidity and capital resources, and other non-historical statements. In some cases, you can identify these forward-looking statements by the use of words such as "outlook," "believes," "expects," "potential," "continues," "may," "will," "should," "could," "seeks," "projects," "predicts," "intends," "plans," "estimates," "anticipates" or the negative version of these words or other comparable words. Such forward-looking statements are subject to various risks and uncertainties, including, among others, risks associated with achieving expected revenue synergies or cost savings from the merger, risks inherent to the single-family rental industry sector and the Company’s business model, macroeconomic factors beyond the Company’s control, competition in identifying and acquiring the Company’s properties, competition in the leasing market for quality residents, increasing property taxes, homeowners' association fees and insurance costs, the Company’s dependence on third parties for key services, risks related to evaluation of properties, poor resident selection and defaults and non-renewals by the Company’s residents, performance of the Company’s information technology systems, and risks related to the Company’s indebtedness. Accordingly, there are or will be important factors that could cause actual outcomes or results to differ materially from those indicated in these statements. Additional factors that could cause the Company’s results to differ materially from those described in the forward-looking statements can be found under the section entitled "Part I. Item 1A. Risk Factors," of the Company’s Annual Report on Form 10-K for the fiscal year ended December 31, 2018, filed with the Securities and Exchange Commission (the "SEC"), as such factors may be updated from time to time in the Company’s periodic filings with the SEC, which are accessible on the SEC’s website at http://www.sec.gov. These factors should not be construed as exhaustive and should be read in conjunction with the other cautionary statements that are included in this presentation and in the Company’s filings with the SEC. The forward-looking statements speak only as of the date of this presentation, and we expressly disclaim any obligation or undertaking to publicly update or review any forward-looking statement, whether as a result of new information, future developments or otherwise, except to the extent otherwise required by law.
2

Southern California
I. INVESTMENT HIGHLIGHTS
3
Invitation Homes Investment Highlights
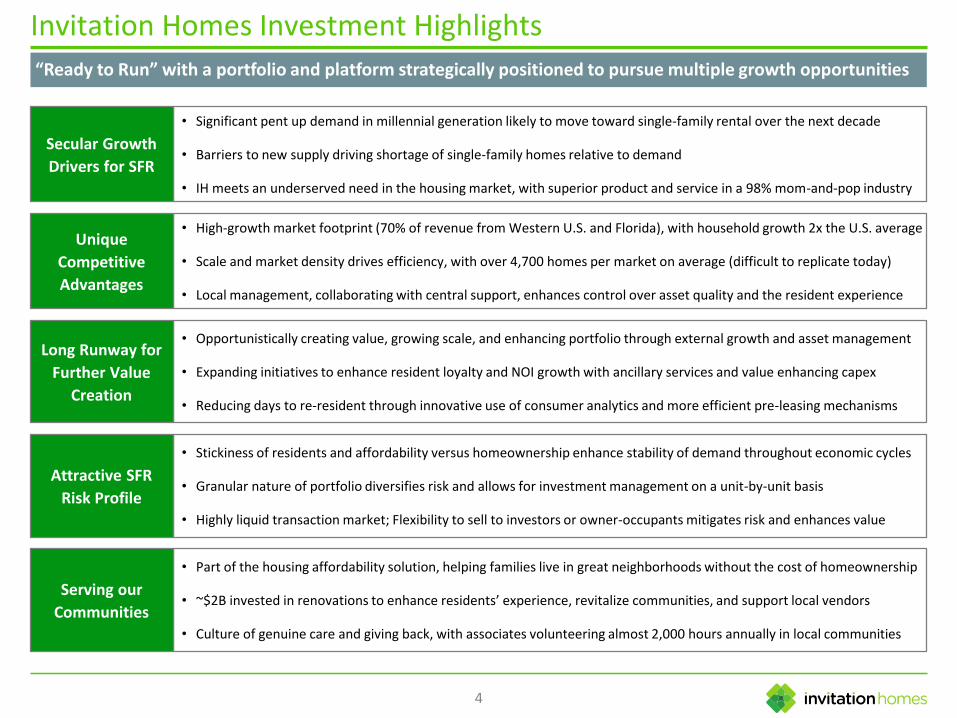
“Ready to Run” with a portfolio and platform strategically positioned to pursue multiple growth opportunities
• Opportunistically creating value, growing scale, and enhancing portfolio through external growth and asset management
• Expanding initiatives to enhance resident loyalty and NOI growth with ancillary services and value enhancing capex
• Reducing days to re-resident through innovative use of consumer analytics and more efficient pre-leasing mechanisms
Long Runway for
Further Value
Creation
• High-growth market footprint (70% of revenue from Western U.S. and Florida), with household growth 2x the U.S. average
• Scale and market density drives efficiency, with over 4,700 homes per market on average (difficult to replicate today)
• Local management, collaborating with central support, enhances control over asset quality and the resident experience
Unique
Competitive
Advantages
• Part of the housing affordability solution, helping families live in great neighborhoods without the cost of homeownership
• ~$2B invested in renovations to enhance residents’ experience, revitalize communities, and support local vendors
• Culture of genuine care and giving back, with associates volunteering almost 2,000 hours annually in local communities
Serving our
Communities
• Significant pent up demand in millennial generation likely to move toward single-family rental over the next decade
• Barriers to new supply driving shortage of single-family homes relative to demand
• IH meets an underserved need in the housing market, with superior product and service in a 98% mom-and-pop industry
Secular Growth
Drivers for SFR
4
Attractive SFR
Risk Profile
• Stickiness of residents and affordability versus homeownership enhance stability of demand throughout economic cycles
• Granular nature of portfolio diversifies risk and allows for investment management on a unit-by-unit basis
• Highly liquid transaction market; Flexibility to sell to investors or owner-occupants mitigates risk and enhances value
5
Early Stages of a Long-Term Growth Story
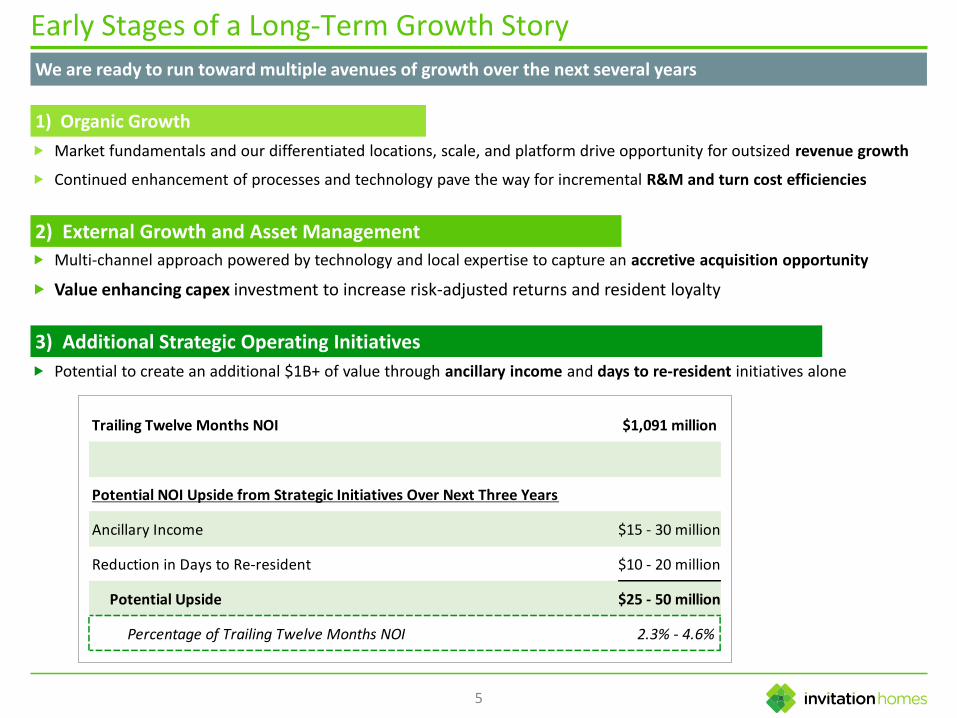
We are ready to run toward multiple avenues of growth over the next several years
Market fundamentals and our differentiated locations, scale, and platform drive opportunity for outsized revenue growth
Continued enhancement of processes and technology pave the way for incremental R&M and turn cost efficiencies
1) Organic Growth
2) External Growth and Asset Management
Multi-channel approach powered by technology and local expertise to capture an accretive acquisition opportunity
Value enhancing capex investment to increase risk-adjusted returns and resident loyalty
3) Additional Strategic Operating Initiatives
Potential to create an additional $1B+ of value through ancillary income and days to re-resident initiatives alone
Trailing Twelve Months NOI $1,091 million
Potential NOI Upside from Strategic Initiatives Over Next Three Years
Ancillary Income $15 - 30 million
Reduction in Days to Re-resident $10 - 20 million
Potential Upside $25 - 50 million
Percentage of Trailing Twelve Months NOI 2.3% - 4.6%

Track Record of Outsized Growth
Sector fundamentals and Invitation Homes differentiators are driving consistent outsized growth
6
4.2%
3.0%
2.8%
InvitationHomes
NationalResidential
CoastalResidential
2017 SS-Revenue Growth
4.5%
2.6%
2.5%
InvitationHomes
NationalResidential
CoastalResidential
2018 SS-Revenue Growth
4.4%
3.6%
3.2%
InvitationHomes
NationalResidential
CoastalResidential
________________________________________________
Note: National Residential represents simple average of AIV, AMH, CPT, MAA, and UDR. Coastal Residential represents simple average of AVB, EQR, and ESS. Data sourced from each company’s public filings.
7.4%
3.5%
2.9%
InvitationHomes
NationalResidential
CoastalResidential
2017 SS-NOI Growth
5.4%
3.9%
3.4%
InvitationHomes
NationalResidential
CoastalResidential
4.4%
2.9%
2.3%
InvitationHomes
NationalResidential
CoastalResidential
2018 SS-NOI Growth
2019 SS-Revenue Growth Guidance Midpoint
2019 SS-NOI Growth Guidance Midpoint
Premier Single-Family Portfolio
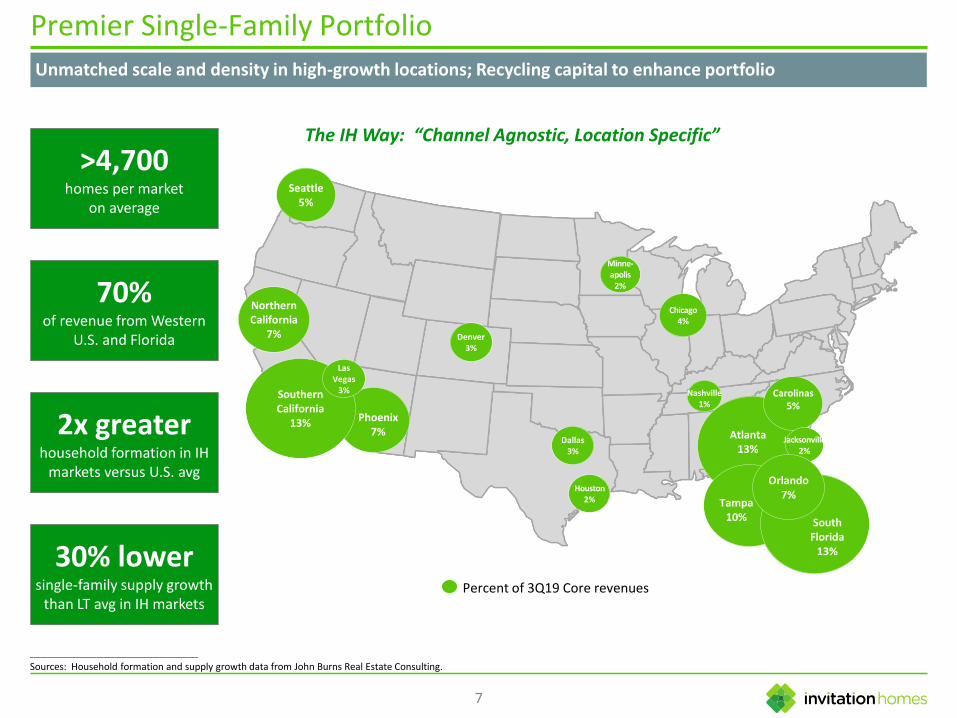
Unmatched scale and density in high-growth locations; Recycling capital to enhance portfolio
7
Percent of 3Q19 Core revenues
Seattle5%
Minne-apolis
2%
Denver3%
Dallas3%
Phoenix7% Atlanta
13%
Tampa10%
SouthernCalifornia
13%
Las Vegas
3%
South Florida
13%
NorthernCalifornia
7%
Carolinas5%
Nashville1%
Jacksonville2%
Orlando7%
The IH Way: “Channel Agnostic, Location Specific”
Houston2%
Chicago4%
>4,700homes per market
on average
70%of revenue from Western
U.S. and Florida
2x greaterhousehold formation in IH
markets versus U.S. avg
30% lowersingle-family supply growth
than LT avg in IH markets
________________________________________________
Sources: Household formation and supply growth data from John Burns Real Estate Consulting.

Best-in-Class Operating & Asset Management Platform
Local, high-touch service with eyes in markets enhances control over asset quality and the resident experience
8
Local resident service, leasing, and investment/asset management, with centralized oversight and tools
Proactive resident care and asset preservation
Collaboration between operations and investment teams to identify opportunities and drive consistency
Enhanced efficiency through technology, process innovation, and data-driven performance management of both in-house personnel and vendor partners
80,232homes
18 Field investment personnel
814 Field ops
personnel covering 34 home pods
Central strategy, tools, and oversight
Collaboration
35.3%34.5%
33.8%32.5%
31.1%30.0% 29.6%
1Q18 2Q18 3Q18 4Q18 1Q19 2Q19 3Q19
Trailing Twelve Months Turnover Rate (Same Store)
________________________________________________
Note: Home count is as of 9/30/2019.

Leasing Fundamentals Remain Strong
Leading investor and operator of over 80k homes in a sector with outsized growth prospects
9
Occupancy is well-positioned for the leasing offseason, and rental rate growth continues to outpace prior year
Same Store Average Occupancy Same Store Blended Rental Rate Growth
4.0%
4.7%
4.3%
3.5%
4.7%
5.3%
4.6%
3.9%
Q1 Q2 Q2 Oct
2018 2019
95.7%
96.1%
95.5%
95.7%
96.5% 96.5%
95.9%
95.7%
Q1 Q2 Q3 Oct
2018 2019

64 65
8874
98 98
142
230
206
234
0
50
100
150
200
250
Jan Feb Mar Apr May June July Aug Sep Oct
2019 One-Off Acquisitions
Seeing More Opportunity for Accretive Acquisitions
Reacted quickly in Q3 2019 to increase buying, using equity to fund acquisitions in excess of dispositions
10
January – JuneAcquired 487 homes for
$147M
81 HomesPer Month
TargetIncrease
223 HomesPer Month
JulyDeployment target increased due to
favorable market conditions
August – OctoberAcquired 670 homes for
$212M
Homes acquired
________________________________________________
Note: All home counts refer to one-off acquisition channel only.

Focused on reducing leverage alongside accretive external growth; $552M of net debt reduction in YTD 2019
Committed to Deleveraging
Making Progress Towards Investment GradeCapital Recycling to Enhance Portfolio
9/30/199/30/18
11
9.4x
8.5xNet Debt to Adjusted EBITDAre
Safe balance sheet today
• No debt maturing prior to 2022
• 99% of debt fixed or swapped to fixed rate in 2020
• ~50% of assets unencumbered
• Significant liquidity with ~$1.1B available through unrestricted cash and revolving lines of credit
Flexible capital stack that is mostly prepayable at no cost
Continuing to open new financing channels, with first loan from life insurance company in 2Q19
Compelling market opportunity to prune portfolio and re-deploy capital into homes with higher expected long-term total return
• $456M of acquisitions and $527M of dispositions YTD through September 2019
• Proprietary asset management tools and rebuy analysis drive decision making on a home-by-home basis
• Portfolio scale enables more selective disposition decisions
Multiple balance sheet tools, including ATM equity program, to fund acquisition opportunities in excess of disposition proceeds
• $19M equity issuance in Q3 2019 to fund acquisitions

Seattle
II. COMPELLING INDUSTRY FUNDAMENTALS
12

Meeting an Underserved Need in the Housing Market
IH provides a superior experience, but today serves only 0.5% of the growing demand for single-family rentals
13
Single-Family Rental (SFR) Market Share (1)(2)
0.3 million
15.4 million
InstitutionalOwners
"Mom & Pops"
Home Count by Owner Type
Growing Single-Family Rental Demand
Single-Family Rental Households
5M
9M
13M
17M
06 07 08 09 10 11 12 13 14 15 16 17 18 2Q19
Single-Family Rental: 36% (16M units)
Mobile Homes, Boats, Etc.: 4%
(2M units)
2-9 Unit Apartments: 29%
(13M units)
10+ Unit Apartments: 31%
(14M units)
Owned: 64% (80M units)
Rented: 36% (45M units)
U.S. Housing Summary (1)
125 Million Households
45 Million Rental Households
________________________________________________
(1) Source: John Burns Real Estate Consulting.(2) Source: Public company home counts from public filings as of 2Q19; Private company home counts estimated using HouseCanary data.

John Burns Real Estate Consulting expects 12.5M net households to be formed over the next 10 years
Demographics to Drive Household Formation
14
21.1
22.1
23.3
21.9
21.2
19.6
20.9
18
19
20
21
22
23
24
15-19 20-24 25-29 30-34 35-39 40-44 45-49
Avg. IH Resident Age: 39
Current Population by Age Cohort(millions of people)
Future Demand
Percentage of 30-Year-Olds Hitting ‘Adult’ Milestones
70%
57%
47%
33%
90%
89%
76%
56%
Live on their own
Have evermarried
Live with a child
Own a home
1975 2015
________________________________________________
Source: U.S. Census Bureau and John Burns Real Estate Consulting.
Delayed milestones = significant future demand
Significant pent-up demand in millennial generation likely to move toward single-family rental over the next decade

Supply is Constrained
Shortfall in single-family home construction is likely to continue
15
________________________________________________
Source: U.S. Census Bureau and John Burns Real Estate Consulting.
Total Housing Permits (Single and Multifamily) as a % of Households in Invitation Homes’ Markets
0.0%
1.0%
2.0%
3.0%
4.0%
1980 1983 1986 1989 1992 1995 1998 2001 2004 2007 2010 2013 2016 2019
Single-Family Multifamily 80-'19 Avg
Homebuilders cite rising labor costs, materials costs, impact fees, and regulatory hurdles as barriers to new supply
Replacement cost increases for single-family housing continue to outpace consumer inflation and household income growth

A Great Business to Own Throughout the Economic Cycle
Single-family rental performance can be strong regardless of economic trends
16
Scenario: Strong Economic Growth, Higher Rates Scenario: Slower Economic Growth, Lower Rates
Job growth could support stronger household formation
Higher mortgage rates could increase the cost of homeownership
Wage growth could support residents’ ability to absorb rent increases and increase demand for ancillary services
Asset values could benefit from home price appreciation
Economic uncertainty could reduce moveouts to homeownership and benefit occupancy
Slower job growth may result in lower rates of household formation, but could increase SFR’s share of formations
External growth opportunity could become more attractive in the world’s most liquid real estate asset class; flexibility to asset manage on a unit-by-unit basis
Key Structural Tailwinds Likely Benefit Invitation Homes Regardless of Macroeconomic Fundamentals
Demographics (aging millennial generation) supportive of household formation
Mature, stable Invitation Homes resident base – $100k average annual income across 2 wage earners; 39 year average age
Cost efficiency upside with earlier-stage platform versus other real estate types
Las Vegas
17
III. THE INVITATION HOMES WAY – LEVERAGING OUR RESOURCES TO SERVE COMMUNITIES

Together with you, we make a house a home.
Mission
Our Mission, Vision, and Values
18
Be the premier choice in home leasing by continuously enhancing our residents’
living experience.
ValuesVision
Unshakeable IntegrityWe hold ourselves accountable to act with honesty, trust and respect.
Genuine CareWe serve with heart.
Continuous ExcellenceWe always find a way to
innovate and deliver.
Standout CitizenshipWe strive to benefit our
neighbors and ourcommunities.

Providing a high quality leasing experience for families and improving communities
Positive Impact on Residents and Communities
~$2 billion investment rehabilitating homes to date
$289 million local taxes supporting communities in 2018
$256 million to maintain homes for residents in 2018
$31 million paid to homeowner associations in 2018
Hundreds of local vendors supported
“ProCare” professional resident services provided by in-
house local management and service teams
24/7 resident service hotline
Resident First Look program for home sales
Technology-enhanced resident experience
High quality homes in desirable neighborhoods
Community InvestmentResident Experience
19

Glossary
20
Adjusted EBITDAreWe define EBITDA as net income or loss computed in accordance with accounting principles generally accepted in the United States (“GAAP”) before the following items: interest expense; income tax expense; and depreciation and amortization. National Association of Real Estate Investment Trusts ("Nareit") recommends as a best practice that REITs operating as real estate companies which report an EBITDA performance measure also report EBITDAre in all financial reports for periods beginning after December 31, 2017. We define EBITDAre, consistent with the Nareit definition, as EBITDA, further adjusted for gain on sale of property, net of tax and impairment on depreciated real estate investments. Adjusted EBITDAre is defined as EBITDAre before the following items: share-based compensation expense; IPO related expenses; merger and transaction-related expenses; severance; casualty losses, net; acquisition costs; and interest income and other miscellaneous income and expenses. EBITDA, EBITDAre and Adjusted EBITDAre are used as supplemental financial performance measures by management and by external users of our financial statements, such as investors and commercial banks. Set forth below is additional detail on how management uses EBITDA, EBITDAre and Adjusted EBITDAre as measures of performance. The GAAP measure most directly comparable to EBITDA, EBITDAre and Adjusted EBITDAreis net income or loss. EBITDA, EBITDAre and Adjusted EBITDAre are not used as measures of our liquidity and should not be considered alternatives to net income or loss or any other measure of financial performance presented in accordance with GAAP. Our EBITDA, EBITDAre and Adjusted EBITDAre may not be comparable to the EBITDA, EBITDAre and Adjusted EBITDAre of other companies due to the fact that not all companies use the same definitions of EBITDA, EBITDAre and Adjusted EBITDAre. Accordingly, there can be no assurance that our basis for computing these non-GAAP measures is comparable with that of other companies.
Average OccupancyAverage occupancy for an identified population of homes represents (i) the total number of days that the homes in such population were occupied during the measurement period, divided by (ii) the total number of days that the homes in such population were owned during the measurement period.
Core RevenuesCore revenues for an identified population of homes reflects total revenues, net of any resident recoveries.
Days to Re-residentDays to re-resident represents, for new leases started during a period, the number of days elapsed between move-out of the prior resident and the lease start date of the new resident.
Net Operating Income (NOI)We define NOI for an identified population of homes as rental revenues and other property income less property operating and maintenance expense (which consists primarily of property taxes, insurance, HOA fees (when applicable), market-level personnel expenses, repairs and maintenance, leasing costs and marketing). NOI excludes: interest expense; depreciation and amortization; general and administrative expense; property management expense; impairment and other; acquisition costs; (gain) loss on sale of property, net of tax; and interest income and other miscellaneous income and expenses. The GAAP measure most directly comparable to NOI is net income or loss. NOI is not used as a measure of liquidity and should not be considered as an alternative to net income or loss or any other measure of financial performance presented in accordance with GAAP. Our NOI may not be comparable to the NOI of other companies due to the fact that not all companies use the same definition of NOI. Accordingly, there can be no assurance that our basis for computing this non-GAAP measure is comparable with that of other companies. We believe that Same Store NOI is also a meaningful supplemental measure of our operating performance for the same reasons as NOI and is further helpful to investors as it provides a more consistent measurement of our performance across reporting periods by reflecting NOI for homes in our Same Store portfolio.
Rental Rate GrowthRental rate growth for any home represents the percentage difference between the monthly rent from an expiring lease and the monthly rent from the next lease, and, in each case, reflects the impact of any amortized non-service rent concessions and contractual rent increases. Leases are either renewal leases, where our current resident chooses to stay for a subsequent lease term, or a new lease, where our previous resident moves out and a new resident signs a lease to occupy the same home.
Glossary (Cont.)
21
Same Store / Same Store PortfolioSame Store or Same Store portfolio includes, for a given reporting period, homes that have been stabilized and seasoned (whether under Invitation Homes ownership or Starwood Waypoint Homes ownership), excluding homes that have been sold, homes that have been identified for sale to an owner occupant and have become vacant, homes that have been deemed inoperable or significantly impaired by casualty loss events or force majeure, and homes acquired in portfolio transactions that are deemed not to have undergone renovations of sufficiently similar quality and characteristics as the existing Invitation Homes Same Store portfolio.
Homes are considered stabilized if they have (i) completed an initial renovation and (ii) entered into at least one post-initial renovation lease. An acquired portfolio that is both leased and deemed to be of sufficiently similar quality and characteristics as the existing Invitation Homes Same Store portfolio may be considered stabilized at the time of acquisition.
Homes are considered to be seasoned once they have been stabilized for at least 15 months prior to January 1st of the year in which the Same Store portfolio was established.
We believe presenting information about the portion of our portfolio that has been fully operational for the entirety of a given reporting period and its prior year comparison period provides investors with meaningful information about the performance of our comparable homes across periods and about trends in our organic business.
Total HomesTotal homes or total portfolio refers to the total number of homes owned, whether or not stabilized, and excludes any properties previously acquired in purchases that have been subsequently rescinded or vacated.
Turnover RateTurnover rate represents the number of instances that homes in an identified population become unoccupied in a given period, divided by the number of homes in such population.
Value Enhancing CapexValue enhancing capex represents re-investment in stabilized homes, above and beyond general replacements to preserve and maintain the value and functionality of a home, for the purpose of enhancing expected risk-adjusted returns.