Embed Size (px)
Citation preview
Strategic Research
PROGRAM
Analysis of Chemical Tanker Transits on the Houston Ship Channel
161510-1
September 2015 Revised 10/19/15
ii
1. Report No.
TTI/SRP/15/161510-1
2. Government Accession No.
3. Recipient's Catalog No.
4. Title and Subtitle
ANALYSIS OF CHEMICAL TANKER TRANSITS ON THE
HOUSTON SHIP CHANNEL
5. Report Date
September 2015 6. Performing Organization Code
7. Author(s)
C. James Kruse
8. Performing Organization Report No.
9. Performing Organization Name and Address
Texas A&M Transportation Institute
College Station, Texas 77843-3135
10. Work Unit No. (TRAIS)
11. Contract or Grant No.
10727 12. Sponsoring Agency Name and Address
Texas A&M Transportation Institute
College Station, Texas 77843-3135
13. Type of Report and Period Covered
14. Sponsoring Agency Code
15. Supplementary Notes
Supported by the State of Texas.
Project Title: Concept of Operations for Vessel Scheduling Optimization at Port of Houston/Houston Ship
Channel 16. Abstract
This research focuses on the issue of in-port transits made by chemical tankers within the Port of Houston.
Unlike other vessels, these vessels typically call at multiple terminals during a single port call. Because of
the high volume of vessel activity in Houston, there are often scheduling conflicts that cause a vessel to have
to move to an anchorage or layberth site until the conflict is resolved. There are approximately 1,400 such
transits on the Houston Ship Channel each year. This report provides some statistical information on these
transits, along with information on the cost, environmental effects, and safety issues associated with these
transits. A number of measures to help mitigate these effects are described for consideration by industry and
policy makers. Additionally, this research proposes a legal/organizational structure to provide the necessary
management and coordination for the implementation of these measures.
17. Key Words
Houston Ship Channel, Chemical Tankers, Port
Efficiency, Port Vessel Traffic
18. Distribution Statement
No restrictions. This document is available to the
public through NTIS:
National Technical Information Service
Alexandria, Virginia
http://www.ntis.gov 19. Security Classif. (of this report)
Unclassified
20. Security Classif. (of this page)
Unclassified
21. No. of Pages
61
22. Price
Technical Report Documentation Page
Form DOT F 1700.7 (8-72) Reproduction of completed page authorized
iv
ANALYSIS OF CHEMICAL TANKER TRANSITS
ON THE HOUSTON SHIP CHANNEL
by
C. James Kruse
Director, Center for Ports and Waterways
Texas A&M Transportation Institute
Report SRP/15/161510-1
Project 161510
Concept of Operations for Vessel Scheduling Optimization at
Port of Houston/Houston Ship Channel
September 2015
TEXAS A&M TRANSPORTATION INSTITUTE
The Texas A&M University System
College Station, Texas 77843-3135
iii
TABLE OF CONTENTS
LIST OF TABLES .......................................................................................................................... v
LIST OF FIGURES ........................................................................................................................ v
DISCLAIMER ............................................................................................................................... vi
ACKNOWLEDGMENTS ............................................................................................................. vi
EXECUTIVE SUMMARY .......................................................................................................... vii
CHAPTER 1: THE OBJECTIVE OF THIS REPORT ................................................................... 1
CHAPTER 2: MANAGING CHEMICAL TANKER TRANSITS IN HOUSTON ...................... 4
Background ................................................................................................................................. 4
The Chemical Tanker Business in Houston ................................................................................ 4
CHAPTER 3: STATISTICAL ANALYSIS ................................................................................... 8
Background to the Statistics........................................................................................................ 8
Statistics ...................................................................................................................................... 9
Environmental Issues ................................................................................................................ 17
Safety Effects ............................................................................................................................ 20
Data Issues ................................................................................................................................ 21
CHAPTER 4: CURRENT AND PAST INITIATIVES................................................................ 23
Marine Activity Planning System (MAPS Application) .......................................................... 23
New/Expanded Anchorages ...................................................................................................... 24
Greater Houston Port Bureau (GHPB) Layby Berth Awareness Initiative .............................. 28
CHAPTER 5: POTENTIAL ACTIONS FOR CONSIDERATION ............................................. 30
Background ............................................................................................................................... 30
Improve Existing Data Collection Activities ............................................................................ 30
Expand Data Collection and Analytical Scope ......................................................................... 31
Tendering Process ..................................................................................................................... 32
Harbormaster............................................................................................................................. 32
Lightering .................................................................................................................................. 33
Inspection Facility ..................................................................................................................... 34
Nordic Tankers’ Tank-Cleaning Initiative ................................................................................ 34
GHPB Layby Berth Awareness Initiative ................................................................................. 35
Scheduling System .................................................................................................................... 35
Organizational Structure and Approach.................................................................................... 39
iv
CHAPTER 6: CONCLUDING REMARKS ................................................................................ 45
APPENDIX A: MAP OF HOUSTON SHIP CHANNEL ............................................................ 46
APPENDIX B: CORPUS CHRISTI HARBORMASTER OPERATING PROCEDURES ........ 50
Ships .......................................................................................................................................... 50
Shifts ......................................................................................................................................... 51
Sailings ...................................................................................................................................... 51
REFERENCES ............................................................................................................................. 52
v
LIST OF TABLES
Table 1. Chemical Tanker Transits versus Total Transits, 2010-2014. ......................................... 9 Table 2. Qualified Transits to Anchorage or Layberth, 2010-2014. .............................................. 9 Table 3. Average Number of Berthings for Port Calls with Qualified Transits, 2010-2014. ...... 11
Table 4. Effect of Qualified Transits on Time and Fees. ............................................................. 14 Table 5. Effect of Qualified Transits on Vessel Operating Costs. ............................................... 14 Table 6. Direct Cost of Qualified Moves, Average for 2010-2014. ............................................ 15 Table 7. Statistics for Barbours Cut Lash Dock Usage, 2010-2014. ........................................... 15 Table 8. Layberth Visits, 2010-2014. .......................................................................................... 16
Table 9. Additional Emissions Caused by Qualified Transits to Offshore Anchorage. .............. 18 Table 10. Additional Emissions Caused by Qualified Transits to Bolivar Roads. ...................... 19 Table 11. Additional Emissions Caused by Qualified Transits to Layberths. ............................. 19
Table 12. Annual Cost to Society of Additional Emissions Generated by Qualified Transits. ... 20 Table 13. Chemical Tanker Transits with Incorrect Ship Type Codes, 2010-2014. ................... 22 Table 14. Anchorage Study Initiatives......................................................................................... 26
Table 15. Composition of Security Zone Directors. .................................................................... 43
LIST OF FIGURES
Figure 1. Average Monthly Qualified Transits, 2010-2014. ....................................................... 10 Figure 2. Average Monthly Voyages with Qualified Transits, 2010-2014. ................................ 11 Figure 3. Effect of Shift to Offshore Anchorage on Total Transit Time. .................................... 12
Figure 4. Effect of Shift to Bolivar Roads on Total Transit Time. .............................................. 13
Figure 5. Proposed Mid-Bay Anchorage. .................................................................................... 24 Figure 6. Location of Anchorage Initiatives 1 through 8............................................................. 27 Figure 7. Location of Anchorage Initiative 9............................................................................... 28
Figure 8. Barge Operator—Terminal Operator Communication Diagram. ................................. 38 Figure 9. Houston Ship Channel—West (Upper) End. ................................................................ 46
Figure 10. Houston Ship Channel—Middle. ............................................................................... 47 Figure 11. Houston Ship Channel—East (Lower) End. .............................................................. 48 Figure 12. Houston Ship Channel—West Galveston Bay. .......................................................... 49
vi
DISCLAIMER
The contents of this report reflect the views of the authors, who are responsible for the facts and
the accuracy of the information presented herein. Mention of trade names or commercial
products does not constitute endorsement or recommendation for use.
ACKNOWLEDGMENTS
The authors recognize the support for this research was provided by the State of Texas.
vii
EXECUTIVE SUMMARY
This research was undertaken with the objective of developing a factual foundation for
discussion of the chemical tanker scheduling situation in the Port of Houston and potential
measures that could be adopted. A detailed literature search, a number of stakeholder interviews,
and contacts with other ports led to the determination that Houston presents a unique challenge
that is not mirrored anywhere else in the world. The channel is 52.5 miles long (longer than the
Panama Canal) from the sea buoy (where the local pilots board) to the Turning Basin. The
terminals are located along a 25-mile segment of the channel that begins with Galveston Bay and
goes westward toward the city of Houston. This part of the ship channel is shown on a series of
four maps in Appendix A. Once a vessel is inside Galveston Island, there is literally no place for
a vessel to pull over or berth for a short time to accommodate scheduling difficulties. Once a
vessel begins moving, it must go to a terminal, the Bolivar Roads anchorage area, or an offshore
anchorage.1 This situation results in a large number of “non-productive” moves that chemical
tankers must make in order to “get out of the way” and adapt to changing conditions.
The research team used the concept of “qualified transits” to analyze the situation. These transits
are defined as a transit on the Houston Ship Channel to a layberth,2 the Bolivar Roads anchorage
area, or an offshore anchorage area that is followed by a transit to a chemical-handling terminal.
Using information from a HarborLights database extract and PortVision’s online vessel tracking
system, the researchers developed a series of statistics to describe the extent of the problems.
There are almost 1,400 qualified transits made each year. These additional moves generate
additional costs for shippers and vessel operators, additional air emissions, and a higher potential
for an incident to occur.
Several initiatives either have been tried or are presently active to address the scheduling
problem. They include:
The Marine Activity Planning System (MAPS, which was discontinued about one decade
ago).
New/expanded anchorages development (some improvements have been accomplished).
Greater Houston Port Bureau Layby Berth Awareness Initiative (actively under
development).
However, none of these addresses the overall question of how to more effectively manage the
scheduling of chemical tankers in Houston. The research team identified what appears to be a
relevant scheduling research problem being addressed by Dutch researchers. More research is
needed into the best approach for handling the constantly changing conditions along the ship
channel, but preliminary indications are that there are tools that can address this issue. In order
1 The Bolivar Roads anchorage area is an area in the vicinity of where the ship channel passes between Galveston
Island and the Bolivar Peninsula. The offshore anchorages are several miles farther out to sea. 2 A layberth is a facility where a vessel can “park” for a short time without conducting any cargo transfers.

viii
for any such system to work there must be a central coordinating and controlling office to
manage the system. The interviewees presented a very wide range of opinions on the concept of
creating a harbormaster office. Since some of the interviewees indicated that they and some of
their peers were very opposed to this concept, the research team explored the concept of using
the Texas municipal management district structure for such an organization. Such a structure
appears to address many of the concerns that have been expressed about the structure and
operation of a centralized coordinating agency.
More research will be required to actually develop an effective and efficient scheduling
mechanism. The technical underpinnings of the Dutch research effort and the tools used to
address disruptions and a constantly changing scheduling environment need to be more
thoroughly investigated.
1
CHAPTER 1: THE OBJECTIVE OF THIS REPORT
Going back at least 20 years, businesses involved in the shipment of chemicals to and from
terminals on the Houston Ship Channel have been concerned about the number of transits that
take place due to inefficient in-port terminal rotations. The most comprehensive analysis of
chemical tankers in the Port of Houston that the researchers were able to acquire was
“Innovation in Chemicals Shipping, Port and Slops Management—Solving Not Shifting,”
published by Delft University in 1994 (1). One chapter of the report focused on the management
of chemical tanker traffic in the Port of Houston. The main objective of that study was to
successfully implement a tool that would help shipping companies limit the time vessels spend in
the port. Unfortunately, the objective was not achieved, but there is much good information in
the report. That report did not take into consideration the viewpoints of parties other than vessel
owners/operators in its analysis.
The primary concern addressed by this Texas A&M Transportation Institute (TTI) study is the
number of transits on the Houston Ship Channel undertaken by a given vessel during a port call
to Houston. Ideally, a chemical vessel would simply move from terminal to terminal as it
conducts its business and then leave port. However, this rarely, if ever, happens. The reasons
for this are discussed in subsequent chapters. The point to note is that unnecessary transits
increase the cost of doing business, increase the likelihood of a collision or allision, generate
additional emissions, and reduce the operating capacity of terminals on the channel.
Much of the problem in Houston is caused by the manner in which development has taken place
on the ship channel. The channel is 52.5 miles long—longer than the Panama Canal—from the
sea buoy (where the local pilots board) to the Turning Basin (2, 3). The terminals are located
along a 25-mile segment of the channel that begins with Galveston Bay and goes westward
toward the city of Houston (4). This part of the ship channel is shown on a series of four maps in
Appendix A. Once a vessel is inside Galveston Island, there is literally no place for a vessel to
pull over or berth for a short period to accommodate scheduling difficulties. Once a vessel begins
moving, it must go to a terminal, the Bolivar Roads anchorage area, or an offshore anchorage.3
One of the parties interviewed for this project likened the situation to having a farm-to-market
road when what is needed is a four- or six-lane freeway.
To date, the stakeholders in the chemical industry in Houston have enjoyed a high degree of
autonomy. In an environment as complex as the Port of Houston, this autonomy produces
conflicts and less-than-optimal outcomes for almost all stakeholders. While it is true that an
autonomous party may be able to take advantage of a specific opportunity that a non-autonomous
party does not have, at the same time all parties are affected by decisions and actions of other
3 The Bolivar Roads anchorage area is an area in the vicinity of where the ship channel passes between Galveston
Island and the Bolivar Peninsula. The offshore anchorages are several miles farther out to sea.
2
parties, and this will eventually create a very inefficient system—a condition that many of the
stakeholders interviewed for this study believe has been reached.
Apart from the logistical and economic concerns that arise from being part of an inefficient
system, the possibility looms that agencies such as the U.S. Coast Guard (Coast Guard) and the
Environmental Protection Agency (EPA) may at some point feel a responsibility to step in and
impose their understanding of “order” on the system. EPA will focus on a cleaner airshed; the
Coast Guard will focus on a safer port environment. Neither approach will necessarily produce
an efficient system.
As mentioned earlier, the Port of Houston’s layout has inherent problems. The sheer size of the
port complex makes the problems extremely complex, and these problems have ramifications for
global markets. Houston's port complex is larger than some countries (such as Singapore).
Antwerp was mentioned as a candidate for comparison—its entire port complex would fit in the
area between Galveston and Texas City. Furthermore, the other large ports in North America
tend to focus on other commodities that have very different requirements. For example, the New
Orleans to Baton Rouge stretch of the Mississippi River tends to focus on agricultural products;
the port complexes at Los Angeles/Long Beach, Savannah, and New York/New Jersey tend to
focus on containerized cargo.
Rotterdam, Amsterdam, and Antwerp were all considered as possible points of comparison for
this study. However, there are significant differences between Houston and these ports. The
form of governance and the geographical layout of the ports are so different that the researchers
could not find a valid point of comparison. Many of the individuals interviewed for this study
commented that the number of terminals, the volume of traffic overall, and the geographical
layout of the Port of Houston make Houston a unique situation that does not have a true
counterpart anywhere in the world.
Houston is primarily an export port. Controlling costs is of paramount importance to most
stakeholders because they need to offer very competitive export prices. Margins and timelines
are occasionally very tight, and companies need to ensure infrastructure and logistics costs
remain under control if they are to recoup an adequate return on their investment.
Given the rapid rate of expansion in the chemical and petrochemical industries in Houston, the
current situation can be expected to deteriorate rather quickly. Bostco opened a new liquid
terminal facility in 2014. Chevron Phillips Chemical, LyondellBasell, and ExxonMobil
Chemical are spending billions of dollars on plant expansions (ExxonMobil Chemical is already
the largest integrated refining complex in the country). Additionally, Dow Chemical is spending
billions more in Freeport (5, 6).
It is important for all stakeholders at the Port of Houston to keep the use of the ship channel as
efficient and safe as possible. This includes eliminating unnecessary transits, such as those
3
caused by a scheduling conflict. These conflicts generate transits to layberths,4 the Bolivar
Roads anchorage area, or offshore anchorages where vessels can wait until the scheduling
conflict is resolved. Not all transits by a chemical tanker to a layberth or anchorage can be
eliminated. However, as the statistics included in this report will show, even a small percentage
reduction could yield significant benefits. Chapter 2 provides an overview of how chemical
tanker transits are managed and the most significant problems encountered in the Port of
Houston. Chapter 3 of this report provides a statistical overview of chemical tanker traffic on the
Houston Ship Channel for 2010-2014. This discussion includes some suggestions for improving
the collection of data that will make future analyses more meaningful and timely. Chapter 4
discusses efforts that have taken place or are currently under way to address some of the issues.
Chapter 5 presents some measures for targeting the “low-hanging fruit” (measures with a high
benefit-cost ratio), as well as a possible approach to improve the scheduling of chemical tankers.
The chapter also provides some suggestions for organizational approaches to the problems under
consideration. Chapter 6 provides some conclusions, potential future research, and project
initiatives for consideration by interested parties.
The focus of this report is on the number of transits made by chemical tankers. The causes and
effects of these transits involve the terminals that receive these vessels as well. By improving
the management of chemical tanker traffic, additional capacity will be freed up on the channel
and at the terminals and, hopefully, more operational efficiencies will result for all parties. Thus,
while the discussion focuses on the vessels themselves, there are many stakeholders whose
activities intertwine with the day-to-day handling of these vessels. This interaction should be
kept in mind while reading this report.
This report is written so that an individual unfamiliar with chemical tanker traffic in general or
the management of that traffic in Houston in particular will be able to grasp the issues and the
potential measures to address them. At the same time, there is enough detail for those who are
familiar with the system to effectively evaluate current conditions and potential responses.
4 A layberth is a facility where a vessel can “park” for a short period without conducting any cargo transfers.

4
CHAPTER 2: MANAGING CHEMICAL TANKER TRANSITS IN HOUSTON
Background
In order to gain an understanding of the operating procedures and issues typically encountered at
the Port of Houston, TTI interviewed 14 individuals with first-hand knowledge of such
procedures and issues. These included:5
Houston Pilots.
Port of Houston Authority personnel.
Shippers/charterers.
Surveyor.
Terminal operators.
U.S. Coast Guard Vessel Traffic Service personnel.
Vessel owners/operators and agents.
These individuals provided much valuable information and insight during these interviews.
These interviews, along with a few key studies/reports, provide the foundation for the remainder
of this chapter and subsequent analysis.
The Chemical Tanker Business in Houston
The contract that governs the hire of a vessel and the charges related to its usage is referred to as
a charter party. Each charter party has certain elements in it that distinguish it from others;
however, charter parties for the vessels that call at Houston tend to have standardized “Houston
clauses.” These clauses dictate how to charge demurrage,6 how to handle the notices of
readiness (NOR) issued by the vessel to the terminals and cargo interests, how to prioritize
vessels, and other details. This tends to cause all public terminals to behave in a similar manner.
This report will not attempt to get into the nuances of charter party agreements, except as they
relate to the ability to address the chemical tanker transit issues.
Chemical tankers have certain unique characteristics that distinguish them from other vessel
types.
Many different product types are shipped on these vessels. Such products include
vegetable oils, lube oils, molasses, caustic soda, BTX, styrene, and many specialty
chemicals.
Products have a high unit value and can be very sensitive to cargo contamination.
5 Specific names and positions are not listed because of a request for confidentiality by some of the interviewees.
6 In simple terms, demurrage refers to charges that are due to the vessel owner/operator for the time the charterer
(entity paying for the vessel’s hire) remains in possession of the vessel after the period allowed to load and unload
cargo (referred to as laytime).
5
Parcel sizes are relatively small, ranging from 300 metric tons to 6,000 tons, with some
industrial chemicals such as caustic soda and MTBE shipping in parcels of up to
40,000 metric tons.
Small parcels are traded interregionally and the freight cost can be very high on a unit
basis.
Some chemicals require special handling and tank characteristics.
Chemicals are subject to International Maritime Organization (IMO)7 regulations on the
transport of hazardous materials.
The construction of the cargo tanks is regulated under 46 CFR 32.
Chemical tankers operating in liner services can have 30 to 55 segregated tanks. The cargoes in
these tanks can be designated to a number of different shippers (charterers).
When chemical tankers arrive at the port, they often have to wait because a terminal is occupied.
However, before proceeding to the first terminal call, they must wait until all necessary
inspections of the cargo and tanks have taken place for that first call. After completion of cargo
and tank inspections for all cargoes to be handled at the designated terminal, they are ready to
enter the port. Once the Coast Guard has cleared the vessel and is ready to enter the port, the
vessel will tender a NOR to all terminals to which it could proceed, given its needs at the Port of
Houston. When a terminal verifies that it is ready to receive the vessel, the vessel will arrange
for a harbor pilot to board the ship and guide it to a berth at the receiving terminal. The vessel is
required to give the pilots a 4-hour notice. They are allowed to make changes up to 2 hours prior
to the scheduled boarding time for vessels that are berthed at a terminal in port, but not for
vessels at anchorage. Harbor pilots also move the vessel to the next terminal or back out to sea.
At the terminal, customs and immigration will board the ship, inspect its documents, and clear it
for cargo transfer. Before cargo transfers take place, a cargo surveyor representing the receiver
or shipper of the cargo will inspect the cargo and/or the tanks on the vessel to be sure everything
is within specifications. All tanks requiring inspection must be approved before any loading
takes place. These inspections may take place while the vessel is at anchorage or at the berth.8
The shipper/charterer usually pays the expense.
After the cargo transfer takes place, the vessel notifies the appropriate next terminal(s) that it is
ready to proceed to the facility. If no appropriate terminal is available for cargo transfer, the
vessel must move to a layberth, go to the Bolivar Roads anchorage area, or move to an offshore
7 The International Maritime Organization is a specialized agency of the United Nations that is responsible for
measures to improve the safety and security of international shipping and to prevent pollution from ships. It is also
involved in legal matters, including liability and compensation issues and the facilitation of international maritime
traffic. It was established by means of a Convention adopted under the auspices of the United Nations in Geneva on
March 17, 1948, and met for the first time in January 1959. 8 An inspection of the tank is referred to as “inspection.” A check of the cargo is referred to as “sampling.” When
these activities take place prior to arrival at the dock where the cargo transfer will occur, they are referred to as “pre-
inspection” and “pre-sampling.”
6
anchorage location. Such transits can be caused by a number of factors such as the unavailability
of the terminal, cargo not being ready for shipment, railcars not being spotted on time, and draft
restrictions, to name a few. A vessel may even have to make two stops at the same terminal—for
example, the right tank may not yet be available for cargo to be loaded or the water depth may
not be sufficient until other cargoes have been discharged. Additional transits can depend on the
necessity to bunker, repair, and take on supplies and spare parts, and the ability or inability to do
so at a given berth. Finally, a vessel may acquire new cargoes during the port call and change its
rotation plan entirely. To make matters more complicated, a vessel may have to call at a
particular terminal first (if coming in heavily loaded) or last (if leaving loaded) because of draft
restrictions. In the aforementioned study by Delft University, it was determined that the biggest
single reason for delays incurred by chemical tankers in Houston was waiting for an occupied
berth to become available (40 percent of time lost).
Utilizing a layberth involves additional costs: pilotage fees, linehandler fees at the layberth, tug
fees, and dockage fees (layberth fees) at the berth, as well as the actual vessel operating costs.
When it is necessary to move to an anchorage, the vessel incurs extra pilotage fees and additional
vessel operating costs, and a significant amount of lost time results (more than 4 hours each
direction). These costs are explained in detail in the next chapter.
There are times when it is necessary for a chemical tanker to move offshore to conduct tank-
cleaning operations, which are in simplest terms a method of flushing the tank with seawater.
They are allowed to perform these operations (which result in some discharge at sea) if they meet
the following conditions (a few others may apply for certain cargoes):
The ship must be more than 12 miles off the nearest coast.
The water depth must be at least 25 meters (82 ft).
For certain products, the ratio of chemical to water must be less than an established limit.
The ship must be moving at a speed of no less than 7 knots.
The discharge must be made below the water line.
These tank-cleaning transits are transits that cannot be eliminated.
Demurrage is an important consideration in managing tanker schedules. Demurrage deals with
the general principle that if one charters (hires) a ship to move cargo from A to B at a set price,
then one should pay the ship compensation if it is delayed while loading or discharging the cargo
to be moved (7).
When the ship arrives at a port, it tenders a NOR to the charterer, stating that it is ready to
load/discharge. After a period of time (normally 6 hours) of giving notification, it is considered
reasonable for the charterers to have been able to start loading or unloading, so laytime starts to
run. Laytime is a period of time set out in the charter party that gives the charterer an allowance
for time to load or discharge. Once the charterers have used up their laytime allowance, time
7
switches to demurrage. Demurrage is a rate of compensation per day (or pro rata per hour) that
the charterer must pay to the ship owner for holding up the ship for longer than agreed. In
Houston, it tends to run about $1,000 per hour.
The laytime clock begins running at the time the NOR is issued. A vessel may have four cargoes
to load or unload. If even one is not ready, the vessel will not come in, but all four cargo
interests will have to pay demurrage, even if they are not the one causing the delay.
When it comes to how terminals schedule vessel berthings, the Houston charter party clauses
require them to accept vessels on a first-come, first-serve basis. A vessel that tenders a valid
notice of readiness first will receive priority.
For some of the berths, it is difficult for an observer to determine if a dock is available.
Oceangoing vessels are required to broadcast their location via the Automated Identification
System (AIS).9 River barges do not have AIS equipment. Therefore, while a vessel may not be
at the dock, there may be barge activity there that would prevent a vessel from docking. This
prohibits any automated system from being able to track activity autonomously for the purposes
of scheduling.
Terminals must often prepare lines and other equipment (e.g., rail cars) prior to a vessel’s arrival.
It is not uncommon for preparations to take 12 hours. Communication between the vessel and
the terminal becomes critical for managing the process. According to the interviewees, a
terminal operates at full capacity if it is occupied 65 percent to 75 percent of the time. An
average vessel servicing time is 24 to 26 hours at the dock (the preparations usually take place
prior to berthing the vessel).
9 AIS units are transceivers that, at a minimum, broadcast a vessel’s name, number, location, course, and speed over
ground. These transmissions can occur at intervals of 30 seconds up to several minutes. These devices can also
exchange information with other vessels. Several businesses store these data and perform value-added services.
8
CHAPTER 3: STATISTICAL ANALYSIS
Background to the Statistics
In this analysis, the term “qualified transit” is used. These transits are defined as a transit on the
Houston Ship Channel to a layberth, the Bolivar Roads anchorage area, or an offshore anchorage
area that is followed by a transit to a chemical-handling terminal.
In order to conduct this statistical analysis, TTI obtained an extract of the HarborLights database
from the Greater Houston Port Bureau. This database is a listing of all vessel transits piloted by
Houston Pilots. The database did not provide any information as to what a vessel was doing
once a pilot took it offshore. It might do any of the following:
Sit at anchorage until a desired terminal is available, then return to port.
Conduct a tank-cleaning operation.
Proceed to another port.
In order to determine what the vessel actually did, TTI subscribed to PortVision’s online AIS
system, which provides information on vessel movements almost anywhere in the world. Putting
the HarborLights database together with the PortVision vessel movement information provided a
fairly complete picture of each port call to Houston.
As part of the analytical process, port calls that involved one or more qualified transits were
identified. A port call was defined as beginning when a Houston pilot first boarded the vessel
and ending when the vessel was ready to be boarded by a pilot from another entity or left the port
area entirely. This means that vessel movements to Texas City, Galveston, and Freeport marked
the end of a designated port call. A number of vessels actually move between these port
complexes, so a vessel might have generated more than one port call in this analysis without
actually leaving the upper Texas coast. This artificial cut-off was established because (a) the
project time frame and budget did not allow for a complete analysis of multiple port areas, and
(b) the difficulty in acquiring the data from three pilot organizations and consolidating them into
a meaningful whole was prohibitive given the timeframe. Interestingly, in a high percentage of
cases, the artificially created “second” port call when the vessel returned from Freeport or Texas
City did not generate any additional qualified transits. While recognizing that issues in vessel
scheduling in one port area could affect the rotation in another port area, it is still quite feasible
to focus on the management of issues along the Houston Ship Channel as a meaningful first step
in addressing the efficiency of vessel transits in Houston.
Also, it must be recognized that this analysis does not address the overall efficiency of vessel
management in Houston, just the issues that might affect the number of transits. For example,
vessels might be waiting at anchorage for an extended period of time before they enter the port
area for a number of reasons. This study did not attempt to evaluate such concerns.
9
Statistics
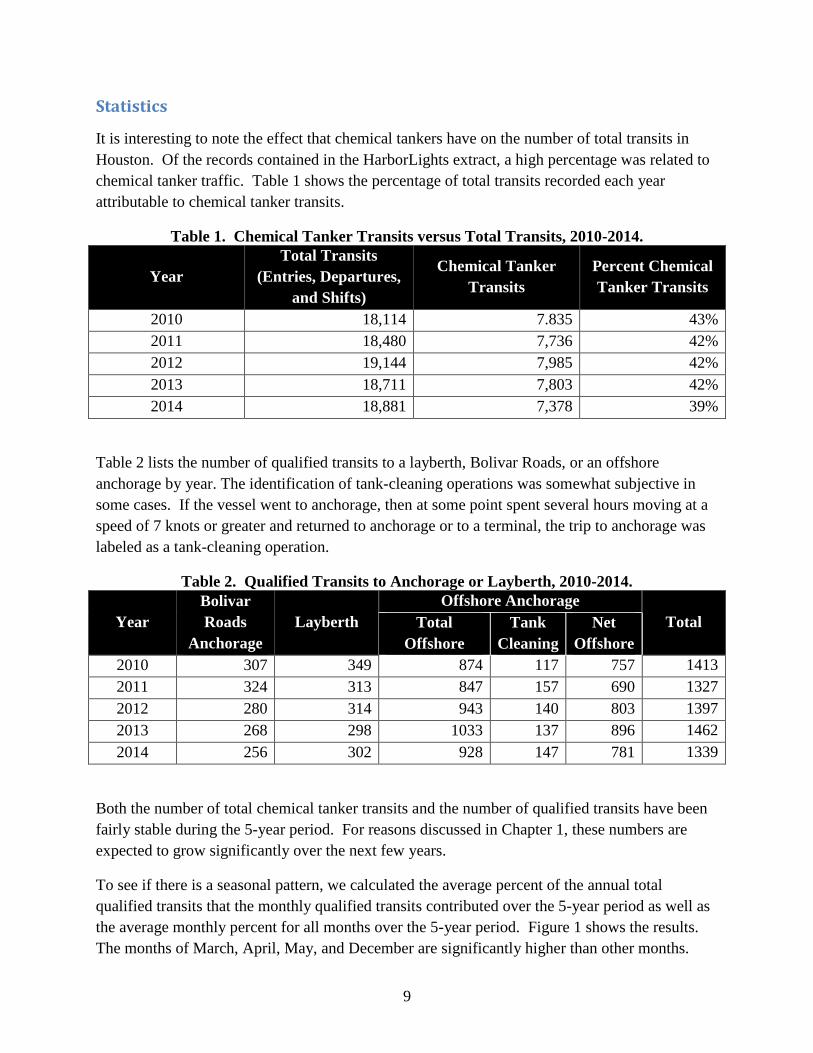
It is interesting to note the effect that chemical tankers have on the number of total transits in
Houston. Of the records contained in the HarborLights extract, a high percentage was related to
chemical tanker traffic. Table 1 shows the percentage of total transits recorded each year
attributable to chemical tanker transits.
Table 1. Chemical Tanker Transits versus Total Transits, 2010-2014.
Year
Total Transits
(Entries, Departures,
and Shifts)
Chemical Tanker
Transits
Percent Chemical
Tanker Transits
2010 18,114 7.835 43%
2011 18,480 7,736 42%
2012 19,144 7,985 42%
2013 18,711 7,803 42%
2014 18,881 7,378 39%
Table 2 lists the number of qualified transits to a layberth, Bolivar Roads, or an offshore
anchorage by year. The identification of tank-cleaning operations was somewhat subjective in
some cases. If the vessel went to anchorage, then at some point spent several hours moving at a
speed of 7 knots or greater and returned to anchorage or to a terminal, the trip to anchorage was
labeled as a tank-cleaning operation.
Table 2. Qualified Transits to Anchorage or Layberth, 2010-2014.
Year
Bolivar
Roads
Anchorage
Layberth
Offshore Anchorage
Total Total
Offshore
Tank
Cleaning
Net
Offshore
2010 307 349 874 117 757 1413
2011 324 313 847 157 690 1327
2012 280 314 943 140 803 1397
2013 268 298 1033 137 896 1462
2014 256 302 928 147 781 1339
Both the number of total chemical tanker transits and the number of qualified transits have been
fairly stable during the 5-year period. For reasons discussed in Chapter 1, these numbers are
expected to grow significantly over the next few years.
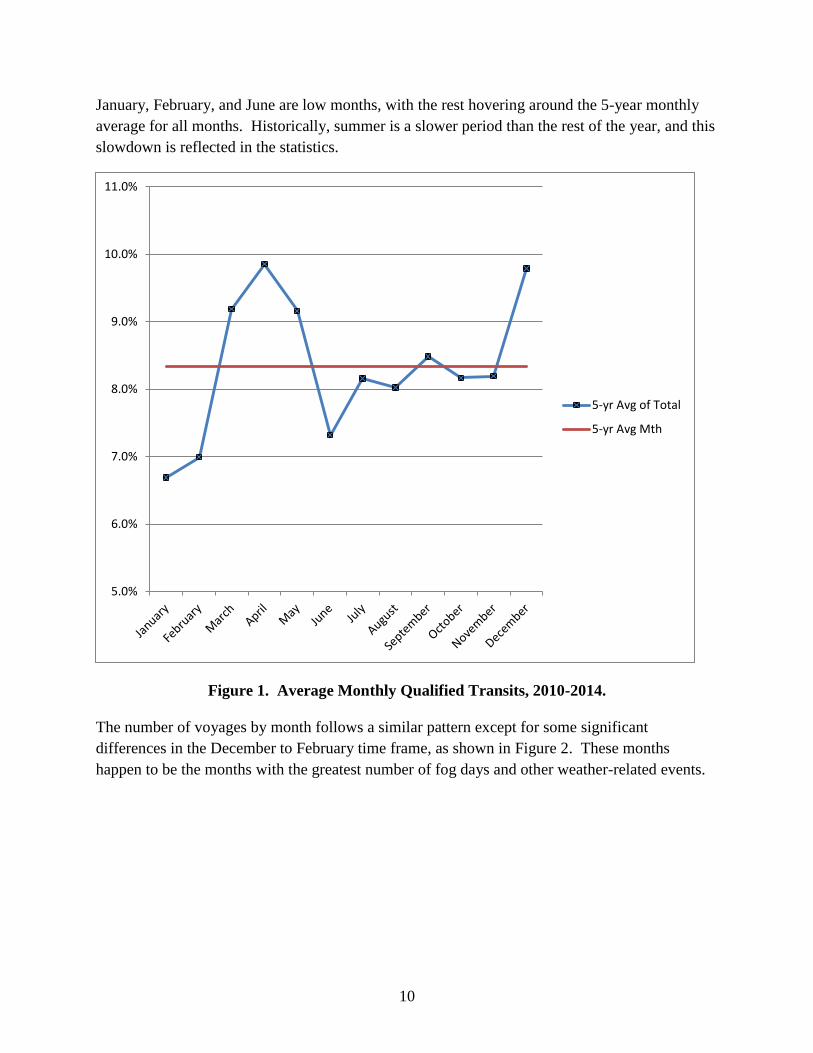
To see if there is a seasonal pattern, we calculated the average percent of the annual total
qualified transits that the monthly qualified transits contributed over the 5-year period as well as
the average monthly percent for all months over the 5-year period. Figure 1 shows the results.
The months of March, April, May, and December are significantly higher than other months.
10
January, February, and June are low months, with the rest hovering around the 5-year monthly
average for all months. Historically, summer is a slower period than the rest of the year, and this
slowdown is reflected in the statistics.
Figure 1. Average Monthly Qualified Transits, 2010-2014.
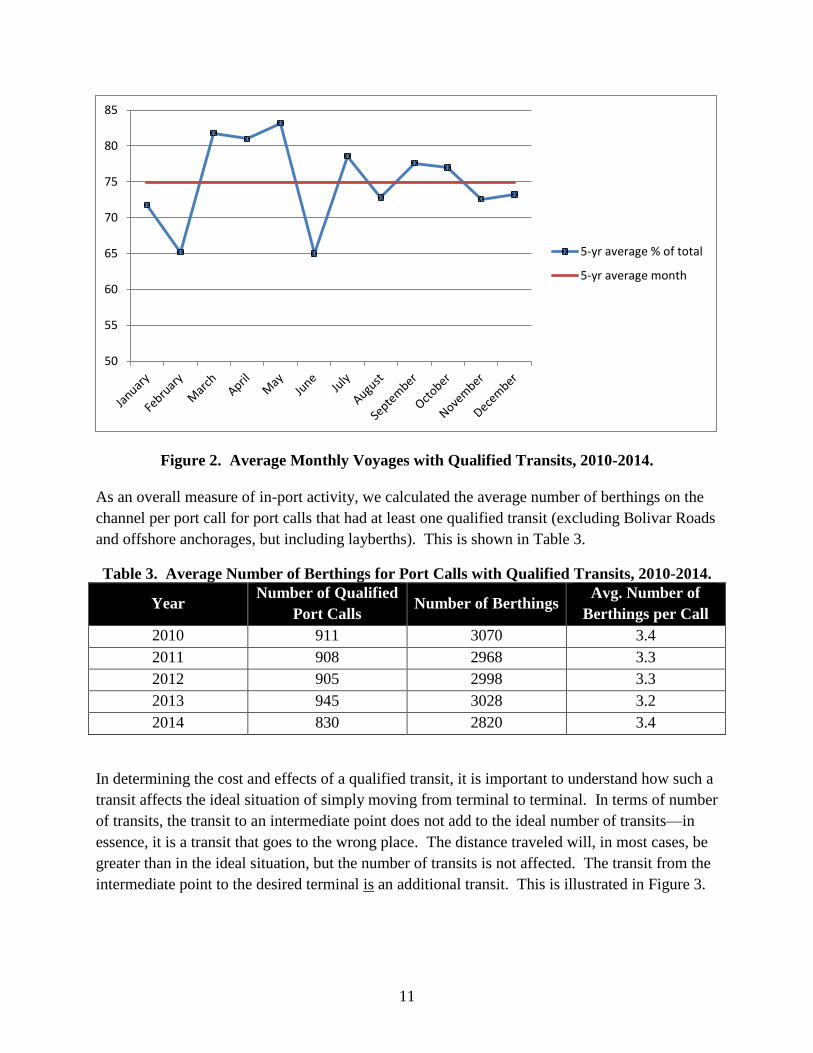
The number of voyages by month follows a similar pattern except for some significant
differences in the December to February time frame, as shown in Figure 2. These months
happen to be the months with the greatest number of fog days and other weather-related events.
5.0%
6.0%
7.0%
8.0%
9.0%
10.0%
11.0%
5-yr Avg of Total
5-yr Avg Mth
11
Figure 2. Average Monthly Voyages with Qualified Transits, 2010-2014.
As an overall measure of in-port activity, we calculated the average number of berthings on the
channel per port call for port calls that had at least one qualified transit (excluding Bolivar Roads
and offshore anchorages, but including layberths). This is shown in Table 3.
Table 3. Average Number of Berthings for Port Calls with Qualified Transits, 2010-2014.
Year Number of Qualified
Port Calls Number of Berthings
Avg. Number of
Berthings per Call
2010 911 3070 3.4
2011 908 2968 3.3
2012 905 2998 3.3
2013 945 3028 3.2
2014 830 2820 3.4
In determining the cost and effects of a qualified transit, it is important to understand how such a
transit affects the ideal situation of simply moving from terminal to terminal. In terms of number
of transits, the transit to an intermediate point does not add to the ideal number of transits—in
essence, it is a transit that goes to the wrong place. The distance traveled will, in most cases, be
greater than in the ideal situation, but the number of transits is not affected. The transit from the
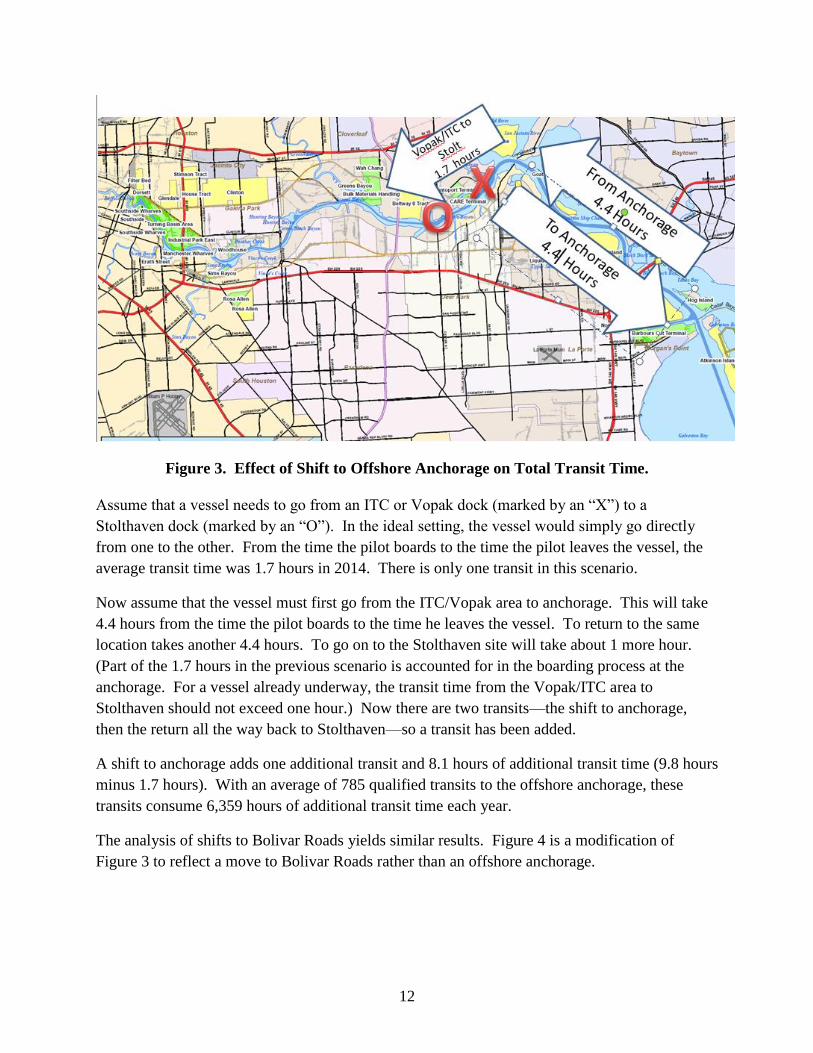
intermediate point to the desired terminal is an additional transit. This is illustrated in Figure 3.
50
55
60
65
70
75
80
85
5-yr average % of total
5-yr average month
12
Figure 3. Effect of Shift to Offshore Anchorage on Total Transit Time.
Assume that a vessel needs to go from an ITC or Vopak dock (marked by an “X”) to a
Stolthaven dock (marked by an “O”). In the ideal setting, the vessel would simply go directly
from one to the other. From the time the pilot boards to the time the pilot leaves the vessel, the
average transit time was 1.7 hours in 2014. There is only one transit in this scenario.
Now assume that the vessel must first go from the ITC/Vopak area to anchorage. This will take
4.4 hours from the time the pilot boards to the time he leaves the vessel. To return to the same
location takes another 4.4 hours. To go on to the Stolthaven site will take about 1 more hour.
(Part of the 1.7 hours in the previous scenario is accounted for in the boarding process at the
anchorage. For a vessel already underway, the transit time from the Vopak/ITC area to
Stolthaven should not exceed one hour.) Now there are two transits—the shift to anchorage,
then the return all the way back to Stolthaven—so a transit has been added.
A shift to anchorage adds one additional transit and 8.1 hours of additional transit time (9.8 hours
minus 1.7 hours). With an average of 785 qualified transits to the offshore anchorage, these
transits consume 6,359 hours of additional transit time each year.
The analysis of shifts to Bolivar Roads yields similar results. Figure 4 is a modification of
Figure 3 to reflect a move to Bolivar Roads rather than an offshore anchorage.

13
Figure 4. Effect of Shift to Bolivar Roads on Total Transit Time.
The round-trip transit time when going to Bolivar Roads is reduced by 0.6 hours compared to a
transit to an offshore anchorage. This results in an increase of 7.5 hours versus ideal conditions.
With an average of 287 qualified transits to Bolivar Roads, an additional 2,153 hours of transit
time each year occurs compared to the ideal scenario.
When shifting within the port complex (using a layberth), the difference is primarily the transit
time of an extra shift. In the example, the extra shift time was 1.7 hours; however, the data for
2011 show that the average transit time for all moves to a layberth was 3.1 hour. With an annual
average of 315 qualified transits to layberth each year, this amounts to another 977 hours each
year.
The total additional time caused by the qualified transits each year compared to the ideal
scenario is 9,489 hours.
The researchers reviewed publicly available tariffs to determine the representative cost of pilot
fees, tug fees, line handler fees, and the harbor fee. For purposes of the calculations, a vessel
with the following characteristics was used as the standard: 553 ft length overall, 92 ft beam,
35 ft draft, and 20,649 gross registered tons. For a transit to or from an offshore anchorage, the
fees are approximately $7,600. One interviewee suggested, and several others agreed, that it is
appropriate to use an estimate of $3,000 in vessel expenses to move a chemical tanker from a
dock to anchorage. However, the actual expenses may vary considerably based on the vessel
size and construction.
14
The fees for a move to Bolivar Roads are approximately $8,300; there is a surcharge for Bolivar
Roads. Given that the transit time is only slightly less than for an offshore anchorage, an
estimate of $3,000 for vessel expenses is assumed here as well.
Shifts within the port cost approximately $6,100. Given that transit times are significantly less in
this case than in the other two cases, vessel operating expenses of $1,500 are assumed.
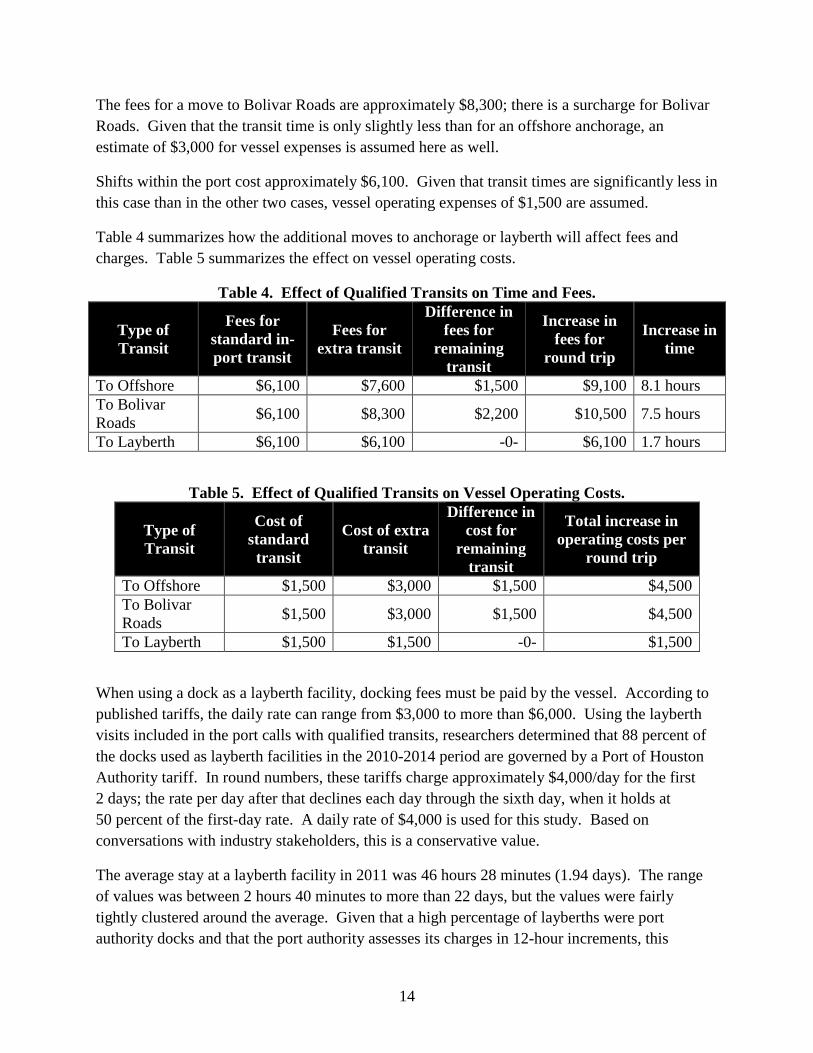
Table 4 summarizes how the additional moves to anchorage or layberth will affect fees and
charges. Table 5 summarizes the effect on vessel operating costs.
Table 4. Effect of Qualified Transits on Time and Fees.
Type of
Transit
Fees for
standard in-
port transit
Fees for
extra transit
Difference in
fees for
remaining
transit
Increase in
fees for
round trip
Increase in
time
To Offshore $6,100 $7,600 $1,500 $9,100 8.1 hours
To Bolivar
Roads $6,100 $8,300 $2,200 $10,500 7.5 hours
To Layberth $6,100 $6,100 -0- $6,100 1.7 hours
Table 5. Effect of Qualified Transits on Vessel Operating Costs.
Type of
Transit
Cost of
standard
transit
Cost of extra
transit
Difference in
cost for
remaining
transit
Total increase in
operating costs per
round trip
To Offshore $1,500 $3,000 $1,500 $4,500
To Bolivar
Roads $1,500 $3,000 $1,500 $4,500
To Layberth $1,500 $1,500 -0- $1,500
When using a dock as a layberth facility, docking fees must be paid by the vessel. According to
published tariffs, the daily rate can range from $3,000 to more than $6,000. Using the layberth
visits included in the port calls with qualified transits, researchers determined that 88 percent of
the docks used as layberth facilities in the 2010-2014 period are governed by a Port of Houston
Authority tariff. In round numbers, these tariffs charge approximately $4,000/day for the first
2 days; the rate per day after that declines each day through the sixth day, when it holds at
50 percent of the first-day rate. A daily rate of $4,000 is used for this study. Based on
conversations with industry stakeholders, this is a conservative value.
The average stay at a layberth facility in 2011 was 46 hours 28 minutes (1.94 days). The range
of values was between 2 hours 40 minutes to more than 22 days, but the values were fairly
tightly clustered around the average. Given that a high percentage of layberths were port
authority docks and that the port authority assesses its charges in 12-hour increments, this

15
analysis uses 2 days as the standard dwell time. Using the $4,000/day rate, the average dockage
fees for a layberth visit were $8,000.
Given the number of qualified transits listed in Table 2, it is possible to estimate the total effect
of such transits on vessel operating expenses at the Port of Houston. The effects are summarized
in Table 6. The table reveals that even eliminating a fraction of these moves could result in
significant cost savings. What the table does not show is the opportunity cost to the vessel owner
for the time a vessel stays in port when it could have gone elsewhere.
Table 6. Direct Cost of Qualified Moves, Average for 2010-2014.
Type of
Transit
Increase in
fees per
qualified
round trip
Increase in
operating
costs per
qualified
round trip
Dockage
fees per
visit
Average
annual
number of
qualified
transits
Total increase
in cost
To Offshore
(net of tank
cleaning)
$9,100 $4,500 -0- 785 $10,676,000
To Bolivar
Roads $10,500 $4,500 -0- 287 $4,305,000
To Layberth $6,100 $1,500 $8,000 315 $4,914,000
TOTAL $19,895,000
Because of competitive issues, it is not possible to do a similar estimate of demurrage fees
caused by the current conditions in Houston. These are expenses that are typically paid by the
charterer/shipper. Interviewees suggested that the current annual total of demurrage fees is many
multiples of the additional vessel operating costs shown in Table 6.
The only officially designated layberth on the Houston Ship Channel is the Barbours Cut Lash
Dock. The information from the HarborLights database allows for a statistical summary of how
much the dock is used by oceangoing vessels, which is shown in Table 7.
Table 7. Statistics for Barbours Cut Lash Dock Usage, 2010-2014.
Year Time Dock
Used (hr)
Time Dock Not in
Use (hr)
% of Time
Not Used
Shortest Time
in Between
Average Time
in Between
2010 2574 6186 71% 1 hr 42 min 76 hr 22 min
2011 3457 5303 61% 1 hr 40 min 62 hr 23 min
2012 4278 4506 51% 1 hr 10 min 45 hr 31 min
2013 3680 5080 58% 3 hr 40 min 57 hr 8 min
2014 2838 5923 68% 1 hr 30 min 72 hr 26 min
The data do not indicate how often this dock is used by barges. Given that the dock is occupied
by oceangoing vessels less than 50 percent of the time, it appears that there is an opportunity to
16
take greater advantage of this facility. It may be a matter of making more vessel operators aware
of this opportunity and providing a better means of scheduling; it may also be desirable to give
oceangoing vessels (especially chemical tankers) priority use of the dock. The Layby Berth
Initiative described in Chapter 4 should help address this concern.
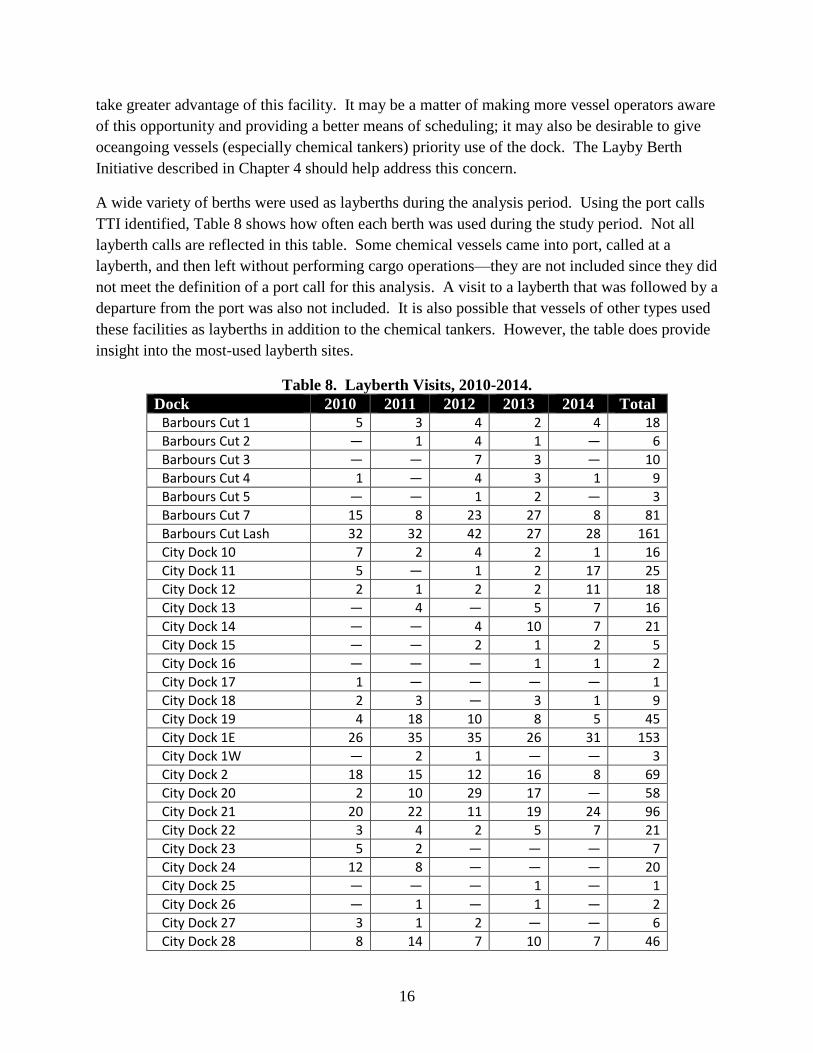
A wide variety of berths were used as layberths during the analysis period. Using the port calls
TTI identified, Table 8 shows how often each berth was used during the study period. Not all
layberth calls are reflected in this table. Some chemical vessels came into port, called at a
layberth, and then left without performing cargo operations—they are not included since they did
not meet the definition of a port call for this analysis. A visit to a layberth that was followed by a
departure from the port was also not included. It is also possible that vessels of other types used
these facilities as layberths in addition to the chemical tankers. However, the table does provide
insight into the most-used layberth sites.
Table 8. Layberth Visits, 2010-2014.
Dock 2010 2011 2012 2013 2014 Total
Barbours Cut 1 5 3 4 2 4 18
Barbours Cut 2 — 1 4 1 — 6
Barbours Cut 3 — — 7 3 — 10
Barbours Cut 4 1 — 4 3 1 9
Barbours Cut 5 — — 1 2 — 3
Barbours Cut 7 15 8 23 27 8 81
Barbours Cut Lash 32 32 42 27 28 161
City Dock 10 7 2 4 2 1 16
City Dock 11 5 — 1 2 17 25
City Dock 12 2 1 2 2 11 18
City Dock 13 — 4 — 5 7 16
City Dock 14 — — 4 10 7 21
City Dock 15 — — 2 1 2 5
City Dock 16 — — — 1 1 2
City Dock 17 1 — — — — 1
City Dock 18 2 3 — 3 1 9
City Dock 19 4 18 10 8 5 45
City Dock 1E 26 35 35 26 31 153
City Dock 1W — 2 1 — — 3
City Dock 2 18 15 12 16 8 69
City Dock 20 2 10 29 17 — 58
City Dock 21 20 22 11 19 24 96
City Dock 22 3 4 2 5 7 21
City Dock 23 5 2 — — — 7
City Dock 24 12 8 — — — 20
City Dock 25 — — — 1 — 1
City Dock 26 — 1 — 1 — 2
City Dock 27 3 1 2 — — 6
City Dock 28 8 14 7 10 7 46
17
Table 8. Layberth Visits, 2010-2014, continued.
Dock 2010 2011 2012 2013 2014 Total
City Dock 29 3 — 1 1 — 5
City Dock 3 2 5 4 1 5 17
City Dock 30 25 16 15 21 9 86
City Dock 31 3 6 5 7 — 21
City Dock 32 — 2 — 1 — 3
City Dock 4 2 1 — — — 3
City Dock 41 — — — — 2 2
City Dock 42 — — — — 14 14
City Dock 43 — — — — 23 23
City Dock 44 — — — — 1 1
City Dock 45 — — — — 15 15
City Dock 46 — — — — 1 1
City Dock 8 2 2 2 5 4 15
City Dock 9 3 3 2 3 3 14
Cruise Terminal 1 32 26 21 20 22 121
Houston Cement East 4 2 2 2 6 16
Inbesa 48 28 15 24 5 120
Jacintoport 2 1 — — 1 — 2
Jacintoport 3 7 7 1 1 2 18
Jacintoport 4 16 3 1 — 2 22
Jacintoport 5 8 3 1 — 1 13
Manchester A — — — 2 — 2
Manchester B — 2 — — 1 3
Vulcan — 10 26 6 11 53
Woodhouse 1 15 8 7 8 5 43
Woodhouse 2 7 3 1 1 — 12
Woodhouse 4 — — 3 — — 3
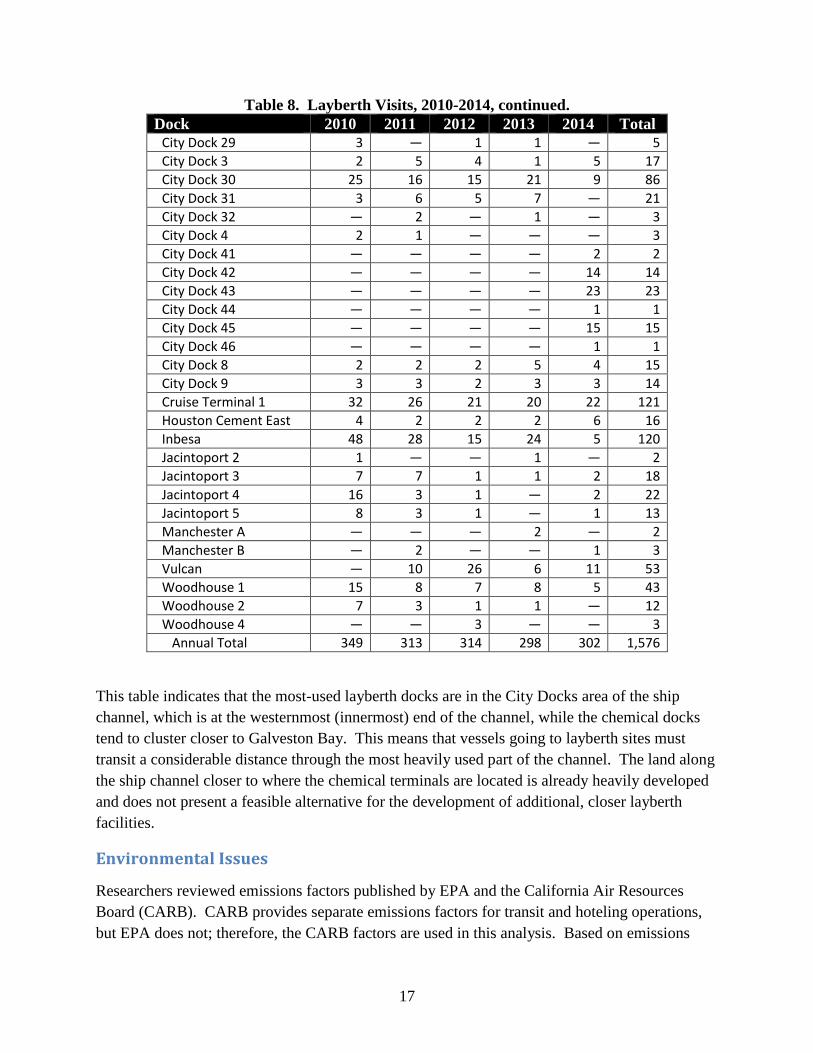
Annual Total 349 313 314 298 302 1,576
This table indicates that the most-used layberth docks are in the City Docks area of the ship
channel, which is at the westernmost (innermost) end of the channel, while the chemical docks
tend to cluster closer to Galveston Bay. This means that vessels going to layberth sites must
transit a considerable distance through the most heavily used part of the channel. The land along
the ship channel closer to where the chemical terminals are located is already heavily developed
and does not present a feasible alternative for the development of additional, closer layberth
facilities.
Environmental Issues
Researchers reviewed emissions factors published by EPA and the California Air Resources
Board (CARB). CARB provides separate emissions factors for transit and hoteling operations,
but EPA does not; therefore, the CARB factors are used in this analysis. Based on emissions
18
factors published by CARB (8), the researchers calculated emissions for transits and hoteling
time at layberth and the anchorages. The average time at rest for each type of visit and for
transits is calculated using the trips that included qualified transits. Given the implementation of
the North American Emission Control Area, vessels are required to use fuel containing no more
than 0.1 percent sulfur when operating within 200 nautical miles from the coast of the United
States or Canada. The appropriate factors were used to reflect this requirement.
The standard vessel used for these calculations is a vessel with a Category 3 slow-speed engine
with an average size of 8500 KW operating in transit mode using marine distillate with
0.1 percent sulfur. Auxiliary engines are assumed to be 1100 KW.
The calculation of air emissions from qualified transits was split into three parts—transits to
offshore anchorages, transits to Bolivar Roads, and transits to a layberth. For each part, the
average additional transit time and hoteling time was computed.
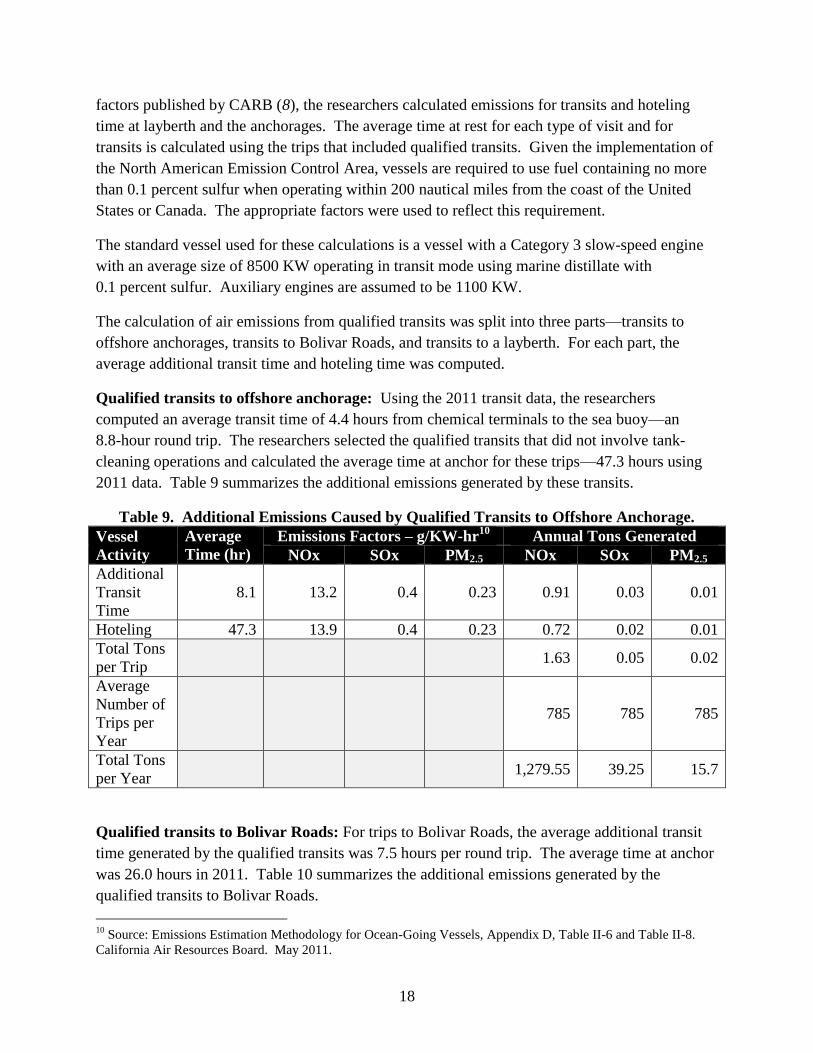
Qualified transits to offshore anchorage: Using the 2011 transit data, the researchers
computed an average transit time of 4.4 hours from chemical terminals to the sea buoy—an
8.8-hour round trip. The researchers selected the qualified transits that did not involve tank-
cleaning operations and calculated the average time at anchor for these trips—47.3 hours using
2011 data. Table 9 summarizes the additional emissions generated by these transits.
Table 9. Additional Emissions Caused by Qualified Transits to Offshore Anchorage.
Vessel
Activity
Average
Time (hr)
Emissions Factors – g/KW-hr10
Annual Tons Generated
NOx SOx PM2.5 NOx SOx PM2.5
Additional
Transit
Time
8.1 13.2 0.4 0.23 0.91 0.03 0.01
Hoteling 47.3 13.9 0.4 0.23 0.72 0.02 0.01
Total Tons
per Trip 1.63 0.05 0.02
Average
Number of
Trips per
Year
785 785 785
Total Tons
per Year 1,279.55 39.25 15.7
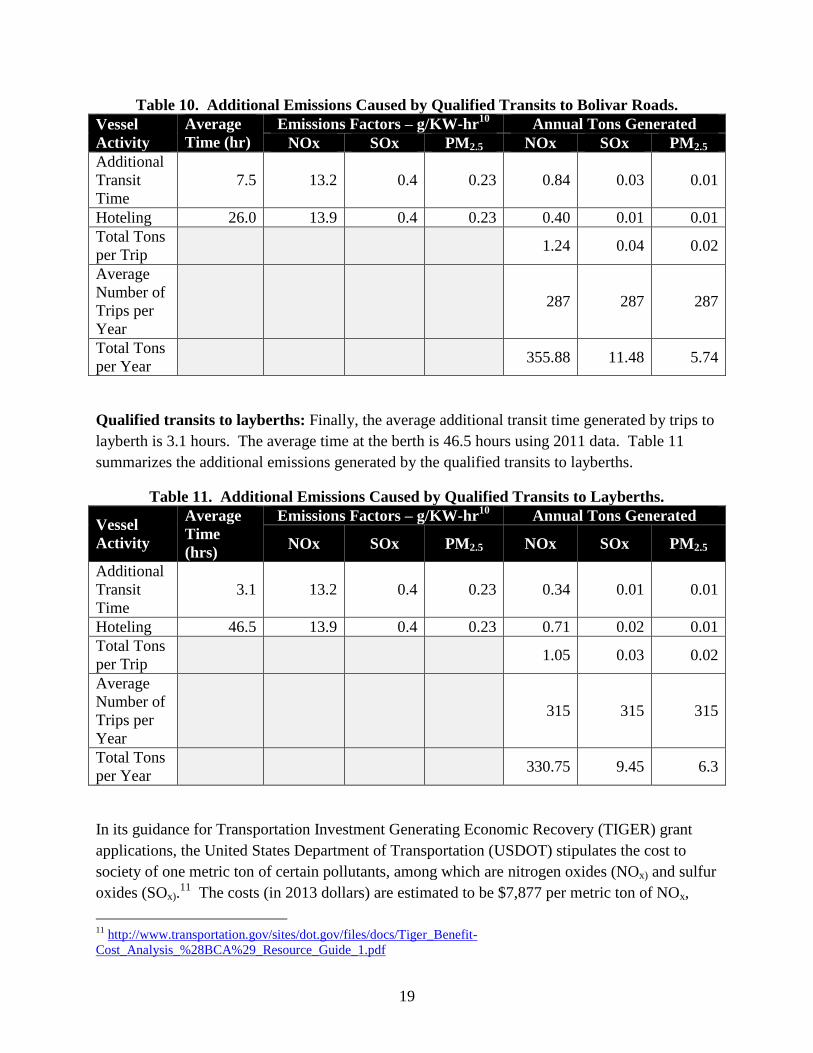
Qualified transits to Bolivar Roads: For trips to Bolivar Roads, the average additional transit
time generated by the qualified transits was 7.5 hours per round trip. The average time at anchor
was 26.0 hours in 2011. Table 10 summarizes the additional emissions generated by the
qualified transits to Bolivar Roads.
10
Source: Emissions Estimation Methodology for Ocean-Going Vessels, Appendix D, Table II-6 and Table II-8.
California Air Resources Board. May 2011.
19
Table 10. Additional Emissions Caused by Qualified Transits to Bolivar Roads.
Vessel
Activity
Average
Time (hr)
Emissions Factors – g/KW-hr10
Annual Tons Generated
NOx SOx PM2.5 NOx SOx PM2.5
Additional
Transit
Time
7.5 13.2 0.4 0.23 0.84 0.03 0.01
Hoteling 26.0 13.9 0.4 0.23 0.40 0.01 0.01
Total Tons
per Trip 1.24 0.04 0.02
Average
Number of
Trips per
Year
287 287 287
Total Tons
per Year 355.88 11.48 5.74
Qualified transits to layberths: Finally, the average additional transit time generated by trips to
layberth is 3.1 hours. The average time at the berth is 46.5 hours using 2011 data. Table 11
summarizes the additional emissions generated by the qualified transits to layberths.
Table 11. Additional Emissions Caused by Qualified Transits to Layberths.
Vessel
Activity
Average
Time
(hrs)
Emissions Factors – g/KW-hr10
Annual Tons Generated
NOx SOx PM2.5 NOx SOx PM2.5
Additional
Transit
Time
3.1 13.2 0.4 0.23 0.34 0.01 0.01
Hoteling 46.5 13.9 0.4 0.23 0.71 0.02 0.01
Total Tons
per Trip 1.05 0.03 0.02
Average
Number of
Trips per
Year
315 315 315
Total Tons
per Year 330.75 9.45 6.3
In its guidance for Transportation Investment Generating Economic Recovery (TIGER) grant
applications, the United States Department of Transportation (USDOT) stipulates the cost to
society of one metric ton of certain pollutants, among which are nitrogen oxides (NOx) and sulfur
oxides (SOx).11
The costs (in 2013 dollars) are estimated to be $7,877 per metric ton of NOx,
11
http://www.transportation.gov/sites/dot.gov/files/docs/Tiger_Benefit-
Cost_Analysis_%28BCA%29_Resource_Guide_1.pdf
20
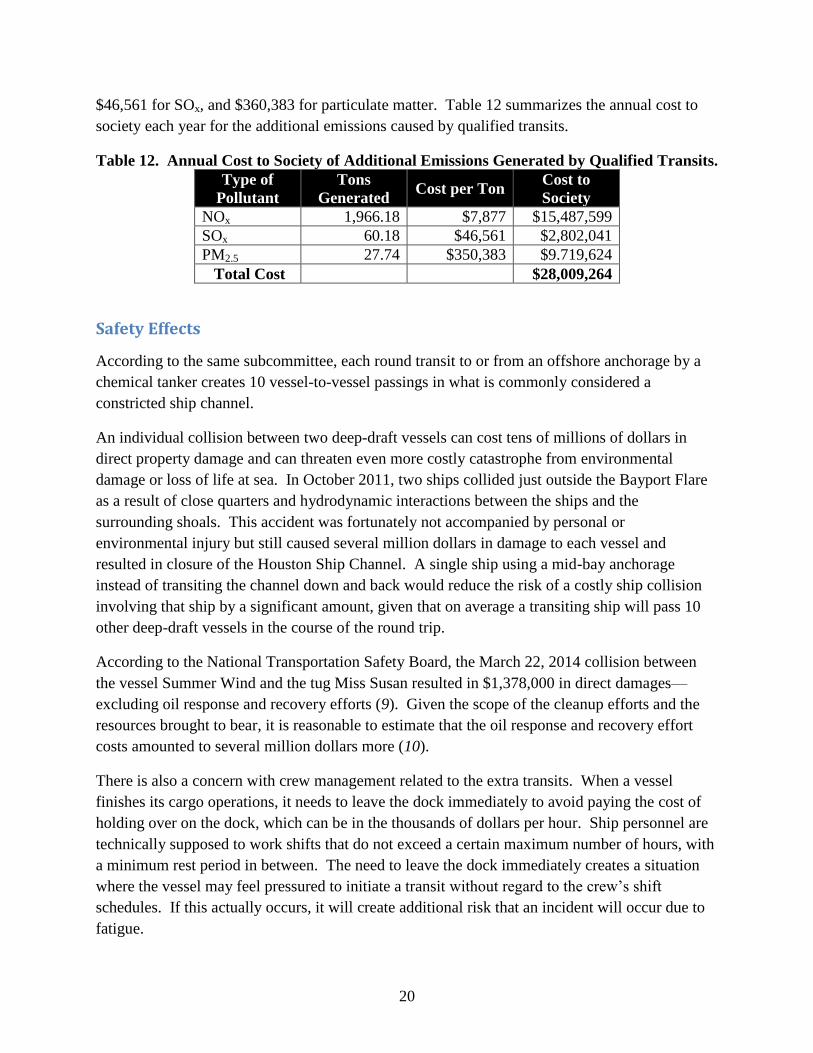
$46,561 for SOx, and $360,383 for particulate matter. Table 12 summarizes the annual cost to
society each year for the additional emissions caused by qualified transits.
Table 12. Annual Cost to Society of Additional Emissions Generated by Qualified Transits.
Type of
Pollutant
Tons
Generated Cost per Ton
Cost to
Society
NOx 1,966.18 $7,877 $15,487,599
SOx 60.18 $46,561 $2,802,041
PM2.5 27.74 $350,383 $9.719,624
Total Cost $28,009,264
Safety Effects
According to the same subcommittee, each round transit to or from an offshore anchorage by a
chemical tanker creates 10 vessel-to-vessel passings in what is commonly considered a
constricted ship channel.
An individual collision between two deep-draft vessels can cost tens of millions of dollars in
direct property damage and can threaten even more costly catastrophe from environmental
damage or loss of life at sea. In October 2011, two ships collided just outside the Bayport Flare
as a result of close quarters and hydrodynamic interactions between the ships and the
surrounding shoals. This accident was fortunately not accompanied by personal or
environmental injury but still caused several million dollars in damage to each vessel and
resulted in closure of the Houston Ship Channel. A single ship using a mid-bay anchorage
instead of transiting the channel down and back would reduce the risk of a costly ship collision
involving that ship by a significant amount, given that on average a transiting ship will pass 10
other deep-draft vessels in the course of the round trip.
According to the National Transportation Safety Board, the March 22, 2014 collision between
the vessel Summer Wind and the tug Miss Susan resulted in $1,378,000 in direct damages—
excluding oil response and recovery efforts (9). Given the scope of the cleanup efforts and the
resources brought to bear, it is reasonable to estimate that the oil response and recovery effort
costs amounted to several million dollars more (10).
There is also a concern with crew management related to the extra transits. When a vessel
finishes its cargo operations, it needs to leave the dock immediately to avoid paying the cost of
holding over on the dock, which can be in the thousands of dollars per hour. Ship personnel are
technically supposed to work shifts that do not exceed a certain maximum number of hours, with
a minimum rest period in between. The need to leave the dock immediately creates a situation
where the vessel may feel pressured to initiate a transit without regard to the crew’s shift
schedules. If this actually occurs, it will create additional risk that an incident will occur due to
fatigue.
21
Data Issues
One of the problems encountered in this analysis was that a high percentage of chemical tankers
were not classified as such in the database extract. The database was not designed to be a
research tool—it is essentially an activity log and not a precise accounting of all the details. The
researchers found that some (not many) vessels that were classified as chemical tankers were
other vessel types. However, fewer than half of the transits by chemical tankers were marked as
such in the database. Some vessels had more than one vessel type attributed to them during a
single port call. Others were never classified as a chemical tanker at any time. Researchers
identified the miscoded chemical tanker traffic by examining the vessel calls at chemical
terminals in Houston, looking up the vessel type in Lloyd’s Register, and comparing that vessel
type to the type shown in the database extract. The terminals that were included were:
Axiall.
Houston Ammonia.
Intercontinental Terminal.
Kinder Morgan.
LBC.
Lyondell.
Magellan Midstream.
Odfjell.
Stolthaven.
Valero (Houston Cement West).
Vopak.
Westway.
Admittedly, this approach may not have identified 100 percent of chemical tanker transits—a
chemical tanker may have called at a terminal not on the list without ever calling at any listed
terminal during the year. However, given the volume of traffic at the listed terminals, the
difference would not be significant in terms of decision-making value.
Table 13 shows the number of chemical tanker transits each year and the percent that were not
identified as such in the database.

22
Table 13. Chemical Tanker Transits with Incorrect Ship Type Codes, 2010-2014.
Year Total Chemical
Tanker Transits Miscoded Transits Percent Miscoded
2010 7.835 5,903 75%
2011 7,736 5.206 67%
2012 7,985 4,157 52%
2013 7,803 3,967 51%
2014 7,378 4,238 57%
23
CHAPTER 4: CURRENT AND PAST INITIATIVES
Marine Activity Planning System (MAPS Application)
In the mid-to-late 1990s, an initiative was undertaken to develop a scheduling system that would
help address some of the issues discussed earlier in this document. The system that was
developed was a paid-subscription-based system with a user login interface. This system, the
Marine Activity Planning System, allowed a ship operator/agent to easily schedule the rotation of
a vessel and receive notifications when there was conflict at a terminal between the vessel being
scheduled and another one. The name of the other vessel was provided by the system to the
vessel being scheduled with the goal of having the two operators talk directly and try to resolve
the conflict. The system was designed to show the user what vessels were in port and which
dock they were occupying.
MAPS was unable to achieve the stated objectives, primarily for the following reasons:
Participation by all relevant stakeholders was not mandatory; therefore, the information
was often incomplete and limited.
The system was vessel-centric. Even though a terminal was able to participate and see an
assortment of information, or even approve or change a scheduled vessel call, the
terminals were not active participants.
There was no overall “authority” managing the system.
At the time the system was developed, AIS did not exist. As the AIS data became
available, much of the functionality of the system was no longer relevant.
The data input required from the users was significant and generated a negative reaction
to the system.
Given that there was not widespread acceptance and that AIS had come online, the system was
terminated approximately 10 years ago. A new system would have to meet the following
minimum requirements to address the issues encountered by MAPS:
There must be broad participation (preferably 100 percent) of stakeholders.
There must a centralized authority that will manage the information and deal with
anomalies and unforeseen conflicts. There must be interplay between technology and
human intelligence.
It must be equitable for all parties; there should be a positive reason to participate.
The functioning of such a system must be transparent and easily reviewed.
These requirements are incorporated into the recommendations in the next chapter.

24
New/Expanded Anchorages
In 2012, a group of waterway users reached the conclusion that an anchorage located closer to
the industrial complex than the offshore Galveston anchorages would provide significant benefits
to chemical tankers. Transit times and distances would be less, and it might be easier to service
the vessel there than at a layberth site because there would not be restrictions imposed by the
terminal on the vessel’s activities.
The Waterways Utilization Subcommittee of the Lone Star Harbor Safety Committee began to
deal with this issue in an organized fashion by forming an Anchorage Working Group in 2012.
The group was formed to study where the unutilized anchorage resources were and recommend
options to optimize the anchorages serving Houston, Texas City, and Galveston.
The group studied the possibility of constructing a mid-bay anchorage adjacent to the Bayport
Cruise Terminal that could accommodate three ships. The proposed layout is shown in Figure 5.
Figure 5. Proposed Mid-Bay Anchorage.

25
The group determined that the dredging effort to construct this anchorage would be considerable.
The site has a depth of approximately 10 ft. To construct the anchorage with a 200-yd radius and
a 36-ft depth would require the removal of 1.5 million cubic yards and considerable ongoing
maintenance. Additionally, the recent dredging of the Bayport Channel encountered some
difficulties from local interests with regard to dredged material disposal. This opposition may be
more intense with another project in the same area.
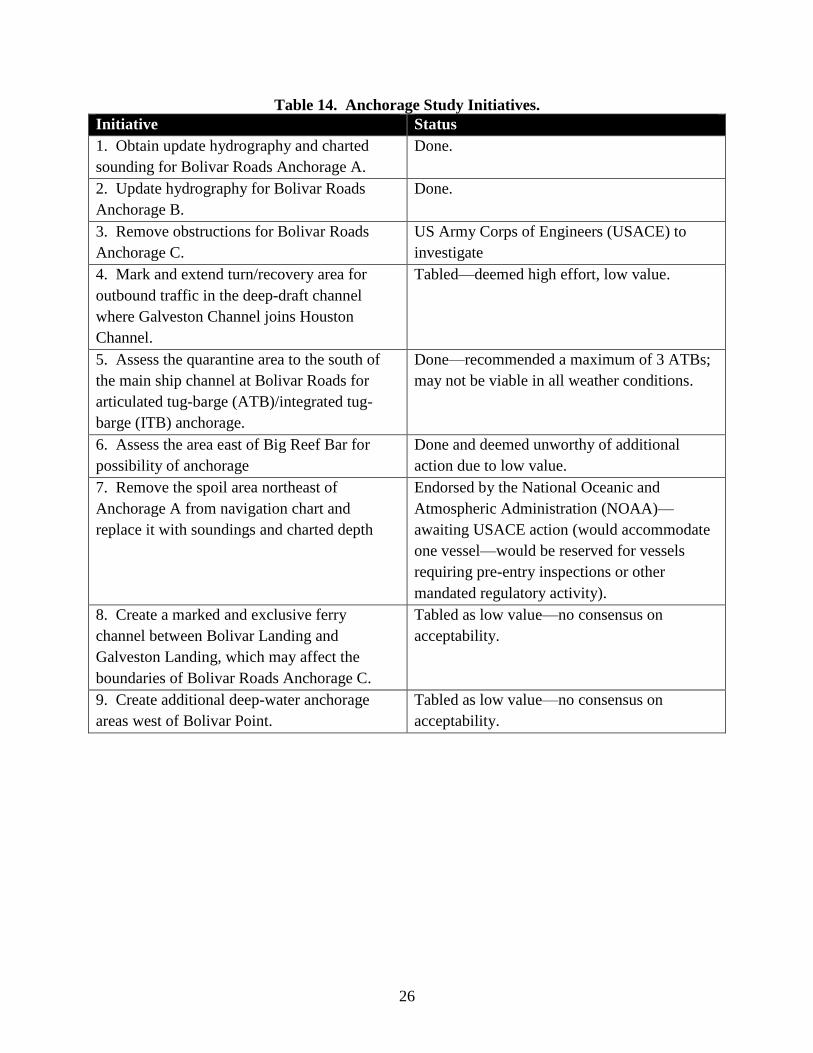
The working group abandoned the concept of the mid-bay anchorage and developed nine
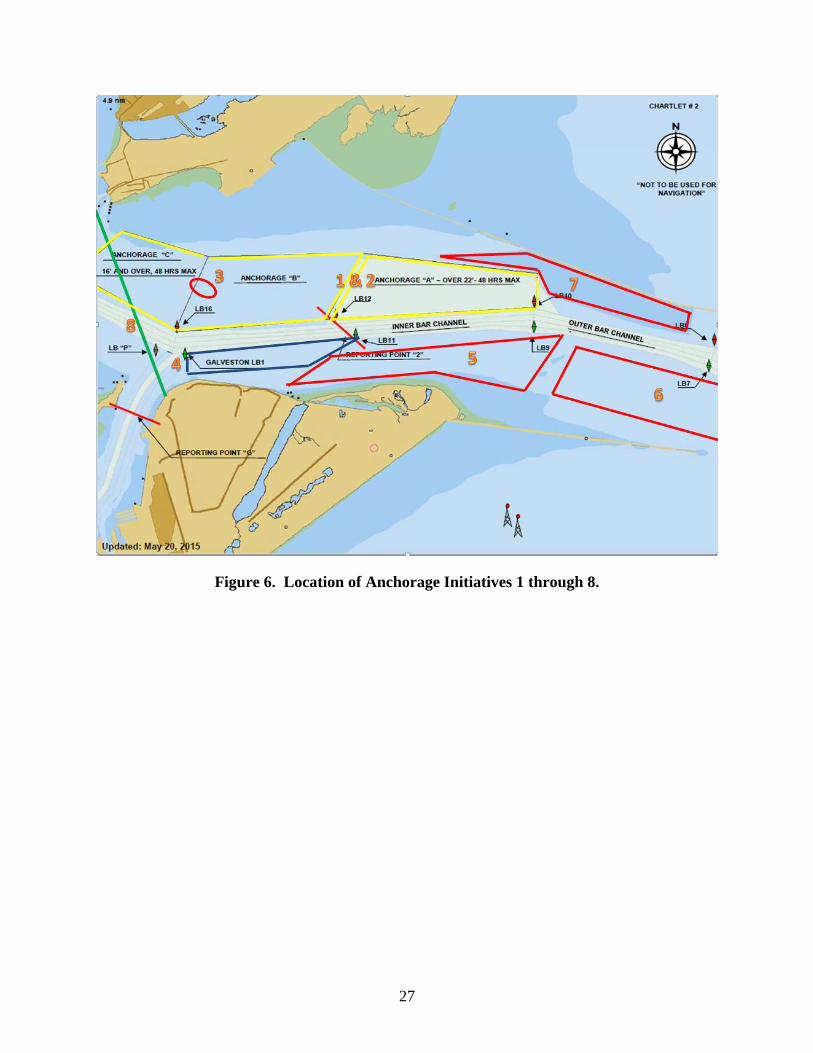
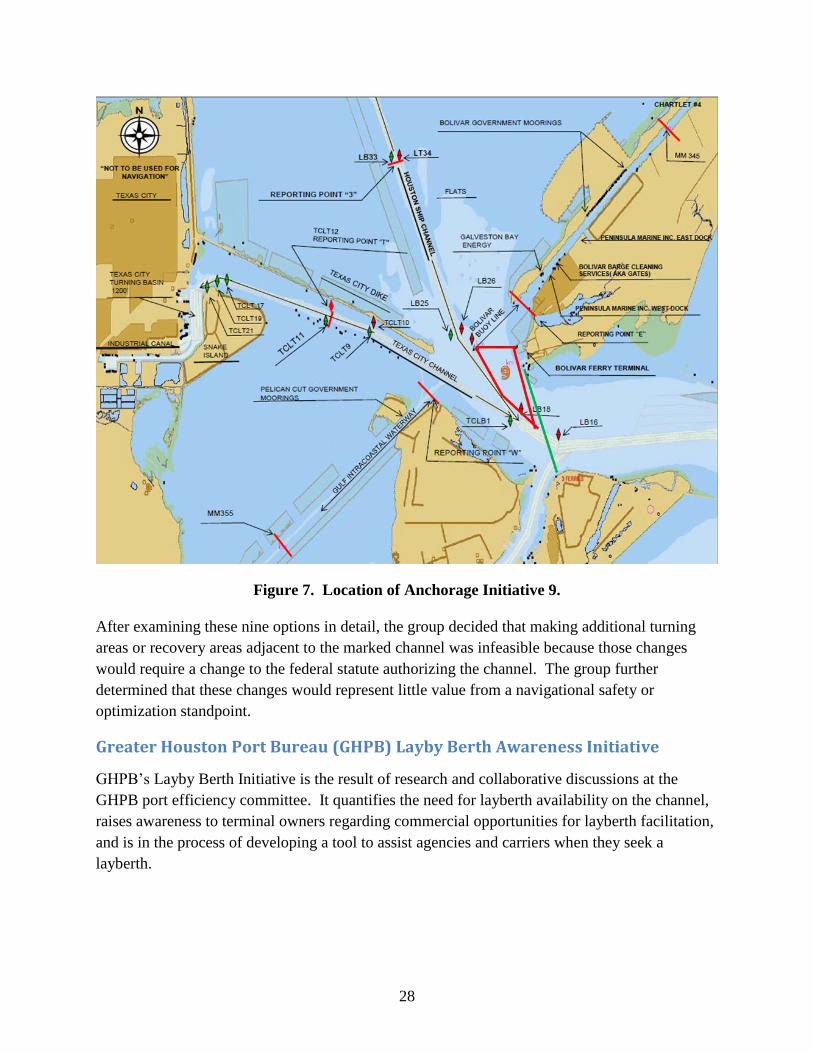
initiatives. Table 14 lists them with their status as of August 2013. Figure 6 depicts initiatives 1
through 8; Figure 7 depicts initiative 9. The shapes in the figures are only approximations and
do not represent exact boundaries.
26
Table 14. Anchorage Study Initiatives.
Initiative Status
1. Obtain update hydrography and charted
sounding for Bolivar Roads Anchorage A.
Done.
2. Update hydrography for Bolivar Roads
Anchorage B.
Done.
3. Remove obstructions for Bolivar Roads
Anchorage C.
US Army Corps of Engineers (USACE) to
investigate
4. Mark and extend turn/recovery area for
outbound traffic in the deep-draft channel
where Galveston Channel joins Houston
Channel.
Tabled—deemed high effort, low value.
5. Assess the quarantine area to the south of
the main ship channel at Bolivar Roads for
articulated tug-barge (ATB)/integrated tug-
barge (ITB) anchorage.
Done—recommended a maximum of 3 ATBs;
may not be viable in all weather conditions.
6. Assess the area east of Big Reef Bar for
possibility of anchorage
Done and deemed unworthy of additional
action due to low value.
7. Remove the spoil area northeast of
Anchorage A from navigation chart and
replace it with soundings and charted depth
Endorsed by the National Oceanic and
Atmospheric Administration (NOAA)—
awaiting USACE action (would accommodate
one vessel—would be reserved for vessels
requiring pre-entry inspections or other
mandated regulatory activity).
8. Create a marked and exclusive ferry
channel between Bolivar Landing and
Galveston Landing, which may affect the
boundaries of Bolivar Roads Anchorage C.
Tabled as low value—no consensus on
acceptability.
9. Create additional deep-water anchorage
areas west of Bolivar Point.
Tabled as low value—no consensus on
acceptability.
27
Figure 6. Location of Anchorage Initiatives 1 through 8.
28
Figure 7. Location of Anchorage Initiative 9.
After examining these nine options in detail, the group decided that making additional turning
areas or recovery areas adjacent to the marked channel was infeasible because those changes
would require a change to the federal statute authorizing the channel. The group further
determined that these changes would represent little value from a navigational safety or
optimization standpoint.
Greater Houston Port Bureau (GHPB) Layby Berth Awareness Initiative
GHPB’s Layby Berth Initiative is the result of research and collaborative discussions at the
GHPB port efficiency committee. It quantifies the need for layberth availability on the channel,
raises awareness to terminal owners regarding commercial opportunities for layberth facilitation,
and is in the process of developing a tool to assist agencies and carriers when they seek a
layberth.
29
GHPB estimates that approximately 500 liquid bulk vessels per year utilize layberths along the
Houston Ship Channel12
; however, GHPB estimates that they represent less than 25 percent of
the movements where a layberth may have been required. In addition, the most commonly used
layberths on the channel, the Port of Houston Authority's City Docks, are relatively distant from
the most heavily trafficked liquid bulk docks clustered in the Bayport Channel and between
Beltway 8 and the Lynchburg Ferry.
GHPB is making a concerted effort to discuss with stakeholders the process of allowing a layby
berth call at terminals closer to those facilities where a vessel either departs from or plans to visit
next. By addressing the concerns of facility owners, such as excessive time at berth and
emergency action plans, the Port Bureau staff has been able to gain conditional acceptance by a
number of terminals to utilize previously ignored facilities as a layby berth, if the terminal's
commercial schedule allows.
In addition, GHPB is working with the Houston Pilots and individual facility owners to develop
a whole-port schedule that will allow agents seeking layby berth facilities to see what options are
available to them while respecting the commercial sensitivities of terminal operators.
12
This is different from the number calculated by TTI. The possible reasons for this difference are discussed in the
explanation of Table 8. TTI did not attempt to reconcile the two numbers.
30
CHAPTER 5: POTENTIAL ACTIONS FOR CONSIDERATION
Background
The potential actions described in this chapter have different levels of difficulty in terms of
implementation. They are not presented in any particular order. It is important to note that
actions that will require changes to the standard charter party clauses for Houston (e.g., the
tendering process) will most likely not be effective unless a requirement is imposed on the
system from some external body. In other words, it will probably be necessary for a
governmental entity to enact some type of legislation or safety/environmental regulations for
such changes to occur and be effective. If the changes are not mandatory for all participants in
the system, it is highly unlikely they will be effective.
In addition to discussing potential actions, this chapter lays out an organizational framework for
instituting the changes and monitoring their progress and effectiveness.
Improve Existing Data Collection Activities
An analysis cannot be any better than the data underlying it. Just a few minor improvements in
the transit data that are currently being collected could yield significant benefits in future
analytical work. Currently, the following data are either not provided or, if provided, do not
paint a sufficiently accurate picture:
Reason for transit. The current dataset does not reveal why vessel transits are occurring,
which is an important factor in crafting new approaches for managing the traffic.
Something as simple as entering a standard reason for the transit on the pilot request
would be extremely helpful. Of course, to be meaningful for analytical use, the reason
for the transit must be accurate and not simply filling in a blank to be compliant with a
new regulation. Such reasons for a transit to/from the offshore anchorage area could
include, but not be limited to:
o Tank Cleaning.
o Desired Berth Occupied.
o Cargo Not Ready.
o Equipment Not Available.
o Bunkering.
o Repairs.
o Departing Port.
o Entering Port.
Terminal services rendered. It would also be helpful to record what services were
performed at the dock. Such a list might include, but not be limited to:
o Cargo Loading.
o Cargo Discharge.

31
o Cargo Sampling/Inspection.
o Tank Inspection.
o Bunkering.
o Repairs.
o Provisioning.
Vessel type. It is critically important to know what type of vessel the analyst is
examining. It would be very helpful to record the vessel type using Lloyd’s Register ship
types (e.g., Chemical/Products Tanker, Crude Oil Tanker, General Cargo, Container
Ship, etc.).
Expand Data Collection and Analytical Scope
A wealth of information in vessel activity logs (Statement of Facts) could be used to increase
vessel and terminal efficiency, which would lead to fewer qualified transits and increase the
operational capacity of terminals. Historically, it has been difficult to tap into this information
because of confidentiality concerns and because of the differences in terminology and record
keeping among the various vessel operating companies. However, the ability to analyze this
information would enable the development of analytics that would establish benchmarks and
highlight variances from that benchmark that need to be addressed. The recent effort by the
GHPB to analyze the time it takes to deploy gangways is an example of this type of analysis for
one specific activity. There are dozens of more activities that could be tracked with the
appropriate system.
The researchers were unable to determine what has been done by private sector interests to
develop a service that would benefit a port-wide community. They identified one company that
offers this type of data collection and analysis to vessel operators—the Marcura Group—via two
of its business units, DA-Desk and PortLog.13
There may be others that the researchers could not
identify, but this company’s analyses are a good example of the type of analytics that could be
valuable to the Houston chemical tanker community.
Based on the interviews conducted for this report, for data collection and analysis to be effective,
it will be necessary to have some type of coordinating agency or management structure that
could manage or oversee these activities. A possible structure for this function is discussed later
in this chapter.
The goal of this type of data management is to minimize the time a vessel is in port and the cost
of conducting business in the port. Although the data focus on the vessel, the result is that there
would be fewer qualified transits, a reduction in idle time at docks (enhancing terminal
efficiencies), a reduction in demurrage bills (which is important to shippers at the Port of
13
The researchers were not able to review what these business units do in sufficient detail to evaluate them. They
are offered as an illustration of the concept.

32
Houston), and a reduction in the negative effects of unnecessary transits (i.e., air emissions,
increased safety risks, and port congestion).
Tendering Process
Several interviewees indicated that it is common practice for a vessel to tender notice of
readiness to multiple terminals and then proceed to the one that makes the most sense in terms of
its overall terminal rotation. However, vessels do not always cancel their NORs to the terminals
they do not select. As a result, terminals prepare for an arrival that is not coming and report that
they are not available when they could be.
It was explained to the researchers that the vessel might not cancel the tenders at the other
terminals because it wants to keep its options open, and it wants to “reserve a place in line.”
However, this has a domino effect throughout the port, creating inefficiencies for multiple
parties. Establishing a system or requirement that ensures that once a vessel is underway to a
terminal all other NORs will be canceled could increase efficiency and free up terminal capacity.
Harbormaster
The concept of a harbormaster was proposed by some of the interviewees and has been the topic
of discussion at numerous industry meetings. The positions of individual stakeholders on this
issue range from strongly against to strongly for, which indicates that this may be a difficult
measure to implement.
A harbormaster is a position that has the authority to direct and control traffic in the port area in
much the same way that the Federal Aviation Administration controls air traffic. In a previous
study (11), TTI identified several traffic management functions a harbormaster would probably
perform in the Houston area, given the port environment and current U.S. port practices. These
functions include:
Authorize relocation or removal of vessels that do not comply with harbor rules.
Order vessel shifting in harbor or change of berthing or docking location because of
harbor safety needs.
Maintain and provide information on currents, tides, channel draft, width, dimensions, or
other navigation parameters.
Authorize temporary moorings.
Coordinate and regulate movement of vessels in harbor (in conjunction with U.S. Coast
Guard–Vessel Traffic Services).
Enforce vessel anchorage rules in harbor.
Assign permits for vessel mooring.
Coordinate and assign vessel berthing and docking locations.
Supervise queuing of vessels waiting to enter the harbor.
Schedule vessel berthing and docking times.
Coordinate vessel shelter, anchoring, or berthing in hazardous weather conditions.
33
Authorize removal and/or scrapping of derelict vessels.
Order vessel shifting in harbor or change of berthing or docking location because of
cargo loading or unloading needs.
In addition to these functions, harbormasters at some ports also have duties and functions in the
areas of (a) public safety, security, and environmental responsibilities; (b) incident, inspection,
and repair responsibilities; and (c) cargo- and supplies-handling responsibilities.
This office could be part of the port authority administration, but it could also be a separate
entity. In a strong majority of cases, the office is part of the port authority administration.
Depending on how the office is defined, the creation of this position may require legislation at
the state level.
The thinking of some of the interviewees was that the harbormaster could have tighter control
over the tendering process from the vessel to the terminals and that it could enforce stricter
adherence to a planned rotation. This would mean that if a vessel changed its rotation because it
wanted to pick up additional cargo, it would have to return to anchorage and initiate a new
rotation. Other interviewees opined that the harbormaster office would not be in a position to
understand the operational and economic consequences of actions it might impose on a vessel
and that the office could do more harm than good.
Corpus Christi is a port with a harbormaster that also handles chemicals. It is not nearly as large
or complex as the Port of Houston. However, to gain an understanding of how a harbormaster
would most likely be expected to operate in a Texas-based port that handles chemicals, TTI
acquired a summary of the operating procedures the Corpus Christi Harbormaster Office follows.
They are included in Appendix B as a reference resource.
Lightering
Lightering involves the transfer of cargo directly between a deep-sea vessel and an inland barge
rather than going through the intermediate step of storing the cargo in an onshore tank.
According to the interviewees, lightering from vessel to barge has been done at ITC, Vopak, and
Stolt. The LBC terminal does not allow it.
Lightering is not always a viable option. In certain parts of the channel, the channel width is too
narrow to have a barge stationed alongside a deep-sea vessel. Lightering would cause the
channel to be blocked or reduce safety for passing vessels.
Lightering costs are $25-30,000 per lighter. These operations usually use 10,000 bbl barges and
take 8 to 10 hours to complete. If a larger barge is used (30,000 bbl), it can take 18 hours to
complete the cargo transfer. The actual transfer rate is primarily dependent on the barge’s
pumping equipment.
34
There are some operational obstacles to lightering. It is difficult to find barges for lightering that
meet the required specifications. The barges must be booked/reserved well ahead of the vessel
arrival. With the uncertainty involved in oceangoing transport, this is a difficult requirement to
meet.
Even with the obstacles involved, certain companies have found it useful to do lightering from
time to time. When lightering is performed, it reduces the number of transits a ship must
conduct, and it speeds up the process of cargo transfers overall. This option might deserve more
study by industry groups who would benefit from these operations.
Inspection Facility
One interviewee suggested that it might be helpful to have a mooring/anchorage facility closer to
Galveston where pre-inspection and pre-clearances could be performed. It would reduce both
the time and expense of conducting those activities. A vessel could make the necessary
arrangements with the surveyor, tie up to the dock for as long as it takes the surveyor to do his
work, and then move back to anchorage or proceed into port. This facility would have to be
dedicated to the single purpose of inspection and pre-clearance.
Nordic Tankers’ Tank-Cleaning Initiative
Nordic Tankers has initiated a tank-cleaning program that would remove pre-inspection
activities. Currently, a wall-washing requirement is imposed on many vessels before a tank will
be cleared for use. If some of these washings could be avoided, it would reduce any possible
over-cleaning, excess bunker consumption, and cleaning chemical consumption. Additionally, a
wall-wash inspection can be subjective and an approval by a surveyor does not afford legal
protection for the vessel.
Nordic has determined that it is possible to analyze washing water using a wave spectrometer.
This allows the vessel to monitor tank cleaning without having to manually enter the cargo tanks.
When using this technology, it is not necessary to confirm cargo tank cleanliness using standard
wall-washing manual inspections.
This alternative approach requires acceptance by the charterer (shipper) to use washing-water
analysis instead of a third-party inspection prior to loading. The advantages to such an approach
are:
Vessels can clean tanks and, when appropriate, inert all cargo tanks14
at sea.
Pre-inspection or cargo tank entry will not be necessary while the vessel is alongside the
loading terminal.
14
The term “inerting” (often referred to as purging) generally refers to the replacement of air in a cargo tank by an
inert gas, in chemical tankers most often by nitrogen, in order to prevent the formation of flammable vapors and
oxygenation of the product, reduce humidity in the tank, and/or protect the quality of the cargo. More information
can be found at http://www.chemicaltankerguide.com/inerting-cargo-tanks.html.
35
There will be less time alongside the terminal and better logistics control for shippers and
terminal operators.
A reduction of bunker consumption (greenhouse gases, etc.) and chemical use (which
must be discharged into the sea) can occur.
The process works on tank vessels with any kind of coating in the cargo tanks and cargoes that
have a UV profile. For the chemical sector, this is a substantial number of ships and if more
widely adopted, has the potential to enhance port efficiency.
GHPB Layby Berth Awareness Initiative
GHPB has already laid much of the groundwork for enabling vessels to take greater advantage of
existing layberth possibilities. A qualified transit to a layberth is less costly and disruptive than a
transit to an anchorage and will consume less time. Working with GHPB to increase the use of
layberth options will reduce the number of transits to anchorage and increase the flexibility of
terminals and vessels in responding to changing conditions.
Scheduling System
The development and deployment of an adequate scheduling and traffic management system that
is acceptable to the broad range of stakeholders involved in chemical transportation has the
potential to significantly increase efficiency and reduce unnecessary transits of chemical tankers
in Houston. However, this is probably the most difficult measure to implement of those that are
listed in this report. It is important to keep in mind that a solution may be technically ideal, but if
it is not acceptable to the parties in the marketplace, it will not be implemented and cannot be
effective.
TTI researchers did a thorough search of publications and research literature to identify any prior
or current efforts to develop such a system that would be of value in the Port of Houston
environment. Unfortunately, a very high percentage of the studies/reports focuses on container
terminals and looks at vessel management from the viewpoint of a single terminal operator.
However, there has been some significant modeling and analytical work done by Dutch
researchers that, with minor adjustments, appears to be directly applicable to the Port of Houston
situation (12).
The Dutch research recognized and incorporated several factors that are directly applicable to the
situation in Houston. It recognized that it is dealing with competitive parties that have to
cooperate but only want to do so under specific conditions.
In a broad sense, the alignment of operations of different companies often requires sharing
information or giving up some control over the operational process. For many companies, these
actions pose a threat to their competitive position. Centralized control mechanisms are not
always accepted by the companies involved. However, distributed control mechanisms may be a
promising alternative.
36
There are a number of specific complicating factors that a scheduling system must address:
Every terminal and vessel operator wants to remain autonomous (in control of its own
operations).
There are no contractual relationships between the vessel operators and terminal
operators. Neither party can force the other to deliver a certain service or charge in a
certain way.
Since vessel operators are in direct competition with each other, they are reluctant to
share information that could affect their competitive position.
The entities in the port system may be different at different points in time.
The activities of terminals are interdependent; the activities of one terminal can directly
affect other terminals.
The environment is highly dynamic; the situation is constantly changing—sometimes
rapidly.
Disturbances occur that must be handled effectively (e.g., fog days, hurricanes, and
collisions).
A number of operators involved in the chemical shipment process often have competing
objectives:
o Vessel owner/operators want to reduce in-port expense and in-port time/delays.
o Terminal operators want to maximize number of vessels handled and minimize idle
time.
o Charterers/shippers want to minimize shipment time and costs and want to minimize
extra expenses such as demurrage fees.
o The port authority wants to keep the port competitive and attract additional traffic.
The Dutch research team focused on solving the scheduling problem for container barges in the
Port of Rotterdam. These barges must visit multiple terminals while in port, they have different
cargo requirements at each terminal, and the services are highly competitive with each other. If
one simply substitutes “chemicals” for “containers” and “vessels” for “barges,” the similarity of
the research problem with the Port of Houston environment is striking.
The research literature indicated that in prior scheduling efforts, system designers and
researchers focused on publishing berth schedules of terminals on the Internet. Vessel/barge
operators saw value in this, but terminal operators did not—the solution was too labor-intensive
for the benefits achieved (a situation that seems to be part of the reason the MAPS application
was terminated).
The Dutch research team developed a multi-agent system that seems to have promise, although it
has not yet been implemented. A multi-agent system is a system in which multiple agents
interact to achieve local or global goals. An agent is usually defined as a hardware- or (more
often) software-based object with key properties of autonomy, social ability, reactivity, and
proactiveness. This means that an agent can:
Operate without direct intervention of humans or others (autonomy).
Interact with other agents (social ability).
37
Perceive its environment and respond to changes in it (reactivity).
Exhibit goal-directed behavior by taking the initiative (proactiveness).
The purpose of an agent is to take over tasks from its principal, e.g., the human or organization it
represents. To do so, an agent can collect, store, and analyze data during operations and make
decisions and agreements on behalf of its principal. The level of review and approval required
by actual human managers must be defined during system development.
A multi-agent system can be defined as a loosely coupled network of problem solvers that work
together to solve problems that are beyond the individual capabilities or knowledge of each
problem solver. Researchers have already investigated the application of agent technology to
manufacturing systems, supply chain management, and transportation networks and determined
that it has promise.
In developing their approach, the Dutch research team focused on understanding the key
performance indicators for vessel/barge operators and terminal operators. As part of their
research, they recruited several key players to participate in a management game based on their
proposed scheduling framework, and the players indicated it was feasible.
In multi-agent systems, (a) each agent has incomplete information (a limited viewpoint), (b)
there is no global (centralized) control, (c) data are decentralized, and (d) computation is
asynchronous (it can occur offline). These systems are ideal for problems with the following
characteristics (which are almost identical to Houston’s operating environment):
Modular structure (there are well-defined entities with distinct state variables).
Decentralized structure.
Changeable structure (may change frequently and rapidly).
Deficient structure.
Complex structure.
These systems make two noticeable contributions:
Communication. Communication between parties can be done faster, more efficiently,
and more reliably with the use of agents.
Decision making. Automated agents can use techniques from the field of operations
research to search quickly through a large number of solutions.
For these systems to be effective and accepted, participation in the system must lead to a higher
payoff than not participating. They must be stable and non-manipulatable—agents cannot
manipulate each other by providing incorrect or incomplete information. The system should
motivate the player to act in the desired manner. It must minimize required communication.
Finally, the sharing of benefits and losses should be designed fairly.

38
Multi-agent systems recognize that speed in decision making is important. The faster decisions
are made, the less likelihood there is that changes will occur in the system that would negate the
decisions.
The Dutch model requires the sharing of a limited amount of information to achieve its
objectives. It is dynamic and allows for real time alignment of barge and terminal operators. It
focuses on using appointments to manage barge/vessel schedules. These are appointments, not
exclusive reservations. The terminal manager has the freedom to undertake any desired activities
as long as the guaranteed processing time is met. In this system, the barge/vessel promises the
terminal to be present at the terminal at a certain time, i.e., before a determined latest arrival
time. The terminal, in turn, guarantees that barge/vessel a latest starting (or departure) time if the
barge/vessel arrives on time. If it arrives late, it has to make a new appointment.
Essentially, there is a two-step scheduling process. The barge/vessel operator obtains
information on the availability of terminals. Next, it actually makes the necessary appointments
through the appropriate agents. Typically, a barge/vessel operator would always assume the
maximum terminal time in planning its rotation. Barge and terminal operators communicate
directly.
Figure 8 presents a simplified version of how a barge operator would communicate with the
terminals in the system envisioned by the Dutch researchers.
Source: “Aligning the Operations of Barges and Terminals through Distributed Planning” (12)
Figure 8. Barge Operator—Terminal Operator Communication Diagram.
39
If a barge/vessel operator arrives late frequently or provides incorrect information, the terminal
can penalize the operator by providing time slots that may result in longer wait times or by
giving him lower priority.
In designing their multi-agent approach, the Dutch researchers made several key assumptions:
Barges arrive in an independent and random manner.
Decisions of barges and terminals have to be made in real time.
Terminals have a fixed capacity, are never closed, and only have information about
barges that have already arrived in port.
On arrival, the barge has information about the terminals’ set-up and operations, the
cargo transactions needed at each terminal, the mooring time at each terminal, and the
sailing time between terminals.
Barges may have to visit up to 20 terminals.
Unfortunately, the Dutch model does not explicitly include the handling of disturbances to the
system, although it explicitly stated that there needs to be a plan to deal with major disturbances.
The concept of using an approach similar to the Port Coordination Team’s approach that is used
during major port disruptions should be a topic of future research.
One additional design option that was not considered in the Dutch model is for barge/vessel
operators to be able to communicate directly with each other. It might make sense for the system
to be designed in a way that allows operators to exchange appointments or share relevant
information.
For a system of this nature to be effective, there will have to be some type of coordinating
agency or organization. A possible framework for this is discussed later in this chapter. One of
the key datasets this organization will need to maintain will be a detailed database of terminal
characteristics. These include available equipment, tank capacities, berth sizes, scheduled
maintenance and construction activities, and other key variables. This information will allow a
greater degree of automated decision making during the scheduling process.
Organizational Structure and Approach
In order for a scheduling system to work and for some of the measures discussed above to have
credibility with stakeholders, it is necessary to have some non-regulatory coordinating
mechanism that all parties can trust to be fair and impartial. Given the concerns expressed by a
number of stakeholders concerning the option of creating a harbormaster’s office, the researchers
investigated other mechanisms that might be more readily accepted. Such a mechanism would
have to be responsive to the needs and concerns of the stakeholders while promoting overall
efficiency.
40
Stakeholders may want to consider an entity with a structure similar to that of a municipal
management district as defined in Texas law. This structure was the framework for the creation
of the Houston Ship Channel Security District (HSCSD), which was created in 2009. A similar
district could be created for the management of chemical tanker traffic in the Port of Houston.
This study refers to such an entity as a ship traffic management district (STMD) for ease of
reference.
Municipal management districts in general are subject to the provisions of the Local Government
Code, Title 12—Planning and Development, Subtitle A—Municipal Planning and Development,
Chapter 375—Municipal Management Districts In General, Subchapter A—General Provisions.
The Houston Ship Channel Security District was authorized and is subject to the provisions of
the Texas Water Code, Title 4—General Law Districts, Chapter 68—Ship Channel Security
Districts.
Entities such as HSCSD are a special district and political subdivision of the state. These
districts have a primary purpose expressed in the statute. In the case of HSCSD, the statute
referenced above describes it as “the promotion of social welfare by providing assistance for the
common good and general welfare to and within the communities of its members for emergency
fire protection and other public safety matters.” A STMD could have a purpose that includes the
scheduling and monitoring of chemical tanker traffic with the goal of promoting the safety,
welfare, and economic interests of all parties using the Houston Ship Channel (the actual purpose
would need to be crafted with the advice of legal counsel).
The legislation can be drafted to specifically determine who will be members of the district. In
the case of the HSCSD, the legislation specified that the members would be:
A chemical manufacturers' association facility.
A mutual-aid organization facility.
A facility as defined in 46 U.S.C. Section 70101.
A facility described by 33 C.F.R. Section 105.105(a).
A facility subject to an area maritime transportation security plan under 46 U.S.C.
Section 70103(b).
A facility subject to 40 C.F.R. Part 112.
A general shipyard facility as defined by 46 C.F.R. Section 298.2.
A facility included in one or more of the following categories and codes of the 2007
North American Industry Classification System:
o Crude petroleum and natural gas extraction, 211111.
o Petroleum refineries, 324110.
o Petrochemical manufacturing, 3251.
o Petroleum lubricating oil and grease manufacturing, 324191.
o All other petroleum and coal products manufacturing, 324199.
o All other chemical manufacturing, 325998.
o Petroleum bulk stations and terminals, 424710.
41
o Plastics, chemical, and petroleum wholesalers, 424610, 424690, and 424720.
o Transportation, including rail, water, and road transportation and pipelines, 482111-
482112, 483111-483114, 484110-484230, 486110-486990, 488210, 488390, and
488490.
o Port and harbor operations, 488310.
o Marine cargo handling, 488320.
o Warehousing and storage, including general, refrigerated, farm and other, 493110,
493120, 493130, and 493190.
o Deep-sea and coastal freight and passenger transportation, 483111-483114.
A facility that the district by petition may request to be added.
The legislation specifically excludes:
A residential property, including a single-family or multi-family residence.
A retail or service business that is not a facility as defined by 46 U.S.C. Section 70101.
A public-access facility as defined by 33 C.F.R. Section 101.105.
A facility that is not listed under Subsection (b) and that is owned by:
o An electric utility or a power generation company as defined by Section 31.002,
Utilities Code.
o A gas utility as defined by Section 101.003 or 121.001, Utilities Code.
o A telecommunications provider as defined by Section 51.002, Utilities Code.
o A person who provides to the public cable television or advanced telecommunications
services.
A special district such as the HSCSD is actually created by the county commissioners court. The
court must receive a petition requesting the district’s creation. The petition must be signed by:
The owners of a majority of facilities in the proposed district.
The owners of a majority of the assessed value of facilities in the proposed district
according to the most recent certified property tax rolls of the county.
The HSCSD is prohibited from imposing any tax, including a property tax or a sales and use tax.
However, it is allowed to set and collect assessments, subject to a number of administrative
requirements. These assessments can be against all the facilities in the district or any portion of
the facilities in the district. In the Texas Water Code citation mentioned above, the law stipulates
that the governing board “shall apportion the cost of a security project or security service to be
assessed against a facility based on any reasonable assessment plan that results in imposing fair
and equitable shares of the cost.”
Legislation will stipulate the number of directors that will make up the governing body and how
they are to be selected. In the case of the HSCSD, the legislation set up a number of zones
within the district. It then stipulated that the board must have at least 10 but not more than 13
directors consisting of:
Two directors for each security zone appointed by the commissioners court of the county
and nominated as provided by Section 68.152.

42
One director appointed for the district at large by the commissioners court of the county
under Section 68.153.
One director appointed under Section 68.154.
Any director serving under Section 68.155.
Table 15 provides a brief description of the legislation sections mentioned in the above four
points.

43
Table 15. Composition of Security Zone Directors.
Section 68.152: Security Zone Directors The commissioners court of the county shall
appoint as directors for each security zone the
one or two nominees as appropriate for the
staggering of terms who received the highest
number of votes in a vote by the facility
owners in each security zone. Each person
nominated as a director must be employed by a
facility owner at a facility in the zone.
Section 68.153: At-Large Director The director appointed by the commissioners
court for the district at large may be:
(1) a person employed by a member of an
association that includes steamship owners,
operators, and agents and stevedoring and
terminal companies and that:
(A) is a Texas nonprofit corporation;
and
(B) leases space in the district; or
(2) any other person considered appropriate by
the commissioners court.
Section 68.154: Municipal Director a) If there is a countywide association of
mayors and city councils of municipalities in a
county that creates a district, the association
shall appoint one director.
(b) If there is not an association described by
Subsection (a), the municipalities in the district
shall appoint a director. If there is more than
one municipality in the district, the governing
body of each municipality by resolution may
vote in favor of a nominated person and a
person who receives the votes of a majority of
governing bodies is appointed director.
(c) The director appointed under this section
must reside in a municipality adjacent to the
largest ship channel in the district.
Section 68.155: Port Authority; Ex Officio
Director
If a port authority is located in the district, the
executive director, or a person designated by
the executive director, serves as a director. If
more than one port authority is located in the
district, the executive director, or a person
designated by the executive director, of the
port authority with the largest territory inside
the district serves as a director.
44
The exact provisions for a STMD would need to be discussed with legislators and legal counsel
to ensure that the members of the district are fairly represented and are treated equitably.
There are several advantages that a structure such as a STMD offers for addressing the problems
discussed in this report. Among them are:
The members of the district would govern themselves rather than have a regulatory
regime imposed on them.
Any contractors hired by the district to manage its affairs (such as a scheduling system),
would be directly responsible to the stakeholders rather than a separate entity.
Such a structure guarantees that knowledge of industry practices and requirements will be
present.
The stakeholders would have direct involvement in determining the costs of management
and whether the measures that are implemented are producing benefits that are greater
than the costs.
The district could contract with existing organizations such as GHPB to manage its operations,
or it could establish a separate management entity.
The specific provisions of the HSCSD legislation are provided as a point of reference and to give
interested parties an understanding of the matters that must be resolved for such a district to be
created. There are two major milestones that must be achieved for such a district to be created:
The legislature needs to authorize the creation of such a district.
Enough stakeholders within the proposed district must petition for its creation before the
district can actually be formed.
Given that the Texas Legislature just finished its 2015 legislative session and will not be in
session again until January of 2017, if there is sufficient interest in the creation of such a district,
this is the ideal time for stakeholders to begin the legislative process and create a stakeholder
coalition to see the process through to completion.

45
CHAPTER 6: CONCLUDING REMARKS
There is a widely perceived problem with chemical tanker traffic in the Port of Houston. The
statistics seem to support this perception. There are no clear-cut, easy solutions to the chemical
tanker scheduling problem. There are some measures that can be taken fairly quickly that will
have a beneficial effect:
Continue to support the GHPB Layby Berth Awareness Initiative.
Improve data collection practices.
Address the problems with the NOR tendering process.
Work with charterers/shippers to institute a tank-cleaning program like the one Nordic
Tankers is initiating.
The development of a scheduling system is a much more difficult proposition. Given the wide
range of opinions on the concept of a harbormaster office, it appears that the most promising
approach is to continue research into the implementation of a system that combines the best of
what the Dutch research team developed in Rotterdam with state-of-the art tools for dealing with
disruptions and constant change,
For a scheduling system to work, there will have to be a central management function to control
and monitor the operation of the system. Some type of human interaction with the system will
be required, at least for the foreseeable future. The concept of creating some form of a municipal
management district appears to merit further consideration. It addresses many of the issues that
are important to stakeholders when it comes to acceptance of a scheduling system.
More research will be required to actually develop a more effective and efficient scheduling
mechanism. The technical underpinnings of the Dutch research effort for scheduling and
modeling tools needs to be explored in depth with the active participation of stakeholders.

46
APPENDIX A: MAP OF HOUSTON SHIP CHANNEL
Source: Texas Mooring Inc.
Figure 9. Houston Ship Channel—West (Upper) End.

47
Source: Texas Mooring Inc.
Figure 10. Houston Ship Channel—Middle.
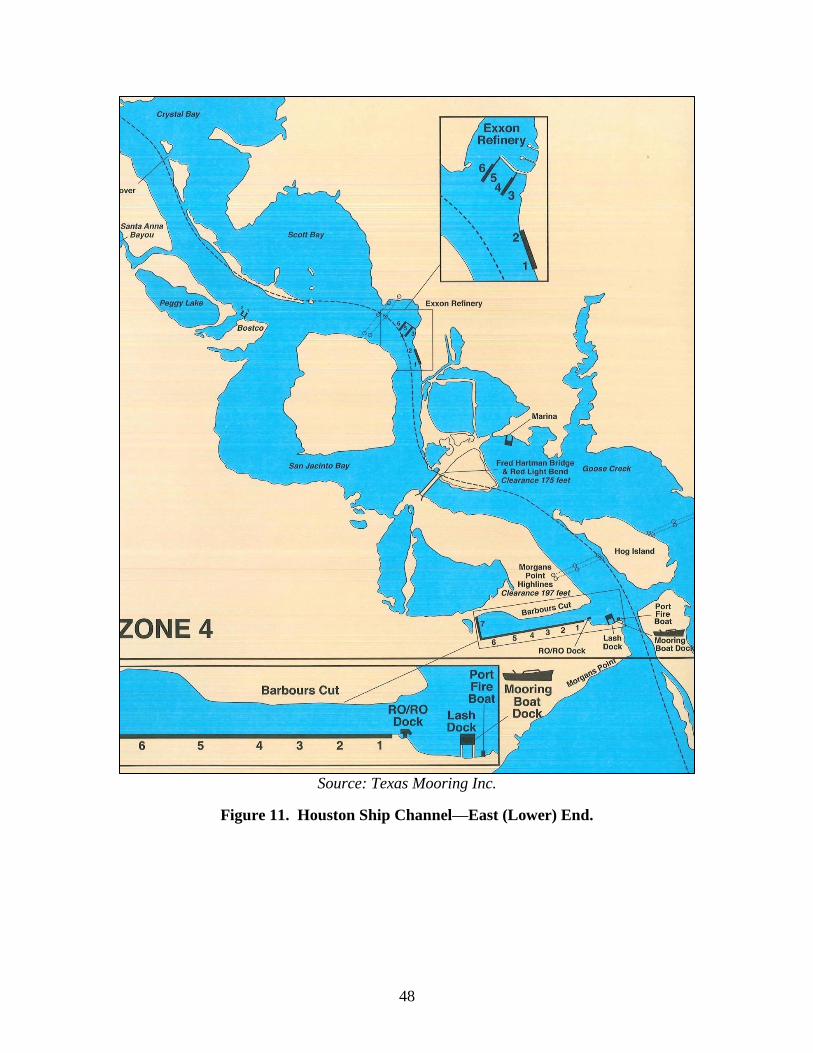
48
Source: Texas Mooring Inc.
Figure 11. Houston Ship Channel—East (Lower) End.
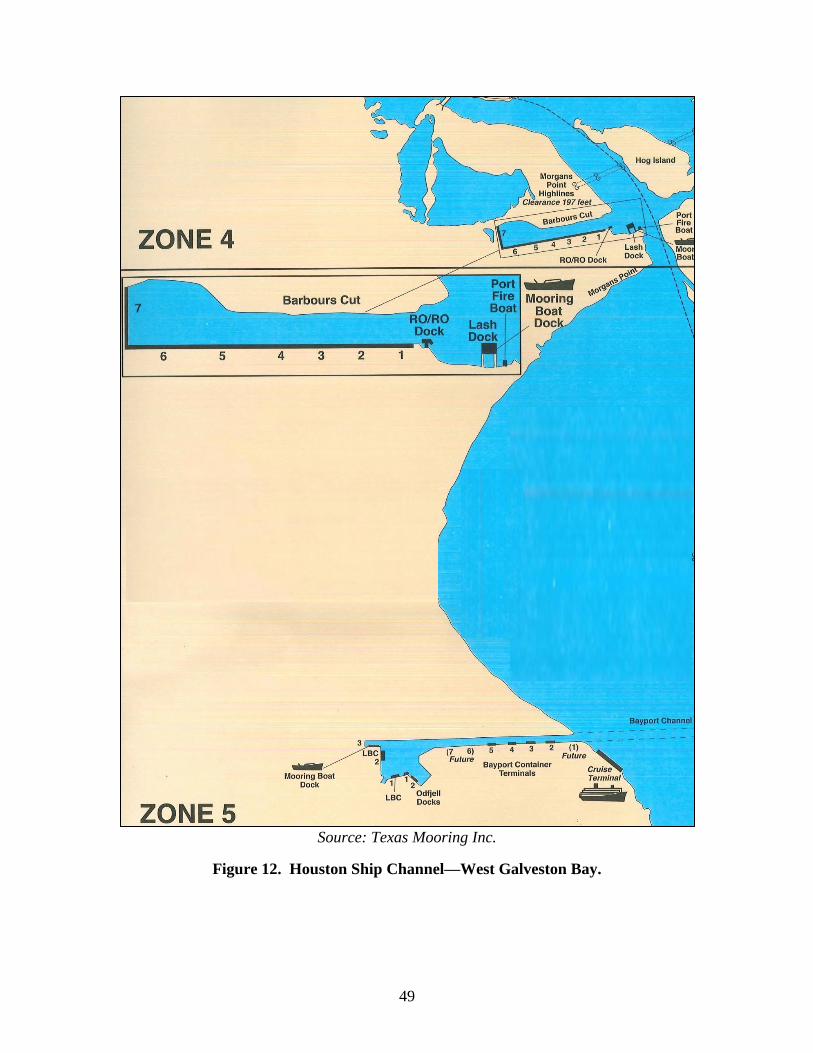
49
Source: Texas Mooring Inc.
Figure 12. Houston Ship Channel—West Galveston Bay.
50
APPENDIX B: CORPUS CHRISTI HARBORMASTER OPERATING PROCEDURES The following information was taken from email correspondence with the Port of Corpus
Christi’s Harbormaster Office.
When vessels are at anchor, traffic control will bring the ship in on a first-come, first-serve basis
provided the agent and terminal are ready and ask for the vessel to be brought in. If the agent is
not ready, the vessel is moved to the end of the list. Private docks make the decision as to what
vessel to bring in.
The traffic controller enters all the vessel information into the computer such as vessel name,
Lloyd’s Register identification number, tonnage, last port of call, and whether the cargo is
loading or unloading. If unloading cargo, the cargo’s point of origin is recorded. If the vessel is
loading, the cargo’s destination is recorded. Records are kept of how much cargo is coming and
going out of the Port of Corpus Christi. These records are kept at the port and are public records.
The refinery or terminal is notified that the vessel is due and confirms all information. The agent
will let traffic control know when he or she is ready to bring the vessel in. At this point, the
pilots, harbor tugs, and linehandlers are notified. The pilot, once on board the vessel, will give
the time of arrival at the bar to traffic control, and traffic control will notify the agent and
refinery of the actual time at the bar. Once again, the agent, linehandlers, security, refinery, and
any port user who would like to know when the vessel is coming in are contacted.
When traffic control has an incoming vessel and there is other traffic in the port or channel, it
must inform all tugs and pilots of the incoming vessel. The tugs and pilots will in turn
communicate with each other via radio about where they are and how they want to pass in the
channel. Cameras throughout the channel are used to monitor ships coming under the Harbor
Bridge and are also used to determine the number of barges and their configuration on the North
Bank, which is a staging area for barges. Cameras are also used frequently at Avery Point, the
Lift Bridge, and North Bank to know what traffic is moving in those areas. Any unreported
movements can then be monitored and redirected, if necessary.
The information required for ships, shifts, sailing, and barges varies slightly. Included below is a
general list.
Ships
In most instances, the agent will notify the Harbormaster’s Office a few days prior to the ship’s
arrival. Information to be submitted consists of the following:
Estimated time of arrival.
Cargo.
Last port of call.

51
Terminal.
Cargo destination or origin.
Linemen.
Harbor tugs.
Pilots and any other concerned persons.
Upon receiving the call, the initial record is made, and pilots, tugs, linemen, terminal personnel,
and all other interested partied are notified.
Shifts
The agent will notify the Harbormaster’s Office that his ship will be moving from one dock to
another (usually this is done prior to the ship’s arrival). The Harbormaster’s Office has the
responsibility of keeping up with the times the ship will be ready to shift. This is done every
three to four hours depending on the ship’s discharge or loading rates.
In this way, all persons involved will have up-to-date information. When the order is received
from the agent to move a ship, the Harbormaster’s Office will then call:
Pilots (and advise the pilot of all vessel traffic before he leaves the dock).
Linemen.
Harbor tugs.
Terminal.
Security (if on port docks).
Sailings
The Harbormaster’s Office is responsible for keeping track of the ship’s estimated time of
departure, but the agent is responsible for issuing a sailing order. The agent is required to give a
two-hour notice for sailing in order to get all parties to the vessel. All orders are to be handled
through the Harbormaster’s Office. When the order is received for a ship to sail, the
Harbormaster’s Office will then call:
Pilots.
Harbor tugs.
Linemen.
Security (if on port docks).
Terminal and other parties that need to be at the vessel on departure.
52
REFERENCES 1 Wijnolst, N., Kalverkamp, J.D., Doornbos, J.D., De Waart, J.A., Heijliger, R., and Waals, F.A.J. Innovation in
Chemicals Shipping, Port and Slops Management: Solving Not Shifting. Delft University Press, 1994.
http://repository.tudelft.nl/view/ir/uuid%3Ada2cdb04-5d1a-4b55-8b01-e78d9779cf22/. Accessed August 2015. 2 Waterborne Commerce of the United States, Calendar Year 2013, Part 2—Waterways and Harbors Gulf Coast,
Mississippi River System and Antilles. Waterborne Commerce Statistics Center, Institute for Water Resources,
U.S. Army Corps of Engineer, Alexandria, VA. http://www.navigationdatacenter.us/wcsc/pdf/wcusmvgc13.pdf.
Accessed August 2015. 3 This is the Canal. Panama Canal Authority. https://www.pancanal.com/eng/acp/asi-es-el-canal.html. Accessed
August 2015. 4 Overview. Port of Houston Authority. http://www.portofhouston.com/about-us/overview/. Accessed August 2015.
5 Meyers, R. “The petrochemical industry has billions in projects on tap, but not enough workers to build them.”
Fuel Fix (from the Houston Chronicle), April 2, 2015. http://fuelfix.com/blog/2015/04/02/the-petrochemical-
industry-has-billions-in-projects-on-tap-but-not-enough-workers-to-build-them/. Accessed August 2015. 6 Pickrell, E. “Exxon Mobil plans multibillion-dollar Baytown plant expansion.” Fuel Fix (from the Houston
Chronicle), March 5, 2013. http://fuelfix.com/blog/2013/03/05/exxon-mobil-plans-multibillion-dollar-baytown-
plant-expansion/. Accessed August 2015. 7 “A Brief Guide to Liquidated Damages.” The Shipping Law Blog. April 21, 2015.
http://www.theshippinglawblog.com/. Accessed August 2015. 8 Emissions Estimation Methodology for Ocean-Going Vessels, Appendix D. California Air Resources Board. May
2011. http://www.arb.ca.gov/regact/2011/ogv11/ogv11appd.pdf. Accessed August 2015. 9 Engineering Investigator’s Factual Report, Collision of the Bulk Carrier Summer Wind and the UTV Miss Susan
Pushing 2 Barges, DCA-14-FM-008. National Transportation Safety Board, Office of Marine Safety, Washington,
D.C., December 18, 2014. http://www.ntsb.gov/investigations/AccidentReports/Pages/MAR1501.aspx. Accessed
August 2015. 10
Kruse, C.J., and Protopapas, A. Analysis of Effects on Port Operations from March 22 Incident in Houston Ship
Channel, Report PRC 14-31-F. Texas A&M Transportation Institute Policy Research Center, October 2014.
http://d2dtl5nnlpfr0r.cloudfront.net/tti.tamu.edu/documents/PRC-14-31-F.pdf. Accessed August 2015. 11
Kruse, C.J. and Bierling, D.H. An Analysis of Harbor Master Positions in Cargo Ports. Texas A&M
Transportation Institute for the Port of Houston Authority, June 2008. 12
Doumas, A. Aligning the Operations of Barges and Terminals through Distributed Planning. Beta Research
School for Operations Management and Logistics, University of Twente, Entschede, the Netherlands, 2008.
http://doc.utwente.nl/60220/1/thesis_Douma%2C_Albert.pdf. Accessed August 2015.