Embed Size (px)
Citation preview

Air Quality TrendsAir Quality Trends
&&
Program UpdateProgram Update
Municipality of Anchorage DHHSMunicipality of Anchorage DHHS
Air Quality ProgramAir Quality Program
2013 2013

2012 Budget = $475k ($323k local match)2012 Budget = $475k ($323k local match)
2013 Budget = $255k ($102k local match)2013 Budget = $255k ($102k local match)
--
2012 2012 –– 5 AQ Program Staff = 4.25 FTE 5 AQ Program Staff = 4.25 FTE
2013 2013 –– 3 AQ Program Staff = 2.65 FTE 3 AQ Program Staff = 2.65 FTE
--
2012 2012 –– 5 sites (4 CO, 4 PM10, 3 PM2.5, 1 ozone)5 sites (4 CO, 4 PM10, 3 PM2.5, 1 ozone)
2013 2013 –– 4 sites (2 CO, 3 PM10, 2 PM2.5)4 sites (2 CO, 3 PM10, 2 PM2.5)
AQ Program CutsAQ Program Cuts

Pollutants Pollutants
�� COCO
�� PMPM2.52.5 –– fine particulate (smoke & soot)fine particulate (smoke & soot)
�� PMPM1010 –– coarse particulate (road dust)coarse particulate (road dust)
�� OzoneOzone
�� Air Toxics Air Toxics –– VOC, PAH (nonVOC, PAH (non--criteria)criteria)
�� PollenPollen (non(non--criteria)criteria)


CO Program Status CO Program Status
�� IM program terminated March 2012 IM program terminated March 2012
�� 2 CO sites closed, 2 CO sites closed,
2 remain: Turnagain, Airport Heights 2 remain: Turnagain, Airport Heights
�� CO LMP sent to EPA CO LMP sent to EPA –– March 2013 March 2013
-- Valid for SIP plan conformity after 90 daysValid for SIP plan conformity after 90 days
-- EPA has 18 mo for full reviewEPA has 18 mo for full review

0.0
5.0
10.0
15.0
20.0
25.0
30.0
1980 1985 1990 1995 2000 2005 2010
2n
d m
ax
8-h
r a
ve
rag
e (
pp
m)
CO NAAQS = 9 ppm
1996

PM2.5 Monitoring PM2.5 Monitoring
�� Neighborhood monitoringNeighborhood monitoring
�� Peak PM2.5 conc. in recent years is about Peak PM2.5 conc. in recent years is about
2/3 of NAAQS2/3 of NAAQS
�� No clear data trend No clear data trend
�� Study shows ~60% is from wood burningStudy shows ~60% is from wood burning
�� Fairbanks is cautionary tale:Fairbanks is cautionary tale:
Increased wood burning and use of Increased wood burning and use of OWBsOWBs
could lead to rise in PM2.5could lead to rise in PM2.5

12.2
20.0
15.8 16.0
31.9
17.9
26.9
14.0
25.0
23.0
17.4
26.4
6.8
17.2
6.9 6.34.9
5.57.2
6.25.2
7.05.96.06.15.4
0
5
10
15
20
25
30
35
40
2000 2001 2002 2003 2004 2005 2006 2007 2008 2009 2010 2011 2012
PM
2.5
(u
g/m
3)
98th percentile of daily 24-hour average
annual average
24-hr PM2.5 NAAQS
Annual Average PM2.5 NAAQS
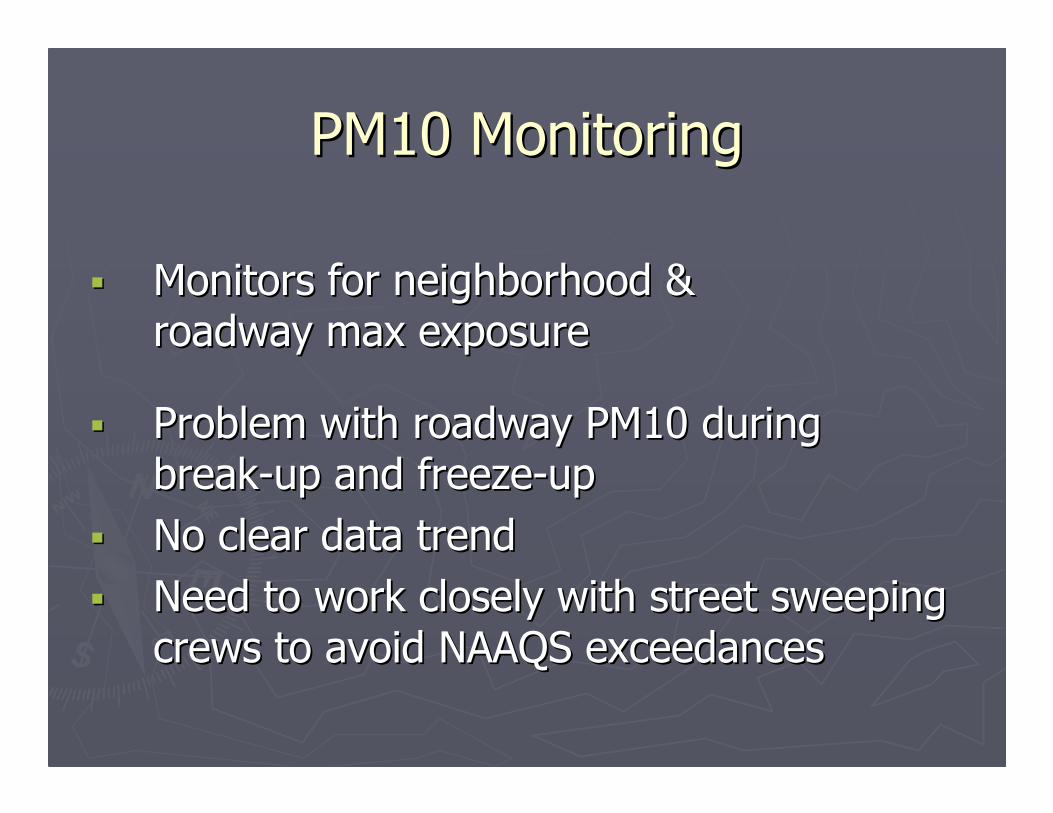
PM10 Monitoring PM10 Monitoring
�� Monitors for neighborhood & Monitors for neighborhood &
roadway max exposureroadway max exposure
�� Problem with roadway PM10 during Problem with roadway PM10 during
breakbreak--up and freezeup and freeze--upup
�� No clear data trend No clear data trend
�� Need to work closely with street sweeping Need to work closely with street sweeping
crews to avoid NAAQS exceedancescrews to avoid NAAQS exceedances

PM10 - 1st & 2nd Max Values
0
100
200
300
400
500
600
2000
2001
2002
2003
2004
2005
2006
2007
2008
2009
2010
2011
2012
2013
Tudor 2nd Max
Eagle R 2nd Max
Tudor 1st Max
Eagle R 1st Max
NAAQS = 155 ug/m3

Ozone Monitoring (suspended)Ozone Monitoring (suspended)
� Max OO33 measurements well below NAAQS
� O3 in Anc. consistently lower than Denali NPAnc. consistently lower than Denali NP
�� EPA concurs, Anchorage may suspend EPA concurs, Anchorage may suspend O3
monitoring.
� ADEC continues O3 monitoring in Wasilla.

7-day Moving Average of
8-hr Daily Maximum
0.0
10.0
20.0
30.0
40.0
50.0
60.0
7-A
pr21
-Apr
5-M
ay19
-May
2-Ju
n
16-J
un
30-J
un
14-J
ul28-
Jul
11-A
ug25
-Aug
8-S
ep22-
Sep
6-O
ct20
-Oct
ozone (
ppb)
Garden Parkgate Denali

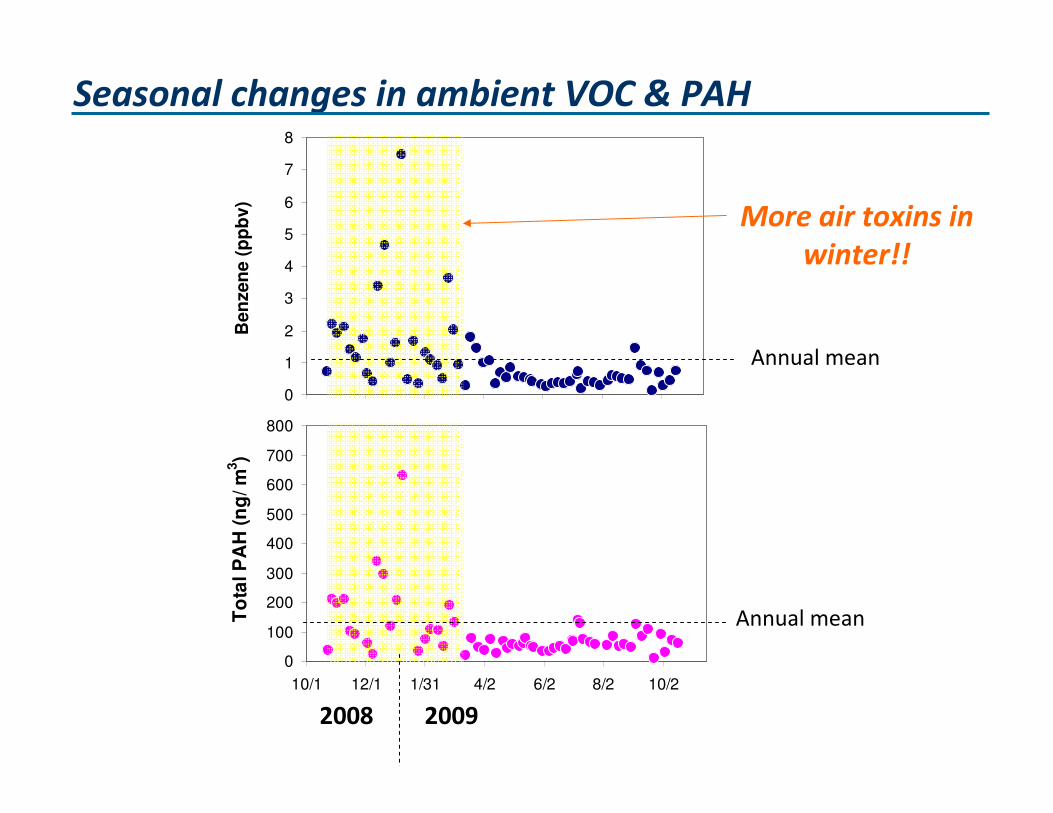
Air ToxicsAir Toxics
� Last study: 2008/2009
Mean ambient Benzene = 1.06 ppb
Mean indoor benzene = 7.4 ppb
� MSAT-2 Benzene study 2012/2013
repeating quarterly gasoline sampling & ambient benzene monitoring for 1 year.
0
1
2
3
4
5
6
7
8
10/1 12/1 1/31 4/2 6/2 8/2 10/2
Date
Ben
zen
e (
pp
bv)
0
100
200
300
400
500
600
700
800
10/1 12/1 1/31 4/2 6/2 8/2 10/2
To
tal P
AH
(n
g/ m
3)
Seasonal changes in ambient VOC & PAH
More air toxins in
winter!!
20092008
Annual mean
Annual mean

Seasonal Benzene Variation Measured in
Anchorage Homes and their Attached Garages
0
10
20
30
40
50
60
Oct Nov Dec Jan Feb Mar Apr May Jun Jul Aug Sep
Benzene C
oncentr
ation (
ppb)
House
Garage