Embed Size (px)
Citation preview

Governance Other InformationFinancial StatementsStrategic Report
1 Our opinion is unmodified We have audited the financial statements of British American Tobacco p.l.c. (“the Company”) for the year ended 31 December 2018 which comprise the Group Income Statement, the Group Statement of Comprehensive Income, the Group and parent Company Statement of Changes in Equity, the Group and parent Company Balance Sheets, the Group Cash Flow Statements and the related notes, including accounting policies in note 1.
In our opinion:
– the financial statements give a true and fair view of the state of the Group’s and of the parent Company’s affairs as at 31 December 2018 and of the Group’s profit for the year then ended;
– the Group financial statements have been properly prepared in accordance with International Financial Reporting Standards as adopted by the European Union (IFRSs as adopted by the EU);
– the parent Company financial statements have been properly prepared in accordance with UK accounting standards, including FRS 101 Reduced Disclosure Framework; and
– the financial statements have been prepared in accordance with the requirements of the Companies Act 2006 and, as regards the Group financial statements, Article 4 of the IAS Regulation.
Additional opinion in relation to IFRSs as issued by the IASBAs explained in the note to the Group financial statements, the Group, in addition to complying with its legal obligation to apply IFRSs as adopted by the EU, has also applied IFRSs as issued by the International Accounting Standards Board (IASB).
In our opinion, the Group financial statements have been properly prepared in accordance with IFRSs as issued by the IASB.
Basis for opinion We conducted our audit in accordance with International Standards on Auditing (UK) (“ISAs (UK)”) and applicable law. Our responsibilities are described below. We believe that the audit evidence we have obtained is a sufficient and appropriate basis for our opinion. Our audit opinion is consistent with our report to the Audit Committee.
We were first appointed as auditor by the Directors on 23 March 2015. The period of total uninterrupted engagement is for the 4 financial years ended 31 December 2018. We have fulfilled our ethical responsibilities under, and we remain independent of the Group in accordance with, UK ethical requirements including the FRC Ethical Standard as applied to listed public interest entities. No non-audit services prohibited by that standard were provided.
2 Key audit matters: our assessment of risks of material misstatement Key audit matters are those matters that, in our professional judgment, were of most significance in the audit of the financial statements and include the most significant assessed risks of material misstatement (whether or not due to fraud) identified by us, including those which had the greatest effect on: the overall audit strategy; the allocation of resources in the audit; and directing the efforts of the engagement team. We summarise below the key audit matters, in decreasing order of audit significance, in arriving at our audit opinion above, together with our key audit procedures to address those matters and, as required for public interest entities, our results from those procedures. These matters were addressed, and our results are based on procedures undertaken in the context of, and solely for the purpose of, our audit of the financial statements as a whole, and in forming our opinion thereon, and consequently are incidental to that opinion. We do not provide a separate opinion on these matters.
Litigations and contingent liabilities Refer to page 65 (Audit Committee report), page 133 (accounting policy) and pages 192 to 211 (financial disclosures).
The risk:Dispute outcome: The Group is subject to a large volume of claims including class actions, which could have a significant impact on the results if the potential exposures were to materialise. For our 2018 audit we believe the most significant risk relates to ongoing smoking and health litigation brought against the operating Company by the province of Quebec, Canada, which is disclosed in note 28 – contingent liabilities and financial commitments and due to be ruled on by the Quebec Court of Appeal imminently. This assessment is consistent with our 2017 audit.
The amounts involved are significant, and the application of accounting standards to determine the amount, if any, to be provided as a liability or disclosed as a contingent liability, is inherently subjective. This includes assumptions relating to the likelihood and/or timing of cash outflows from the business and the interpretation of preliminary and pending court rulings.
The effect of these matters is that, as part of our risk assessment, we determined that the potential exposure to litigation has a high degree of judgement, with a potential range of reasonable outcomes greater than our materiality for the financial statements as a whole, and possibly many times that amount.
Our procedures included:– Control design and operation: Evaluating the processes and controls over litigations operated by Management at Group, regional and local
level through regular meetings with in-house legal counsel and review of Board and sub-committee meeting minutes;
– Enquiry of lawyers: Assessing the status of cases through inspection of written confirmations from the Group’s external counsel, correspondence between the Group and their external counsel and discussions with and representations from in-house counsel
Independent auditor’s reportto the members of British American Tobacco p.l.c. only@
115BAT Annual Report and Form 20-F 2018

Financial Statements
Independent auditor’s reportto the members of British American Tobacco p.l.c. only@ continued
– Our legal expertise: With the assistance of KPMG legal specialists of the Canadian component audit team, we assessed the relevant historical and recent judgments passed by the judicial court authorities in relation to the Quebec, Canada litigation, as well as the written confirmations of current status from external counsel, in order to challenge the basis used for the accounting treatment and resulting disclosures; and
– Assessing transparency: Assessing whether the Group’s disclosures in note 28 regarding contingent liabilities and financial commitments adequately disclose the relevant facts and circumstances and potential liabilities of the Group.
Our results:From the evidence obtained, we found the Group’s treatment of the litigation and contingent liabilities and related disclosures to be acceptable.
Goodwill and indefinite lived intangibles impairment – arising from the Reynolds American Inc. acquisition in 2017. New 2018 risk. Refer to page 66 (Audit Committee report), page 130 (accounting policy) and pages 151 and 152 (financial disclosures)
The risk: Subjective valuation: As a result of the acquisition of Reynolds American Inc. in 2017, the Group, as at 31 December 2018 has goodwill and indefinite lived intangibles of £35,337 million and £73,885 million, respectively (2017: goodwill of £34,280 million and indefinite lived intangibles of £69,562 million).
There is significant judgement with regard to assumptions and estimates involved in the forecasting of future cash flows, which form the basis of the assessment of the recoverability of the goodwill and indefinite lived intangible assets. The key assumption included is the forecast revenue growth rate, which is dependent on macro and micro-economic factors, as well as potential regulatory change in the US.
The effect of these matters is that, as part of our risk assessment, we determined that the value in use of calculations of both the goodwill and the indefinite lived intangible assets has a high degree of estimation uncertainty, with a potential range of reasonable outcomes greater than our materiality for the financial statements as a whole, and possibly many times that amount. The financial statements (note 9) disclose the sensitivity of the carrying amounts of the Goodwill estimated by the Group.
Our procedures included: – Control design and operation: Assessing the US operating Company’s budgeting processes and controls as well as the review and approval
procedures upon which the cash flow forecasts are based for each of the individual brands recognised as indefinite lived intangibles and for the overall operating Company as it pertains to the associated goodwill.
– Assessing assumptions: Critically assessing the Group’s assertion not to include any impact of the potential menthol ban into the cash flow forecast or the discount rate by inspecting the US operating Company’s correspondence with external counsel, inspecting analyst and industry reports, and by inspecting scientific studies and representations from in-house counsel with regard to the likelihood, timing, nature and extent of proposed potential regulatory changes to the US market.
– Benchmarking assumptions: Comparing the US operating Company’s revenue growth and terminal growth assumptions to externally derived publicly and privately available data, including, but not limited to, broker and analyst reports, industry reports, macro-economic assumptions, and academic and scientific studies.
– Historical comparisons: Challenging the reasonableness of the assumptions, particularly forecast revenue, by assessing the historical accuracy of the Group’s forecasting at a brand level for each of the indefinite lived intangibles and at a cash generating unit level for the goodwill.
– Sensitivity analysis: Performing breakeven analysis on the assumptions noted above.
– Assessing transparency: Assessing whether the Group’s disclosures detailing the key estimates and judgements with regard to the impairment testing of the goodwill and indefinite lived intangibles arising from the acquisition of Reynolds American Inc.
Our results:We found the Directors assessment of the estimate of the recoverability of the goodwill and indefinite lived intangibles arising from the acquisition of Reynolds American Inc. to be acceptable (2017: acceptable).
Recoverability of parent Company’s investment in subsidiaries. Refer to page 248 (accounting policy) and page 249 (financial disclosures)
Low risk, high value: The carrying amount of the Parent Company’s investments in subsidiaries is £27,901 million (2017: £27,898 million) which represents 77% (2017: 77%) of the Company’s total assets. Their recoverability is not a high risk of significant misstatement or subject to significant judgement.
However, due to their materiality in the context of the Parent Company financial statements, this is considered to be the area that had the greatest effect on our overall Parent Company audit.
Our procedures included:– Tests of detail: Comparing the carrying amount of a sample of the highest value investments, representing 100% (2017: 98%) of the total
investment balance with the relevant subsidiaries’ draft balance sheet to identify whether their net assets, being an approximation of their minimum recoverable amount, were in excess of their carrying amount and assessing whether those subsidiaries have historically been profit-making.
– Assessing subsidiary audits: Assessing the audit work performed over the subsidiaries and considering the results of that work, on those subsidiaries’ profits and net assets.
Our results:We found the Directors assessment of the recoverability of the investment in subsidiaries to be acceptable.
116 BAT Annual Report and Form 20-F 2018
Governance Other InformationFinancial StatementsStrategic Report
3 Our application of materiality and an overview of the scope of our audit Materiality for the Group financial statements as a whole was set at £420 million (2017: £330 million), determined with reference to a benchmark of Group profit before taxation. This represents 4.8% (2017: 4.8%) of the Group’s reported profit before taxation. Materiality for the parent Company financial statements as a whole was set at £50m (2017: £35m) by reference to component materiality. This is lower than the materiality we would otherwise have determined by reference to Company net assets.
We agreed to report to the Audit Committee any corrected or uncorrected identified misstatements exceeding £20 million (2017: £16 million) in addition to other identified misstatements that warranted reporting on qualitative grounds.
Scope of our auditThe Group operates three shared service centres (2017: three) in Romania, Malaysia and Costa Rica, the outputs of which are included in the financial information of the reporting components they service and therefore they are not separate reporting components. Each of the service centres is subject to specified risk-focused audit procedures, predominantly the testing of transaction processing and review controls. Additional procedures are performed at certain reporting components to address the audit risks not covered by the work performed over the shared service centres.
We performed audits for Group reporting purposes of 23 components (2017: 35 components).One of these components was the Parent Company. Audits of these components were performed using materiality levels assigned by the group audit team, which were lower than the materiality level for the Group as a whole, ranging from £35 million to £220 million (2017: £1 million to £200 million), and determined by reference to the size and risk profile of the components.
Audits of one or more account balances were performed in respect of a further 14 components (2017: 20), using a materiality ranging from £1 million to £50 million (2017: £1 to 35 million) assigned by the Group audit team. Specified risk-focused audit procedures have been performed at 2 components (2017: 5) in relation to tax exposures and financing, using a materiality of £35 million. These 16 components for which we performed work other than audits for group reporting purposes were not individually significant but were included in the scope of our Group reporting work in order to provide further coverage over the Group’s results. This is consistent with the approach that was adopted in 2017.
The work on 32 of the 39 components (2017: 54 of the 60 components) was performed by component auditors and the rest, including the audit of the Parent Company, was performed by the Group team.
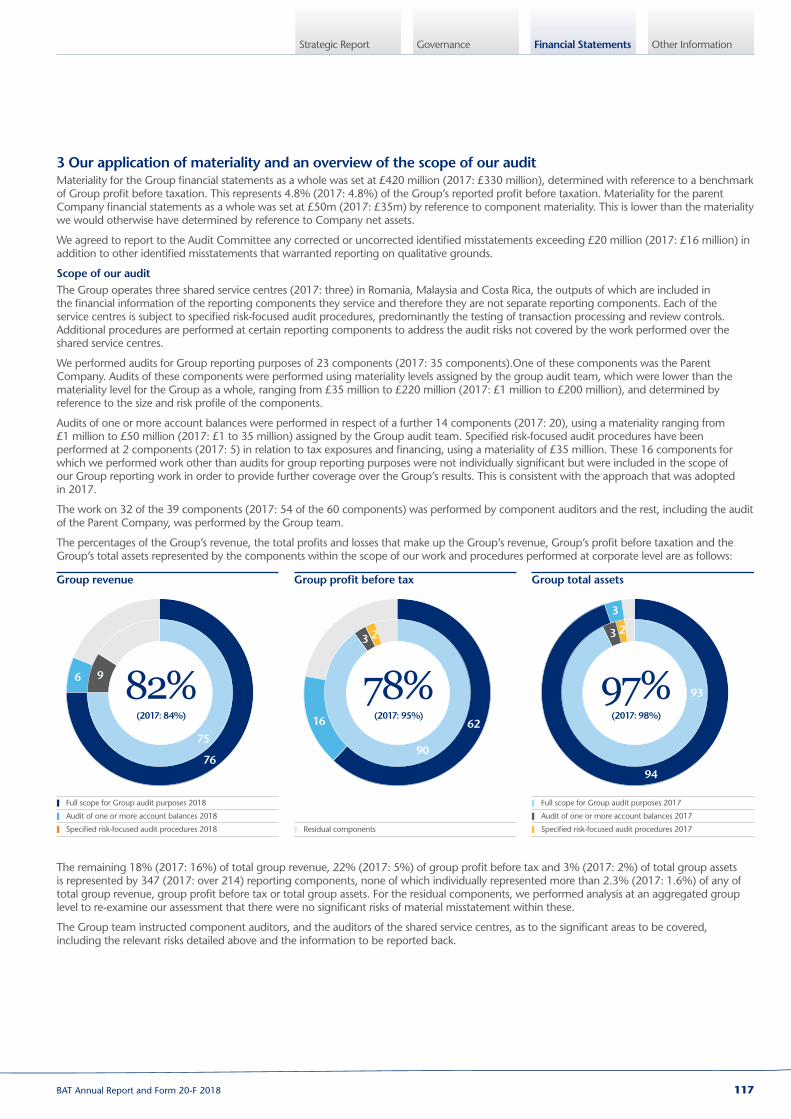
The percentages of the Group’s revenue, the total profits and losses that make up the Group’s revenue, Group’s profit before taxation and the Group’s total assets represented by the components within the scope of our work and procedures performed at corporate level are as follows:
Group revenue Group profit before tax Group total assets
Full scope for Group audit purposes 2018
Audit of one or more account balances 2018
Specified risk-focused audit procedures 2018
Full scope for Group audit purposes 2017
Audit of one or more account balances 2017
Residual components Specified risk-focused audit procedures 2017
76
6
75
9
62
90
16
3
23
97%(2017: 98%)
82%(2017: 84%)
78%(2017: 95%)
94
23
93
The remaining 18% (2017: 16%) of total group revenue, 22% (2017: 5%) of group profit before tax and 3% (2017: 2%) of total group assets is represented by 347 (2017: over 214) reporting components, none of which individually represented more than 2.3% (2017: 1.6%) of any of total group revenue, group profit before tax or total group assets. For the residual components, we performed analysis at an aggregated group level to re-examine our assessment that there were no significant risks of material misstatement within these.
The Group team instructed component auditors, and the auditors of the shared service centres, as to the significant areas to be covered, including the relevant risks detailed above and the information to be reported back.
117BAT Annual Report and Form 20-F 2018

Financial Statements
Independent auditor’s reportto the members of British American Tobacco p.l.c. only@ continued
The Group team visited two (2017: three) component locations in Canada and the United States (2017: Brazil, Canada and the United States) for the purpose of performing detailed file reviews. In addition, the Group team visited the shared service centres in Costa Rica, Malaysia and Romania (2017: Costa Rica, Malaysia and Romania) as well as visiting a further three (2017: three) component locations in Bangladesh, South Africa and Italy (2017: The Netherlands, Poland and South Korea) for business understanding and risk assessment purposes. In addition the Group audit team held audit risk planning and strategy conferences in the United Kingdom which component auditors attended. Further to these visits and conferences, the Group team also held telephone and/or online meetings as part of the audit planning phase to explain our audit instructions and discuss the component auditors’ plans as well as performing detailed remote file reviews upon completion of the component auditors’ engagements. The findings reported to the Group audit team were discussed in more detail, and any further work required by the Group team was then performed by the component auditor.
4 We have nothing to report on going concern The Directors have prepared the financial statements on the going concern basis as they do not intend to liquidate the Company or the Group or to cease their operations, and as they have concluded that the Company’s and the Group’s financial position means that this is realistic. They have also concluded that there are no material uncertainties that could have cast significant doubt over their ability to continue as a going concern for at least a year from the date of approval of the financial statements (“the going concern period”).
Our responsibility is to conclude on the appropriateness of the Directors’ conclusions and, had there been a material uncertainty related to going concern, to make reference to that in this audit report. However, as we cannot predict all future events or conditions and as subsequent events may result in outcomes that are inconsistent with judgements that were reasonable at the time they were made, the absence of reference to a material uncertainty in this auditor’s report is not a guarantee that the Group and the Company will continue in operation.
In our evaluation of the Directors’ conclusions, we considered the inherent risks to the Group’s and Company’s business model and analysed how those risks might affect the Group’s and Company’s financial resources or ability to continue operations over the going concern period. The risks that we considered most likely to adversely affect the Group’s and Company’s available financial resources over this period were:
– The enactment of regulation that significantly impairs the Group’s ability to communicate, differentiate, market or launch its products
– Product liability, regulatory or other significant cases may be lost or compromised resulting in a material loss or other consequence
As these were risks that could potentially cast significant doubt on the Group’s and the Company’s ability to continue as a going concern, we considered sensitivities over the level of available financial resources indicated by the Group’s financial forecasts taking account of reasonably possible (but not unrealistic) adverse effects that could arise from these risks individually and collectively, and evaluated the achievability of the actions the Directors consider they would take to improve the position should the risks materialise. We also considered less predictable but realistic second order impacts, such as the impact of Brexit and the erosion of customer or supplier confidence, which could result in a rapid reduction of available financial resources.
Based on this work, we are required to report to you if:
– we have anything material to add or draw attention to in relation to the directors’ statement in Note 1 to the financial statements on the use of the going concern basis of accounting with no material uncertainties that may cast significant doubt over the Group and Company’s use of that basis for a period of at least twelve months from the date of approval of the financial statements; or
– the related statement under the Listing Rules set out on page 42 is materially inconsistent with our audit knowledge.
We have nothing to report in these respects, and we did not identify going concern as a key audit matter.
5 We have nothing to report on the other information in the Annual Report The Directors are responsible for the other information presented in the Annual Report together with the financial statements. Our opinion on the financial statements does not cover the other information and, accordingly, we do not express an audit opinion or, except as explicitly stated below, any form of assurance conclusion thereon.
Our responsibility is to read the other information and, in doing so, consider whether, based on our financial statements audit work, the information therein is materially misstated or inconsistent with the financial statements or our audit knowledge. Based solely on that work we have not identified material misstatements in the other information.
Strategic report and Directors’ report Based solely on our work on the other information:
– we have not identified material misstatements in the strategic report and the directors’ report;
– in our opinion the information given in those reports for the financial year is consistent with the financial statements; and
– in our opinion those reports have been prepared in accordance with the Companies Act 2006.
Directors’ remuneration report In our opinion the part of the Directors’ Remuneration Report to be audited has been properly prepared in accordance with the Companies Act 2006.
118 BAT Annual Report and Form 20-F 2018

Governance Other InformationFinancial StatementsStrategic Report
Disclosures of principal risks and longer‑term viability Based on the knowledge we acquired during our financial statements audit, we have nothing material to add or draw attention to in relation to:
– the Directors’ confirmation within the viability statement on page 48 that they have carried out a robust assessment of the principal risks facing the Group, including those that would threaten its business model, future performance, solvency and liquidity;
– the Principal Group risk factors disclosures describing these risks and explaining how they are being managed and mitigated; and
– the Directors’ explanation in the viability statement of how they have assessed the prospects of the Group, over what period they have done so and why they considered that period to be appropriate, and their statement as to whether they have a reasonable expectation that the Group will be able to continue in operation and meet its liabilities as they fall due over the period of their assessment, including any related disclosures drawing attention to any necessary qualifications or assumptions.
Under the Listing Rules we are required to review the principle group risk factors. We have nothing to report in this respect.
Our work is limited to assessing these matters in the context of only the knowledge acquired during our financial statements audit. As we cannot predict all future events or conditions and as subsequent events may result in outcomes that are inconsistent with judgments that were reasonable at the time they were made, the absence of anything to report on these statements is not a guarantee as to the Group’s and the Parent Company’s longer-term viability.
Corporate governance disclosures We are required to report to you if:
– we have identified material inconsistencies between the knowledge we acquired during our financial statements audit and the Directors’ statement that they consider that the annual report and financial statements taken as a whole is fair, balanced and understandable and provides the information necessary for shareholders to assess the Group’s position and performance, business model and strategy; or
– the section of the annual report describing the work of the Audit Committee does not appropriately address matters communicated by us to the Audit Committee.
We are required to report to you if the Corporate Governance Statement does not properly disclose a departure from the eleven provisions of the UK Corporate Governance Code specified by the Listing Rules for our review.
We have nothing to report in these respects.
6 We have nothing to report on the other matters on which we are required to report by exception Under the Companies Act 2006, we are required to report to you if, in our opinion:
– adequate accounting records have not been kept by the parent Company, or returns adequate for our audit have not been received from branches not visited by us; or
– the parent Company financial statements and the part of the Directors’ Remuneration Report to be audited are not in agreement with the accounting records and returns; or
– certain disclosures of directors’ remuneration specified by law are not made; or
– we have not received all the information and explanations we require for our audit.
We have nothing to report in these respects.
119BAT Annual Report and Form 20-F 2018

Financial Statements
7 Respective responsibilities Directors’ responsibilities As explained more fully in their statement set out on page 114, the directors are responsible for: the preparation of the financial statements including being satisfied that they give a true and fair view; such internal control as they determine is necessary to enable the preparation of financial statements that are free from material misstatement, whether due to fraud or error; assessing the Group and Parent Company’s ability to continue as a going concern, disclosing, as applicable, matters related to going concern; and using the going concern basis of accounting unless they either intend to liquidate the Group or the Parent Company or to cease operations, or have no realistic alternative but to do so.
Auditor’s responsibilities Our objectives are to obtain reasonable assurance about whether the financial statements as a whole are free from material misstatement, whether due to fraud or other irregularities (see below), or error, and to issue our opinion in an auditor’s report. Reasonable assurance is a high level of assurance, but does not guarantee that an audit conducted in accordance with ISAs (UK) will always detect a material misstatement when it exists. Misstatements can arise from fraud, other irregularities or error and are considered material if, individually or in aggregate, they could reasonably be expected to influence the economic decisions of users taken on the basis of the financial statements.
A fuller description of our responsibilities is provided on the FRC’s website at www.frc.org.uk/auditorsresponsibilities.
Irregularities – ability to detectWe identified areas of laws and regulations that could reasonably be expected to have a material effect on the financial statements from our general commercial and sector experience and through discussion with the Directors and other management (as required by auditing standards), and from inspection of the Group’s regulatory and legal correspondence and discussed with the Directors and other management the policies and procedures regarding compliance with laws and regulations. We communicated identified laws and regulations throughout our team and remained alert to any indications of non-compliance throughout the audit. This included communication from the Group audit team to component audit teams of relevant laws and regulations identified at group level.
The potential effect of these laws and regulations on the financial statements varies considerably.
Firstly, the Group is subject to laws and regulations that directly affect the financial statements including financial reporting legislation (including related companies legislation), distributable profits legislation and taxation legislation and we assessed the extent of compliance with these laws and regulations as part of our procedures on the related financial statement items.
Secondly, the Group is subject to many other laws and regulations where the consequences of non-compliance could have a material effect on amounts or disclosures in the financial statements, for instance through the imposition of fines or litigation or the loss of the Group’s licence to operate. We identified the following areas as those most likely to have such an effect: impact of laws and regulations related to anti-bribery and corruption (reflecting the legislative environment of operating with a diverse geographic footprint) and tobacco control and product liability (reflecting the nature of the operating businesses). Auditing standards limit the required audit procedures to identify non-compliance with these laws and regulations to enquiry of the directors and other management and inspection of regulatory and legal correspondence, if any. These limited procedures did not identify actual or suspected non-compliance. Further details in respect of tobacco control and product liability is set out in the key audit matter disclosures in section 2 of this report.
Owing to the inherent limitations of an audit, there is an unavoidable risk that we may not have detected some material misstatements in the financial statements, even though we have properly planned and performed our audit in accordance with auditing standards. For example, the further removed non-compliance with laws and regulations (irregularities) is from the events and transactions reflected in the financial statements, the less likely the inherently limited procedures required by auditing standards would identify it. In addition, as with any audit, there remained a higher risk of non-detection of irregularities, as these may involve collusion, forgery, intentional omissions, misrepresentations, or the override of internal controls. We are not responsible for preventing non-compliance and cannot be expected to detect non-compliance with all laws and regulations.
8 The purpose of our audit work and to whom we owe our responsibilities This report is made solely to the Company’s members, as a body, in accordance with Chapter 3 of Part 16 of the Companies Act 2006 and terms of our engagement by the Company. Our audit work has been undertaken so that we might state to the Company’s members those matters we are required to state to them in an auditor’s report and further matters we are required to state to them in accordance with terms agreed with the Company, and for no other purpose. To the fullest extent permitted by law, we do not accept or assume responsibility to anyone other than the Company and the Company’s members, as a body, for our audit work, for this report, or for the opinions we have formed.
Mark Baillache (Senior Statutory Auditor) For and on behalf of KPMG LLP, Statutory AuditorChartered Accountants 15 Canada Square London E14 5GL
27 February 2019
Independent auditor’s reportto the members of British American Tobacco p.l.c. only@ continued
120 BAT Annual Report and Form 20-F 2018

Governance Other InformationFinancial StatementsStrategic Report
to the Stockholders and Board of Directors of British American Tobacco p.l.c.»
Report of Independent Registered Public Accounting Firm
Opinions on the Consolidated Financial Statements and Internal Control Over Financial ReportingWe have audited the accompanying Group Balance Sheets of British American Tobacco and subsidiaries (the “Group”) as of December 31, 2018 and 2017, the related Group Income statement, Group Statement of Comprehensive Income, Group Statement of Changes in Equity, and Group Cash Flow Statement for each of the years in the three-year period ended December 31, 2018 and the related notes (collectively, the Group’s “consolidated financial statements”). We also have audited the Group’s internal control over financial reporting as of December 31, 2018, based on criteria established in Internal Control – Integrated Framework (2013) issued by the Committee of Sponsoring Organizations of the Treadway Commission.
In our opinion, the consolidated financial statements referred to above present fairly, in all material respects, the financial position of the Group as of December 31, 2018 and 2017, and the results of its operations and its cash flows for each of the years in the three-year period ended December 31, 2018, in conformity with International Financial Reporting Standards (IFRS) as issued by the International Accounting Standards Board and in conformity with IFRS as adopted by the European Union. Also in our opinion, the Group maintained, in all material respects, effective internal control over financial reporting as of December 31, 2018 based on criteria established in Internal Control – Integrated Framework (2013) issued by the Committee of Sponsoring Organizations of the Treadway Commission.
Basis for OpinionsThe Group’s management is responsible for these consolidated financial statements, for maintaining effective internal control over financial reporting, and for its assessment of the effectiveness of internal control over financial reporting, included in the accompanying Management’s report on internal control over financial reporting. Our responsibility is to express an opinion on the Group’s consolidated financial statements and an opinion on the Group’s internal control over financial reporting based on our audits. We are a public accounting firm registered with the Public Company Accounting Oversight Board (United States) (PCAOB) and are required to be independent with respect to the Group in accordance with the U.S. federal securities laws and the applicable rules and regulations of the Securities and Exchange Commission and the PCAOB.
We conducted our audits in accordance with the standards of the PCAOB. Those standards require that we plan and perform the audits to obtain reasonable assurance about whether the consolidated financial statements are free of material misstatement, whether due to error or fraud, and whether effective internal control over financial reporting was maintained in all material respects.
Our audits of the consolidated financial statements included performing procedures to assess the risks of material misstatement of the consolidated financial statements, whether due to error or fraud, and performing procedures that respond to those risks. Such procedures included examining, on a test basis, evidence regarding the amounts and disclosures in the consolidated financial statements. Our audits also included evaluating the accounting principles used and significant estimates made by management, as well as evaluating the overall presentation of the consolidated financial statements. Our audit of internal control over financial reporting included obtaining an understanding of internal control over financial reporting, assessing the risk that a material weakness exists, and testing and evaluating the design and operating effectiveness of internal control based on the assessed risk. Our audits also included performing such other procedures as we considered necessary in the circumstances. We believe that our audits provide a reasonable basis for our opinions.
Definition and Limitations of Internal Control Over Financial Reporting A company’s internal control over financial reporting is a process designed to provide reasonable assurance regarding the reliability of financial reporting and the preparation of financial statements for external purposes in accordance with generally accepted accounting principles. A company’s internal control over financial reporting includes those policies and procedures that (1) pertain to the maintenance of records that, in reasonable detail, accurately and fairly reflect the transactions and dispositions of the assets of the company; (2) provide reasonable assurance that transactions are recorded as necessary to permit preparation of financial statements in accordance with generally accepted accounting principles, and that receipts and expenditures of the company are being made only in accordance with authorizations of management and directors of the company; and (3) provide reasonable assurance regarding prevention or timely detection of unauthorized acquisition, use, or disposition of the company’s assets that could have a material effect on the financial statements.
Because of its inherent limitations, internal control over financial reporting may not prevent or detect misstatements. Also, projections of any evaluation of effectiveness to future periods are subject to the risk that controls may become inadequate because of changes in conditions, or that the degree of compliance with the policies or procedures may deteriorate.
We have served as the Group’s auditor since 2015.
KPMG LLPLondon, United Kingdom
27 February, 2019
121BAT Annual Report and Form 20-F 2018

Financial Statements
Group Income Statement
For the years ended 31 December
Notes
2018£m
2017£m
Revised
2016£m
Revised
Revenue1 2 24,492 19,564 14,130 Raw materials and consumables used (4,664) (4,520) (3,777)Changes in inventories of finished goods and work in progress 3(h) 114 (513) 44 Employee benefit costs 3(a),(e) (3,005) (2,679) (2,274)Depreciation, amortisation and impairment costs 3(b),(e),(f),(h) (1,038) (902) (607)Other operating income 3(e) 85 144 176 Loss on reclassification from amortised cost to fair value (3) – – Other operating expenses 3(c),(d),(e),(g),(h) (6,668) (4,682) (3,037)Profit from operations 2 9,313 6,412 4,655 Net finance costs 3(h),4 (1,381) (1,094) (637)Share of post-tax results of associates and joint ventures 2, 5 419 24,209 2,227
Profit before taxation 8,351 29,527 6,245 Taxation on ordinary activities 6 (2,141) 8,129 (1,406)Profit for the year 6,210 37,656 4,839
Attributable to: Owners of the parent 6,032 37,485 4,648 Non-controlling interests 178 171 191 6,210 37,656 4,839
Earnings per share Basic 7 264.0p 1,833.9p 250.2pDiluted 7 263.2p 1,827.6p 249.2p
1. Revenue is net of duty, excise and other taxes of £38,553 million, £37,780 million and £32,136 million for the years ended 31 December 2018, 2017 and 2016, respectively.
The accompanying notes are an integral part of these consolidated financial statements.
The results for the twelve-month period ended 31 December 2017 and 31 December 2016 have been revised as explained in notes 1 and 31.
122 BAT Annual Report and Form 20-F 2018

Governance Other InformationFinancial StatementsStrategic Report
Group Statement of Comprehensive Income
For the years ended 31 December
Notes
2018£m
2017£m
Revised
2016£m
Revised
Profit for the year 6,210 37,656 4,839
Other comprehensive income/(expense) Items that may be reclassified subsequently to profit or loss: 3,099 (3,809) 1,760 Differences on exchange 3,868 (3,084) 1,270 Cash flow hedges – net fair value (losses)/gains (58) (264) 29 – reclassified and reported in profit for the year 17 109 38 – reclassified and reported in total assets – (16) (12)Investments held at fair value – net fair value losses – (27) – Net investment hedges – net fair value (losses)/gains (472) 425 (837) – differences on exchange on borrowings (236) (68) (124)Associates – share of OCI, net of tax 5 (38) (918) 1,415 Tax on items that may be reclassified 6(f) 18 34 (19)Items that will not be reclassified subsequently to profit or loss: 115 681 (173)Retirement benefit schemes – net actuarial gains/(losses) 12 138 833 (228) – surplus recognition and minimum funding obligations 12 4 (6) (1)Associates – share of OCI, net of tax 5 6 25 20 Tax on items that will not be reclassified 6(f) (33) (171) 36
Total other comprehensive (expense)/income for the year, net of tax 3,214 (3,128) 1,587 Total comprehensive income for the year, net of tax 9,424 34,528 6,426
Attributable to: Owners of the parent 9,239 34,361 6,180 Non-controlling interests 185 167 246 9,424 34,528 6,426
The accompanying notes are an integral part of these consolidated financial statements.
The results for the twelve-month period ended 31 December 2017 have been revised as explained in notes 1 and 31.
123BAT Annual Report and Form 20-F 2018

Financial Statements
Attributable to owners of the parent
Notes
Sharecapital
£m
Sharepremium,
capitalredemptionand merger
reserves£m
Otherreserves
£m
Retainedearnings
£m
Totalattributable
to ownersof parent
£m
Non‑controlling
interests£m
Totalequity
£m
Balance at 31 December 2017 614 26,602 (3,392) 36,935 60,759 222 60,981 Accounting policy change (IFRS 9 see note 31) – – (9) (29) (38) – (38)Revised balance at 1 January 2018 614 26,602 (3,401) 36,906 60,721 222 60,943 Total comprehensive income for the year comprising: – – 3,090 6,149 9,239 185 9,424 Profit for the year – – – 6,032 6,032 178 6,210 Other comprehensive income for the year – – 3,090 117 3,207 7 3,214 Cash flow hedges reclassified and reported in total assets – – (22) – (22) – (22)Other changes in equity Employee share options – value of employee services 25 – – – 121 121 – 121 – proceeds from shares issued – 4 – – 4 – 4 Dividends and other appropriations – ordinary shares 8 – – – (4,463) (4,463) – (4,463)– to non-controlling interests – – – – – (163) (163)Purchase of own shares – held in employee share ownership trusts – – – (139) (139) – (139)Non-controlling interests – acquisitions 24(c) – – – (11) (11) – (11)Other movements – – – (6) (6) – (6)Balance at 31 December 2018 614 26,606 (333) 38,557 65,444 244 65,688
The accompanying notes are an integral part of these consolidated financial statements.
Attributable to owners of the parent
Revised Notes
Sharecapital
£m
Sharepremium,
capitalredemptionand merger
reserves£m
Otherreserves
£m
Retainedearnings
£m
Totalattributable
to ownersof parent
£m
Non-controlling
interests£m
Totalequity
£m
Balance at 1 January 2017 507 3,931 413 3,331 8,182 224 8,406 Total comprehensive income for the year comprising: – – (3,805) 38,166 34,361 167 34,528 Profit for the year – – – 37,485 37,485 171 37,656 Other comprehensive income for the year – – (3,805) 681 (3,124) (4) (3,128)Other changes in equity Employee share options – value of employee services 25 – – – 105 105 – 105 – proceeds from shares issued – 5 – – 5 – 5 Dividends and other appropriations – ordinary shares – – – (4,465) (4,465) – (4,465)– to non-controlling interests – – – – – (169) (169)Purchase of own shares – held in employee share ownership trusts – – – (205) (205) – (205)Shares issued – RAI acquisition 24(a) 107 22,666 – – 22,773 – 22,773 Other movements – – – 3 3 – 3 Balance at 31 December 2017 614 26,602 (3,392) 36,935 60,759 222 60,981
The accompanying notes are an integral part of these consolidated financial statements.
The results for the twelve-month period ended 31 December 2017 have been revised as explained in notes 1 and 31.
Group Statement of Changes in Equity
124 BAT Annual Report and Form 20-F 2018

Governance Other InformationFinancial StatementsStrategic Report
Attributable to owners of the parent
Notes
Sharecapital
£m
Sharepremium,
capitalredemptionand merger
reserves£m
Otherreserves
£m
Retainedearnings
£m
Totalattributable
to ownersof parent
£m
Non-controlling
interests£m
Totalequity
£m
Balance at 1 January 2016 507 3,927 (1,294) 1,754 4,894 138 5,032 Total comprehensive income for the year comprising: – – 1,707 4,473 6,180 246 6,426 Profit for the year – – – 4,648 4,648 191 4,839 Other comprehensive income for the year – – 1,707 (175) 1,532 55 1,587 Other changes in equity Employee share options – value of employee services 25 – – – 71 71 – 71 – proceeds from shares issued – 4 – – 4 – 4 Dividends and other appropriations – ordinary shares – – – (2,910) (2,910) – (2,910)– to non-controlling interests – – – – – (156) (156)Purchase of own shares – held in employee share ownership trusts – – – (64) (64) – (64)Non-controlling interests – acquisitions 24(c) – – – 4 4 (4) – Other movements – – – 3 3 – 3 Balance at 31 December 2016 507 3,931 413 3,331 8,182 224 8,406
The accompanying notes are an integral part of these consolidated financial statements.
125BAT Annual Report and Form 20-F 2018

Financial Statements
Group Balance Sheet
At 31 December
Notes
2018£m
2017£m
Revised
Assets Intangible assets 9 124,013 117,785 Property, plant and equipment 10 5,166 4,882 Investments in associates and joint ventures 11 1,737 1,577 Retirement benefit assets 12 1,147 1,123 Deferred tax assets 13 344 333 Trade and other receivables 14 685 756 Investments held at fair value 15 39 42 Derivative financial instruments 16 556 590 Total non‑current assets 133,687 127,088 Inventories 17 6,029 5,864 Income tax receivable 74 460 Trade and other receivables 14 3,588 4,053 Investments held at fair value 15 178 65 Derivative financial instruments 16 179 228 Cash and cash equivalents 18 2,602 3,291 12,650 13,961 Assets classified as held-for-sale 5 5 Total current assets 12,655 13,966 Total assets 146,342 141,054 Equity – capital and reserves Share capital 614 614 Share premium, capital redemption and merger reserves 26,606 26,602 Other reserves (333) (3,392)Retained earnings 38,557 36,935 Owners of the parent 65,444 60,759 Non-controlling interests 244 222 Total equity 19 65,688 60,981 Liabilities Borrowings 20 43,284 44,027 Retirement benefit liabilities 12 1,665 1,821 Deferred tax liabilities 13 17,776 17,129 Other provisions for liabilities 21 331 354 Trade and other payables 22 1,055 1,058 Derivative financial instruments 16 214 79 Total non‑current liabilities 64,325 64,468 Borrowings 20 4,225 5,423 Income tax payable 853 720 Other provisions for liabilities 21 318 399 Trade and other payables 22 10,631 8,908 Derivative financial instruments 16 302 155 Total current liabilities 16,329 15,605 Total equity and liabilities 146,342 141,054
The accompanying notes are an integral part of these consolidated financial statements.
The balance sheet as of 31 December 2017 has been revised as explained in notes 1 and 31.
On behalf of the Board
Richard BurrowsChairman
27 February 2019
126 BAT Annual Report and Form 20-F 2018

Governance Other InformationFinancial StatementsStrategic Report
Group Cash Flow Statement
For the years ended 31 December
Notes
2018£m
2017£m
Revised
2016£m
Profit from operations 9,313 6,412 4,655 Adjustments for – depreciation, amortisation and impairment costs 3(b) 1,038 902 607 – (increase)/decrease in inventories (192) 1,409 (638) – decrease/(increase) in trade and other receivables 502 (732) 87 – increase in amounts recoverable in respect of Quebec class action 14 – (130) (242) – increase/(decrease) in provision for Master Settlement Agreement 3(d) 1,364 (934) – – increase/(decrease) in trade and other payables 123 (685) 428 – decrease in net retirement benefit liabilities (100) (131) (145) – (decrease)/increase in other provisions for liabilities (107) (78) 141 – other non-cash items 31 86 – Cash generated from operations 11,972 6,119 4,893 Dividends received from associates 214 903 962 Tax paid (1,891) (1,675) (1,245)Net cash generated from operating activities 10,295 5,347 4,610 Cash flows from investing activities Interest received 52 83 62 Purchases of property, plant and equipment (758) (791) (586)Proceeds on disposal of property, plant and equipment 38 95 93 Purchases of intangibles (185) (187) (88)Purchases of investments (320) (170) (109)Proceeds on disposals of investments 167 160 22 Acquisition of Reynolds American Inc. net of cash acquired – (17,657) – Investment in associates and acquisitions of other subsidiaries net of cash acquired (32) (77) (57)Proceeds on disposal of non-core business net of cash disposed 17 – – Proceeds from associates’ share buy-backs – – 23 Net cash used in investing activities (1,021) (18,544) (640)Cash flows from financing activities Interest paid (1,559) (1,114) (641)Proceeds from increases in and new borrowings 2,111 40,937 3,476 Inflows/(outflows) relating to derivative financial instruments 49 (406) (26)Purchases of own shares held in employee share ownership trusts (139) (205) (64)Reductions in and repayments of borrowings (5,596) (20,827) (3,840)Dividends paid to owners of the parent 8 (4,347) (3,465) (2,910)Purchases of non-controlling interests (11) – (70)Dividends paid to non-controlling interests (142) (167) (147)Other 4 6 (7)Net cash (used in)/from financing activities (9,630) 14,759 (4,229)Net cash flows generated (used in)/from operating, investing and financing activities (356) 1,562 (259)Differences on exchange (138) (391) 180 (Decrease)/increase in net cash and cash equivalents in the year (494) 1,171 (79)Net cash and cash equivalents at 1 January 2,822 1,651 1,730 Net cash and cash equivalents at 31 December 18 2,328 2,822 1,651
The accompanying notes are an integral part of these consolidated financial statements.
Cash flow for the twelve-month period ended 31 December 2017 has been revised as explained in notes 1 and 31.
127BAT Annual Report and Form 20-F 2018

Financial Statements
Notes on the Accounts
1 Accounting policiesBasis of preparationThe consolidated financial statements have been prepared in accordance with International Financial Reporting Standards (“IFRS”) as issued by the International Accounting Standards Board (“IASB”), IFRS as adopted by the European Union (EU)@, and in accordance with the provisions of the UK Companies Act 2006 applicable to companies reporting under IFRS@. IFRS as adopted by the EU differs in certain respects from IFRS as issued by the IASB. The differences have no impact on the Group’s consolidated financial statements for the periods presented.
The consolidated financial statements have been prepared on a going concern basis under the historical cost convention except as described in the accounting policy below on financial instruments.
With effect from 1 January 2018, the Group has adopted IFRS 15 Revenue from Contracts with Customers. The Group has revised prior periods, as permitted by the Standard, to ensure comparability of the income statement across the periods presented. This Standard has changed the way the Group accounts for consideration payable to customers, and requires certain payments to indirect customers, previously shown as marketing expenses, to be shown as deductions from revenue. This has reduced revenue for the year ended 31 December 2017 by £664 million (2016: £621 million), with a corresponding reduction in other operating expenses. In addition, due to the timing of the recognition of certain payments to indirect customers, revenue and operating profit for the year ended 31 December 2017 has been reduced by a further £64 million. For further details, refer to note 31.
In addition, with effect from 1 January 2018, the Group has adopted IFRS 9 Financial Instruments with no revision of prior periods, as permitted by the Standard. The cumulative impact of adopting the Standard, including the effect of tax entries, has been recognised as a restatement of opening reserves in 2018, and is £38 million, arising from the impairment of financial assets under the expected loss model required under IFRS 9, which accelerates recognition of potential impairment on loans and trade receivables when compared with the incurred loss model under IAS 39 Financial Instruments. A simplified “lifetime expected loss model” has been used for balances arising as a result of revenue recognition, as permitted by the Standard, by applying a standard rate of provision on initial recognition of trade debtors based upon the Group’s historical experience of credit loss modified by expectations of the future, and increasing this provision to take account of overdue receivables. Applying the requirements of IFRS 9 has resulted in a decrease of trade and other receivables of £45 million as at 1 January 2018.
IFRS 9 has also changed the classification and measurement of financial assets. The category of available-for-sale investments (where fair value changes were deferred in reserves until disposal of the investment) has been replaced with the category of financial assets at Fair Value through Profit and Loss (for most investments) and the category of financial assets at Fair Value through Other Comprehensive Income (for qualifying equity investments). The available-for-sale reserve at 1 January 2018 has been reclassified as appropriate into retained earnings. In addition, certain loans and receivables which do not meet the measurement tests for amortised cost classification under IFRS 9 have been reclassified as financial assets at Fair Value through Profit and Loss at the same date. Given the immateriality of the various investment classes and to avoid clutter on the face of the balance sheet, the Group will use the term “investments held at fair value” to refer to all of these financial assets both pre- and post- the adoption of IFRS 9.
For further details on the impact on the Group’s balance sheet of these changes, refer to note 31. The Group has adopted the hedge accounting requirements of IFRS 9 prospectively from 1 January 2018. All of the Group’s hedging relationships at the end of 2017 are considered to be continuing hedge relationships on the adoption of IFRS 9.
In addition, with effect from 1 January 2018, the Group has changed certain estimates of useful economic lives for cigarette-making machinery across the Group, harmonising depreciation rates used by the historic BAT Group and by Reynolds American Inc. from 14 years and 30 years, respectively, to a standard 20-year life. The effect of the change is not material to the Group, and is estimated to be around £66 million for the year. Reynolds American Inc. recognised an impairment charge of £13 million in adopting the new estimate of useful economic lives.
The preparation of the consolidated financial statements requires management to make estimates and assumptions that affect the reported amounts of revenues, expenses, assets and liabilities, and the disclosure of contingent liabilities at the date of the financial statements. The key estimates and assumptions are set out in the accounting policies below, together with the related notes to the accounts.
The critical accounting estimates include:
– the review of asset values, especially indefinite life assets such as goodwill and certain trademarks and similar intangibles. The key assumptions used in respect of the impairment testing are the determination of cash-generating units, the budgeted cash flows of these units, the long-term growth rate for cash flow projections and the rate used to discount the cash flow projections. These are described in note 9;
– the estimation of and accounting for retirement benefit costs. The determination of the carrying value of assets and liabilities, as well as the charge for the year, and amounts recognised in other comprehensive income, involves judgements made in conjunction with independent actuaries. These involve estimates about uncertain future events based on the environment in different countries, including life expectancy of scheme members, salary and pension increases, inflation, as well as discount rates and asset values at the year end. The assumptions used by the Group and sensitivity analysis are described in note 12;
– the estimation of amounts to be recognised in respect of taxation and legal matters, and the estimation of other provisions for liabilities and charges are subject to uncertain future events, may extend over several years and so the amount and/or timing may differ from current assumptions. The accounting policy for taxation is explained below. The recognised deferred tax assets and liabilities, together with a note of unrecognised amounts, are shown in note 13, and a contingent tax asset is explained in note 6(b). Other provisions for liabilities and charges are as set out in note 21. The accounting policy on contingent liabilities, which are not provided for, is set out below and the contingent liabilities of the Group are explained in note 28. The application of these accounting policies to the payments made and credits recognised under the Master Settlement Agreement by Reynolds American Inc. (“Reynolds”) is described in note 3(d); and
– the estimation of the fair values of acquired net assets arising in a business combination and the allocation of the purchase consideration between the underlying net assets acquired, including intangible assets other than goodwill, on the basis of their fair values. These estimates are prepared in conjunction with the advice of independent valuation experts where appropriate. The relevant transactions for 2018, 2017 and 2016 are described in note 24.
@ Denotes phrase, paragraph or similar that does not form part of BAT’s Annual Report on Form 20-F as filed with the SEC.
128 BAT Annual Report and Form 20-F 2018

Governance Other InformationFinancial StatementsStrategic Report
1 Accounting policies continuedThe critical accounting judgements include:
– the definition of adjusting items, which are separately disclosed as memorandum information, is explained below and the impact of these on the calculation of adjusted earnings per share is described in note 7;
– the determination as to whether control (subsidiaries), joint control (joint arrangements), or significant influence (associates) exists in relation to the investments held by the Group. This is assessed after taking into account the Group’s ability to appoint Directors to the entity’s Board, its relative shareholding compared with other shareholders, any significant contracts or arrangements with the entity or its other shareholders and other relevant facts and circumstances; and
– the review of applicable exchange rates for transactions with and translation of entities in territories where there are restrictions on the free access to foreign currency, or multiple exchange rates.
Such estimates and assumptions are based on historical experience and various other factors that are believed to be reasonable in the circumstances and constitute management’s best judgement at the date of the financial statements. In the future, actual experience may deviate from these estimates and assumptions, which could affect the financial statements as the original estimates and assumptions are modified, as appropriate, in the year in which the circumstances change.
These consolidated financial statements were authorised for issue by the Board of Directors on 27 February 2019.
Basis of consolidationThe consolidated financial information includes the financial statements of British American Tobacco p.l.c. and its subsidiary undertakings, collectively “the Group”, together with the Group’s share of the results of its associates and joint arrangements.
A subsidiary is an entity controlled by the Group. The Group controls an entity when the Group is exposed to, or has rights to, variable returns from its involvement with the entity and has the ability to affect those returns through its power over the entity.
Associates comprise investments in undertakings, which are not subsidiary undertakings or joint arrangements, where the Group’s interest in the equity capital is long term and over whose operating and financial policies the Group exercises a significant influence. They are accounted for using the equity method.
Joint arrangements comprise contractual arrangements where two or more parties have joint control and where decisions regarding the relevant activities of the entity require unanimous consent. Joint operations are jointly-controlled arrangements where the parties to the arrangement have rights to the underlying assets and obligations for the underlying liabilities relating to the arrangement. The Group accounts for its share of the assets, liabilities, income and expenses of any such arrangement. Joint ventures comprise arrangements where the parties to the arrangement have rights to the net assets of the arrangement. They are accounted for using the equity method.
Foreign currencies and hyperinflationary territoriesThe functional currency of the Parent Company is sterling and this is also the presentation currency of the Group. The income and cash flow statements of Group undertakings expressed in currencies other than sterling are translated to sterling using exchange rates applicable to the dates of the underlying transactions. Average rates of exchange in each year are used where the average rate approximates the relevant exchange rate at the date of the underlying transactions. Assets and liabilities of Group undertakings are translated at the applicable rates of exchange at the end of each year. In territories where there are restrictions on the free access to foreign currency or multiple exchange rates, the applicable rates of exchange are regularly reviewed.
The differences between retained profits translated at average and closing rates of exchange are taken to reserves, as are differences arising on the retranslation to sterling (using closing rates of exchange) of overseas net assets at the beginning of the year, and are presented as a separate component of equity. They are recognised in the income statement when the gain or loss on disposal of a Group undertaking is recognised.
Foreign currency transactions are initially recognised in the functional currency of each entity in the Group using the exchange rate ruling at the date of the transaction. Foreign exchange gains and losses resulting from the settlement of such transactions and from the translation of foreign currency assets and liabilities at year end rates of exchange are recognised in the income statement, except when deferred in equity as qualifying cash flow hedges, on intercompany net investment loans and qualifying net investment hedges. Foreign exchange gains or losses recognised in the income statement are included in profit from operations or net finance costs depending on the underlying transactions that gave rise to these exchange differences.
In addition, for hyperinflationary countries where the effect on the Group results would be significant, the financial statements in local currency are adjusted to reflect the impact of local inflation prior to translation into sterling, in accordance with IAS 29 Financial Reporting in Hyperinflationary Economies. Where applicable, IAS 29 requires all transactions to be indexed by an inflationary factor to the balance sheet date, potentially leading to a monetary gain or loss on indexation. In addition, the Group assesses the carrying value of fixed assets after indexation and applies IAS 36 Impairment of Assets, where appropriate, to ensure that the carrying value correctly reflects the economic value of such assets.
The results and balance sheets of operations in hyperinflationary territories are translated at the period end rate. In the case of Venezuela, the Group uses an estimated exchange rate calculated by reflecting the development of the general price index since the Group last achieved meaningful repatriation of dividends.
RevenueRevenue principally comprises sales of cigarettes, other tobacco products, and nicotine products, to external customers. Revenue excludes duty, excise and other taxes and is after deducting rebates, returns and other similar discounts and payments to direct and indirect customers. Revenue is recognised when control of the goods is transferred to a customer; this is usually evidenced by a transfer of the significant risks and rewards of ownership upon delivery to the customer, which in terms of timing is not materially different to the date of shipping.
129BAT Annual Report and Form 20-F 2018

Financial Statements
Notes on the Accounts continued
1 Accounting policies continued Retirement benefit costsThe Group operates both defined benefit and defined contribution schemes including post-retirement healthcare schemes. The net deficit or surplus for each defined benefit pension scheme is calculated in accordance with IAS 19 Employee Benefits based on the present value of the defined benefit obligation at the balance sheet date less the fair value of the scheme assets adjusted, where appropriate, for any surplus restrictions or the effect of minimum funding requirements.
For defined benefit schemes, the actuarial cost charged to profit from operations consists of current service cost, net interest on the net defined benefit liability or asset, past service cost and the impact of any settlements.
Some benefits are provided through defined contribution schemes and payments to these are charged as an expense as they fall due.
Share‑based paymentsThe Group has equity-settled and cash-settled share-based compensation plans.
Equity-settled share-based payments are measured at fair value at the date of grant. The fair value determined at the grant date of the equity-settled share-based payments is expensed over the vesting period, based on the Group’s estimate of awards that will eventually vest. For plans where vesting conditions are based on total shareholder returns, the fair value at date of grant reflects these conditions, whereas earnings per share vesting conditions are reflected in the calculation of awards that will eventually vest over the vesting period. For cash-settled share-based payments, a liability equal to the portion of the services received is recognised at its current fair value determined at each balance sheet date. Fair value is measured by the use of the Black-Scholes option pricing model, except where vesting is dependent on market conditions when the Monte-Carlo option pricing model is used.
The expected life used in the models has been adjusted, based on management’s best estimate, for the effects of non-transferability, exercise restrictions and behavioural considerations.
Research and developmentResearch expenditure is charged to income in the year in which it is incurred. Development expenditure is charged to income in the year it is incurred, unless it meets the recognition criteria of IAS 38 Intangible Assets to be capitalised as an intangible asset.
TaxationTaxation is that chargeable on the profits for the period, together with deferred taxation.
The current income tax charge is calculated on the basis of tax laws enacted or substantively enacted at the balance sheet date in the countries where the Group’s subsidiaries, associates and joint arrangements operate and generate taxable income.
Deferred taxation is provided in full using the liability method for temporary differences between the carrying amount of assets and liabilities for financial reporting purposes and the amount used for taxation purposes. A deferred tax asset is recognised only to the extent that it is probable that future taxable profits will be available against which the asset can be utilised.
Deferred tax is determined using the tax rates that have been enacted or substantively enacted by the balance sheet date and are expected to apply when the related deferred tax asset is realised or deferred tax liability is settled.
Tax is recognised in the income statement except to the extent that it relates to items recognised in other comprehensive income or directly in equity, in which case it is recognised in the statement of other comprehensive income or the statement of changes in equity.
The Group has exposures in respect of the payment or recovery of a number of taxes. Liabilities or assets for these payments or recoveries are recognised at such time as an outcome becomes probable and when the amount can reasonably be estimated.
GoodwillGoodwill arising on acquisitions is capitalised and any impairment of goodwill is recognised immediately in the income statement and is not subsequently reversed.
Goodwill in respect of subsidiaries is included in intangible assets. In respect of associates and joint ventures, goodwill is included in the carrying value of the investment in the associated company or joint venture. On disposal of a subsidiary, associate or joint venture, the attributable amount of goodwill is included in the determination of the profit or loss on disposal.
Intangible assets other than goodwillThe intangible assets shown on the Group balance sheet consist mainly of trademarks and similar intangibles, including certain intellectual property, acquired by the Group’s subsidiary undertakings and computer software.
Acquired trademarks and similar assets are carried at cost less accumulated amortisation and impairment. Trademarks with indefinite lives are not amortised but are reviewed annually for impairment. Other trademarks and similar assets are amortised on a straight-line basis over their remaining useful lives, consistent with the pattern of economic benefits expected to be received, which do not exceed 20 years. Any impairments of trademarks are recognised in the income statement but increases in trademark values are not recognised.
Computer software is carried at cost less accumulated amortisation and impairment, and, with the exception of global software solutions, is amortised on a straight-line basis over periods ranging from three years to five years. Global software solutions are software assets designed to be implemented on a global basis and used as a standard solution by all of the operating companies in the Group. These assets are amortised on a straight-line basis over periods not exceeding ten years.
Property, plant and equipmentProperty, plant and equipment are stated at cost less accumulated depreciation and impairment. Depreciation is calculated on a straight-line basis to write off the assets over their useful economic life. No depreciation is provided on freehold land or assets classified as held-for-sale. Freehold and leasehold property are depreciated at rates between 2.5% and 4% per annum, and plant and equipment at rates between 3% and 25% per annum.
As noted above, with effect from 1 January 2018, cigarette-making machinery within this category is depreciated at 5% per annum (previously, between 3% and 7% per annum) as disclosed in note 3(b).
Capitalised interestBorrowing costs which are directly attributable to the acquisition, construction or production of intangible assets or property, plant and equipment that takes a substantial period of time to get ready for its intended use or sale, are capitalised as part of the cost of the asset.
130 BAT Annual Report and Form 20-F 2018
Governance Other InformationFinancial StatementsStrategic Report
1 Accounting policies continuedLeased assetsAssets where the Group has substantially all the risks and rewards of ownership of the leased asset are classified as finance leases and are included as part of property, plant and equipment. Finance lease assets are initially recognised at an amount equal to the lower of their fair value and the present value of the minimum lease payments at inception of the lease, then depreciated over the shorter of the lease term and their estimated useful lives. Leasing payments consist of capital and finance charge elements and the finance element is charged to the income statement.
Rental payments under operating leases are charged to the income statement on a straight-line basis over the lease term.
Impairment of non‑financial assetsAssets are reviewed for impairment whenever events indicate that the carrying amount of a cash-generating unit may not be recoverable. In addition, assets that have indefinite useful lives are tested annually for impairment. An impairment loss is recognised to the extent that the carrying value exceeds the higher of the asset’s fair value less costs to sell and its value in use.
A cash-generating unit is the smallest identifiable group of assets that generates cash flows which are largely independent of the cash flows from other assets or groups of assets. At the acquisition date, any goodwill acquired is allocated to the relevant cash-generating unit or group of cash-generating units expected to benefit from the acquisition for the purpose of impairment testing of goodwill.
Impairment of financial assetsFinancial assets are reviewed at each balance sheet date, or whenever events indicate that the carrying amount may not be recoverable.
With effect from 1 January 2018, loss allowances for expected credit losses on financial assets which are held at amortised cost are recognised on initial recognition of the underlying asset. As permitted by IFRS 9, the loss allowance on trade receivables arising from the recognition of revenue under IFRS 15 are initially measured at an amount equal to lifetime expected losses. Allowances in respect of loans and other receivables are initially recognised at an amount equal to 12-month expected credit losses. Allowances are measured at an amount equal to the lifetime expected credit losses where the credit risk on the receivables increases significantly after initial recognition.
Prior to 1 January 2018, financial assets were reviewed for impairment at each balance sheet date, or whenever events indicated that the carrying amount might not be recoverable.
InventoriesInventories are stated at the lower of cost and net realisable value. Cost is based on the weighted average cost incurred in acquiring inventories and bringing them to their existing location and condition, which will include raw materials, direct labour and overheads, where appropriate. Net realisable value is the estimated selling price less costs to completion and sale. Tobacco inventories which have an operating cycle that exceeds 12 months are classified as current assets, consistent with recognised industry practice.
Financial instrumentsThe Group’s business model for managing financial assets is set out in the Group Treasury Manual which notes that the primary objective with regard to the management of cash and investments is to protect against the loss of principal. Additionally, the Group aims: to maximise Group liquidity by concentrating cash at the Centre, to align the maturity profile of external investments with that of the forecast liquidity profile, to wherever practicable, match the interest rate profile of external investments to that of debt maturities or fixings, and to optimise the investment yield within the Group’s investment parameters. The majority of financial assets are held in order to collect contractual cash flows (typically cash and cash equivalents and loans and other receivables) but some assets (typically investments) are held for investment potential.
Financial assets and financial liabilities are recognised when the Group becomes a party to the contractual provisions of the relevant instrument and derecognised when it ceases to be a party to such provisions. Such assets and liabilities are classified as current if they are expected to be realised or settled within 12 months after the balance sheet date. If not, they are classified as non-current.
Non-derivative financial assets are classified on initial recognition in accordance with the Group’s business model as investments at fair value through profit and loss, investments at fair value through OCI, loans and receivables, or cash and cash equivalents and accounted for as follows:
– Investments: These are non-derivative financial assets that cannot be classified as loans and receivables or cash and cash equivalents. Dividend and interest income on these investments are included within finance income when the Group’s right to receive payments is established. This category includes financial assets at fair value through profit and loss, financial assets at fair value through other comprehensive income and, prior to 1 January 2018, available-for-sale investments as defined by IAS 39.
– Loans and other receivables: These are non-derivative financial assets with fixed or determinable payments that are solely payments of principal and interest on the principal amount outstanding, that are primarily held in order to collect contractual cash flows. These balances include trade and other receivables and are measured at amortised cost, using the effective interest rate method, and stated net of allowances for credit losses.
– Cash and cash equivalents: Cash and cash equivalents include cash in hand and deposits held on call, together with other short-term highly liquid investments including investments in certain money market funds. Cash equivalents normally comprise instruments with maturities of three months or less at date of acquisition. In the cash flow statement, cash and cash equivalents are shown net of bank overdrafts, which are included as current borrowings in the liabilities section on the balance sheet.
Fair values for quoted investments are based on observable market prices. If there is no active market for a financial asset, the fair value is established by using valuation techniques principally involving discounted cash flow analysis.
Non-derivative financial liabilities, including borrowings and trade payables, are stated at amortised cost using the effective interest method. For borrowings, their carrying value includes accrued interest payable, as well as unamortised issue costs. As shown in note 20, certain borrowings are subject to fair value hedges, as defined below.
131BAT Annual Report and Form 20-F 2018

Financial Statements
Notes on the Accounts continued
1 Accounting policies continuedDerivative financial assets and liabilities are initially recognised, and subsequently measured, at fair value, which includes accrued interest receivable and payable where relevant. Changes in their fair values are recognised as follows:
– for derivatives that are designated as cash flow hedges, the changes in their fair values are recognised directly in other comprehensive income, to the extent that they are effective, with the ineffective portion being recognised in the income statement. Where the hedged item results in a non-financial asset, the accumulated gains and losses, previously recognised in other comprehensive income, are included in the initial carrying value of the asset (basis adjustment) and recognised in the income statement in the same periods as the hedged item. Where the underlying transaction does not result in such an asset, the accumulated gains and losses are reclassified to the income statement in the same periods as the hedged item;
– for derivatives that are designated as fair value hedges, the carrying value of the hedged item is adjusted for the fair value changes attributable to the risk being hedged, with the corresponding entry being made in the income statement. The changes in fair value of these derivatives are also recognised in the income statement;
– for derivatives that are designated as hedges of net investments in foreign operations, the changes in their fair values are recognised directly in other comprehensive income, to the extent that they are effective, with the ineffective portion being recognised in the income statement. Where non-derivatives such as foreign currency borrowings are designated as net investment hedges, the relevant exchange differences are similarly recognised. The accumulated gains and losses are reclassified to the income statement when the foreign operation is disposed of; and
– for derivatives that do not qualify for hedge accounting or are not designated as hedges, the changes in their fair values are recognised in the income statement in the period in which they arise. These are referred to as “held-for-trading”.
In order to qualify for hedge accounting, the Group is required to document prospectively the economic relationship between the item being hedged and the hedging instrument. The Group is also required to demonstrate an assessment of the economic relationship between the hedged item and the hedging instrument, which shows that the hedge will be highly effective on an ongoing basis. This effectiveness testing is re-performed periodically to ensure that the hedge has remained, and is expected to remain, highly effective.
Hedge accounting is discontinued when a hedging instrument is derecognised (e.g. through expiry or disposal), or no longer qualifies for hedge accounting. Where the hedged item is a highly probable forecast transaction, the related gains and losses remain in equity until the transaction takes place, when they are reclassified to the income statement in the same manner as for cash flow hedges as described above. When a hedged future transaction is no longer expected to occur, any related gains and losses, previously recognised in other comprehensive income, are immediately reclassified to the income statement.
Derivative fair value changes recognised in the income statement are either reflected in arriving at profit from operations (if the hedged item is similarly reflected) or in finance costs.
All of the Group’s hedging relationships at the end of 2017 are considered to be continuing hedge relationships on the adoption of IFRS 9.
The Group’s accounting policies for financial instruments prior to the adoption of IFRS 9 on 1 January 2018, were as set out above, except for the following: non-derivative financial assets were classified on initial recognition as available-for-sale investments, loans and receivables or cash and cash equivalents. Available-for-sale investments were non-derivative financial assets that could not be classified as loans and receivables or cash and cash equivalents. Apart from available-for-sale investments, non-derivative financial assets were stated at amortised cost using the effective interest method, subject to reduction for allowances for estimated irrecoverable amounts. These estimates for irrecoverable amounts were recognised when there was objective evidence that the full amount receivable would not be collected according to the original terms of the asset. Available-for-sale investments were stated at fair value, with changes in fair value being recognised directly in other comprehensive income. When such investments were derecognised (e.g. through disposal) or became impaired, the accumulated gains and losses, previously recognised in other comprehensive income, were reclassified to the income statement within ‘finance income’. Dividend and interest income on available-for-sale investments were included within ‘finance income’ when the Group’s right to receive payments was established.
DividendsDividend distributions to the Company’s shareholders are recognised as a liability in the Group’s financial statements in the period in which they are approved by shareholders (final dividends) or confirmed by the Directors (interim dividends). With effect from 1 January 2018, the Company has moved to four interim quarterly dividend payments.
Segmental analysisThe Group is organised and managed on the basis of its geographic regions. These are the reportable segments for the Group as they form the focus of the Group’s internal reporting systems and are the basis used by the chief operating decision maker, identified as the Management Board, for assessing performance and allocating resources.
The Group is primarily a single product business providing cigarettes and other tobacco products. While the Group has clearly differentiated brands, global segmentation between a wide portfolio of brands is not part of the regular internally reported financial information. The results of Next Generation Products are reported as part of the results of each geographic region, and are not currently material to the Group.
The prices agreed between Group companies for intra-group sales of materials, manufactured goods, charges for royalties, commissions, services and fees, are based on normal commercial practices which would apply between independent businesses. Royalty income, less related expenditure, is included in the region in which the licensor is based.
Adjusting itemsAdjusting items are significant items of income or expense in revenue, profit from operations, net finance costs, taxation and the Group’s share of the post-tax results of associates and joint ventures which individually or, if of a similar type, in aggregate, are relevant to an understanding of the Group’s underlying financial performance because of their size, nature or incidence. In identifying and quantifying adjusting items, the Group consistently applies a policy that defines criteria that are required to be met for an item to be classified as adjusting. These items are separately disclosed in the segmental analyses or in the notes to the accounts as appropriate.
132 BAT Annual Report and Form 20-F 2018

Governance Other InformationFinancial StatementsStrategic Report
1 Accounting policies continuedThe Group believes that these items are useful to users of the Group financial statements in helping them to understand the underlying business performance and are used to derive the Group’s principal non-GAAP measures of adjusted revenue, adjusted profit from operations, adjusted diluted earnings per share, operating cash flow conversion ratio and adjusted cash from operations, all of which are before the impact of adjusting items and which are reconciled from revenue, profit from operations, diluted earnings per share, cash conversion ratio and net cash generated from operating activities.
ProvisionsProvisions are recognised when either a legal or constructive obligation as a result of a past event exists at the balance sheet date, it is probable that an outflow of economic resources will be required to settle the obligation and a reasonable estimate can be made of the amount of the obligation.
Contingent liabilities and contingent assetsSubsidiaries and associate companies are defendants in tobacco-related and other litigation. Provision for this litigation (including legal costs) is made at such time as an unfavourable outcome becomes probable and the amount can be reasonably estimated.
Contingent assets are possible assets whose existence will only be confirmed by future events not wholly within the control of the entity and are not recognised as assets until the realisation of income is virtually certain.
Where a provision has not been recognised, the Group records its external legal fees and other external defence costs for tobacco-related and other litigation as these costs are incurred.
Repurchase of share capitalWhen share capital is repurchased the amount of consideration paid, including directly attributable costs, is recognised as a deduction from equity. Repurchased shares which are not cancelled, or shares purchased for the employee share ownership trusts, are classified as treasury shares and presented as a deduction from total equity.
Future changes to accounting policiesCertain changes to IFRS will be applicable to the Group financial statements in future years. Set out below are those which are considered to be most relevant to the Group.
IFRS 16 LeasesThis Standard was finalised and published in January 2016 with a mandatory effective date of implementation of 1 January 2019. In adopting IFRS 16, the Group will apply the modified retrospective approach consistently across the Group, with no restatement of prior periods, as permitted by the Standard. On the initial implementation of the Standard, virtually all previously recognised operating leases will be capitalised as right-to-use assets and financial liabilities will be recognised at the same initial value.
The Group will take advantage of certain practical expedients available under the Standard, including “grandfathering” previously recognised lease arrangements such that contracts will not be reassessed at the implementation date as to whether they are, or contain, a lease, and leases previously classified as finance leases under IAS 17 Leases will remain capitalised on the adoption of IFRS 16. In addition, as part of the implementation, the Group will apply a single discount rate to a portfolio of leases with reasonably similar characteristics, will assess whether a lease is onerous prior to applying the Standard, will apply hindsight in determining the lease term if the contract contains options to extend or terminate the lease, and will not apply the capitalisation requirements of the Standard to leases for which the lease term ends within 12 months of the date of initial application.
Going forward, the Group will also adopt several practical expedients under the Standard including not applying the requirements of IFRS 16 to leases of intangible assets, applying the portfolio approach where appropriate to do so, and not applying the recognition and measurement requirements of IFRS 16 to short-term leases (leases of less than 12 months maximum duration) and to leases of low-value assets. Except for property-related leases, non-lease components will not be separated from lease components. The Group will continue to report recognised assets and liabilities under leases within property, plant and equipment and borrowings respectively rather than show these as separate line items on the face of the balance sheet.
Had the Standard been applied to the 2018 results, profit for the year would have been £11 million lower and non-current assets and liabilities would have each been increased by £564 million at the start of the year. At the end of the year, non-current assets would have been increased by £551 million and non-current liabilities by £558 million.
The anticipated impact of the new Standard to the Group’s balance sheet at 1 January 2019, and a reconciliation to reported leasing commitments, is shown in note 31.
IFRIC 23 Uncertainty over Income Tax treatmentsThis interpretation was finalised and published in June 2017 with a mandatory effective date of implementation of 1 January 2019. The Interpretation clarifies how to apply the recognition and measurement requirements in IAS 12 when there is uncertainty over income tax treatments. In particular, the Interpretation addresses whether uncertain tax treatments should be considered separately or together with one or more other uncertain tax treatments, and addresses the assumptions an entity makes about how probable it is that a taxation authority will accept an uncertain tax treatment. The impact on the Group’s profit and equity is not expected to be material.
Other interpretations and revisionsIn addition, a number of other interpretations and revisions to existing standards have been issued which will be applicable to the Group’s financial statements in future years, but will not have a material effect on reported profit or equity or on the disclosures in the financial statements.
133BAT Annual Report and Form 20-F 2018

Financial Statements
Notes on the Accounts continued
2 Segmental analyses (revised)With effect from 1 January 2018, the Group has adopted IFRS 15 Revenue from Contracts with Customers. The Group has fully restated (“revised”) prior periods, as explained in notes 1 and 31.
Due to the acquisition of RAI, the Group revised its organisational structure. RAI is reported as a separate region (United States). The markets which previously comprised EEMEA merged with the Americas, Western Europe and Asia-Pacific to form three new regions. The markets in the Middle East merged with Asia-Pacific to form the Asia-Pacific and Middle East region (APME). The markets in East and Central Africa, West Africa and Southern Africa merged with the Americas region to form the Americas and Sub-Saharan Africa region (AMSSA). The markets in Russia, Ukraine, Caucasus, Central Asia, Belarus, Turkey and North Africa merged with the Western Europe region to form the Europe and North Africa region (ENA). The segments disclosed below have been revised on this new basis.
As the chief operating decision maker, the Management Board reviews external adjusted revenues and adjusted profit from operations to evaluate segment performance and allocate resources to the overall business. The results of Next Generation Products are reported as part of the results of each geographic region and are not currently material to the Group. Consequently, it is not considered a reportable segment that requires separate disclosure under the requirements of IFRS 8 Operating Segments. Interest income, interest expense and taxation are centrally managed and accordingly such items are not presented by segment as they are excluded from the measure of segment profitability.
The four geographic regions are the reportable segments for the Group as they form the focus of the Group’s internal reporting systems and are the basis used by the Management Board for assessing performance and allocating resources. The Management Board reviews current and prior year adjusted segmental revenue, adjusted profit from operations of subsidiaries and joint operations, and adjusted post-tax results of associates and joint ventures at constant rates of exchange. The constant rate comparison provided for reporting segment information is based on a retranslation, at prior year exchange rates, of the current year results of the Group, including intercompany royalties payable in foreign currency to UK entities. However, the Group does not adjust for the normal transactional gains and losses in operations which are generated by movements in exchange rates.
In respect of the United States region, all financial statements and financial information provided by or with respect to the US business or RAI (and/or the RAI Group) are prepared on the basis of US GAAP and constitute the primary financial statements or financial information of the US business or RAI (and/or the RAI Group). Solely for the purpose of consolidation within the results of BAT p.l.c. and the BAT Group, this financial information is then converted to International Financial Reporting Standards as issued by the IASB and adopted by the European Union (IFRS). To the extent any such financial information provided in these financial statements relate to the US business or RAI (and/or the RAI Group) it is provided as an explanation of the US business’ or RAI’s (and/or the RAI Group’s) primary US GAAP based financial statements and information.
The following table shows 2018 revenue and adjusted revenue at current rates, and 2018 adjusted revenue translated using 2017 rates of exchange. The 2017 figures are stated at the 2017 rates of exchange.
2018 2017
Adjusted RevenueConstant
rates£m
Translationexchange
£m
AdjustedRevenueCurrent
rates£m
Adjusting items
Currentrates
£m
RevenueCurrent
rates£m
AdjustedRevenue
£m
Adjustingitems
£mRevenue
£m
United States 9,838 (343) 9,495 – 9,495 4,160 – 4,160 APME 5,250 (368) 4,882 – 4,882 4,973 – 4,973 AMSSA 4,560 (449) 4,111 – 4,111 4,323 – 4,323 ENA 6,112 (288) 5,824 180 6,004 5,850 258 6,108 Revenue 25,760 (1,448) 24,312 180 24,492 19,306 258 19,564
Note: adjusting items in revenue are in respect of excise included in goods acquired from a third party under short term arrangements and then passed on to customers. This is deemed as adjusting due to the distorting nature to revenue and operating margin.
The following table shows 2017 revenue and adjusted revenue at current rates, and 2017 adjusted revenue translated using 2016 rates of exchange. The 2016 figures are stated at the 2016 rates of exchange.
2017 2016
AdjustedRevenueConstant
rates£m
Translationexchange
£m
AdjustedRevenueCurrent
rates£m
Adjustingitems
Currentrates£m
RevenueCurrent
rates£m
Revenue£m
United States 3,958 202 4,160 – 4,160 –APME 4,776 197 4,973 – 4,973 4,769AMSSA 4,365 (42) 4,323 – 4,323 4,038ENA 5,507 343 5,850 258 6,108 5,323Revenue 18,606 700 19,306 258 19,564 14,130
Note: adjusting items in revenue are in respect of excise included in goods acquired from a third party under short term arrangements and then passed on to customers. This is deemed as adjusting due to the distorting nature to revenue and operating margin.
134 BAT Annual Report and Form 20-F 2018
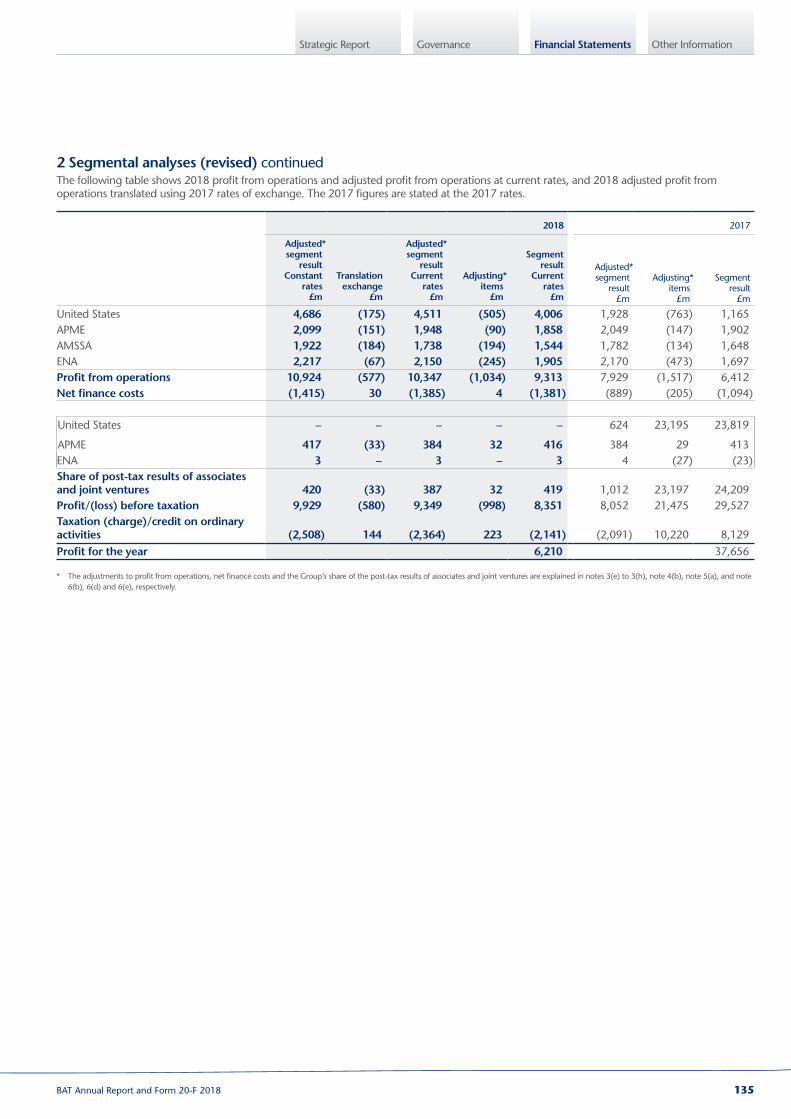
Governance Other InformationFinancial StatementsStrategic Report
2 Segmental analyses (revised) continuedThe following table shows 2018 profit from operations and adjusted profit from operations at current rates, and 2018 adjusted profit from operations translated using 2017 rates of exchange. The 2017 figures are stated at the 2017 rates.
2018 2017
Adjusted*segment
resultConstant
rates£m
Translationexchange
£m
Adjusted*segment
resultCurrent
rates£m
Adjusting*items
£m
Segmentresult
Currentrates
£m
Adjusted*segment
result£m
Adjusting*items
£m
Segmentresult
£m
United States 4,686 (175) 4,511 (505) 4,006 1,928 (763) 1,165 APME 2,099 (151) 1,948 (90) 1,858 2,049 (147) 1,902 AMSSA 1,922 (184) 1,738 (194) 1,544 1,782 (134) 1,648 ENA 2,217 (67) 2,150 (245) 1,905 2,170 (473) 1,697 Profit from operations 10,924 (577) 10,347 (1,034) 9,313 7,929 (1,517) 6,412 Net finance costs (1,415) 30 (1,385) 4 (1,381) (889) (205) (1,094)
United States – – – – – 624 23,195 23,819
APME 417 (33) 384 32 416 384 29 413 ENA 3 – 3 – 3 4 (27) (23)Share of post‑tax results of associates and joint ventures 420 (33) 387 32 419 1,012 23,197 24,209 Profit/(loss) before taxation 9,929 (580) 9,349 (998) 8,351 8,052 21,475 29,527 Taxation (charge)/credit on ordinary activities (2,508) 144 (2,364) 223 (2,141) (2,091) 10,220 8,129 Profit for the year 6,210 37,656
* The adjustments to profit from operations, net finance costs and the Group’s share of the post-tax results of associates and joint ventures are explained in notes 3(e) to 3(h), note 4(b), note 5(a), and note 6(b), 6(d) and 6(e), respectively.
135BAT Annual Report and Form 20-F 2018

Financial Statements
Notes on the Accounts continued
2 Segmental analyses (revised) continuedThe following table shows 2017 profit from operations and adjusted profit from operations at current rates, and 2017 adjusted profit from operations translated using 2016 rates of exchange. The 2016 figures are stated at the 2016 rates of exchange.
2017 2016
Adjusted*segment
resultConstant
rates£m
Translationexchange
£m
Adjusted*segment
resultCurrent
rates£m
Adjusting*items
£m
Segmentresult
Currentrates£m
Adjusted*segment
result£m
Adjusting*items
£m
Segmentresult
£m
United States 1,827 101 1,928 (763) 1,165 – – – APME 1,962 87 2,049 (147) 1,902 1,972 (198) 1,774 AMSSA 1,799 (17) 1,782 (134) 1,648 1,684 (262) 1,422 ENA 2,017 153 2,170 (473) 1,697 1,824 (345) 1,479 7,605 324 7,929 (1,517) 6,412 5,480 (805) 4,675 Fox River** – – (20) (20)Profit from operations 7,605 324 7,929 (1,517) 6,412 5,480 (825) 4,655 Net finance (costs)/income (833) (56) (889) (205) (1,094) (529) (108) (637)United States 593 31 624 23,195 23,819 991 889 1,880 APME 354 30 384 29 413 333 11 344 AMSSA – – – – – – – – ENA 4 – 4 (27) (23) 3 – 3 Share of post‑tax results of associates and joint ventures 951 61 1,012 23,197 24,209 1,327 900 2,227 Profit/(loss) before taxation 7,723 329 8,052 21,475 29,527 6,278 (33) 6,245 Taxation on ordinary activities (2,017) (74) (2,091) 10,220 8,129 (1,473) 67 (1,406)Profit for the year 37,656 4,839
* The adjustments to profit from operations, net finance (costs)/income and the Group’s share of the post-tax results of associates and joint ventures are explained in notes 3(e) to 3(h), note 4(b), note 5(a) and note 6(b), 6(d) and 6(e) respectively.
** The Fox River charge in 2016 (see note 3(g) and note 28) has not been allocated to any segment as it neither relates to current operations nor the tobacco business. It has been presented separately from the segmental reporting which is used to evaluate segment performance and to allocate resources, and is reported to the chief operating decision maker on this basis.
136 BAT Annual Report and Form 20-F 2018
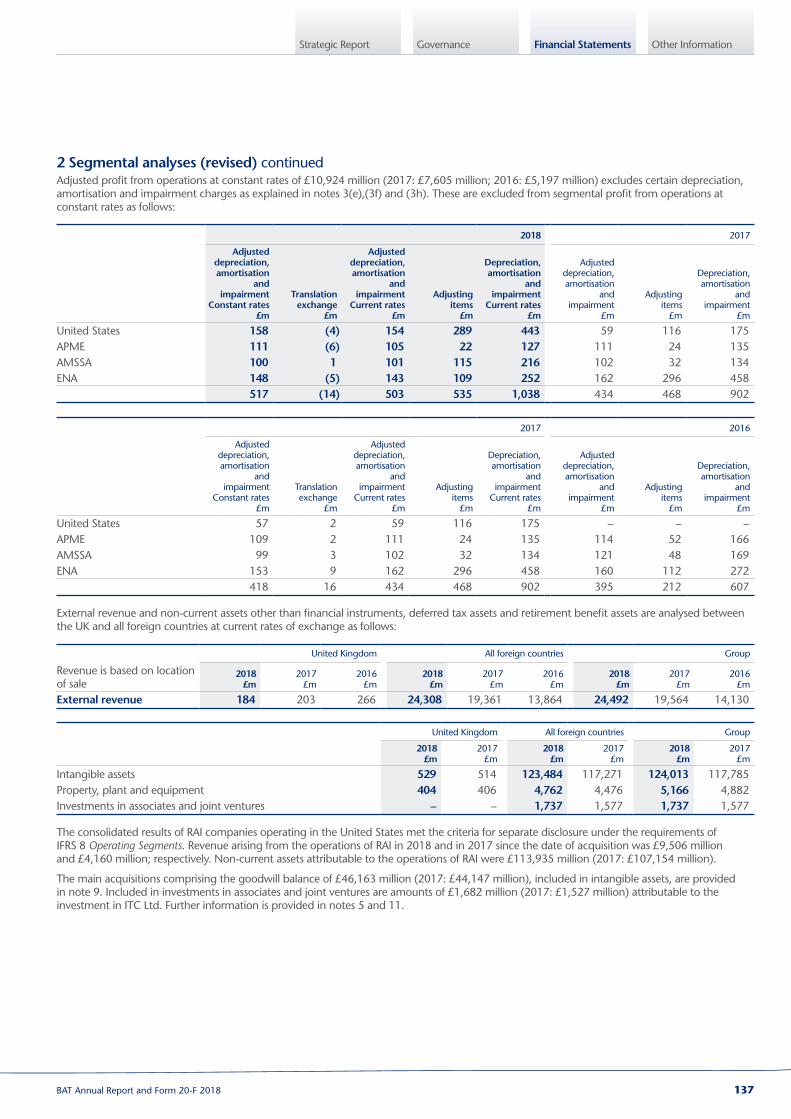
Governance Other InformationFinancial StatementsStrategic Report
2 Segmental analyses (revised) continuedAdjusted profit from operations at constant rates of £10,924 million (2017: £7,605 million; 2016: £5,197 million) excludes certain depreciation, amortisation and impairment charges as explained in notes 3(e),(3f) and (3h). These are excluded from segmental profit from operations at constant rates as follows:
2018 2017
Adjusted depreciation, amortisation
and impairment
Constant rates£m
Translationexchange
£m
Adjusted depreciation, amortisation
and impairment
Current rates£m
Adjusting items
£m
Depreciation, amortisation
and impairment
Current rates£m
Adjusted depreciation, amortisation
andimpairment
£m
Adjustingitems
£m
Depreciation, amortisation
andimpairment
£m
United States 158 (4) 154 289 443 59 116 175APME 111 (6) 105 22 127 111 24 135AMSSA 100 1 101 115 216 102 32 134ENA 148 (5) 143 109 252 162 296 458
517 (14) 503 535 1,038 434 468 902
2017 2016
Adjusted depreciation, amortisation
and impairment
Constant rates£m
Translationexchange
£m
Adjusted depreciation, amortisation
and impairment
Current rates£m
Adjusting items
£m
Depreciation, amortisation
and impairment
Current rates£m
Adjusted depreciation, amortisation
andimpairment
£m
Adjustingitems
£m
Depreciation, amortisation
andimpairment
£m
United States 57 2 59 116 175 – – –APME 109 2 111 24 135 114 52 166AMSSA 99 3 102 32 134 121 48 169ENA 153 9 162 296 458 160 112 272 418 16 434 468 902 395 212 607
External revenue and non-current assets other than financial instruments, deferred tax assets and retirement benefit assets are analysed between the UK and all foreign countries at current rates of exchange as follows:
United Kingdom All foreign countries Group
Revenue is based on location of sale
2018£m
2017£m
2016£m
2018£m
2017£m
2016£m
2018£m
2017£m
2016£m
External revenue 184 203 266 24,308 19,361 13,864 24,492 19,564 14,130
United Kingdom All foreign countries Group
2018
£m2017
£m 2018
£m2017
£m 2018
£m2017
£m
Intangible assets 529 514 123,484 117,271 124,013 117,785Property, plant and equipment 404 406 4,762 4,476 5,166 4,882Investments in associates and joint ventures – – 1,737 1,577 1,737 1,577
The consolidated results of RAI companies operating in the United States met the criteria for separate disclosure under the requirements of IFRS 8 Operating Segments. Revenue arising from the operations of RAI in 2018 and in 2017 since the date of acquisition was £9,506 million and £4,160 million; respectively. Non-current assets attributable to the operations of RAI were £113,935 million (2017: £107,154 million).
The main acquisitions comprising the goodwill balance of £46,163 million (2017: £44,147 million), included in intangible assets, are provided in note 9. Included in investments in associates and joint ventures are amounts of £1,682 million (2017: £1,527 million) attributable to the investment in ITC Ltd. Further information is provided in notes 5 and 11.
137BAT Annual Report and Form 20-F 2018

Financial Statements
Notes on the Accounts continued
3 Profit from operationsEnumerated below are movements in costs that have impacted profit from operations in 2018, 2017 and 2016. These include changes in our underlying business performance, as well as the impact of adjusting items, as defined in note 1, in profit from operations (note 3(d) to 3(h)).
(a) Employee benefit costs
2018
£m2017
£m2016
£m
Wages and salaries 2,463 2,131 1,882Social security costs 207 216 207Other pension and retirement benefit costs (note 12) 212 215 101Share-based payments – equity and cash-settled (note 25) 123 117 84 3,005 2,679 2,274
(b) Depreciation, amortisation and impairment costs
2018
£m2017
£m2016
£m
Intangibles – amortisation and impairment of trademarks and similar intangibles (note 3(f))
377 383 149
– amortisation and impairment of other intangibles 111 140 81Property, plant and equipment – depreciation and impairment 550 379 377 1,038 902 607
Included within depreciation are gains and losses recognised on the sale of property, plant and equipment.
With effect from 1 January 2018, cigarette making machinery within property, plant and equipment is depreciated at 5% per annum (previously, between 3% and 7% per annum). The impact of this change in accounting estimate is a net reduction in depreciation expense for the year of £53 million.
(c) Other operating expenses include:
2018
£m2017
£m2016
£m
Research and development expenses (excluding employee benefit costs and depreciation) 105 80 53Exchange differences (15) (6) (2)Hedge ineffectiveness within operating profit (8) – –Rent of plant and equipment (operating leases) – minimum lease payments 61 41 20Rent of property (operating leases) – minimum lease payments 110 85 51Auditor’s remuneration Total expense for audit services pursuant to legislation: – fees to KPMG LLP for Parent Company and Group audit 6.3 6.3 2.0– fees to KPMG LLP firms and associates for local statutory and Group reporting audits 8.8 11.3 7.2Total audit fees expense – KPMG LLP firms and associates 15.1 17.6 9.2Audit fees expense to other firms 0.2 0.2 –Total audit fees expense 15.3 17.8 9.2Fees to KPMG LLP firms and associates for other services: – audit-related assurance services 9.4 8.0 0.2– other assurance services 0.3 4.1 0.1– tax advisory services – – 0.2– tax compliance – 0.2 0.3– audit of defined benefit schemes of the Company 0.4 – –– other non-audit services – – 1.4 10.1 12.3 2.2
The total auditor’s remuneration to KPMG firms and associates included above are £25.2 million (2017: £29.9 million; 2016: £11.4 million).
During 2018 the Group incurred expenditure of £8.7 million (2017: £nil million, 2016: £nil million) within audit-related assurance services associated with the controls attestation of the Group’s implementation of Sarbanes-Oxley Section 404 during 2018.
During 2017, the Group incurred additional expenditure with the Group’s auditor, as part of the acquisition of the remaining shares in RAI not previously owned. This was due to the Securities and Exchange Commission (SEC) listing requirements to re-audit 2015 and 2016 under Public Company Accounting Oversight Board (“PCAOB”) standards, to audit the purchase price allocation, to provide assurance services on the registration documents and to provide, amongst other things, assurance services with regards to the planned 2018 implementation of Sarbanes-Oxley Section 404.
138 BAT Annual Report and Form 20-F 2018

Governance Other InformationFinancial StatementsStrategic Report
3 Profit from operations continuedAccordingly, the following costs, related to the acquisition of RAI and treated as an adjusting item, were incurred within the respective categories: audit-related assurance service £7.7 million and within other assurance services £3.5 million.
Under SEC regulations, the remuneration to KPMG firms and associates of £25.2 million in 2018 (2017: £30.1 million; 2016: £11.4 million) is required to be presented as follows: audit fees £24.7 million (2017: £29.2 million; 2016: £9.2 million), audit-related fees £0.4 million (2017: £0.5 million; 2016: £0.2 million), tax fees £nil million (2017: £0.2 million; 2016: £0.5 million) and all other fees £0.1 million (2017: £0.2 million; 2016: £1.5 million).
Total research and development costs including employee benefit costs and depreciation are £258 million (2017: £191 million; 2016: £144 million).
(d) Master Settlement AgreementIn 1998, the major US cigarette manufacturers (including R.J. Reynolds Tobacco Company, Lorillard and Brown & Williamson, businesses which are now part of Reynolds American) entered into the Master Settlement Agreement (MSA) with attorneys general representing most US states and territories. The MSA imposes a perpetual stream of future payment obligations on the major US cigarette manufacturers. The amounts of money that the participating manufacturers are required to annually contribute are based upon, amongst other things, the volume of cigarettes sold and market share (based on cigarette shipments in that year).
During 2012, R.J. Reynolds Tobacco Company, Santa Fe Natural Tobacco Company (SFNTC), various other tobacco manufacturers, 17 states, the District of Columbia and Puerto Rico reached an agreement related to the Non-Participating Manufacturer (NPM) adjustment under the MSA and three more states joined the agreement in 2013. Under this agreement, R.J. Reynolds Tobacco Company will receive credits, currently estimated to be more than US$1 billion, in respect of its Non-Participating Manufacturer (NPM) Adjustment claims related to the period from 2003 to 2012. These credits have been and will be applied against the companies’ MSA payments over a period of five years from 2013, subject to, and dependent upon, meeting the various ongoing performance obligations. During 2014, two additional states agreed to settle NPM disputes related to claims for the period 2003 to 2012. It is estimated that R.J. Reynolds Tobacco Company will receive US$170 million in credits, which will be applied over a five-year period from 2014. During 2015, another state agreed to settle NPM disputes related to claims for the period 2004 to 2014. It is estimated that R.J. Reynolds Tobacco Company will receive US$285 million in credits, which will be applied over a four-year period from 2015. During 2016, no additional states agreed to settle NPM disputes. During 2017, two more states agreed to settle NPM disputes related to claims for the period 2004 to 2014. It is estimated that R.J. Reynolds Tobacco Company will receive US$61 million in credits, which will be applied over a five-year period from 2017. During 2018, nine more states agreed to settle NPM disputes related to claims for the period 2004 to 2019, with an option through 2022, subject to certain conditions. It is estimated that R.J. Reynolds Tobacco Company will receive US$182 million in credits for settled periods through 2017, which will be applied over a five-year period from 2018. Also in 2018, one additional state agreed to settle NPM disputes related to claims for the period 2004 to 2024, subject to certain conditions. It is estimated that R.J. Reynolds Tobacco Company will receive US$205 million in credits for settled periods through 2017, which will be applied over a five-year period from 2019. Credits in respect of future years’ payments and the NPM Adjustment claims would be accounted for in the applicable year and will not be treated as adjusting items. Only credits in respect of prior year payments are included as adjusting items.
The BAT Group is subject to substantial payment obligations under the MSA and the state settlement agreements with the states of Mississippi, Florida, Texas and Minnesota (such settlement agreements, collectively State Settlement Agreements). RAl’s operating subsidiaries’ expenses and payments under the MSA and the State Settlement Agreements for 2017 amounted to US$2,856 million in respect of settlement expenses and US$4,612 million in respect of settlement cash payments. RAl’s operating subsidiaries’ expenses and payments under the MSA and the State Settlement Agreements for 2018 amounted to US$2,741 million in respect of settlement expenses and US$917 million in respect of settlement cash payments.
(e) Restructuring and integration costsRestructuring costs reflect the costs incurred as a result of initiatives to improve the effectiveness and the efficiency of the Group as a globally integrated enterprise, including the relevant operating costs of implementing the new operating model. These costs represent additional expenses incurred, which are not related to the normal business and day-to-day activities.
The new operating model is underpinned by a global single instance of SAP with full deployment occurring during 2016 with benefits already realised within the business and future savings expected in the years to come. The initiatives also include a review of the Group’s trade marketing and manufacturing operations, supply chain, overheads and indirect costs, organisational structure and systems and software used.
The costs of the Group’s initiatives together with the costs of integrating acquired businesses into existing operations, including acquisition costs, are included in profit from operations under the following headings:
2018
£m2017
£m2016
£m
Employee benefit costs 176 193 240Depreciation, amortisation and impairment costs 48 85 64Other operating expenses 145 330 325Other operating income (6) (8) (26) 363 600 603
Restructuring and integration costs in 2018 include integration costs associated with the acquisition of RAI and ongoing costs of implementing the revisions to the Group’s operating model. This includes the cost of packages in respect of permanent headcount reductions and permanent employee benefit reductions in the Group. The costs also cover downsizing activities in Russia, Germany and APME, partially offset by the income from sale of certain assets that have become available as part of the downsizing activities.
139BAT Annual Report and Form 20-F 2018

Financial Statements
Notes on the Accounts continued
3 Profit from operations continuedRestructuring and integration costs in 2017 include advisor fees and costs incurred related to the acquisition of the remaining shares in RAI not already owned by the Group, that completed on 25 July 2017 (note 24). It also includes the implementation of a new operating model and the cost of redundancy packages in respect of permanent headcount reductions and permanent employee benefit reductions in the Group. The costs also cover integration costs incurred as a result of the RAI acquisition, factory closure and downsizing activities in Germany and Malaysia, certain exit costs and asset write-offs related to the withdrawal from the Philippines.
Restructuring and integration costs in 2016 principally related to the restructuring initiatives directly related to implementation of a new operating model and the cost of initiatives in respect of permanent headcount reductions and permanent employee benefit reductions in the Group. The costs also covered factory closures and downsizing activities in Germany, Malaysia and Brazil, certain exit costs and asset write-offs related to the change in approach to the commercialisation of Voke, uncertainties surrounding regulatory changes and restructurings in Japan and Australia.
In 2018, other operating income includes gains from the sale of land and buildings in The Netherlands and in 2017, this included gains from the sale of land and buildings in Brazil. In 2016, this included gains from the sale of land and buildings in Malaysia.
(f) Amortisation and impairment of trademarks and similar intangiblesAcquisitions including RAI, TDR d.o.o. (TDR) and Skandinavisk Tobakskompagni (ST) in previous years, have resulted in the capitalisation of trademarks and similar intangibles which are amortised over their expected useful lives, which do not exceed 20 years. The amortisation and impairment charge of £377 million (2017: £383 million; 2016: £149 million) is included in depreciation, amortisation and impairment costs in profit from operations.
(g) Fox RiverAs explained in note 28, a Group subsidiary has certain liabilities in respect of indemnities given on the purchase and disposal of former businesses in the United States and in 2011, the subsidiary provided £274 million in respect of claims in relation to environmental clean-up costs of the Fox River.
On 30 September 2014, a Group subsidiary, NCR, Appvion and Windward Prospects entered into a Funding Agreement with regard to the costs for the clean-up of Fox River.
In January 2017, NCR and Appvion entered into a consent decree with the US Government to resolve how the remaining clean-up will be funded and to resolve further outstanding claims between them. The Consent Decree was approved by a US District Judge in August 2017 but is currently subject to appeal in the US Seventh Circuit Court of Appeals, refer to note 28 for further details.
In July 2016, the High Court ruled in a Group subsidiary’s favour that a dividend of €135 million paid by Windward to Sequana in May 2009 was a transaction made with the intention of putting assets beyond the reach of the Group subsidiary and of negatively impacting its interests. On 10 February 2017, further to a hearing in January 2017 to determine the relief due, the Court found in the Group subsidiary’s favour, ordering that Sequana must pay an amount up to the full value of the dividend plus interest which equates to around US$185 million, related to past and future clean-up costs. The Court granted all parties leave to appeal and Sequana a stay in respect of the above payments. In June 2018, the Court of Appeal heard arguments in the Sequana Claims Appeal (as defined in note 28). On 6 February 2019, the Court of Appeal gave judgment upholding the High Court’s findings, with one immaterial change to the method of calculating the damages awarded. Sequana therefore remains liable to pay the above mentioned dividend. Due to the uncertain outcome of the case no asset has been recognised in relation to this ruling. In February 2017, Sequana entered into a process in France seeking court protection (the “Sauvegarde”), exiting the Sauvegarde in June 2017. No payments have been received.
The provision is £108 million at 31 December 2018 (2017: £138 million). Based on this Funding Agreement, £30 million has been paid in 2018, which includes legal costs of £5 million (2017: £25 million, including legal costs of £7 million; 2016: £17 million, including legal costs of £11 million). In addition, in 2016 the devaluation of sterling against the US dollar led to a charge of £20 million.
(h) Other adjusting itemsIn 2018, the Group incurred £294 million of other adjusting items, including £178 million related to Engle progeny litigation offset by credits related to the Non-Participating Manufacturers settlement, which have been adjusted within ‘other operating expenses’.
In 2018, the European Securities and Markets Authority (ESMA) recognised the specific issues related to Venezuela and proposed that companies with exposure to Venezuela use an “estimated” exchange rate rather than the official exchange rate, as otherwise required under IAS 21. Accordingly, the Group has used an exchange rate calculated with reference to the estimated inflation since the latest dividend payment in 2010. In addition, the net assets of the Group’s Venezuelan operations are subject to accounting adjustments IAS 29 Financial Reporting in Hyperinflationary Economies, as they are revalued, for accounting purposes, from their acquisition date to the balance sheet date. However, management believes that such a revaluation is not reflective of the recoverable value of those assets and have incurred an impairment charge of £110 million. This charge has been treated as an adjusting item as it does not reflect the underlying performance of the Group. The Group has also recognised a gain of £45 million within net finance costs (note 4), being the partial counter-party to the above non-monetary asset movement, generating a monetary gain due to hyperinflation accounting under IAS 29.
In 2017, the release of the fair value acquisition accounting adjustments to finished goods inventories of £465 million on the RAI acquisition has been adjusted within ‘Changes in inventories of finished goods and work in progress’. Also included in 2017 is the impairment of certain assets of £69 million related to a third-party distributor (Agrokor) in Croatia, that has been adjusted within ‘other operating expenses’.
In 2016, the Board of Audit and Inspection of Korea (“BAI”) concluded its tax assessment in relation to the 2014 year-end tobacco inventory, and imposed additional sales tax (excise and VAT) and penalties. This resulted in the recognition of a £53 million charge by a Group subsidiary. Management deems the tax and penalties to be unfounded and has appealed to the tax tribunal against the assessment. Based on the legal opinion from a local law firm, management believes that this appeal will be successful, and that the findings of the BAI will be reversed. On grounds of materiality and the high likelihood of the tax and penalties being reversed in future, the Group has classified the tax and penalties charge as an adjusting item in 2016.
140 BAT Annual Report and Form 20-F 2018

Governance Other InformationFinancial StatementsStrategic Report
4 Net finance costs(a) Net finance costs/(income)
2018
£m2017
£m2016
£m
Interest expense 1,593 1,081 645 Facility fees 13 13 5 Interest related to adjusting tax payables (note 4(b)) 41 43 25 Loss on bond redemption (note 4(b)) – – 101 Acquisition of RAI (note 4(b)) – 153 – Fair value changes on derivative financial instruments and hedged items (154) (149) (458)Hedge ineffectiveness (note 4(b)) – 9 – Venezuela hyperinflation (note 4 (b)) (45) – – Exchange differences on financial liabilities 36 47 363 Finance costs 1,484 1,197 681 Interest under the effective interest method (68) (83) (68)Dividend income – (1) – Hedge ineffectiveness (note 4(b)) – – (18)Exchange differences on financial assets (35) (19) 42 Finance income (103) (103) (44)Net finance costs 1,381 1,094 637
The Group manages foreign exchange gains and losses and fair value changes on a net basis excluding adjusting items, which are explained in note 4(b); and the derivatives that generate the fair value changes are in note 16.
Facility fees principally relate to the Group’s central banking facilities.
(b) Adjusting items included in net finance costsAdjusting items are significant items in net finance costs which individually or, if of a similar type, in aggregate, are relevant to an understanding of the Group’s underlying financial performance.
In 2018, the Group incurred interest on adjusting tax payables of £41 million (2017: £43 million; 2016: £25 million). This included interest of £25 million (2017: £25 million; 2016: £25 million) in relation to the Franked Investment Income Group Litigation Order (FII GLO) (note 6(b)) and interest of £12 million in relation to retrospective guidance by a tax authority on overseas withholding tax.
Also in 2018, the Group recognised a monetary gain of £45 million related to the application of hyperinflationary accounting in Venezuela (note 3(h)).
In 2017, the Group incurred pre-financing costs related to the acquisition of RAI of £153 million.
Also in 2017, the Group realised a £9 million charge in relation to the reversal of a gain recognised in 2016, related to hedge ineffectiveness on external swaps following the referendum regarding “Brexit”. The gain in 2016 of £18 million was deemed to be adjusting as it is not representative of the underlying performance of the business and so the partial reversal has also been deemed as an adjusting item.
In 2016, the Group redeemed a US$700 million bond, prior to its original maturity date of 15 November 2018. This led to a loss of US$130 million (£101 million), which has been treated as an adjusting item.
141BAT Annual Report and Form 20-F 2018

Financial Statements
Notes on the Accounts continued
5 Associates and joint ventures 2018 2017 2016
Total
£m
Group’sshare
£m Total
£m
Group’sshare
£m Total
£m
Group’sshare
£m
Revenue 7,235 2,058 14,085 4,794 16,491 5,997Profit from operations* 2,128 630 4,342 24,854 9,379 3,740Net finance costs (8) (3) (279) (116) (477) (200)Profit on ordinary activities before taxation 2,120 627 4,063 24,738 8,902 3,540Taxation on ordinary activities (678) (201) (1,441) (522) (3,280) (1,308)Profit on ordinary activities after taxation 1,442 426 2,622 24,216 5,622 2,232Non-controlling interests (24) (7) (22) (7) (17) (5)Post-tax results of associates and joint ventures 1,418 419 2,600 24,209 5,605 2,227
Comprised of: – adjusted share of post-tax results of associates and joint ventures 1,308 387 2,785 1,012 3,461 1,327– issue of shares and change in shareholding 75 22 98 29 36 11– gain on deemed divestment of RAI – – – 23,288 – –– gain on disposal of assets – – – – 2,231 941– other 35 10 (283) (120) (123) (52) 1,418 419 2,600 24,209 5,605 2,227
* The gain on deemed divestment of RAI is recognised in the Group’s share of associates profit from operations.
Enumerated below are movements that have impacted the post-tax results of associates and joint ventures in 2018, 2017 and 2016.
(a) Adjusting itemsIn 2018, the Group’s interest in ITC Ltd. (ITC) decreased from 29.71% to 29.57% (2017: 29.89% to 29.71%; 2016: 30.06% to 29.89%) as a result of ITC issuing ordinary shares under the ITC Employee Share Option Scheme. The issue of these shares and change in the Group’s share of ITC resulted in a gain of £22 million (2017: £29 million; 2016: £11 million), which is treated as a deemed partial disposal and included in the income statement. ITC has also recognised an adjusting gain in respect of the release of certain provisions related to a tax claim, the Group’s share of which was £10 million.
On 25 July 2017, the Group announced the completion of the acquisition of the 57.8% of RAI the Group did not already own. As at this date RAI ceased to be reported as an associate and has become a fully owned subsidiary. Accordingly, as at that date, the Group was deemed to divest its investment in RAI as an associate and consolidated RAI in accordance with IFRS 10 Consolidated Financial Statements. This resulted in a gain of £23,288 million that has been reported in the Group’s share of post-tax results of associates and joint ventures.
In 2017, due to a deterioration in the financial performance of Tisak d.d. (Tisak), linked to the financial difficulties associated with a third-party distributor (Agrokor) in Croatia, the Group impaired the carrying value of this investment. This resulted in a charge of £27 million to the income statement that has been reported as an “other” adjusting item.
In 2016, RAI recognised a gain in relation to the sale of the international rights to Natural American Spirit to the Japan Tobacco Group of companies (JT) of US$4,861 million. The Group’s share of this net gain amounted to £941 million (net of tax).
In 2017, RAI recognised, prior to acquisition by the Group, the following amounts in ‘other’: transaction costs associated with the acquisition by the Group of US$125 million, the Group’s share of which is £33 million (net of tax) (2016: £nil million), deferred tax charges in respect of temporary differences on trademarks of US$51 million, the Group’s share of which is £18 million (2016: £nil million), restructuring charges of US$79 million, the Group’s share of which is £14 million (net of tax) (2016: US$36 million, the Group’s share of which is £7 million) and costs in respect of a number of Engle progeny lawsuits and other tobacco litigation charges that amounted to US$162 million, the Group’s share of which is £32 million (net of tax) (2016: US$86 million, the Group’s share of which is £17 million (net of tax)). Additionally, there is income of US$17 million (2016: US$6 million) related to the Non-Participating Manufacturer (NPM) Adjustment claims of the states no longer challenging the findings of non-diligence entered against them by an Arbitration Panel, the Group’s share of which is £4 million (net of tax) (2016: £2 million). The remaining costs in 2016 includes income relating to the early termination of the Manufacturing Agreement between BATUS Japan Inc. and RJRT (note 27) of US$90 million, the Group’s share of which is £18 million (net of tax) and transaction costs of US$5 million and financing costs of US$243 million, connected with the acquisition of Lorillard, the Group’s share is £1 million (net of tax) and £47 million of financing costs.
(b) Master Settlement AgreementFor information on the Master Settlement Agreement applicable to RAI as an associate for the period up to and including 24 July 2017 (note 3(d)).
142 BAT Annual Report and Form 20-F 2018
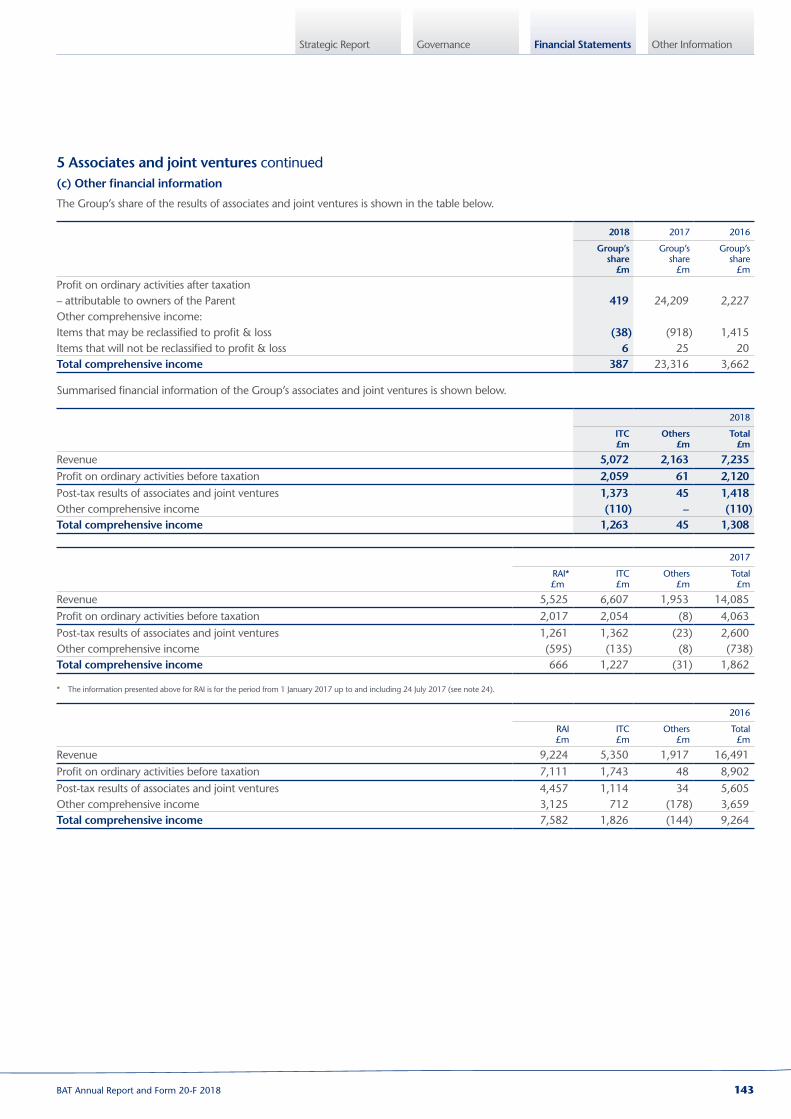
Governance Other InformationFinancial StatementsStrategic Report
5 Associates and joint ventures continued(c) Other financial information
The Group’s share of the results of associates and joint ventures is shown in the table below.
2018 2017 2016
Group’sshare
£m
Group’sshare
£m
Group’sshare
£m
Profit on ordinary activities after taxation – attributable to owners of the Parent 419 24,209 2,227Other comprehensive income: Items that may be reclassified to profit & loss (38) (918) 1,415Items that will not be reclassified to profit & loss 6 25 20Total comprehensive income 387 23,316 3,662
Summarised financial information of the Group’s associates and joint ventures is shown below.
2018
ITC £m
Others £m
Total £m
Revenue 5,072 2,163 7,235Profit on ordinary activities before taxation 2,059 61 2,120Post-tax results of associates and joint ventures 1,373 45 1,418Other comprehensive income (110) – (110)Total comprehensive income 1,263 45 1,308
2017
RAI*£m
ITC £m
Others £m
Total £m
Revenue 5,525 6,607 1,953 14,085Profit on ordinary activities before taxation 2,017 2,054 (8) 4,063Post-tax results of associates and joint ventures 1,261 1,362 (23) 2,600Other comprehensive income (595) (135) (8) (738)Total comprehensive income 666 1,227 (31) 1,862
* The information presented above for RAI is for the period from 1 January 2017 up to and including 24 July 2017 (see note 24).
2016
RAI £m
ITC £m
Others £m
Total £m
Revenue 9,224 5,350 1,917 16,491Profit on ordinary activities before taxation 7,111 1,743 48 8,902Post-tax results of associates and joint ventures 4,457 1,114 34 5,605Other comprehensive income 3,125 712 (178) 3,659Total comprehensive income 7,582 1,826 (144) 9,264
143BAT Annual Report and Form 20-F 2018

Financial Statements
Notes on the Accounts continued
6 Taxation on ordinary activities(a) Summary of taxation on ordinary activities
2018£m
2017£m
Revised
2016£m
UK corporation tax 60 26 7Comprising: – current year tax expense 66 26 7 – adjustments in respect of prior periods (6) – –Overseas tax 2,455 1,617 1,395Comprising: – current year tax expense 2,460 1,615 1,382 – adjustments in respect of prior periods (5) 2 13Total current tax 2,515 1,643 1,402Deferred tax (374) (9,772) 4Comprising: – deferred tax relating to origination and reversal of temporary differences (304) (152) 4 – deferred tax relating to changes in tax rates (70) (9,620) – 2,141 (8,129) 1,406
With effect from 1 January 2018, the Group has adopted IFRS 15 Revenue from Contracts with Customers. The Group has revised 2017, as explained in notes 1 and 31.
(b) Franked Investment Income Group Litigation OrderThe Group is the principal test claimant in an action in the United Kingdom against HM Revenue and Customs (HMRC) in the Franked Investment Income Group Litigation Order (FII GLO). There are 25 corporate groups in the FII GLO. The case concerns the treatment for UK corporate tax purposes of profits earned overseas and distributed to the UK.
The original claim was filed in 2003. The trial of the claim was split broadly into issues of liability and quantification. The main liability issues were heard by the High Court, Court of Appeal and Supreme Court in the UK and the European Court of Justice in the period to November 2012. The detailed technical issues of the quantification mechanics of the claim were heard by the High Court during May and June 2014 and the judgment handed down on 18 December 2014. The High Court determined that in respect of issues concerning the calculation of unlawfully charged corporation tax and advance corporation tax, the law of restitution including the defence on change of position and questions concerning the calculation of overpaid interest, the approach of the Group was broadly preferred. The conclusion reached by the High Court would, if upheld, produce an estimated receivable of £1.2 billion for the Group. Appeals on a majority of the issues were made to the Court of Appeal, which heard the arguments in June 2016. The Court of Appeal determined in November 2016 on the majority of issues that the conclusion reached by the High Court should be upheld. HMRC have sought permission to appeal to the Supreme Court on all issues. A decision on whether permission will be granted is anticipated in early 2019. If permission is granted the Supreme Court will not be expected to hand down its judgment until 2020. In July 2018, the Supreme Court handed down its judgment in the Prudential Assurance Company Ltd case, which is closely related to the FII GLO. Applying the Prudential judgment reduces the value of the FII claim to approximately £0.6 billion, mainly as the result of the application of simple interest.
During 2015, HMRC paid to the Group a gross amount of £1,224 million in two separate payments. The payments made by HMRC have been made without any admission of liability and are subject to refund were HMRC to succeed on appeal. The second payment in November 2015 followed the introduction of a new 45% tax on the interest component of restitution claims against HMRC. HMRC held back £261 million from the second payment contending that it represents the new 45% tax on that payment, leading to total cash received by the Group of £963 million. Actions challenging the legality of the withholding of the 45% tax have been lodged by the Group. The First Tier Tribunal found in favour of HMRC in July 2017 and the Group’s appeal to the Upper Tribunal was heard in July 2018 and judgment has not yet been handed down.
Due to the uncertainty of the amounts and eventual outcome the Group has not recognised any impact in the Income Statement in the current or prior period. The receipt, net of the deduction by HMRC, is held as deferred income as disclosed in note 22. Any future recognition as income will be treated as an adjusting item, due to the size of the amount, with interest of £25 million for the 12 months to 31 December 2018 (2017: £25 million; 2016: £25 million) accruing on the balance, which was also treated as an adjusting item.
Notes on the Accounts continued
144 BAT Annual Report and Form 20-F 2018
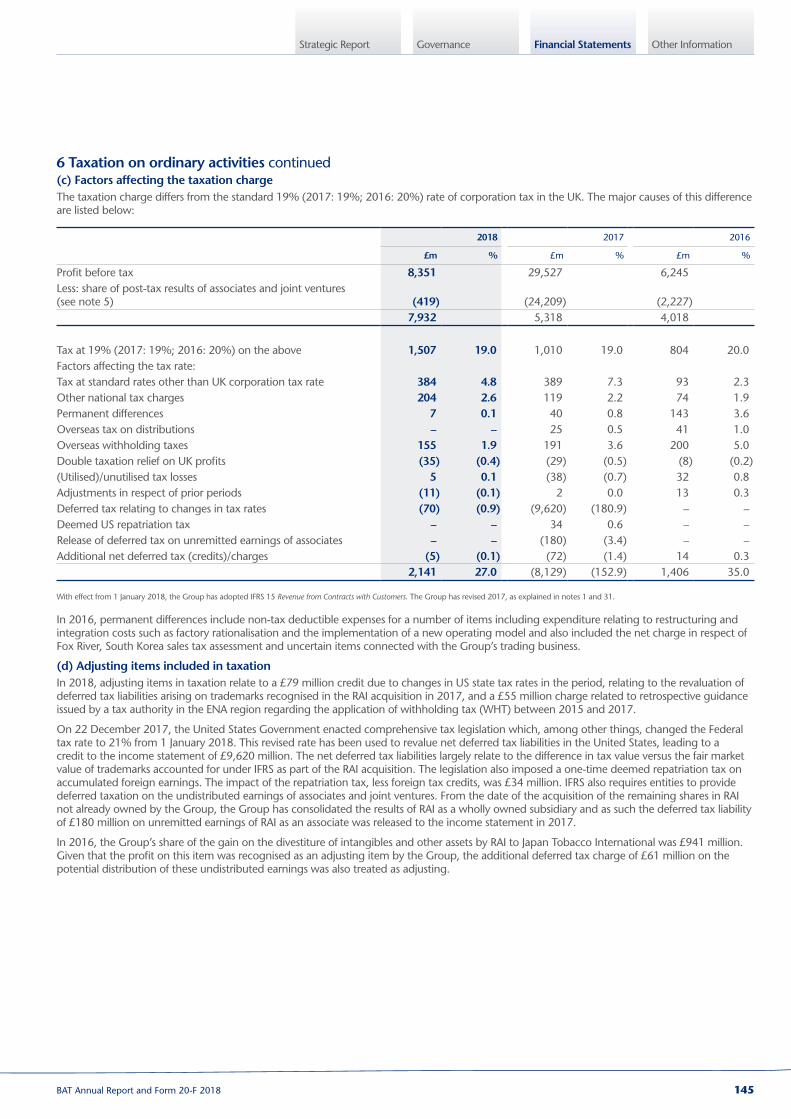
Governance Other InformationFinancial StatementsStrategic Report
6 Taxation on ordinary activities continued(c) Factors affecting the taxation chargeThe taxation charge differs from the standard 19% (2017: 19%; 2016: 20%) rate of corporation tax in the UK. The major causes of this difference are listed below:
2018 2017 2016
£m % £m % £m %
Profit before tax 8,351 29,527 6,245 Less: share of post-tax results of associates and joint ventures (see note 5) (419) (24,209) (2,227) 7,932 5,318 4,018 Tax at 19% (2017: 19%; 2016: 20%) on the above 1,507 19.0 1,010 19.0 804 20.0Factors affecting the tax rate: Tax at standard rates other than UK corporation tax rate 384 4.8 389 7.3 93 2.3Other national tax charges 204 2.6 119 2.2 74 1.9Permanent differences 7 0.1 40 0.8 143 3.6Overseas tax on distributions – – 25 0.5 41 1.0Overseas withholding taxes 155 1.9 191 3.6 200 5.0Double taxation relief on UK profits (35) (0.4) (29) (0.5) (8) (0.2)(Utilised)/unutilised tax losses 5 0.1 (38) (0.7) 32 0.8Adjustments in respect of prior periods (11) (0.1) 2 0.0 13 0.3Deferred tax relating to changes in tax rates (70) (0.9) (9,620) (180.9) – –Deemed US repatriation tax – – 34 0.6 – –Release of deferred tax on unremitted earnings of associates – – (180) (3.4) – –Additional net deferred tax (credits)/charges (5) (0.1) (72) (1.4) 14 0.3 2,141 27.0 (8,129) (152.9) 1,406 35.0
With effect from 1 January 2018, the Group has adopted IFRS 15 Revenue from Contracts with Customers. The Group has revised 2017, as explained in notes 1 and 31.
In 2016, permanent differences include non-tax deductible expenses for a number of items including expenditure relating to restructuring and integration costs such as factory rationalisation and the implementation of a new operating model and also included the net charge in respect of Fox River, South Korea sales tax assessment and uncertain items connected with the Group’s trading business.
(d) Adjusting items included in taxationIn 2018, adjusting items in taxation relate to a £79 million credit due to changes in US state tax rates in the period, relating to the revaluation of deferred tax liabilities arising on trademarks recognised in the RAI acquisition in 2017, and a £55 million charge related to retrospective guidance issued by a tax authority in the ENA region regarding the application of withholding tax (WHT) between 2015 and 2017.
On 22 December 2017, the United States Government enacted comprehensive tax legislation which, among other things, changed the Federal tax rate to 21% from 1 January 2018. This revised rate has been used to revalue net deferred tax liabilities in the United States, leading to a credit to the income statement of £9,620 million. The net deferred tax liabilities largely relate to the difference in tax value versus the fair market value of trademarks accounted for under IFRS as part of the RAI acquisition. The legislation also imposed a one-time deemed repatriation tax on accumulated foreign earnings. The impact of the repatriation tax, less foreign tax credits, was £34 million. IFRS also requires entities to provide deferred taxation on the undistributed earnings of associates and joint ventures. From the date of the acquisition of the remaining shares in RAI not already owned by the Group, the Group has consolidated the results of RAI as a wholly owned subsidiary and as such the deferred tax liability of £180 million on unremitted earnings of RAI as an associate was released to the income statement in 2017.
In 2016, the Group’s share of the gain on the divestiture of intangibles and other assets by RAI to Japan Tobacco International was £941 million. Given that the profit on this item was recognised as an adjusting item by the Group, the additional deferred tax charge of £61 million on the potential distribution of these undistributed earnings was also treated as adjusting.
145BAT Annual Report and Form 20-F 2018
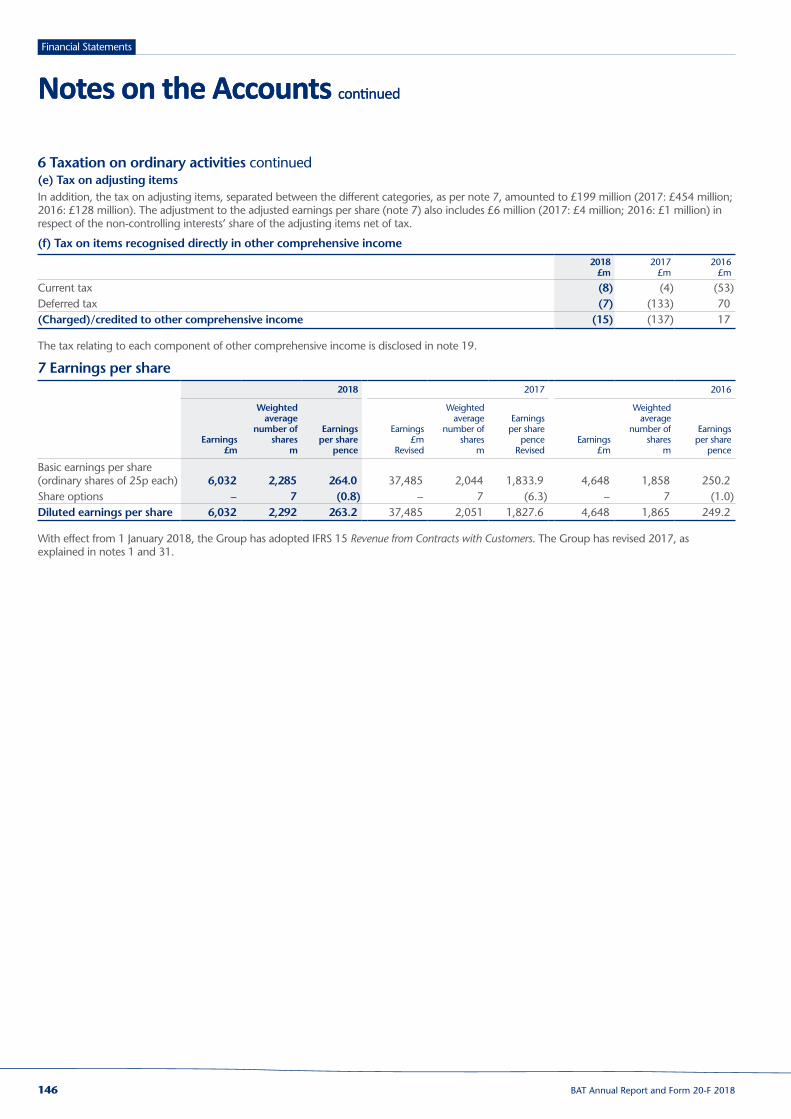
Financial Statements
Notes on the Accounts continued
6 Taxation on ordinary activities continued(e) Tax on adjusting itemsIn addition, the tax on adjusting items, separated between the different categories, as per note 7, amounted to £199 million (2017: £454 million; 2016: £128 million). The adjustment to the adjusted earnings per share (note 7) also includes £6 million (2017: £4 million; 2016: £1 million) in respect of the non-controlling interests’ share of the adjusting items net of tax.
(f) Tax on items recognised directly in other comprehensive income
2018
£m2017
£m2016
£m
Current tax (8) (4) (53)Deferred tax (7) (133) 70(Charged)/credited to other comprehensive income (15) (137) 17
The tax relating to each component of other comprehensive income is disclosed in note 19.
7 Earnings per share
2018 2017 2016
Earnings £m
Weighted average
number of shares
m
Earnings per share
pence
Earnings £m
Revised
Weighted average
number of shares
m
Earnings per share
penceRevised
Earnings £m
Weighted average
number of shares
m
Earnings per share
pence
Basic earnings per share (ordinary shares of 25p each) 6,032 2,285 264.0 37,485 2,044 1,833.9 4,648 1,858 250.2Share options – 7 (0.8) – 7 (6.3) – 7 (1.0)Diluted earnings per share 6,032 2,292 263.2 37,485 2,051 1,827.6 4,648 1,865 249.2
With effect from 1 January 2018, the Group has adopted IFRS 15 Revenue from Contracts with Customers. The Group has revised 2017, as explained in notes 1 and 31.
Notes on the Accounts continued
146 BAT Annual Report and Form 20-F 2018
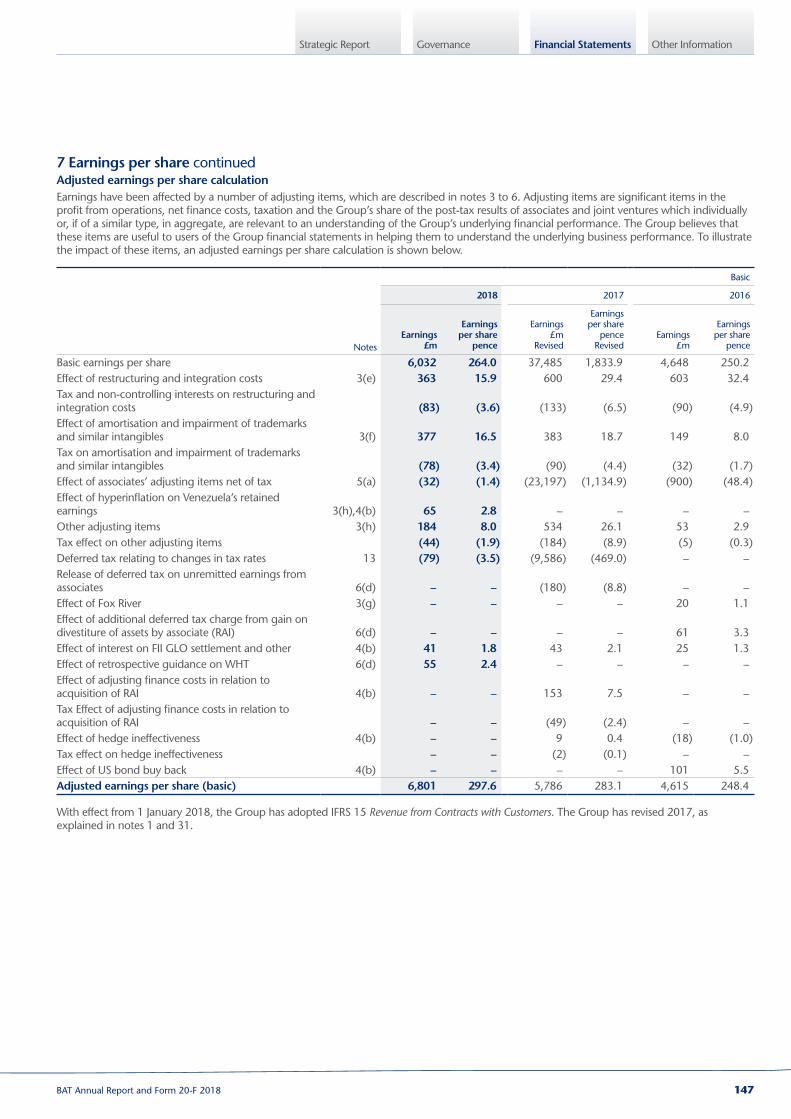
Governance Other InformationFinancial StatementsStrategic Report
7 Earnings per share continuedAdjusted earnings per share calculationEarnings have been affected by a number of adjusting items, which are described in notes 3 to 6. Adjusting items are significant items in the profit from operations, net finance costs, taxation and the Group’s share of the post-tax results of associates and joint ventures which individually or, if of a similar type, in aggregate, are relevant to an understanding of the Group’s underlying financial performance. The Group believes that these items are useful to users of the Group financial statements in helping them to understand the underlying business performance. To illustrate the impact of these items, an adjusted earnings per share calculation is shown below.
Basic
2018 2017 2016
NotesEarnings
£m
Earnings per share
pence
Earnings £m
Revised
Earnings per share
penceRevised
Earnings £m
Earnings per share
pence
Basic earnings per share 6,032 264.0 37,485 1,833.9 4,648 250.2Effect of restructuring and integration costs 3(e) 363 15.9 600 29.4 603 32.4Tax and non-controlling interests on restructuring and integration costs (83) (3.6) (133) (6.5) (90) (4.9)Effect of amortisation and impairment of trademarks and similar intangibles 3(f) 377 16.5 383 18.7 149 8.0Tax on amortisation and impairment of trademarks and similar intangibles (78) (3.4) (90) (4.4) (32) (1.7)Effect of associates’ adjusting items net of tax 5(a) (32) (1.4) (23,197) (1,134.9) (900) (48.4)Effect of hyperinflation on Venezuela’s retained earnings 3(h),4(b) 65 2.8 – – – –Other adjusting items 3(h) 184 8.0 534 26.1 53 2.9Tax effect on other adjusting items (44) (1.9) (184) (8.9) (5) (0.3)Deferred tax relating to changes in tax rates 13 (79) (3.5) (9,586) (469.0) – –Release of deferred tax on unremitted earnings from associates 6(d) – – (180) (8.8) – –Effect of Fox River 3(g) – – – – 20 1.1Effect of additional deferred tax charge from gain on divestiture of assets by associate (RAI) 6(d) – – – – 61 3.3Effect of interest on FII GLO settlement and other 4(b) 41 1.8 43 2.1 25 1.3Effect of retrospective guidance on WHT 6(d) 55 2.4 – – – –Effect of adjusting finance costs in relation to acquisition of RAI 4(b) – – 153 7.5 – –Tax Effect of adjusting finance costs in relation to acquisition of RAI – – (49) (2.4) – –Effect of hedge ineffectiveness 4(b) – – 9 0.4 (18) (1.0)Tax effect on hedge ineffectiveness – – (2) (0.1) – –Effect of US bond buy back 4(b) – – – – 101 5.5Adjusted earnings per share (basic) 6,801 297.6 5,786 283.1 4,615 248.4
With effect from 1 January 2018, the Group has adopted IFRS 15 Revenue from Contracts with Customers. The Group has revised 2017, as explained in notes 1 and 31.
147BAT Annual Report and Form 20-F 2018
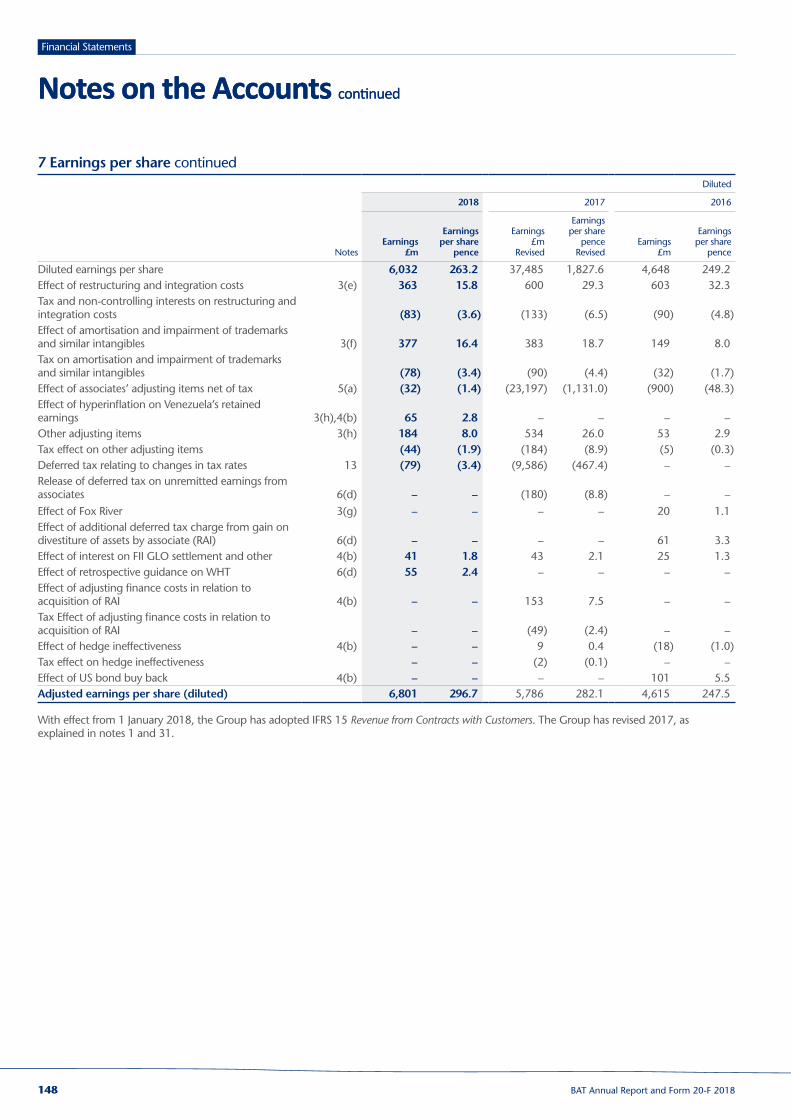
Financial Statements
Notes on the Accounts continued
7 Earnings per share continued
Notes
Diluted
2018 2017 2016
Earnings £m
Earnings per share
pence
Earnings £m
Revised
Earnings per share
penceRevised
Earnings £m
Earnings per share
pence
Diluted earnings per share 6,032 263.2 37,485 1,827.6 4,648 249.2Effect of restructuring and integration costs 3(e) 363 15.8 600 29.3 603 32.3Tax and non-controlling interests on restructuring and integration costs (83) (3.6) (133) (6.5) (90) (4.8)Effect of amortisation and impairment of trademarks and similar intangibles 3(f) 377 16.4 383 18.7 149 8.0Tax on amortisation and impairment of trademarks and similar intangibles (78) (3.4) (90) (4.4) (32) (1.7)Effect of associates’ adjusting items net of tax 5(a) (32) (1.4) (23,197) (1,131.0) (900) (48.3)Effect of hyperinflation on Venezuela’s retained earnings 3(h),4(b) 65 2.8 – – – –Other adjusting items 3(h) 184 8.0 534 26.0 53 2.9Tax effect on other adjusting items (44) (1.9) (184) (8.9) (5) (0.3)Deferred tax relating to changes in tax rates 13 (79) (3.4) (9,586) (467.4) – –Release of deferred tax on unremitted earnings from associates 6(d) – – (180) (8.8) – –Effect of Fox River 3(g) – – – – 20 1.1Effect of additional deferred tax charge from gain on divestiture of assets by associate (RAI) 6(d) – – – – 61 3.3Effect of interest on FII GLO settlement and other 4(b) 41 1.8 43 2.1 25 1.3Effect of retrospective guidance on WHT 6(d) 55 2.4 – – – –Effect of adjusting finance costs in relation to acquisition of RAI 4(b) – – 153 7.5 – –Tax Effect of adjusting finance costs in relation to acquisition of RAI – – (49) (2.4) – –Effect of hedge ineffectiveness 4(b) – – 9 0.4 (18) (1.0)Tax effect on hedge ineffectiveness – – (2) (0.1) – –Effect of US bond buy back 4(b) – – – – 101 5.5Adjusted earnings per share (diluted) 6,801 296.7 5,786 282.1 4,615 247.5
With effect from 1 January 2018, the Group has adopted IFRS 15 Revenue from Contracts with Customers. The Group has revised 2017, as explained in notes 1 and 31.
Notes on the Accounts continued
148 BAT Annual Report and Form 20-F 2018

Governance Other InformationFinancial StatementsStrategic Report
7 Earnings per share continuedHeadline earnings per share as required by the JSE LimitedThe presentation of headline earnings per share, as an alternative measure of earnings per share, is mandated under the JSE Listing Requirements. It is calculated in accordance with Circular 4/2018 ‘Headline Earnings’, as issued by the South African Institute of Chartered Accountants.
Basic
2018 2017 2016
Earnings £m
Earnings per share
pence
Earnings £m
Revised
Earnings per share
penceRevised
Earnings £m
Earnings per share
pence
Basic earnings per share 6,032 264.0 37,485 1,833.9 4,648 250.2Effect of impairment of intangibles, property, plant and equipment and assets held-for-sale 238 10.3 179 8.7 126 6.8Tax and non-controlling interests on impairment of intangibles and property, plant and equipment (65) (2.8) (35) (1.7) (35) (1.9)Effect of gains on disposal of property, plant and equipment and held-for-sale assets (11) (0.5) (48) (2.3) (59) (3.2)Tax and non-controlling interests on disposal of property, plant and equipment and held-for-sale assets 4 0.2 13 0.6 30 1.6Effect of gains on disposal of businesses, non-current investments and brands (10) (0.4) – – – –Tax on gains on disposal of businesses, non-current investments and brands 2 0.1 – – – –Gain on deemed disposal of RAI associate – – (23,288) (1,139.3) – –Write-off of investment in associate – – 27 1.3 – –Share of associates’ gains on disposal of assets – – – – (941) (50.6)Tax effect of associates’ disposal of assets – – – – 61 3.3 Issue of shares and change in shareholding in associate (22) (1.0) (29) (1.4) (11) (0.6)Headline earnings per share (basic) 6,168 269.9 14,304 699.8 3,819 205.6
With effect from 1 January 2018, the Group has adopted IFRS 15 Revenue from Contracts with Customers. The Group has revised 2017, as explained in notes 1 and 31.
Diluted
2018 2017 2016
Earnings £m
Earnings per share
pence
Earnings £m
Revised
Earnings per share
penceRevised
Earnings £m
Earnings per share
pence
Diluted earnings per share 6,032 263.2 37,485 1,827.6 4,648 249.2Effect of impairment of intangibles, property, plant and equipment and assets held-for-sale 238 10.3 179 8.6 126 6.8Tax and non-controlling interests on impairment of intangibles and property, plant and equipment (65) (2.8) (35) (1.7) (35) (1.9)Effect of gains on disposal of property, plant and equipment and held-for-sale assets (11) (0.5) (48) (2.3) (59) (3.2)Tax and non-controlling interests on disposal of property, plant and equipment and held-for-sale assets 4 0.2 13 0.6 30 1.6Effect of gains on disposal of businesses, non-current investments and brands (10) (0.4) – – – –Tax on gains on disposal of businesses, non-current investments and brands 2 0.1 – – – –Gain on deemed disposal of RAI associate – – (23,288) (1,135.4) – –Write-off of investment in associate – – 27 1.3 – –Share of associates’ gains on disposal of assets – – – – (941) (50.4)Tax effect of associates’ disposal of assets – – – – 61 3.3 Issue of shares and change in shareholding in associate (22) (1.0) (29) (1.4) (11) (0.6)Headline earnings per share (diluted) 6,168 269.1 14,304 697.3 3,819 204.8
With effect from 1 January 2018, the Group has adopted IFRS 15 Revenue from Contracts with Customers. The Group has revised 2017, as explained in notes 1 and 31.
149BAT Annual Report and Form 20-F 2018

Financial Statements
Notes on the Accounts continued
8 Dividends and other appropriations
Dividends paid to owner of the parent
2018 2017 2016
Pence per share £m
Pence per share £m
Pence per share £m
Ordinary sharesInterim2018 paid 15 November 2018 48.8 1,114 2018 paid 8 August 2018 48.8 1,118 2018 paid 9 May 2018 48.8 1,111 2017 paid 8 February 2018 43.6 1,004 2017 paid 28 September 2017 56.5 1,284 2016 paid 28 September 2016 51.3 961Final 2016 paid 4 May 2017 118.1 2,181 2015 paid 5 May 2016 104.6 1,949 190.0 4,347 174.6 3,465 155.9 2,910
From 1 January 2018, the Group moved to four interim quarterly dividend payments of 48.8p per ordinary share. As part of the transition, and to ensure shareholders receive the equivalent amount of total cash payments in 2018 as they would have under the previous payment policy, an additional interim dividend of 43.6 pence per share was announced on 5 December 2017 which was paid on 8 February 2018.
The dividend declared in 2018 for payment on 9 May 2018, 8 August 2018, 15 November 2018 and 7 February 2019 was £1,117 million, £1,112 million, £1,115 million and £1,119 million respectively and is estimated based on the number of shares and the proportion of dividends to be paid in foreign currency using the applicable exchange rate. This takes the total dividend declared in respect of 2018 to £4,463 million.
9 Intangible assets2018
Goodwill £m
Computer software
£m
Trademarks and similar intangibles
£m
Assets in the course of
development £m
Total £m
1 January Cost 44,147 1,119 74,136 71 119,473Accumulated amortisation and impairment (672) (1,016) (1,688)Net book value at 1 January 44,147 447 73,120 71 117,785
Differences on exchange 2,024 – 4,483 6,507Additions – internal development – – – 120 120– acquisitions (note 24) 14 – 13 – 27– separately acquired – – 62 – 62Reallocations (22) 58 30 (66) –Amortisation charge – (102) (342) – (444)Impairment – – (44) – (44)31 December Cost 46,163 1,101 78,736 125 126,125 Accumulated amortisation and impairment (698) (1,414) (2,112)Net book value at 31 December 46,163 403 77,322 125 124,013
Notes on the Accounts continued
150 BAT Annual Report and Form 20-F 2018

Governance Other InformationFinancial StatementsStrategic Report
9 Intangible assets continued
2017
Goodwill £m
Computer software
£m
Trademarks and similar intangibles
£m
Assets in the course of
development £m
Total £m
1 January Cost 11,023 1,054 1,255 60 13,392Accumulated amortisation and impairment (616) (659) (1,275)Net book value at 1 January 11,023 438 596 60 12,117
Differences on exchange (1,189) (3) (2,669) – (3,861)Additions – internal development – – – 87 87– acquisitions (note 24) 34,313 33 75,488 4 109,838– separately acquired – 29 98 – 127Reallocations – 80 – (80) –Amortisation charge – (88) (268) – (356)Impairment – (42) (125) – (167)31 December Cost 44,147 1,119 74,136 71 119,473Accumulated amortisation and impairment (672) (1,016) (1,688)Net book value at 31 December 44,147 447 73,120 71 117,785
Included in computer software and assets in the course of development are internally developed assets with a carrying value of £523 million (2017: £459 million). The costs of internally developed assets include capitalised expenses of employees working full time on software development projects, third-party consultants, and software licence fees from third-party suppliers.
The Group has £6 million future contractual commitments (2017: £16 million) related to intangible assets.
Trademarks and similar intangibles with indefinite livesIncluded in the net book value of trademarks and similar intangibles are trademarks relating to the acquisition of RAI with indefinite lives amounting to £73,885 million (2017: £69,562 million).
The trademarks and similar intangibles have been tested for impairment in line with the following methodology. The recoverable amounts of trademarks and similar intangibles with indefinite lives have been determined on a value-in-use basis. The value-in-use calculations use cash flows based on detailed brand budgets prepared by management using projected sales volumes and projected brand profitability covering a five-year to 10-year horizon depending on the brand and, thereafter, grown into perpetuity. The brand budgets include an allocation for corporate costs based on volumes. The discount rate of 6.5% and long-term growth rates applied to the brand value-in-use calculations have been determined by local management based on experience, specific market and brand trends, pricing expectations and costs. The brand budgets are incorporated into the budget information used in the goodwill impairment review below. Following the application of a reasonable range of sensitivities, there was no indication of impairment.
Trademarks and similar intangibles with definite livesIncluded in the net book value of trademarks and similar intangibles are trademarks relating to the acquisition of RAI £3,013 million (2017: £3,097 million), Skandinavisk Tobakskompagni (ST) £209 million (2017: £230 million) and TDR d.o.o. £40 million (2017: £61 million).
During 2018, a purchase price allocation adjustment was recognised in respect of the provisional goodwill recognised as a result of the Group acquiring certain tobacco assets, including a distribution company, from Bulgartabac Holdings AD in Bulgaria. The provisional goodwill of £22 million was reclassified to trademarks and similar intangibles with definite lives.
Impairment testing for goodwillGoodwill of £46,163 million (2017: £44,147 million) is included in intangible assets in the balance sheet of which the following are the significant acquisitions: RAI £35,117 million (2017: £33,062 million); Rothmans Group £4,856 million (2017: £4,834 million); Imperial Tobacco Canada £2,307 million (2017: £2,367 million); ETI (Italy) £1,478 million (2017: £1,462 million) and ST (principally Scandinavia) £1,111 million (2017: £1,102 million). The principal allocations of goodwill in the Rothmans’ acquisition are to the cash-generating units of Europe and South Africa, with the remainder mainly relating to operations in the domestic and export markets in the United Kingdom and operations in APME.
As a consequence of the Group’s new regional structure effective 1 January 2018, goodwill allocated to the Western Europe cash-generating unit (2017: £4,033 million and pre-tax discount rate of 7.3%) has been combined with the goodwill allocated to the Eastern Europe cash-generating unit (2017: £980 million and pre-tax discount rate of 8.1%) to create the new Europe cash-generating unit.
In 2018, goodwill was allocated for impairment testing purposes to 19 (2017: 19) individual cash-generating units – one in the United States (2017: one), five in APME (2017: five), six in AMSSA (2017: six) and seven in ENA (2017: seven).
151BAT Annual Report and Form 20-F 2018

Financial Statements
Notes on the Accounts continued
9 Intangible assets continued2018 2017
Carryingamount
£m
Pre‑taxdiscount rate
%
Carryingamount
£m
Pre-taxdiscount rate
%
Cash Generating UnitRAI 35,117 7.7 33,062 7.7Canada 2,307 7.5 2,367 7.5Europe 5,069 7.5 5,013 7.3 / 8.1South Africa 605 10.6 661 9.6Australia 740 7.9 775 7.9Singapore 615 6.6 591 6.6Malaysia 448 8.2 431 8.3Other 1,262 1,247 Total 46,163 44,147
The recoverable amounts of all cash-generating units have been determined on a value-in-use basis. The key assumptions for the recoverable amounts of all units are the budgeted volumes, operating margins and long-term growth rates, which directly impact the cash flows, and the discount rates used in the calculation. The long-term growth rate is used purely for the impairment testing of goodwill under IAS 36 Impairment of Assets and does not reflect long-term planning assumptions used by the Group for investment proposals or for any other assessments.
Pre-tax discount rates of between 6.6% and 22.0% (2017: 6.6% and 19.2%) were used, based on the Group’s weighted average cost of capital, taking into account the cost of capital and borrowings, to which specific market-related premium adjustments are made. These adjustments are derived from external sources and are based on the spread between bonds (or credit default swaps, or similar indicators) issued by the US or comparable governments and by the local government, adjusted for the Group’s own credit market risk. For ease of use and consistency in application, these results are periodically calibrated into bands based on internationally recognised credit ratings. The long-term growth rates and discount rates have been applied to the budgeted cash flows of each cash-generating unit. These cash flows have been determined by local management based on experience, specific market and brand trends, pricing expectations and costs, and have been endorsed by Group management as part of the consolidated Group budget.
The value-in-use calculations use cash flows based on detailed financial budgets prepared by management covering a one-year period extrapolated over a 10-year horizon with growth of 4% in years 2 to 10, including 2% inflation (2017: 1% inflation), where after a total growth rate of 2% (2017: 2%) has been assumed. A 10-year horizon is considered appropriate based on the Group’s history of profit and cash growth, its well-balanced portfolio of brands and the industry in which it operates. In some instances, such as recent acquisitions, start-up ventures or in specific cases, the valuation is expanded to reflect the medium-term plan of the country or market management spanning five years or beyond. If discounted cash flows for cash-generating units should fall by 10%, or the discount rate was increased at a post-tax rate of 1%, there would be no impairment.
On 15th November 2018, the U.S. Food and Drug Administration (FDA) announced an intention to ban flavoured vaping products and menthol cigarettes. Market speculation in the days leading up to the announcement over the financial impact of a possible menthols ban had a significant negative impact on the share price of the Group.
However, the Group does not believe that there is an impairment trigger at this stage on either the Newport brand or the US goodwill for the following reasons:
– the multitude of procedures embedded in the comprehensive rule-making process;
– the possibility that any proposed regulation fails to withstand judicial review;
– the possibility that any proposed regulation would not apply to the US market for several years;
– the uncertainty surrounding how any potential regulation will affect the manufacture and marketing of Newport; and
– the lack of any other indicators of impairment in relation to the US business.
The Group will continue to monitor developments in relation to the proposed ban on flavoured vaping products and menthol cigarettes.
152 BAT Annual Report and Form 20-F 2018

Governance Other InformationFinancial StatementsStrategic Report
10 Property, plant and equipment
2018
Freehold property
£m
Leasehold property
£m
Plant and equipment
£m
Assets in the course of
construction £m
Total £m
1 JanuaryCost 1,455 267 5,552 917 8,191Accumulated depreciation and impairment (369) (124) (2,816) (3,309)Net book value at 1 January 1,086 143 2,736 917 4,882
Differences on exchange 76 4 27 (5) 102Additions – separately acquired 5 1 41 722 769Reallocations 58 2 466 (526) –Depreciation (34) (11) (318) (363)Impairment (74) – (120) (194)Disposals (13) – (17) (30)31 December Cost 1,515 268 5,763 1,108 8,654Accumulated depreciation and impairment (411) (129) (2,948) (3,488)Net book value at 31 December 1,104 139 2,815 1,108 5,166
In 2018, the differences on exchange include £149 million of indexation in respect of the operations in Venezuela. However, management believes that such a revaluation is not reflective of the fair value of assets in Venezuela and an impairment charge of £110 million has been recognised, as explained in note 3(h).
2017
Freehold property
£m
Leasehold property
£m
Plant and equipment
£m
Assets in the course of
construction £m
Total £m
1 JanuaryCost 1,163 239 5,022 725 7,149Accumulated depreciation and impairment (360) (116) (2,991) (21) (3,488)Net book value at 1 January 803 123 2,031 704 3,661
Differences on exchange (33) (11) (117) (49) (210)Additions – acquisitions (note 24) 349 4 626 62 1,041– separately acquired 23 – 47 753 823Reallocations (5) 35 523 (553) –Depreciation (29) (7) (352) (388)Impairment (1) (1) (10) (12)Disposals (4) – (12) (16)Net reclassifications as held-for-sale (17) – – (17)31 December Cost 1,455 267 5,552 917 8,191Accumulated depreciation and impairment (369) (124) (2,816) (3,309)Net book value at 31 December 1,086 143 2,736 917 4,882
Net book value of assets held under finance leases for 2018 was £16 million (2017: £29 million).
The Group’s finance lease arrangements relate principally to the lease of tobacco vending machines by the Group’s subsidiary in Japan. In 2017, the Group’s finance lease arrangements related principally to the lease of tobacco vending machines and buildings in Japan and Peru respectively. Assets held under finance leases are secured under finance lease obligations included in note 20.
As explained in note 12, contributions to the British American Tobacco UK Pension Fund are secured by a charge over the Group’s Head Office (Globe House). Globe House is included in freehold property above with a carrying value of £185 million (2017: £187 million).
153BAT Annual Report and Form 20-F 2018

Financial Statements
Notes on the Accounts continued
10 Property, plant and equipment continued
2018
£m2017
£m
Cost of freehold land within freehold property on which no depreciation is provided 255 253Leasehold property comprises – net book value of long leasehold 100 104– net book value of short leasehold 46 39 146 143Contracts placed for future expenditure 141 85
11 Investments in associates and joint ventures
2018
£m2017
£m
1 January 1,577 9,507Total comprehensive income (note 5) 387 23,316Dividends (211) (688)Additions – 13Reclassification of Reynolds American Inc. (RAI) – (30,521)Other equity movements (16) (50)31 December 1,737 1,577Non-current assets 1,225 1,127Current assets 953 1,019Non-current liabilities (71) (67)Current liabilities (370) (502) 1,737 1,577ITC Ltd. (Group’s share of the market value is £11,465 million (2017: £11,036 million)) 1,682 1,527Other listed associates (Group’s share of the market value is £183 million (2017: £184 million)) 20 18Unlisted associates 35 32 1,737 1,577
On 25 July 2017, the Group announced the completion of the acquisition of the remaining 57.8% of RAI the Group did not already own. As at that date, RAI ceased to be reported as an associate and has become a fully owned subsidiary. Accordingly, as at that date, RAI has been consolidated in accordance with IFRS 10 Consolidated Financial Statements. Included in the £30,521 million is the gain arising on the deemed disposal of RAI of £23,288 million. This gain includes amounts restated in accordance with IAS 21 The Effects of Changes in Foreign Exchange Rates (see note 19).
Prior to 25 July 2017, the Group accounted for RAI as an associate, having concluded that it did not have de facto control of RAI because of the operation of the governance agreement between the Group and RAI which ensured that the Group did not have the practical ability to direct relevant activities of RAI.
The Group’s investment in Tisak d.d. (Tisak) was acquired as part of the TDR transaction (note 24). During 2016, the Group entered into an agreement with Tisak’s parent Agrokor d.d. (Agrokor) to convert certain outstanding trading balances into long-term loans and an additional shareholding in Tisak. As part of the agreement, Agrokor had the right to reacquire the additional shareholding in Tisak. As a consequence of this, while the Group had legal ownership of the additional shareholding, it did not consider that the shares provided any additional equity interest and continued to account for 26% of the equity of Tisak. In 2017, due to the financial difficulties of Agrokor and Tisak, the Group fully impaired this investment. This resulted in a charge of £27 million to the income statement that has been reported as an adjusting item in note 5. In July 2018, Agrokor’s creditors approved a settlement plan proposed by Agrokor’s administrators that is expected to be implemented during 2019. In its current form, the settlement plan is unlikely to return any value to the Group on this investment.
Included within the dividends amount of £211 million (2017: £688 million) are £nil million (2017: £477 million) attributable to dividends declared by RAI and £204 million (2017: £204 million) attributable to dividends declared by ITC.
The principal associate undertaking of the Group is ITC Ltd. (ITC) as shown under associates undertakings and joint ventures.
154 BAT Annual Report and Form 20-F 2018

Governance Other InformationFinancial StatementsStrategic Report
11 Investments in associates and joint ventures continuedITC Ltd.ITC is an Indian conglomerate based in Kolkata and maintains a presence in cigarettes, hotels, paper and packaging, agri-business and other fast-moving goods (e.g. confectionery, IT, branded apparel, personal care, greetings cards and safety matches). BAT’s interest in ITC is 29.57%.
ITC prepares accounts on a quarterly basis with a 31 March year end. As permitted by IAS 28, results up to 30 September 2018 have been used in applying the equity method. This is driven by the availability of information at the half year, to be consistent with the treatment in the Group’s interim accounts. Any further information available after the date used for reporting purposes is reviewed and any material items adjusted for in the final results. The latest published information available is at 31 December 2018.
2018
£m2017
£m
Non-current assets 4,106 3,738Current assets 2,823 3,089Non-current liabilities (238) (240)Current liabilities (1,002) (1,446) 5,689 5,141
Group’s share of ITC Ltd. (2018: 29.57%; 2017: 29.71%) 1,682 1,527
12 Retirement benefit schemesThe Group’s subsidiary undertakings operate over 190 retirement benefit arrangements worldwide. The majority of scheme members belong to defined benefit schemes, most of which are funded externally and many of which are closed to new entrants. The Group also operates a number of defined contribution schemes.
The liabilities arising in the defined benefit schemes are determined in accordance with the advice of independent, professionally qualified actuaries, using the projected unit credit method. It is Group policy that all schemes are formally valued at least every three years.
The principal schemes are in the USA, UK, Germany, Canada, The Netherlands and Switzerland. Together, schemes in these territories account for over 85% of the total obligations of the Group’s defined benefit schemes. These obligations consist mainly of final salary pension schemes which provide benefits to members in the form of a guaranteed level of pension payable for life. The level of benefits provided depends on members’ length of service and their salary in the final years leading up to retirement.
In addition, the Group operates several healthcare benefit schemes, of which the most significant are in the USA and Canada. The liabilities in respect of healthcare benefits are also assessed by qualified independent actuaries, applying the projected unit credit method.
All of these arrangements, including funded schemes where formal trusts or equivalents are required, have been developed and are operated in accordance with local practices and regulations where applicable in the countries concerned. For example, in the USA, the main funded pension schemes are the Reynolds American Retirement Plan and the Retirement Income Plan for Certain RAI Affiliates, and the main funded healthcare scheme is the Brown & Williamson Tobacco Corporation Welfare & Fringe Benefit Plan, all of which are established with corporate trustees that are required to run the schemes in accordance with the Plan’s rules and to comply with all relevant legislation, including the Employee Retirement Income Security Act 1974 and US law. Similarly, in the UK, the main pension scheme is the British American Tobacco UK Pension Fund, which is established under trust law and has a corporate trustee that is required to run the scheme in accordance with the Fund’s Trust Deed and Rules and to comply with the Pension Scheme Act 1993, Pensions Act 1995, Pensions Act 2004 and all the relevant legislation.
Responsibility for the governance of the schemes across the Group, including investment decisions and contribution schedules, generally lies with the trustees. The trustees for each arrangement will usually consist of representatives appointed by both the sponsoring company and the beneficiaries. In the USA, the corporate trustees act as custodians with a committee of local management acting in a fiduciary capacity with regard to investment decisions, risk mitigation and administration of the arrangements.
The majority of schemes are subject to local regulations regarding funding requirements. Contributions to defined benefit schemes are determined after consultation with the respective trustees and actuaries of the individual externally funded schemes, and after taking into account regulatory requirements in each territory.
The Group’s contributions to funded retirement benefit schemes in 2019 are expected to be £88 million in total compared to £221 million in 2018.
Contributions to the various funded schemes in the USA are agreed with the relevant corporate Trustee, the named fiduciary, scheme actuaries and the committee of local management after taking account of statutory requirements including the Pensions Protection Act of 2006, as amended. Through its subsidiaries in the USA, the Group intends to make significant regular contributions, when required, with the aim of maintaining a funding status of at least 90%, and becoming fully funded long-term. The Group contributed £87 million to its funded pension plans and £40 million to its funded post-retirement plans in 2018. However, during 2019, the Group does not expect to contribute to its funded pension and post-retirement plans in the USA.
155BAT Annual Report and Form 20-F 2018

Financial Statements
Notes on the Accounts continued
12 Retirement benefit schemes continued Contributions to the British American Tobacco UK Pension Fund for 2017 and 2016 were agreed with the Trustee as part of a recovery plan to include £30 million a year to cover ongoing service costs, with additional contributions to eliminate a funding shortfall. Additional contributions were £78 million in both 2017 and 2016. These contributions were to be used to achieve the statutory funding objective and thereafter to support attaining a lower risk investment strategy (noted below). With effect from July 2018, the Group will pay £18 million a year to meet the cost of future benefit accruals. Additional annual contributions are payable until the Fund is valued to 115% on a Technical Provisions basis, and are expected to be £11 million in 2019.
Total contributions payable to the UK Pension Fund are secured by a charge over the Group’s Head Office (Globe House) up to a maximum of £150 million. The charge would be triggered in the event that the Group defaults on agreed contributions due to the Fund or if an insolvency event occurs with respect to the UK entity responsible for making the payments. The charge is due to be released in 2039 but may be released earlier by negotiation or if the assets of the Fund are sufficient to achieve certain funding levels. Under the rules of the scheme, any future surplus would be returnable to the Group by refund at the end of the life of the scheme. The funding commitment is therefore not considered onerous, and in accordance with IFRIC 14 no additional liabilities or surplus restriction have been recognised in respect of this commitment.
Payments made to pensioners by the operating companies in Germany, net of income on scheme assets, are deemed to be company contributions to the Contractual Trust Arrangements and are anticipated to be around £25 million in 2019 and ranging from £24 million per annum, decreasing to £21 million in 2023. Contributions to pension schemes in Canada, The Netherlands and Switzerland in total are anticipated to be around £25 million in 2019 and then around £10 million per annum for the four years after that.
The majority of benefit payments are from trustee administered funds, however, there are also a number of unfunded schemes where the sponsoring company meets the benefit payment obligation as it falls due. For unfunded schemes in the USA, UK and Canada, 41% of the liabilities reported at year end are expected to be settled by the Group within 10 years, 29% between 10 and 20 years, 17% between 20 and 30 years, and 13% thereafter.
The funded arrangements in the Group have policies on investment management, including strategies over a preferred long-term investment profile, and schemes in certain territories including Canada and The Netherlands manage their bond portfolios to match the weighted average duration of scheme liabilities. For funded schemes in the USA, the Group employs a risk mitigation strategy which seeks to balance pension plan returns with a reasonable level of funded status volatility. Based on this framework, the asset allocation has two primary components. The first component is the hedging portfolio, which uses extended duration fixed income holdings (typically US Government and investment grade corporate bonds) and to a lesser extent derivatives to match a portion of the interest rate risk associated with the benefit obligations, thereby reducing expected funded status volatility. The second component is the return seeking portfolio, which is designed to enhance portfolio returns. The return seeking portfolio is broadly diversified across asset classes. In addition, the main scheme in the UK had a target investment strategy such that, by 31 December 2018, the scheme would have moved to 20% return-seeking assets and 80% risk-reducing assets. This objective was achieved during the first quarter of 2018 and the Trustee has subsequently selected an investment strategy with a high-level target of broadly 10% return-seeking and 90% risk-reducing assets. Investments are diversified by type of investment, by investment sector, and where appropriate by country.
Through its defined benefit pension schemes and healthcare schemes, the Group is exposed to a number of risks, including:
Asset volatility:The plan liabilities are calculated using discount rates set by reference to bond yields. If plan assets underperform this yield, e.g. due to stock market volatility, this will create a deficit. However, most schemes hold a proportion of assets which are expected to outperform bonds in the long term, and the majority of schemes by value are subject to local regulation regarding funding deficits.
Changes in bond yields:A decrease in corporate bond yields will increase scheme liabilities, although this will be partially offset by an increase in the value of the schemes’ bond holdings or other hedging instruments.
Inflation risk:Some of the Group’s pension obligations are linked to inflation and higher inflation will lead to higher liabilities, although in most cases, caps on the level of inflationary increases are in place in the scheme rules, while some assets and derivatives provide specific inflation protection.
Life expectancy:The majority of the schemes’ obligations are to provide benefits for the life of the member, so increases in life expectancy will result in an increase in the plans’ liabilities. Assumptions regarding mortality and mortality improvements are regularly reviewed in line with actuarial tables and scheme specific experience.
156 BAT Annual Report and Form 20-F 2018

Governance Other InformationFinancial StatementsStrategic Report
12 Retirement benefit schemes continued The amounts recognised in the balance sheet are determined as follows:
Pension schemes Healthcare schemes Total
2018£m
2017£m
2018£m
2017£m
2018£m
2017£m
Present value of funded scheme liabilities (11,031) (11,542) (286) (326) (11,317) (11,868)Fair value of funded scheme assets 11,747 12,157 178 193 11,925 12,350 716 615 (108) (133) 608 482Unrecognised funded scheme surpluses (20) (23) – – (20) (23) 696 592 (108) (133) 588 459Present value of unfunded scheme liabilities (531) (535) (575) (622) (1,106) (1,157) 165 57 (683) (755) (518) (698)
The above net asset/(liability) is recognised in the balance sheet as follows:
– retirement benefit scheme liabilities (982) (1,065) (683) (756) (1,665) (1,821)– retirement benefit scheme assets 1,147 1,122 – 1 1,147 1,123 165 57 (683) (755) (518) (698)
The net liabilities of funded pension schemes by territory are as follows:
Liabilities Assets Total
2018£m
2017£m
2018£m
2017£m
2018£m
2017£m
– USA (4,835) (5,022) 4,464 4,640 (371) (382)– UK (2,962) (3,133) 4,016 4,119 1,054 986– Germany (949) (998) 948 945 (1) (53)– Canada (694) (782) 708 779 14 (3)– The Netherlands (782) (769) 793 819 11 50 – Switzerland (326) (330) 283 285 (43) (45)– Rest of the Group (483) (508) 535 570 52 62Funded schemes (11,031) (11,542) 11,747 12,157 716 615
Of the Group’s unfunded pension schemes 48% (2017: 47%) relate to arrangements in the UK and 32% (2017: 33%) relate to arrangements in the USA, while 87% (2017: 86%) of the Group’s unfunded healthcare arrangements relate to arrangements in the USA.
The amounts recognised in the income statement are as follows:
Pension schemes Healthcare schemes Total
2018£m
2017£m
2018£m
2017£m
2018£m
2017£m
Defined benefit schemes Service cost – current service cost 95 104 2 – 97 104– past service cost/(credit), curtailments and settlements – 11 (1) – (1) 11Net interest on the net defined benefit liability – interest on scheme liabilities 364 291 33 19 397 310– interest on scheme assets (362) (276) (8) (4) (370) (280)– interest on unrecognised funded scheme surpluses 2 2 – – 2 2 99 132 26 15 125 147Defined contribution schemes 87 68 – – 87 68Total amount recognised in the income statement (note 3(a)) 186 200 26 15 212 215
The above charges are recognised within employee benefit costs in note 3(a) and include a charge of £3 million in 2018 (2017: £12 million charge) in respect of settlements, past service costs and defined contribution costs reported as part of the restructuring costs charged in arriving at profit from operations (note 3(e)). Included in current service costs in 2018 is £16 million (2017: £16 million) of administration costs.
157BAT Annual Report and Form 20-F 2018

Financial Statements
Notes on the Accounts continued
12 Retirement benefit schemes continued The movements in scheme liabilities are as follows:
Pension schemes Healthcare schemes Total
2018£m
2017£m
2018£m
2017£m
2018£m
2017£m
Present value at 1 January 12,077 7,510 948 120 13,025 7,630Differences on exchange 295 (199) 43 (35) 338 (234)Current service cost 95 105 2 2 97 107Past service cost/(credit) – 4 – – – 4Settlements (10) 7 (1) – (11) 7Interest on scheme liabilities 364 292 33 19 397 311Contributions by scheme members 2 3 – – 2 3Benefits paid (694) (523) (62) (31) (756) (554)Acquisition of subsidiaries – 5,211 – 882 – 6,093Actuarial (gains)/losses – arising from changes in demographic assumptions (12) (418) (4) (8) (16) (426)– arising from changes in financial assumptions (547) 92 (49) 9 (596) 101Experience gains (8) (7) (49) (10) (57) (17)Present value at 31 December 11,562 12,077 861 948 12,423 13,025
Changes in financial assumptions principally relate to discount rate movements in both years.
Scheme liabilities by scheme membership:
Pension schemes Healthcare schemes Total
2018£m
2017£m
2018£m
2017£m
2018£m
2017£m
Active members 1,785 1,928 55 69 1,840 1,997Deferred members 1,259 1,394 2 3 1,261 1,397Retired members 8,518 8,755 804 876 9,322 9,631Present value at 31 December 11,562 12,077 861 948 12,423 13,025
Approximately 95% of scheme liabilities in both years relate to guaranteed benefits.
158 BAT Annual Report and Form 20-F 2018

Governance Other InformationFinancial StatementsStrategic Report
12 Retirement benefit schemes continuedThe movements in funded scheme assets are as follows:
Pension schemes Healthcare schemes Total
2018£m
2017£m
2018£m
2017£m
2018£m
2017£m
Fair value of scheme assets at 1 January 12,157 7,264 193 14 12,350 7,278Differences on exchange 262 (170) 8 (7) 270 (177)Settlements (10) (1) – – (10) (1)Interest on scheme assets 362 277 8 4 370 281Company contributions 176 232 45 22 221 254Contributions by scheme members – 4 – – – 4Benefits paid (684) (509) (61) (25) (745) (534)Acquisition of subsidiaries – 4,574 – 180 – 4,754Actuarial gains/(losses) (516) 486 (15) 5 (531) 491Fair value of scheme assets at 31 December 11,747 12,157 178 193 11,925 12,350
Pension schemes Healthcare schemes Total
2018£m
2017£m
2018£m
2017£m
2018£m
2017£m
Equities – listed 1,133 2,444 5 6 1,138 2,450Equities – unlisted 930 1,337 59 71 989 1,408Bonds – listed 5,925 5,272 11 14 5,936 5,286Bonds – unlisted 1,672 1,346 84 84 1,756 1,430Other assets – listed 618 682 10 9 628 691Other assets – unlisted 1,469 1,076 9 9 1,478 1,085Fair value of scheme assets at 31 December 11,747 12,157 178 193 11,925 12,350
Scheme assets have been diversified into equities, bonds and other assets and are typically invested via fund investment managers into both pooled and segregated mandates of listed and unlisted equities and bonds.
In the USA, pension plan assets are invested using active investment strategies and multiple investment management firms. Managers within each asset class cover a range of investment styles and approaches. Allowable investment types include global equity, fixed income, real assets, private equity and absolute return. The range of allowable investment types utilised for pension assets provides enhanced returns and more widely diversifies the plan.
In addition, certain scheme assets, including a portion of the assets held in the main UK pension scheme, are further diversified by investing in equities listed on non-UK stock exchanges via investment funds. The main UK scheme also makes use of liability driven investment funds and inflation opportunity funds as part of its investment portfolio.
In the above analysis investments via equity-based investment funds are shown under listed equities, and investments via bond-based investment funds are shown under listed bonds. Other assets include cash and other deposits, derivatives and other hedges, recoverable taxes, reinsurance contracts, infrastructure investments and investment property.
The actuarial gains and losses in both years principally relate to movements in the fair values of scheme assets and actual returns are stated net of applicable taxes and fund management fees. The fair values of listed scheme assets were derived from observable data including quoted market prices and other market data, including market values of individual segregated investments and of pooled investment funds where quoted. The fair values of unlisted assets were derived from cash flow projections of estimated future income after taking into account the estimated recoverable value of these assets.
159BAT Annual Report and Form 20-F 2018

Financial Statements
Notes on the Accounts continued
12 Retirement benefit schemes continued The movements in the unrecognised scheme surpluses, recognised in other comprehensive income, are as follows:
Pension schemes Healthcare schemes Total
2018£m
2017£m
2016£m
2018£m
2017£m
2016£m
2018£m
2017£m
2016£m
Unrecognised funded scheme surpluses at 1 January (23) (18) (11) – – – (23) (18) (11)Differences on exchange 1 3 (4) – – – 1 3 (4)Interest on unrecognised funded scheme surpluses (2) (2) (2) – – – (2) (2) (2)Movement in year (note 19) 4 (6) (1) – – – 4 (6) (1)Unrecognised funded scheme surpluses at 31 December (20) (23) (18) – – – (20) (23) (18)
The principal actuarial assumptions (weighted to reflect individual scheme differences) used in the following principal countries are shown below. In both years, discount rates are determined by reference to normal yields on high quality corporate bonds at the balance sheet date. For countries where there is not a deep market in such corporate bonds, the yield on government bonds is used.
2018 2017
USA UK Germany CanadaThe
Netherlands Switzerland USA UK Germany CanadaThe
Netherlands Switzerland
Rate of increase in salaries (%) 3.9 3.2 1.7 3.0 2.1 1.3 3.9 3.2 2.5 3.0 2.0 1.3Rate of increase in pensions in payment (%) 2.5 3.2 1.1 Nil 1.1 Nil 2.5 3.2 1.8 Nil 1.2 NilRate of increase in deferred pensions (%) – 2.2 1.1 Nil 1.1 – – 2.2 1.8 Nil 1.2 –Discount rate (%) 4.3 2.9 1.3 3.8 1.8 0.9 3.7 2.5 1.9 3.3 2.0 0.6General inflation (%) 2.5 3.2 1.1 2.0 2.0 1.1 2.5 3.2 1.8 2.0 2.0 1.0
2018 2017
USA UK Germany CanadaThe
Netherlands Switzerland USA UK Germany CanadaThe
Netherlands Switzerland
Weighted average duration of liabilities (years) 10.8 16.0 8.2 10.5 17.5 12.8 11.3 16.9 13.7 11.0 17.8 13.5
160 BAT Annual Report and Form 20-F 2018

Governance Other InformationFinancial StatementsStrategic Report
12 Retirement benefit schemes continuedFor healthcare inflation in the USA, the assumption is 6.5% (2017: 7.0%) and in Canada, the assumption is 5.0% (2017: 5.0%).
Mortality assumptions are subject to regular review. The principal schemes used the following tables at year-end:
USA RP-2018 mortality tables without collar or amounts adjusted projected with MP-2018 generational projection (2017: RP-2017 and MP-2017)
UK S2PA (YOB) with the CMI (2017) improvement model with a 1.25% long term improvement rate (2017: CMI (2016))Germany RT Heubeck 2018 G (2017: Heubeck 2005 G)Canada CPM-2014 Private Table (both years)The Netherlands AG Prognosetafel 2018 (2017: AG Prognosetafel 2016)Switzerland LPP/BVG 2015 base table with CMI projection factors for mortality improvements with a 1.5% long-term improvement rate
(both years)
Based on the above, the weighted average life expectancy, in years, for mortality tables used to determine benefit obligations is as follows:
USA UK Germany Canada The Netherlands Switzerland
Male Female Male Female Male Female Male Female Male Female Male Female
31 December 2018 Member age 65 (current life expectancy) 20.7 22.7 22.6 24.1 17.0 20.6 21.5 23.9 20.8 24.5 21.8 23.8Member age 45 (life expectancy at age 65) 22.3 24.2 24.2 25.4 19.8 22.8 22.5 24.8 23.1 26.5 23.6 25.6
31 December 2017 Member age 65 (current life expectancy) 20.7 22.7 22.7 24.2 19.3 23.3 21.4 23.8 20.8 24.8 21.7 23.7Member age 45 (life expectancy at age 65) 22.3 24.2 24.3 25.5 21.9 25.8 22.5 24.8 23.3 27.0 23.5 25.5
For the remaining territories, typical assumptions are that real salary increases will be from 0.5% to 6.3% (2017: 0.5% to 4.0%) per annum and discount rates will be from 0.6% to 7.6% (2017: 0.5% to 10.0%) above inflation. Pension increases, where allowed for, are generally assumed to be in line with inflation. Assumptions of life expectancy are in line with best practice in each territory.
The valuation of retirement benefit schemes involves judgements about uncertain future events. Sensitivities in respect of the key assumptions used to measure the principal pension schemes as at 31 December 2018 are set out below. These sensitivities show the hypothetical impact of a change in each of the listed assumptions in isolation, with the exception of the sensitivity to inflation which incorporates the impact of certain correlating assumptions such as salary increases. While each of these sensitivities holds all other assumptions constant, in practice such assumptions rarely change in isolation, while asset values also change, and the impacts may offset to some extent.
1 yearincrease
£m
1 yeardecrease
£m
0.25percentage
point increase
£m
0.25percentage
point decrease
£m
Average life expectancy – increase/(decrease) of scheme liabilities 339 (340) Rate of inflation – increase/(decrease) of scheme liabilities 169 (159)Discount rate – (decrease)/increase of scheme liabilities (267) 286
A one percentage point increase in healthcare inflation would increase healthcare scheme liabilities by £42 million, and a one percentage point decrease would decrease liabilities by £36 million. The income statement effect of this change in assumption is not material.
161BAT Annual Report and Form 20-F 2018

Financial Statements
Notes on the Accounts continued
13 Deferred taxNet deferred tax assets/(liabilities) comprise:
Stockrelief
£m
Excess ofcapital
allowances over
depreciation£m
Taxlosses
£m
Undistributed earnings of
associates and subsidiaries
£m
Retirementbenefits
£mTrademarks
£m
Othertemporarydifferences
£mTotal
£m
At 31 December 2017 (91) (174) 113 (241) 264 (17,323) 656 (16,796)Accounting policy change (IFRS 9) (note 31) – – – – – – 7 7 At 1 January 2018 (91) (174) 113 (241) 264 (17,323) 663 (16,789)Differences on exchange (7) (10) 4 6 15 (1,066) 47 (1,011)Subsidiaries acquired (note 24) – – – – – (3) 4 1Credited/(charged) to the income statement 27 (16) (11) (46) (36) 67 319 304Credited/(charged) relating to changes in tax rates 1 (10) (1) – 4 79 (3) 70(Charged)/credited to other comprehensive income – – – – (25) – 18 (7)At 31 December 2018 (70) (210) 105 (281) 222 (18,246) 1,048 (17,432)Revised At 1 January 2017 31 (58) 89 (392) 117 (95) 92 (216)Differences on exchange 2 15 (6) 13 (12) 862 (22) 852Subsidiaries acquired (note 24) (375) (234) – – 514 (28,091) 1,115 (27,071)Credited/(charged) to the income statement 180 19 30 138 10 66 (291) 152Credited/(charged) relating to changes in tax rates 71 84 – – (194) 9,935 (276) 9,620(Charged)/credited to other comprehensive income – – – – (171) – 38 (133)At 31 December 2017 (91) (174) 113 (241) 264 (17,323) 656 (16,796)
With effect from 1 January 2018, the Group has adopted IFRS 15 Revenue from Contracts with Customers. The Group has revised 2017, as explained in notes 1 and 31.
In 2017, as part of the acquisition of RAI, the Group had to account for the assets and liabilities of the RAI companies at fair market value at the acquisition date of 25 July 2017 (note 24). The increase in the net asset value versus the tax bases created net deferred tax liabilities, valued within the purchase price allocation process at the prevailing Federal and State corporation tax rate at the date of the acquisition. Subsequently on 22 December 2017, the Federal corporation tax rate was changed to 21% from 1 January 2018. This revised rate has been used to revalue the net deferred tax liabilities in the United States, reducing the liability leading to a credit in the income statement of £9,620 million.
The net deferred tax liabilities are reflected in the Group balance sheet as follows: deferred tax asset of £344 million and deferred tax liability of £17,776 million (2017: deferred tax asset of £333 million and deferred tax liability of £17,129 million), after offsetting assets and liabilities where there is a legally enforceable right to offset current tax assets and liabilities and where the deferred income taxes relate to the same fiscal authority.
At the balance sheet date, the Group has not recognised a deferred tax asset in respect of unused tax losses of £308 million (2017: £301 million) which have no expiry date and unused tax losses of £502 million (2017: £616 million) which will expire within the next 10 years.
At the balance sheet date, the Group has not recognised a deferred tax asset in respect of deductible temporary differences of £nil million (2017: £nil million), which have no expiry date and £184 million (2017: £140 million), which will expire within the next 10 years.
At the balance sheet date, the Group has unused tax credits of £80 million (2017: £80 million) which have no expiry date. No amount of deferred tax has been recognised in respect of these unused tax credits.
At the balance sheet date, the aggregate amount of undistributed earnings of subsidiaries which would be subject to dividend withholding tax and for which no withholding tax liability has been recognised was £0.7 billion (2017: £0.7 billion).
162 BAT Annual Report and Form 20-F 2018

Governance Other InformationFinancial StatementsStrategic Report
14 Trade and other receivables
2018
£m2017
£m
Trade receivables 2,868 3,306Loans and other receivables 1,082 1,214Prepayments and accrued income 323 289 4,273 4,809 Current 3,588 4,053Non-current 685 756 4,273 4,809
In certain countries, the Group has entered into factoring arrangements and periodically sells certain trade receivables to banks and other financial institutions, without recourse, for cash. These trade receivables have been derecognised from the statement of financial position, because the Group has transferred substantially all of the risks and rewards of the receivables, including credit risk. The cash inflows have been recognised within operating cash flows. Typically in these arrangements, the Group also acts as a collection agent for the bank. At 31 December, the value of trade receivables derecognised through the factoring arrangements where the Group acts as a collection agent was £428 million and where the Group does not act as a collection agent was £40 million (2017: £139 million, £nil million respectively). Included in trade receivables above is £270 million (2017: £54 million) of trade debtor balances which were available for factoring under these arrangements.
Included in loans and other receivables are £553 million of litigation related deposits (2017: £603 million). The Group has determined that these payments are recoverable on conclusion of ongoing appeals and the deposits have not been discounted. Litigation related deposits include £436 million (2017: £449 million) in respect of payments made by a Group subsidiary in relation to the Quebec Class Action, as detailed in note 28. While there is uncertainty over the timeframe of the appeal process, it is estimated that had discounting been applied the carrying value of the asset would have been reduced by approximately £24 million (2017: £21 million). Amounts receivable from related parties including associated undertakings are shown in note 27.
Trade and other receivables have been reported in the balance sheet net of allowances as follows:
2018
£m2017
£m
Trade receivables – gross 2,898 3,345Trade receivables – allowance (30) (39)Loans and other receivables – gross 1,092 1,260Loans and other receivables – allowance (10) (46)Prepayments and accrued income 323 289Net trade and other receivables per balance sheet 4,273 4,809
The movements in the allowance account are as follows:
Trade receivables
2018£m
Loans and other receivables
2018£m
Total2018
£m
Trade receivables2017
£m
Loans and other receivables
2017£m
Total2017
£m
1 January 39 46 85 87 – 87Accounting policy change (IFRS 9) (notes 1 and 31) 37 8 45 – – –Revised 1 January 76 54 130 87 – 87Differences on exchange 2 – 2 4 – 4Provided in the year 16 10 26 – 46 46Released (64) (54) (118) (52) – (52)31 December 30 10 40 39 46 85
As permitted by IFRS 9, the loss allowance on trade receivables arising from the recognition of revenue under IFRS 15 is initially measured at an amount equal to lifetime expected losses. Allowances in respect of loans and other receivables are initially recognised at an amount equal to 12-month expected credit losses. Allowances are measured at an amount equal to the lifetime expected credit losses where the credit risk on the receivables increases significantly after initial recognition.
Prior to the adoption of IFRS 9 on 1 January 2018, loans and receivables were stated net of allowances for estimated irrecoverable amounts due to the identification of a loss event (the incurred loss method).
The Group holds bank guarantees, other guarantees and credit insurance in respect of some of the past due debtor balances.
Trade and other receivables are predominantly denominated in the functional currencies of subsidiary undertakings apart from the following: US dollar: 3.5% (2017: 1.4%), UK sterling: 4.2% (2017: 4.3%), Euro: 1.6% (2017: 1.5%) and other currencies: 6.6% (2017: 9.6%).
163BAT Annual Report and Form 20-F 2018
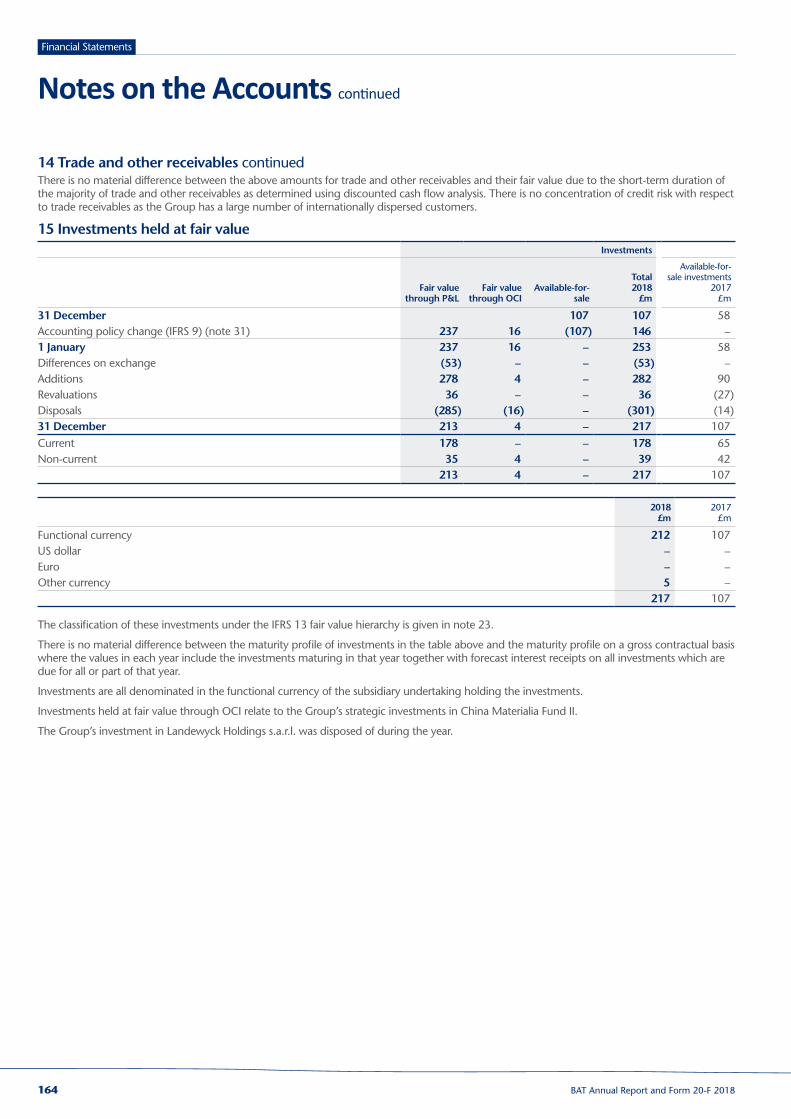
Financial Statements
Notes on the Accounts continued
14 Trade and other receivables continuedThere is no material difference between the above amounts for trade and other receivables and their fair value due to the short-term duration of the majority of trade and other receivables as determined using discounted cash flow analysis. There is no concentration of credit risk with respect to trade receivables as the Group has a large number of internationally dispersed customers.
15 Investments held at fair valueInvestments
Fair value
through P&LFair value
through OCIAvailable‑for‑
sale
Total2018
£m
Available-for-sale investments
2017£m
31 December 107 107 58Accounting policy change (IFRS 9) (note 31) 237 16 (107) 146 –1 January 237 16 – 253 58Differences on exchange (53) – – (53) –Additions 278 4 – 282 90Revaluations 36 – – 36 (27)Disposals (285) (16) – (301) (14)31 December 213 4 – 217 107Current 178 – – 178 65Non-current 35 4 – 39 42
213 4 – 217 107
2018
£m2017
£m
Functional currency 212 107US dollar – –Euro – –Other currency 5 – 217 107
The classification of these investments under the IFRS 13 fair value hierarchy is given in note 23.
There is no material difference between the maturity profile of investments in the table above and the maturity profile on a gross contractual basis where the values in each year include the investments maturing in that year together with forecast interest receipts on all investments which are due for all or part of that year.
Investments are all denominated in the functional currency of the subsidiary undertaking holding the investments.
Investments held at fair value through OCI relate to the Group’s strategic investments in China Materialia Fund II.
The Group’s investment in Landewyck Holdings s.a.r.l. was disposed of during the year.
164 BAT Annual Report and Form 20-F 2018

Governance Other InformationFinancial StatementsStrategic Report
16 Derivative financial instrumentsThe fair values of derivatives are determined based on market data (primarily yield curves, implied volatilities and exchange rates) to calculate the present value of all estimated flows associated with each derivative at the balance sheet date. In the absence of sufficient market data, fair values would be based on the quoted market price of similar derivatives. The classification of these derivative assets and liabilities under the IFRS 13 fair value hierarchy is given in note 23.
2018 2017
Assets£m
Liabilities£m
Assets£m
Liabilities£m
Fair value hedges – interest rate swaps 181 83 97 14– cross-currency swaps 282 – 263 –Cash flow hedges – interest rate swaps – 98 1 –– cross-currency swaps 149 56 187 –– forward foreign currency contracts 61 42 82 73Net investment hedges – forward foreign currency contracts 10 174 85 39Held-for-trading* – interest rate swaps 6 – 68 77– forward foreign currency contracts 46 63 35 31Total 735 516 818 234 Current 179 302 228 155Non-current 556 214 590 79 735 516 818 234 Derivatives – in respect of net debt 647 269 640 117– other 88 247 178 117 735 516 818 234
* Derivatives which do not meet the tests for hedge accounting under IFRS 9 (previously under IAS 39) or which are not designated as hedging instruments are referred to as “held-for-trading”. These derivatives principally consist of forward foreign currency contracts which have not been designated as hedges due to their value changes offsetting with other components of net finance costs relating to financial assets and financial liabilities. The Group do not use derivatives for speculative purposes. All derivatives are undertaken for risk management purposes.
For cash flow hedges, the timing of expected cash flows is as follows: assets of £210 million (2017: £270 million) of which £59 million (2017: £73 million) is expected within one year and £149 million (2017: £165 million) beyond five years and liabilities of £196 million (2017: £73 million) of which £39 million (2017: £69 million) is expected within one year and £113 million (2017: £ nil) beyond five years.
The Group’s cash flow hedges are principally in respect of sales or purchases of inventory and certain debt instruments. A certain number of forward foreign currency contracts were used to manage the currency profile of external borrowings and are reflected in the currency table in note 20. Interest rate swaps have been used to manage the interest rate profile of external borrowings and are reflected in the re-pricing table in note 20.
165BAT Annual Report and Form 20-F 2018

Financial Statements
Notes on the Accounts continued
16 Derivative financial instruments continuedThe tables below set out the maturities of the Group’s derivative financial instruments on an undiscounted contractual basis, based on spot rates.
The maturity dates of all gross-settled derivative financial instruments are as follows:
2018 2017
Assets Liabilities Assets Liabilities
Inflow£m
Outflow£m
Inflow£m
Outflow£m
Inflow£m
Outflow£m
Inflow£m
Outflow£m
Within one year – forward foreign currency contracts 7,081 (6,526) 9,876 (9,749) 8,874 (8,702) 5,929 (6,059)– cross-currency swaps 55 (54) 33 (92) 56 (97) – –Between one and two years – forward foreign currency contracts 332 (330) 449 (441) 339 (328) 229 (230)– cross-currency swaps 36 (43) 20 (73) 89 (135) – –Between two and three years – cross-currency swaps 830 (771) 1,008 (1,075) 60 (108) – –Between three and four years – cross-currency swaps 15 (26) 17 (38) 1,812 (1,782) – –Between four and five years – cross-currency swaps 733 (592) 690 (730) 32 (62) – –Beyond five years – cross-currency swaps 754 (625) 469 (490) 2,623 (2,366) – – 9,836 (8,967) 12,562 (12,688) 13,885 (13,580) 6,158 (6,289)
The maturity dates of net-settled derivative financial instruments, which primarily relate to interest rate swaps, are as follows:
2018 2017
AssetsInflow
£m
LiabilitiesOutflow
£m
AssetsInflow
£m
LiabilitiesOutflow
£m
Within one year 53 40 44 18Between one and two years 48 19 34 5Between two and three years 45 15 28 6Between three and four years 26 13 26 6Between four and five years 23 15 12 7Beyond five years 15 23 28 51 210 125 172 93
166 BAT Annual Report and Form 20-F 2018

Governance Other InformationFinancial StatementsStrategic Report
16 Derivative financial instruments continuedThe items designated as hedging instruments are as follows:
2018
Nominal amount of hedging instrument
£m
Changes in fair value used for
calculating hedge ineffectiveness for
2018£m
Interest rate risk exposure: Fair value hedges – interest rate swaps 4,470 11– cross-currency swaps 1,561 19Cash flow hedges – interest rate swaps 2,715 (98)– cross-currency swaps 2,856 (91)Foreign currency risk exposure: Cash flow hedges – forward foreign currency contracts 3,574 (4)Net investment hedges (derivative related) – forward foreign currency contracts 5,291 (166)Net investment hedges (non-derivative related) – debt (carrying value) in borrowings designated as net investment hedges of net assets 4,647 (226)
17 Inventories
2018
£m2017
£m
Raw materials and consumables 3,049 3,027Finished goods and work in progress 2,877 2,692Goods purchased for resale 103 145 6,029 5,864
Inventories pledged as security for liabilities amount to £7 million (2017: £7 million). Write-offs taken to other operating expenses in the Group income statement comprise £148 million (2017: £114 million; 2016: £127 million), including amounts relating to restructuring costs. Goods purchased for resale include Group brands produced under third party contract manufacturing arrangements.
167BAT Annual Report and Form 20-F 2018
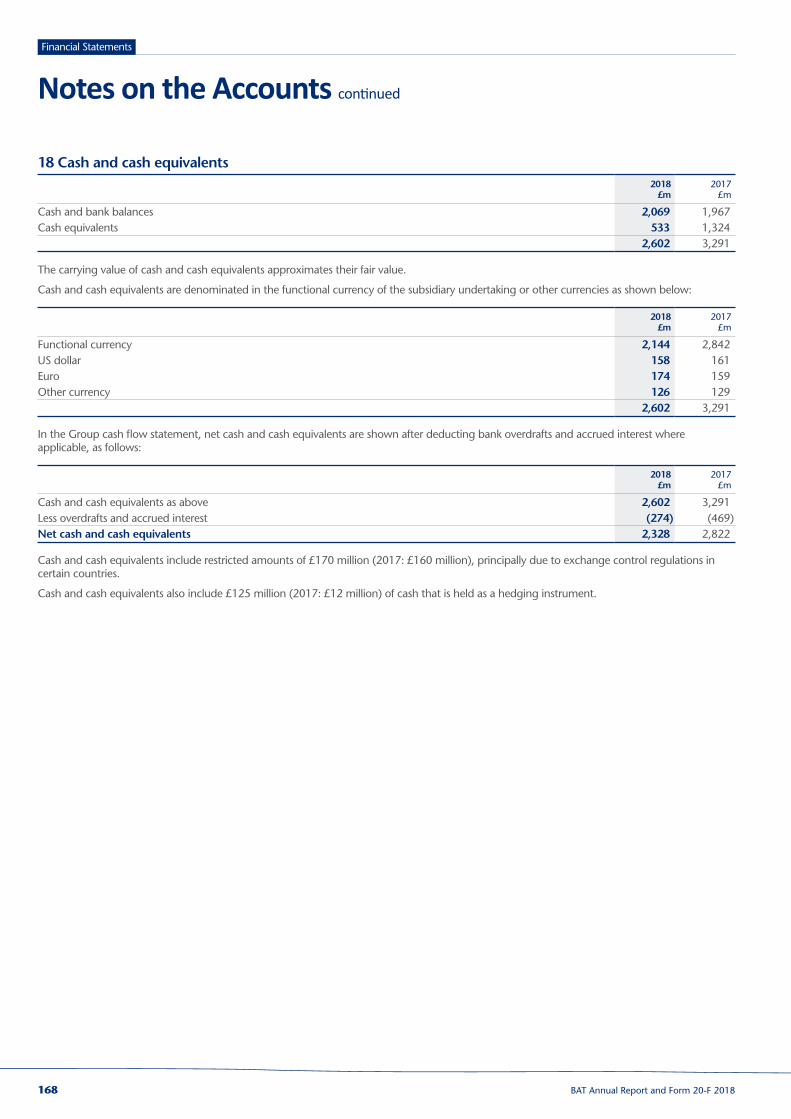
Financial Statements
Notes on the Accounts continued
18 Cash and cash equivalents
2018
£m2017
£m
Cash and bank balances 2,069 1,967Cash equivalents 533 1,324 2,602 3,291
The carrying value of cash and cash equivalents approximates their fair value.
Cash and cash equivalents are denominated in the functional currency of the subsidiary undertaking or other currencies as shown below:
2018
£m2017
£m
Functional currency 2,144 2,842US dollar 158 161Euro 174 159Other currency 126 129 2,602 3,291
In the Group cash flow statement, net cash and cash equivalents are shown after deducting bank overdrafts and accrued interest where applicable, as follows:
2018
£m2017
£m
Cash and cash equivalents as above 2,602 3,291Less overdrafts and accrued interest (274) (469)Net cash and cash equivalents 2,328 2,822
Cash and cash equivalents include restricted amounts of £170 million (2017: £160 million), principally due to exchange control regulations in certain countries.
Cash and cash equivalents also include £125 million (2017: £12 million) of cash that is held as a hedging instrument.
168 BAT Annual Report and Form 20-F 2018

Governance Other InformationFinancial StatementsStrategic Report
19 Capital and reserves – reconciliation of movement in total equity Attributable to owners of the parent
Share capital
£m
Sharepremium,
capitalredemptionand merger
reserves£m
Otherreserves
£m
Retainedearnings
£m
Totalattributable
to owners ofthe parent
£m
Non‑controlling
interests£m
Totalequity
£m
31 December 2017 614 26,602 (3,392) 36,935 60,759 222 60,981Accounting policy change (IFRS 9) (note 31) – – (9) (29) (38) – (38)Revised 1 January 2018 614 26,602 (3,401) 36,906 60,721 222 60,943Comprehensive income and expense Profit for the year – – – 6,032 6,032 178 6,210Differences on exchange – – 3,861 – 3,861 7 3,868Cash flow hedges – net fair value losses – – (58) – (58) – (58)– reclassified and reported in profit for the year – – 17 – 17 – 17Investments held at fair value – reclassified and reported in retained earnings – – (8) 8 – – –Net investment hedges – net fair value losses – – (472) – (472) – (472)– differences on exchange on borrowings – – (236) – (236) – (236)Associates – share of OCI, net of tax (note 5) – – (38) – (38) – (38)Tax on items recognised directly in other comprehensive income that may be reclassified subsequently to profit or loss (note 6(f)) – – 18 – 18 – 18Retirement benefit schemes – net actuarial gains (note 12) – – – 138 138 – 138– surplus recognition and minimum funding obligations (note 12) – – – 4 4 – 4Associates – share of OCI, net of tax (note 5) – – 6 – 6 – 6Tax on items recognised directly in other comprehensive income that will not be reclassified subsequently to profit or loss (note 6(f)) – – – (33) (33) – (33)Cash flow hedges reclassified and reported in total assets – – (22) – (22) – (22)Other changes in equity Employee share options – value of employee services – – – 121 121 – 121– proceeds from shares issued – 4 – – 4 – 4Dividends and other appropriations – ordinary shares (note 8) – – – (4,463) (4,463) – (4,463)– to non-controlling interests – – – – – (163) (163)Purchase of own shares – held in employee share ownership trusts – – – (139) (139) – (139)Non-controlling interests – acquisitions (note 24(c)) – – – (11) (11) – (11)Other movements – – – (6) (6) – (6)31 December 2018 614 26,606 (333) 38,557 65,444 244 65,688
169BAT Annual Report and Form 20-F 2018
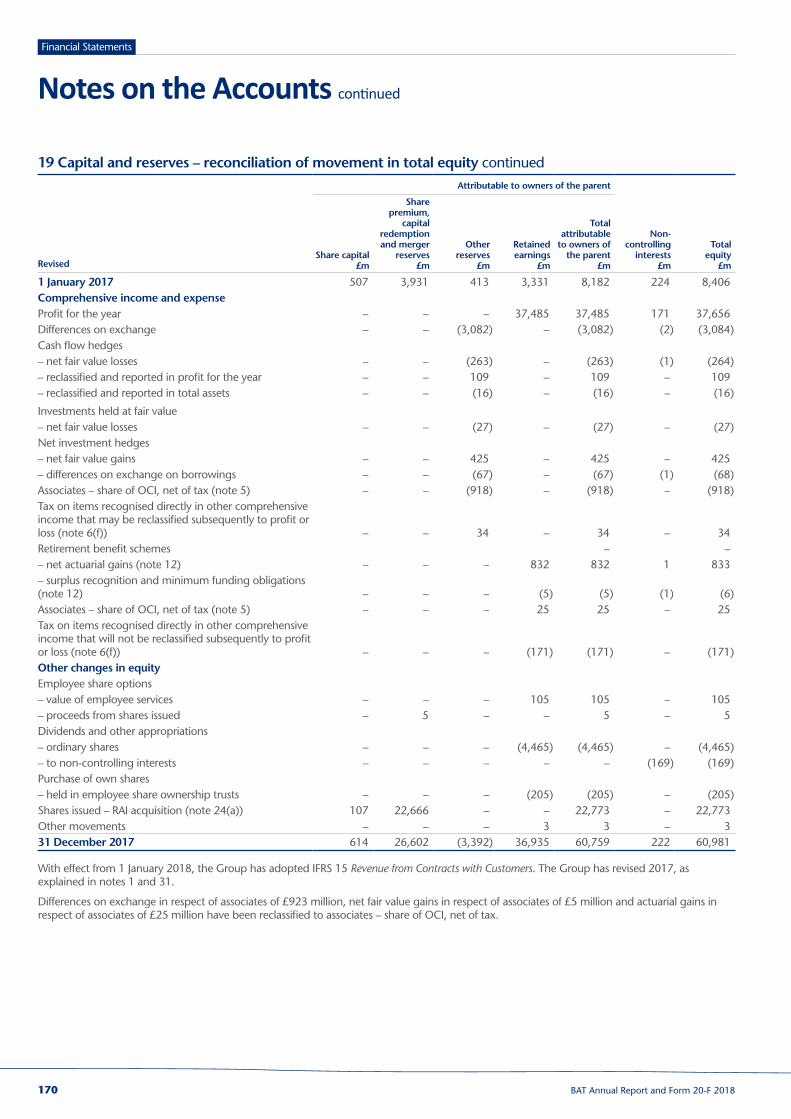
Financial Statements
Notes on the Accounts continued
19 Capital and reserves – reconciliation of movement in total equity continued Attributable to owners of the parent
RevisedShare capital
£m
Sharepremium,
capitalredemptionand merger
reserves£m
Otherreserves
£m
Retainedearnings
£m
Totalattributable
to owners ofthe parent
£m
Non‑controlling
interests£m
Totalequity
£m
1 January 2017 507 3,931 413 3,331 8,182 224 8,406Comprehensive income and expense Profit for the year – – – 37,485 37,485 171 37,656Differences on exchange – – (3,082) – (3,082) (2) (3,084)Cash flow hedges – net fair value losses – – (263) – (263) (1) (264)– reclassified and reported in profit for the year – – 109 – 109 – 109– reclassified and reported in total assets – – (16) – (16) – (16)
Investments held at fair value – net fair value losses – – (27) – (27) – (27)Net investment hedges – net fair value gains – – 425 – 425 – 425– differences on exchange on borrowings – – (67) – (67) (1) (68)Associates – share of OCI, net of tax (note 5) – – (918) – (918) – (918)Tax on items recognised directly in other comprehensive income that may be reclassified subsequently to profit or loss (note 6(f)) – – 34 – 34 – 34Retirement benefit schemes – –– net actuarial gains (note 12) – – – 832 832 1 833– surplus recognition and minimum funding obligations (note 12) – – – (5) (5) (1) (6)Associates – share of OCI, net of tax (note 5) – – – 25 25 – 25Tax on items recognised directly in other comprehensive income that will not be reclassified subsequently to profit or loss (note 6(f)) – – – (171) (171) – (171)Other changes in equity Employee share options – value of employee services – – – 105 105 – 105– proceeds from shares issued – 5 – – 5 – 5Dividends and other appropriations – ordinary shares – – – (4,465) (4,465) – (4,465)– to non-controlling interests – – – – – (169) (169)Purchase of own shares – held in employee share ownership trusts – – – (205) (205) – (205)Shares issued – RAI acquisition (note 24(a)) 107 22,666 – – 22,773 – 22,773Other movements – – – 3 3 – 331 December 2017 614 26,602 (3,392) 36,935 60,759 222 60,981
With effect from 1 January 2018, the Group has adopted IFRS 15 Revenue from Contracts with Customers. The Group has revised 2017, as explained in notes 1 and 31.
Differences on exchange in respect of associates of £923 million, net fair value gains in respect of associates of £5 million and actuarial gains in respect of associates of £25 million have been reclassified to associates – share of OCI, net of tax.
170 BAT Annual Report and Form 20-F 2018
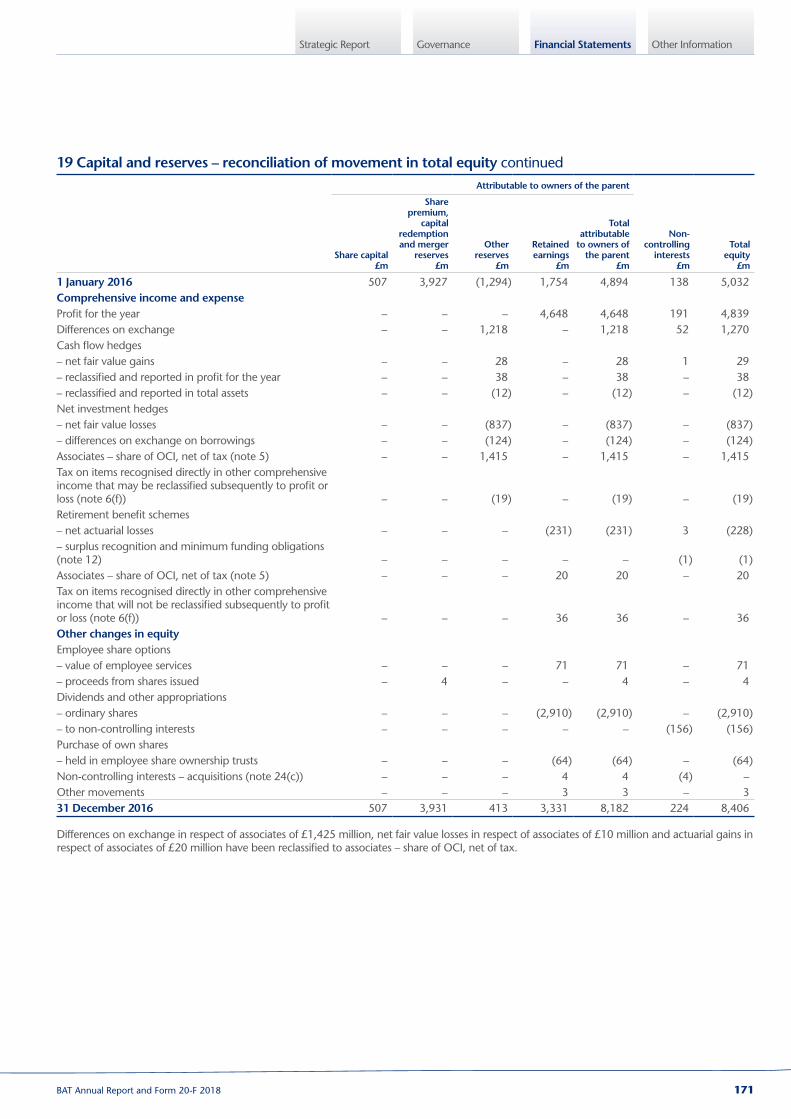
Governance Other InformationFinancial StatementsStrategic Report
19 Capital and reserves – reconciliation of movement in total equity continued Attributable to owners of the parent
Share capital£m
Sharepremium,
capitalredemptionand merger
reserves£m
Otherreserves
£m
Retainedearnings
£m
Totalattributable
to owners ofthe parent
£m
Non‑controlling
interests£m
Totalequity
£m
1 January 2016 507 3,927 (1,294) 1,754 4,894 138 5,032Comprehensive income and expense Profit for the year – – – 4,648 4,648 191 4,839Differences on exchange – – 1,218 – 1,218 52 1,270Cash flow hedges – net fair value gains – – 28 – 28 1 29– reclassified and reported in profit for the year – – 38 – 38 – 38– reclassified and reported in total assets – – (12) – (12) – (12)Net investment hedges – net fair value losses – – (837) – (837) – (837)– differences on exchange on borrowings – – (124) – (124) – (124)Associates – share of OCI, net of tax (note 5) – – 1,415 – 1,415 – 1,415Tax on items recognised directly in other comprehensive income that may be reclassified subsequently to profit or loss (note 6(f)) – – (19) – (19) – (19)Retirement benefit schemes – net actuarial losses – – – (231) (231) 3 (228)– surplus recognition and minimum funding obligations (note 12) – – – – – (1) (1)Associates – share of OCI, net of tax (note 5) – – – 20 20 – 20Tax on items recognised directly in other comprehensive income that will not be reclassified subsequently to profit or loss (note 6(f)) – – – 36 36 – 36Other changes in equity Employee share options – value of employee services – – – 71 71 – 71– proceeds from shares issued – 4 – – 4 – 4Dividends and other appropriations – ordinary shares – – – (2,910) (2,910) – (2,910)– to non-controlling interests – – – – – (156) (156)Purchase of own shares – held in employee share ownership trusts – – – (64) (64) – (64)Non-controlling interests – acquisitions (note 24(c)) – – – 4 4 (4) –Other movements – – – 3 3 – 331 December 2016 507 3,931 413 3,331 8,182 224 8,406
Differences on exchange in respect of associates of £1,425 million, net fair value losses in respect of associates of £10 million and actuarial gains in respect of associates of £20 million have been reclassified to associates – share of OCI, net of tax.
171BAT Annual Report and Form 20-F 2018

Financial Statements
Notes on the Accounts continued
19 Capital and reserves – reconciliation of movement in total equity continued(a) Share premium account, capital redemption reserves and merger reserves comprise:
Sharepremiumaccount
£m
Capitalredemption
reserves£m
Mergerreserves
£mTotal
£m
31 December 2018 91 101 26,414 26,60631 December 2017 87 101 26,414 26,60231 December 2016 82 101 3,748 3,931
The share premium account includes the difference between the value of shares issued and their nominal value. The increase of £4 million (2017: £5 million; 2016: £4 million) relates solely to ordinary shares issued under the Company’s share option schemes.
On the purchase of own shares as part of the share buy-back programme for shares which are cancelled, a transfer is made from retained earnings to the capital redemption reserve equivalent to the nominal value of shares purchased. Purchased shares which are not cancelled are classified as treasury shares and presented as a deduction from total equity.
In 1999, shares were issued for the acquisition of the Rothmans International B.V. Group, and the difference between the fair value of shares issued and their nominal value of £3,748 million was credited to merger reserves.
On 25 July 2017, the Group announced the completion of the acquisition of the remaining 57.8% of RAI not already owned by the Group. Shares were issued for the acquisition and the difference between the fair value of shares issued and their nominal value of £22,666 million was credited to merger reserves.
Total equity attributable to owners of the parent is stated after deducting the cost of treasury shares which include £4,845 million (2017: £4,845 million; 2016: £4,845 million) for shares repurchased and not cancelled and £397 million (2017: £350 million; 2016 £208 million) in respect of the cost of own shares held in employee share ownership trusts.
The share buy-back programme was suspended from 30 July 2014. As at 31 December 2018, treasury shares include 7,536,408 (2017: 6,750,597; 2016: 5,137,602) of shares held in trust and 162,645,590 (2017: 162,645,590; 2016: 162,645,590) of shares repurchased and not cancelled as part of the Company’s share buy-back programme.
Other movements in shareholders’ funds principally relate to the release of treasury shares as a result of the exercise of share options.
Called up share capital
Ordinaryshares of 25p eachNumber of shares £m
Allotted and fully paid 1 January 2018 2,456,278,414 614.06Changes during the year – share option schemes 137,470 0.03
31 December 2018 2,456,415,884 614.09
Allotted and fully paid 1 January 2017 2,027,019,508 506.75Changes during the year – share option schemes 213,144 0.05– Issue of shares RAI acquisition 429,045,762 107.26
31 December 2017 2,456,278,414 614.06
Allotted and fully paid 1 January 2016 2,026,866,724 506.71Changes during the year – share option schemes 152,784 0.04
31 December 2016 2,027,019,508 506.75
(b) Information on the principal components of non-controlling interests is provided in note 29.
172 BAT Annual Report and Form 20-F 2018

Governance Other InformationFinancial StatementsStrategic Report
19 Capital and reserves – reconciliation of movement in total equity continuedMovements in other reserves and retained earnings (which are after deducting treasury shares) shown above comprise:
Retained earnings
Translationreserve
£m
Hedgingreserve
£m
Fair value reserve
£m
Revaluationreserve
£mOther
£m
Total otherreserves
£m
Treasuryshares
£mOther
£m
31 December 2017 (4,029) (132) 17 179 573 (3,392) (5,195) 42,130Accounting policy change (IFRS 9) (note 31) – – (9) – – (9) – (29)1 January 2018 (4,029) (132) 8 179 573 (3,401) (5,195) 42,101Comprehensive income and expense Profit for the year – – – – – – – 6,032Differences on exchange 3,861 – – – – 3,861 – –Cash flow hedges – net fair value losses – (58) – – – (58) – –– reclassified and reported in profit for the year – 17 – – – 17 – –Investments held at fair value – reclassified and reported in retained earnings – – (8) – – (8) – 8Net investment hedges – net fair value losses (472) – – – – (472) – –– differences on exchange on borrowings (236) – – – – (236) – –Associates – share of OCI, net of tax (note 5) (38) – – – – (38) – –Tax on items recognised directly in other comprehensive income that may be reclassified subsequently to profit or loss (note 6(f)) – 18 – – – 18 – –Retirement benefit schemes – net actuarial gains (note 12) – – – – – – – 138– surplus recognition and minimum funding obligations (note 12) – – – – – – – 4Associates – share of OCI, net of tax (note 5) – – 6 – – 6 – –Tax on items recognised directly in other comprehensive income that will not be reclassified subsequently to profit or loss (note 6(f)) – – – – – – – (33)Cash flow hedges reclassified and reported in total assets – (22) – – – (22) – –Other changes in equity Employee share options – value of employee services – – – – – – – 121Dividends and other appropriations – ordinary shares (note 8) – – – – – – – (4,463)Purchase of own shares – held in employee share ownership trusts – – – – – – (139) –Non-controlling interests – acquisitions (note 24(c)) – – – – – – – (11)Other movements – – – – – – 92 (98)31 December 2018 (914) (177) 6 179 573 (333) (5,242) 43,799
With effect from 1 January 2018, the Group has adopted IFRS 15 Revenue from Contracts with Customers. The Group has revised 2017, as explained in notes 1 and 31.
In 2018, within the translation reserve differences on exchange, a gain of £107 million has been recognised in relation to the application of hyperinflationary accounting in Venezuela as explained in note 3 (h).
173BAT Annual Report and Form 20-F 2018

Financial Statements
Notes on the Accounts continued
19 Capital and reserves – reconciliation of movement in total equity continued Retained earnings
Revised
Translationreserve
£m
Hedgingreserve
£m
Available-for-salereserve
£m
Revaluationreserve
£mOther
£m
Total other reserves
£m
Treasuryshares
£mOther
£m
1 January 2017 (382) 4 39 179 573 413 (5,053) 8,384Comprehensive income and expense Profit for the year – – – – – – – 37,485Differences on exchange (3,082) – – – – (3,082) – –Cash flow hedges – net fair value losses – (263) – – – (263) – –– reclassified and reported in profit for the year – 109 – – – 109 – –– reclassified and reported in total assets – (16) – – – (16) – –Investments held at fair value – net fair value losses – – (27) – – (27) – –Net investment hedges – net fair value gains 425 – – – – 425 – –– differences on exchange on borrowings (67) – – – – (67) – –Associates – share of OCI, net of tax (note 5) (923) – 5 – – (918) – –Tax on items recognised directly in other comprehensive income that may be reclassified subsequently to profit or loss (note 6(f)) – 34 – – – 34 – –Retirement benefit schemes – net actuarial gains (note 12) – – – – – – – 832– surplus recognition and minimum funding obligations (note 12) – – – – – – – (5)Associates – share of OCI, net of tax (note 5) – – – – – – – 25Tax on items recognised directly in other comprehensive income that will not be reclassified subsequently to profit or loss (note 6(f)) – – – – – – – (171)Other changes in equity Employee share options – value of employee services – – – – – – – 105Dividends and other appropriations – ordinary shares – – – – – – – (4,465)Purchase of own shares – held in employee share ownership trusts – – – – – – (205) 0Other movements – – – – – – 63 (60)31 December 2017 (4,029) (132) 17 179 573 (3,392) (5,195) 42,130
174 BAT Annual Report and Form 20-F 2018
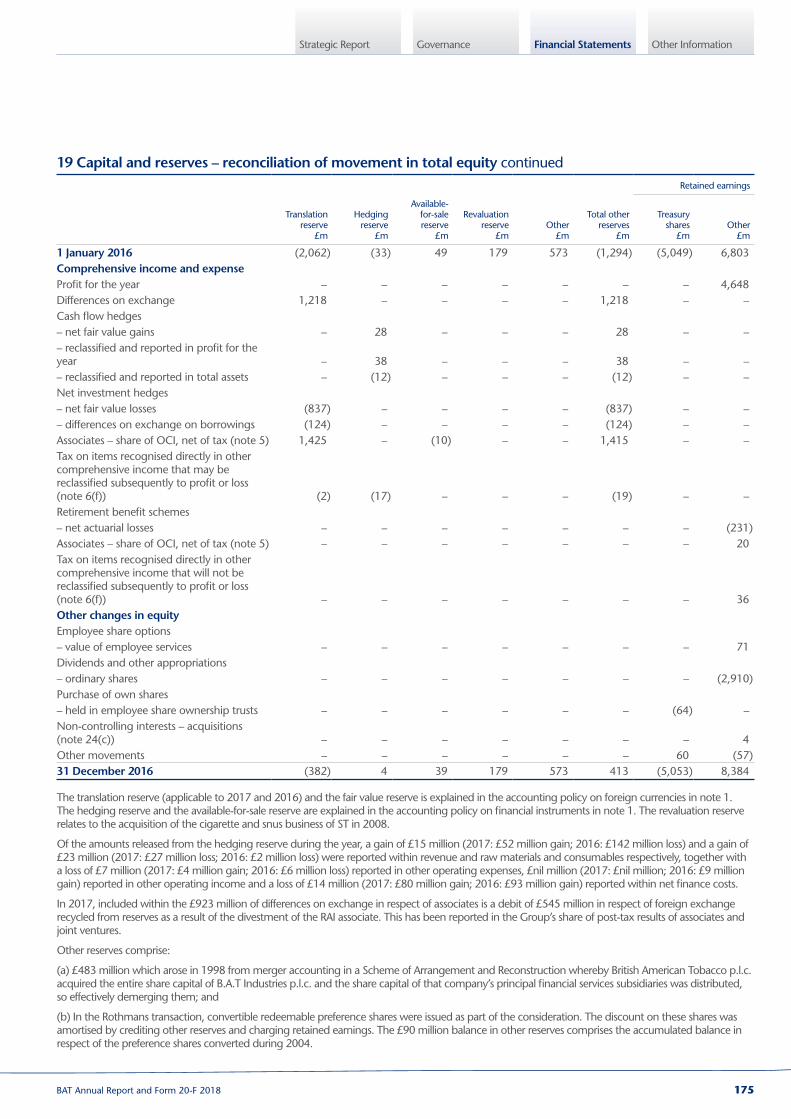
Governance Other InformationFinancial StatementsStrategic Report
19 Capital and reserves – reconciliation of movement in total equity continued Retained earnings
Translationreserve
£m
Hedgingreserve
£m
Available-for-salereserve
£m
Revaluationreserve
£mOther
£m
Total otherreserves
£m
Treasuryshares
£mOther
£m
1 January 2016 (2,062) (33) 49 179 573 (1,294) (5,049) 6,803Comprehensive income and expense Profit for the year – – – – – – – 4,648Differences on exchange 1,218 – – – – 1,218 – –Cash flow hedges – net fair value gains – 28 – – – 28 – –– reclassified and reported in profit for the year – 38 – – – 38 – –– reclassified and reported in total assets – (12) – – – (12) – –Net investment hedges – net fair value losses (837) – – – – (837) – –– differences on exchange on borrowings (124) – – – – (124) – –Associates – share of OCI, net of tax (note 5) 1,425 – (10) – – 1,415 – –Tax on items recognised directly in other comprehensive income that may be reclassified subsequently to profit or loss (note 6(f)) (2) (17) – – – (19) – –Retirement benefit schemes – net actuarial losses – – – – – – – (231)Associates – share of OCI, net of tax (note 5) – – – – – – – 20Tax on items recognised directly in other comprehensive income that will not be reclassified subsequently to profit or loss (note 6(f)) – – – – – – – 36Other changes in equity Employee share options – value of employee services – – – – – – – 71Dividends and other appropriations – ordinary shares – – – – – – – (2,910)Purchase of own shares – held in employee share ownership trusts – – – – – – (64) –Non-controlling interests – acquisitions (note 24(c)) – – – – – – – 4Other movements – – – – – – 60 (57)31 December 2016 (382) 4 39 179 573 413 (5,053) 8,384
The translation reserve (applicable to 2017 and 2016) and the fair value reserve is explained in the accounting policy on foreign currencies in note 1. The hedging reserve and the available-for-sale reserve are explained in the accounting policy on financial instruments in note 1. The revaluation reserve relates to the acquisition of the cigarette and snus business of ST in 2008.
Of the amounts released from the hedging reserve during the year, a gain of £15 million (2017: £52 million gain; 2016: £142 million loss) and a gain of £23 million (2017: £27 million loss; 2016: £2 million loss) were reported within revenue and raw materials and consumables respectively, together with a loss of £7 million (2017: £4 million gain; 2016: £6 million loss) reported in other operating expenses, £nil million (2017: £nil million; 2016: £9 million gain) reported in other operating income and a loss of £14 million (2017: £80 million gain; 2016: £93 million gain) reported within net finance costs.
In 2017, included within the £923 million of differences on exchange in respect of associates is a debit of £545 million in respect of foreign exchange recycled from reserves as a result of the divestment of the RAI associate. This has been reported in the Group’s share of post-tax results of associates and joint ventures.
Other reserves comprise:
(a) £483 million which arose in 1998 from merger accounting in a Scheme of Arrangement and Reconstruction whereby British American Tobacco p.l.c. acquired the entire share capital of B.A.T Industries p.l.c. and the share capital of that company’s principal financial services subsidiaries was distributed, so effectively demerging them; and
(b) In the Rothmans transaction, convertible redeemable preference shares were issued as part of the consideration. The discount on these shares was amortised by crediting other reserves and charging retained earnings. The £90 million balance in other reserves comprises the accumulated balance in respect of the preference shares converted during 2004.
175BAT Annual Report and Form 20-F 2018

Financial Statements
Notes on the Accounts continued
19 Capital and reserves – reconciliation of movement in total equity continuedThe tax attributable to components of other comprehensive income is as follows:
2018
£m2017
£m2016
£m
Translation reserve Net investment hedges – net fair value gains/(losses) – – (2) – – (2)Hedging reserve Cash flow hedges – net fair value losses/(gains) 18 34 (11)– reclassified and reported in profit for the year – – (6) 18 34 (17)Retained earnings – actuarial (gains)/losses in respect of subsidiaries (33) (171) 36 (33) (171) 36Owners of the parent (15) (137) 17Non-controlling interests – – –Total tax recognised in other comprehensive income for the year (note 6(f)) (15) (137) 17
176 BAT Annual Report and Form 20-F 2018

Governance Other InformationFinancial StatementsStrategic Report
20 Borrowings
Currency Maturity dates Interest rates2018
£m2017
£m
Eurobonds Euro 2019 to 2045 0.4% to 4.9% 8,717 8,585 Euro 2021 3m EURIBOR +50bps 986 1,326 UK sterling 2019 to 2055 1.8% to 7.3% 4,671 4,680 US dollar 2019 1.6% 512 482 Swiss franc 2021 to 2026 0.6% to 1.4% 523 498Bonds issued pursuant to Rules under the US Securities Act (as amended) US dollar 2019 to 2047 2.3% to 8.1% 25,428 25,545
US dollar 2020 to 2022USD 3m LIBOR + 59bps to 88bps 1,381 1,665
Bonds and notes 42,218 42,781Commercial paper 536 1,200Other loans 3,859 4,466Bank loans 608 512Bank overdrafts 274 469Finance leases 14 22 47,509 49,450
The interest on the commercial paper referred to in the table above is based on USD LIBOR plus a margin ranging between 22 and 65 basis points and EURIBOR plus a margin ranging between 8 and 15 basis points (2017: USD LIBOR plus a margin ranging between 19 and 38 basis points and EURIBOR plus a margin ranging between 10 and 24 basis points).
Current borrowings per the balance sheet include interest payable of £470 million at 31 December 2018 (2017: £445 million). Included within borrowings are £6,245 million (2017: £6,690 million) of borrowings subject to fair value hedges where their amortised cost has been increased by £179 million (2017: £208 million) in the table above.
The fair value of borrowings is estimated to be £44,457 million (2017: £50,449 million). £39,169 million (2017: £43,780 million) has been calculated using quoted market prices and is within level 1 of the fair value hierarchy. £5,288 million (2017: £6,669 million) has been calculated based on discounted cash flow analysis and is within level 3 of the fair value hierarchy.
The amounts secured on Group assets as at 31 December 2018 is £75 million (2017: £159 million), including finance leases of £14 million (2017: £20 million) and amounts secured on certain inventory of the Group (note 17).
Borrowings are repayable as follows:
Per balance sheet Contractual gross maturities
2018
£m2017
£m2018
£m2017
£m
Within one year 4,225 5,423 5,636 6,381Between one and two years 7,261 2,344 8,471 3,609Between two and three years 2,958 7,011 4,086 8,141Between three and four years 7,095 2,913 8,131 4,034Between four and five years 2,580 6,857 3,462 7,836Beyond five years 23,390 24,902 32,712 34,842 47,509 49,450 62,498 64,843
The contractual gross maturities in each year include the borrowings maturing in that year together with forecast interest payments on all borrowings which are outstanding for all or part of that year.
177BAT Annual Report and Form 20-F 2018

Financial Statements
Notes on the Accounts continued
20 Borrowings continuedBorrowings are denominated in the functional currency of the subsidiary undertaking or other currencies as shown below:
Functionalcurrency
£m
USdollar
£m
UKsterling
£mEuro£m
Canadiandollar
£m
Othercurrencies
£mTotal
£m
31 December 2018 Total borrowings 32,612 3,803 450 10,089 – 555 47,509Effect of derivative financial instruments – cross-currency swaps 4,029 17 (450) (3,653) – (256) (313)– forward foreign currency contracts (1,905) 1,961 – (389) – 321 (12) 34,736 5,781 – 6,047 – 620 47,18431 December 2017 Total borrowings 32,580 4,789 450 10,837 – 794 49,450Effect of derivative financial instruments – cross-currency swaps 3,903 16 (450) (3,613) – (243) (387)– forward foreign currency contracts (1,142) 922 – (388) 215 388 (5) 35,341 5,727 – 6,836 215 939 49,058
The exposure to interest rate changes when borrowings are re-priced is as follows:
Within1 year
£m
Between1-2 years
£m
Between2-3 years
£m
Between3-4 years
£m
Between4-5 years
£m
Beyond5 years
£mTotal
£m
31 December 2018 Total borrowings 10,384 4,540 1,967 4,577 2,585 23,456 47,509Effect of derivative financial instruments – interest rate swaps 3,069 (589) (539) (236) – (1,705) –– cross-currency swaps 1,318 – (793) – (700) (138) (313) 14,771 3,951 635 4,341 1,885 21,613 47,19631 December 2017 Total borrowings 12,516 2,325 4,321 1,941 4,332 24,015 49,450Effect of derivative financial instruments – interest rate swaps 2,995 – (554) (533) (222) (1,686) –– cross-currency swaps 1,287 (17) – (775) – (882) (387) 16,798 2,308 3,767 633 4,110 21,447 49,063
Finance lease liabilities per the balance sheet and on a contractual gross maturity basis are payable as follows: £7 million (2017: £10 million) repayable within one year and £7 million (2017: £12 million) repayable between one and five years. There is no material difference between the repayable principal and the total gross cash flows shown above.
The Group’s undrawn committed borrowing facilities (note 23) total £6,000 million (2017: £5,400 million) with £3,000 million (2017: £2,400 million) maturing within one year and with £3,000 million expiring between two and three years (2017: £3,000 million expiring between three and four years).
178 BAT Annual Report and Form 20-F 2018

Governance Other InformationFinancial StatementsStrategic Report
20 Borrowings continuedThe Group defines net debt as follows:
2018
£m2017
£m
Borrowings* 47,509 49,450Derivatives in respect of net debt: – assets (note 16) (647) (640)– liabilities (note 16) 269 117Cash and cash equivalents (note 18) (2,602) (3,291)Current investments held at fair value (note 15) (178) (65) 44,351 45,571
* Borrowings as at 31 December 2018 include £944 million (2017: £947 million) in respect of the purchase price adjustments relating to the acquisition of Reynolds.
The movements in net debt are presented below:
2018
£m
Opening balance
Accounting policy change
(IFRS 9) (note 31)
Revised opening balance
Subsidiaries acquired Cash flow
Foreign exchange,
accrued interest and
otherClosing balance
Borrowings 49,450 – 49,450 – (3,671) 1,730 47,509Derivatives in respect of net debt: – assets (note 16) (640) – (640) – 109 (116) (647)– liabilities (note 16) 117 – 117 – (6) 158 269Cash and cash equivalents (note 18) (3,291) – (3,291) (1) 563 127 (2,602)Current investments held at fair value (note 15) (65) (144) (209) – 9 22 (178) 45,571 (144) 45,427 (1) (2,996) 1,921 44,351
2017
£m
Opening balance
Subsidiaries acquired Cash flow
Foreign exchange,
accrued interest and
otherClosing balance
Borrowings 19,495 11,203 20,024 (1,272) 49,450Derivatives in respect of net debt: – assets (note 16) (809) – 106 63 (640)– liabilities (note 16) 300 – (380) 197 117Cash and cash equivalents (note 18) (2,204) (1,288) 57 144 (3,291)Current investments held at fair value (note 15) (15) – (44) (6) (65) 16,767 9,915 19,763 (874) 45,571
179BAT Annual Report and Form 20-F 2018

Financial Statements
Notes on the Accounts continued
21 Provisions for liabilities
Restructuringof existing businesses
£m
Employee‑related
benefits£m
Fox River£m
Otherprovisions
£mTotal
£m
1 January 2018 158 40 138 417 753Differences on exchange – (3) – (15) (18)Provided in respect of the year 41 10 – 50 101Utilised during the year (72) (14) (30) (71) (187)31 December 2018 127 33 108 381 649
Analysed on the balance sheet as: – current 74 17 19 208 318– non-current 53 16 89 173 331 127 33 108 381 649
Restructuringof existing businesses
£m
Employee-related
benefits£m
Fox River£m
Otherprovisions
£mTotal
£m
1 January 2017 190 40 163 400 793Differences on exchange 4 (3) – (22) (21)Subsidiaries acquired – – – 42 42Provided in respect of the year 172 15 – 95 282Utilised during the year (208) (12) (25) (98) (343)31 December 2017 158 40 138 417 753
Analysed on the balance sheet as: – current 87 24 22 266 399– non-current 71 16 116 151 354 158 40 138 417 753
The restructuring provisions relate to the restructuring and integration costs incurred and reported as adjusting items in the income statement. The principal restructuring activities in 2018 and 2017 are as described in note 3(e). While some elements of the non-current provisions of £53 million will unwind over several years, as termination payments are made over extended periods in some countries, it is estimated that approximately 30% will unwind within five years.
Employee-related benefits mainly relate to employee benefits other than post-employment benefits. The principal components of these provisions are gratuity and termination awards, and ‘jubilee’ payments due after a certain service period. It is estimated that approximately 30% of the non-current provisions of £16 million will unwind within five years.
A provision of £274 million was made in 2011 for a potential claim under a 1998 settlement agreement entered into by a Group subsidiary in respect of the clean-up of sediment in the Fox River. On 30 September 2014, the Group, NCR, Appvion and Windward Prospects entered into a funding agreement; the details of this agreement are explained in note 28. This agreement led to payments of £25 million in 2018 (2017: £18 million). In addition, the Group incurred legal costs of £5 million (2017: £7 million), which were also charged against the provision. It is expected that the non-current provision will unwind within five years.
On 10 February 2017, a decision was delivered on the further hearing related to a payment of dividends by Windward to Sequana in May 2009. Further details are provided in note 28.
Other provisions comprise balances set up in the ordinary course of general business that cannot be classified within the other categories, such as sales returns and onerous contracts, together with amounts in respect of supplier, excise and other disputes. The nature of the amounts provided in respect of disputes is such that the extent and timing of cash flows are difficult to estimate and the ultimate liability may vary from the amounts provided.
Amounts provided above are shown net of reversals of unused provisions which include reversals of £12 million (2017: £7 million) for restructuring of existing businesses, £4 million (2017: £5 million) for employee benefits and £111 million (2017: £49 million) for other provisions, of which £56 million was reclassified to trade and other payables.
180 BAT Annual Report and Form 20-F 2018
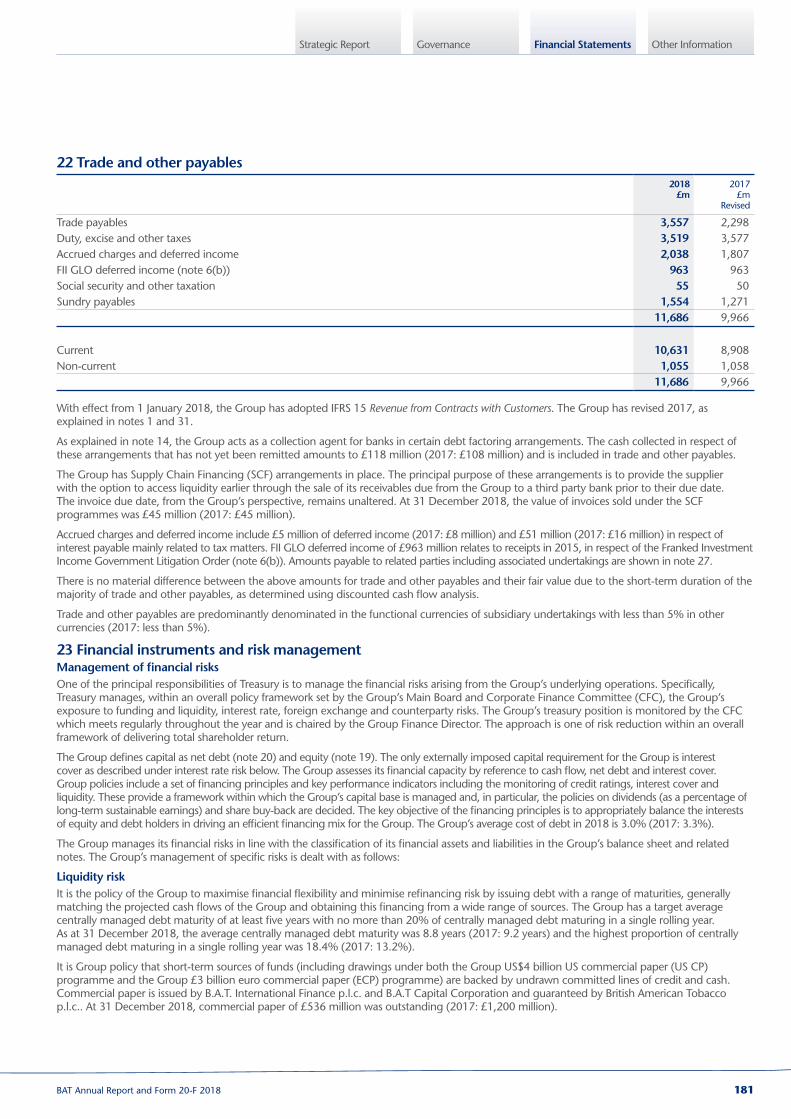
Governance Other InformationFinancial StatementsStrategic Report
22 Trade and other payables
2018£m
2017£m
Revised
Trade payables 3,557 2,298Duty, excise and other taxes 3,519 3,577Accrued charges and deferred income 2,038 1,807FII GLO deferred income (note 6(b)) 963 963Social security and other taxation 55 50Sundry payables 1,554 1,271 11,686 9,966
Current 10,631 8,908Non-current 1,055 1,058 11,686 9,966
With effect from 1 January 2018, the Group has adopted IFRS 15 Revenue from Contracts with Customers. The Group has revised 2017, as explained in notes 1 and 31.
As explained in note 14, the Group acts as a collection agent for banks in certain debt factoring arrangements. The cash collected in respect of these arrangements that has not yet been remitted amounts to £118 million (2017: £108 million) and is included in trade and other payables.
The Group has Supply Chain Financing (SCF) arrangements in place. The principal purpose of these arrangements is to provide the supplier with the option to access liquidity earlier through the sale of its receivables due from the Group to a third party bank prior to their due date. The invoice due date, from the Group’s perspective, remains unaltered. At 31 December 2018, the value of invoices sold under the SCF programmes was £45 million (2017: £45 million).
Accrued charges and deferred income include £5 million of deferred income (2017: £8 million) and £51 million (2017: £16 million) in respect of interest payable mainly related to tax matters. FII GLO deferred income of £963 million relates to receipts in 2015, in respect of the Franked Investment Income Government Litigation Order (note 6(b)). Amounts payable to related parties including associated undertakings are shown in note 27.
There is no material difference between the above amounts for trade and other payables and their fair value due to the short-term duration of the majority of trade and other payables, as determined using discounted cash flow analysis.
Trade and other payables are predominantly denominated in the functional currencies of subsidiary undertakings with less than 5% in other currencies (2017: less than 5%).
23 Financial instruments and risk managementManagement of financial risksOne of the principal responsibilities of Treasury is to manage the financial risks arising from the Group’s underlying operations. Specifically, Treasury manages, within an overall policy framework set by the Group’s Main Board and Corporate Finance Committee (CFC), the Group’s exposure to funding and liquidity, interest rate, foreign exchange and counterparty risks. The Group’s treasury position is monitored by the CFC which meets regularly throughout the year and is chaired by the Group Finance Director. The approach is one of risk reduction within an overall framework of delivering total shareholder return.
The Group defines capital as net debt (note 20) and equity (note 19). The only externally imposed capital requirement for the Group is interest cover as described under interest rate risk below. The Group assesses its financial capacity by reference to cash flow, net debt and interest cover. Group policies include a set of financing principles and key performance indicators including the monitoring of credit ratings, interest cover and liquidity. These provide a framework within which the Group’s capital base is managed and, in particular, the policies on dividends (as a percentage of long-term sustainable earnings) and share buy-back are decided. The key objective of the financing principles is to appropriately balance the interests of equity and debt holders in driving an efficient financing mix for the Group. The Group’s average cost of debt in 2018 is 3.0% (2017: 3.3%).
The Group manages its financial risks in line with the classification of its financial assets and liabilities in the Group’s balance sheet and related notes. The Group’s management of specific risks is dealt with as follows:
Liquidity riskIt is the policy of the Group to maximise financial flexibility and minimise refinancing risk by issuing debt with a range of maturities, generally matching the projected cash flows of the Group and obtaining this financing from a wide range of sources. The Group has a target average centrally managed debt maturity of at least five years with no more than 20% of centrally managed debt maturing in a single rolling year. As at 31 December 2018, the average centrally managed debt maturity was 8.8 years (2017: 9.2 years) and the highest proportion of centrally managed debt maturing in a single rolling year was 18.4% (2017: 13.2%).
It is Group policy that short-term sources of funds (including drawings under both the Group US$4 billion US commercial paper (US CP) programme and the Group £3 billion euro commercial paper (ECP) programme) are backed by undrawn committed lines of credit and cash. Commercial paper is issued by B.A.T. International Finance p.l.c. and B.A.T Capital Corporation and guaranteed by British American Tobacco p.l.c.. At 31 December 2018, commercial paper of £536 million was outstanding (2017: £1,200 million).
181BAT Annual Report and Form 20-F 2018

Financial Statements
Notes on the Accounts continued
23 Financial instruments and risk management continuedThe Group utilises cash pooling and zero balancing bank account structures in addition to intercompany loans and borrowings to mobilise cash efficiently within the Group. The key objectives of Treasury in respect of cash and cash equivalents are to protect their principal value, to concentrate cash at the centre, to minimise the required debt issuance and to optimise the yield earned. The amount of debt issued by the Group is determined by forecasting the net debt requirement after the mobilisation of cash.
The Group continues to target a solid investment-grade credit rating. Following the announcement of the agreement to acquire the remaining 57.8% of Reynolds American Inc. not already owned by the Group, in January 2017, Moody’s and S&P revised the Group’s rating to Baa2 and BBB+ with stable outlook, respectively. The Group’s strategy is to continue deleveraging post completion of the transaction and is seeking to recover to Baa1/BBB+ in the medium term. The Group is confident of its continued ability to successfully access the debt capital markets.
As part of its short-term cash management, the Group invests in a range of cash and cash equivalents, including money market funds, which are regarded as highly liquid and are not exposed to significant changes in fair value. These are kept under continuous review as described in the credit risk section below. At 31 December 2018, cash and cash equivalents include £25 million invested in money market funds (2017: £668 million).
Subsidiary companies are funded by share capital and retained earnings, loans from the central finance companies on commercial terms, or through local borrowings by the subsidiaries in appropriate currencies to predominantly fund short-to-medium term working capital requirements. All contractual borrowing covenants have been met and none of them is expected to inhibit the Group’s operations or funding plans.
In January 2018, the Group repaid the £600 million that was drawn under the 364-day £3 billion Group revolving credit facility. The facility had a one-year extension option which was utilised in July 2018.
In March and June 2018, the Group repaid €400 million and US$2,500 million bonds at maturity respectively.
In March and April 2017, the Group arranged short term bilateral facilities with core relationship banks for a total amount of approximately £1.6 billion. These facilities provided an alternative source of cost-effective short-term funding for the Group and all matured prior to year-end 2017. In June 2017, the Group repaid US$600 million and €1.25 billion bonds at maturity and in August 2017, the Group paid on maturity a US$500 million bond.
In July 2017, following the shareholder approvals of acquisition of RAI, the Group utilised its US$25 billion acquisition facility provided by a syndicate of relationship banks, comprising US$15 billion and US$5 billion bridge facilities with one and two-year maturities, respectively. In addition, the acquisition facility included two £1.9 billion (equivalent of US$2.5 billion) term loans with maturity in 2020 and 2022, respectively. In August 2017, the bridge facilities were refinanced in the US and European capital markets.
Four series of bonds were issued in August 2017, pursuant to the EMTN programme and comprised of a £450 million bond maturing in August 2025 and three euro denominated bonds totalling €3.1 billion, comprising of a €1.1 billion bond maturing in August 2021, a €750 million bond maturing in November 2023 and a €1.25 billion bond maturing in January 2030. Eight series of US$ denominated unregistered bonds totalling US$17.25 billion were issued in August 2017 pursuant to Rule 144A with registration rights, whereby the Group committed to investors that the bonds would be exchangeable for registered notes. In October 2018, investors were offered to exchange their unregistered bonds for registered bonds in line with the registration rights. The exchange offer was completed in November with 99.7% of the bonds exchanged.
Additionally, in 2017, the Group replaced its existing £3 billion revolving credit facility maturing in 2021 with a new two-tranche £6 billion revolving credit facility. This consists of a 364-day revolving credit facility of £3 billion (with a one-year extension, which was exercised in 2018, and a one-year term-out option), and a £3 billion revolving credit facility maturing in 2021. At 31 December 2018, the facility was undrawn (2017: £600 million).
The Group also increased the EMTN programme in 2017 from £15 billion to £25 billion and increased its US and European commercial paper programmes from US$3 billion to US$4 billion and from £1 billion to £3 billion, respectively, to accommodate the liquidity needs of the enlarged Group.
Currency riskThe Group is subject to exposure on the translation of the net assets of foreign currency subsidiaries and associates into its reporting currency, sterling. The Group’s primary balance sheet translation exposures are to the US dollar, Canadian dollar, euro, Danish krone, Swiss franc, South African rand, Russian rouble, Brazilian real, Australian dollar, Malaysian ringgit, Singaporean dollar and Indian Rupees. These exposures are kept under continuous review. The Group’s policy on borrowings is to broadly match the currency of these borrowings with the currency of cash flows arising from the Group’s underlying operations. Within this overall policy, the Group aims to minimise all balance sheet translation exposure where it is practicable and cost-effective to do so through matching currency assets with currency borrowings. The main objective of these policies is to protect shareholder value by increasing certainty and minimising volatility in earnings per share. At 31 December 2018, the currency profile of the Group’s gross debt, after taking into account derivative contracts, was 65% US dollar (2017: 62%), 13% euro (2017: 14%), 16% sterling (2017: 20%), and 6% other currencies (2017: 4%).
The Group faces currency exposures arising from the translation of profits earned in foreign currency subsidiaries and associates and joint arrangements; these exposures are not normally hedged. Exposures also arise from:
(i) foreign currency denominated trading transactions undertaken by subsidiaries. These exposures comprise committed and highly probable forecast sales and purchases, which are offset wherever possible. The remaining exposures are hedged within the Treasury policies and procedures with forward foreign exchange contracts and options, which are designated as hedges of the foreign exchange risk of the identified future transactions; and
(ii) forecast dividend flows from subsidiaries to the centre. To ensure cash flow certainty, the Group enters into forward foreign exchange contracts which are designated as net investment hedges of the foreign exchange risk arising from the investments in these subsidiaries.
IFRS 7 requires a sensitivity analysis that shows the impact on the income statement and on items recognised directly in other comprehensive income of hypothetical changes of exchange rates in respect of non-functional currency financial assets and liabilities held across the Group. All other variables are held constant although, in practice, market rates rarely change in isolation. Financial assets and liabilities held in the functional currency of the Group’s subsidiaries, as well as non-financial assets and liabilities and translation risk, are not included in the analysis. The Group considers a 10% strengthening or weakening of the functional currency against the non-functional currency of its subsidiaries as a reasonably possible change. The impact is calculated with reference to the financial asset or liability held as at the year-end, unless this is unrepresentative of the position during the year.
A 10% strengthening of functional currencies against non-functional currencies would result in pre-tax profit being £33 million higher (2017: £14 million lower; 2016: £2 million higher) and items recognised directly in other comprehensive income being £384 million higher (2017: £148 million higher; 2016: £413 million higher).
182 BAT Annual Report and Form 20-F 2018

Governance Other InformationFinancial StatementsStrategic Report
23 Financial instruments and risk management continuedA 10% weakening of functional currencies against non-functional currencies would result in pre-tax profit being £41 million lower (2017: £4 million higher; 2016: £4 million lower) and items recognised directly in other comprehensive income being £469 million lower (2017: £148 million lower; 2016: £505 million lower).
The exchange sensitivities on items recognised directly in other comprehensive income relate to hedging of certain net asset currency positions in the Group, as well as on cash flow hedges in respect of future transactions, but does not include sensitivities in respect of exchange on non-financial assets or liabilities.
Interest rate riskThe objectives of the Group’s interest rate risk management policy are to lessen the impact of adverse interest rate movements on the earnings, cash flow and economic value of the Group and to safeguard against any possible breach of its financial covenants. Additional objectives are to minimise the cost of hedging and the associated counterparty risk.
The Group targets an interest cover ratio, as calculated under its key central banking facilities, of greater than 5 and for 2018 it is 7.2 times (2017: 7.8 times; 2016: 12.2 times). The only externally imposed capital requirement the Group has is in respect of its centrally managed banking facilities, which require a gross interest cover of at least 4.5 times.
In order to manage its interest rate risk, the Group maintains both floating rate and fixed rate debt. The Group sets targets (within overall guidelines) for the desired ratio of floating to fixed rate debt on a net basis (at least 50% fixed on a net basis in the short to medium term) as a result of regular reviews of market conditions and strategy by the Corporate Finance Committee and the board of the main central finance company. At 31 December 2018, the relevant ratios of floating to fixed rate borrowings were 21:79 (2017: 19:81) on a net basis. Underlying borrowings are arranged on both a fixed rate and a floating rate basis and, where appropriate, the Group uses derivatives, primarily interest rate swaps to vary the fixed and floating mix, or forward starting swaps to manage the refinancing risk. The interest rate profile of liquid assets is taken into account in determining the net interest rate exposure.
IFRS 7 requires a sensitivity analysis that shows the impact on the income statement and on items recognised directly in other comprehensive income of hypothetical changes of interest rates in respect of financial assets and liabilities of the Group. All other variables are held constant although, in practice, market rates rarely change in isolation. For the purposes of this sensitivity analysis, financial assets and liabilities with fixed interest rates are not included. The Group considers a 100 basis point change in interest rates a reasonably possible change except where rates are less than 100 basis points. In these instances it is assumed that the interest rates increase by 100 basis points and decrease to zero for the purpose of performing the sensitivity analysis. The impact is calculated with reference to the financial asset or liability held as at the year-end, unless this is unrepresentative of the position during the year.
A 100 basis point increase in interest rates would result in pre-tax profit being £90 million lower (2017: £108 million lower; 2016: £37 million lower). A 100 basis point decrease in interest rates, or less where applicable, would result in pre-tax profit being £74 million higher (2017: £77 million higher; 2016: £16 million higher). The effect of these interest rate changes on items recognised directly in other comprehensive income is not material in either year.
Credit riskThe Group has no significant concentrations of customer credit risk. Subsidiaries have policies in place requiring appropriate credit checks on potential customers before sales commence. The process for monitoring and managing credit risk once sales to customers have been made varies depending on local practice in the countries concerned.
Certain territories have bank guarantees, other guarantees or credit insurance provided in the Group’s favour in respect of Group trade receivables, the issuance and terms of which are dependent on local practices in the countries concerned. All derivatives are subject to ISDA agreements or equivalent documentation.
Cash deposits and other financial instruments give rise to credit risk on the amounts due from the related counterparties. Generally, the Group aims to transact with counterparties with strong investment grade credit ratings. However, the Group recognises that due to the need to operate over a large geographic footprint, this will not always be possible. Counterparty credit risk is managed on a global basis by limiting the aggregate amount and duration of exposure to any one counterparty, taking into account its credit rating. The credit ratings of all counterparties are reviewed regularly.
The Group ensures that it has sufficient counterparty credit capacity of requisite quality to undertake all anticipated transactions throughout its geographic footprint, while at the same time ensuring that there is no geographic concentration in the location of counterparties.
With the following exceptions, the maximum exposure to the credit risk of financial assets at the balance sheet date is reflected by the carrying values included in the Group’s balance sheet. In 2014, the Group entered into a guarantee arrangement in respect of the borrowings of the non-controlling interest in relation to the capital injection made to the Group’s Algerian business. The Group no longer has this credit exposure as it was repaid in 2018. The maximum exposure under the arrangement was £3 million in 2017. In addition, the Group has entered into short-term risk participation agreements in relation to certain leaf supply arrangements and the maximum exposure under these would be £102 million (2017: £96 million). In 2017, the Group entered into a guarantee arrangement to support a short-term credit facility with a distributor. The maximum exposure under the arrangement would be £102 million (2017: £116 million).
Price riskThe Group is exposed to price risk on investments held by the Group, which are included in investments held at fair value on the consolidated balance sheet, but the quantum of such is not material.
Hedge accountingIn order to qualify for hedge accounting, the Group is required to document prospectively the economic relationship between the item being hedged and the hedging instrument. The Group is also required to demonstrate an assessment of the economic relationship between the hedged item and the hedging instrument, which shows that the hedge will be highly effective on an ongoing basis. This effectiveness testing is repeated periodically to ensure that the hedge has remained, and is expected to remain highly effective. The prospective effectiveness testing determines that an economic relationship between the hedged item and the hedging instrument exists.
In accordance with the Group Treasury Manual, the exact hedge ratios and profile of a hedge relationship will depend on several factors, including the desired degree of certainty and reduced volatility of net interest costs and market conditions, trends and expectations in the relevant markets. The sources of ineffectiveness include spot and forward differences, impact of time value and timing differences between periods in the hedged item and hedging instrument.
The Group’s risk management strategy has been explained in further detail in note 23 under interest rate risk and currency risk.
Fair value estimationThe fair values of financial assets and liabilities with maturities of less than one year, other than derivatives, are assumed to approximate their book values. For other financial instruments which are measured at fair value in the balance sheet, the basis for fair values is described below.
183BAT Annual Report and Form 20-F 2018

Financial Statements
Notes on the Accounts continued
23 Financial instruments and risk management continuedFair value hierarchyThe following table presents the Group’s financial assets and liabilities that are measured at fair value in accordance with IFRS 13 classification hierarchy:
2018 2017
Level 1
£mLevel 2
£mLevel 3
£mTotal
£mLevel 1
£mLevel 2
£mLevel 3
£mTotal
£m
Assets at fair value Investment held at fair value (note 15) 141 – 76 217 91 – 16 107Derivatives relating to – interest rate swaps (note 16) – 187 – 187 – 166 – 166– cross-currency swaps (note 16) – 431 – 431 – 450 – 450– forward foreign currency contracts
(note 16) – 117 – 117 – 202 – 202Assets at fair value 141 735 76 952 91 818 16 925Liabilities at fair value Derivatives relating to – interest rate swaps (note 16) – 181 – 181 – 91 – 91– cross-currency swaps (note 16) – 56 – 56 – – – –– forward foreign currency contracts
(note 16) – 279 – 279 – 143 – 143Liabilities at fair value – 516 – 516 – 234 – 234
Level 2 financial instruments are not traded in an active market, but the fair values are based on quoted market prices, broker/dealer quotations, or alternative pricing sources with reasonable levels of price transparency. The Group’s level 2 financial instruments include OTC derivatives.
Netting arrangements of derivative financial instrumentsThe gross fair value of derivative financial instruments as presented in the Group balance sheet, together with the Group’s rights of offset associated with recognised financial assets and recognised financial liabilities subject to enforceable master netting arrangements and similar agreements, is summarised as follows:
2018 2017
Amount presented in
the Group balance
sheet*£m
Related amounts not offset in the
Group balance
sheet£m
Net amount
£m
Amount presented in
the Group balance
sheet*£m
Related amounts not
offset in the Group
balance sheet
£m
Net amount
£m
Financial Assets – Derivative Financial Instruments (note 16) 735 (295) 440 818 (211) 607Financial Liabilities – Derivative Financial Instruments (note 16) (516) 295 (221) (234) 211 (23) 219 – 219 584 – 584
* No financial instruments have been offset in the Group balance sheet.
The Group is subject to master netting arrangements in force with financial counterparties with whom the Group trades derivatives.
The master netting arrangements determine the proceedings should either party default on their obligations. In case of any event of default: the non-defaulting party will calculate the sum of the replacement cost of outstanding transactions and amounts owed to it by the defaulting party. If that sum exceeds the amounts owed to the defaulting party, the defaulting party will pay the balance to the non-defaulting party. If the sum is less than the amounts owed to the defaulting party, the non-defaulting party will pay the balance to the defaulting party.
184 BAT Annual Report and Form 20-F 2018

Governance Other InformationFinancial StatementsStrategic Report
23 Financial instruments and risk management continuedThe hedged items by risk category are presented below:
2018
Carrying amount of the
hedged itemLiabilities
£m
Accumulated amount of fair
value hedge adjustments on
the hedged item included in the
carrying amount of the hedged
itemLiabilities
£m
Line item in the statement of
financial position where
the hedged item is included
Changes in fair value used for
calculating hedge
ineffectiveness for 2018
£m
Cash flow hedge
reserve£m
Fair value hedges Interest rate risk – borrowings 6,424 179 Borrowings (32) Cash flow hedges Interest rate risk – borrowings 2,819 Borrowings 189 (146)
The change in the value used for calculating hedge ineffectiveness for hedged items designated under net investment hedge relationship is £226 million.
As at 31 December 2018, the total balance of the cash flow hedge reserve was a loss of £177 million including a £146 million loss in relation to interest rate exposure and foreign currency exposure arising from borrowings held by the Group, a £98 million loss in relation to interest rate exposure on forecasted borrowings, and a £48 million gain in relation to deferred tax arising from cash flow hedges. The remainder related to the Group’s foreign currency exposure on forecasted transactions.
185BAT Annual Report and Form 20-F 2018

Financial Statements
Notes on the Accounts continued
24 Business combinations, disposals and other changes in the Group(a) Reynolds American Inc. (“RAI”)On 25 July 2017, the Group announced the completion of the acquisition of the remaining 57.8% of RAI not already owned by the Group for a consideration of £41.8 billion. RAI ceased to be reported as an associate and has been consolidated as a wholly owned subsidiary from the acquisition date. RAI shareholders received, for each share of RAI common stock, US$29.44 in cash, without interest, and 0.5260 BAT ordinary shares represented by BAT ADSs listed on the New York Stock Exchange. The fair value of consideration paid to RAI shareholders was £41,770 million. Included in the fair value of consideration paid to RAI shareholders is £22,828 million of non-cash consideration of which £22,773 million arises from the issue of BAT ordinary shares (note 19).
In accordance with IFRS 3, the step-acquisition of RAI has been accounted for as if the Group has contributed its previously held equity interest in RAI at fair value as part of the consideration for acquiring 100% of the net assets of RAI. The value attributable to BAT’s shareholding was £30,145 million, making the total acquisition price £71,915 million. The difference between the fair value and the carrying value of the previously held equity interest has been recognised as a gain in the income statement.
The goodwill of £34,280 million and brands and similar intangibles of £75,482 million were recognised in the transaction. Goodwill on the acquisition of the business represents a strategic premium to enter the United States market as well as synergies and cost savings that are anticipated to be realised post-acquisition.
(b) Other acquisitionsDuring 2018, 2017 and 2016, the Group acquired certain businesses and other tobacco assets as noted below. The financial impact of these transactions to the Group were immaterial individually and in aggregate. Except as noted, there were no material differences between the fair value and book values of net assets acquired in business combinations.
On 22 November 2018, the Group completed the acquisition of Quantus Beteiligungs‑und Beratungsgesellschaft mbH, Germany’s leading vapour retail chain trading as “Highendsmoke”, from a private shareholder. The fair value of consideration payable was £21 million. The fair values and book values of net assets acquired were not materially different except for the recognition of trademarks and similar intangibles of £13 million. Provisional goodwill of £11 million arising on this transaction represents a strategic premium to enter the vapour retail market.
On 26 September 2018, as part of an agreement to acquire an additional 44% stake in the Myanmar business, the Group acquired the business and individual assets of a local distributor, Star Way Limited from IMU Enterprises Limited for £6 million. The fair values and book values of net assets acquired were not materially different except for the recognition of goodwill of £3 million representing anticipated synergies.
On 1 August 2017, the Group acquired certain tobacco assets, including a distribution company, Tobacco Press d.o.o. Mostar, from Fabrika Duhana Sarajevo d.d in Bosnia-Herzegovina. The assets acquired, including goodwill of £2 million, brands and other intangibles of £39 million, and other assets, were purchased for a total consideration of £39 million.
On 5 May 2017, the Group acquired certain tobacco assets, including a distribution company, Express Logistic and Distribution EOOD, from Bulgartabac Holding AD in Bulgaria. The assets acquired for a total consideration of £110 million, of which £28 million is contingent upon future performance in the market. £14 million of this was paid during 2018.
The provisional fair values recorded at the time included provisional goodwill of £22 million and brands and other intangibles of £95 million. These values were subsequently finalised as goodwill of £nil million and brands and other intangibles of £117 million.
On 5 April 2017, the Group acquired the business and certain assets of Must Have Limited (trading as ViP Electronic Cigarette (“ViP”)), a company in administration. ViP is one the largest e-cigarette retailers in the UK with a large point of sale network. The assets acquired, including goodwill of £1 million, intellectual property and other intangibles of £9 million, and other assets, were purchased for a total consideration of £12 million.
On 4 January 2017, the Group completed the acquisition of 100% of Winnington Holding AB, a Swedish manufacturer of “white” snus, for a purchase price of £31 million. Goodwill of £8 million and brands and similar intangibles of £28 million were recognised. £8 million of the consideration was contingent on post-acquisition targets being met and was substantially settled in January 2019.
On 20 April 2016, the Group completed the acquisition of 100% of Ten Motives Limited and 10 Motives Limited, a UK-based e-cigarette business. The fair value of consideration payable was £56 million. The fair values and book values of net assets acquired were not materially different except for the recognition of trademarks and similar intangibles of £33 million. Goodwill of £21 million arising on this transaction represents a strategic premium to increase the Group’s share of the UK non-tobacco market.
On 30 December 2015, the Group acquired 100% of the CHIC Group from private shareholders. The fair value of the consideration payable was £82 million, of which £30 million was contingent on achievement of certain post-acquisition targets. £6 million of this was paid during 2016, £13 million during 2017 and a final £1 million in final settlement in 2018.
On 17 November 2015, the Group acquired 100% of Blue Nile Cigarette Company Limited from a private shareholder. The fair value of the consideration payable was £45 million of which £8 million is contingent on achievement of certain post-acquisition targets. Subsequent payments in respect of this were £1 million in 2016, £5 million in 2017 and £1 million in 2018.
On 30 September 2015, the Group acquired TDR and other tobacco and retail assets from Adris Grupa d.d. for a total enterprise value of €550 million. Part of the consideration is contingent upon certain targets being met post-acquisition, and £5 million of this was paid in January 2017.
(c) Non‑controlling interestsIncluded in the acquisition of non-controlling interests are the purchases of the remaining shares in British American Tobacco Vranje a.d. in Serbia and an additional 44% stake in British American Tobacco Myanmar Limited. The financial impact of these transactions to the Group is immaterial individually and in aggregate.
During 2017, the Group acquired the remaining 49% interest in IPRESS d.o.o.
On 16 October 2015, the Group announced that it had concluded the auction related to its public tender offer in Brazil to acquire up to all of the 24.7% of Souza Cruz shares not currently owned by the Group and to delist the company. As at 31 December 2015 the Group owned 99.1% of Souza Cruz. The cost of acquiring these shares up to end of December 2015 was £1,660 million. The compulsory acquisition of the remaining minority shares was approved on 5 February 2016, with Souza Cruz becoming a wholly-owned subsidiary as at that date. The cost of acquiring the remaining shares was £70 million.
During 2015, the Group acquired a further 0.2% interest in BAT Chile Operaciones S.A. at a cost of £1 million. This increased the Group’s shareholding to 99%. A further 0.01% interest was acquired during 2017.
186 BAT Annual Report and Form 20-F 2018

Governance Other InformationFinancial StatementsStrategic Report
24 Business combinations, disposals and other changes in the Group continued (d) Other transactionsOn 21 December 2017, the Group signed an agreement to acquire 100% of the share capital of Twisp Propriety Limited, a South African e-cigarette/nicotine vapour company, conditional upon, amongst other things, anti-trust approval. The proposed acquisition continues to be subject to a South African Competition Tribunal process, with a decision expected in 2019.
On 10 January 2019, the Group acquired a minority stake in AYR Limited, a vapour technology company based in the UK, for £8 million, with the potential to increase this in the future. The investment terms also provide for BAT and AYR to agree a commercial collaboration agreement under which BAT and AYR will jointly develop future vaping products.
25 Share‑based paymentsThe Group operates a number of share-based payment arrangements of which the two principal ones are:
Long‑Term Incentive Plan (LTIP)Nil-cost options exercisable after three years from date of grant with a contractual life of ten years. Payout is subject to performance conditions based on earnings per share (40% of grant), operating cash flow (20% of grant), total shareholder return (20% of grant) and net turnover (20% of grant) in 2016, 2017 and 2018. Total shareholder return combines the share price and dividend performance of the Company by reference to one comparator group. Participants are not entitled to dividends prior to the exercise of the options. A cash equivalent dividend accrues through the vesting period and is paid on vesting. Both equity and cash-settled LTIP awards were granted in March of 2018 (2017: March; 2016: May).
Following the acquisition of RAI on 25 July 2017, underlying RAI shares for LTIPs were replaced with B.A.T American Depositary Shares (ADS). LTIP awards for ADSs are measured against the performance conditions of RAI at the maximum of 150% at the vesting date. Equity settled LTIPs were granted by RAI in March of 2018 (2017: March) with options exercisable after 3 years from the date of grant with the payment made no later than 90 days from date of vesting. Participants are not entitled to dividends prior to exercise of the options.
Deferred Share Bonus Scheme (DSBS)Free ordinary shares released three years from date of grant and may be subject to forfeit if a participant leaves employment before the end of the three-year holding period. Participants receive a separate payment equivalent to a proportion of the dividend payment during the holding period. Both equity and cash-settled deferred shares are granted in March each year.
The Group also has a number of other arrangements which are not material for the Group and these are as follows:
Sharesave Scheme (SAYE)Options granted in March each year from 2011 onwards (previously November until 2009 and no options were granted during 2010) by invitation at a 20% discount to the market price. Options to this equity-settled scheme are exercisable at the end of a three year or five year savings contract. Participants are not entitled to dividends prior to the exercise of the options. The maximum amount that can be saved by a participant in this way is £6,000 in any tax year.
Share Reward Scheme (SRS) and International Share Reward Scheme (ISRS)Free shares granted in April each year (maximum £3,600 in any year) under the equity-settled schemes are subject to a three- year holding period. Participants receive dividends during the holding period which are reinvested to buy further shares.
Partnership Share SchemeOpen to all eligible employees, where employees can allocate part of their pre-tax salary to purchase shares in British American Tobacco p.l.c.. The maximum amount that can be allocated in this way to any individual is £1,800 in any tax year. The shares purchased are held in a UK-based trust and are normally capable of transfer to participants tax free after a five-year holding period.
Share‑based payment expenseThe amounts recognised in the income statement in respect of share-based payments were as follows:
2018 2017 2016
Equity‑settled £m
Cash‑settled £m
Equity-settled £m
Cash-settled £m
Equity-settled £m
Cash-settled £m
LTIP (note (a)) 70 – 56 3 25 6DSBS (note (b)) 44 2 42 9 40 7Other schemes 7 – 7 – 6 –Total recognised in the income statement (note 3(a)) 121 2 105 12 71 13
187BAT Annual Report and Form 20-F 2018

Financial Statements
Notes on the Accounts continued
25 Share‑based payments continuedShare‑based payment liabilityThe Group issues to certain employees cash-settled share-based payments that require the Group to pay the intrinsic value of these share-based payments to the employee at the date of exercise. The Group has recorded liabilities in respect of vested and unvested grants at the end of 2018 and 2017:
2018 2017
Vested£m
Unvested£m
Vested£m
Unvested£m
LTIP 0.5 2.6 0.3 9.1DSBS 0.2 6.1 0.3 11.6Total liability 0.7 8.7 0.6 20.7
(a) Long‑Term Incentive PlanDetails of the movements for the equity- and cash-settled LTIP scheme during the years ended 31 December 2018 and 31 December 2017, were as follows:
2018 2017
Equity‑settled
Number of options
in thousands
Cash‑settled Number
of options in thousands
Equity- settled
Number of options
in thousands
Cash-settled Number
of options in thousands
Outstanding at start of year 6,030 378 5,337 407Granted during the period 3,067 66 1,690 152Acquired from RAI – – 904 –Exercised during the period (1,739) (102) (746) (65)Forfeited during the period (450) (36) (1,155) (116)Outstanding at end of year 6,908 306 6,030 378Exercisable at end of year 676 22 653 7
As at 31 December 2018, the Group has 6,908,000 shares (2017: 6,030,000 shares) outstanding which includes 1,208,129 shares (2017: 891,677 shares) which are related to RAI LTIP awards from which 72,033 shares (2017: 327,463 shares) are exercisable at the end of the year.
The weighted average British American Tobacco p.l.c. share price at the date of exercise for share options exercised during the period was £38.90 (2017: £51.95; 2016: £45.80) for equity-settled and £40.62 (2017: £52.08; 2016: £47.00) for cash-settled options.
The weighted average British American Tobacco p.l.c. share price for ADS on the New York Stock Exchange at the date of exercise for share options exercised during the period relating to equity-settled RAI LTIP awards was US$51.43 (2017: US$62.67).
The outstanding shares for the year ended 31 December 2018 had a weighted average remaining contractual life of 8.1 years (2017: 8.1 years; 2016: 8.2 years) for the equity-settled scheme, 1.91 years for RAI equity-settled scheme (2017: 2.17 years) and 8.1 years (2017: 8.3 years; 2016: 7.9 years) for the cash-settled share-based payment arrangements.
(b) Deferred Share Bonus SchemeDetails of the movements for the equity- and cash-settled DSBS scheme during the years ended 31 December 2018 and 31 December 2017, were as follows:
2018 2017
Equity‑settled
Number of options
in thousands
Cash‑settled Number
of options in thousands
Equity- settled
Number of options
in thousands
Cash-settled Number
of options in thousands
Outstanding at start of year 2,962 382 3,225 423Granted during the period 1,262 66 1,079 136Exercised during the period (940) (145) (1,267) (165)Forfeited during the period (36) (22) (75) (12)Outstanding at end of year 3,248 281 2,962 382Exercisable at end of year 79 5 61 5
The weighted average British American Tobacco p.l.c. share price at the date of exercise for share options exercised during the financial year was £40.00 (2017: £52.52; 2016: £42.26) for equity-settled and £40.51 (2017: £52.50; 2016: £41.97) for cash-settled options.
The outstanding shares for the year ended 31 December 2018 had a weighted average remaining contractual life of 1.3 years (2017: 1.3 years; 2016: 1.3 years) for the equity-settled scheme and 1.1 years (2017: 1.2 years; 2016: 1.2 years) for the cash-settled scheme.
188 BAT Annual Report and Form 20-F 2018

Governance Other InformationFinancial StatementsStrategic Report
25 Share‑based payments continuedValuation assumptionsAssumptions used in the Black-Scholes models to determine the fair value of share options at grant date were as follows:
2018 2017
LTIP DSBS LTIP DSBS
Expected volatility (%) 18 18 18 18Average expected term to exercise (years) 3.5 3.0 3.5 3.0Risk-free rate (%) 1.0 1.0 0.3 0.3Expected dividend yield (%) 5.0 5.0 3.2 3.2Share price at date of grant (£) 38.94 38.94 52.11 52.11Fair value at grant date (£) 29.39 33.50 41.04 47.27
Market condition features were incorporated into the Monte-Carlo models for the total shareholder return elements of the LTIP, in determining fair value at grant date. Assumptions used in these models were as follows:
2018 2017
LTIP LTIP
Average share price volatility FMCG comparator group (%) 18 19Average correlation FMCG comparator group (%) 31 31
Fair values determined from the Black-Scholes and Monte-Carlo models use assumptions revised at the end of each reporting period for cash-settled share-based payment arrangements.
The expected British American Tobacco p.l.c. share price volatility was determined taking account of the return index (the share price index plus the dividend reinvested) over a five-year period. The FMCG share price volatility and correlation was also determined over the same periods. The average expected term to exercise used in the models has been adjusted, based on management’s best estimate, for the effects of non-transferability, exercise restrictions and behavioural conditions, forfeiture and historical experience.
The risk-free rate has been determined from market yield curves for government gilts with outstanding terms equal to the average expected term to exercise for each relevant grant. The expected dividend yield was determined by calculating the yield from the last two declared dividends divided by the grant share price.
In addition to these valuation assumptions, LTIP awards contain earnings per share performance conditions. As these are non-market performance conditions they are not included in the determination of fair value of share options at the grant date, however they are used to estimate the number of awards expected to vest. This pay-out calculation is based on expectations published in analysts’ forecasts.
26 Group employeesThe average number of persons employed by the Group and its associates during the year, including Directors, was 95,239 (2017: 91,402).
2018 Number
2017 Number
United States 5,066 2,168APME 15,074 14,075AMSSA 19,351 19,158ENA 26,102 25,192Subsidiary undertakings 65,593 60,593Associates 29,646 30,809
95,239 91,402
Included within the employee numbers for ENA are certain employees in the UK in respect of central functions. Some of the costs of these employees are allocated or charged to the various regions and markets in the Group.
189BAT Annual Report and Form 20-F 2018
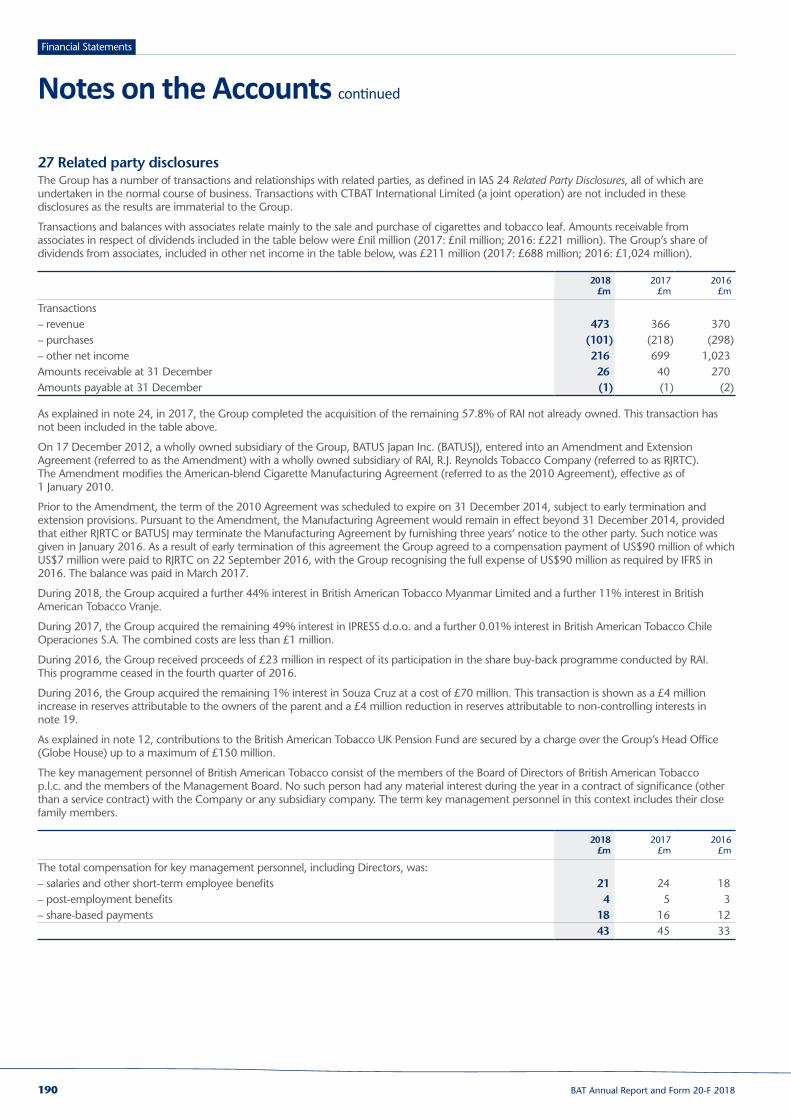
Financial Statements
Notes on the Accounts continued
27 Related party disclosuresThe Group has a number of transactions and relationships with related parties, as defined in IAS 24 Related Party Disclosures, all of which are undertaken in the normal course of business. Transactions with CTBAT International Limited (a joint operation) are not included in these disclosures as the results are immaterial to the Group.
Transactions and balances with associates relate mainly to the sale and purchase of cigarettes and tobacco leaf. Amounts receivable from associates in respect of dividends included in the table below were £nil million (2017: £nil million; 2016: £221 million). The Group’s share of dividends from associates, included in other net income in the table below, was £211 million (2017: £688 million; 2016: £1,024 million).
2018 £m
2017 £m
2016 £m
Transactions– revenue 473 366 370– purchases (101) (218) (298)– other net income 216 699 1,023Amounts receivable at 31 December 26 40 270Amounts payable at 31 December (1) (1) (2)
As explained in note 24, in 2017, the Group completed the acquisition of the remaining 57.8% of RAI not already owned. This transaction has not been included in the table above.
On 17 December 2012, a wholly owned subsidiary of the Group, BATUS Japan Inc. (BATUSJ), entered into an Amendment and Extension Agreement (referred to as the Amendment) with a wholly owned subsidiary of RAI, R.J. Reynolds Tobacco Company (referred to as RJRTC). The Amendment modifies the American-blend Cigarette Manufacturing Agreement (referred to as the 2010 Agreement), effective as of 1 January 2010.
Prior to the Amendment, the term of the 2010 Agreement was scheduled to expire on 31 December 2014, subject to early termination and extension provisions. Pursuant to the Amendment, the Manufacturing Agreement would remain in effect beyond 31 December 2014, provided that either RJRTC or BATUSJ may terminate the Manufacturing Agreement by furnishing three years’ notice to the other party. Such notice was given in January 2016. As a result of early termination of this agreement the Group agreed to a compensation payment of US$90 million of which US$7 million were paid to RJRTC on 22 September 2016, with the Group recognising the full expense of US$90 million as required by IFRS in 2016. The balance was paid in March 2017.
During 2018, the Group acquired a further 44% interest in British American Tobacco Myanmar Limited and a further 11% interest in British American Tobacco Vranje.
During 2017, the Group acquired the remaining 49% interest in IPRESS d.o.o. and a further 0.01% interest in British American Tobacco Chile Operaciones S.A. The combined costs are less than £1 million.
During 2016, the Group received proceeds of £23 million in respect of its participation in the share buy-back programme conducted by RAI. This programme ceased in the fourth quarter of 2016.
During 2016, the Group acquired the remaining 1% interest in Souza Cruz at a cost of £70 million. This transaction is shown as a £4 million increase in reserves attributable to the owners of the parent and a £4 million reduction in reserves attributable to non-controlling interests in note 19.
As explained in note 12, contributions to the British American Tobacco UK Pension Fund are secured by a charge over the Group’s Head Office (Globe House) up to a maximum of £150 million.
The key management personnel of British American Tobacco consist of the members of the Board of Directors of British American Tobacco p.l.c. and the members of the Management Board. No such person had any material interest during the year in a contract of significance (other than a service contract) with the Company or any subsidiary company. The term key management personnel in this context includes their close family members.
2018 £m
2017 £m
2016 £m
The total compensation for key management personnel, including Directors, was: – salaries and other short-term employee benefits 21 24 18– post-employment benefits 4 5 3– share-based payments 18 16 12
43 45 33
190 BAT Annual Report and Form 20-F 2018

Governance Other InformationFinancial StatementsStrategic Report
27 Related party disclosures continuedThe following table, which is not part of IAS24 disclosures, shows the aggregate emoluments of the Directors of the Company.
Executive Directors Chairman Non-Executive Directors Total
2018 £’000
2017 £’000
2016 £’000
2018 £’000
2017 £’000
2016 £’000
2018 £’000
2017 £’000
2016 £’000
2018 £’000
2017 £’000
2016 £’000
Salary; fees; benefits; incentives – salary 2,211 2,122 2,057 – – – – – – 2,211 2,122 2,057– fees – – – 680 660 645 1,092 1,042 1,051 1,772 1,702 1,696– taxable benefits 427 385 335 116 129 106 303 195 122 846 709 563– short-term incentives 5,031 4,689 4,622 – – – – – – 5,031 4,689 4,622– long-term incentives 5,300 10,192 4,483 – – – – – – 5,300 10,192 4,483Sub-total 12,969 17,388 11,497 796 789 751 1,395 1,237 1,173 15,160 19,414 13,421Pension; other emoluments – pension 921 612 634 – – – – – – 921 612 634– other emoluments 50 50 44 – – – – – – 50 50 44Sub-total 971 662 678 – – – – – – 971 662 678Total emoluments 13,940 18,050 12,175 796 789 751 1,395 1,237 1,173 16,131 20,076 14,099
Aggregate gains on LTIP shares exercised in the year
Award dateExercised
LTIP shares Exercise date
Price per share
(£)
Aggregate gain
(£)
Nicandro Durante 27 Mar 2015 122,477 27 Mar 2018 39.46 4,832,942Ben Stevens 27 Mar 2015 66,925 27 Mar 2018 39.46 2,640,861
LTIP – Value of awards 2015
Shares
Price per share
(£)1
Face value
(£)
Nicandro Durante 127,448 36.25 4,619,990Ben Stevens 69,641 36.25 2,524,486
1. For information only as awards are made as nil cost options.
In 2018, no Sharesave were exercised by Executive Directors.
191BAT Annual Report and Form 20-F 2018

Financial Statements
Notes on the Accounts continued
28 Contingent liabilities and financial commitments1. The Group is subject to contingencies pursuant to requirements
that it complies with relevant laws, regulations and standards.
2. Failure to comply could result in restrictions in operations, damages, fines, increased tax, increased cost of compliance, interest charges, reputational damage or other sanctions. These matters are inherently difficult to quantify. In cases where the Group has an obligation as a result of a past event existing at the balance sheet date, if it is probable that an outflow of economic resources will be required to settle the obligation and if the amount of the obligation can be reliably estimated, a provision will be recognised based on best estimates and management judgment.
3. There are, however, contingent liabilities in respect of litigation, taxes in some countries and guarantees for which no provisions have been made.
General Litigation Overview4. There are a number of legal and regulatory actions, proceedings
and claims against Group companies related to tobacco products that are pending in a number of jurisdictions. These proceedings include, among other things, claims for personal injury (both individual claims and class actions) and claims for economic loss arising from the treatment of smoking and health-related diseases (such as medical recoupment claims brought by local governments).
5. The plaintiffs in these cases seek recovery on a variety of legal theories, including negligence, strict liability in tort, design defect, failure to warn, fraud, misrepresentation, violations of unfair and deceptive trade practices statutes, conspiracy, medical monitoring and violations of competition and antitrust laws. The plaintiffs seek various forms of relief, including compensatory and, where available, punitive damages, treble or multiple damages and statutory damages and penalties, creation of medical monitoring and smoking cessation funds, disgorgement of profits, attorneys’ fees, and injunctive and other equitable relief.
6. Although alleged damages often are not determinable from a complaint, and the law governing the pleading and calculation of damages varies from jurisdiction to jurisdiction, compensatory and punitive damages have been specifically pleaded in a number of cases, sometimes in amounts ranging into the hundreds of millions and even hundreds of billions of pounds.
7. With the exception of the Engle progeny cases described below, the Group continues to win the majority of tobacco-related litigation claims that reach trial, and a very high percentage of the tobacco-related litigation claims brought against them, including Engle progeny cases, continue to be dismissed at or before trial. Based on their experience in tobacco-related litigation and the strength of the defences available to them in such litigation, the Group’s companies believe that their successful defence of tobacco-related litigation in the past will continue in the future.
8. Group companies generally do not settle claims. However, Group companies may enter into settlement discussions in some cases, if they believe it is in their best interests to do so. Exceptions to this general approach include, but are not limited to, actions taken pursuant to “offer of judgment” statutes and Filter Cases, as defined below. An “offer of judgment,” if rejected by the plaintiff, preserves the Group’s right to recover attorneys’ fees under certain statutes in the event of a verdict favourable to the Group. Such offers are sometimes made through court-ordered mediations. Other settlements by Group companies include the State Settlement Agreements (described below), the funding by various tobacco companies of a US$5.2 billion (approximately £4.1 billion) trust fund contemplated by the Master Settlement Agreement to benefit tobacco growers, the original Broin flight attendant case, and most of the Engle progeny cases pending in US federal court, after the initial docket of over 4,000 such cases was reduced to approximately 400 cases. The Group believes that the circumstances surrounding these claims are readily distinguishable from the current categories of tobacco-related litigation claims involving Group companies.
9. Although the Group intends to defend all pending cases vigorously, and believes that the Group’s companies have valid bases for appeals of adverse verdicts and valid defences to all actions, and that an outflow of resources related to any individual case is not considered probable, litigation is subject to many uncertainties, and, generally, it is not possible to predict the outcome of any particular litigation pending against Group companies, or to reasonably estimate the amount or range of any possible loss. Furthermore, a number of political, legislative, regulatory and other developments relating to the tobacco industry and cigarette smoking have received wide media attention. These developments may negatively affect the outcomes of tobacco-related legal actions and encourage the commencement of additional similar litigation. Therefore, the Group does not provide estimates of the financial effect of the contingent liabilities represented by such litigation, as such estimates are not practicable.
10. The following table lists the categories of the tobacco-related actions pending against Group companies as of 31 December 2018 and the increase or decrease from the number of cases pending against Group Companies as of 31 December 2017. Details of the quantum of past judgments awarded against Group companies, the majority of which are under appeal, are also identified, along with any settlements reached during the relevant period. Given the volume and more active nature of the Engle progeny cases and the Filter Cases in the US described below, and the fluctuation in the number of such cases and amounts awarded from year to year, the Group presents judgment or settlement figures for these cases on a three-year basis. Where no quantum is identified, either no judgment has been awarded against a Group company, or where a verdict has been reached no quantification of damages has been given, or no settlement has been entered into. Further details on the judgments, damages quantification and settlements are included within the case narratives below. For a discussion of the non-tobacco related litigation pending against the Group, see note 28, paragraph 79, et seq.
192 BAT Annual Report and Form 20-F 2018

Governance Other InformationFinancial StatementsStrategic Report
28 Contingent liabilities and financial commitments continued
Case TypeCase Numbers as at 31 December 2018
Case Numbers as at 31 December 2017 (note 1)
Change in Number Increase/(Decrease)
US tobacco related actions
Medical reimbursement cases (note 2) 2 2 No changeClass actions (note 3) 20 24 (4)Individual smoking and health cases (note 4) 111 99 12West Virginia IPIC (note 5) 1 1 No changeEngle progeny cases (note 6) 2,268 2,569 (301)Broin II cases (note 7) 1,406 2,321 (915)Filter cases (note 8) 58 71 (13)State Settlement Agreements – Enforcement and Validity (note 9) 3 2 1Non-US tobacco related actions
Medical reimbursement cases 19 19 No changeClass actions (note 10) 13 14 (1)Individual smoking and health cases (note 11) 107 120 (13)
(Note 1) This includes cases to which the RAI group companies were a party at such date.
(Note 2) This category of cases includes the Department of Justice action. See note 28, paragraphs 20-24 and the list of Closed Litigation Matters.
(Note 3) See note 28, paragraphs 25-39.
(Note 4) This category of cases includes smoking and health cases alleging personal injuries caused by tobacco use or exposure brought by or on behalf of individual plaintiffs based on theories of negligence, strict liability, breach of express or implied warranty and violations of state deceptive trade practices or consumer protection statutes. The plaintiffs seek to recover compensatory damages, attorneys’ fees and costs and punitive damages. Out of the 111 active individual smoking and health cases, five judgments have been returned in the plaintiffs’ favour, awarding damages totalling US$209.4 million (approximately £164.4 million), all of which are on appeal. For a further description of these cases, see note 28, paragraph 40.
(Note 5) The West Virginia IPIC cases are a series of roughly 1,200 cases, filed in West Virginia beginning in 1999, asserting claims against PM USA, Lorillard Tobacco, RJRT, B&W and The American Tobacco Company. These cases were brought in consolidated proceedings in West Virginia alleging personal injuries. The one claim upon which plaintiffs prevailed was a limited failure to instruct claim covering a narrow window of time. Only 30 plaintiffs qualified to pursue that narrow claim. In 2017, the court dismissed all claims of those 30 plaintiffs with prejudice pursuant to an agreement providing that each plaintiff who submits a release within one year will receive US$7,000 (approximately £5,496). In addition to the foregoing claims, various plaintiffs in 1999 and 2000 asserted claims against retailers and distributors (which have not been pursued in light of the result in the Phase I trial in defendants’ favour), as well as smokeless claims against various defendants including RJRT, Lorillard, American Snuff and B&W. 41 plaintiffs sought to pursue their smokeless claims in 2017. In April 2017, the court dismissed the claims of those 41 smokeless plaintiffs with prejudice. For a further discussion of the related plaintiffs’ claims, see note 28, paragraph 41.
(Note 6) In July 1998, trial began in Engle v R.J. Reynolds Tobacco Co., a then-certified class action filed in Circuit Court, Miami-Dade County, Florida, against US cigarette manufacturers, including RJRT, Lorillard Tobacco and B&W. In July 2000, the jury in Phase II awarded the class a total of approximately US$145 billion (approximately £114 billion) in punitive damages, apportioned US$36.3 billion (approximately £28.5 billion) to RJRT, US$17.6 billion (approximately £13.8 billion) to B&W, and US$16.3 billion (approximately £12.8 billion) to Lorillard Tobacco. This decision was appealed and ultimately resulted in the Florida Supreme Court in December 2006 decertifying the class and allowing judgments entered for only two of the three Engle class representatives to stand and setting aside the punitive damages award. Putative Engle class members were permitted to file individual lawsuits, deemed “Engle progeny cases”, against the Engle defendants, within one year of the Supreme Court’s decision (subsequently extended to 11 January 2008). Between the period 1 January 2016 and 31 December 2018, 46 judgments have been returned in the plaintiffs’ favour, awarding damages totalling approximately US$341.7 million (approximately £268.3 million). Certain of these judgments have been appealed by RJRT and in certain other cases, RJRT still had time to appeal, as of 31 December 2018. For a further description of the Engle progeny cases, see note 28, paragraphs 30-39.
(Note 7) Broin v Philip Morris, Inc. was a class action filed in Circuit Court in Miami-Dade County, Florida in 1991 and brought on behalf of flight attendants alleged to have suffered from diseases or ailments caused by exposure to Environmental Tobacco Smoke (ETS) in airplane cabins. Group companies and other cigarette manufacturer defendants settled Broin, agreeing to pay a total of US$300 million (approximately £236 million) to fund research on the detection and cure of tobacco- related diseases and US$49 million (approximately £38.5 million) in plaintiffs’ counsel’s fees and expenses. Group companies’ share of these payments totalled US$223 million (approximately £175 million). Broin II cases refer to individual cases by class members. There have been no Broin II trials since 2007. For a further description of the Broin II cases, see note 28, paragraph 41.
(Note 8) Includes claims brought against Lorillard Tobacco and Lorillard by individuals who seek damages resulting from their alleged exposure to asbestos fibres that were incorporated into filter material used in one brand of cigarettes manufactured by a predecessor to Lorillard Tobacco for a limited period of time ending more than 50 years ago. Since 1 January 2016, Lorillard Tobacco and RJRT have paid, or have reached agreement to pay, a total of approximately US$30.2 million (approximately £23.7 million) in settlements to resolve 137 Filter Cases. See note 28, paragraph 41.
193BAT Annual Report and Form 20-F 2018

Financial Statements
Notes on the Accounts continued
28 Contingent liabilities and financial commitments continued (Note 9) Group companies’ expenses and payments under the State Settlement Agreements for 2018 amounted to US$2,741 million (approximately £2,152 million) in respect of settlement expenses and US$917 million (approximately £720 million) in respect of settlement cash payments. See note 28, paragraph 44. The pending cases referred to above relate to the enforcement, validity or interpretation of the State Settlement Agreements in which RJR Tobacco, B&W or Lorillard Tobacco is a party. See note 28, paragraphs 42-53.
(Note 10) Outside the United States, there are 13 class actions being brought against Group companies (excluding one class action in Brazil that is included in the medical reimbursement category) as of 31 December 2018. These include class actions in the following jurisdictions: Brazil (1), Canada (11) and Venezuela (1). For a description of the Group companies’ class actions, see note 28, paragraphs 65-77. Pursuant to the judgment in 2015 in the two Quebec class actions, the plaintiffs were awarded damages and interest in the amount of CAD$15.6 billion (approximately £8.9 billion or US$11.4 billion), of which the Group companies’ share is CAD$10.4 billion (approximately £5.9 billion or US$7.6 billion). The class actions are currently under appeal. For a further description of the Quebec class actions, see note 28, paragraph 72.
(Note 11) As at 31 December 2018, the jurisdictions with the most active individual cases against Group companies were, in descending order: Brazil (56), Italy (25), Chile (10), Canada (5), Argentina (5) and Ireland (2). There were a further four jurisdictions with one active case only. Out of these 107 cases, in 2018, 2 judgments have been returned in the plaintiffs’ favour as of 31 December 2018, one case in Brazil awarding damages totalling R$ 637,500 (approximately £129,149 or US$ $164,484) and one case in Italy awarding damages totalling €789,970, (approximately £709,054 or US$903,051), both of which are currently on appeal.
11. Certain terms and phrases used in this note 28 may require some explanation.
a. “Judgment” or “final judgment” refers to the final decision of the court resolving the dispute and determining the rights and obligations of the parties. At the trial court level, for example, a final judgment generally is entered by the court after a jury verdict and after post-verdict motions have been decided. In most cases, the losing party can appeal a verdict only after a final judgment has been entered by the trial court.
b. “Damages” refers to the amount of money sought by a plaintiff in a complaint, or awarded to a party by a jury or, in some cases, by a judge. “Compensatory damages” are awarded to compensate the prevailing party for actual losses suffered, if liability is proved. In cases in which there is a finding that a defendant has acted wilfully, maliciously or fraudulently, generally based on a higher burden of proof than is required for a finding of liability for compensatory damages, a plaintiff also may be awarded “punitive damages”. Although damages may be awarded at the trial court stage, a losing party may be protected from paying any damages until all appellate avenues have been exhausted by posting a supersedeas bond. The amount of such a bond is governed by the law of the relevant jurisdiction and generally is set at the amount of damages plus some measure of statutory interest, modified at the discretion of the appropriate court or subject to limits set by a court or statute.
c. “Settlement” refers to certain types of cases in which cigarette manufacturers, including RJRT, B&W and Lorillard Tobacco, have agreed to resolve disputes with certain plaintiffs without resolving the cases through trial.
d. All sums set out in this note 28 have been converted to GBP and US$ using the following end closing rates as at December 2018: GBP 1 to US$ 1.273600, GBP 1 to CAD$1.739480, GBP 1 to EURO 1.1141192, GBP 1 to BRL 4.93616, GBP 1 to AOA 393.04188, GBP 1 to NGN 462.9536, GBP 1 to KRW 1421.08 and GBP 1 to HRK 8.25382, and GBP 1 to JPY 139.73302.
US Litigation12. Group companies, notably R. J. Reynolds Tobacco Company
(“RJRT”) (individually and as successor by merger to Lorillard Tobacco Company (“Lorillard Tobacco”)) and Brown & Williamson Holdings, Inc. (formerly Brown & Williamson Tobacco Corporation) (“B&W”) as well as other leading cigarette manufacturers, are defendants in a number of product liability cases. In a number of these cases, the amounts of compensatory and punitive damages sought are significant.
13. The total number of US tobacco product liability cases pending at 31 December 2018 involving RJRT, Lorillard Tobacco and/or B&W was approximately 3,900. As at 31 December 2018, British American Tobacco (Investments) Limited (“Investments”) has been served as a co-defendant in one of those cases (2017:1). No other UK-based Group company has been served as a co-defendant in any US tobacco product liability case pending as at 31 December 2018.
14. Since many of these pending cases seek unspecified damages, it is not possible to quantify the total amounts being claimed, but the aggregate amounts involved in such litigation are significant, possibly totalling billions of US dollars. The cases fall into four broad categories: medical reimbursement cases; class actions; individual cases and other claims.
15. RJRT (individually and as successor by merger to Lorillard Tobacco), American Snuff Co., Santa Fe Natural Tobacco Company, Inc. (“SFNTC”), R.J. Reynolds Vapor Company (“RJR Vapor”), RAI, Lorillard, other RAI affiliates and indemnitees, including but not limited to B&W (collectively, the “Reynolds Defendants”), believe that they have valid defences to the tobacco-related litigation claims against them, as well as valid bases for appeal of adverse verdicts against them. The Reynolds Defendants have, through their counsel, filed pleadings and memoranda in pending tobacco-related litigation that set forth and discuss a number of grounds and defences that they and their counsel believe have a valid basis in law and fact.
16. Scheduled trials. Trial schedules are subject to change, and many cases are dismissed before trial. In the US, there are 34 cases, exclusive of Engle progeny cases, scheduled for trial as of 31 December 2018 through 31 December 2019, for the Reynolds Defendants: 12 individual smoking and health cases, 20 Filter Cases and one other non-smoking and health case. There are also approximately 135 Engle progeny cases against RJRT (individually and as successor to Lorillard Tobacco) and B&W for trial through 31 December 2019. It is not known how many of these cases will actually be tried.
194 BAT Annual Report and Form 20-F 2018

Governance Other InformationFinancial StatementsStrategic Report
28 Contingent liabilities and financial commitments continued17. Trial results. From 1 January 2016 through 31 December 2018,
117 individual smoking and health, Engle progeny, Filter and health-care cost recovery cases in which the Reynolds Defendants were defendants were tried, including 13 trials for cases where mistrials were declared in the original proceedings. Verdicts in favour of the Reynolds Defendants and, in some cases, other defendants, were returned in 29 cases, tried in Florida (27), California (1) and New Jersey (1). There were also 26 mistrials in Florida. Verdicts in favour of the plaintiffs were returned in 50 cases, tried in Florida (47), the U.S. Virgin Islands (2), and Massachusetts (1). Five cases in Florida were dismissed during trial. Two cases were continued during trial. Four cases were punitive damages retrials and one case was resolved during trial.
(a) Medical Reimbursement Cases18. These civil actions seek to recover amounts spent by government
entities and other third-party providers on healthcare and welfare costs claimed to result from illnesses associated with smoking.
19. At 31 December 2018, one US medical reimbursement suit (Crow Creek Sioux Tribe v American Tobacco Co.) was pending against RJRT, Lorillard Tobacco and B&W in a Native American tribal court in South Dakota. The plaintiffs seek to recover actual and punitive damages, restitution, funding of a clinical cessation programme, funding of a corrective public education programme, and disgorgement of unjust profits from sales to minors. No other medical reimbursement suits are pending against these companies by county or other political subdivisions of the states.
US Department of Justice Action20. On 22 September 1999, the US Department of Justice brought an
action in the US District Court for the District of Columbia against various industry members, including RJRT, Lorillard Tobacco, B&W, B.A.T Industries p.l.c. (“Industries”) and Investments (United States v Philip Morris USA Inc.). The US Department of Justice initially sought (1) recovery of federal funds expended in providing health care to smokers who developed alleged smoking-related diseases pursuant to the Medical Care Recovery Act and Medicare Secondary Payer provisions of the Social Security Act and (2) equitable relief under the civil provisions of the Racketeer Influenced and Corrupt Organizations Act (“RICO”), including disgorgement of roughly US$280 billion (approximately £220 billion) in profits the government contended were earned as a consequence of a purported racketeering “enterprise” along with certain “corrective communications”. In September 2000, the district court dismissed the government’s Medical Care Recovery Act and Medicare Secondary Payer claims. In February 2005, the US Court of Appeals for the DC Circuit (the “DC Circuit”) ruled that disgorgement was not an available remedy.
21. Industries was dismissed for lack of personal jurisdiction on 28 September 2000. In addition, Investments was a defendant at the trial, but intervening changes in controlling law post-trial led to a 28 March 2011 court ruling that the court’s Final Judgment and Remedial Order no longer applied to Investments prospectively, and for this reason, Investments would not have to comply with any of the remaining injunctive remedies being sought by the government. As the government did not appeal the 28 March 2011 ruling, this means that Investments is no longer in the case and is not subject to any injunctive relief that the court is expected to order against the remaining defendants. As the case continued as against RJRT and Lorillard Tobacco with respect to injunctive relief and related matters, the following is noted.
22. The non-jury trial of the RICO portion of the claim began on 21 September 2004, and ended on 9 June 2005. On 17 August 2006, the federal district court issued its Final Judgment and Remedial Order, which found certain defendants, including RJRT, B&W, Lorillard Tobacco and Investments, had violated RICO, but did not impose any direct financial penalties. The district court instead enjoined the defendants from committing future racketeering acts, participating in certain trade organisations, making misrepresentations concerning smoking and health and youth marketing, and using certain brand descriptors such as “low tar”, “light”, “ultra-light”, “mild” and “natural”. The district court also ordered the defendants to issue “corrective communications” on five subjects, including smoking and health and addiction, and to comply with further undertakings, including maintaining web sites of historical corporate documents and disseminating certain marketing information on a confidential basis to the government. In addition, the district court placed restrictions on the defendants’ ability to dispose of certain assets for use in the United States, unless the transferee agrees to abide by the terms of the district court’s order, and ordered certain defendants to reimburse the US Department of Justice its taxable costs incurred in connection with the case.
23. Defendants, including RJRT, Lorillard Tobacco, B&W and Investments, appealed, and the US government cross-appealed to the DC Circuit. On 22 May 2009, the DC Circuit affirmed the federal district court’s RICO liability judgment, but vacated the order and remanded for further factual findings and clarification as to whether liability should be imposed against B&W, based on changes in the nature of B&W’s business operations (including the extent of B&W’s control over tobacco operations). The court also remanded on three other discrete issues relating to the injunctive remedies, including for the district court “to reformulate” the injunction on the use of low-tar descriptors “to exempt foreign activities that have no substantial, direct, and foreseeable domestic effects,” and for the district court to evaluate whether corrective communications could be required at point-of-sale displays (which requirement the DC Circuit vacated). On 28 June 2010, the US Supreme Court denied the parties’ petitions for further review.
24. On 22 December 2010, the district court dismissed B&W from the litigation. In November 2012, the trial court entered an order setting forth the text of the corrective statements and directed the parties to engage in discussions with the Special Master to implement them. After various proceedings and appeals, the federal district court in October 2017 ordered RJRT and the other US tobacco company defendants to fund the publishing of compelled public statements in various US media outlets, including in newspapers, and on television, the companies’ websites and cigarette packaging. The compelled public statements began appearing in US newspapers on 24 November 2017 and ran serially over four months; they began appearing on national US broadcast television networks on 27 November 2017 and ran several times per week for one year. The statements also began appearing on RJRT websites on 18 June 2018 and first appeared on package onserts beginning in November 2018 (the onserts will be distributed periodically through mid-2020). The district court is considering mandating the display of the compelled public statements at retail point of sale; briefing on that issue concluded on 14 September 2018.
195BAT Annual Report and Form 20-F 2018
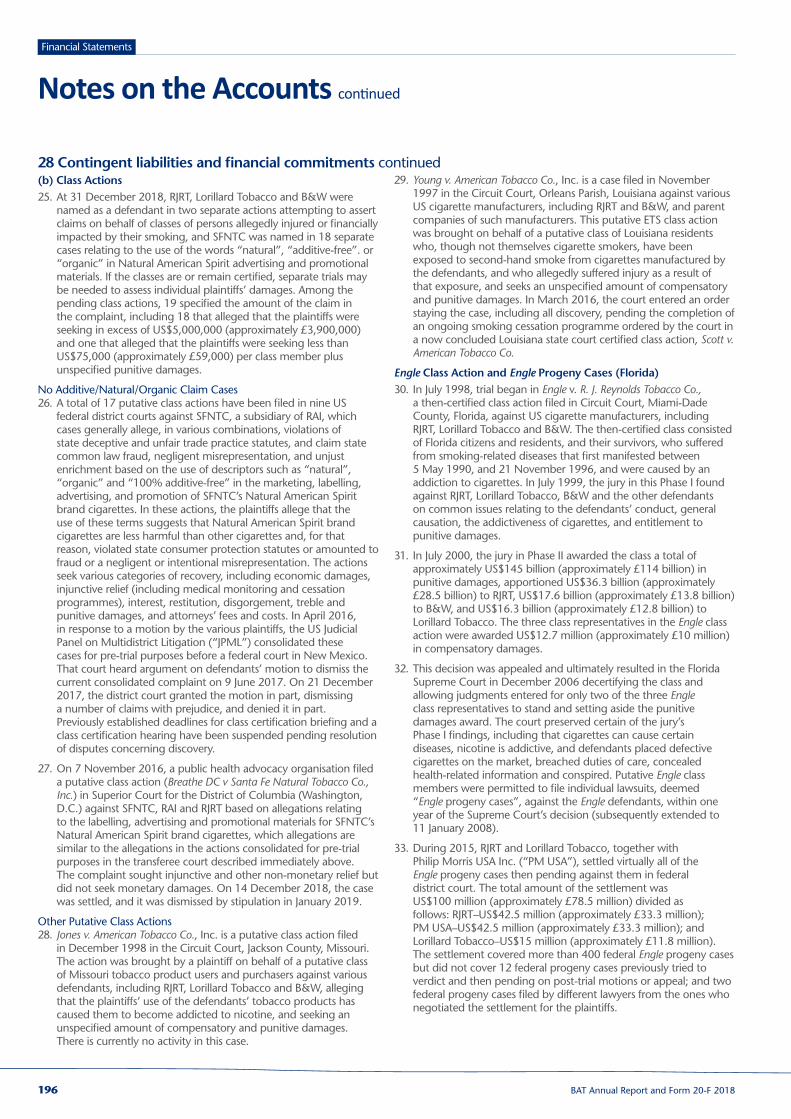
Financial Statements
Notes on the Accounts continued
28 Contingent liabilities and financial commitments continued (b) Class Actions25. At 31 December 2018, RJRT, Lorillard Tobacco and B&W were
named as a defendant in two separate actions attempting to assert claims on behalf of classes of persons allegedly injured or financially impacted by their smoking, and SFNTC was named in 18 separate cases relating to the use of the words “natural”, “additive-free”. or “organic” in Natural American Spirit advertising and promotional materials. If the classes are or remain certified, separate trials may be needed to assess individual plaintiffs’ damages. Among the pending class actions, 19 specified the amount of the claim in the complaint, including 18 that alleged that the plaintiffs were seeking in excess of US$5,000,000 (approximately £3,900,000) and one that alleged that the plaintiffs were seeking less than US$75,000 (approximately £59,000) per class member plus unspecified punitive damages.
No Additive/Natural/Organic Claim Cases26. A total of 17 putative class actions have been filed in nine US
federal district courts against SFNTC, a subsidiary of RAI, which cases generally allege, in various combinations, violations of state deceptive and unfair trade practice statutes, and claim state common law fraud, negligent misrepresentation, and unjust enrichment based on the use of descriptors such as “natural”, “organic” and “100% additive-free” in the marketing, labelling, advertising, and promotion of SFNTC’s Natural American Spirit brand cigarettes. In these actions, the plaintiffs allege that the use of these terms suggests that Natural American Spirit brand cigarettes are less harmful than other cigarettes and, for that reason, violated state consumer protection statutes or amounted to fraud or a negligent or intentional misrepresentation. The actions seek various categories of recovery, including economic damages, injunctive relief (including medical monitoring and cessation programmes), interest, restitution, disgorgement, treble and punitive damages, and attorneys’ fees and costs. In April 2016, in response to a motion by the various plaintiffs, the US Judicial Panel on Multidistrict Litigation (“JPML”) consolidated these cases for pre-trial purposes before a federal court in New Mexico. That court heard argument on defendants’ motion to dismiss the current consolidated complaint on 9 June 2017. On 21 December 2017, the district court granted the motion in part, dismissing a number of claims with prejudice, and denied it in part. Previously established deadlines for class certification briefing and a class certification hearing have been suspended pending resolution of disputes concerning discovery.
27. On 7 November 2016, a public health advocacy organisation filed a putative class action (Breathe DC v Santa Fe Natural Tobacco Co., Inc.) in Superior Court for the District of Columbia (Washington, D.C.) against SFNTC, RAI and RJRT based on allegations relating to the labelling, advertising and promotional materials for SFNTC’s Natural American Spirit brand cigarettes, which allegations are similar to the allegations in the actions consolidated for pre-trial purposes in the transferee court described immediately above. The complaint sought injunctive and other non-monetary relief but did not seek monetary damages. On 14 December 2018, the case was settled, and it was dismissed by stipulation in January 2019.
Other Putative Class Actions28. Jones v. American Tobacco Co., Inc. is a putative class action filed
in December 1998 in the Circuit Court, Jackson County, Missouri. The action was brought by a plaintiff on behalf of a putative class of Missouri tobacco product users and purchasers against various defendants, including RJRT, Lorillard Tobacco and B&W, alleging that the plaintiffs’ use of the defendants’ tobacco products has caused them to become addicted to nicotine, and seeking an unspecified amount of compensatory and punitive damages. There is currently no activity in this case.
29. Young v. American Tobacco Co., Inc. is a case filed in November 1997 in the Circuit Court, Orleans Parish, Louisiana against various US cigarette manufacturers, including RJRT and B&W, and parent companies of such manufacturers. This putative ETS class action was brought on behalf of a putative class of Louisiana residents who, though not themselves cigarette smokers, have been exposed to second-hand smoke from cigarettes manufactured by the defendants, and who allegedly suffered injury as a result of that exposure, and seeks an unspecified amount of compensatory and punitive damages. In March 2016, the court entered an order staying the case, including all discovery, pending the completion of an ongoing smoking cessation programme ordered by the court in a now concluded Louisiana state court certified class action, Scott v. American Tobacco Co.
Engle Class Action and Engle Progeny Cases (Florida)30. In July 1998, trial began in Engle v. R. J. Reynolds Tobacco Co.,
a then-certified class action filed in Circuit Court, Miami-Dade County, Florida, against US cigarette manufacturers, including RJRT, Lorillard Tobacco and B&W. The then-certified class consisted of Florida citizens and residents, and their survivors, who suffered from smoking-related diseases that first manifested between 5 May 1990, and 21 November 1996, and were caused by an addiction to cigarettes. In July 1999, the jury in this Phase I found against RJRT, Lorillard Tobacco, B&W and the other defendants on common issues relating to the defendants’ conduct, general causation, the addictiveness of cigarettes, and entitlement to punitive damages.
31. In July 2000, the jury in Phase II awarded the class a total of approximately US$145 billion (approximately £114 billion) in punitive damages, apportioned US$36.3 billion (approximately £28.5 billion) to RJRT, US$17.6 billion (approximately £13.8 billion) to B&W, and US$16.3 billion (approximately £12.8 billion) to Lorillard Tobacco. The three class representatives in the Engle class action were awarded US$12.7 million (approximately £10 million) in compensatory damages.
32. This decision was appealed and ultimately resulted in the Florida Supreme Court in December 2006 decertifying the class and allowing judgments entered for only two of the three Engle class representatives to stand and setting aside the punitive damages award. The court preserved certain of the jury’s Phase I findings, including that cigarettes can cause certain diseases, nicotine is addictive, and defendants placed defective cigarettes on the market, breached duties of care, concealed health-related information and conspired. Putative Engle class members were permitted to file individual lawsuits, deemed “Engle progeny cases”, against the Engle defendants, within one year of the Supreme Court’s decision (subsequently extended to 11 January 2008).
33. During 2015, RJRT and Lorillard Tobacco, together with Philip Morris USA Inc. (“PM USA”), settled virtually all of the Engle progeny cases then pending against them in federal district court. The total amount of the settlement was US$100 million (approximately £78.5 million) divided as follows: RJRT–US$42.5 million (approximately £33.3 million); PM USA–US$42.5 million (approximately £33.3 million); and Lorillard Tobacco–US$15 million (approximately £11.8 million). The settlement covered more than 400 federal Engle progeny cases but did not cover 12 federal progeny cases previously tried to verdict and then pending on post-trial motions or appeal; and two federal progeny cases filed by different lawyers from the ones who negotiated the settlement for the plaintiffs.
196 BAT Annual Report and Form 20-F 2018
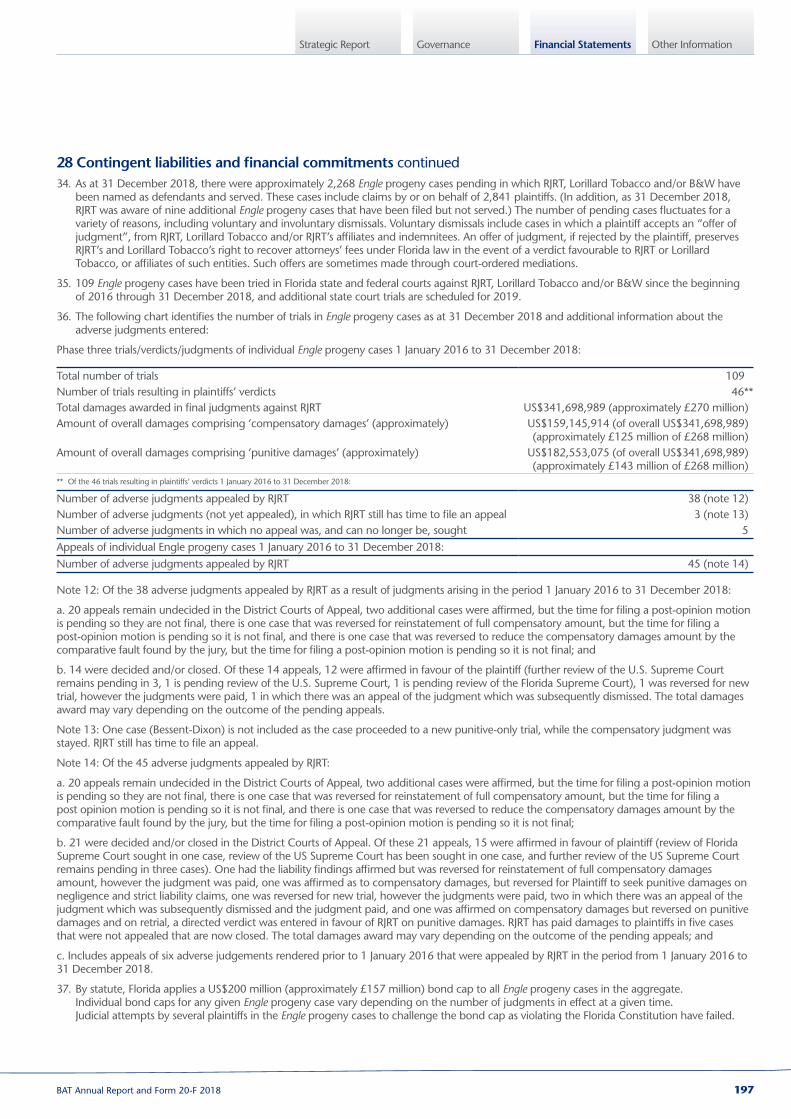
Governance Other InformationFinancial StatementsStrategic Report
28 Contingent liabilities and financial commitments continued34. As at 31 December 2018, there were approximately 2,268 Engle progeny cases pending in which RJRT, Lorillard Tobacco and/or B&W have
been named as defendants and served. These cases include claims by or on behalf of 2,841 plaintiffs. (In addition, as 31 December 2018, RJRT was aware of nine additional Engle progeny cases that have been filed but not served.) The number of pending cases fluctuates for a variety of reasons, including voluntary and involuntary dismissals. Voluntary dismissals include cases in which a plaintiff accepts an “offer of judgment”, from RJRT, Lorillard Tobacco and/or RJRT’s affiliates and indemnitees. An offer of judgment, if rejected by the plaintiff, preserves RJRT’s and Lorillard Tobacco’s right to recover attorneys’ fees under Florida law in the event of a verdict favourable to RJRT or Lorillard Tobacco, or affiliates of such entities. Such offers are sometimes made through court-ordered mediations.
35. 109 Engle progeny cases have been tried in Florida state and federal courts against RJRT, Lorillard Tobacco and/or B&W since the beginning of 2016 through 31 December 2018, and additional state court trials are scheduled for 2019.
36. The following chart identifies the number of trials in Engle progeny cases as at 31 December 2018 and additional information about the adverse judgments entered:
Phase three trials/verdicts/judgments of individual Engle progeny cases 1 January 2016 to 31 December 2018:
Total number of trials 109Number of trials resulting in plaintiffs’ verdicts 46**Total damages awarded in final judgments against RJRT US$341,698,989 (approximately £270 million)Amount of overall damages comprising ‘compensatory damages’ (approximately) US$159,145,914 (of overall US$341,698,989)
(approximately £125 million of £268 million)Amount of overall damages comprising ‘punitive damages’ (approximately) US$182,553,075 (of overall US$341,698,989)
(approximately £143 million of £268 million)** Of the 46 trials resulting in plaintiffs’ verdicts 1 January 2016 to 31 December 2018: Number of adverse judgments appealed by RJRT 38 (note 12)Number of adverse judgments (not yet appealed), in which RJRT still has time to file an appeal 3 (note 13)Number of adverse judgments in which no appeal was, and can no longer be, sought 5Appeals of individual Engle progeny cases 1 January 2016 to 31 December 2018:Number of adverse judgments appealed by RJRT 45 (note 14)
Note 12: Of the 38 adverse judgments appealed by RJRT as a result of judgments arising in the period 1 January 2016 to 31 December 2018:
a. 20 appeals remain undecided in the District Courts of Appeal, two additional cases were affirmed, but the time for filing a post-opinion motion is pending so they are not final, there is one case that was reversed for reinstatement of full compensatory amount, but the time for filing a post-opinion motion is pending so it is not final, and there is one case that was reversed to reduce the compensatory damages amount by the comparative fault found by the jury, but the time for filing a post-opinion motion is pending so it is not final; and
b. 14 were decided and/or closed. Of these 14 appeals, 12 were affirmed in favour of the plaintiff (further review of the U.S. Supreme Court remains pending in 3, 1 is pending review of the U.S. Supreme Court, 1 is pending review of the Florida Supreme Court), 1 was reversed for new trial, however the judgments were paid, 1 in which there was an appeal of the judgment which was subsequently dismissed. The total damages award may vary depending on the outcome of the pending appeals.
Note 13: One case (Bessent-Dixon) is not included as the case proceeded to a new punitive-only trial, while the compensatory judgment was stayed. RJRT still has time to file an appeal.
Note 14: Of the 45 adverse judgments appealed by RJRT:
a. 20 appeals remain undecided in the District Courts of Appeal, two additional cases were affirmed, but the time for filing a post-opinion motion is pending so they are not final, there is one case that was reversed for reinstatement of full compensatory amount, but the time for filing a post opinion motion is pending so it is not final, and there is one case that was reversed to reduce the compensatory damages amount by the comparative fault found by the jury, but the time for filing a post-opinion motion is pending so it is not final;
b. 21 were decided and/or closed in the District Courts of Appeal. Of these 21 appeals, 15 were affirmed in favour of plaintiff (review of Florida Supreme Court sought in one case, review of the US Supreme Court has been sought in one case, and further review of the US Supreme Court remains pending in three cases). One had the liability findings affirmed but was reversed for reinstatement of full compensatory damages amount, however the judgment was paid, one was affirmed as to compensatory damages, but reversed for Plaintiff to seek punitive damages on negligence and strict liability claims, one was reversed for new trial, however the judgments were paid, two in which there was an appeal of the judgment which was subsequently dismissed and the judgment paid, and one was affirmed on compensatory damages but reversed on punitive damages and on retrial, a directed verdict was entered in favour of RJRT on punitive damages. RJRT has paid damages to plaintiffs in five cases that were not appealed that are now closed. The total damages award may vary depending on the outcome of the pending appeals; and
c. Includes appeals of six adverse judgements rendered prior to 1 January 2016 that were appealed by RJRT in the period from 1 January 2016 to 31 December 2018.
37. By statute, Florida applies a US$200 million (approximately £157 million) bond cap to all Engle progeny cases in the aggregate. Individual bond caps for any given Engle progeny case vary depending on the number of judgments in effect at a given time. Judicial attempts by several plaintiffs in the Engle progeny cases to challenge the bond cap as violating the Florida Constitution have failed.
197BAT Annual Report and Form 20-F 2018

Financial Statements
Notes on the Accounts continued
28 Contingent liabilities and financial commitments continued In addition, bills have been introduced in sessions of the Florida legislature that would eliminate the Engle progeny bond cap, but those bills
have not been enacted as of 31 December 2018.
38. In 2018, RJRT or Lorillard Tobacco has paid judgments in 33 Engle progeny cases. Those payments totalled US$333 million (approximately £261 million) in compensatory or punitive damages. Additional costs were paid in respect of attorneys’ fees and statutory interest.
39. In addition, accruals for damages and attorneys’ fees and statutory interest for 8 cases (Starr-Blundell v R. J. Reynolds Tobacco Co., Odom v. R. J. Reynolds Tobacco Co., Nally v. R. J. Reynolds Tobacco Co., Johnston v. R. J. Reynolds Tobacco Co., Searcy v. R. J. Reynolds Tobacco Co., Fox v. R. J. Reynolds Tobacco Co., Lima v. R. J. Reynolds Tobacco Co and Pardue v. R. J. Reynolds Tobacco Co.) were recorded in RAI’s consolidated balance sheet as of 31 December 2018 to the value of US$104,902,981.61 (approximately £82,367,291).
(c) Individual Cases40. As of 31 December 2018, 111 individual cases were pending in the United States against RJRT, Lorillard Tobacco and/or B&W. This category
of cases includes smoking and health cases alleging personal injuries caused by tobacco use or exposure brought by or on behalf of individual plaintiffs based on theories of negligence, strict liability, breach of express or implied warranty, and violations of state deceptive trade practices or consumer protection statutes. The plaintiffs seek to recover compensatory damages, attorneys’ fees and costs, and punitive damages. The category does not include the West Virginia personal injury cases (“West Virginia IPIC”) cases, Engle progeny cases, Broin II cases, and Filter Cases discussed above and below. One of the individual cases is brought by or on behalf of an individual or his/her survivors alleging personal injury as a result of exposure to ETS.
41. The following chart identifies the number of individual cases pending as of 31 December 2018 as against the number pending as of 31 December 2017, along with the number of West Virginia IPIC cases, Engle progeny cases, Broin II cases, and Filter Cases, which are discussed further below.
Case TypeUS Case Numbers
31 December 2018US Case Numbers
31 December 2017Change in Number
Increase/(Decrease)
US tobacco related actions Individual Smoking and Health Cases (note 15) 111 99 12West Virginia IPIC (Number of Plaintiffs) (note 16) 1 (1) 1 (564) No change/(563)Engle Progeny Cases (Number of Plaintiffs) (note 17) 2,268 (2,841) 2,569 (3,276) (301) (435)Broin II Cases (note 18) 1,406 2,321 (915)Filter Cases (note 19) 58 71 (13)
(Note 15) Out of the 111 pending individual smoking and health cases, five have received adverse verdicts in the court of first instance or on appeal, and the total amount of those verdicts is US$209.4 million (approximately £164.4 million).
(Note 16) The West Virginia IPIC cases are a series of roughly 1,200 cases, filed in West Virginia beginning in 1999, asserting claims against PM USA, Lorillard Tobacco, RJRT, B&W and The American Tobacco Company. These cases were brought in consolidated proceedings in West Virginia alleging personal injuries, where the first phase of the trial began on 15 April 2013 and on 15 May 2013 the jury returned a verdict for defendants on all but one of plaintiffs’ claims (the verdict was affirmed on appeal). The one claim upon which plaintiffs prevailed was a limited failure to instruct claim covering a narrow window of time. Only 30 plaintiffs qualified to pursue that narrow claim. In 2017, those 30 plaintiffs agreed to resolve their claims for US$7,000 (approximately £5,496) per case. All of those failure to instruct claims have been dismissed with prejudice, with the agreement that each plaintiff who submits a release within one year will receive the agreed payment of US$7,000 (approximately £5,496) from either PM USA or RJRT, as appropriate. Three of the 30 plaintiffs have submitted releases to date. In addition to the foregoing failure to instruct claims, various plaintiffs in 1999 and 2000 asserted claims against retailers and distributors (which have not been pursued in light of the result in the Phase I trial in defendants’ favour), as well as smokeless claims against various defendants including RJRT, Lorillard, American Snuff and B&W. In 2017, 41 plaintiffs were permitted to pursue their smokeless claims over defendants’ objections. On 27 April 2018, the court dismissed the claims of those 41 plaintiffs with prejudice. In the final weeks of the case in the trial court, one plaintiff sought to pursue a roll-your-own claim that had long been dormant. The trial court denied that request and that one plaintiff appealed to the West Virginia Supreme Court on 8 May 2018. That appeal has been fully briefed and is awaiting decision.
(Note 17) The number of Engle progeny cases will fluctuate as cases are dismissed or if any of the dismissed cases are appealed. Please see earlier table in paragraph 36.
(Note 18) Broin v Philip Morris, Inc. was a class action filed in Circuit Court in Miami-Dade County, Florida in 1991 and brought on behalf of flight attendants alleged to have suffered from diseases or ailments caused by exposure to ETS in airplane cabins. In October 1997, RJRT, Lorillard Tobacco, B&W and other cigarette manufacturer defendants settled Broin, agreeing to pay a total of US$300 million (approximately £236 million) in three annual US$100 million (approximately £79 million) instalments, allocated among the companies by market share, to fund research on the early detection and cure of diseases associated with tobacco smoke. It also required those companies to pay a total of US$49 million (approximately £38.5 million) for the plaintiffs’ counsel’s fees and expenses. RJRT’s portion of these payments was approximately US$86 million (approximately £68 million); Lorillard Tobacco’s was approximately US$57 million (approximately £45 million); and B&W’s was approximately US$31 million (approximately £24.3 million). The settlement agreement, among other things, limits the types of claims class members may bring and eliminates claims for punitive damages. The settlement agreement also provides that, in individual cases by class members that are referred to as Broin II lawsuits, the defendants will bear the burden of proof with respect to whether ETS can cause certain specifically enumerated diseases, referred to as “general causation”. With respect to all other liability issues, including whether an individual plaintiff’s disease was caused by his or her exposure to ETS in airplane cabins, referred to as “specific causation”, individual plaintiffs will bear the burden of proof. On 7 September 1999, the Florida Supreme Court approved the settlement. There have been no Broin II trials since 2007. There have been periodic efforts to activate cases and the Group expects this to continue over time.
198 BAT Annual Report and Form 20-F 2018
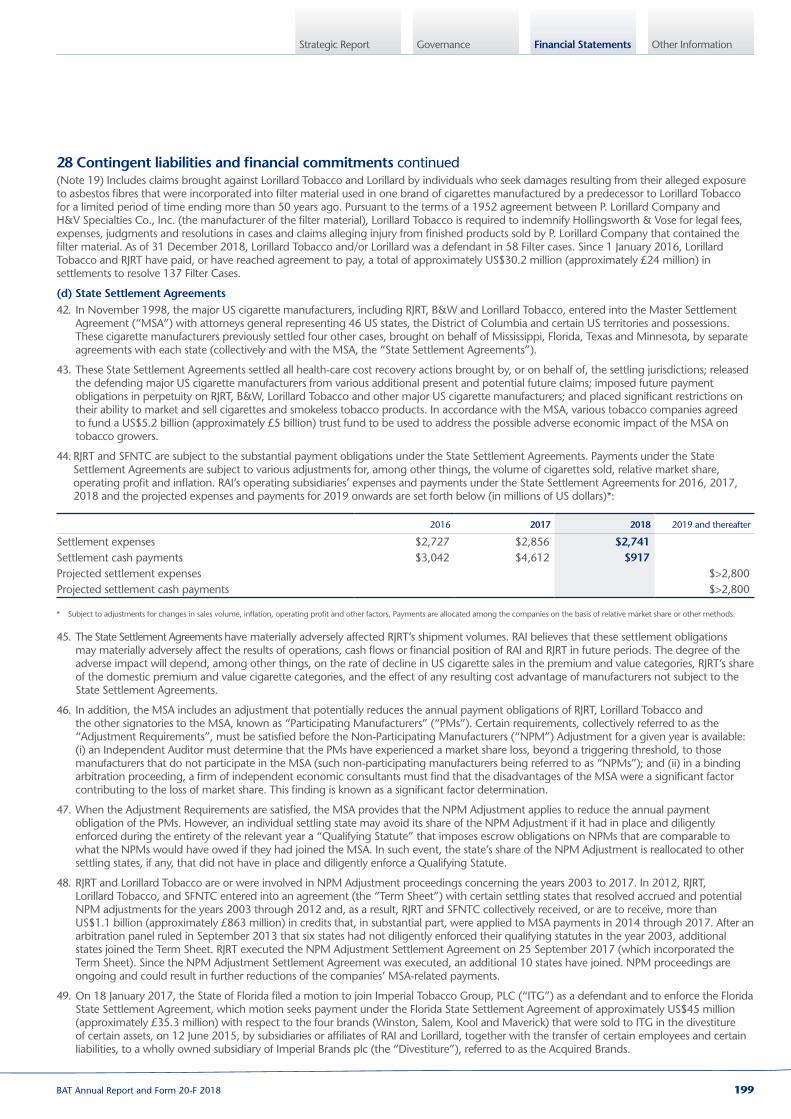
Governance Other InformationFinancial StatementsStrategic Report
28 Contingent liabilities and financial commitments continued(Note 19) Includes claims brought against Lorillard Tobacco and Lorillard by individuals who seek damages resulting from their alleged exposure to asbestos fibres that were incorporated into filter material used in one brand of cigarettes manufactured by a predecessor to Lorillard Tobacco for a limited period of time ending more than 50 years ago. Pursuant to the terms of a 1952 agreement between P. Lorillard Company and H&V Specialties Co., Inc. (the manufacturer of the filter material), Lorillard Tobacco is required to indemnify Hollingsworth & Vose for legal fees, expenses, judgments and resolutions in cases and claims alleging injury from finished products sold by P. Lorillard Company that contained the filter material. As of 31 December 2018, Lorillard Tobacco and/or Lorillard was a defendant in 58 Filter cases. Since 1 January 2016, Lorillard Tobacco and RJRT have paid, or have reached agreement to pay, a total of approximately US$30.2 million (approximately £24 million) in settlements to resolve 137 Filter Cases.
(d) State Settlement Agreements42. In November 1998, the major US cigarette manufacturers, including RJRT, B&W and Lorillard Tobacco, entered into the Master Settlement
Agreement (“MSA”) with attorneys general representing 46 US states, the District of Columbia and certain US territories and possessions. These cigarette manufacturers previously settled four other cases, brought on behalf of Mississippi, Florida, Texas and Minnesota, by separate agreements with each state (collectively and with the MSA, the “State Settlement Agreements”).
43. These State Settlement Agreements settled all health-care cost recovery actions brought by, or on behalf of, the settling jurisdictions; released the defending major US cigarette manufacturers from various additional present and potential future claims; imposed future payment obligations in perpetuity on RJRT, B&W, Lorillard Tobacco and other major US cigarette manufacturers; and placed significant restrictions on their ability to market and sell cigarettes and smokeless tobacco products. In accordance with the MSA, various tobacco companies agreed to fund a US$5.2 billion (approximately £5 billion) trust fund to be used to address the possible adverse economic impact of the MSA on tobacco growers.
44. RJRT and SFNTC are subject to the substantial payment obligations under the State Settlement Agreements. Payments under the State Settlement Agreements are subject to various adjustments for, among other things, the volume of cigarettes sold, relative market share, operating profit and inflation. RAI’s operating subsidiaries’ expenses and payments under the State Settlement Agreements for 2016, 2017, 2018 and the projected expenses and payments for 2019 onwards are set forth below (in millions of US dollars)*:
2016 2017 2018 2019 and thereafter
Settlement expenses $2,727 $2,856 $2,741 Settlement cash payments $3,042 $4,612 $917 Projected settlement expenses $>2,800Projected settlement cash payments $>2,800
* Subject to adjustments for changes in sales volume, inflation, operating profit and other factors. Payments are allocated among the companies on the basis of relative market share or other methods.
45. The State Settlement Agreements have materially adversely affected RJRT’s shipment volumes. RAI believes that these settlement obligations may materially adversely affect the results of operations, cash flows or financial position of RAI and RJRT in future periods. The degree of the adverse impact will depend, among other things, on the rate of decline in US cigarette sales in the premium and value categories, RJRT’s share of the domestic premium and value cigarette categories, and the effect of any resulting cost advantage of manufacturers not subject to the State Settlement Agreements.
46. In addition, the MSA includes an adjustment that potentially reduces the annual payment obligations of RJRT, Lorillard Tobacco and the other signatories to the MSA, known as “Participating Manufacturers” (“PMs”). Certain requirements, collectively referred to as the “Adjustment Requirements”, must be satisfied before the Non-Participating Manufacturers (“NPM”) Adjustment for a given year is available: (i) an Independent Auditor must determine that the PMs have experienced a market share loss, beyond a triggering threshold, to those manufacturers that do not participate in the MSA (such non-participating manufacturers being referred to as “NPMs”); and (ii) in a binding arbitration proceeding, a firm of independent economic consultants must find that the disadvantages of the MSA were a significant factor contributing to the loss of market share. This finding is known as a significant factor determination.
47. When the Adjustment Requirements are satisfied, the MSA provides that the NPM Adjustment applies to reduce the annual payment obligation of the PMs. However, an individual settling state may avoid its share of the NPM Adjustment if it had in place and diligently enforced during the entirety of the relevant year a “Qualifying Statute” that imposes escrow obligations on NPMs that are comparable to what the NPMs would have owed if they had joined the MSA. In such event, the state’s share of the NPM Adjustment is reallocated to other settling states, if any, that did not have in place and diligently enforce a Qualifying Statute.
48. RJRT and Lorillard Tobacco are or were involved in NPM Adjustment proceedings concerning the years 2003 to 2017. In 2012, RJRT, Lorillard Tobacco, and SFNTC entered into an agreement (the “Term Sheet”) with certain settling states that resolved accrued and potential NPM adjustments for the years 2003 through 2012 and, as a result, RJRT and SFNTC collectively received, or are to receive, more than US$1.1 billion (approximately £863 million) in credits that, in substantial part, were applied to MSA payments in 2014 through 2017. After an arbitration panel ruled in September 2013 that six states had not diligently enforced their qualifying statutes in the year 2003, additional states joined the Term Sheet. RJRT executed the NPM Adjustment Settlement Agreement on 25 September 2017 (which incorporated the Term Sheet). Since the NPM Adjustment Settlement Agreement was executed, an additional 10 states have joined. NPM proceedings are ongoing and could result in further reductions of the companies’ MSA-related payments.
49. On 18 January 2017, the State of Florida filed a motion to join Imperial Tobacco Group, PLC (“ITG”) as a defendant and to enforce the Florida State Settlement Agreement, which motion seeks payment under the Florida State Settlement Agreement of approximately US$45 million (approximately £35.3 million) with respect to the four brands (Winston, Salem, Kool and Maverick) that were sold to ITG in the divestiture of certain assets, on 12 June 2015, by subsidiaries or affiliates of RAI and Lorillard, together with the transfer of certain employees and certain liabilities, to a wholly owned subsidiary of Imperial Brands plc (the “Divestiture”), referred to as the Acquired Brands.
199BAT Annual Report and Form 20-F 2018

Financial Statements
Notes on the Accounts continued
28 Contingent liabilities and financial commitments continuedThe motion also claims future annual losses of approximately US$30 million (approximately £23.6 million) absent the court’s enforcement of the Florida State Settlement Agreement. The State’s motion sought, among other things, an order declaring that RJR Tobacco and ITG are in breach of the Florida Settlement Agreement and are required, jointly and severally, to make annual payments to the State under the Florida State Settlement Agreement with respect to the Acquired Brands. In addition, on 18 January 2017, PM USA filed a motion to enforce the Florida State Settlement Agreement, asserting among other things that RJR Tobacco and ITG breached that agreement by failing to make settlement payments as to the Acquired Brands, which PM USA asserts has improperly shifted settlement payment obligations to PM USA. On 27 January 2017, RJR Tobacco sought leave to file a supplemental pleading for breach by ITG of its obligations regarding joinder into the Florida State Settlement Agreement. The Florida court, on 30 March 2017, ruled that ITG should be joined into the enforcement action.
50. After a bench trial, the court entered an order holding that RJR Tobacco (not ITG) is liable for annual settlement payments for the Acquired Brands, finding that ITG did not assume liability for annual settlement payments under the terms of the asset purchase agreement relating to the Divestiture and RJR Tobacco remained liable for payments under the Florida State Settlement Agreement as to the Acquired Brands. On 23 January 2018, RJR Tobacco filed a notice of appeal, and on 25 January 2018, RJR Tobacco filed an amended notice of appeal, and PM USA filed a notice of appeal as to the court’s ruling as to ITG. On 26 January 2018, the State moved for recovery of its attorneys’ fees and costs from RJR Tobacco. The State and PM USA filed a joint motion for the entry of final judgment on 1 February 2018. The Court declined to enter a final judgment until after resolution of the dispute between RJR Tobacco and PM USA regarding PM USA’s assertion that settlement payment obligations have been improperly shifted to PM USA. On 15 August 2018, the Court entered a Final Judgement in the action. As a result of the Court’s Final Judgment, PM USA’s challenge to RJR Tobacco’s accounting assumptions related to the Acquired Brands was rendered moot, subject to reinstatement if ITG joins the Florida State Settlement Agreement or if judgment is reversed. On 29 August 2018, RJR Tobacco filed a notice of appeal on the Final Judgment. On 7 September 2018, PM USA filed a notice of appeal with respect to the court’s ruling as to ITG. On 12 September 2018, RJR Tobacco filed a motion to consolidate RJR Tobacco’s appeal with the appeal filed by PM USA, which was granted on 1 October 2018, RJR Tobacco’s initial brief was due on 11 February 2019. On 30 January 2019, RJR Tobacco filed an agreed notice of extension of time to serve its initial brief. RJR Tobacco’s initial brief is now due on 2 April 2019. RJR Tobacco will seek indemnification from ITG, if necessary. In January 2018, the auditor of the Florida State Settlement Agreement adjusted the final 2017 invoice for the annual payment and amended the 2015 and 2016 invoices for the respective annual payment and the net operating profit penalty for each of those years under the Florida Settlement Agreement, based on the auditor’s interpretation of the court’s order. The adjusted invoices reflected amounts due to both the State of Florida and PM USA. In total, the estimated additional amounts due were US$99.4 million (approximately £78 million) with US$83.5 million (approximately £65.6 million) to the State of Florida and US$15.9 million (approximately £12.5 million) to PM USA. RJR Tobacco has advised the auditor that it disputes these amounts, and therefore no further amounts were due or would be paid for those years pending the final resolution of RJR Tobacco’s appeal of the court’s order. Those amounts were not paid.
51. On 17 February 2017, ITG filed an action in the Court of Chancery of the State of Delaware seeking declaratory relief and a motion for a temporary restraining order against RAI and RJR Tobacco. In its complaint, ITG asked the court to declare various matters related to its rights and obligations under the asset purchase agreement (and related documents) relating to the Divestiture. ITG sought an injunction barring RAI and/or RJR Tobacco from alleging in the Florida enforcement litigation that ITG had breached the asset purchase agreement and requiring these companies to litigate issues under the asset purchase agreement in Delaware. Following a hearing on ITG’s complaint and motion on 1 March 2017, the Delaware court entered a temporary restraining order that enjoined RAI and RJR Tobacco from “taking offensive action to assert claims against ITG Brands” in the Florida enforcement action, but the order does not prevent RJR Tobacco from making arguments in response to claims asserted by the State of Florida, PM USA or ITG in the Florida enforcement litigation. On 24 March 2017, RAI and RJR Tobacco answered the ITG complaint and filed a motion to stay proceedings in Delaware pending the outcome of the Florida enforcement litigation, which motion was denied 18 May 2017. Cross motions for partial judgment on the pleadings were filed focusing on whether ITG’s obligation to use “reasonable best efforts” to join the Florida State Settlement Agreement continued after the 12 June 2015 closing. On 30 November 2017, following argument, the Delaware court ruled in favour of RJR Tobacco, holding that ITG’s obligation to use its reasonable best efforts to join the Florida Settlement Agreement did not terminate due to the closing of the asset purchase agreement relating to the Divestiture. On 4 January 2019, RJR Tobacco filed a motion for partial judgment on the pleadings seeking to resolve two contract-interpretation questions under the asset purchase agreement: first, to the extent RJR Tobacco is held liable for any settlement payments based on post-closing sales of the Acquired Brands, ITG assumed this liability, and second, that the asset purchase agreement does not entitle ITG to a unique protection from an equity-fee law that does not yet exist in a Previously Settled State.
52. On 26 March 2018, the State of Minnesota filed a motion against RJR Tobacco to enforce the Minnesota State Settlement Agreement, which motion seeks payments under the Minnesota State Settlement Agreement of approximately US$40 million (approximately £31.4 million) with respect to the Acquired Brands. The motion also claims future annual losses of approximately US$15 million (approximately £11.8 million) absent the court’s enforcement of the Minnesota State Settlement Agreement. The State of Minnesota also filed a separate complaint against ITG, which complaint seeks the same payments. The State’s motion against RJR Tobacco and complaint against ITG seek, among other things, an order declaring that RJR Tobacco and ITG are in breach of the Minnesota State Settlement Agreement and are jointly and severally liable to make annual payments to the State of Minnesota under the Minnesota State Settlement Agreement with respect to the Acquired Brands. In addition, on 28 March 2018, PM USA filed a motion to enforce the Minnesota State Settlement Agreement, asserting, among other things, that RJR Tobacco and ITG breached the Minnesota State Settlement Agreement by failing to make settlement payments as to the Acquired Brands, which PM USA asserts has improperly shifted settlement payment obligations to PM USA. On 27 March 2018, the Minnesota court consolidated the motions to enforce and complaint against ITG into one proceeding captioned In re Petition of the State of Minnesota for an Order Compelling Payments of Settlement Proceeds Related
200 BAT Annual Report and Form 20-F 2018
Governance Other InformationFinancial StatementsStrategic Report
28 Contingent liabilities and financial commitments continuedto ITG Brands LLC, Court File No. 62-CV-18-1912. On 11 June 2018, the court held a scheduling conference in the case and by order dated 21 June 2018, set a discovery schedule for the case. Discovery is scheduled to be completed by 31 March 2019. No trial date has yet been set.
53. On 28 January 2019, the State of Texas filed motions to join ITG as a defendant and to enforce the Texas State Settlement Agreement against RJR Tobacco and ITG, seeking payment under the Texas State Settlement Agreement of approximately US$125 million (approximately £98 million) with respect to the Acquired Brands that were sold to ITG in the Divestiture. The motion also claims future annual losses of an unspecified amount absent the court’s enforcement of the Texas State Settlement Agreement. The State’s motion seeks, among other things, an order declaring that RJR Tobacco, or in the alternative, ITG, is in breach of the Texas Settlement Agreement and is required to make annual payments to the State under the Texas State Settlement Agreement with respect to the Acquired Brands. In addition, on 29 January 2019, PM USA filed a motion to enforce the Texas State Settlement Agreement, asserting among other things that RJR Tobacco and ITG breached that agreement by failing to make settlement payments as to the Acquired Brands, which PM USA asserts has improperly shifted settlement payment obligations to PM USA.
(e) UK — Based Group Companies54. As at 31 December 2018, Investments has been served in one
dormant individual action in the US (Perry) in which there has been no activity since 1998 following the plaintiff’s death in 1997.
Tobacco Related Litigation Outside the United States55. As at 31 December 2018:
a. medical reimbursement actions are being brought in Angola, Argentina, Brazil, Canada, Nigeria and South Korea;
b. class actions are being brought in Brazil, Canada and Venezuela;
c. active tobacco product liability claims against the Group’s companies existed in 14 markets outside the US. The only markets with five or more claims were Argentina, Brazil, Canada, Chile, Nigeria and Italy.
(a) Medical reimbursement casesAngola56. In or about November 2016, BAT Angola affiliate Sociedade
Unificada de Tabacos de Angola (“SUT”) was served with a collective action filed in the Provincial Court of Luanda, 2nd Civil Section, by the consumer association Associação Angolana dos Direitos do Consumidor (“AADIC”). The lawsuit seeks damages of AOA 800,000,000 (approximately £2 million or US$2.6 million) allegedly incurred by the Angolan Instituto Nacional do Controlo do Cancro (“INCC”) for the cost of treating tobacco-related disease, non-material damages allegedly suffered by certain individual smokers on the rolls of INCC, and the mandating of certain cigarette package warnings. SUT filed its answer to the claim on or about 5 December 2016. The case remains pending.
Argentina57. In 2007, the non-governmental organisation the Argentina Tort
Law Association (“ATLA”) and Emma Mendoza Voguet brought a reimbursement action against Nobleza Piccardo S.A.I.C.y.F. (“Nobleza”) and Massalín Particulares. The case is being heard in the Contentious Administrative Court and is currently at the evidentiary stage.
Brazil58. In August 2007, the São Paulo Public Prosecutor’s Office filed a
medical reimbursement claim against Souza Cruz S.A. (“Souza Cruz”). A similar claim was lodged against Philip Morris Brasil Indústria e Comércio Ltda. On 4 October 2011, the Court dismissed the action against Souza Cruz, with a judgment on the merits. The plaintiffs’ appeal to the Court of Appeal failed by unanimous vote (3 to 0). The Public Prosecutor’s Office filed a Special Appeal to the Superior Court of Justice, which was denied on 12 November 2018 by a decision that is subject to further appeal.
Canada59. Following the implementation of legislation enabling provincial
governments to recover healthcare costs directly from tobacco manufacturers, ten actions for recovery of healthcare costs arising from the treatment of smoking and health-related diseases have been brought. These proceedings name various Group companies as defendants, including the Company, Investments, Industries, Carreras Rothmans Limited (collectively, the “UK Companies”) and Imperial Tobacco Canada Limited (“Imperial”), the Group’s operating company in Canada, as well as RJRT and its affiliate R.J. Reynolds Tobacco International Inc. (“RJRTI”) (collectively, the “RJR Companies”). Pursuant to the terms of the 1999 sale of RJRT’s international tobacco business to Japan Tobacco Incorporated (“JTI”), JTI has agreed to indemnify RJRT for all liabilities and obligations (including litigation costs) arising in respect of the Canadian recoupment actions. Subject to a reservation of rights, JTI has assumed the defence of the RJR Companies in these actions.
60. The ten cases are proceeding in British Columbia, New Brunswick, Newfoundland and Labrador, Ontario, Quebec, Manitoba, Alberta, Saskatchewan, Nova Scotia and Prince Edward Island. The enabling legislation is in force in all ten provinces. In addition, legislation has received Royal Assent in two of the three territories in Canada, but has yet to be proclaimed into force.
201BAT Annual Report and Form 20-F 2018

Financial Statements
Notes on the Accounts continued
28 Contingent liabilities and financial commitments continued
Canadian provinceAct pursuant to which Claim was brought Companies named as Defendants Current stage
British Columbia Tobacco Damages and Health Care Costs Recovery Act 2000
ImperialInvestmentsIndustriesCarreras Rothmans LimitedRJR CompaniesOther former Rothmans Group companiesAll have been served.
The defences of Imperial, Investments, Industries, Carreras Rothmans Limited and the RJR Companies have been filed, and document production and discoveries are ongoing. On 13 February 2017 the province delivered an expert report dated October 2016, quantifying its damages in the amount of CAD$118 billion (approximately £68 billion or US$ 86.3 billion). No trial date has been set. The federal government is seeking CAD$5 million (approximately £2.9 million or US$3.7 million) jointly from all the defendants in respect of costs pertaining to the third-party claim, now dismissed.
New Brunswick Tobacco Damages and Health Care Costs Recovery Act 2006
Imperial, the UK Companies and RJR Companies have all been named as defendants and served.
The defences of Imperial, the UK Companies and the RJR Companies have been filed and document production and discoveries are substantially complete. The most recent expert report filed by the Province estimates a range of damages between CAD$11.1 billion (approximately £6.4 billion or US$8.1 billion) – CAD$23.2 billion (approximately £13.4 billion or US$17 billion), including expected future costs. Following a motion to set a trial date, the court ordered that the trial commence on 4 November 2019.
Ontario Tobacco Damages and Health Care Costs Recovery Act 2009
Imperial, the UK Companies and RJR Companies have all been named as defendants and served.
The defences of Imperial, the UK Companies and the RJR Companies have been filed. The parties completed significant document production in summer of 2017 and discoveries commenced in the fall of 2018. On 15 June 2018, the province delivered an expert report quantifying its damages in the range of CAD$280 billion (approximately £161 billion or US$205 billion) – CAD$630 billion (approximately £362 billion or US$ 461 billion) in 2016/2017 dollars for the period 1954 – 2060, and the Province has amended the damages sought in its Statement of Claim to CAD$330 billion (approximately £190 billion or US$242 billion). On 31 January 2019, the Province delivered a further expert report claiming an additional CAD$9.4 billion (approximately £5.4 billion or US$6.9 billion) – CAD$10.9 billion in damages (approximately £6.3 billion or US$7.9 billion) in respect of environmental tobacco smoke. No trial date has been set.
Newfoundland and Labrador
Tobacco Health Care Costs Recovery Act 2001
Imperial, the UK Companies and the RJR Companies have all been named as defendants and served.
The case is at an early case management stage. The defences of Imperial, the UK Companies and the RJR Companies have been filed and the province began its document production in March 2018. Damages have not been quantified by the province. No trial date has been set.
Saskatchewan Tobacco Damages and Health Care Costs Recovery Act 2007
Imperial, the UK Companies and the RJR Companies have all been named as defendants and served.
This case is at an early case management stage. The defences of Imperial, the UK Companies and the RJR Companies have been filed and the province has delivered a test shipment of documents. Damages have not been quantified by the province. No trial date has been set.
Manitoba Tobacco Damages Health Care Costs Recovery Act 2006
Imperial, the UK Companies and RJR Companies have all been named as defendants and served.
This case is at an early case management stage. The defences of Imperial, the UK Companies and the RJR Companies have been filed and document production is underway. Damages have not been quantified by the province. No trial date has been set.
Alberta Crown’s Right of Recovery Act 2009
Imperial, the UK Companies and RJR Companies have all been named as defendants and served.
This case is at an early case management stage. The defences of Imperial, the UK Companies and the RJR Companies have been filed and document production is underway. The province has stated its claim to be worth CAD$10 billion (approximately £5.7 billion or US$7.3 billion). No trial date has been set.
Quebec Tobacco Related Damages and Health Care Costs Recovery Act 2009
Imperial, Investments, Industries, the RJR Companies and Carreras Rothmans Limited have been named as defendants and served.
The case is at an early case management stage. The defences of Imperial, Investments, Industries, Carreras Rothmans Limited and the RJR Companies have been filed. Motions over admissibility of documents and damages discovery have been filed but not heard. The province is seeking CAD$60 billion (approximately £34.4 billion or US$44 billion). No trial date has been set.
202 BAT Annual Report and Form 20-F 2018

Governance Other InformationFinancial StatementsStrategic Report
Prince Edward Island
Tobacco Damages and Health Care Costs Recovery Act 2009
Imperial, the UK Companies and RJR Companies have all been named as defendants and served.
This case is at an early case management stage. The defences of Imperial, the UK Companies and the RJR Companies have been filed and the next step will be document production, which the parties have deferred for the time being. Damages have not been quantified by the province. No trial date has been set.
Nova Scotia Tobacco Health Care Costs Recovery Act 2005
Imperial, the UK Companies and RJR Companies have all been named as defendants and served.
This case is at an early case management stage. The defences of Imperial, the UK Companies and the RJR Companies have been filed. The province provided a test document production in March 2018. Damages have not been quantified by the province. No trial date has been set.
Nigeria61. British American Tobacco (Nigeria) Limited (“BAT Nigeria”), the Company and Investments have been named as defendants in a medical
reimbursement action by the federal government of Nigeria, filed on 6 November 2007 in the Federal High Court, and in similar actions filed by the Nigerian states of Kano (9 May 2007), Oyo (30 May 2007), Lagos (13 March 2008), Ogun (26 February 2008), and Gombe (17 October 2008) commenced in their respective High Courts. In the five cases that remain active, the plaintiffs seek a total of approximately 10.6 trillion Nigerian naira (approximately £22.9 billion or US$29.1 billion) in damages, including special, anticipatory and punitive damages, restitution and disgorgement of profits, as well as declaratory and injunctive relief.
62. The suits claim that the state and federal government plaintiffs incurred costs related to the treatment of smoking-related illnesses resulting from allegedly tortious conduct by the defendants in the manufacture, marketing, and sale of tobacco products in Nigeria, and assert that the plaintiffs are entitled to reimbursement for such costs. The plaintiffs assert causes of action for negligence, negligent design, fraud and deceit, fraudulent concealment, breach of express and implied warranty, public nuisance, conspiracy, strict liability, indemnity, restitution, unjust enrichment, voluntary assumption of a special undertaking, and performance of another’s duty to the public.
63. The Company and Investments have made a number of challenges to the jurisdiction of the Nigerian courts. Such challenges are still pending (on appeal) against the federal government and the states of Lagos, Kano, Gombe and Ogun. The underlying cases are stayed or adjourned pending the final outcome of these jurisdictional challenges. In the state of Oyo, on 13 November 2015, and 24 February 2017, respectively, the Company’s and Investments’ jurisdictional challenges were successful in the Court of Appeal and the issuance of the writ of summons was set aside.
South Korea64. In April 2014, Korea’s National Health Insurance Service (“NHIS”) filed a healthcare recoupment action against KT&G (a Korean tobacco
company), PM Korea and BAT Korea (including BAT Korea Manufacturing). The NHIS is seeking damages of roughly 54 billion Korean Won (approximately £38 million or US$ 48.2 million) in respect of health care costs allegedly incurred by the NHIS treating patients with lung (small cell and squamous cell) and laryngeal (squamous cell) cancer between 2003 and 2012. Court hearings in the case, which constitute the trial, commenced in September 2014 and remain ongoing.
(b) Class ActionsBrazil65. There are currently two class actions being brought in Brazil. One is also a medical reimbursement claim (São Paulo Public Prosecutor’s
Office), and is therefore discussed at paragraph 58 above.
66. In 1995, the Associação de Defesa da Saúde do Fumante (“ADESF”) class action was filed against Souza Cruz and Philip Morris in the São Paulo Lower Civil Court alleging that the defendants are liable to a class of smokers and former smokers for failing to warn of cigarette addiction. The case was stayed in 2004 pending the defendants’ appeal from a decision issued by the Lower Civil Court that held that the defendants had not met their burden of proving that cigarette smoking was not addictive or harmful to health.
67. On 12 November 2008, the São Paulo Court of Appeals overturned the lower court’s unfavourable decision of 2004, returning the case to the lower court for production of evidence and a new judgment. Following production of evidence, on 16 May 2011, the lower court granted Souza Cruz’s motion to dismiss the action in its entirety on the merits. The plaintiffs’ appeal to the Sao Paolo Court of Appeals was unsuccessful. The plaintiffs then filed a Special Appeal to the Superior Court of Justice, which was rejected under procedural grounds on 20 February 2017. The plaintiffs filed an appeal of the rejection in the Superior Court of Justice on 15 March 2017.
Canada68. There are 11 class actions being brought in Canada against Group companies.
69. Knight Class Action: The Supreme Court of British Columbia certified a class of all consumers who purchased Imperial cigarettes in British Columbia bearing ‘light’ or ‘mild’ descriptors since 1974. The plaintiff is seeking compensation for amounts spent on ‘light and mild’ products and a disgorgement of profits from Imperial on the basis that the marketing of light and mild cigarettes was deceptive because it conveyed a false and misleading message that those cigarettes are less harmful than regular cigarettes.
70. On appeal, the appellate court confirmed the certification of the class, but limited any financial liability, if proven, to 1997 onward. Imperial’s third party claim against the federal government was dismissed by the Supreme Court of Canada. The federal government is seeking a cost order of CAD$5 million (approximately £2.9 million or US$3.7 million) from Imperial relating to its now dismissed third party claim. After being dormant for several years, the plaintiff delivered a Notice of Intention to Proceed, and Imperial delivered an application to dismiss the action for delay. The application was heard on 23 June 2017 and was dismissed on 23 August 2017. Notice to class members of certification was provided on 14 February 2018. The next steps include discovery-related ones.
28 Contingent liabilities and financial commitments continued
203BAT Annual Report and Form 20-F 2018

Financial Statements
Notes on the Accounts continued
28 Contingent liabilities and financial commitments continued71. Growers’ Class Action: In December 2009, Imperial was served
with a proposed class action filed by Ontario tobacco farmers and the Ontario Flue-Cured Tobacco Growers’ Marketing Board. The plaintiffs allege that Imperial and the Canadian subsidiaries of Phillip Morris International and JTI failed to pay the agreed domestic contract price to the growers used in products manufactured for the export market and which were ultimately smuggled back into Canada. JTI has sought indemnification pursuant to the JTI Indemnities (discussed below at paragraphs 123 to 124). The plaintiffs seek damages in the amount of CAD$50 million (approximately £28.7 million or US$36.6 million). Various preliminary challenges have been heard, the last being a motion for summary judgment on a limitation period. The motion was dismissed and ultimately, leave to appeal to the Ontario Court of Appeal was dismissed in November 2016. In December 2017, the plaintiffs proposed that the action proceed by way of individual actions as opposed to a class action. The defendants did not consent. The claim is currently in abeyance pending further action from the plaintiffs.
72. Quebec Class Actions: There are currently two class actions in Quebec. On 21 February 2005, the Quebec Superior Court granted certification in two class actions against Imperial and two other domestic manufacturers. The Court certified two classes, with the class definitions being revised in the judgment rendered 27 May 2015. One class consists of residents of Quebec who (a) smoked before 20 November 1998 at least 12 pack years of cigarettes manufactured by the Defendants; and (b) were diagnosed before 12 March 2012 with: lung cancer, or cancer (squamous cell carcinoma) of the throat, or emphysema. The group also includes the heirs of persons deceased after 20 November 1998 who meet the criteria described above. The second consists of residents of Quebec who, as of 30 September 1998, were addicted to nicotine contained in cigarettes and who in addition meet the following three criteria: (a) they started smoking before 30 September 1994 by smoking cigarettes manufactured by the Defendants; (b) between 1 September and 30 September 1998 they smoked on average at least 15 cigarettes manufactured by the Defendants on a daily basis; and (c) they still smoked an average of at least 15 cigarettes manufactured by the Defendants as of 21 February 2005, or until their death if it occurred before that date. The group also includes the heirs of members who meet the criteria described above. Pursuant to the judgment, the plaintiffs were awarded damages and interest against Imperial and the Canadian subsidiaries of Philip Morris International and JTI in the amount of CAD$15.6 billion (approximately £9 billion or US$11.4 billion), of which Imperial’s share is CAD$10.4 billion (approximately £6 billion or US$7.6 billion). An appeal of the judgment was filed on 26 June 2015. The Court also awarded provisional execution pending appeal of CAD$1,131 million (approximately £650 million or US$828 million), of which Imperial’s share was approximately CAD$742 million (approximately £427 million or US$543 million). This order was subsequently overturned by the Court of Appeal. Following the cancellation of the order for provisional execution, the plaintiffs filed a motion against Imperial and one other manufacturer seeking security in the amount of CAD $5 billion (approximately £2.9 billion or US$3.7 billion) to guarantee, in whole or in part, the payment of costs of the appeal and the judgment. On 27 October 2015, the Court of Appeal ordered the parties to post security in the amount of CAD$984 million (approximately £566 million or US$720 million), of which Imperial’s share was CAD$758 million (approximately £436 million or US$ 555 million).
The security was paid in seven equal quarterly instalments of just over CAD$108 million (approximately £62 million or US$79 million) between 31 December 2015 and 30 June 2017 – see note 14. Imperial filed its Factum on Appeal on 11 December 2015 and the appeal was heard in November 2016. The decision has been under reserve and is expected to be released on 1 March 2019.
73. Other Canadian Smoking and Health Class Actions: Seven putative class actions, described below, have been filed against various Canadian and non-Canadian tobacco-related entities, including the UK Companies, Imperial and the RJR Companies, in various Canadian Provinces. In these cases, none of which have quantified their asserted damages, the plaintiffs allege claims based on fraud, fraudulent concealment, breach of warranty of merchantability, and of fitness for a particular purpose, failure to warn, design defects, negligence, breach of a “special duty” to children and adolescents, conspiracy, concert of action, unjust enrichment, market share liability and violations of various trade practices and competition statutes. Pursuant to the terms of the 1999 sale of RJRT’s international tobacco business, RJRT has tendered to JTI the defence of these seven actions (Semple, Kunka, Adams, Dorion, Bourassa, McDermid and Jacklin, discussed below). Subject to a reservation of rights, JTI has assumed the defence of the RJR Companies in these actions.
74. In June 2009, four smoking and health class actions were filed in Nova Scotia (Semple), Manitoba (Kunka), Saskatchewan (Adams) and Alberta (Dorion) against various Canadian and non-Canadian tobacco-related entities, including the UK Companies, Imperial and the RJR Companies. In Saskatchewan, the UK Companies have been released from the action, and the RJR Companies have brought a motion challenging the jurisdiction of the court. No date has been set in these cases with respect to the certification motion hearing. There are service issues in relation to Imperial and the UK Companies in Alberta and in relation to the UK Companies in Manitoba.
75. In June 2010, two further smoking and health class actions were filed in British Columbia against various Canadian and non-Canadian tobacco-related entities, including Imperial, the UK Companies and the RJR Companies. The Bourassa claim is allegedly on behalf of all individuals who have suffered chronic respiratory disease and the McDermid claim proposes a class based on heart disease. Both claims state that they have been brought on behalf of those who have “smoked a minimum of 25,000 cigarettes.” The UK Companies, Imperial, the RJR Companies and other defendants objected to jurisdiction. Subsequently, the Company and Carreras Rothmans Limited were released from Bourassa and McDermid. Imperial, Industries, Investments and the RJR Companies remain as defendants in both actions. No certification motion hearing date has been set. The Plaintiffs were due to deliver certification motion materials by 31 January 2015, but have not yet done so.
76. In June 2012, a new smoking and health class action was filed in Ontario (Jacklin) against various Canadian and non-Canadian tobacco-related entities, including the UK Companies, Imperial and the RJR Companies. The claim is presently in abeyance.
204 BAT Annual Report and Form 20-F 2018

Governance Other InformationFinancial StatementsStrategic Report
28 Contingent liabilities and financial commitments continuedVenezuela77. In April 2008, the Venezuelan Federation of Associations of Users
and Consumers (FEVACU) and Wolfang Cardozo Espinel and Giorgio Di Muro Di Nunno, acting as individuals, filed a class action against the Venezuelan government. The class action seeks regulatory controls on tobacco and recovery of medical expenses for future expenses of treating smoking-related illnesses in Venezuela. Both C.A Cigarrera Bigott Sucs. (“Cigarrera Bigott”), a Group subsidiary, and ASUELECTRIC, represented by its president Giorgio Di Muro Di Nunno (who had previously filed as an individual), have been admitted as third parties by the Constitutional Chamber of the Supreme Court of Justice. A hearing date for the action is yet to be scheduled. On 25 April 2017 and on 23 January 2018, Cigarrera Bigott requested the Court to declare the lapsing of the class action due to no proceedings taking place in the case in over a year. A ruling on the matter is yet to be issued.
(c) Individual Tobacco Related Personal Injury Claims78. As at 31 December 2018, the jurisdictions with the most active
individual cases against Group companies were, in descending order: Brazil (56), Italy (25), Chile (10), Canada (5), Argentina (5) and Ireland (2). There were a further four jurisdictions with one active case only. Out of the 107 active individual tobacco related personal injury claims, two have received unfavourable verdicts in either the court of first instance or on appeal. The total value of those unfavourable verdicts is approximately €801,954 (approximately £719,819 or US$916,750).
Non‑Tobacco Related LitigationCroatian Distributor Dispute79. BAT Hrvatska d.o.o u likvidaciji and British American Tobacco
Investments (Central and Eastern Europe) Limited are named as defendants in a claim by Mr Perica received on 22 August 2017 and brought before the commercial court of Zagreb, Croatia. Mr Perica seeks damages of HRK 408,401,866.15 (approximately £49 million or US$63 million) relating to a BAT Standard Distribution Agreement dating from 2005. BAT Hrvatska d.o.o and British American Tobacco Investments (Central and Eastern Europe) Ltd filed a reply to the statement of claim on 6 October 2017. A hearing had been scheduled to take place on 10 May 2018, but it was postponed due to a change of the judge hearing the case. The Commercial Court in Zagreb declared they do not have jurisdiction and that the competent court to hear this case is the Municipal Court in Zagreb. TDR d.o.o. is also named as the defendant in a claim by Mr Perica received on 30 April 2018 and brought before the commercial court of Zagreb, Croatia. Mr. Perica seeks payment in the amount of HRK 408,401,866.15 (approximately £49 million or US$63 million) claiming that BAT Hrvatska d.o.o. transferred a business unit to TDR d.o.o, thus giving rise to a liability of TDR d.o.o. for the debts incurred by BAT Hrvatska d.o.o, on the basis of the provisions of Croatian civil obligations law. A response to the statement of claim was filed on 30 May 2018. The Commercial Court in Zagreb declared they do not have jurisdiction and that the competent court to hear this case is the Municipal Court in Pula. Mr Perica filed an appeal against this decision which was rejected by the High Commercial Court of The Republic of Croatia confirming therewith that the competent court to hear this case is the Municipal Court in Pula.
Reynolds American, Inc./Lorillard, Inc. Shareholder Litigation80. On 15 July 2014, RAI announced that it had entered into a
definitive merger agreement with Lorillard. Inc. (“Lorillard”), whereby RAI would acquire Lorillard in exchange for a combination of cash and RAI stock (the “Lorillard Transaction”). As part of this transaction, the Company executed a Share Purchase Agreement to acquire a sufficient number of RAI’s shares to maintain its approximately 42.2 per cent equity stake in RAI after the merger.
81. On 8 August 2014, the Company was named as a defendant in an action in state court in North Carolina (Corwin v British American Tobacco PLC) stemming from the announcement of the Lorillard Transaction. The action was brought on behalf of a putative class of RAI’s shareholders alleging that the Company is a controlling shareholder of RAI and breached its fiduciary duty to the other RAI’s shareholders in connection with the Lorillard Transaction. The plaintiff alleges that as part of an equity financing to support the Lorillard Transaction, the Company purchased newly issued RAI stock at an amount alleged to be up to US$920 million (approximately £722 million) below fair value. RAI and the members of the RAI Board of Directors were also named as defendants.
82. RAI believed that the Corwin action was without merit. However, to eliminate certain burdens, expenses and uncertainties, on 17 January 2015, RAI and the director defendants in Corwin entered into the North Carolina Memorandum of Understanding regarding the settlement of the disclosure claims asserted in that lawsuit. The North Carolina Memorandum of Understanding outlines the terms of the parties’ agreement in principle to settle and release the disclosure claims which were or could have been asserted in Corwin. In consideration of the partial settlement and release, RAI agreed to make certain supplemental disclosures to the Joint Proxy Statement/Prospectus, which it did on 20 January 2015. On 17 February 2016, the trial court approved the partial settlement, including the plaintiff’s unopposed request for US$415,000 (approximately £326,000) in attorneys’ fees and costs. The partial settlement did not affect the consideration paid to Lorillard shareholders in connection with the Lorillard Merger.
83. On 4 August 2015, the trial court granted the defendants’ motions to dismiss all of the remaining non-disclosure claims. On 28 August 2015, the court dismissed all claims against the Company. Among other things, the court found that the plaintiff had not properly alleged that the Company was a controlling shareholder of RAI and therefore that the Company did not owe a fiduciary duty to RAI’s other shareholders. The plaintiff appealed. On 20 December 2016, the North Carolina Court of Appeals affirmed the trial court’s dismissal of the claims against RAI and RAI’s Board of Directors on the grounds that the plaintiff could not state a direct claim against RAI’s Board of Directors for breach of fiduciary duties. That court reversed the trial court’s judgment with respect to the claims against the Company, finding the allegations that the Company was a controlling shareholder and breached its fiduciary duty to be sufficient to warrant further proceedings for the plaintiff to attempt to prove those allegations with evidence. On 4 January 2017, the Company moved to have the North Carolina Court of Appeals rehear the case en banc, and that motion was denied on 2 February 2017. On 17 February 2017, the Company filed a petition for discretionary review with the North Carolina Supreme Court, which the court allowed on 9 June 2017. On 7 December 2018, after briefing and oral argument, the North Carolina Supreme Court reversed the decision of the Court of Appeals, finding insufficient the plaintiff’s allegations that the Company was a controlling shareholder of RAI and effectively reinstating the trial court’s dismissal of the claims against the Company. On 11 January 2019, the plaintiff filed a petition for rehearing with the North Carolina Supreme Court, which was denied on 30 January 2019.
205BAT Annual Report and Form 20-F 2018
Financial Statements
Notes on the Accounts continued
28 Contingent liabilities and financial commitments continuedBAT/Reynolds American Inc. Shareholder Litigation84. Following the Company’s acquisition of the remaining 57.8% of
RAI in July 2017, pursuant to North Carolina law, under which RAI was incorporated, a number of RAI shareholders dissented and asserted their rights to a judicial appraisal of the value of their RAI stock. On 29 November 2017, RAI filed a Complaint for Judicial Appraisal in state court in North Carolina against 20 dissenting shareholders, comprised of three groups of affiliated entities claiming price per share values of US$81.21, US$88.16 and US$94.33 respectively. The complaint asks the court to determine the fair value of the dissenting shareholders’ shares in RAI and any accrued interest. Trial is currently scheduled to be held no earlier than June 2019.
Glo Litigation85. On 22 June 2018, an affiliate of Philip Morris International (PMI)
commenced proceedings against British American Tobacco Japan, Ltd. in the Japanese courts challenging the manufacture, import and sale of the glo device and of the NeoStik consumable in Japan, claiming that the glo devices directly infringe two Japanese patents that have been issued to the PMI affiliate and that the NeoStik indirectly infringe those patents. Damages for the glo device and NeoStik are claimed in the court filing, to the amount of 100 million yen (approximately £715,650 or US$911,452). PMI has also filed a request for injunction with respect to the glo device. BAT denies infringement and is challenging the validity of the two PMI Japanese patents.
Mozambican IP Litigation86. On 19 April 2017, Sociedade Agrícola de Tabacos, Limitada
(“SAT”) (a BAT Group company in Mozambique) filed a complaint to the National Inspectorate for Economic Activities (“INAE”), the government body under the Ministry of Industry and Trade, regarding alleged infringements of its registered trademark (“GT”) by GST. INAE subsequently seized the allegedly infringing products (“GS cigarettes”) and fined and ordered GST to discontinue manufacturing products that could infringe SAT’s intellectual property rights. Following INAE’s decision, in July 2017 and March 2018, SAT sought damages via the Judicial Court of Nampula, from GST in the amount of and equivalent to £572,907 (approximately US$730,000) as well as a permanent restraint order in connection with the manufacturing and selling of the allegedly infringing products. The Judicial Court of Nampula (Tribunal Judicial de Nampula) granted the order on an interim basis on 7 August 2017. After hearing the parties, on 5 September 2017, the Court found that no alleged infringement by GST had occurred and removed the interim restraint order, this decision was appealed by SAT and is currently pending a decision. GST filed an application for review against INAE’s initial decision directly to the Minister of Trade and Industry, which reversed the decision of INAE. On 31 December 2018, SAT was notified of GST’s counterclaim against SAT at the Judicial Court of Nampula for damages allegedly sustained as a result of SAT’s complaint to INAE (and INAE’s decision). GST is seeking damages in the amount equivalent to £190 million (approximately US$242 million). On 31 January 2019 SAT filed a formal response to the counterclaim.
Fox RiverBackground to environmental liabilities arising out of contamination of the Fox River87. In Wisconsin, the authorities have identified potentially responsible
parties (“PRPs”) to fund the clean-up of river sediments in the lower Fox River. The pollution was caused by discharges of Polychlorinated Biphenyls (“PCBs”) from paper mills and other facilities operating close to the river. Among the PRPs is NCR Corporation (“NCR”).
88. In NCR’s Form 10-K Annual Report for the year ended 31 December 2014, which is the most recent public source available, the total clean-up costs for the Fox River are estimated at US$825 million (approximately £648 million). This estimate is subject to uncertainties and does not include natural resource damages (“NRDs”). Total NRDs may range from US$0 to US$246 million (approximately £0–£193 million).
89. Industries’ involvement with the environmental liabilities arises out of indemnity arrangements which it became party to due to a series of transactions that took place from the late-1970s onwards and subsequent litigation brought by NCR against Industries and Appvion Inc. (“Appvion”) (a former Group subsidiary) in relation to those arrangements which was ultimately settled. US authorities have never identified Industries as a PRP.
90. There has been a substantial amount of litigation in the United States involving NCR and Appvion regarding the responsibility for the costs of the clean-up operations. The US Government also brought enforcement proceedings against NCR and Appvion to ensure compliance with regulatory orders made in relation to the Fox River clean-up. This litigation has been settled through agreements with other PRPs and a form of settlement known as a Consent Decree with the US Government.
91. The principal terms of the Consent Decree, in summary, are as follows:
a. NCR will perform and fund all of the remaining Fox River remediation work by itself.
b. The US Government enforcement proceedings will be settled, with NCR having no liability to meet the US Government’s claim for costs it has incurred in relation to the clean-up to date and only a secondary responsibility to meet certain future costs. NCR will have no liability to the US Government for NRDs.
c. NCR will cease to pursue its contribution claims against the other PRPs and in return will receive contribution protection which means that the other PRPs will not be able to pursue their contribution claims against NCR. NCR will, however, have the right to reinstate its contribution claims if the other PRPs decide to continue to pursue certain contractual claims against NCR.
d. Appvion will also cease to pursue its claims against the other PRPs to recover monies that it has spent on the clean-up and in return will receive contribution protection. Appvion will, however, have the right to reinstate its claims if the other PRPs decide to continue to pursue certain claims against Appvion.
92. The Consent Decree was approved by the District Court in Wisconsin on 23 August 2017. The US Government enforcement action against NCR was terminated as a result of that order. The PRPs’ claims for contribution against NCR were dismissed by order of the District Court in Wisconsin given on 11 October 2017.
93. On 20 October 2017 P.H. Glatfelter filed an appeal against the approval of the Consent Decree in the US Court of Appeals for the Seventh Circuit.
94. On 4 January 2019 the US Department of Justice filed a motion for approval of a separate Consent Decree with Georgia-Pacific and P.H. Glatfelter. This Consent Decree settles the allocation of costs of the remaining remediation work on the Fox River and, if approved, will lead to P. H. Glatfelter withdrawing its 20 October 2017 appeal. Approval of this Consent Decree should therefore conclude all current Fox River litigation.
206 BAT Annual Report and Form 20-F 2018

Governance Other InformationFinancial StatementsStrategic Report
28 Contingent liabilities and financial commitments continued Industries’ involvement with environmental liabilities arising out of the contamination of the Fox River95. NCR has taken the position that, under the terms of a 1998
Settlement Agreement between it, Appvion and Industries and a 2005 arbitration award, Industries and Appvion generally had a joint and several obligation to bear 60 per cent of the Fox River environmental remediation costs imposed on NCR and of any amounts NCR has to pay in respect of other PRPs’ contribution claims. BAT has not acknowledged any such liability to NCR and has defences to such claims. Further, under the terms of the Funding Agreement (described above and below) any dispute between Industries and NCR as to the final amount of any NCR claim against Industries in respect of the Fox River (if any) can only be determined at the later of (i) the completion of Fox River remediation works or (ii) the final resolution and exhaustion of all possible appeals in the proceedings against Sequana, PricewaterhouseCoopers LLP (PwC) and other former advisers.
96. Until May 2012, Appvion and Windward (another former Group subsidiary) paid 60 per cent share of the clean-up costs. and Industries was never required to contribute. Around that time Appvion refused to continue to pay clean-up costs, leading to NCR demanding that Industries pay a 60 per cent share.
97. Industries commenced proceedings against Windward and Appvion in December 2011 seeking indemnification in respect of any liability it might have to NCR (the “English Indemnity Proceedings”) pursuant to a 1990 de-merger agreement between those parties.
Funding Agreement of 30 September 201498. On 30 September 2014, Industries entered into the Funding
Agreement with Windward, Appvion, NCR and BTI 2014 LLC (“BTI”) (a wholly owned subsidiary of Industries). Pursuant to the Funding Agreement, the English Indemnity Proceedings and a counterclaim Appvion had brought in those proceedings, as well as an NCR-Appvion arbitration concerning Appvion’s indemnity to NCR, were discontinued as part of an overall agreement between the parties providing a framework through which they would together fund the ongoing costs of the Fox River clean-up. Under the agreement, NCR has agreed to accept funding by Industries at the lower level of 50 per cent of the ongoing clean-up related costs of the Fox River (rather than the 60 per cent referenced above; this remains subject to an ability to litigate at a later stage the extent of Industries’ liability in relation to Fox River clean-up related costs (including in respect of the 50 per cent of costs that Industries has paid under the Funding Agreement to date). In addition, Windward has contributed US$10 million (approximately £7.8 million) of funding and Appvion has contributed US$25 million (approximately £19.6 million) for Fox River and agreed to contribute US$25 million (approximately £ 19.6 million) for the Kalamazoo River (see further below). Appvion entered Chapter 11 bankruptcy protection on 1 October 2017.
99. The parties also agreed to cooperate in order to maximise recoveries from certain claims made against third parties, including (i) a claim commenced by Windward in the High Court of England & Wales (the High Court) against Sequana and the former Windward directors (the “Windward Dividend Claim”). That claim was assigned to BTI under the Funding Agreement, and relates to dividend payments made by Windward to Sequana of around €443 million (approximately £398 million or US$506 million) in 2008 and €135 million (approximately £121 million or US$154 million) in 2009 (the “Dividend Payments”)
and (ii) a claim commenced by Industries directly against Sequana to recover the value of the Dividend Payments alleging that the dividends were paid for the purpose of putting assets beyond the reach of Windward’s creditors (including Industries) (the “BAT section 423 Claim”).
100. A trial of the Windward Dividend Claim and the BAT section 423 Claim took place before the English High Court between February and April 2016. Judgment was handed down by the High Court on 11 July 2016. The Court held that the 2009 Dividend Payment of €135 million (approximately £121 million or US$154 million) was a transaction at an undervalue made with the intention of putting assets beyond the reach of Industries or of otherwise prejudicing Industries’ interests. It therefore contravened Section 423 of the Insolvency Act. The Court dismissed the Windward Dividend Claim. BTI sought permission to appeal in respect of the Judge’s findings in relation to the Windward Dividend Claim. Sequana sought permission to appeal the Judge’s findings in relation to the BAT section 423 claim.
101. On 13 and 16 January 2017 and 3 February 2017 further hearings took place to determine the precise form of relief to be awarded to Industries and to hear the parties’ applications for permission to appeal. Judgment was handed down on 10 February 2017. In respect of relief, the Court ordered that Sequana must pay BTI an amount up to the full value of the 2009 Dividend plus interest which equates to around US$185 million (approximately £145 million). This figure is subject to increase as interest is continuing to accrue. Sequana must make an initial payment of around US$138.4 million (approximately £108.7 million) and further payments going forward as and when Industries makes payments in respect of clean-up costs. In respect of appeals, the Court granted BTI and Sequana permission to appeal (the “Sequana Claims Appeal”). The Court also granted Sequana a stay in respect of the above payments. The stay was lifted in May 2017.
102. In February 2017 Sequana entered into a process in France seeking court protection (the “Sauvegarde”). Sequana exited the Sauvegarde in June 2017. To date, Industries has not received any payments from Sequana.
103. In June 2018, the Court of Appeal heard arguments in the Sequana Claims Appeal. On 6 February 2019 the Court of Appeal gave judgment upholding the High Court’s findings, with one immaterial change to the method of calculating the damages awarded. Sequana therefore remains liable to pay approximately US$185 million (approximately £145 million). The Court of Appeal dismissed BTI’s appeal in relation to the Windward Dividend Claim. The Court of Appeal also dismissed Sequana’s application for permission to appeal the High Court’s costs order in favour of Industries. Sequana therefore remains liable to pay around £10 million (approximately US$12.7 million) in costs to Industries. The Court of Appeal made no order as to the costs of the appeal. All parties to the appeal sought permission from the Court of Appeal for a further appeal to the U.K. Supreme Court. The Court of Appeal refused the applications. Industries and BTI are considering requesting permission to appeal directly from the Supreme Court.
104. BTI has brought claims against certain of Windward’s former advisers, including Windward’s auditors at the time of the dividend payments, PwC (which claims were also assigned to BTI under the Funding Agreement). The claim was stayed while the Windward Dividends claim and the BAT section 423 Claim were heard. BTI and PwC have agreed that the stay will remain in effect until the Court of Appeal gives judgment in the Sequana Claims Appeal.
207BAT Annual Report and Form 20-F 2018

Financial Statements
Notes on the Accounts continued
28 Contingent liabilities and financial commitments continued105. The sums Industries has agreed to pay under the Funding
Agreement are subject to ongoing adjustment, as clean-up costs can only be estimated in advance of the work being carried out and as certain sums payable are the subject of ongoing US litigation. In 2018, Industries paid £25 million (approximately US$32 million) in respect of clean-up costs and is potentially liable for further costs associated with the clean-up. Industries has a provision of £108 million (approximately US$137.5 million) which represents the current best estimate of its exposure – see note 21.
Kalamazoo106. NCR is also being pursued by Georgia-Pacific, as the owner of a
facility on the Kalamazoo River in Michigan which released PCBs into that river. Georgia-Pacific has been designated as a PRP in respect of the river.
107. Georgia-Pacific contends that NCR is responsible for, or should contribute to, the clean-up costs, because:
a. predecessor to NCR’s Appleton Papers Division sold “broke” containing PCBs to Georgia-Pacific or others for recycling;
b. NCR itself sold paper containing PCBs to Georgia-Pacific or others for recycling; and/or
c. NCR is liable for sales to Georgia-Pacific or others of PCB-containing broke by Mead Corporation, which, like the predecessor to NCR’s Appleton Papers Division, coated paper with the PCB containing emulsion manufactured by NCR.
108. A full trial on liability took place in February 2013. On 26 September 2013, the Michigan Court held that NCR was liable as a PRP on the basis that broke sales constituted an arrangement for the disposal of hazardous material for the purposes of CERCLA. The decision was based on NCR’s knowledge of the hazards of PCBs from at least 1969. The decision is under appeal.
109. The second phase of the Kalamazoo trial to determine the apportionment of liability amongst NCR, Georgia-Pacific and the other PRPs (International Paper Company and Weyerhaeuser Company) took place between September and December 2015.
110. On 29 March 2018, Judge Jonker handed down judgment in respect of around US$55 million (approximately £43 million) of Georgia-Pacific’s past remediation costs. Judge Jonker did not determine the question of future remediation costs. Judge Jonker ordered that NCR pay 40% of Georgia-Pacific’s past costs (around US$22 million (approximately £17.3 million)).
111. It is anticipated that NCR will look to Industries to pay 60 per cent of any sums it becomes liable to pay to Georgia-Pacific on the basis, it would be asserted, that the river constitutes a “Future Site” for the purposes of the Settlement Agreement. The Funding Agreement described above does not resolve any such claims, but does provide an agreed mechanism pursuant to which any surplus from the valuable recoveries of any third party claims that remains after all Fox River related clean-up costs have been paid and Industries and NCR have been made whole may be applied towards Kalamazoo clean-up costs, in the event that NCR were to be successful in any claim for a portion of them from Industries or Appvion (subject to Appvion’s cap, described below). Industries has defences to any claims made by NCR in relation to the Kalamazoo River. No such claims have been made against Industries.
112. Industries also anticipates that NCR may seek to recover from Appvion (subject to a cap of US$25 million (approximately £19.7 million)) for “Future Sites” under the Funding Agreement). The basis of the recovery would be the same as any demand NCR may make on Industries. Appvion entered Chapter 11 bankruptcy protection on 1 October 2017. The effect of the Chapter 11 proceedings on Appvion’s liability for Future Sites payments under the Funding Agreement is currently uncertain.
113. Further hearings have been held before Judge Jonker to determine the final form of the order reflecting this judgment. The parties commenced appeal proceedings against this judgment in July 2018. NCR has agreed an appeal bond with Georgia-Pacific to prevent enforcement of the judgment while it remains subject to appeal. The appeal bond arrangement has been approved by the Court. The timing of any appeal hearing is currently unknown.
114. The quantum of the clean-up costs for the Kalamazoo River is presently unclear (and the extent of NCR’s liability in respect of such future costs remains unclear pending the outcome of the appeal of Judge Jonker’s 29 March 2018 judgment), but could run into the hundreds of millions of dollars. A witness on behalf of Georgia-Pacific testified in the trial concerning apportionment of liability that the cost of performing future remediation in Operable Unit 5 of the Kalamazoo River was in the order of US$670 million. (approximately £526 million). Operable Unit 5 is the Kalamazoo River itself, as distinct from the other Operable Units which are landfills or other facilities adjoining the Kalamazoo River. Remediation of these other operable Units has largely been completed except for monitoring.
115. As detailed above, Industries is taking active steps to protect its interests, including seeking to procure the repayment of the Windward dividends, pursuing the other valuable claims that are now within its control, and working with the other parties to the Funding Agreement to maximise recoveries from third parties with a view to ensuring that amounts funded towards clean up related costs are later recouped under the agreed repayment mechanisms under the Funding Agreement.
Other environmental matters116. RAI and its subsidiaries are subject to federal, state and local
environmental laws and regulations concerning the discharge, storage, handling and disposal of hazardous or toxic substances. Such laws and regulations provide for significant fines, penalties and liabilities, sometimes without regard to whether the owner or operator of the property or facility knew of, or was responsible for, the release or presence of hazardous or toxic substances. In addition, third parties may make claims against owners or operators of properties for personal injuries and property damage associated with releases of hazardous or toxic substances. In the past, RJRT has been named a potentially responsible party (PRP) with third parties under the Comprehensive Environmental Response, Compensation and Liability Act (CERCLA) with respect to several superfund sites. RAI and its subsidiaries are not aware of any current environmental matters that are expected to have a material adverse effect on the business, results of operations or financial position of RAI or its subsidiaries.
Criminal investigations117. As previously reported by the Group, it has been investigating,
through external legal advisors, allegations of misconduct and has been liaising with the UK’s Serious Fraud Office (SFO) and other relevant authorities. It was announced in August 2017 that the SFO had opened an investigation in relation to the Group, its subsidiaries and associated persons. The Group is cooperating with the SFO’s investigation.
208 BAT Annual Report and Form 20-F 2018

Governance Other InformationFinancial StatementsStrategic Report
28 Contingent liabilities and financial commitments continued118. The outcomes of these matters will be decided by the relevant authorities or, if necessary, the courts. It is too early to predict the outcomes,
but these could include the prosecution of individuals and/or of a Group company or companies. Accordingly, the potential for fines, penalties or other consequences cannot currently be assessed. As the investigation is ongoing, it is not yet possible to identify the timescale in which these matters might be resolved.
Closed litigation matters119. The following matters on which the Company reported in the contingent liabilities and financial commitments note 28 to the Company’s
2017 financial statements have been dismissed, concluded or resolved as noted below:
Matter Jurisdiction Companies named as Defendants Description Disposition
Fontem USA R.J. Reynolds Vapor Company Alleged patent infringement Settlement agreed on confidential terms
Codacons Italy BAT Italia Smoking and health class action Supreme Court decisionInvestments Indemnity Japan British American Tobacco
(Investments) LimitedAlleged patent infringement Settlement agreed on confidential
termsLights Class Actions USA RJRT and B&W Four Lights class actions Court ordered dismissalParsons Class Action USA RJRT and B&W Smoking and health class action Court ordered dismissal
General Litigation Conclusion120. While it is impossible to be certain of the outcome of any particular case or of the amount of any possible adverse verdict, the Group believes
that the defences of the Group’s companies to all these various claims are meritorious on both the law and the facts, and a vigorous defence is being made everywhere.
121. An adverse judgment was entered against one Group company, Imperial, in the Quebec class actions and an appeal has been made. The decision in that appeal is expected to be released on 1 March 2019. As at 27 February 2019, no judgment has been made available by the Court of Appeal, there is no indication of the outcome and, as such, there is no change to the management’s assessment of the outcome of the appeal. The Group continues to recognise the value of the Order for Security as a receivable and with the outcome of the appeal against the substantive decision included as a contingent liability. Subject to the outcome of the judgment, the Group will assess its response and will provide further guidance. If further adverse judgments are entered against any of the Group’s companies in any case, avenues of appeal will be pursued. Such appeals could require the appellants to post appeal bonds or substitute security (as has been necessary in Quebec) in amounts which could in some cases equal or exceed the amount of the judgment. At least in the aggregate, and despite the quality of defences available to the Group, it is not impossible that the Group’s results of operations or cash flows in particular quarterly or annual periods could be materially adversely affected by the impact of a significant increase in litigation, difficulties in obtaining the bonding required to stay execution of judgments on appeal, or any final outcome of any particular litigation.
122. Having regard to all these matters, with the exception of Fox River and certain Engle progeny cases identified above the Group does not consider it appropriate to make any provision in respect of any pending litigation because the likelihood of any resulting material loss, on an individual case basis, is not considered probable and/or the amount of any such loss cannot be reasonably estimated. The Group does not believe that the ultimate outcome of this litigation will significantly impair the Group’s financial condition. If the facts and circumstances change, then there could be a material impact on the financial statements of the Group.
Other contingencies123. JTI Indemnities. By a purchase agreement dated 9 March 1999, amended and restated as of 11 May 1999, referred to as the 1999 Purchase
Agreement, R.J. Reynolds Tobacco Holdings, Inc. (“RJR”) and RJRT sold their international tobacco business to JTI. Under the 1999 Purchase Agreement, RJR and RJRT retained certain liabilities relating to the international tobacco business sold to JTI, and agreed to indemnify JTI against: (i) any liabilities, costs and expenses arising out of the imposition or assessment of any tax with respect to the international tobacco business arising prior to the sale, other than as reflected on the closing balance sheet; (ii) any liabilities, costs and expenses that JTI or any of its affiliates, including the acquired entities, may incur after the sale with respect to any of RJR’s or RJRT’s employee benefit and welfare plans; and (iii) any liabilities, costs and expenses incurred by JTI or any of its affiliates arising out of certain activities of Northern Brands.
124. RJRT has received claims for indemnification from JTI, and several of these have been resolved. Although RJR and RJRT recognise that, under certain circumstances, they may have other unresolved indemnification obligations to JTI under the 1999 Purchase Agreement, RJR and RJRT disagree what circumstances described in such claims give rise to any indemnification obligations by RJR and RJRT and the nature and extent of any such obligation. RJR and RJRT have conveyed their position to JTI, and the parties have agreed to resolve their differences at a later date.
125. ITG Indemnity. In the Divestiture, RAI agreed to defend and indemnify, subject to certain conditions and limitations, ITG in connection with claims relating to the purchase or use of one or more of the Winston, Kool, Salem or Maverick cigarette brands on or before 12 June 2015, as well as in actions filed before 13 June 2023, relating to the purchase or use of one or more of the Winston, Kool, Salem or Maverick cigarette brands. In the purchase agreement relating to the Divestiture, ITG agreed to defend and indemnify, subject to certain conditions and limitations, RAI and its affiliates in connection with claims relating to the purchase or use of “blu” brand e-cigarettes. ITG also agreed to defend and indemnify, subject to certain conditions and limitations, RAI and its affiliates in actions filed after 12 June 2023, relating to the purchase or use of one or more of the Winston, Kool, Salem or Maverick cigarette brands after 12 June 2015. ITG has tendered a number of actions to RAI under the terms of this indemnity, and RAI has, subject to a reservation of rights, agreed to defend and indemnify ITG pursuant to the terms of the indemnity. These claims are substantially similar in nature and extent to claims asserted directly against RJRT in similar actions.
209BAT Annual Report and Form 20-F 2018

Financial Statements
Notes on the Accounts continued
28 Contingent liabilities and financial commitments continued126. Loews Indemnity. In 2008, Loews Corporation (“Loews”), entered
into an agreement with Lorillard, Lorillard Tobacco, and certain of their affiliates, which agreement is referred to as the “Separation Agreement”. In the Separation Agreement, Lorillard agreed to indemnify Loews and its officers, directors, employees and agents against all costs and expenses arising out of third-party claims (including, without limitation, attorneys’ fees, interest, penalties and costs of investigation or preparation of defence), judgments, fines, losses, claims, damages, liabilities, taxes, demands, assessments, and amounts paid in settlement based on, arising out of or resulting from, among other things, Loews’ ownership of or the operation of Lorillard and its assets and properties, and its operation or conduct of its businesses at any time prior to or following the separation of Lorillard and Loews (including with respect to any product liability claims). Loews is a defendant in three pending product liability actions, each of which is a putative class action. Pursuant to the Separation Agreement, Lorillard is required to indemnify Loews for the amount of any losses and any legal or other fees with respect to such cases. Following the closing of the Lorillard merger, RJRT assumed Lorillard’s obligations under the Separation Agreement as was required under the Separation Agreement.
127. SFRTI Indemnity. In connection with the 13 January 2016 sale by RAI of the international rights to the Natural American Spirit brand name and associated trademarks, along with SFR Tobacco International GmbH (“SFRTI”) and other international companies that distributed and marketed the brand outside the United States, to JT International Holding BV (“JTI Holding”), each of SFNTC, R. J. Reynolds Global Products, Inc., and R. J. Reynolds Tobacco B.V. agreed to indemnify JTI Holding against, among other things, any liabilities, costs, and expenses relating to actions (i) commenced on or before (a) 13 January 2019, to the extent relating to alleged personal injuries, and (b) in all other cases, 13 January 2021; (ii) brought by (a) a governmental authority to enforce legislation implementing European Union Directive 2001/37/EC or European Directive 2014/40/EU or (b) consumers or a consumer association; and (iii) arising out of any statement or claim (a) made on or before 13 January 2016, (b) by any company sold to JTI Holding in the transaction, (c) concerning Natural American Spirit brand products consumed or intended to be consumed outside of the United States and (d) that the Natural American Spirit brand product is natural, organic, or additive free. Under the terms of this indemnity, JTI has requested indemnification from Santa Fe Natural Tobacco Company Germany GmbH (“SFNTCG”) in connection with an audit of SFNTCG relating to transfer pricing for the tax years 2007 to 2010 and 2012 to 2015. SFNTCG contests the audit results. The amount in dispute is approximately €21 million plus interest (approximately £18.8 million or US$24 million).
128. Indemnification of Distributors and Retailers. RJRT, Lorillard Tobacco, Santa Fe, American Snuff Co. and RJR Vapor have entered into agreements to indemnify certain distributors and retailers from liability and related defence costs arising out of the sale or distribution of their products. Additionally, Santa Fe has entered into an agreement to indemnify a supplier from liability and related defence costs arising out of the sale or use of Santa Fe’s products. The cost has been, and is expected to be, insignificant. RJRT, Santa Fe, American Snuff Co. and RJR Vapor believe that the indemnified claims are substantially similar in nature and extent to the claims that they are already exposed to by virtue of their having manufactured those products.
129. Except as otherwise noted above, RAI is not able to estimate the maximum potential of future payments, if any, related to these indemnification obligations.
130. Competition Investigations. There are instances where Group companies are co-operating with relevant national competition authorities, including (amongst others) in the Ukraine and Cyprus, in relation to on-going competition law investigations.
Tax DisputesThe Group has exposures in respect of the payment or recovery of a number of taxes. The Group is and has been subject to a number of tax audits covering, amongst others, excise tax, value added taxes, sales taxes, corporate taxes, withholding taxes and payroll taxes.
The estimated costs of known tax obligations have been provided in these accounts in accordance with Group’s accounting policies. In some countries, tax law requires that full or part payment of disputed tax assessments be made pending resolution of the dispute. To the extent that such payments exceed the estimated obligation, they would not be recognised as an expense.
The following matters may proceed to litigation:
BrazilThe Brazilian Federal Tax Authority has filed claims against Souza Cruz seeking to reassess the profits of overseas subsidiaries to corporate income tax and social contribution tax. The reassessments are for the years 2004 until and including 2012 for a total amount of BRL1,630 million (£330 million) to cover tax, interest and penalties.
Souza Cruz appealed all reassessments. Regarding the first assessments (2004-2006) Souza Cruz’s appeal was rejected in 2013 although the written judgement of that tribunal was received in 2016. Souza Cruz has appealed the decision. The appeal against the second assessments (2007 and 2008) was upheld at the second tier tribunal and was closed. In 2015, a further reassessment for the same period (2007 and 2008) was raised after the five-year statute of limitation. This has been appealed to the administrative level special chamber.
Souza Cruz received further reassessments in 2014 for the 2009 calendar year and in 2015 an assessment for the 2010 calendar year. Souza Cruz appealed both the reassessments in full. In December 2016, assessments were received for the calendar years 2011 and 2012 which have also been appealed.
South AfricaIn 2011, the South African Revenue Service (SARS) challenged the debt financing of British American Tobacco South Africa (BATSA) and reassessed the years 2006 to 2008. BATSA has objected to and appealed this reassessment. In 2014, SARS also reassessed the years 2009 and 2010. In 2015, BATSA filed formal Notices of Appeal and detailed objection letters against the 2009 and 2010 assessments and has reserved its right to challenge the constitutionality of the assessment at a later date. In 2016, SARS filed a Statement of Grounds of Assessment and BATSA filed its Statement of Grounds of Appeal in early 2017. During 2018 both parties have filed their notices of discovery. Across the period from 2006 to 2010 the reassessments are for ZAR2.1 billion (£116 million) covering both tax and interest.
210 BAT Annual Report and Form 20-F 2018

Governance Other InformationFinancial StatementsStrategic Report
28 Contingent liabilities and financial commitments continued The NetherlandsThe Dutch tax authority has issued a number of assessments on various issues across the years 2003-2016 in relation to various intra-group transactions. The assessments amount to an aggregate net liability across these periods of £902 million covering tax, interest and penalties. The Group has appealed against the assessments in full.
The Group believes that its companies have meritorious defences in law and fact in each of the above matters and intends to pursue each dispute through the judicial system as necessary. The Group does not consider it appropriate to make provision for these amounts nor for any potential further amounts which may be assessed in relation to these matters in subsequent years.
While the amounts that may be payable or receivable in relation to tax disputes could be material to the results or cash flows of the Group in the period in which they are recognised, the Board does not expect these amounts to have a material effect on the Group’s financial condition.
VAT and duty disputesBangladeshOn 25 July 2018, the Appellate Division of the Supreme Court of Bangladesh has reversed the decision of the High Court Division against BAT Bangladesh in respect of the retrospective demands for VAT and Supplementary Duty amounting to approximately £170 million. The Attorney General’s Office has 30 days from receipt of the certified Court Order, which remains to be issued, in which to seek a review of this decision.
EgyptBritish American Tobacco Egypt LLC is subject to two ongoing civil cases concerning the imposition of sales tax on low price category brands brought by the Egyptian tax authority for approximately £102 million.
Management believes that the tax claims are unfounded and has appealed the tax claims. These cases are under review by the Council of State and hearings are scheduled for 27 March 2019 and 24 April 2019 respectively.
Operating leasesTotal future minimum lease payments under non-cancellable operating leases comprise leases where payments fall due:
2018
£m2017
£m
Property Within one year 111 75Between one and five years 269 183Beyond five years 137 117 517 375Plant and equipment and other Within one year 66 32Between one and five years 107 38 173 70Total operating lease commitments (note 31) 690 445
Performance guaranteesAs part of the acquisition of TDR in 2015, the Group has committed to keeping the manufacturing facility in Kanfanar, Croatia operational for at least five years following completion of the acquisition. A similar commitment for four years following completion was given in respect of the packaging plant in Rovinj, Croatia, which was disposed of in December 2018. The maximum exposure under these guarantees is £46 million (2017: £46 million) of which £1 million relates to the Rovinj plant.
211BAT Annual Report and Form 20-F 2018

Financial Statements
Notes on the Accounts continued
29 Interests in subsidiariesSubsidiaries with material non‑controlling interestsNon-controlling interests principally arise from the Group’s listed investment in Malaysia (British American Tobacco (Malaysia) Berhad), where the Group held 50% of the listed holding company in 2018, 2017 and 2016. The Group has assessed that it exercises de facto control over Malaysia as it has the practical ability to direct the business through effective control of the company’s board as a result of the Group controlling the largest shareholding block in comparison to other shareholdings which are widely dispersed. Summarised financial information for Malaysia is shown below as required by IFRS 12. As part of the Group’s reporting processes, Malaysia report consolidated financial information for the Malaysia group which has been adjusted to comply with Group accounting policies which may differ to local accounting practice. Goodwill in respect of Malaysia, which arose as a result of the acquisition of the Rothmans group referred to in note 9, has not been included as part of the net assets below. In addition, no adjustments have been made to the information below for the elimination of intercompany transactions and balances with the rest of the Group.
Summarised financial information
2018£m
2017£m
Revised
2016£m
Revised
Revenue 231 237 317Profit for the year 87 89 129– Attributable to non-controlling interests 43 44 64Total comprehensive income 87 87 146– Attributable to non-controlling interests 43 43 73Dividends paid to non-controlling interests (40) (64) (59)Summary net assets: Non-current assets 16 18 31Current assets 116 101 103Non-current liabilities – (5) (4)Current liabilities (129) (120) (94)Total equity at the end of the year 3 (6) 36– Attributable to non-controlling interests 1 (3) 18Net cash generated from operating activities 86 67 108Net cash generated in investing activities (2) 14 45Net cash used in financing activities (77) (86) (151)Differences on exchange 1 (1) 1Increase/(decrease) in net cash and cash equivalents 8 (6) 3Net cash and cash equivalents at 1 January 2 8 5Net cash and cash equivalents at 31 December 10 2 8
With effect from 1 January 2018, the Group has adopted IFRS 15 Revenue from Contracts with Customers. The Group has revised 2017, as explained in notes 1 and 31.
Other shareholdingsThe Group holds 92% of the equity shares of PT Bentoel Internasional Investama Tbk (“Bentoel”). In 2011, the Group sold 984 million shares, representing approximately 14% of Bentoel’s share capital, for the purposes of fulfilling certain obligations pursuant to Bapepam LK (Indonesia) takeover regulations. The Group simultaneously entered into a total return swap on 971 million of the shares. In June 2016, the Group and other investors participated in a rights issue by Bentoel, increasing its stake in Bentoel to 92%. Simultaneously, the Group amended the total return swap to take account of an addition 1,684 million shares. The shares subject to the total return swap now represent 7% of Bentoel’s issued capital. While the Group does not have legal ownership of these shares, it retains the risks and rewards associated with them which results in the Group continuing to recognise an effective interest in 99% of Bentoel’s net assets and results.
Refer to note 11 for information on the Group’s 42% investment in Tisak d.d.
212 BAT Annual Report and Form 20-F 2018

Governance Other InformationFinancial StatementsStrategic Report
30 Condensed consolidating financial informationThe following consolidating financial information is required by the rules of the Securities and Exchange Commission and has been prepared as a requirement of the Regulation S-X 3-10.
The following condensed consolidating financial information relates to the guarantees of:
– US$11 billion RAI unsecured notes;
– US$231 million of Lorillard unsecured notes; and
– US$17.2 billion of bonds representing the registered portion (99.7%) of a total US$17.25 billion of bonds issued by BATCAP in connection with the acquisition of RAI.
The condensed consolidating financial information has been prepared as a requirement of the Regulation S-X 3-10. All financial statements and financial information provided by or with respect to the US business or RAI (and/or the RAI Group) are prepared on the basis of US GAAP and constitute the primary financial statements or financial information of the US business or RAI (and/or the RAI Group). Solely for the purpose of consolidation within the results of BAT p.l.c. and the BAT Group, this financial information is then converted to International Financial Reporting Standards as issued by the IASB and adopted by the European Union (IFRS). To the extent any such financial information provided in these financial statements relates to the US business or RAI (and/or the RAI Group) it is provided as an explanation of the US business’ or RAI’s (and/or the RAI Group’s) primary US GAAP-based financial statements and information.
With effect from 1 January 2018, the Group has adopted IFRS 15 Revenue from Contracts with Customers. The Group has revised the results for the twelve-month period ended 31 December 2017 and 31 December 2016, as explained in note 31.
(a) RAI and Lorillard unsecured notesThe following condensed consolidating financial information relates to the guarantees of: US$11 billion (2017: US$12.2 billion) RAI unsecured notes (referred to as “RB” below) and US$231 million of Lorillard unsecured notes (referred to as “LB” below). The subsidiaries disclosed below are wholly owned and the guarantees provided are full and unconditional, and joint and several.
The following condensed consolidating financial information includes the accounts and activities of:
a. British American Tobacco p.l.c. (parent guarantor of RB and LB), referred to as “BAT p.l.c.” in financials below;
b. R.J. Reynolds Tobacco Company (issuer of LB), referred to as “RJRT” in financials below;
c. Reynolds American Inc. (issuer of RB, subsidiary guarantor of LB), referred to as “RAI” in financials below;
d. R.J. Reynolds Tobacco Holdings Inc. (subsidiary guarantor of RB and LB), referred to as “RJRTH” in financials below;
e. other direct and indirect subsidiaries of the BAT Group that are not guarantors;
f. elimination entries necessary to consolidate the parent with the issuer, the subsidiary guarantors and non-guarantor subsidiaries; and
g. the BAT Group on a consolidated basis.
213BAT Annual Report and Form 20-F 2018

Financial Statements
Notes on the Accounts continued
30 Condensed consolidating financial information continued Condensed Consolidated Income Statement
For the year ended 31 December 2018£m
BAT p.l.c. RJRT RAI RJRTHAll other
companies BAT Group
Parent
guarantor Issuer (LB)
Issuer (RB)Subsidiary
guarantor (LB)
Subsidiary guarantor (LB & RB)
Non‑guarantor subsidiaries Eliminations Consolidated
Revenue – 7,752 – – 16,959 (219) 24,492Raw materials and consumables used – (662) – – (4,161) 159 (4,664)Changes in inventories of finished goods and work in progress – (4) – – 118 – 114Employee benefit costs (5) (169) (13) – (2,822) 4 (3,005)Depreciation, amortisation and impairment costs – (91) – – (947) – (1,038)Other operating income – 3 22 – 3,847 (3,787) 85Loss on reclassification from amortised cost to fair value – – – – (3) – (3)Other operating expenses (124) (6,579) (17) – (3,819) 3,871 (6,668)(Loss)/profit from operations (129) 250 (8) – 9,172 28 9,313Net finance income/(costs) 95 9 (421) 3 (947) (120) (1,381)Share of post-tax results of associates and joint ventures – – – – 419 – 419
Profit before taxation (34) 259 (429) 3 8,644 (92) 8,351Taxation on ordinary activities – (100) 93 1 (2,135) – (2,141)Equity income from subsidiaries 6,210 2,569 3,436 2,755 – (14,970) –Profit for the year 6,176 2,728 3,100 2,759 6,509 (15,062) 6,210Attributable to: Owners of the parent 6,176 2,728 3,100 2,759 6,331 (15,062) 6,032Non-controlling interests – – – – 178 – 178 6,176 2,728 3,100 2,759 6,509 (15,062) 6,210
214 BAT Annual Report and Form 20-F 2018

Governance Other InformationFinancial StatementsStrategic Report
30 Condensed consolidating financial information continued Condensed Consolidated Income Statement
For the year ended 31 December 2017£m
Revised
BAT p.l.c. RJRT RAI RJRTH All other
companies BAT Group
Parent guarantor Issuer (LB)
Issuer (RB)Subsidiary
guarantor (LB)
Subsidiary guarantor (LB & RB)
Non-guarantor subsidiaries Eliminations Consolidated
Revenue – 3,459 – – 16,243 (138) 19,564Raw materials and consumables used – (346) – – (4,286) 112 (4,520)Changes in inventories of finished goods and work in progress – (7) – – (507) 1 (513)Employee benefit costs (8) (117) (35) (2) (2,525) 8 (2,679)Depreciation, amortisation and impairment costs – (28) – – (874) – (902)Other operating income – 7 34 – 1,859 (1,756) 144Other operating expenses (101) (2,889) (6) – (3,499) 1,813 (4,682)(Loss)/profit from operations (109) 79 (7) (2) 6,411 40 6,412 Net finance income/(costs) 3 11 (190) 9 (908) (19) (1,094)Share of post-tax results of associates and joint ventures – – – – 24,209 – 24,209
Profit before taxation (106) 90 (197) 7 29,712 21 29,527Taxation on ordinary activities – (240) 61 (3) 8,311 – 8,129Equity income from subsidiaries 37,656 3,870 4,259 3,893 – (49,678) –Profit for the year 37,550 3,720 4,123 3,897 38,023 (49,657) 37,656Attributable to: Owners of the parent 37,550 3,720 4,123 3,897 37,852 (49,657) 37,485Non-controlling interests – – – – 171 – 171 37,550 3,720 4,123 3,897 38,023 (49,657) 37,656
215BAT Annual Report and Form 20-F 2018

Financial Statements
Notes on the Accounts continued
30 Condensed consolidating financial information continued Condensed Consolidated Income Statement
For the year ended 31 December 2016£m
Revised
BAT p.l.c. RJRT RAI RJRTHAll other
companies BAT Group
Parent guarantor Issuer (LB)
Issuer (RB)Subsidiary
guarantor (LB)
Subsidiary guarantor (LB & RB)
Non-guarantor subsidiaries Eliminations Consolidated
Revenue – – – – 14,130 – 14,130Raw materials and consumables used – – – – (3,777) – (3,777)Changes in inventories of finished goods and work in progress – – – – 44 – 44Employee benefit costs (7) – – – (2,274) 7 (2,274)Depreciation, amortisation and impairment costs – – – – (607) – (607)Other operating income – – – – 176 – 176Other operating expenses (75) – – – (3,037) 75 (3,037)(Loss)/profit from operations (82) – – – 4,655 82 4,655Net finance (costs)/income (54) – – – (637) 54 (637)Share of post-tax results of associates and joint ventures – – – – 2,227 – 2,227
Profit before taxation (136) – – – 6,245 136 6,245Taxation on ordinary activities – – – – (1,406) – (1,406)Equity income from subsidiaries 4,839 – – – – (4,839) –Profit for the year 4,703 – – – 4,839 (4,703) 4,839Attributable to: Owners of the parent 4,703 – – – 4,648 (4,703) 4,648Non-controlling interests – – – – 191 – 191 4,703 – – – 4,839 (4,703) 4,839
216 BAT Annual Report and Form 20-F 2018

Governance Other InformationFinancial StatementsStrategic Report
30 Condensed consolidating financial information continued Condensed Consolidated Statement of Comprehensive Income
For the year ended 31 December 2018£m
BAT p.l.c. RJRT RAI RJRTH All other
companies BAT Group
Parent guarantor Issuer (LB)
Issuer (RB)Subsidiary
guarantor (LB)
Subsidiary guarantor (LB & RB)
Non‑guarantor subsidiaries Eliminations Consolidated
Profit for the year 6,176 2,728 3,100 2,759 6,509 (15,062) 6,210Other comprehensive income/(expense) Items that may be reclassified subsequently to profit or loss: – – – – 3,099 – 3,099Differences on exchange – – – – 3,868 – 3,868Cash flow hedges – – – – (41) – (41)Net investment hedges – – – – (708) – (708)Associates–share of OCI, net of tax – – – – (38) – (38)Tax on items that may be reclassified – – – – 18 – 18Items that will not be reclassified subsequently to profit or loss: – – – – 115 – 115Retirement benefit schemes – – – – 142 – 142Associates – share of OCI, net of tax – – – – 6 – 6Tax on items that will not be reclassified – – – – (33) – (33)
Total other comprehensive income for the year, net of tax – – – – 3,214 – 3,214Share of subsidiaries OCI (other reserves) 115 – – – – (115) –Share of subsidiaries OCI (retained earnings) 3,099 – – – – (3,099) –Total comprehensive income/(expense) for the year, net of tax 9,390 2,728 3,100 2,759 9,723 (18,276) 9,424Attributable to: Owners of the parent 9,390 2,728 3,100 2,759 9,538 (18,276) 9,239Non-controlling interests – – – – 185 – 185 9,390 2,728 3,100 2,759 9,723 (18,276) 9,424
217BAT Annual Report and Form 20-F 2018

Financial Statements
Notes on the Accounts continued
30 Condensed consolidating financial information continued Condensed Consolidated Statement of Comprehensive Income
For the year ended 31 December 2017£m
Revised
BAT p.l.c. RJRT RAI RJRTH All other
companies BAT Group
Parent guarantor Issuer (LB)
Issuer (RB)Subsidiary
guarantor (LB)
Subsidiary guarantor (LB & RB)
Non-guarantor subsidiaries Eliminations Consolidated
Profit for the year 37,550 3,720 4,123 3,897 38,023 (49,657) 37,656Other comprehensive income/(expense) Items that may be reclassified subsequently to profit or loss: – – – – (3,809) – (3,809)Differences on exchange – – – – (3,084) – (3,084)Cash flow hedges – – – – (171) – (171)Investments held at fair value – – – – (27) – (27)Net investment hedges – – – – 357 – 357Associates – share of OCI, net of tax – – – – (918) – (918)Tax on items that may be reclassified – – – – 34 – 34Items that will not be reclassified subsequently to profit or loss: – – – – 681 – 681Retirement benefit schemes – – – – 827 – 827Associates–share of OCI, net of tax – – – – 25 – 25Tax on items that will not be reclassified – – – – (171) – (171)
Total other comprehensive expense for the year, net of tax – – – – (3,128) – (3,128)Share of subsidiaries OCI (other reserves) 681 – – – – (681) –Share of subsidiaries OCI (retained earnings) (3,809) – – – – 3,809 –Total comprehensive income/(expense) for the year, net of tax 34,422 3,720 4,123 3,897 34,895 (46,529) 34,528Attributable to: Owners of the parent 34,422 3,720 4,123 3,897 34,728 (46,529) 34,361Non-controlling interests – – – – 167 – 167 34,422 3,720 4,123 3,897 34,895 (46,529) 34,528
218 BAT Annual Report and Form 20-F 2018

Governance Other InformationFinancial StatementsStrategic Report
30 Condensed consolidating financial information continued Condensed Consolidated Statement of Comprehensive Income
For the year ended 31 December 2016£m
BAT p.l.c. RJRT RAI RJRTH All other
companies BAT Group
Parent guarantor Issuer (LB)
Issuer (RB)Subsidiary
guarantor (LB)
Subsidiary guarantor (LB & RB)
Non-guarantor subsidiaries Eliminations Consolidated
Profit for the year 4,703 – – – 4,839 (4,703) 4,839Other comprehensive income/(expense) Items that may be reclassified subsequently to profit or loss: – – – – 1,760 – 1,760Differences on exchange – – – – 1,270 – 1,270Cash flow hedges – – – – 55 – 55Net investment hedges – – – – (961) – (961)Associates – share of OCI, net of tax – – – – 1,415 – 1,415Tax on items that may be reclassified – – – – (19) – (19)Items that will not be reclassified subsequently to profit or loss: – – – – (173) – (173)Retirement benefit schemes – – – – (229) – (229)Associates–share of OCI, net of tax – – – – 20 – 20Tax on items that will not be reclassified – – – – 36 – 36
Total other comprehensive income for the year, net of tax – – – – 1,587 – 1,587Share of subsidiaries OCI (other reserves) (173) – – – – 173 –Share of subsidiaries OCI (retained earnings) 1,760 – – – – (1,760) –Total comprehensive income/(expense) for the year, net of tax 6,290 – – – 6,426 (6,290) 6,426Attributable to: Owners of the parent 6,290 – – – 6,180 (6,290) 6,180Non-controlling interests – – – – 246 – 246 6,290 – – – 6,426 (6,290) 6,426
219BAT Annual Report and Form 20-F 2018
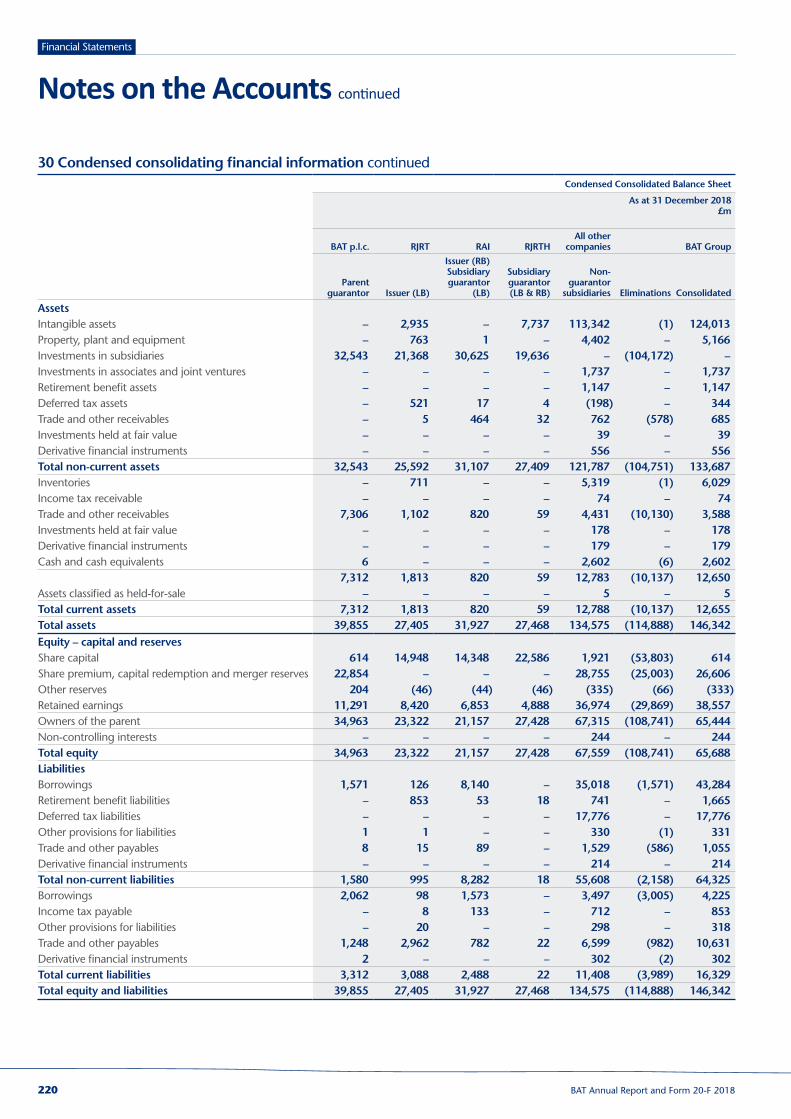
Financial Statements
Notes on the Accounts continued
30 Condensed consolidating financial information continuedCondensed Consolidated Balance Sheet
As at 31 December 2018 £m
BAT p.l.c. RJRT RAI RJRTHAll other
companies BAT Group
Parent guarantor Issuer (LB)
Issuer (RB)Subsidiary guarantor
(LB)
Subsidiary guarantor (LB & RB)
Non‑guarantor
subsidiaries Eliminations Consolidated
Assets Intangible assets – 2,935 – 7,737 113,342 (1) 124,013Property, plant and equipment – 763 1 – 4,402 – 5,166Investments in subsidiaries 32,543 21,368 30,625 19,636 – (104,172) –Investments in associates and joint ventures – – – – 1,737 – 1,737Retirement benefit assets – – – – 1,147 – 1,147Deferred tax assets – 521 17 4 (198) – 344Trade and other receivables – 5 464 32 762 (578) 685Investments held at fair value – – – – 39 – 39Derivative financial instruments – – – – 556 – 556Total non‑current assets 32,543 25,592 31,107 27,409 121,787 (104,751) 133,687Inventories – 711 – – 5,319 (1) 6,029Income tax receivable – – – – 74 – 74Trade and other receivables 7,306 1,102 820 59 4,431 (10,130) 3,588Investments held at fair value – – – – 178 – 178Derivative financial instruments – – – – 179 – 179Cash and cash equivalents 6 – – – 2,602 (6) 2,602 7,312 1,813 820 59 12,783 (10,137) 12,650Assets classified as held-for-sale – – – – 5 – 5Total current assets 7,312 1,813 820 59 12,788 (10,137) 12,655Total assets 39,855 27,405 31,927 27,468 134,575 (114,888) 146,342Equity – capital and reserves Share capital 614 14,948 14,348 22,586 1,921 (53,803) 614Share premium, capital redemption and merger reserves 22,854 – – – 28,755 (25,003) 26,606Other reserves 204 (46) (44) (46) (335) (66) (333)Retained earnings 11,291 8,420 6,853 4,888 36,974 (29,869) 38,557Owners of the parent 34,963 23,322 21,157 27,428 67,315 (108,741) 65,444Non-controlling interests – – – – 244 – 244Total equity 34,963 23,322 21,157 27,428 67,559 (108,741) 65,688Liabilities Borrowings 1,571 126 8,140 – 35,018 (1,571) 43,284Retirement benefit liabilities – 853 53 18 741 – 1,665Deferred tax liabilities – – – – 17,776 – 17,776Other provisions for liabilities 1 1 – – 330 (1) 331Trade and other payables 8 15 89 – 1,529 (586) 1,055Derivative financial instruments – – – – 214 – 214Total non‑current liabilities 1,580 995 8,282 18 55,608 (2,158) 64,325Borrowings 2,062 98 1,573 – 3,497 (3,005) 4,225Income tax payable – 8 133 – 712 – 853Other provisions for liabilities – 20 – – 298 – 318Trade and other payables 1,248 2,962 782 22 6,599 (982) 10,631Derivative financial instruments 2 – – – 302 (2) 302Total current liabilities 3,312 3,088 2,488 22 11,408 (3,989) 16,329Total equity and liabilities 39,855 27,405 31,927 27,468 134,575 (114,888) 146,342
220 BAT Annual Report and Form 20-F 2018

Governance Other InformationFinancial StatementsStrategic Report
30 Condensed consolidating financial information continuedCondensed Consolidated Balance Sheet
As at 31 December 2017 £m
Revised
BAT p.l.c. RJRT RAI RJRTHAll other
companies BAT Group
Parent guarantor Issuer (LB)
Issuer (RB)Subsidiary guarantor
(LB)
Subsidiary guarantor (LB & RB)
Non-guarantor
subsidiaries Eliminations Consolidated
Assets Intangible assets – 2,780 – 7,284 107,722 (1) 117,785Property, plant and equipment – 677 2 – 4,203 – 4,882Investments in subsidiaries 58,255 17,217 29,165 18,972 – (123,609) –Investments in associates and joint ventures – – – – 1,577 – 1,577Retirement benefit assets – – – – 1,123 – 1,123Deferred tax assets – 320 16 4 (7) – 333Trade and other receivables – 23 860 42 826 (995) 756Investments held at fair value – – – – 42 – 42Derivative financial instruments – – – – 590 – 590Total non‑current assets 58,255 21,017 30,043 26,302 116,076 (124,605) 127,088Inventories – 721 – – 5,144 (1) 5,864Income tax receivable – – 339 – 121 – 460Trade and other receivables 7,365 – 571 9 5,725 (9,617) 4,053Investments held at fair value – – – – 65 – 65Derivative financial instruments – – – – 228 – 228Cash and cash equivalents 5 2 2 – 3,287 (5) 3,291 7,370 723 912 9 14,570 (9,623) 13,961Assets classified as held-for-sale – – – – 5 – 5Total current assets 7,370 723 912 9 14,575 (9,623) 13,966Total assets 65,625 21,740 30,955 26,311 130,651 (134,228) 141,054Equity – capital and reserves Share capital 614 14,070 13,509 21,260 1,297 (50,136) 614Share premium, capital redemption and merger reserves 22,939 – – – 26,602 (22,939) 26,602Other reserves 805 (25) (24) (24) (3,392) (732) (3,392)Retained earnings 36,511 5,128 6,276 5,055 37,434 (53,469) 36,935Owners of the parent 60,869 19,173 19,761 26,291 61,941 (127,276) 60,759Non-controlling interests – – – – 222 – 222Total equity 60,869 19,173 19,761 26,291 62,163 (127,276) 60,981Liabilities Borrowings 1,571 186 8,212 – 35,629 (1,571) 44,027Retirement benefit liabilities – 926 42 20 833 – 1,821Deferred tax liabilities – – – – 17,129 – 17,129Other provisions for liabilities – 1 – – 353 – 354Trade and other payables 8 18 102 – 1,933 (1,003) 1,058Derivative financial instruments – – – – 79 – 79Total non‑current liabilities 1,579 1,131 8,356 20 55,956 (2,574) 64,468Borrowings 2,058 40 1,009 – 4,374 (2,058) 5,423Income tax payable – 23 – – 697 – 720Other provisions for liabilities – 4 – – 395 – 399Trade and other payables 1,119 1,369 1,829 – 6,911 (2,320) 8,908Derivative financial instruments – – – – 155 – 155Total current liabilities 3,177 1,436 2,838 – 12,532 (4,378) 15,605Total equity and liabilities 65,625 21,740 30,955 26,311 130,651 (134,228) 141,054
221BAT Annual Report and Form 20-F 2018

Financial Statements
Notes on the Accounts continued
30 Condensed consolidating financial information continuedCondensed Consolidated Cash Flow Statement
Year ended 31 December 2018 £m
BAT p.l.c. RJRT RAI RJRTHAll other
companies BAT Group
Parent guarantor Issuer (LB)
Issuer (RB) Subsidiary guarantor
(LB)
Subsidiary guarantor (LB & RB)
Non‑guarantor
subsidiaries Eliminations Consolidated
Net cash (used in)/generated from operating activities (45) 1,670 349 (7) 8,249 79 10,295Net cash generated from/(used in) investing activities 187 3,039 4,280 3,366 (877) (11,016) (1,021)Net cash (used in)/generated from financing activities (140) (4,711) (4,631) (3,359) (11,391) 14,602 (9,630)Net cash flows generated from/(used in) operating, investing and financing activities 2 (2) (2) – (4,019) 3,665 (356)Differences on exchange (1) – – – (138) 1 (138)Increase/(decrease) in net cash and cash equivalents in the year 1 (2) (2) – (4,157) 3,666 (494)Net cash and cash equivalents at 1 January* 5 2 2 – 2,813 – 2,822Net cash and cash equivalents at 31 December 6 – – – (1,344) 3,666 2,328
Condensed Consolidated Cash Flow Statement
Year ended 31 December 2017 £m
BAT p.l.c. RJRT RAI RJRTHAll other
companies BAT Group
Parent guarantor Issuer (LB)
Issuer (RB) Subsidiary guarantor
(LB)
Subsidiary guarantor (LB & RB)
Non-guarantor
subsidiaries Eliminations Consolidated
Net cash (used in)/generated from operating activities (12) (1,860) (270) (11) 7,488 12 5,347Net cash generated from/(used in) investing activities 2 (88) 1,116 1 (19,512) (63) (18,544)Net cash generated from/(used in) financing activities 10 1,950 (844) 10 21,030 (7,397) 14,759Net cash flows generated from/(used in) operating, investing and financing activities – 2 2 – 9,006 (7,448) 1,562Differences on exchange – – – – (391) – (391)Increase/(decrease) in net cash and cash equivalents in the year – 2 2 – 8,615 (7,448) 1,171Net cash and cash equivalents at 1 January* 5 – – – 1,646 – 1,651Net cash and cash equivalents at 31 December 5 2 2 – 10,261 (7,448) 2,822
222 BAT Annual Report and Form 20-F 2018
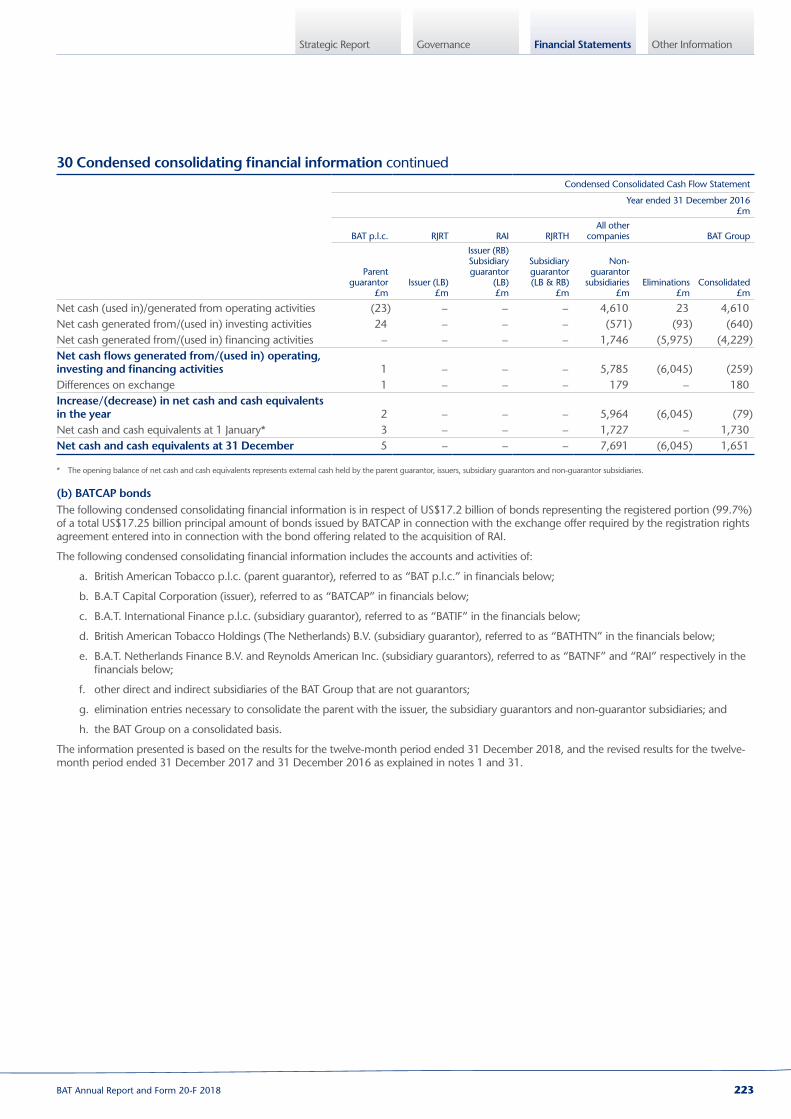
Governance Other InformationFinancial StatementsStrategic Report
30 Condensed consolidating financial information continuedCondensed Consolidated Cash Flow Statement
Year ended 31 December 2016 £m
BAT p.l.c. RJRT RAI RJRTHAll other
companies BAT Group
Parent guarantor
£mIssuer (LB)
£m
Issuer (RB) Subsidiary guarantor
(LB)£m
Subsidiary guarantor (LB & RB)
£m
Non-guarantor
subsidiaries£m
Eliminations£m
Consolidated£m
Net cash (used in)/generated from operating activities (23) – – – 4,610 23 4,610Net cash generated from/(used in) investing activities 24 – – – (571) (93) (640)Net cash generated from/(used in) financing activities – – – – 1,746 (5,975) (4,229)Net cash flows generated from/(used in) operating, investing and financing activities 1 – – – 5,785 (6,045) (259)Differences on exchange 1 – – – 179 – 180Increase/(decrease) in net cash and cash equivalents in the year 2 – – – 5,964 (6,045) (79)Net cash and cash equivalents at 1 January* 3 – – – 1,727 – 1,730Net cash and cash equivalents at 31 December 5 – – – 7,691 (6,045) 1,651
* The opening balance of net cash and cash equivalents represents external cash held by the parent guarantor, issuers, subsidiary guarantors and non-guarantor subsidiaries.
(b) BATCAP bondsThe following condensed consolidating financial information is in respect of US$17.2 billion of bonds representing the registered portion (99.7%) of a total US$17.25 billion principal amount of bonds issued by BATCAP in connection with the exchange offer required by the registration rights agreement entered into in connection with the bond offering related to the acquisition of RAI.
The following condensed consolidating financial information includes the accounts and activities of:
a. British American Tobacco p.l.c. (parent guarantor), referred to as “BAT p.l.c.” in financials below;
b. B.A.T Capital Corporation (issuer), referred to as “BATCAP” in financials below;
c. B.A.T. International Finance p.l.c. (subsidiary guarantor), referred to as “BATIF” in the financials below;
d. British American Tobacco Holdings (The Netherlands) B.V. (subsidiary guarantor), referred to as “BATHTN” in the financials below;
e. B.A.T. Netherlands Finance B.V. and Reynolds American Inc. (subsidiary guarantors), referred to as “BATNF” and “RAI” respectively in the financials below;
f. other direct and indirect subsidiaries of the BAT Group that are not guarantors;
g. elimination entries necessary to consolidate the parent with the issuer, the subsidiary guarantors and non-guarantor subsidiaries; and
h. the BAT Group on a consolidated basis.
The information presented is based on the results for the twelve-month period ended 31 December 2018, and the revised results for the twelve-month period ended 31 December 2017 and 31 December 2016 as explained in notes 1 and 31.
223BAT Annual Report and Form 20-F 2018

Financial Statements
Notes on the Accounts continued
30 Condensed consolidating financial information continued Condensed Consolidated Income Statement
Year ended 31 December 2018
£m
BAT p.l.c. BATCAP BATIF BATHTNBATNF
and RAI All other
companies BAT Group
Parent
guarantor IssuerSubsidiary guarantor
Subsidiary guarantor
Subsidiary guarantors
Non‑guarantor
subsidiaries Eliminations Consolidated
Revenue – – – – – 24,492 – 24,492Raw materials and consumables used – – – – – (4,664) – (4,664)Changes in inventories of finished goods and work in progress – – – – – 114 – 114Employee benefit costs (5) – – (2) (13) (2,990) 5 (3,005)Depreciation, amortisation and impairment costs – – – – – (1,038) – (1,038)Other operating income – – – – 22 63 – 85Loss on reclassification from amortised cost to fair value – – – – – (3) – (3)Other operating expenses (124) (3) (1) (4) (17) (6,643) 124 (6,668)(Loss)/profit from operations (129) (3) (1) (6) (8) 9,331 129 9,313Net finance income/(costs) 95 239 96 248 (421) (599) (1,039) (1,381)Share of post-tax results of associates and joint ventures – – – – – 419 – 419Profit before taxation (34) 236 95 242 (429) 9,151 (910) 8,351Taxation on ordinary activities – (79) 7 1 93 (2,163) – (2,141)Equity income from subsidiaries 6,210 – – – 3,436 – (9,646) –Profit for the year 6,176 157 102 243 3,100 6,988 (10,556) 6,210Attributable to: Owners of the parent 6,176 157 102 243 3,100 6,810 (10,556) 6,032Non-controlling interests – – – – – 178 – 178 6,176 157 102 243 3,100 6,988 (10,556) 6,210
224 BAT Annual Report and Form 20-F 2018

Governance Other InformationFinancial StatementsStrategic Report
30 Condensed consolidating financial information continued Condensed Consolidated Income Statement
Year ended 31 December 2017
£m
BAT p.l.c. BATCAP BATIF BATHTNBATNF
and RAI All other
companies BAT Group
Parent
guarantor IssuerSubsidiary guarantor
Subsidiary guarantor
Subsidiary guarantors
Non-guarantor subsidiaries Eliminations Consolidated
Revenue – – – – – 19,564 – 19,564Raw materials and consumables used – – – – – (4,520) – (4,520)Changes in inventories of finished goods and work in progress – – – – – (513) – (513)Employee benefit costs (8) – – (3) (35) (2,641) 8 (2,679)Depreciation, amortisation and impairment costs – – – – – (902) – (902)Other operating income – 1 – 1 33 109 – 144Other operating expenses (101) (1) (1) (2) (7) (4,671) 101 (4,682)(Loss)/profit from operations (109) – (1) (4) (9) 6,426 109 6,412Net finance income/(costs) 3 (62) (22) 636 (191) (1,403) (55) (1,094)Share of post-tax results of associates and joint ventures – – – – – 24,209 – 24,209Profit before taxation (106) (62) (23) 632 (200) 29,232 54 29,527Taxation on ordinary activities – 10 (40) 4 61 8,094 – 8,129Equity income from subsidiaries 37,656 – – – 4,259 – (41,915) –Profit for the year 37,550 (52) (63) 636 4,120 37,326 (41,861) 37,656Attributable to: Owners of the parent 37,550 (52) (63) 636 4,120 37,155 (41,861) 37,485Non-controlling interests – – – – – 171 – 171 37,550 (52) (63) 636 4,120 37,326 (41,861) 37,656
225BAT Annual Report and Form 20-F 2018

Financial Statements
Notes on the Accounts continued
30 Condensed consolidating financial information continued Condensed Consolidated Income Statement
Year ended 31 December 2016
£m
BAT p.l.c. BATCAP BATIF BATHTNBATNF
and RAI All other
companies BAT Group
Parent
guarantor IssuerSubsidiary guarantor
Subsidiary guarantor
Subsidiary guarantors
Non-guarantor subsidiaries Eliminations Consolidated
Revenue – – – – – 14,130 – 14,130Raw materials and consumables used – – – – – (3,777) – (3,777)Changes in inventories of finished goods and work in progress – – – – – 44 – 44Employee benefit costs (7) – – (3) – (2,271) 7 (2,274)Depreciation, amortisation and impairment costs – – – – – (607) – (607)Other operating income – – – – – 176 – 176Other operating expenses (75) – (4) – – (3,033) 75 (3,037)(Loss)/profit from operations (82) – (4) (3) – 4,662 82 4,655Net finance (costs)/income (54) – 1,006 (412) – (1,231) 54 (637)Share of post-tax results of associates and joint ventures – – – – – 2,227 – 2,227Profit before taxation (136) – 1,002 (415) – 5,658 136 6,245Taxation on ordinary activities – – (2) 65 – (1,469) – (1,406)Equity income from subsidiaries 4,839 – – – – – (4,839) –Profit for the year 4,703 – 1,000 (350) – 4,189 (4,703) 4,839Attributable to: Owners of the parent 4,703 – 1,000 (350) – 3,998 (4,703) 4,648Non-controlling interests – – – – – 191 – 191 4,703 – 1,000 (350) – 4,189 (4,703) 4,839
226 BAT Annual Report and Form 20-F 2018

Governance Other InformationFinancial StatementsStrategic Report
30 Condensed consolidating financial information continued Condensed Consolidated Statement of Comprehensive Income
Year ended 31 December 2018
£m
BAT p.l.c. BATCAP BATIF BATHTNBATNF
and RAI All other
companies BAT Group
Parent
guarantor IssuerSubsidiary guarantor
Subsidiary guarantor
Subsidiary guarantors
Non‑guarantor
subsidiaries Eliminations Consolidated
Profit for the year 6,176 157 102 243 3,100 6,988 (10,556) 6,210Other comprehensive income/(expense) Items that may be reclassified subsequently to profit or loss: – (101) 15 – – 3,185 – 3,099Differences on exchange – – – – – 3,868 – 3,868Cash flow hedges – (101) 15 – – 45 – (41)Net investment hedges – – – – – (708) – (708)Associates–share of OCI, net of tax – – – – – (38) – (38)Tax on items that may be reclassified – – – – – 18 – 18Items that will not be reclassified subsequently to profit or loss: – – – – – 115 – 115Retirement benefit schemes – – – – – 142 – 142Associates–share of OCI, net of tax – – – – – 6 – 6Tax on items that will not be reclassified – – – – – (33) – (33)Total other comprehensive (expense)/income for the year, net of tax – (101) 15 – – 3,300 – 3,214Share of subsidiaries OCI (other reserves) 115 – – – – – (115) –Share of subsidiaries OCI (retained earnings) 3,099 – – – – – (3,099) –Total comprehensive income/(expense) for the year, net of tax 9,390 56 117 243 3,100 10,288 (13,770) 9,424Attributable to: Owners of the parent 9,390 56 117 243 3,100 10,103 (13,770) 9,239Non-controlling interests – – – – – 185 – 185 9,390 56 117 243 3,100 10,288 (13,770) 9,424
227BAT Annual Report and Form 20-F 2018

Financial Statements
Notes on the Accounts continued
30 Condensed consolidating financial information continued Condensed Consolidated Statement of Comprehensive Income
Year ended 31 December 2017
£m
BAT p.l.c. BATCAP BATIF BATHTNBATNF
and RAI All other
companies BAT Group
Parent
guarantor IssuerSubsidiary guarantor
Subsidiary guarantor
Subsidiary guarantors
Non-guarantor subsidiaries Eliminations Consolidated
Profit for the year 37,550 (52) (63) 636 4,120 37,326 (41,861) 37,656Other comprehensive income/(expense) Items that may be reclassified subsequently to profit or loss: – (242) (21) – – (3,546) – (3,809)Differences on exchange – – – – – (3,084) – (3,084)Cash flow hedges – (242) (10) – – 81 – (171)Investments held at fair value – – – – – (27) – (27)Net investment hedges – – (11) – – 368 – 357Associates–share of OCI, net of tax – – – – – (918) – (918)Tax on items that may be reclassified – – – – – 34 – 34Items that will not be reclassified subsequently to profit or loss: – – – – – 681 – 681Retirement benefit schemes – – – – – 827 – 827Associates–share of OCI, net of tax – – – – – 25 – 25Tax on items that will not be reclassified – – – – – (171) – (171)Total other comprehensive (expense)/income for the year, net of tax – (242) (21) – – (2,865) – (3,128)Share of subsidiaries OCI (other reserves) 681 – – – – – (681) –Share of subsidiaries OCI (retained earnings) (3,809) – – – – – 3,809 –Total comprehensive income/(expense) for the year, net of tax 34,422 (294) (84) 636 4,120 34,461 (38,733) 34,528Attributable to: Owners of the parent 34,422 (294) (84) 636 4,120 34,294 (38,733) 34,361Non-controlling interests – – – – – 167 – 167 34,422 (294) (84) 636 4,120 34,461 (38,733) 34,528
228 BAT Annual Report and Form 20-F 2018
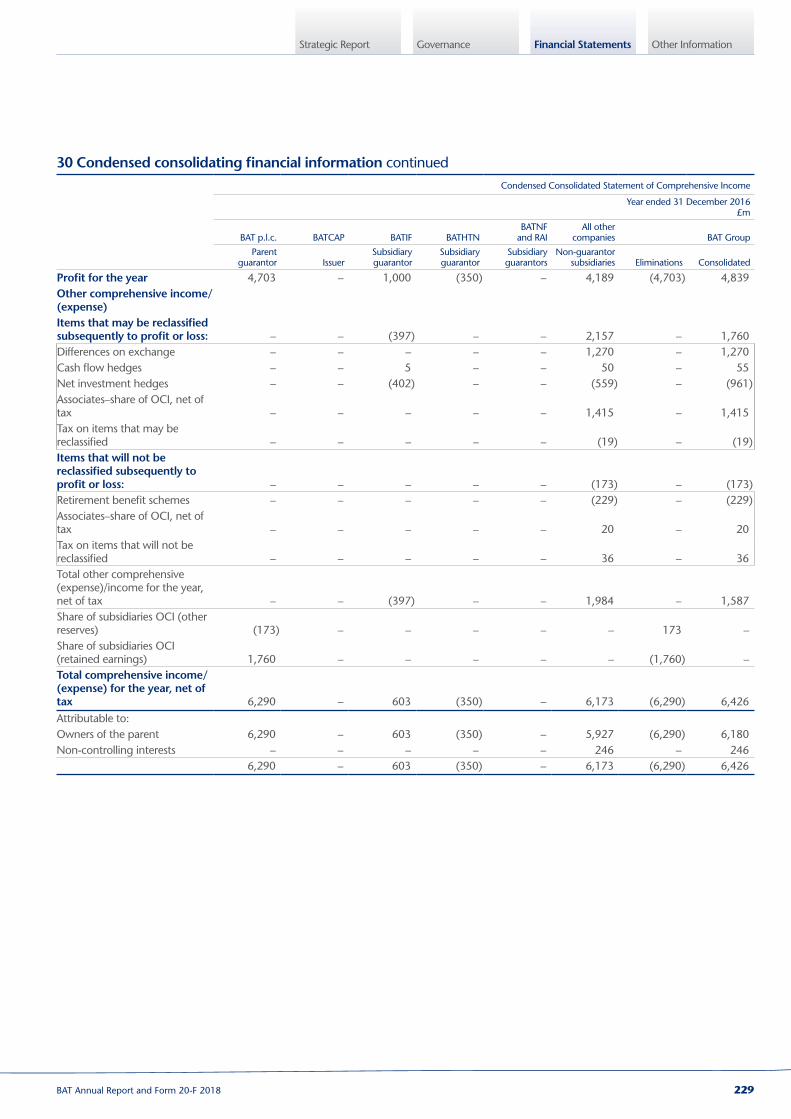
Governance Other InformationFinancial StatementsStrategic Report
30 Condensed consolidating financial information continued Condensed Consolidated Statement of Comprehensive Income
Year ended 31 December 2016
£m
BAT p.l.c. BATCAP BATIF BATHTNBATNF
and RAI All other
companies BAT Group
Parent
guarantor IssuerSubsidiary guarantor
Subsidiary guarantor
Subsidiary guarantors
Non-guarantor subsidiaries Eliminations Consolidated
Profit for the year 4,703 – 1,000 (350) – 4,189 (4,703) 4,839Other comprehensive income/(expense) Items that may be reclassified subsequently to profit or loss: – – (397) – – 2,157 – 1,760Differences on exchange – – – – – 1,270 – 1,270Cash flow hedges – – 5 – – 50 – 55Net investment hedges – – (402) – – (559) – (961)Associates–share of OCI, net of tax – – – – – 1,415 – 1,415Tax on items that may be reclassified – – – – – (19) – (19)Items that will not be reclassified subsequently to profit or loss: – – – – – (173) – (173)Retirement benefit schemes – – – – – (229) – (229)Associates–share of OCI, net of tax – – – – – 20 – 20Tax on items that will not be reclassified – – – – – 36 – 36Total other comprehensive (expense)/income for the year, net of tax – – (397) – – 1,984 – 1,587Share of subsidiaries OCI (other reserves) (173) – – – – – 173 –Share of subsidiaries OCI (retained earnings) 1,760 – – – – – (1,760) –Total comprehensive income/(expense) for the year, net of tax 6,290 – 603 (350) – 6,173 (6,290) 6,426Attributable to: Owners of the parent 6,290 – 603 (350) – 5,927 (6,290) 6,180Non-controlling interests – – – – – 246 – 246 6,290 – 603 (350) – 6,173 (6,290) 6,426
229BAT Annual Report and Form 20-F 2018
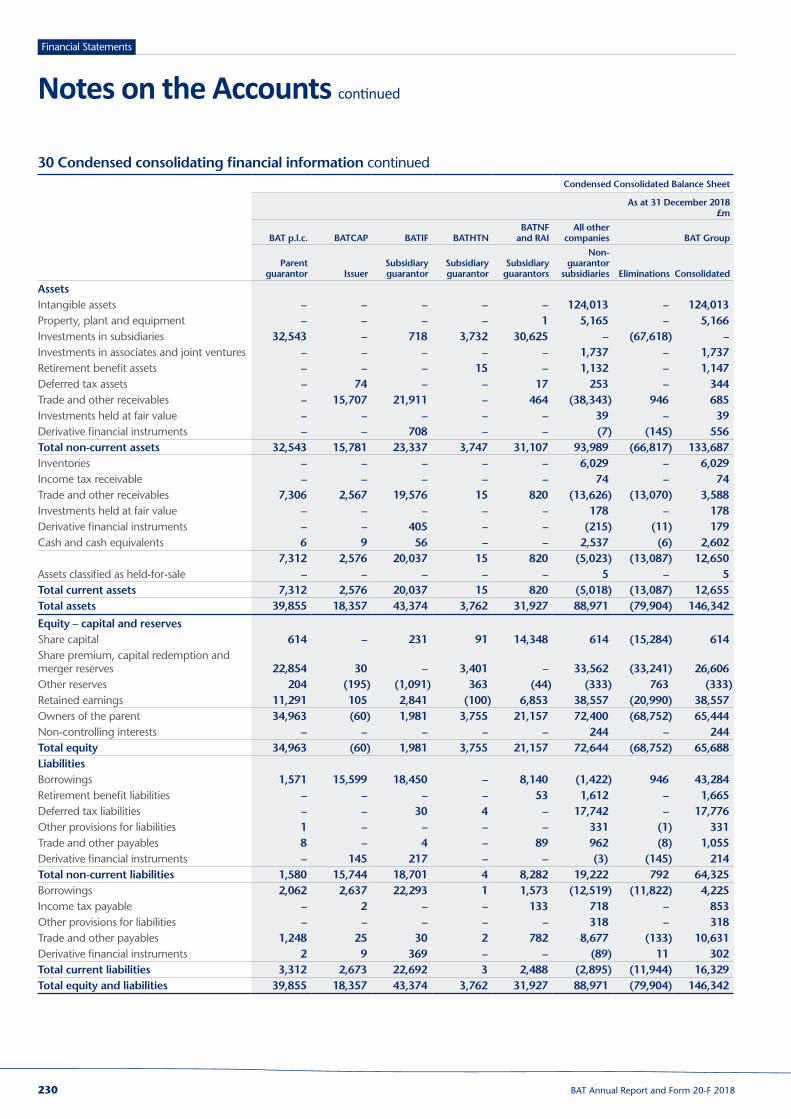
Financial Statements
Notes on the Accounts continued
30 Condensed consolidating financial information continuedCondensed Consolidated Balance Sheet
As at 31 December 2018£m
BAT p.l.c. BATCAP BATIF BATHTNBATNF
and RAI All other
companies BAT Group
Parent guarantor Issuer
Subsidiary guarantor
Subsidiary guarantor
Subsidiary guarantors
Non‑guarantor
subsidiaries Eliminations
Consolidated
Assets Intangible assets – – – – – 124,013 – 124,013Property, plant and equipment – – – – 1 5,165 – 5,166Investments in subsidiaries 32,543 – 718 3,732 30,625 – (67,618) –Investments in associates and joint ventures – – – – – 1,737 – 1,737Retirement benefit assets – – – 15 – 1,132 – 1,147Deferred tax assets – 74 – – 17 253 – 344Trade and other receivables – 15,707 21,911 – 464 (38,343) 946 685Investments held at fair value – – – – – 39 – 39Derivative financial instruments – – 708 – – (7) (145) 556Total non‑current assets 32,543 15,781 23,337 3,747 31,107 93,989 (66,817) 133,687Inventories – – – – – 6,029 – 6,029Income tax receivable – – – – – 74 – 74Trade and other receivables 7,306 2,567 19,576 15 820 (13,626) (13,070) 3,588Investments held at fair value – – – – – 178 – 178Derivative financial instruments – – 405 – – (215) (11) 179Cash and cash equivalents 6 9 56 – – 2,537 (6) 2,602
7,312 2,576 20,037 15 820 (5,023) (13,087) 12,650Assets classified as held-for-sale – – – – – 5 – 5Total current assets 7,312 2,576 20,037 15 820 (5,018) (13,087) 12,655Total assets 39,855 18,357 43,374 3,762 31,927 88,971 (79,904) 146,342
Equity – capital and reserves Share capital 614 – 231 91 14,348 614 (15,284) 614Share premium, capital redemption and merger reserves 22,854 30 – 3,401 – 33,562 (33,241) 26,606Other reserves 204 (195) (1,091) 363 (44) (333) 763 (333)Retained earnings 11,291 105 2,841 (100) 6,853 38,557 (20,990) 38,557Owners of the parent 34,963 (60) 1,981 3,755 21,157 72,400 (68,752) 65,444Non-controlling interests – – – – – 244 – 244Total equity 34,963 (60) 1,981 3,755 21,157 72,644 (68,752) 65,688Liabilities Borrowings 1,571 15,599 18,450 – 8,140 (1,422) 946 43,284Retirement benefit liabilities – – – – 53 1,612 – 1,665Deferred tax liabilities – – 30 4 – 17,742 – 17,776Other provisions for liabilities 1 – – – – 331 (1) 331Trade and other payables 8 – 4 – 89 962 (8) 1,055Derivative financial instruments – 145 217 – – (3) (145) 214Total non‑current liabilities 1,580 15,744 18,701 4 8,282 19,222 792 64,325Borrowings 2,062 2,637 22,293 1 1,573 (12,519) (11,822) 4,225Income tax payable – 2 – – 133 718 – 853Other provisions for liabilities – – – – – 318 – 318Trade and other payables 1,248 25 30 2 782 8,677 (133) 10,631Derivative financial instruments 2 9 369 – – (89) 11 302Total current liabilities 3,312 2,673 22,692 3 2,488 (2,895) (11,944) 16,329Total equity and liabilities 39,855 18,357 43,374 3,762 31,927 88,971 (79,904) 146,342
230 BAT Annual Report and Form 20-F 2018

Governance Other InformationFinancial StatementsStrategic Report
30 Condensed consolidating financial information continuedCondensed Consolidated Balance Sheet
As at 31 December 2017£m
BAT p.l.c. BATCAP BATIF BATHTNBATNF
and RAI All other
companies BAT Group
Parent guarantor Issuer
Subsidiary guarantor
Subsidiary guarantor
Subsidiary guarantors
Non-guarantor
subsidiaries Eliminations Consolidated
Assets Intangible assets – – – – – 117,785 – 117,785Property, plant and equipment – – – – 2 4,880 – 4,882Investments in subsidiaries 58,255 – 718 3,687 29,165 – (91,825) –Investments in associates and joint ventures – – – – – 1,577 – 1,577Retirement benefit assets – – – 52 – 1,071 – 1,123Deferred tax assets – 49 – – 16 268 – 333Trade and other receivables – 14,787 12,333 – 860 (27,699) 475 756Investments held at fair value – – – – – 42 – 42Derivative financial instruments – 68 594 – – (4) (68) 590Total non‑current assets 58,255 14,904 13,645 3,739 30,043 97,920 (91,418) 127,088Inventories – – – – – 5,864 – 5,864Income tax receivable – – – – 339 121 – 460Trade and other receivables 7,365 56 30,789 24 569 (25,490) (9,260) 4,053Investments held at fair value – – – – – 65 – 65Derivative financial instruments – – 339 – – (111) – 228Cash and cash equivalents 5 122 750 – 2 2,417 (5) 3,291
7,370 178 31,878 24 910 (17,134) (9,265) 13,961Assets classified as held-for-sale – – – – – 5 – 5Total current assets 7,370 178 31,878 24 910 (17,129) (9,265) 13,966Total assets 65,625 15,082 45,523 3,763 30,953 80,791 (100,683) 141,054
Equity – capital and reserves Share capital 614 – 231 91 13,509 614 (14,445) 614Share premium, capital redemption and merger reserves 22,939 258 – 3,401 – 22,943 (22,939) 26,602Other reserves 805 (129) (1,106) 322 (25) (3,427) 168 (3,392)Retained earnings 36,511 (52) 2,741 (75) 6,275 46,032 (54,497) 36,935Owners of the parent 60,869 77 1,866 3,739 19,759 66,162 (91,713) 60,759Non-controlling interests – – – – – 222 – 222Total equity 60,869 77 1,866 3,739 19,759 66,384 (91,713) 60,981Liabilities Borrowings 1,571 14,783 19,873 – 8,212 (1,364) 952 44,027Retirement benefit liabilities – – – – 42 1,779 – 1,821Deferred tax liabilities – – 38 13 – 17,078 – 17,129Other provisions for liabilities – – – – – 354 – 354Trade and other payables 8 – 4 – 102 952 (8) 1,058Derivative financial instruments – – 158 – – (11) (68) 79Total non‑current liabilities 1,579 14,783 20,073 13 8,356 18,788 876 64,468Borrowings 2,058 160 23,290 1 1,009 (11,408) (9,687) 5,423Income tax payable – 2 – 7 – 711 – 720Other provisions for liabilities – – – 1 – 398 – 399Trade and other payables 1,119 54 8 2 1,829 6,049 (153) 8,908Derivative financial instruments – 6 286 – – (131) (6) 155Total current liabilities 3,177 222 23,584 11 2,838 (4,381) (9,846) 15,605Total equity and liabilities 65,625 15,082 45,523 3,763 30,953 80,791 (100,683) 141,054
231BAT Annual Report and Form 20-F 2018
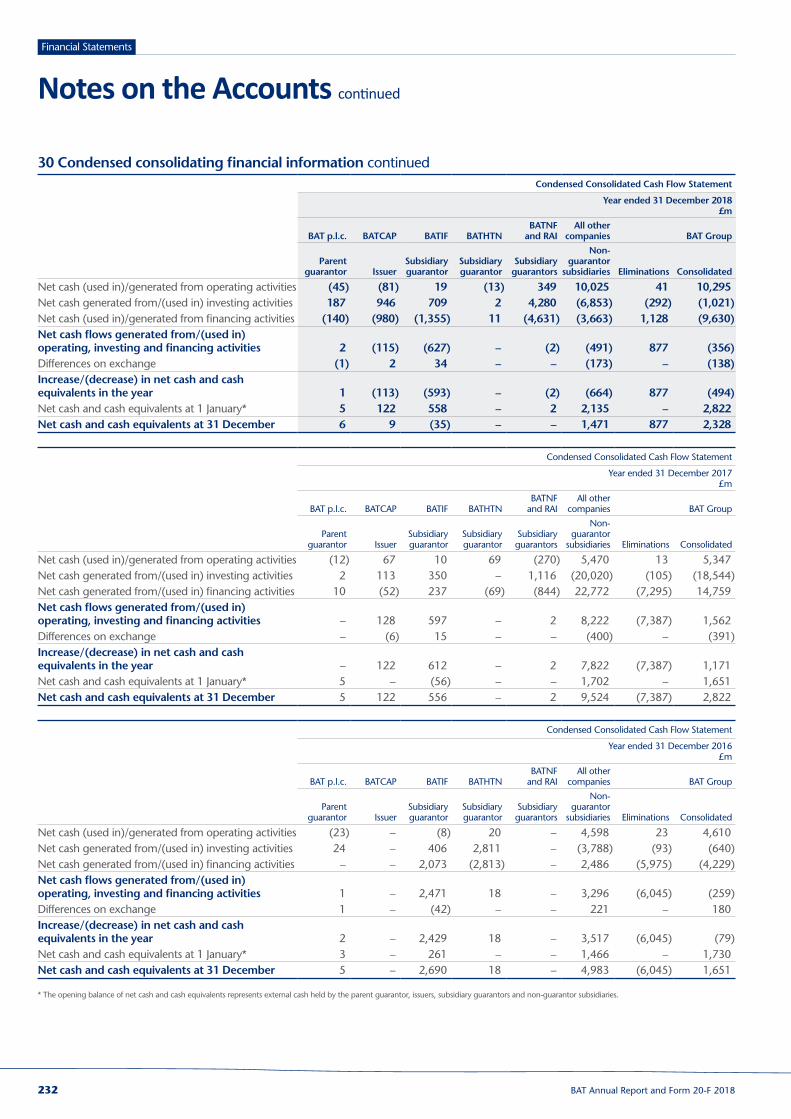
Financial Statements
Notes on the Accounts continued
30 Condensed consolidating financial information continuedCondensed Consolidated Cash Flow Statement
Year ended 31 December 2018£m
BAT p.l.c. BATCAP BATIF BATHTNBATNF
and RAI All other
companies BAT Group
Parent guarantor Issuer
Subsidiary guarantor
Subsidiary guarantor
Subsidiary guarantors
Non‑guarantor
subsidiaries Eliminations Consolidated
Net cash (used in)/generated from operating activities (45) (81) 19 (13) 349 10,025 41 10,295Net cash generated from/(used in) investing activities 187 946 709 2 4,280 (6,853) (292) (1,021)Net cash (used in)/generated from financing activities (140) (980) (1,355) 11 (4,631) (3,663) 1,128 (9,630)Net cash flows generated from/(used in) operating, investing and financing activities 2 (115) (627) – (2) (491) 877 (356)Differences on exchange (1) 2 34 – – (173) – (138)Increase/(decrease) in net cash and cash equivalents in the year 1 (113) (593) – (2) (664) 877 (494)Net cash and cash equivalents at 1 January* 5 122 558 – 2 2,135 – 2,822Net cash and cash equivalents at 31 December 6 9 (35) – – 1,471 877 2,328
Condensed Consolidated Cash Flow Statement
Year ended 31 December 2017£m
BAT p.l.c. BATCAP BATIF BATHTNBATNF
and RAI All other
companies BAT Group
Parent guarantor Issuer
Subsidiary guarantor
Subsidiary guarantor
Subsidiary guarantors
Non-guarantor
subsidiaries Eliminations Consolidated
Net cash (used in)/generated from operating activities (12) 67 10 69 (270) 5,470 13 5,347Net cash generated from/(used in) investing activities 2 113 350 – 1,116 (20,020) (105) (18,544)Net cash generated from/(used in) financing activities 10 (52) 237 (69) (844) 22,772 (7,295) 14,759Net cash flows generated from/(used in) operating, investing and financing activities – 128 597 – 2 8,222 (7,387) 1,562Differences on exchange – (6) 15 – – (400) – (391)Increase/(decrease) in net cash and cash equivalents in the year – 122 612 – 2 7,822 (7,387) 1,171Net cash and cash equivalents at 1 January* 5 – (56) – – 1,702 – 1,651Net cash and cash equivalents at 31 December 5 122 556 – 2 9,524 (7,387) 2,822
Condensed Consolidated Cash Flow Statement
Year ended 31 December 2016£m
BAT p.l.c. BATCAP BATIF BATHTNBATNF
and RAI All other
companies BAT Group
Parent guarantor Issuer
Subsidiary guarantor
Subsidiary guarantor
Subsidiary guarantors
Non-guarantor
subsidiaries Eliminations Consolidated
Net cash (used in)/generated from operating activities (23) – (8) 20 – 4,598 23 4,610Net cash generated from/(used in) investing activities 24 – 406 2,811 – (3,788) (93) (640)Net cash generated from/(used in) financing activities – – 2,073 (2,813) – 2,486 (5,975) (4,229)Net cash flows generated from/(used in) operating, investing and financing activities 1 – 2,471 18 – 3,296 (6,045) (259)Differences on exchange 1 – (42) – – 221 – 180Increase/(decrease) in net cash and cash equivalents in the year 2 – 2,429 18 – 3,517 (6,045) (79)Net cash and cash equivalents at 1 January* 3 – 261 – – 1,466 – 1,730Net cash and cash equivalents at 31 December 5 – 2,690 18 – 4,983 (6,045) 1,651
* The opening balance of net cash and cash equivalents represents external cash held by the parent guarantor, issuers, subsidiary guarantors and non-guarantor subsidiaries.
232 BAT Annual Report and Form 20-F 2018
Governance Other InformationFinancial StatementsStrategic Report
31 Accounting policy changes and regional restructureRevisions to previously issued consolidated financial statementsAdoption of IFRS 15With effect from 1 January 2018, the Group has adopted IFRS 15 Revenue from Contracts with Customers. In the 2018 financial statements the Group has fully revised prior periods, as permitted by the Standard, to ensure comparability of the income statement across prior periods. This standard requires certain payments to indirect customers, previously shown as marketing expenses, to be shown as deductions from revenue. This has reduced previously reported revenue for the year ended 31 December 2017 by £664 million (2016: £621 million), with a corresponding reduction in operating costs. In addition, due to the timing of the recognition of certain payments to indirect customers, previously reported revenue and operating profit for the twelve months ended 31 December 2017 has been reduced by a further £64 million (2016: £nil million). The impact on the Group Balance Sheet is disclosed below. In addition the above has also had an incidental impact on revenue policy included in note 1, note 2, note 6, note 7, note 13, note 19, note 22, note 29 and note 30(a).
Segment revisionIn connection with the acquisition of RAI, the Group has revised its organisational structure. RAI is reported as a separate region (United States). The markets which previously comprised EEMEA merged with the Americas, Western Europe and Asia-Pacific to form three new regions. The markets in the Middle East merged with Asia-Pacific to form the Asia-Pacific and Middle East region (APME). The markets in East and Central Africa, West Africa and Southern Africa merged with the Americas region to form the Americas and Sub-Saharan Africa region (AMSSA). The markets in Russia, Ukraine, Caucasus, Central Asia, Belarus, Turkey and North Africa merged with the Western Europe region to form the Europe and North Africa region (ENA).
Accordingly the following disclosures have been revised in these consolidated financials:
– Note 2 Segmental analyses
– Note 9 Intangible assets
– Note 26 Group employees
Adoption of new accounting standards effective 1 January 2018Adoption of IFRS 9In addition, with effect from 1 January 2018, the Group has adopted IFRS 9 Financial Instruments with no restatement of prior periods, as permitted by the Standard.
The cumulative impact of adopting the Standard, including the effect of tax entries, has been recognised as a restatement of opening reserves in 2018, and is £38 million, arising from the impairment of financial assets under the expected loss model. A simplified “lifetime expected loss model” is available for balances arising as a result of revenue recognition, by applying a standard rate of provision on initial recognition of trade debtors based upon the Group’s historical experience of credit loss modified by expectations of the future, and increasing this provision to take account of overdue receivables. Applying the requirements of IFRS 9 has resulted in a decrease of trade and other debtors of £45 million as at 1 January 2018.
IFRS 9 also changes the classification and measurement of financial assets. The category of available-for-sale investments (where fair value changes were deferred in reserves until disposal of the investment) has been replaced with the category of financial assets at Fair Value through Profit and Loss (for most investments) and the category of financial assets at Fair Value through Other Comprehensive Income (for qualifying equity investments), and the available-for-sale reserve at 1 January 2018 has been reclassified into retained earnings. In addition, certain loans and receivables which do not meet the measurement tests for amortised cost classification under IFRS 9 have been reclassified as financial assets at Fair Value through Profit and Loss at the same date. The Group has used the term “investments held at fair value” to refer to all of these financial assets both pre- and post- the adoption of IFRS 9.
233BAT Annual Report and Form 20-F 2018

Financial Statements
Notes on the Accounts continued
31 Accounting policy changes and regional restructure continued31 December 2017 Impact of IFRS 9 01 Jan 2018
Reported£m
Adoption ofIFRS 15
£m Revised
£m
Financial assets reclass
£m
Expected loss impairment
£m
Revised for IFRS 9
£m
Assets Non‑current assets Deferred tax assets 317 16 333 – 7 340Trade and other receivables 756 – 756 (2) – 754Investments held at fair value 42 – 42 2 – 44Other 125,957 – 125,957 – – 125,957Total non‑current assets 127,072 16 127,088 – 7 127,095Current assets Trade and other receivables 4,053 – 4,053 (144) (45) 3,864Investments held at fair value 65 – 65 144 – 209Other 9,848 – 9,848 – – 9,848Total current assets 13,966 – 13,966 – (45) 13,921Total assets 141,038 16 141,054 – (38) 141,016Equity Capital and reserves Share capital 614 – 614 – – 614Share premium, capital redemption and merger reserves 26,602 – 26,602 – – 26,602Other reserves (3,395) 3 (3,392) (9) – (3,401)Retained earnings 36,983 (48) 36,935 9 (38) 36,906Owners of the parent 60,804 (45) 60,759 – (38) 60,721Non-controlling interests 222 – 222 – – 222Total equity 61,026 (45) 60,981 – (38) 60,943Liabilities
Non‑current liabilities Other 64,468 – 64,468 – – 64,468Total non‑current liabilities 64,468 – 64,468 – – 64,468Current liabilities Trade and other payables 8,847 61 8,908 – – 8,908Other 6,697 – 6,697 – – 6,697Total current liabilities 15,544 61 15,605 – – 15,605Total equity and liabilities 141,038 16 141,054 – (38) 141,016
Adoption of new accounting standards effective 1 January 2019Adoption of IFRS 16As set out in note 1, IFRS 16 Leases has mandatory effective date of implementation of 1 January 2019. The distinction between operating leases and finance leases is removed with the effect that virtually all leasing arrangements will be brought on to the balance sheet as financial obligations and ‘right-to-use’ assets.
In adopting IFRS 16, the Group will apply the modified retrospective approach consistently across the Group, with no restatement of prior periods, as permitted by the Standard. On the initial implementation of the Standard, previously recognised operating leases will be capitalised as right-to-use assets and financial liabilities will be recognised at the same initial value. The Group will take advantage of certain practical expedients available under the Standard including:
– “grandfathering” previously recognised lease arrangements;
– applying a single discount rate to a portfolio of leases with reasonably similar characteristics;
– assessing whether a lease is onerous prior to applying the Standard;
– applying hindsight in determining the lease term if the contract contains options to extend or terminate the lease; and
– not applying the capitalisation requirements of the Standard to leases for which the lease term ends within 12 months of the date of initial application.
234 BAT Annual Report and Form 20-F 2018

Governance Other InformationFinancial StatementsStrategic Report
31 Accounting policy changes and regional restructure continuedGoing forward, the Group will also adopt several practical expedients under the Standard including:
– not applying the requirements of IFRS 16 to leases of intangible assets;
– applying the portfolio approach where appropriate to do so;
– not applying the recognition and measurement requirements of IFRS 16 to short-term leases and to leases of low-value assets; and
– not separating non-lease components from lease components (except in the case of property-related leases).
The anticipated impact of the new Standard to the Group’s balance sheet at 1 January 2019, and a reconciliation to reported leasing commitments in note 28, is shown below:
£m
Minimum lease commitments as disclosed in note 28 690Additional commitments on the exercise of options 28Low value leases and short-term leases excluded (24)Discounted to present value (132)To be capitalised as lease liabilities at 1 January 2019 562Prepaid leases reclassified from receivables 3To be capitalised as right‑to‑use assets at 1 January 2019 565
The weighted average incremental borrowing rate applied in discounting lease commitments was 5.76%.
235BAT Annual Report and Form 20-F 2018

Financial Statements
This disclosure is made in accordance with Section 409 of the Companies Act 2006 and The Large and Medium-sized Companies and Groups (Accounts and Reports) Regulations 2008, as amended by The Companies, Partnerships and Groups (Accounts and Reports) Regulations 2015. A full list of subsidiary undertakings, associates and joint ventures and joint operations as defined by IFRS (showing the country of incorporation, effective percentage of equity shares held and full registered office addresses) as at 31 December 2018 is disclosed below.
The subsidiary undertakings that are held directly by British American Tobacco p.l.c. (the ultimate parent company) are indicated thus*; all others are held by sub-holding companies.
Unless otherwise stated, the equity shares held are in the form of ordinary shares or common stock, except for those indicated thus#, which include preference shares. The effective percentage of equity shares held in subsidiary undertakings is 100% unless otherwise stated. Further, where the effective percentage of equity shares held by the sub-holding company is different from that held by British American Tobacco p.l.c., the percentage of equity shares held by British American Tobacco p.l.c. is indicated thus^ and is shown after the percentage interest held by the sub-holding company.
The results of a number of these subsidiary undertakings principally affect the financial statements of the Group. These principal subsidiary undertakings are highlighted in grey and are considered to be the main corporate entities in those countries which, in aggregate, contributed over 76% of the Group revenue and 95% of profit from operations.
Subsidiary UndertakingsAlbaniaRruga e Kavajes, Ish Kombinati Ushqimor, Tirana, AlbaniaBritish American Tobacco – Albania SH.P.K.AlgeriaIndustrial Zone, Cheraga, El Omrane, Ouled Fayet Road, Lot 04 Ilot 789, Algiers, AlgeriaBritish American Tobacco (Algérie) S.P.A. (51%)AngolaViana Park, Polo Industrial, Viana, Luanda, AngolaAgrangol Limitada (77%) British American Tobacco – B.A.T. Angola, Limitada1
Fabrica de Tabacos de Cacuso (51%) SETA, Sarl (98%) Sociedade Geral de Distribuição e Comércio, LimitadaSociedade Industrial Tabacos Angola LDA (76.60%) Sociedade Unificada Tabacos Angola LDA (76.30%) ArgentinaSan Martín 140, Floor 14, City of Buenos Aires, ArgentinaBritish American Tobacco Argentina S.A.I.C.y F. (99.98%)Australia166 William Street, Woolloomooloo, NSW 2011, AustraliaAmerican Cigarette Company (Overseas) Pty. Limited9
British American Tobacco (Australasia Holdings) Pty Limited9
British American Tobacco Australasia Limited9
British American Tobacco Australia Limited9 British American Tobacco Australia Overseas Pty Limited9 British American Tobacco Australia Services Limited9
British American Tobacco Manufacturing Australia Pty Ltd.9
Martins of Piccadilly Pty Ltd9
Rothmans Asia Pacific Limited9 #
The Benson & Hedges Company Pty. Limited9
The Nelson Tobacco Manufacturing Corporation Pty. Ltd9
W.D. & H.O. Wills Holdings Limited9
Wills (Pagewood) Pty Limited9
AustriaDr. Karl Lueger Platz 5, 1010, Wien, AustriaBritish American Tobacco (Austria) GmbH BahrainUnit 1, Building 2126, Road 1734, Block 117, Hidd Town, BahrainBritish American Tobacco Middle East S.P.C.
BangladeshNew DOHS Road, Mohakhali, Dhaka 1206, BangladeshBritish American Tobacco Bangladesh Company Limited (72.91%)BarbadosBraemar Court, Deighton Road, St. Michael, BarbadosB.C.O., Inc Chancery Chambers, Chancery House, High Street, Bridgetown, BarbadosSouthward Insurance Ltd. Belarus7th Floor, 3 Kuprevicha Str., Minsk, 220141, BelarusBritish-American Tobacco Trading Company Foreign Private Trading Unitary EnterpriseBelgiumGlobe House, 4 Temple Place, London, WC2R 2PG, United KingdomBritish American Tobacco Holdings Belgium N.V.Nieuwe Gentsesteenweg 21, 1702 Groot-Bijgaarden, BelgiumBritish American Tobacco Belgium N.V. Tabacofina-Vander Elst N.V. Rue de Koninck 38, 1080 Sint-Jans-Molenbeek, BelgiumBritish American Tobacco Co-ordination Centre/L.P. Co-ordination Centre VOF BeninCotonou, Lot Numbero H19, Quartiers Les Cocotiers, 01 BP 2520, BeninBritish American Tobacco Benin SA BoliviaAv. Costanerita No. 71, esq Calle 6, floor 5, Zona de Obrajes, La Paz, BoliviaBAT Bolivia S.R.L.
Group companies and undertakings
236 BAT Annual Report and Form 20-F 2018

Governance Other InformationStrategic Report Financial Statements
Bosnia and HerzegovinaBlajburških žrtava br. 62, Mostar, Bosnia and HerzegovinaTOBACCO PRESS d.o.o. MostarFra Dominka Mandica 24 A, 88220 Široki Brijeg, Bosnia and HerzegovinaIPRESS d.o.o.Ulica Carice Milice br. 11, 78000 Banja Luka, Bosnia and HerzegovinaBritish American Tobacco – BAT – BL d.o.o. ul. Azize Šacirbegovic 1, 71000 Sarajevo-Novo Sarajevo, Bosnia and HerzegovinaTDR d.o.o. Sarajevoul. Kolodvorska 12, 71000 Sarajevo-Novo Sarajevo, Bosnia and HerzegovinaiNovine BH d.o.o.Opresa d.o.o.ul. Kralja Petra I Karadordevica br. 82, 78000 Banja Luka, Bosnia and HerzegovinaFDBL-B d.o.o. Banja Luka BotswanaPlot 20774 Broadhurst Industrial Estate, Gaborone, BotswanaBritish American Tobacco Botswana (Pty) Limited Business Venture Investments Botswana 6773 (Pty) Ltd.BrazilRua Candelaria 66, Rio de Janeiro, BrazilYolanda Participacoes S.A. Rua Candelaria 66, Salas 101 a 1201, Rio de Janeiro, BrazilSouza Cruz LTDA Brunei Darussalam6th Floor, Bang Hj Ahmad Laksamana Othman, 38-39, Jalan Sultan, Bandar Seri Begawan BS8811, Brunei DarussalamCommercial Marketers and Distributors Sdn. Bhd. (100%) (50%) ^ Bulgaria115 M, Tsarigradsko Shose Blvd., Building D, Floor 5, Sofia, Mladost Municipality, 1784, BulgariaBritish American Tobacco Trading EOOD425, Tsarigradsko Shose Blvd., Warehouse Base 2, Warehouse (205 – 208) – (219 – 222), Pancharevo Municipality, 1000, Sofia, BulgariaExpress Logistics and Distribution EOODBurkina FasoOuagadougou, Avenue Yennega, BP: 882, Ouagadougou, Burkina FasoTobacco Marketing Consultant Burkina Faso SARLBurundiAvenue de L’Uprona a Bujumbura, BP 345, BurundiTabarundi SARLCambodia1121 National Road 2, Prek Tanou Village, Sangkat Chak Ang Re Leu, Khan Mean Chey, Phnom Penh, Kingdom of CambodiaBritish American Tobacco (Cambodia) Limited (71%)British American Tobacco (Cambodge) International Limited CameroonRue Njo Njo, Bonapriso – B.P. 259, Douala, CameroonBritish American Tobacco Cameroun S.A. (99.76%)
Canada30 Pedigree Court, Brampton, Ontario, L6T 5T8, CanadaImperial Tobacco Canada LimitedImperial Tobacco Company Limited3711 St-Antoine West, Montreal, Quebec, H4C 3P6, CanadaAllan Ramsay and Company Limited Cameo Inc.Genstar Corporation2
Imperial Brands Limited Imperial Tobacco Products LimitedImperial Tobacco Services Inc. John Player & Sons Limited Liggett & Myers Tobacco Company of Canada Limited3
Marlboro Canada LimitedMedaillon Inc. 45 O’Connor Street, Suite 1500, Ottawa, Ontario, K1P 1A4, Canada2004969 Ontario Inc.Cayman IslandsChile Trident Trust Company (Cayman) Ltd., One Capital Place, PO Box 847, Grand Cayman KY1-1103, Cayman IslandsR.J. Reynolds Tobacco (CI) Co.ChileIsidora Goyenechea 3000, Piso 19, Las Condes, ChileBAT Chile S.A. (100%) (99.51%) ^ British American Tobacco Chile Operaciones S.A. (99.51%)Inversiones Casablanca S.A.ChinaRoom 436, No. 1000, Zenchen Road, Baoshan District, ShanghaiBritish American (Shanghai) Enterprise Development Co. LtdBritish American Nico Business Consulting (Shanghai) Co. LtdUnit 1001 in 901, 9/F, Building 3, No.8 Guanghuadongli, Chaoyang District Beijing, People’s Republic of ChinaBritish American Consulting (Beijing) Ltd ColombiaAv. Cra. 72 # 80-94 Piso 10. Bogotá, ColombiaBritish American Tobacco Colombia S.A.S. Vype Colombia S.A.S.Congo (Democratic Republic of)149, A&B Boulevard du 30 Juin, Gombe, Kinshasa, Democratic Republic of CongoBAT Services Congo SARLBritish American Tobacco Import SARL1er étage, Immeuble du Centenaire, Gombe, Kinshasa, Democratic Republic of CongoBAT Distribution SARL British American Tobacco Congo SARLCosta Rica325 Metros este del Puente de la Firestone, Llorente, Flores, Heredia, Costa RicaBASS Americas S.A. BATCCA Park Inversiones Immobiliarias, S.A.BATCCA Servicios S.A.
237BAT Annual Report and Form 20-F 2018
Financial Statements
CroatiaDraškoviceva 27, 10000 Zagreb, CroatiaInovine d.d. (93.42%) Ivana Lucica 2/a, 10000 Zagreb, CroatiaBAT HRVATSKA d.o.o. u likvidacijiObala V. Nazora 1, 52210 Rovinj, CroatiaAdista d.o.o.TDR d.o.o.Osjecka 2, 33000 Virovitica, CroatiaHrvatski Duhani d.d. Tobacco Leaf Processing (89.55%) CubaCalle Reyes, No. 6, entre Calzada de Luyanó y Calle Princesa, Municipio 10 de Octubre, Ciudad de La Habana, CubaBrascuba Cigarrillos S.A. (50%)CyprusPhotiades Business Centre, 5th Floor, 8 Stasinou Avenue, Nicosia, CY-1060, CyprusB.A.T (Cyprus) LimitedRothmans (Middle East) LimitedCzech RepublicKarolinská 654/2, Prague 8 – Karlín, 186 00, Czech Republic British American Tobacco (Czech Republic), s.r.o. DenmarkVester Farimagsgade 19, 1606 Copenhagen, DenmarkBritish American Tobacco Denmark A/S (House of Prince A/S) Precis (1789) Denmark A/SX-International ApSDjiboutiRue de Magadiscio, Lot No. 133, Djibouti City, DjiboutiBritish American Tobacco Djibouti SARLEgyptAdministrative unit no.1, 5th Floor, Building S2B, Sector A, Downtown Mall Katameya, 5th settlement, New Cairo, EgyptBETCO for General Services and Marketing LLCBETCO for Trade and Distribution LLCBritish American Tobacco Egypt LLCBritish American Tobacco North Africa LLCEritreaP.O. Box 749, 62 Fel Ket Street, Asmara, EritreaBritish American Tobacco (Eritrea) Share Company #
EstoniaTornimäe 7, 10145 Tallinn, EstoniaBritish American Tobacco Estonia ASEthiopiaBole Road, TK Building 3rd Floor, Addis Ababa, EthiopiaTobacco Marketing ConsultantsFijiLady Maria Road, Nabua, Suva, FijiBritish American Tobacco (Fiji) Marketing Pte LimitedCentral Manufacturing Company Pte LimitedRothmans of Pall Mall (Fiji) Pte Limited
FinlandItamerentori 2, 00180, Helsinki, FinlandBritish American Tobacco Finland OyFrance8 Rue La Boétie, 75008 Paris, FranceCarreras France SASCœur Défense Tour A 100-110 Esplanade de Gaulle 92932 Paris La Défense Cedex, FranceBritish American Tobacco France SAS 23, Rue du Roule, 75001 Paris, FranceNicoventures France S.A.S.GermanyAlsterufer 4, 20354 Hamburg, GermanyBATIG Gesellschaft fur Beteiligungen m.b.H. British American Tobacco (Germany) GmbH British American Tobacco (Hamburg International) GmbHBritish American Tobacco (Industrie) GmbH Schillerstr. 10, 28195 Bremen, GermanyChic Deutschland GmbHSchutterwalder Straße 23, 01458 Ottendorf-Okrilla, GermanyQuantus Beteiligungs – und Beratungsgesellschaft mbHGhanaF190/5 Josiah Tongogari Street, Opposite Tante Marie Restaurant, Labone-Accra, GhanaBritish American Tobacco Ghana Limited (97.09%) Greece27, Ag. Thoma Street, Maroussi, 151 24, GreeceBritish American Tobacco Hellas S.A.GuernseySt. Martin’s House, Le Bordage, St. Peter’s Port, GY1 4AU, GuernseyBelaire Insurance Company LimitedGuyana90 Carmichael Street, South Cummingsburg, Georgetown, GuyanaDemerara Tobacco Company Limited (70.25%) HondurasBoulevard del Sur, Zona El Cacao, San Pedro Sula, Depart. de Cortés, HondurasTabacalera Hondureña S.A. (83.64%) Hong Kong11/F, One Pacific Place, 88 Queensway, Hong KongBritish American Tobacco China Investments LimitedLevel 30, Three Pacific Place, 1 Queen’s Road East, Wanchai, Hong KongBritish American Tobacco Asia-Pacific Region LimitedBritish-American Tobacco Company (Hong Kong) LimitedLEHMAN, LEE & XU CORPORATE SERVICES, Suite 3313, Tower One, Times Square, 1 Matheson Street, Causeway Bay, Hong KongReynolds Asia-Pacific LimitedUnits 2501 and 2506 to 2510, 25/F Island Place Tower, Island Place 510, King’s Road, Hong KongAmerican Cigarette Company LimitedBritish Cigarette Company (1964) LimitedHungaryH-1124, Budapest, Csörsz utca 49-51. 3. em., HungaryBAT Pécsi Dohánygyár Korlátolt Felelosségu Társaság
Group companies and undertakings continued
238 BAT Annual Report and Form 20-F 2018

Governance Other InformationStrategic Report Financial Statements
IndonesiaCapital Place Office Tower 6th Floor, Jl. Gatot Subroto Kav. 18, Jakarta 12710 IndonesiaPT Bentoel Internasional Investama, Tbk (92.48%) ^ Jl. Raya Karanglo, Desa Banjararum, Kecamatan Singosari, Jawa Timur 65153 IndonesiaPT Perusahaan Dagang dan Industri Tresno (100%) (92.48%) ^ PT Bentoel Prima (iv) (100%) (92.48%) ^ Jl. Susanto No. 2B, Ciptomulyo, Sukun, Malang, Jawa Timur 65148 IndonesiaPT Bentoel Distribusi Utama (100%) (92.48%) ^ Iran, Islamic Republic ofNo. 2 Saba Boulevard with Africa Boulevard, Tehran, 19667, Islamic Republic of IranB.A.T. Pars Company (Private Joint Stock) (99%)Unit 09, Level 9, 114, Kaj Abadi Street Valiasr, Tehran, 1966916545, Islamic Republic of IranTDR Parisian CoIraqEnkawa, Erbil, Kurdistan Region of IraqB.A.T. Iraqia Company for Tobacco Trading LimitedIrelandSuite D, 2nd Floor, The Apex Building, Blackthorn Road, Sandyford Industrial Estate, Dublin 18, Republic of IrelandCarroll Group Distributors LimitedP.J. Carroll & Company Limited4
Rothmans of Pall Mall (Ireland) Limited5
Isle of Man2nd Floor, St Mary’s Court, 20 Hill Street, Douglas, IM1 1EU, Isle of ManAbbey Investment Company LimitedThe Raleigh Investment Company LimitedTobacco Manufacturers (India) LimitedItalyVia Amsterdam 147, 00144 Rome, ItalyBritish American Tobacco Italia S.p.A.Ivory CoastCocody Deux-Plateaux Immeuble Woodin, 28 BP 1551 Abidjan 28, Ivory CoastBritish American Tobacco RCI SARLMarcory, Immeuble Plein Ciel Boulevard VGE – 6 BP 1377, Ivory Coast Tobacco Marketing Consultant CDI SARLJamaica13A Ripon Road, Kingston 5, JamaicaCarreras Limited (50.40%)8 Sans Souci Development Limited (100%) (50.40%)8 ^Sans Souci Limited (100%) (50.40%)8 ^JapanMidtown Tower 20F, 9-7-1 Akasaka, Minato-ku, Tokyo, JapanBritish American Tobacco Japan, Ltd. Jersey22 Grenville Street, St Helier, JE4 8PX, JerseyPathway 5 (Jersey) Limited
JordanSalman Quadah Street, Behind Abdoun Mall Opp. Khaled Khreisat Complex, Villa No. (1), Abdoun, Amman, JordanBritish American Tobacco – Jordan Private Shareholding Company Limited11
Kazakhstan240G, Nursultan Nazarbayev avenue, A26F8D4 Almaty, Republic of Kazakhstan British American Tobacco Kazakhstan Trading LLPKenya8 Likoni Road, Industrial Area, P.O. Box 30000-00100, Nairobi, KenyaAfrican Cigarette Company (Overseas) Limited (100%) (60%) ^ BAT Kenya Tobacco Company Limited (100%) (60%) ^ 9 Likoni Road, Industrial Area, P.O. Box 30000-00100, Nairobi, KenyaBritish American Tobacco Area Limited10 Likoni Road, Industrial Area, P.O. Box 30000-00100, Nairobi, KenyaBritish American Tobacco Kenya plc (60%) 11 Likoni Road, Industrial Area P.O. Box 30000-00100, Nairobi, KenyaEast African Tobacco Company (Kenya) Limited (100%) (60%) ^ Korea, Republic ofGangnam Finance Center, 152 Teheran-ro, Gangnam-gu, Seoul, Republic of KoreaBritish American Tobacco Korea Limited141, Gongdan1-ro, Sanam-Myun, Sacheon City, Kyungsangnamdo, Republic of KoreaBritish American Tobacco Korea Manufacturing LimitedKosovo, Republic of Llapllaselle p.n., 10500 Gracanicë, Republic of KosovoBritish American Tobacco Kosovo SH.P.K.LatviaMukusalas iela 101, Riga LV-1004, LatviaBritish American Tobacco Latvia SIALithuaniaJ. Galvydžio g. 11-7, LT-08236 Vilnius LithuaniaUAB British American Tobacco LietuvaLuxembourg1, Rue Jean Piret, 2350 Luxembourg, Grand Duchy of LuxembourgBritish American Tobacco Brands (Switzerland) LimitedMalawiNorthgate Arcade, Highway Chipembere, Blantyre, MalawiBritish American Tobacco (Malawi) LimitedMalaysiaLevel 8, Symphony House, Block D13, Pusat Dagangan Dana 1, Jalan PJU 1A/46, 47301, Petaling Jaya, Selangor Darul Ehsan, MalaysiaBritish American Tobacco GSD (Kuala Lumpur) Sdn BhdLevel 11, Sunway Geo Tower, Jalan Lagoon Selatan, Sunway South Quay, Bandar Sunway, 47500 Subang Jaya, Selangor Darul Ehsan, MalaysiaBAT Aspac Service Centre Sdn BhdLevel 19, Guoco Tower, Damansara City, No. 6 Jalan Damanlela, Bukit Damansara, 50490 Kuala Lumpur, MalaysiaBritish American Tobacco Malaysia Foundation7
British American Tobacco (Malaysia) Berhad (50%)Commercial Marketers and Distributors Sdn. Bhd. (100%) (50%) ^ Rothmans Brands Sdn. Bhd. (100%) (50%) ^ Tobacco Importers and Manufacturers Sdn. Bhd. (100%) (50%) ^
239BAT Annual Report and Form 20-F 2018

Financial Statements
MaliDjelibougou, Immeuble BASSARO, BP 2065, Bamako – MaliBritish American Tobacco (Mali) SarlMaltaPM Building, Level 2, Mriehel Industrial Zone, Bone Street, Mriehel, BKR3000, MaltaBritish American Tobacco (Malta) LimitedCentral Cigarette Company LimitedRothmans of Pall Mall (Malta) LimitedMexicoFrancisco I Madero 2750 Poniente, Colonia Centro, Monterrey, Nuevo León, C.P. 64000, MexicoBritish American Tobacco Mexico Comercial, S.A. de C.V.British American Tobacco Mexico, S.A. de C.V.4
British American Tobacco Servicios S.A. de C.V.Cigarrera La Moderna, S.A. de C.V.Predio Los Sauces Sin número, Colonia Los Sauces, C.P. 63195, Tepic, Nayarit, MexicoProcesadora de Tabacos de Mexico, S.A. de C.V. (93%) Moldova, Republic of65, Stephan cel Mare Str., off. 414-417, Chisinau, MD2001, Republic of MoldovaBritish American Tobacco – Moldova S.R.L.MontenegroRimski Trg 50, Podgorica, Republic of MontenegroTDR d.o.o. PodgoricaMozambique2289 Avenida de Angola, Maputo, MozambiqueBritish American Tobacco Mozambique Limitada (95%) Sociedade Agricola de Tabacos Limitada (95%) Myanmar55/56, Schwe Thanlwin, Industrial Zone, Hlaing Thar Yar Township, Yangon, MyanmarBritish American Tobacco Myanmar Limited (95%)8 British American Tobacco Myanmar Services Limited8
NamibiaShop 48, Second Floor Old Power Station Complex, Armstrong Street, Windhoek, NamibiaBritish American Tobacco Namibia (Pty) Limited
NetherlandsHandelsweg 53 A, 1181 ZA, Amstelveen, NetherlandsAruba Properties B.V.Aruba Properties II B.V.B.A.T Finance B.V.B.A.T. Netherlands Finance B.V.British American Tobacco European Operations Centre B.V.British American Tobacco Exports B.V. British American Tobacco Holdings (Australia) B.V.British American Tobacco Holdings (Malaysia) B.V.British American Tobacco Holdings (South Africa) B.V.British American Tobacco Holdings (The Netherlands) B.V. British American Tobacco Holdings (Venezuela) B.V.British American Tobacco Holdings (Vietnam) B.V.British American Tobacco International (Holdings) B.V.British American Tobacco International Europe (Nederland) B.V.British American Tobacco International Investments B.V.British American Tobacco Manufacturing B.V.British American Tobacco Nederland B.V. British American Tobacco Western Europe Region B.V. Molensteegh Invest B.V.Precis (1789) B.V.Precis (1790) B.V.Rothmans Far East B.V.Rothmans International Holdings B.V.Rothmans International Holdings II B.V.Rothmans Tobacco Investments B.V.Rothmans UK Holdings B.V.Turmac Tobacco Company B.V.Paterswoldseweg 43, 9726 BB Groninge, Netherlands Koninklijke Theodorus Niemeyer B.V.Parktoren, 6th Floor, VanHeuven Goedhartlaan 11a, 1181 LE Amstelveen, Netherlands R.J. Reynolds Tobacco B.V.R.J. Reynolds Tobacco C.V.Reynolds International Holdings B.V.New Zealand2 Watt Street, Parnell, Auckland, 1052, New ZealandBritish American Tobacco (New Zealand) Limited British American Tobacco Holdings (New Zealand) Limited25 Princess Street, Palmerston North, New ZealandNew Zealand (UK Finance) Limited #
NigerC/O Niger Briques SARL, Grand, Marché Niamey BP2401, Niamey-NigerBritish American Tobacco Niger
Group companies and undertakings continued
240 BAT Annual Report and Form 20-F 2018

Governance Other InformationStrategic Report Financial Statements
Nigeria1, Tobacco Road, Oluyole Local Government Area, Ibadan, Oyo State, NigeriaBritish American Tobacco (Nigeria) Limited 2 Olumegbon Road, Ikoyi, Lagos, NigeriaBritish American Tobacco Marketing Nigeria Limited North Macedonia, Republic ofBul. 8-mi Septemvri No. 18, 1000 Skopje, Republic of North MacedoniaTDR Skopje d.o.o.e.l. SkopjeNorwayDronning Eufemias Gate 42, 0191 Oslo, NorwayBritish American Tobacco Norway ASPakistanSerena Business Complex. Khayaban-e-Suhrwardy, Islamabad, PakistanBritish American Tobacco SAA Services (Private) LtdPakistan Tobacco Company Limited (94.65%)Bun Khurma Chichian Road, Mirpur, Azad Kashmir, PakistanPhoenix (Private) Limited (100%) (94.65%) ^ PanamaTorre Banco Panama, Boulevard Costa Del Este y Aveida La Rotonda, Piso 14, Oficina 1400, Costa del Este Ciudad de Panama, PanamaBAT Caribbean, S.A.British American Tobacco Central America S.A. (87.76%) British American Tobacco Panama S.A.Tabacalera Istmeña S.A.Papau New GuineaAshurst PNG, Level 11, MRDC Haus, Port Moresby, National Capital District, Papua New GuineaRothmans of Pall Mall (P.N.G.) LimitedBritish American Tobacco (PNG) LimitedPapua New Guinea Tobacco Co. LtdParadise Tobacco Co. LimitedParaguayAvenida Aviadores del Chaco N° 2050 (World Trade Center, Torre 2, Piso 17), Asunción, ParaguayBritish American Tobacco Productora de Cigarrillos S.A.PeruPasaje Santa Rosa 256, Ate, Lima, PerúBritish American Tobacco del Peru Holdings S.A. (98.55%)6
British American Tobacco del Peru, S.A.C.Philippines31 Tayuman Street, Tondo, Manila, PhilippinesAlhambra Industries Inc. #
PolandAleja Wojska Polskiego 23c, 63-500, Ostrzeszow, PolandCHIC sp.zo.o.CHIC sp.zo.osp.k.Chic Holding sp.zo.oChic Investments sp.zo.o.eSMOKING Liquids sp.zooeSMOKING Liquids sp.zo.o.sp.k.Nicoventures Polska sp. z.o.o.
Krakowiakow 48, 02-255, Warszawa, PolandBritish American Tobacco Polska Trading sp. zo.o. Rubiez 46, 61-612, Poznan, PolandeSMOKING INSITUTE sp.zooUl. Ilzecka 26E, 02-135, Warsaw, PolandNicoventures Poland sp.z.o.o.Ul. Tytoniowa 16, 16-300, Augustow, PolandBritish-American Tobacco Polska S.A. PortugalEdificio Amoreiras Square, Rua Carlos Alberto da Mota Pinto 17, 3e A, 1070-313, Amoreiras, Lisboa, PortugalCOTAPO Empreendimentos Commerciais e Industriais S.A.QatarP O Box 6689, 41 Floor, Tornado Tower, West Bay, Doha, QatarBritish American Tobacco Q LLCRéunion5 Immeuble Cap 2000, Avenue Théodore Drouhet, ZAC Horizon 2000 – 97420 Le Port, La RéunionB.A.T. La Reunion SASRomania319 Splaiul Independentei, Sema Parc ‘City Building’, 1st Floor, 6th Sector, Bucharest, RomaniaBritish American Shared Services (Europe) S.R.L.Ploiesti, 17-19 Laboratorului Street, Prahova County, RomaniaBritish-American Tobacco (Romania) Investment S.R.L.Bucharest Business Park, Building A (3rd floor) and Building B2 (floors 2-4), 1A Bucuresti – Ploiesti (DN1) Road, Sector 1, Bucharest 013681, RomaniaBritish American Tobacco (Romania) Trading SRL Russia197229 Russia, Saint Petersburg, 3rd Konnaya lakhta, 38JSC ‘British American Tobacco-SPb’ #
121614 Russia, Moscow, Krylatskaya st., 17, bld. 2JSC ‘International Tobacco Marketing Services’ RwandaSociete Rwandaise Dássurances, Boulevard de la Revolution P.O Box 650 Kigali, Rwanda British American Tobacco Rwanda LimitedSaint Luciac/o ADCO Incorporated, 10 Manoel Street, Castries, Saint LuciaCarisma Marketing Services LtdSt Lucia Pointe Seraphine, Castries, Saint LuciaRothmans Holdings (Caricom) LimitedSamoaVaitele, Apia, Samoa. P.O.Box 1304.British American Tobacco Company (Samoa) LimitedSenegalAlmadies, Route Hotel Meridien en Face Club Med, Dakar, Senegal BP 3174Tobacco Marketing Consultant TMC S.A.R.L.SerbiaBulevar Milutina Milankovica 1ž, Belgrade, 11070, SerbiaBritish American Tobacco South – East Europe d.o.o.Kralja Stefana Provencanog 209, Vranje, 17500, SerbiaBritish American Tobacco Vranje a.d.
241BAT Annual Report and Form 20-F 2018

Financial Statements
Singapore15 Senoko Loop , Singapore, 758168British American Tobacco Asia Pacific Treasury Private LimitedBritish American Tobacco International Services Pte LtdBritish-American Tobacco (Singapore) Private LimitedBritish-American Tobacco Marketing (Singapore) Private Limited18 Ah Hood Road #12-51, Hiap Hoe Bldg at Zhongshan Park, Singapore, 329983British American Tobacco Sales & Marketing Singapore Pte. Ltd.Shenton Way, #33-00 OUE Downtown, Singapore 068809RHL Investments Pte Limited #
SloveniaBravnicarjeva ulica 13, 1000 Ljubljana, SloveniaBritish American Tobacco d.o.o.Solomon IslandsKukum Highway, Ranadi, Honiara, Honiara, Solomon IslandsSolomon Islands Tobacco Company LimitedSouth AfricaWaterway House South, 3 Dock Road, V&A Waterfront, Cape Town 8000, South AfricaAgrega EEMEA (Pty) LimitedAmalgamated Tobacco Corporation (South Africa) (Pty) LimitedAmerican Cigarette Company (Overseas) Ltd.Benson & Hedges (Pty) LimitedBritish American Shared Services Africa Middle East (Pty) LimitedBritish American Tobacco GSD (South Africa) (Pty) LimitedBritish American Tobacco Holdings South Africa (Pty) Limited #
British American Tobacco Manufacturers South Africa (Pty) Ltd.British American Tobacco Properties South Africa (Pty) Ltd.British American Tobacco Services South Africa (Pty) LimitedBritish American Tobacco South Africa (Pty) LimitedBritish American Tobacco Southern Africa Markets (Pty) LimitedBrown & Williamson Tobacco Corporation (Pty) LimitedBusiness Venture Investments No 216 (Pty) LimitedCarlton Cigarette Company (Pty) LimitedGauloises (Pty) LimitedIntercontinental Tobacco Company (Pty) Ltd.John Chapman (Pty) LimitedJohn Player & Sons (Pty) LimitedKentucky Tobacco Corporation (Pty) LimitedMartins of London (Pty) LimitedRembrandt Tobacco Corporation (Overseas) LtdRiggio Tobacco Corporation of New York LtdRothmans of Pall Mall London LimitedSt. Regis Tobacco Corporation LtdStellenbosch Development Company (Pty) LimitedThomas Bear’s Son & Co (Pty) LimitedTobacco Research and Development Institute (Pty) LimitedW.D. & H.O. Wills (Pty) LimitedWestminster Tobacco Company (Cape Town & London) (Pty) LimitedWinfield Tobacco Corporation (Pty) LimitedWinston Tobacco Company Limited
SpainTorreo Espacio, Paseo de la Castellana, 259D, 28046 Madrid, SpainBritish American Tobacco España, S.A. Sri Lanka178 Srimath Ramanathan Mawatha, Colombo, 15, Sri LankaCeylon Tobacco Company Plc (84.13%) SudanByblos Tower, Al-Muk Nemer Street, Postal Code 11111, P.O Box 1381, Khartoum, SudanBlue Nile Cigarette Company LimitedSwazilandRhus Office Park, Kal Grant Street, P.O. Box 569, Mbabane, SwazilandBritish American Tobacco Swaziland (Pty) LimitedSwedenStre Järnvägsgatan 13, 4 fl. SE-252 24 Helsingborg, SwedenNiconovum ABVästra Trädgårdsgatan 15, 111 53 Stockholm, SwedenBritish American Tobacco Sweden ABBritish American Tobacco Sweden Holding ABSweden Stationsvägen 11, 523 74 Hökerum, SwedenWinds Global ABWinnington AB Winnington Holding ABStenåldersgatan 23, 213 76 Malmö, SwedenFiedler & Lundgren ABSwitzerlandRoute de France 17, 2926 Boncourt, SwitzerlandAD Tabacs International S.A.American-Cigarette Company (Overseas) LimitedBritish American Tobacco Switzerland S.A. British American Tobacco Switzerland Vending SARothmans of Pall Mall LimitedRoute de la Glâne 107, c/o NBA Fiduciaire S.A. 1752 Villars-sur-Glâne, SwitzerlandIntertab S.A. (50%) c/o Seepark AG, Gartenstrasse 4, 6300 Zug, SwitzerlandBritish American Tobacco International Limited in Liquidation TanzaniaAcacia Estate Building, Kinondoni Rd, P.O. Box 72484, Dar es Salaam, TanzaniaBritish American Tobacco (Tanzania) LimitedInternational Cigarette Distributors Limited (99%) Zanzibar Distribution Company Limited (99%) c/o IMMMA Advocates, Plot No.357, UN Road, Upanga, P.O Box 72484, Dar es Salaam, TanzaniaBAT Distribution Tanzania LimitedTrinidad and TobagoCorner Eastern Main Road and Mt. D’or Road, Champs Fleurs, Trinidad and TobagoThe West Indian Tobacco Company Limited (50.13%)TurkeyOrjin Maslak is Merkezi, Eski Büyükdere Caddesi, Kat: 9-10, Maslak, Sanyer, istanbul, Türkiye – PK: 34485British American Tobacco Tütün Mamulleri Sanayi ve Ticaret Anonim Sirketi
Group companies and undertakings continued
242 BAT Annual Report and Form 20-F 2018

Governance Other InformationStrategic Report Financial Statements
Uganda7th Floor TWED Towers, Plot 10, Kafu Road, Nakasero, P.O. Box 7100, Kampala, UgandaBritish American Tobacco Uganda Limited (90%) Ukraine13-15 Bolsunovska Str, Kyiv, 01014 UkraineLLC ‘British American Tobacco Sales and Marketing Ukraine’ 21 Nezalezhnosti Str, Pryluky, Chernihiv Region, 17502 UkrianePJSC ‘A/T B.A.T. – Prilucky Tobacco Company’United Arab EmiratesJumeriah Business Centre 3, 37th Floor, Jumeirah Lake Towers, Dubai, P.O. Box 337222, United Arab EmiratesBritish American Tobacco GCC DMCCBritish American Tobacco ME DMCCUnited Kingdom212-218 Upper Newtownards Road, Belfast, BT4 3ET, Northern IrelandMurray, Sons & Company, Limited7 More London, Riverside, London, SE1 2RT, United KingdomRyesekks P.L.C. (50%)Globe House, 1 Water Street, London, WC2R 3LA, United KingdomAdvanced Technologies (Cambridge) LimitedAllen & Ginter (UK) LimitedB.A.T (U.K. and Export) Limited B.A.T Cambodia (Investments) LimitedB.A.T Far East Development LimitedB.A.T Far East Holding LimitedB.A.T Far East Leaf LimitedB.A.T Guangdong LimitedB.A.T Guizhou LimitedB.A.T. Portugal LimitedB.A.T Services Limited B.A.T Uzbekistan (Investments) LimitedB.A.T Vietnam LimitedB.A.T. (Westminster House) LimitedB.A.T. China LimitedBAT Finance COP LimitedBATIF Dollar LimitedBATUS LimitedBig Ben Tobacco Company LimitedBritish American Shared Services (GSD) LimitedBritish American Shared Services LimitedBritish American Tobacco (AIT) Limited
British American Tobacco (GLP) Limited British American Tobacco (Investments) Limited British American Tobacco (Philippines) Limited British American Tobacco (Serbia) LimitedBritish American Tobacco (South America) LimitedBritish American Tobacco China Holdings LimitedBritish American Tobacco Georgia LimitedBritish American Tobacco Global Travel Retail Limited British American Tobacco International Holdings (UK) LimitedBritish American Tobacco Investments (Central & Eastern Europe) LimitedBritish American Tobacco Italy Investments LimitedBritish American Tobacco Italy LimitedBritish American Tobacco Korea (Investments) LimitedBritish American Tobacco Malaysia (Investments) LimitedBritish American Tobacco Peru Holdings LimitedBritish American Tobacco UK Pension Fund Trustee Limited (x)
British American Tobacco Western Europe Commercial Trading Limited British-American Tobacco (Mauritius) p.l.c.Carreras Rothmans Limited #
Chelwood Trading & Investment Company LimitedEast African Tobacco Company (U.K.) LimitedLord Extra LimitedMyddleton Investment Company LimitedNicovations LimitedNicoventures Holdings LimitedNicoventures Retail (UK) LimitedNicoventures Trading LimitedPowhattan LimitedPrecis (2396) LimitedRidirectors LimitedRothmans Exports LimitedRothmans International LimitedRothmans International Tobacco (UK) LimitedRothmans International Services LimitedRothmans of Pall Mall (Overseas) LimitedRothmans Trading LimitedRyservs (1995) LimitedRyservs (No.3) LimitedTobacco Exporters International LimitedTobacco Marketing Consultants LimitedVenezuela Property Company LimitedWestanley Trading & Investment Company LimitedWestminster Tobacco Company LimitedGlobe House, 2 Milford Lane, London, WC2R 3LN, United KingdomWorld Investment Company Limited
243BAT Annual Report and Form 20-F 2018

Financial Statements
Globe House, 4 Temple Place, London, WC2R 2PG, United KingdomAmalgamated Tobacco Company LimitedAmerican Cigarette Company (Overseas) LimitedArdath Tobacco Company LimitedB.A.T Additional Retirement Benefit Scheme Trustee LimitedB.A.T Industries p.l.c.B.A.T. International Finance p.l.c.* BATLaw LimitedBATMark Limited * Benson & Hedges (Overseas) LimitedBritish American Global Shared Services LimitedBritish American Tobacco (1998) Limited *British American Tobacco (2009) LimitedBritish American Tobacco (2009 PCA) LimitedBritish American Tobacco (2012) LimitedBritish American Tobacco (Brands) Limited British American Tobacco (Corby) LimitedBritish American Tobacco (NGP) LimitedBritish American Tobacco Taiwan Logistics LimitedBritish American Ventures LimitedBritish-American Tobacco (Holdings) Limited Brown & Williamson Tobacco Corporation (Export) LimitedCarreras LimitedCG Ventures LimitedCourtleigh of London LimitedDunhill Tobacco of London LimitedJohn Sinclair LimitedLouisville Securities LimitedMoorgate Tobacco Co. LimitedPeter Jackson (Overseas) LimitedPrecis (1789) LimitedPrecis (1790) LimitedPrecis (1814) LimitedRothmans International Enterprises LimitedRothmans of Pall Mall LimitedSenior Service (Overseas) LimitedSouth Western Nominees LimitedThe London Tobacco Company LimitedTobacco Insurance Company LimitedWeston (2009) LimitedWeston Investment Company LimitedOne, Eton Street, Richmond Upon Thames, London, TW9 1EF, United KingdomBritish American Tobacco UK LimitedTen Motives Limited10 Motives Limited
United States2710 Gateway Oaks Drive, Suite 150N, Sacramento CA 95833, United StatesGenstar Pacific Corporation251 Little Falls Drive, Wilmington, DE 19808, United StatesB.A.T Capital Corporation BATUS Holdings Inc.BATUS Japan, INC.BATUS Retail Services, Inc.British American Tobacco (Brands) Inc. Brown & Williamson Holdings, Inc.BTI 2014 LLCImasco Holdings Group, Inc.Imasco Holdings, Inc.ITL (USA) LimitedLouisville Corporate Services, Inc.Nicoventures U.S. LimitedFarmers Bank Building, Suite 1402, 301 N. Market Street, Wilmington, DE 19801, United StatesReynolds Finance Company 3700 Airpark Drive, Owensboro, KY 42301, United StatesKentucky BioProcessing, Inc.401 N. Main Street, Winston-Salem, NC 27101, United StatesCF Vapor Company, LLCConwood Holdings, Inc.EXP Homes, LLCLOEC, Inc.Lorillard Holdings Company, Inc.Lorillard Licensing Company LLCLorillard Q-Tech, Inc.Lorillard Technologies, Inc.Lorillard, LLCNiconovum USA, IncNorthern Brands International, Inc.One Park Media Services, Inc.R.J. Reynolds Global Products, Inc.R.J. Reynolds Tobacco CompanyR.J. Reynolds Tobacco International, IncR.J. Reynolds Vapor CompanyR.J. Reynolds Tobacco Co.R.J. Reynolds Tobacco Holdings, Inc.RAI Innovations CompanyRAI International, Inc.RAI Services CompanyRAI Strategic Holdings, Inc.RAI Trade Marketing Services CompanyReynolds American Inc. Reynolds Brands Inc.Reynolds Technologies, Inc.RJR Realty Relocation Services, Inc.RJR Vapor Co., LLCRosswil LLCS.F. Imports, Inc.Spot You More, Inc.
Group companies and undertakings continued
244 BAT Annual Report and Form 20-F 2018

Governance Other InformationStrategic Report Financial Statements
3220 Knotts Grove Road, Oxford, NC 27565, United StatesSanta Fe Natural Tobacco Company, Inc5106, Tradeport Dr., Memphis, TN 38141, United StatesAmerican Snuff Company, LLCUruguayJuncal 1392, Montevideo, UruguayKellian S.A.Uzbekistan77 Minor Passage, Tashkent, 100084, UzbekistanJSC JV UZBAT A.O. (97.38%) VenezuelaRegistro Mecantil Primero de la Circunscripción, Judical des Distrito, Capital y Estado, Miranda, VenezuelaAgrega de Venezuela, Agreven, C.A. (50%) Avenida Francisco de Miranda, Edificio Bigott, Los Ruices, Caracas – Estado Miranda, 1010, VenezuelaAgrobigott, C.A.Compania Anonima Cigarrera Bigott Sucesores Distribuidora Bigott, C.A.Avenida Francisco de Miranda, Torre Chacao 19.02, Municipio Chacao, Estado, Miranda, Caracas, VenezuelaProyectos de Inversion BAT 1902 C.A.Vietnam20/F Mplaza Saigon, 39 Le Duan Street, Ben Nghe Ward, District 1, Ho Chi Minh City, VietnamBritish American Tobacco East Asia Area Services Company LimitedArea 8, Long Binh Ward, Bien Hoa City, Dong Nai Province, VietnamBritish American Tobacco – Vintaba (JV) Limited (70%)Lot 45C/I, Road #7, Vinh Loc Industrial Park, Binh Chanh District, Ho Chi Minh City, VietnamVINA-BAT Joint Venture Company (49%) Zambia20992 Kafue Road, P O Box 30622, Lusaka, ZambiaBritish American Tobacco (Zambia) plc (78%) ZimbabweManchester Road 1, Southerton, Harare, ZimbabweAmerican-Cigarette Company (Overseas) (Private) LtdBritish American Tobacco Zimbabwe (Holdings) Limited (43.13%)Rothmans Limited
Associated undertakings and joint venturesCroatiaSlavonska avenija 11a, 10000 Zagreb, CroatiaTisak d.d. (41.86%)
HungaryH-6800 Hódmezóvásárhely, Erzsébeti út 5/b, HungaryOrszágos Dohányboltellátó Korlátolt Felelosségu Társaság (49%) IndiaVirginia House, 37, J.L. Nehru Road, Kolkata, 700 071, IndiaITC Limited (29.56%)8 Azamabad, Andhra Pradesh, Hyderabad, 500 020, IndiaVST Industries Limited (32.16%)8
NepalShree Bal Sadan, Gha 2-513, Kantipath, Kathmandu, NepalSurya Nepal Pvt. Limited (61%) (19.44%)10 ^SerbiaTemerinska 102, Novi Sad, 21000, SerbiaVeletabak d.o.o. (25%) Uganda69/71 Jinja Road, P.O Box 7100, Kampala, UgandaUganda Tobacco Processors Limited (50%) YemenP.O. Box 14, Sanna, YemenKamaran Industry and Investment Company (31%) P.O. Box 5302, Hoban, Taiz, YemenUnited Industries Company Limited (32%)
Joint operationsHong Kong29/F, Oxford House, 979 King’s Road, Taikoo Place, Quarry Bay, Hong KongCTBAT International Co. Limited (50%)
Notes:1. Ownership held in the class of USD 100 (100%) (76.30%)^ and USD 49,900 (100%).
2. Ownership held in the class of Series F and 2nd Preferred shares.
3. Ownership held in the class of A shares (50%) and class of B shares (100%).
4. Ownership held in class of A shares and B shares.
5. Ownership held solely in class of preference shares.
6. Ownership held in class of Investment stock (98.98%) and Ordinary shares (98.35%).
7. Company limited by guarantee.
8. 31 March year-end.
9. 30 June year-end.
10. 15 July year-end.
11. 30 November year-end.
245BAT Annual Report and Form 20-F 2018

Financial Statements
Balance Sheet@
British American Tobacco p.l.c. – at 31 December
Note2018
£m2017
£m
AssetsFixed assetsInvestments in Group undertakings 2 27,901 27,898
Current assetsDebtors 3 8,276 8,456 Cash at bank and in hand 6 5 Total current assets 8,282 8,461 Total assets 36,183 36,359
EquityCapital and reservesCalled up share capital 614 614 Share premium account 92 88 Capital redemption reserve 101 101 Merger reserves 23,116 23,116 Other reserves 90 90 Profit and loss account 5,919 6,163 after deducting cost of treasury shares (5,227) (5,174)
Total shareholders’ funds 4 29,932 30,172
LiabilitiesCreditors 5 6,249 6,187 Derivative financial instruments 2 – Total liabilities 6,251 6,187 Total Equity and liabilities 36,183 36,359
The accompanying Notes on the Accounts are an integral part of the Parent Company financial statements.
On behalf of the Board
Richard BurrowsChairman
27 February 2019
@ denotes section, including accompanying text and tables, that does not form part of BAT’s Annual Report on Form 20-F as filed with the SEC.
246 BAT Annual Report and Form 20-F 2018

Governance Other InformationFinancial StatementsStrategic Report
Statement of Changes in Equity@
Called up share capital
£m
Share premium account
£m
Merger Reserve
£m
Capital redemption
reserves£m
Other Reserves
£m
Profit and loss account
£mTotal Equity
£m
1 January 2018 614 88 23,116 101 90 6,163 30,172Accounting policy change – – – – – (42) (42)1 January 2018 (revised) 614 88 23,116 101 90 6,121 30,130Increase in share capital – share options – 4 – – – – 4Profit for the financial year – – – – – 4,314 4,314Dividends – declared on equity shares – – – – – (4,463) (4,463)Consideration paid for purchase of own shares held in Employee Share Ownership Trusts – – – – – (125) (125)Other movements – – – – – 72 7231 December 2018 614 92 23,116 101 90 5,919 29,932
Called up share capital
£m
Share premium account
£m
Merger Reserve
£m
Capital redemption
reserves£m
Other Reserves
£m
Profit and loss account
£mTotal Equity
£m
1 January 2017 507 82 – 101 90 7,105 7,885Increase in share capital – RAI acquisition 107 – 23,116 – – – 23,223Increase in share capital – share options – 6 – – – – 6Profit for the financial year – – – – – 3,661 3,661Dividends – declared on equity shares – – – – – (4,465) (4,465)Consideration paid for purchase of own shares held in Employee Share Ownership Trusts – – – – – (200) (200)Other movements – – – – – 62 6231 December 2017 614 88 23,116 101 90 6,163 30,172
There was no difference between profit and loss for the period and total comprehensive income for the period.
British American Tobacco p.l.c. – for the year ended 31 December
@ denotes section, including accompanying text and tables, that does not form part of BAT’s Annual Report on Form 20-F as filed with the SEC.
247BAT Annual Report and Form 20-F 2018

Financial Statements
Notes on the Accounts@
1 Accounting policiesBasis of accountingThe financial statements of the Company have been prepared in accordance with Financial Reporting Standard 101 ‘Reduced Disclosure Framework’ (’FRS 101’).
In preparing these financial statements, the Company applies the recognition, measurement and disclosure requirements of International Financial Reporting Standards as adopted by the EU (’IFRS’), but makes amendments where necessary in order to comply with Companies Act 2006 and where advantage of certain disclosure exemptions available under FRS 101 have been taken, including those relating to:
– a cash flow statement and related notes;
– comparative period reconciliations;
– disclosures in respect of transactions with wholly-owned subsidiaries;
– disclosures in respect of capital management;
– the effects of new but not yet effective IFRSs; and
– disclosures in respect of the compensation of key management personnel.
As the consolidated financial statements of the Group include equivalent disclosures, the Company has also taken the exemptions under FRS 101 available in respect of disclosures under IFRS 2 related to group settled share-based payments.
With effect from 1 January 2018, the Company has adopted IFRS 9 ‘Financial Instruments’. The cumulative impact of adopting IFRS 9, including the effect of tax entries, has been recognised as a restatement of opening reserves in 2018, and is £42 million arising from the impairment of financial assets under the expected loss model.
The preparation of the financial statements requires the Directors to make estimates and assumptions that affect the reported amounts of revenues, expenses, assets and liabilities, and the disclosure of contingent liabilities at the date of the financial statements. The key estimates and assumptions are set out in the accounting policies below, together with the related Notes on the Accounts.
As permitted by Section 408 of the Companies Act 2006, the profit and loss of the Company has not been presented in these financial statements.
The Company is a public limited company which is listed on the London Stock Exchange and the Johannesburg Stock Exchange and is incorporated and domiciled in the UK. In addition, the Company’s shares are traded on the New York Stock Exchange in the form of American Depository Shares (ADSs).
Foreign currenciesThe functional currency of the Company is sterling. Transactions arising in currencies other than sterling are translated at the rate of exchange ruling on the date of the transaction. Assets and liabilities expressed in currencies other than sterling are translated at rates of exchange ruling at the end of the financial year. All exchange differences are taken to the profit and loss account in the year.
RevenueRevenue and other income are included in the profit and loss account when all contractual or other applicable conditions for recognition have been met. From 1 January 2018, as permitted by IFRS 9, a provisions matrix for lifetime expected losses is used for receivables balances arising from the recognition of revenue. Prior to this, allowances were made for bad and doubtful debts, as appropriate.
TaxationTaxation is that chargeable on the profits for the period, together with deferred taxation. Income tax charges, where applicable, are calculated on the basis of tax laws enacted or substantively enacted at the balance sheet date. A deferred tax asset is recognised only to the extent that it is probable that future taxable profits will be available against which the asset can be utilised.
Deferred tax is determined using the tax rates that have been enacted or substantively enacted by the balance sheet date and are expected to apply when the related deferred tax asset is realised or deferred tax liability is settled. As required under IAS 12 ‘Income Taxes’ deferred tax assets and liabilities are not discounted.
Investments in Group companiesInvestments in Group companies are stated at cost, together with subsequent capital contributions, less provisions for any impairment in value, where appropriate.
DividendsDividend distributions to the Company’s shareholders are recognised as a liability in the financial statements in the period in which the dividends are approved by the Company’s shareholders (final dividends) or confirmed by the Directors (interim dividends). With effect from 1 January 2018, the Company has moved to four interim quarterly dividend payments.
Dividend income is recognised at the same time as the paying company recognises the liability to pay a dividend.
Repurchase of share capitalWhen share capital is repurchased, the amount of consideration paid, including directly attributable costs, is recognised as a deduction from equity. Repurchased shares which are not cancelled, or shares purchased for the employee share ownership trusts, are classified as treasury shares and presented as a deduction from total equity.
Related partiesThe Company has taken advantage of the exemption under FRS 101 from disclosing transactions with related parties that are wholly-owned subsidiaries of British American Tobacco p.l.c. Group.
Financial instrumentsFinancial assets and financial liabilities are recognised when the Company becomes a party to the contractual provisions of the relevant instrument and derecognised when it ceases to be a party to such provisions. Such assets and liabilities are classified as current if they are expected to be realised or settled within 12 months after the balance sheet date. If not, they are classified as non-current.
Financial instruments are initially recognised at fair value.
The Company’s financial assets are held in order to collect contractual cash flows and are subsequently carried at amortised cost.
Non-derivative financial liabilities, including creditors, are subsequently carried at amortised cost using the effective interest method.
Financial guarantees are initially recorded at fair value, and subsequently carried at this fair value less accumulated amortisation.
Derivative financial assets and liabilities are initially recognised, and subsequently measured, at fair value, which includes accrued interest receivable and payable where relevant. Changes in their fair values are recognised in profit and loss.
@ denotes section, including accompanying text and tables, that does not form part of BAT’s Annual Report on Form 20-F as filed with the SEC.
248 BAT Annual Report and Form 20-F 2018

Governance Other InformationFinancial StatementsStrategic Report
2 Investments in Group companiesThe Company’s directly-owned subsidiaries are British American Tobacco (1998) Limited, B.A.T. International Finance p.l.c. and BATMark Limited. A full list of indirect subsidiaries and other undertakings as required by Section 409 of the Companies Act 2006 is shown on pages 199 to 208 of the Group’s financial statements.
On 17 January 2017, the Company announced that it had agreed the terms of a recommended offer with Reynolds American Inc. (’RAI’) for British American Tobacco p.l.c. to acquire the remaining 57.8% of RAI it did not already own. The proposed merger was accepted by both parties’ shareholders on 19 July 2017.
Pursuant to the Merger Agreement,the Company, on behalf of its indirect subsidiary BATUS Holdings Inc (’BATUS’), agreed to issue new shares, represented by American Depositary Shares, for the benefit of RAI shareholders. In consideration for the Company issuing new shares, BATUS agreed to issue to the Company an assignable obligation owed by BATUS to issue shares to the holder of that obligation. This assignable obligation was transferred down the chain of Group companies from the Company to BATUS, in exchange for the issue of shares by each subsidiary company to its direct parent.
As a consequence, on 25 July 2017, the Company transferred the assignable warrant to its direct subsidiary British American Tobacco (1998) Limited in exchange for 2,915 new shares with a nominal value of £2,915 and a total value of £23,223,433,253.
Other movements in investments are related to parental guarantees issued by the Company.
The Directors are of the opinion that the individual investments in the subsidiary undertakings have a value not less than the amount at which they are shown in the Balance Sheet.
Shareholdings at cost less provisions and other fixed asset investments
2018£m
2017£m
1 January 27,898 4,446 Additions 3 23,452 31 December 27,901 27,898
@ denotes section, including accompanying text and tables, that does not form part of BAT’s Annual Report on Form 20-F as filed with the SEC.
Impairment of financial assets With effect from 1 January 2018, loss allowances for expected credit losses on financial assets which are held at amortised cost are recognised on the initial recognition of the underlying asset. Allowances in respect of loans and other receivables (debtors) are initially recognised at an amount equal to 12-month expected credit losses. Where the credit risk on the receivables has increased significantly since initial recognition, allowances are measured at an amount equal to the lifetime expected credit loss. Prior to 1 January 2018, financial assets were reviewed for impairment at each balance sheet date, or whenever events indicated that the carrying amount might not be recoverable.
Share‑based paymentsThe Company has equity-settled share-based compensation plans.
Equity-settled share-based payments are measured at fair value at the date of grant. The fair value determined at the grant date of the equity-settled share-based payments is expensed over the vesting period, based on the Group’s estimate of awards that will eventually vest. For plans where vesting conditions are based on total shareholder returns, the fair value at date of grant reflects these conditions, whereas earnings per share vesting conditions are reflected in the calculation of awards that will eventually vest over the vesting period.
Fair value is measured by the use of the Black-Scholes option pricing model, except where vesting is dependent on market conditions when the Monte-Carlo option pricing model is used. The expected life used in the models has been adjusted, based on management’s best estimate, for the effects of non-transferability, exercise restrictions and behavioural considerations.
249BAT Annual Report and Form 20-F 2018

Financial Statements
3 Debtors 2018
£m 2017
£m
Amounts due from Group undertakings 8,276 8,456
Current 7,431 7,471 Non-current 882 985 Allowance account (37) –31 December 8,276 8,456
2018£m
2017£m
Allowance account1 January 42 –Released during the year (5) –31 December 37 –
Current 7 – Non-current 30 –31 December 37 –
Included within amounts due from Group undertakings is an amount of £7,278 million (2017: £7,306 million) which is unsecured, interest bearing and repayable on demand. The interest rate is based on LIBOR.
Amounts due from Group undertakings include £1,031 million (2017: £1,145 million) representing the value of the fees receivable from the parental guarantees issued by the Company, of which £150 million (2017: £160 million) is due within one year and £882 million (2017: £985 million) is due after more than one year. In addition, amounts due from Group undertakings include balances of £4 million (2017: £5 million) which are unsecured, interest free and repayable on demand.
The adoption of IFRS 9 resulted in the recognition of an expected credit loss allowance of £42 million as at 1 January 2018.
@ denotes section, including accompanying text and tables, that does not form part of BAT’s Annual Report on Form 20-F as filed with the SEC.
Notes on the Accounts@ continued
250 BAT Annual Report and Form 20-F 2018

Governance Other InformationFinancial StatementsStrategic Report
4 Shareholders’ fundsThe accounting policy change is in respect of the recognition of IFRS 9 adoption as at 1 January 2018. The effect of this adoption was a charge to profit and loss reserve of £42 million.
Dividend distributions to the Company’s shareholders are recognised as a liability in the financial statements in the period in which the dividends are approved by the Company’s shareholders (final dividends) or declared (interim dividends). With effect from 1 January 2018, the Company will move to four interim quarterly dividend payments.
As permitted by Section 408 of the Companies Act 2006, the profit and loss of the Company has not been presented in these Financial Statements. The profit for the year ended 31 December 2018 was £4,314 million (2017: £3,661 million).
Details of the Director’s remuneration, share options and retirement benefits are given in the Remuneration Report in the Group Annual Report and Accounts. Details of key management compensation are included in note 27 of the Group financial statements. The Company had two employees at 31 December 2018 (2017: two). These two employees are Nicandro Durante and Ben Stevens. The details of their remuneration are shown on page 91 Group’s Annual Report and Accounts for the year ended 31 December 2018. The costs of these employees are borne by another Group company.
Shareholders’ funds are stated after deducting the cost of treasury shares which include £4,845 million (2017: £4,845 million) for shares repurchased and not cancelled and £382 million (2017: £329 million) in respect of the cost of own shares held in Employee Share Ownership Trusts.
As at 31 December 2018 treasury shares include 7,312,975 (2017: 6,750,597) of shares held in trust and 162,645,590 (2017: 162,645,590) of shares repurchased and not cancelled as part of the company’s share buy-back programme.
Other movements in shareholders’ funds principally relate to the release of treasury shares as a result of the exercise of share options.
Called up Share CapitalOrdinary Shares of 25p each
Number of shares £m
Allotted and fully paid 1 January 2018 2,456,278,414 614.06 Changes during the year– share option schemes 137,470 0.0331 December 2018 2,456,415,884 614.09
Called up Share CapitalOrdinary Shares of 25p each
Number of shares £m
Allotted and fully paid 1 January 2017 2,027,019,508 506.75Changes during the year– issue of shares–RAI acquisition 429,045,762 107.26– share option schemes 213,144 0.0531 December 2017 2,456,278,414 614.06
Called up Share Capital and merger reserveOn 17 January 2017, the Company announced that it had agreed the terms of a recommended offer with Reynolds American Inc. (’RAI’) for British American Tobacco p.l.c. to acquire the remaining 57.8% of RAI it did not already own. The proposed merger was accepted by both parties’ shareholders on 19 July 2017.
Pursuant to the Merger Agreement, the Company, on behalf of its indirect subsidiary BATUS Holdings Inc (’BATUS’), agreed to issue new shares, represented by American Depositary Shares, for the benefit of RAI shareholders. In consideration for the Company issuing new shares, BATUS agreed to issue to the Company an assignable obligation owed by BATUS to issue shares to the holder of that obligation.
As a consequence, on 25 July 2017, the Company issued 429,030,727 new shares with a nominal value of £107,257,682, and, on the same day the Company transferred the assignable warrant to its direct subsidiary British American Tobacco (1998) Limited in exchange for 2,915 new shares with a nominal value of £2,915 and a total value of £23,223,433,253. Subsequently, on 18 September 2017, the Company issued an additional number of 15,035 new shares with a nominal value of £3,759.
In accordance with S612 of the Companies Act 2006, the excess of the fair value of the shares issued over the nominal value of the shares has been treated as a merger reserve.
Share premiumThe share premium increase of £4 million (2017: £6 million) relates solely to ordinary shares issued under the Company’s share option schemes. These schemes are described in the Remuneration Report.
@ denotes section, including accompanying text and tables, that does not form part of BAT’s Annual Report on Form 20-F as filed with the SEC.
251BAT Annual Report and Form 20-F 2018

Financial Statements
5 Creditors2018
£m2017
£m
Amounts due to Group undertakings 124 109 Loans due to Group undertakings 3,617 3,617 Ordinary dividends payable 1,116 1,000 Other creditors 1,384 1,453 Deferred income 8 8
6,249 6,187
Current 3,453 3,317 Non-current 2,796 2,870
6,249 6,187
Amounts due to Group undertaking of £124 million (2017: £109 million) are unsecured, interest free and repayable on demand.
Loans due to Group undertakings of £3,617 million (2017: £3,617 million) are unsecured, bear interest at rates between 0.9% and 2.28% (2017: 1.19% and 1.85%). An amount of £2,046 million is repayable in 2019, and the remaining amount of £1,571 million is repayable in 2022.
Included in other creditors is a provision of £1,360 million (2017: £1,432 million) in respect of subsidiary undertaking borrowings guaranteed by the Company. Out of this amount, a total of £142 million (2017: £141 million) represents amounts to be settled within one year.
Ordinary dividends payable of £1,116 million (2017: £1,000 million) represent interim dividends declared by the Company in December 2018 and due for payment in February 2019.
6 Audit Fees2018 2017
Fees payable to KPMG– Audit fees £30,000 £30,000 – Fees paid for other services £nil £nil
The audit fees are borne by another Group Company.
7 Contingent LiabilitiesBritish American Tobacco p.l.c. has guaranteed borrowings by subsidiary undertakings of £45.1 billion (2017: £46.9 billion) and total borrowing facilities of £51.9 billion (2017: £51.1 billion).
There are contingent liabilities in respect of litigation in various countries (note 28 to the Group financial statements). In addition, the Company has cross-guaranteed the liabilities of the British American Tobacco UK Pension Fund which had a deficit according to the last formal triennial valuation in March 2017 of £23 million and which had a surplus on an IAS 19 basis at 31 December 2018 of £1,063 million (2017: £995 million).
Notes on the Accounts@ continued
@ denotes section, including accompanying text and tables, that does not form part of BAT’s Annual Report on Form 20-F as filed with the SEC.
252 BAT Annual Report and Form 20-F 2018