Embed Size (px)
Citation preview

Strategic Report andIFRS Financial Statements
Year Ended November 30, 2014
The Annual Report of Carnival plc comprises the Strategic Report and Carnival plc consolidated andcompany IFRS Financial Statements contained herein, together with certain parts of the Proxy Statement(including its Annexes), dated February 20, 2015.
The Carnival plc consolidated IFRS Financial Statements, which are required to satisfy reportingrequirements of the Companies Act 2006, incorporate the results of Carnival plc and its subsidiaries and,accordingly, do not include the IFRS consolidated results and financial position of Carnival Corporationand its subsidiaries. However, the Directors consider that, within the Carnival Corporation and Carnivalplc dual listed company (“DLC”) arrangement, the most appropriate presentation of Carnival plc’s resultsand financial position is by reference to the Carnival Corporation & plc U.S. GAAP consolidated financialstatements (“DLC Financial Statements”). The DLC Financial Statements are included in the CarnivalCorporation & plc 2014 Annual Report (“DLC Annual Report”), which is prepared to satisfy U.S.reporting requirements. Accordingly, the DLC Annual Report (containing the DLC Financial Statements)is included in Annex 1 to the Carnival plc Annual Report.

In order to obtain a better understanding of the Carnival Corporation & plc business, financial condition andresults of operations, the Carnival plc stakeholders should read the items referenced below included in the ProxyStatement, Annex 1 and Carnival Corporation & plc joint Annual Report on Form 10-K (“Form 10-K”), inaddition to the Carnival plc Strategic Report and IFRS Financial Statements contained herein.
The locations where the Carnival plc Annual Report Documents and Other Information can be found are asfollows:
CARNIVAL PLC ANNUAL REPORT DOCUMENTS LOCATIONS PAGE NO.
Strategic ReportChief Executive Officer’s Letter to Shareholders . . . . . . . . . . . . . . . . . . . . . . . . . . . . . . . . . . Strategic Report 2 – 4Overview-Summary . . . . . . . . . . . . . . . . . . . . . . . . . . . . . . . . . . . . . . . . . . . . . . . . . . . . . . . . . . . . . . Strategic Report 5Vision, Goals and Related Strategies . . . . . . . . . . . . . . . . . . . . . . . . . . . . . . . . . . . . . . . . . . . . . . Strategic Report 5 – 8Global Cruise Industry-Overview . . . . . . . . . . . . . . . . . . . . . . . . . . . . . . . . . . . . . . . . . . . . . . . . . Strategic Report 8Favorable Characteristics of the Global Cruise Industry . . . . . . . . . . . . . . . . . . . . . . . . . . . Strategic Report 9 – 10Passenger Capacity and Cruise Guests Carried . . . . . . . . . . . . . . . . . . . . . . . . . . . . . . . . . . . . Strategic Report 11Our Global Cruise Business-Cruise Programs . . . . . . . . . . . . . . . . . . . . . . . . . . . . . . . . . . . . . Strategic Report 12Segment Information . . . . . . . . . . . . . . . . . . . . . . . . . . . . . . . . . . . . . . . . . . . . . . . . . . . . . . . . . . . . . Strategic Report 12North America Cruise Brands . . . . . . . . . . . . . . . . . . . . . . . . . . . . . . . . . . . . . . . . . . . . . . . . . . . . Strategic Report 13 – 16Europe, Australia & Asia Cruise Brands . . . . . . . . . . . . . . . . . . . . . . . . . . . . . . . . . . . . . . . . . . Strategic Report 16 – 22Ships Under Contract for Construction . . . . . . . . . . . . . . . . . . . . . . . . . . . . . . . . . . . . . . . . . . . . Strategic Report 22Cruise Ports and Destination Developments . . . . . . . . . . . . . . . . . . . . . . . . . . . . . . . . . . . . . . . Strategic Report 23Cruise Ship Repair Facility . . . . . . . . . . . . . . . . . . . . . . . . . . . . . . . . . . . . . . . . . . . . . . . . . . . . . . . Strategic Report 23Cruise Pricing and Payment Terms, Onboard and Other Revenues, Sales
Relationships, Marketing Activities, Seasonality and Competition . . . . . . . . . . . . . . Strategic Report 23 – 27Government Regulations (including Greenhouse Gas Emissions and Human
Rights) . . . . . . . . . . . . . . . . . . . . . . . . . . . . . . . . . . . . . . . . . . . . . . . . . . . . . . . . . . . . . . . . . . . . . . . . Strategic Report 27 – 35Training, Employees (including diversity), Supply Chain, Communities in
Which We Operate, Information Technology, Insurance, Trademarks andOther Intellectual Property, Taxation and Industry and Market Data Strategic Report 35 – 40
Business Review . . . . . . . . . . . . . . . . . . . . . . . . . . . . . . . . . . . . . . . . . . . . . . . . . . . . . . . . . . . . . . . . . Strategic Report 40 – 56Principal Risks and Uncertainties . . . . . . . . . . . . . . . . . . . . . . . . . . . . . . . . . . . . . . . . . . . . . . . . . Strategic Report 57 – 63Repurchase Authorizations and Stock Swap Programs . . . . . . . . . . . . . . . . . . . . . . . . . . . . Strategic Report 63 – 64Carnival plc IFRS Financial Statements for the year ended
November 30, 2014Carnival plc IFRS Financial Statements . . . . . . . . . . . . . . . . . . . . . . . . . . . . . . . . . . . . . . . . . . . Carnival plc Financial
Statements 65 – 110PricewaterhouseCoopers LLP Independent Auditor’s Report . . . . . . . . . . . . . . . . . . . . . . Carnival plc Financial
Statements 111 – 117Additional DocumentsCertain Relationships and Related Party Transactions . . . . . . . . . . . . . . . . . . . . . . . . . . . . . Proxy Statement 81 – 82Carnival plc Directors’ Report . . . . . . . . . . . . . . . . . . . . . . . . . . . . . . . . . . . . . . . . . . . . . . . . . . . . Proxy Statement –
Annex A A-1 – A-8Carnival plc Directors’ Remuneration Report – Part I . . . . . . . . . . . . . . . . . . . . . . . . . . . . . Proxy Statement 43 – 62Carnival plc Directors’ Remuneration Report – Part II . . . . . . . . . . . . . . . . . . . . . . . . . . . . Proxy Statement –
Annex B B-1 – B-13Carnival plc Corporate Governance Report . . . . . . . . . . . . . . . . . . . . . . . . . . . . . . . . . . . . . . . Proxy Statement –
Annex C C-1 – C-13OTHER INFORMATION
DLC Annual ReportDLC Financial Statements . . . . . . . . . . . . . . . . . . . . . . . . . . . . . . . . . . . . . . . . . . . . . . . . . . . . . . . . Annex 1 6 – 36Selected Financial Data . . . . . . . . . . . . . . . . . . . . . . . . . . . . . . . . . . . . . . . . . . . . . . . . . . . . . . . . . . . Annex 1 61 – 62Market Price for Common Stock and Ordinary Shares . . . . . . . . . . . . . . . . . . . . . . . . . . . . Annex 1 62Stock Performance Graphs . . . . . . . . . . . . . . . . . . . . . . . . . . . . . . . . . . . . . . . . . . . . . . . . . . . . . . . Annex 1 63 – 64Selected Quarterly Financial Data (Unaudited) . . . . . . . . . . . . . . . . . . . . . . . . . . . . . . . . . . . . Annex 1 65 – 66Corporate and Other Information . . . . . . . . . . . . . . . . . . . . . . . . . . . . . . . . . . . . . . . . . . . . . . . . . Annex 1 67
OtherOther Risk Factors . . . . . . . . . . . . . . . . . . . . . . . . . . . . . . . . . . . . . . . . . . . . . . . . . . . . . . . . . . . . . . . Form 10-K 37 – 47Properties, Legal Proceedings, Executive Officers and Dividends . . . . . . . . . . . . . . . . . Form 10-K 47 – 50
The Notice of Annual Meetings and Proxy Statement, dated February 20, 2015 (“Proxy Statement”) and Form10-K are not set forth within this document, but are available for viewing at www.carnivalcorp.com orwww.carnivalplc.com. The Carnival plc IFRS Financial Statements have been submitted to the National StorageMechanism and are available for inspection at www.morningstar.co.uk/uk/NSM and will be included in theAnnual Meeting materials available to the Carnival plc shareholders.
Strategic Report
The Directors consider that, within the DLC arrangement, the most appropriate presentation of Carnival plc’sbusiness strategy is by reference to the consolidated strategy of Carnival Corporation & plc. Accordingly, thisStrategic Report presents the required strategy and business review for the combined group in order to satisfyreporting requirements of the Companies Act 2006.
1. Chief Executive Officer’s Letter to Shareholders.
Dear Shareholders,
Achieving positive revenue yields and earnings growth of nearly 25 percent over 2013, we reached a significantinflection point for our company. Looking ahead, we are working hard to enable growth to accelerate in the yearsto come as we aggressively work toward delivering double-digit return on invested capital (“ROIC”).
In 2014, we achieved non-GAAP net income exceeding $1.5 billion and cash from operations of nearly $3.5billion, while containing costs and overcoming our share of obstacles, including the loss of higher yieldingitineraries due to geopolitical concerns and historically high industry capacity increases in the Caribbean. Thesestrong results were well above our 2014 guidance and a credit to the outstanding efforts of our 120,000 shipboardand shoreside team members who create exceptional vacation experiences each and every day for our more than10.5 million guests across the globe.
Our earnings growth in 2014 was driven by improved performance at our Costa Cruises and Carnival Cruise Linebrands. Costa experienced a further improvement in perception with an almost doubling of trust and confidencein Italy. Significantly, the brand experienced continued yield growth as well as improved profitability throughcollaboration across our Continental European brands.
Carnival Cruise Line was recognized as the most improved in consumer perception of any brand in any categoryin the United States in 2014 by YouGov. A number of initiatives introduced by Carnival Cruise Line such as theCarnival LIVE concert series, children’s programs Camp Ocean and Seuss at Sea, as well as the Great VacationGuarantee, are clearly resonating with guests.
New product initiatives and innovative marketing campaigns implemented across our brands over the past yearare driving increased demand. We experienced a sustained improvement in booking trends throughout 2014 andare gaining momentum in our efforts to drive ticket prices and onboard revenues higher.
THE PATH TO DOUBLE DIGIT ROIC
Measured Capacity Growth
In 2014, we continued progress toward enhancing our fleet while maintaining our commitment to measuredcapacity growth. We delivered two spectacular ships, Regal Princess and Costa Diadema. These new shipintroductions generated substantial media coverage and positive buzz, including the star studded North Americandebut of Regal Princess which featured a reunion of the “Love Boat” cast and 25 guest stars who appeared on thehit TV show. The delivery of Costa Diadema was equally stunning and included a festive inaugural in Genoa,Italy.
As we continue to advance our fleet, we have a number of ships that we expect to replace with newer, larger andmore fuel efficient vessels over time. These new ships will be more than double the size of those they arereplacing, offer higher yielding balcony cabins, more than 20 percent lower unit costs and greater than 35 percentimproved fuel efficiency.
We recently signed orders for three new ships for delivery in 2018 bringing the total order book to 10 vesselsover a four-year period. We also sold four of our smaller, less-efficient ships resulting in only a 3 percent netcapacity increase over this period and reinforcing our commitment to measured capacity growth.
Accelerating Demand
At the same time we are striving to drive additional demand. Cruising captures just a small percentage of theoverall vacation market. Consequently, our biggest opportunity is to increase cruise consideration amongconsumers. We have a number of initiatives underway to attract first-time cruisers through increased demand inestablished markets, as well as expansion into new markets.
We are continually implementing product enhancements across all our brands, and striving to deliver an evenbetter guest experience to increase retention and life-long advocacy. “Word of mouth” remains the most powerfultool in attracting first-time cruise guests.
2
Stra
tegi
cR
epor
t
We are unwaveringly focused on increasing demand on all fronts. That includes a significant public relationseffort across all brands to deliver our message to consumers that cruising is a great experience, at a great value.In fact, we enjoyed a significant increase in our collective share of voice globally in 2014 with our number ofpositive mentions more than doubling.
We have increased our investment in advertising, having spent over $600 million in 2014. We launched newmarketing campaigns in multiple regions. In North America, Carnival Cruise Line was the National Cruise Lineadvertiser of the Winter Olympics telecast while Princess Cruises launched its first television campaign in 10years. In addition, both Costa Cruises in Europe and P&O Cruises in the UK launched new advertisingcampaigns.
As we began 2015, we aired a new commercial on Super Bowl Sunday – the world’s biggest marketing stage.Our company’s first major multi-brand marketing initiative extended well beyond the Super Bowl itselfgarnering nearly 5 billion media impressions even before the game aired and more than 10 billion totalimpressions to date.
These efforts collectively help to drive demand for our brands that outpaces capacity, ultimately leading to higheryields.
New Market Opportunities
Asia, and in particular, China continues to be a focus for emerging market development, where we expectdouble-digit growth over the next few years. We expect China to be the largest cruise market in the world overtime. We were the first to enter the market through our Costa Cruises brand in 2006 and are currently the largestcruise operator in mainland China. This year we will lead the industry with four ships which will homeport out ofMainland China and more than 12 marketing offices in the region. To coordinate our growth strategy, our ChiefOperations Officer, Alan Buckelew, has relocated to China and we have entered into several strategic agreementsfocused on expanding the cruise industry in China.
We signed a memorandum of understanding (“MOU”) with China State Shipbuilding Corporation, China’slargest shipyard, and Italian shipbuilder, Fincantieri, to explore the possibility of shipbuilding and other strategicpartnerships to foster growth. We also signed a MOU with China Merchants Group, China’s oldest stateenterprise, to explore joint ventures in port and destination development, as well as other areas to successfullydevelop our industry.
We have clearly established a solid foothold as the largest cruise operator home-porting in China, and ourdevelopment strategy is accelerating.
Working Together to Unlock Our Potential
I feel strongly that our brands must remain independent, especially concerning the guest interface, yet worktogether to unlock the potential of leveraging our scale and collective expertise. We began 2014 with the first-ever global leadership team meeting that brought together our top 65 leaders from around the world and achievedremarkable alignment on our vision and top priorities. By strengthening our communication and coordination, weenjoyed some early wins on our revenue and cost cross-brand collaboration efforts.
We furthered our never-ending pursuit of capturing insights from our guests beginning with our segmentationstudy in North America, the first we have done across brands and the largest ever done in our industry. Weconducted extensive interviews with over 40,000 respondents and mined our 30 million past-guest database forinsight to help grow demand and onboard revenue.
We elevated our level of cross-brand global deployment planning to drive greater penetration and more effectivecapacity management. Additionally, we conducted our first deep dive examination of our revenue managementsystems to share best practices and identify gaps, new opportunities and tools.
Some early wins on our cost containment efforts already contributed $20 million of savings in 2014. Weanticipate another $70 to $80 million in cost reductions to benefit 2015 and have further opportunity to helpoffset inflation in the broader base of non-fuel purchases over time.
Sustainable Operations
We recognize our reputation and success depend on sustainable and transparent operations. We are committed toensuring cruising is the most enjoyable vacation experience possible for our guests. We maintain thiscommitment by keeping our guests and crewmembers safe, by protecting the environment, by developing ourworkforce, by strengthening our stakeholder relations, enhancing the port communities that our ships visit andmaintaining our fiscal strength.
3
Increasing our fuel efficiency remains at the cornerstone of our sustainability efforts. It is gratifying to say wehave reduced our unit fuel consumption by 25 percent since 2007, meeting our stated goal of delivering a 20percent reduction (per unit) in carbon emissions ahead of schedule. Over that time, our effort has saved over 1billion gallons of fuel and $2.5 billion in fuel costs. This efficiency improvement is a testament to the breadth ofefforts undertaken to reduce consumption.
Moreover, we have taken the lead on developing technology to mitigate the impact of new low-sulfur fuel usagerequirements which came into effect in January while maintaining our commitment to the pristine environmentsin which we have the great pleasure to sail. We are aggressively installing new air emissions technology onapproximately 70 percent of our fleet by 2017 while at the same time rolling out other energy efficienttechnology. These advancements are an important investment in the environment and lay a solid foundation forsustainable earnings improvement.
EXECUTING ALONG THE PATH
We believe we are executing along a clear path toward double-digit ROIC. We improved ROIC by nearly onepercentage point in 2014 and expect another percentage point of improvement in 2015. We continue to managethe total capital plan with a keen eye toward exceeding guest expectations, while at the same time maintainingfiscal discipline.
Our collective efforts created significant value for shareholders in fiscal 2014, with our share price advancingover 22 percent as well as returning nearly $800 million in dividends.
Importantly, the ground work for continued progress is laid and we are firmly on a path to deliver double-digitROIC in the next three to four years.
In closing, I thank our Board for their counsel and support throughout the past year and I thank our managementfor their strong leadership in moving our company forward. For his contribution, I especially thank Gerry Cahill,an invaluable leader who retired after more than 20 years, and most recently served as President and CEO of theCarnival Cruise Line brand. We welcome Christine Duffy, the new head of Carnival Cruise Line, OrlandoAshford, the new head of Holland America Line and Neil Palombo, the new head of Costa Cruises — threestrong additions to our very capable leadership team.
Our business, or any business, is all about the people. One out of every two guests who cruise anywhere in theworld cruise on one of our nine brands and 100 ships. That is only possible because of the extraordinary effortsof our employees worldwide who passionately and consistently deliver joyful and memorable vacationexperiences for our guests, as well as our travel agent partners around the globe who support our brands. I thankthem all. My sincerest appreciation to our shareholders and, of course, our more than 10.5 million valued guestsfor choosing to spend their vacation with us. I look forward to welcoming you aboard again soon.
Arnold W. DonaldPresident and Chief Executive Officer
4
Stra
tegi
cR
epor
t
2. Business.
A. Overview
I. Summary
Carnival Corporation was incorporated in Panama in 1972 and Carnival plc was incorporated in England andWales in 2000. Carnival Corporation and Carnival plc operate a dual listed company (“DLC”), whereby thebusinesses of Carnival Corporation and Carnival plc are combined through a number of contracts and throughprovisions in Carnival Corporation’s Articles of Incorporation and By-Laws and Carnival plc’s Articles ofAssociation. The two companies operate as if they are a single economic enterprise with a single senior executivemanagement team and identical Boards of Directors, but each has retained its separate legal identity. CarnivalCorporation and Carnival plc are both public companies with separate stock exchange listings and their ownshareholders. Together with their consolidated subsidiaries, Carnival Corporation and Carnival plc are referred tocollectively within this Strategic Report as “Carnival Corporation & plc,” “our,” “us” and “we.”
We are among the most profitable and financially strong leisure travel companies in the world with a marketcapitalization of $36 billion at February 20, 2015. We are the largest cruise company with a global market shareof 48% based on the number of guests carried and a leading provider of vacations to all major cruise destinationsthroughout the world (see Item 2. Business. C. “Our Global Cruise Business – Cruise Programs”). We operate100 cruise ships within a portfolio of nine leading global, regional and national cruise brands that sell tailoredcruise products, services and vacation experiences in all the world’s most important vacation markets. Webelieve having global and regional brands that are predominately serving multiple source markets and nationalbrands that are predominately serving major source markets provides us with a unique advantage to competewithin the entire leisure market for consumers’ discretionary vacation spending. The descriptions of the principalvacation markets where we source substantially all of our guests and our brands that market primarily to thesevacationers are discussed in Item 2. Business. C. “Our Global Cruise Business – North America” and “OurGlobal Cruise Business – Europe, Australia & Asia.”
II. Vision, Goals and Related Strategies
Our vision is to deliver unmatched joyful vacation experiences and breakthrough total shareholder returns byexceeding guest expectations and achieving the full benefits inherent in our scale. We believe our portfolio ofglobal, regional and national brands is instrumental to us achieving our vision and maintaining our cruiseindustry leadership positions, which includes having a leading cruise brand selling in each of our primary sourcemarkets targeting specific guest segments. Our primary financial goals are to profitably grow our cruise businessand increase our return on invested capital, reaching double digit returns in the next three to four years, whilemaintaining a strong balance sheet. Our ability to generate significant operating cash flows allows us to internallyfund our capital investments. Our goal is to return “excess free cash flows” (defined as cash flows fromoperations less investing activities and regularly scheduled quarterly dividends) to our shareholders in the formof additional dividends and/or share buybacks. In addition, we are committed to maintaining our stronginvestment grade credit ratings, which are among the highest in the leisure travel industry.
To reach our primary financial goals, we have started to implement various demand creating initiatives as westrive to create additional demand for our brands that far outpaces supply, ultimately leading to higher revenueyields. We have also identified opportunities that are aimed at increasing our pricing, enhancing our cruiseproducts and services and optimizing our cost structure while preserving the unique identities of our individualbrands. We are making significant investments to gain further insight into our guests’ decision making byevaluating data included in our global database of guests to identify vacationers’ needs and wants and to analysetheir purchasing behaviours. We are also implementing strategies to grow demand by increasing consumerawareness and consideration of our cruise brands through advertising.
Furthermore, we identified new strategies and tactics to strengthen our cruise ticket revenue managementprocesses and systems across our portfolio of brands, such as optimizing our pricing methodologies, improvingour pricing models and increasing the brands’ coordination of our global fleet deployments. We have tools thatenable us to perform customer segmentation analyses, evaluate our guests’ decision making process and identifynew market growth opportunities to expand our customer base. We are also implementing new initiatives tostrengthen our onboard revenue programs, such as expanding our onboard retail shop offerings and enhancingour bar and casino programs. In addition, we are adding new home ports in selected geographic areas to provideeasier access and to reduce travel costs in order to attract more first-time cruisers.
5
We believe that we have significant opportunities to continue to grow our presence in China due to its large andgrowing middle-class population and expansion of their international tourism. It is estimated that Chinese cruisedemand will increase to 1.6 million annual cruisers by 2020. The Chinese government has expressed a strongdesire to transform China into a leading global cruise market and is making substantial investments in cruise-related infrastructure. Due to the high strategic importance we place on the China cruise market, in 2014 werelocated our Chief Operations Officer to China to more closely oversee our brands’ strategic initiatives,coordinate our growth strategy in China and the surrounding markets and liaise with Chinese governmentofficials. With the introduction of Costa Serena in 2015, we will have four ships home ported in China, whichwill represent a 140% increase in guest capacity over a two-year period and will offer our Chinese guestsdiversified cruise products with two brands targeting two different segments of travellers. As we execute ourstrategy to accelerate growth in China, we have the benefit of eight years of local experience to help guide ourexpansion and enhance our cruise products and services and make them even more attractive to our Chineseguests. As part of our China cruise strategy, we are exploring opportunities aimed at the development of adomestic cruise company and the formation of a domestic cruise shipbuilding company, as well as portdevelopment, talent development and training, enhanced relationships with our distribution partners and sharingof supply chain and logistics expertise.
With 100 ships and 10.6 million guests in 2014, we have the scale to optimize our structure by utilizing ourcombined purchasing volumes and common technologies and implementing cross-brand initiatives aimed at costcontainment. For example, we have common reservation systems, shared data centres, shared port facilities andare working on cross-brand contracting for food and beverages, air travel, hotel supplies, port and manningagency services, advertising and promotions, shore excursions and technical operations to further utilize the scaleof our combined purchases.
While we are well underway with certain initiatives and are already beginning to see their positive results, someof our initiatives will take longer to realize their full benefits due to our size and the nature of the cruise industry.Our strategic initiatives demonstrate the benefits of communicating, coordinating and collaborating across ourbrands and will help us fulfil our vision.
Our vision is based on four key pillars:
• Health, environment, safety, security and sustainability,• Guests,• Employees and• Shareholders and other stakeholders
Health, Environment, Safety, Security and Sustainability
We consider health, environment, safety, security and sustainability matters to be core guiding principles. Ouruncompromising commitment to the safety and comfort of our guests and crew is paramount to the success of ourbusiness. We are committed to operating a safe and reliable fleet and protecting the health, safety and security ofour guests, employees and all others working on our behalf, thereby promoting an organization that is free ofinjuries, illness and loss. We continue to focus on further enhancing the safety measures onboard all of our ships.We are also devoted to protecting the environment in which our vessels sail and the communities in which weoperate. We are dedicated to fully complying with, or exceeding, all relevant legal and statutory requirementsrelated to health, environment, safety, security and sustainability throughout our business.
We are developing a company-wide safety management system that standardizes our maritime related policies,procedures and processes and are increasing the amount of maritime safety, ship command and engine roommanagement training for our shipboard officers at our expanding global training facility in the Netherlands. Weare also updating our processes, systems and training surrounding fire prevention, detection and suppression.Furthermore, we continue to make investments in our ships’ maritime systems to improve their safety andreliability, which also allows us to operate them more efficiently and sustainably.
As a result of our efficiency improvements and initiatives, we have reduced our unit fuel consumption by almost5% in 2014 and 25% since 2007 and have achieved our stated goal of delivering a 20% reduction (per unit) in theintensity of carbon dioxide emissions from our shipboard operations one year prior to our target date. We arecurrently developing new goals aimed at protecting the environment and further reducing our fuel consumption.We are installing new exhaust gas cleaning systems on our ships to achieve environmental objectives andmitigate the financial impact of the new 2015 low sulphur regulatory requirements. In addition, we are also
6
Stra
tegi
cR
epor
t
implementing a series of new energy saving technology initiatives across our fleet in areas such as propulsion, airconditioning and waste heat recovery systems as well as more efficient lighting in order to help reduce ourcarbon footprint and costs.
Guests
Our goal is to consistently exceed our guests’ expectations while providing them with a wide variety ofexceptional vacation experiences. We believe that we can achieve this goal by continually focusing our efforts onhelping our guests choose the cruise brand that will meet their unique needs and desires, improving their overallvacation experiences and building state-of-the-art ships with innovative onboard offerings and unequaled guestservices.
Our nine unique brands with worldwide sourcing of guests and diverse itinerary options allow us to expand ourofferings to our ever increasing past guest base, while continuing to grow our business through the acquisition ofnew guests in established and emerging markets. Our leading vacation destination experiences, including those atour unique private islands, such as Half Moon Cay and Princess Cays®, and company-owned ports, such as thosein Cozumel, Mexico and Roatan, Honduras, as well as preferential access to other leading destinations, supportour portfolio of first-choice cruise brands. Our cruise products and services are tailored to specific geographicareas and lifestyles, which allows us to penetrate each geographic area more effectively. We are conductingpsychographic segmentation studies, including qualitative and quantitative surveys and analyses, to gain a moreinsightful and impactful understanding of our guests’ needs, wants and expectations. We will then target ouradvertising and promotions toward these specific guest segments in order to drive demand for our offerings andbetter guide our guests to the cruise brand experience that best matches their tastes. These studies should enableus to better differentiate each brand in the minds of vacationers and consumers-at-large and adjust the productand service offerings of our brands.
We recognize the importance of cultivating lifelong relationships with our guests and creating brand advocatesthrough personal interactions with our highly trained, motivated and service-oriented employees and byproviding enjoyable vacation experiences. We are continually introducing new innovative cruise products andservices, such as the Carnival LIVETM concert series and the first culinary school at sea at P&O Cruises (UK)designed by a celebrity chef, to attract more first-time cruisers. We also continue to add to our shipboardamenities, such as Carnival Cruise Line’s Fun Ship® 2.0 product enhancement initiatives, AIDA’s Four ElementsFun Park and P&O Cruises (Australia)’s shipboard adventure series, P&OEdgeTM, to enhance the experience ofnew as well as repeat guests. We are working toward providing our guests and crew with improved shipboardinternet connectivity to enable them to share their onboard experiences with family and friends. Overall, we arecommitted to preserving the positive image and reputation of all of our first choice brands and are dedicated tomaking our guests’ experience at every touch point before, during and after their cruise truly exceptional so thatour guests become our lifelong advocates.
We are building new, innovative, purpose-built ships that are larger and more efficient and have a wider range ofonboard amenities and features, which enable us to better compete for consumers’ vacation spend. These largerships enable us to obtain greater economies of scale. In 2014, we introduced Princess Cruises’ 3,560-passengerRegal Princess and Costa Cruises’ 3,692-passenger Costa Diadema. As of February 20, 2015, we have ten cruiseships scheduled to be delivered between late February 2015 and November 2018, some of which will replaceexisting capacity as older, smaller and less efficient ships exit our fleet. We strategically time the introduction ofadditional ships into our brands to allow ample time for those lines to further grow their guest base and absorbthe new capacity. We have removed 16 ships from our fleet since 2006 and have agreements in place to removethree more ships by March 2016. Based on our current ship orders and announced ship withdrawals, our netcapacity growth rate is expected to be 2.0% in 2015 and 2.8% compounded annually through 2018. We arecommitted to measured capacity growth so that we achieve an optimal balance of supply and demand tomaximize our profitability in established cruise regions, such as North America and Western Europe. We believethe increasing deployment of ships into the emerging Asia market may further moderate the level of supply inNorth America and Western Europe. In addition, we continue to make substantial investments in our existingship enhancement programs to improve our onboard product offerings and enrich our guests’ vacationexperiences.
Employees
Our goal is to select, train and retain the finest shipboard and shoreside employees because having a team ofhighly motivated and engaged employees is key to delivering vacation experiences that exceed our guests’
7
expectations. Understanding the critical skills that are needed for outstanding performance is crucial in order tohire and train our crew and shoreside personnel. We believe in listening to our employees’ perspectives and ideasand use employee feedback tools to monitor our progress in this area. We also deliver on diversity and inclusionby having highly empowered and inspired employees from over 100 countries serving onboard our fleet and atour shoreside facilities. We have structured our work processes and incentive compensation plans to reflect aculture that enables our brands to better align their individual performance with our primary financial goals. Ourmanagement teams are aligned by geographic region to further optimize our operations, utilize our scale andbetter manage our performance.
Shareholders and Other Stakeholders
We truly value our relationships with a diverse range of stakeholders, including guests, travel agents, employees,communities, shareholders, regulatory bodies, media, creditors, shipbuilders, governments and suppliers. Webelieve that engaging stakeholders in a mutually beneficial manner is critical to our long-term success and keyfor us to realize our vision. Our media communication programs are designed to strengthen these relationships soas to help us attract new cruisers and provide for balanced and fair reporting of cruise industry events. As part ofthis effort, we believe we must continue to be an outstanding corporate citizen in the communities in which weoperate. Our brands are socially responsible and work to meet or exceed the economic, environmental, ethicaland legal responsibilities placed on them by our stakeholders. We help create a higher standard of living andquality of life in our home communities and those that we visit.
Strong relationships with our travel agents are also vital to our success. We continue to strengthen ourrelationship with the travel agent community by increasing our communication and outreach, implementingchanges based on travel agent feedback, increasing our trade marketing presence and improving our educationalprograms to assist agents in stimulating cruise demand. We host travel professionals on our ships to provide themwith an opportunity to better experience our products and services and also to engage with them on a morefocused level. The expanded use of brand communications is also highly important in order to raise our profileand to proactively build relationships with the travel agent community. Similarly, we are expanding our use ofsocial media to cultivate relationships with travel agents and guests, including the more technology savvymillennials and thereby build lifelong brand advocates.
B. Global Cruise Industry
I. Overview
The multi-night global cruise industry has grown significantly but still remains relatively small compared to thewider global vacation industry, which includes a large variety of land-based vacation alternatives around theworld. For example, there were only about 250,000 cabins in the global cruise industry at November 30, 2014,which is less than two percent of the number of worldwide hotel rooms. Within the global vacation industry,cruise companies compete for the discretionary income spent by vacationers. A 2014 Nielsen Global ConsumerConfidence Survey found that after providing for savings and living expenses, the number one global spendingpriority is for vacations. As a result of these and other favourable cruise industry characteristics, we believe thatthe global cruise industry has the opportunity to capture a greater share of consumers’ spending.
Cruising offers a broad range of products and services to suit vacationing guests of many ages, backgrounds andinterests. Cruise brands can be broadly classified as offering contemporary, premium and luxury cruiseexperiences. The contemporary experience typically includes cruises that last seven days or less, have a morecasual ambiance and are less expensive than premium or luxury cruises. The premium experience typicallyincludes cruises that last from seven to 14 days and appeal to the more experienced cruise guest who is usuallymore affluent and older. Premium cruises emphasize quality, comfort, style and more destination-focuseditineraries, and the average pricing is normally higher than contemporary cruises. The luxury experience isusually characterized by smaller vessel size, very high standards of accommodation and service, higher pricesand exotic itineraries to ports that are inaccessible to larger ships. We have product and service offerings in eachof these three broad classifications. Notwithstanding these classifications, there generally is overlap andcompetition among all cruise products and services.
8
Stra
tegi
cR
epor
t
II. Favourable Characteristics of the Global Cruise Industry
a. Exceptional Value Proposition
We believe that the cost of a cruise vacation represents an exceptional value in comparison to alternative land-based vacations. Cruising provides many relatively unique benefits, such as transportation to various destinationswhile also providing accommodations, a generous diversity of food choices and a selection of daily entertainmentoptions for one all-inclusive, competitive price. To make cruising even more cost effective and more easilyaccessible to vacationers, the cruise industry typically offers a number of drive-to homeports, which enablesmany cruise guests to reduce their overall vacation costs by eliminating or reducing air and other transportationcosts.
b. Relatively Low Penetration Levels
Based on industry data, the 2014 annual penetration rates when computed based on the number of annual cruiseguests as a percentage of the total population are as follows (a):
• 3.4% for North America (b),• 3.4% for Australia and New Zealand,• 2.6% for the United Kingdom (“UK”) and• 1.3% for continental Europe (Germany, Italy, France, Spain and Portugal).
(a) 2014 annual penetration rates were computed based on the historical number of cruise guests carriedfor at least two consecutive nights obtained from G.P. Wild (International Limited) (“G.P. Wild”), anindependent cruise research company, and internally developed estimates of increases in capacity.
(b) For the purpose of the penetration rate calculation, North America is only comprised of the UnitedStates of America (“U.S.”) and Canada.
Based on industry data and our internal estimates, approximately 20% of the U.S. population and lowerpercentages of European and Australian populations have ever taken a cruise. In addition, Europeans andAustralians have significantly more vacation days a year than North Americans, which presents opportunities forincreases in these regions’ penetration levels compared to North America.
Cruising is at a very early stage of development and has lower penetration rates in emerging markets withinAsia. There are an increasing number of relatively lower penetrated markets, such as China, where economic growthhas raised discretionary income levels and thus fuelled an increasing demand for vacations, including cruising.
c. Wide Appeal
Cruising appeals to a broad range of ages and income levels. Cruising provides something for every generation,from kids’ clubs to an array of onboard entertainment designed to appeal to teens and adults. Cruising also offerstransportation to a variety of destinations and a diverse range of ship types and sizes, as well as price points, toattract guests with varying tastes and from most income levels. To encourage first time cruisers, the duration ofsome cruises has been shortened, which has also lowered the purchase price and thus broadened the appeal forcruising.
d. Positive Demand Trends
The average age of populations in established cruise regions is increasing. The average age of a cruise guest,which varies by brand, ranges from approximately 40 years to 60 years across the contemporary, premium andluxury cruise categories in established cruise regions. Between 2014 and 2024, the number of people in the cruisebusiness’ primary age group of 45 years and older is expected to grow by 17 million, or 12%, in the U.S. andCanada, 14 million, or 9%, in the major Western European countries and 1.6 million, or 17%, in Australia.
The baby boomer generation, or those born between 1946 and 1964, is the most active older population group inhistory. The youngest in this group, who are in their fifties, are typically experiencing their peak earning yearsand some have children at home, making cruising for the whole family a great value. Some of the oldest in thisgroup, who are in their late sixties, are defying traditional stereotypes by continuing to work, having more activelifestyles and enjoying cruising with their children and grandchildren.
9
The fastest growing segment of the vacation industry is the millennial generation, or those born between 1980and 2000. With a population of over 80 million, the millennial generation has surpassed the size of the babyboomers generation and now represents the largest generation size in history. The millennial generation has astrong desire for travel and shared experiences and will continue to offer growth and drive innovation in thevacation industry, especially as they evolve into more frequent travellers. This presents an opportunity for thecruise industry to attract more first time cruisers and grow its repeat cruiser base within this segment. For themillennial generation, vacation is typically not merely about relaxation and exploring, but rather self-development and being able to share their adventures with friends and family via social media. Also, millennialstypically prefer more affordable vacations without sacrificing the accommodations or experiences. The cruiseindustry is working toward meeting the millennials’ unique vacation preferences, including enhancing its ships’internet connectivity.
Furthermore, many emerging international markets are experiencing growing economies and a rapid growth inmiddle-class consumers. As their earnings power and disposable income increase, these middle-class consumersare becoming more eager to purchase entertainment, travel and discretionary products and services. This demandgrowth provides the cruise industry the opportunity to expand its reach in these markets.
We believe the cruise industry is well-positioned to take advantage of these positive demand trends.
e. Ship Mobility
The mobility of cruise ships enables cruise companies to move their vessels between regions in order tomaximize profitability. For example, brands can change itineraries over time in order to cater to guest tastes or asgeneral economic or geopolitical conditions warrant. This flexibility allows cruise operators to better positionthemselves to attract more first-time cruisers and provide repeat guests with new and more desirable destinations.In addition, cruise companies have the flexibility to reposition some of their capacity to areas with growingdemand, such as Asia. We believe that this unique ability to move ships provides the cruise industry with acompetitive advantage compared to other land-based vacation alternatives.
f. High Guest Satisfaction Rates
Cruise guests tend to rate their overall satisfaction with a cruise vacation higher than comparable land-basedhotel and resort vacations. According to industry surveys, the cruise experience consistently exceeds expectationsof repeat and first-time cruisers on a wide range of important vacation attributes. Cruising continues to receivehigh guest satisfaction rates because of the unique vacation experiences it offers, including visiting multipledestinations without having to pack and unpack, all-inclusive product offerings and state-of-the-art cruise shipswith entertainment, relaxation and fun, all at an outstanding value.
g. Favourable Supply Versus Demand Balance
Over the last several years cruise operators have slowed their passenger capacity growth in the more establishedcruise markets of North America and Western Europe compared to historical levels. Furthermore, smaller, olderand less efficient cruise ships will continue to be retired from service as they reach the end of their economiclives, no longer provide guests with the vacation experiences that they desire or do not provide sufficient cashflows. Over time we expect demand to accelerate as global economic conditions improve and emerging marketscontinue to develop. We believe this favourable supply versus demand balance will have a positive impact on thecruise industry’s ability to grow profitably. The cruise industry continues to maintain a measured rate of growthin established markets, such as North America and Western Europe, and is investing in emerging markets, suchas China, where it believes it has greater growth opportunities.
10
Stra
tegi
cR
epor
t
III. Passenger Capacity and Cruise Guests Carried
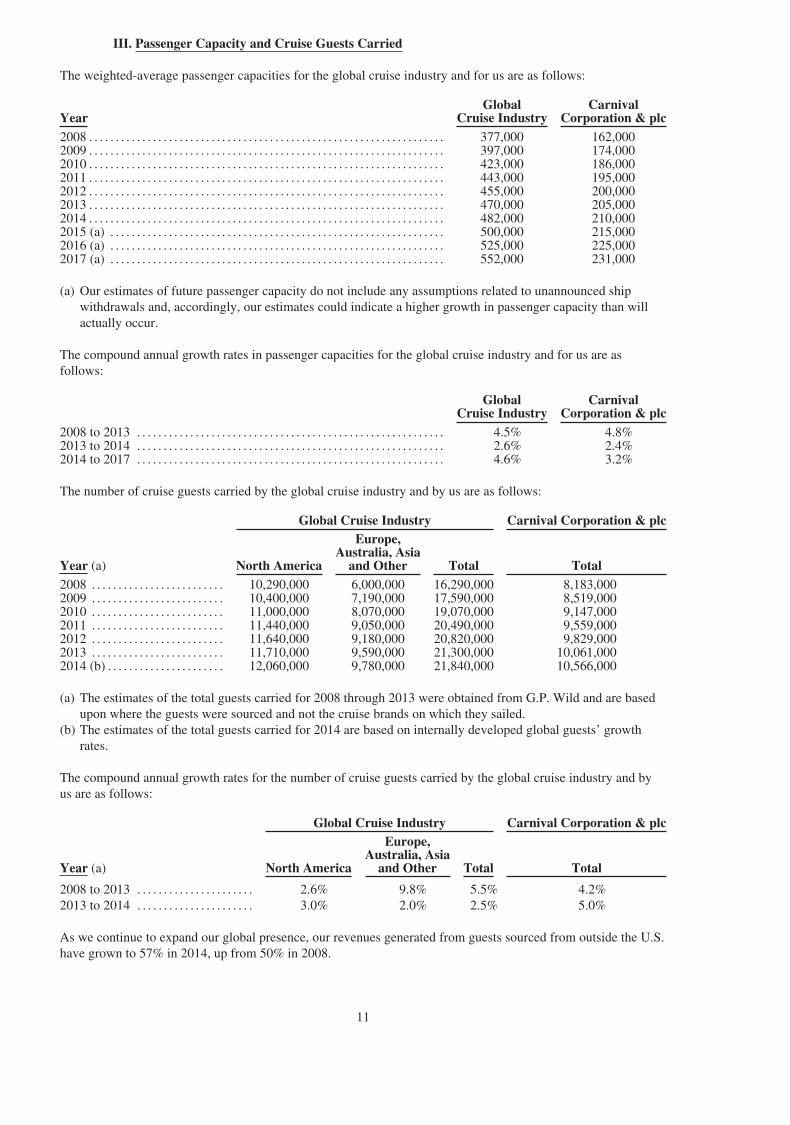
The weighted-average passenger capacities for the global cruise industry and for us are as follows:
YearGlobal
Cruise IndustryCarnival
Corporation & plc2008 . . . . . . . . . . . . . . . . . . . . . . . . . . . . . . . . . . . . . . . . . . . . . . . . . . . . . . . . . . . . . . . . . . . 377,000 162,0002009 . . . . . . . . . . . . . . . . . . . . . . . . . . . . . . . . . . . . . . . . . . . . . . . . . . . . . . . . . . . . . . . . . . . 397,000 174,0002010 . . . . . . . . . . . . . . . . . . . . . . . . . . . . . . . . . . . . . . . . . . . . . . . . . . . . . . . . . . . . . . . . . . . 423,000 186,0002011 . . . . . . . . . . . . . . . . . . . . . . . . . . . . . . . . . . . . . . . . . . . . . . . . . . . . . . . . . . . . . . . . . . . 443,000 195,0002012 . . . . . . . . . . . . . . . . . . . . . . . . . . . . . . . . . . . . . . . . . . . . . . . . . . . . . . . . . . . . . . . . . . . 455,000 200,0002013 . . . . . . . . . . . . . . . . . . . . . . . . . . . . . . . . . . . . . . . . . . . . . . . . . . . . . . . . . . . . . . . . . . . 470,000 205,0002014 . . . . . . . . . . . . . . . . . . . . . . . . . . . . . . . . . . . . . . . . . . . . . . . . . . . . . . . . . . . . . . . . . . . 482,000 210,0002015 (a) . . . . . . . . . . . . . . . . . . . . . . . . . . . . . . . . . . . . . . . . . . . . . . . . . . . . . . . . . . . . . . . 500,000 215,0002016 (a) . . . . . . . . . . . . . . . . . . . . . . . . . . . . . . . . . . . . . . . . . . . . . . . . . . . . . . . . . . . . . . . 525,000 225,0002017 (a) . . . . . . . . . . . . . . . . . . . . . . . . . . . . . . . . . . . . . . . . . . . . . . . . . . . . . . . . . . . . . . . 552,000 231,000
(a) Our estimates of future passenger capacity do not include any assumptions related to unannounced shipwithdrawals and, accordingly, our estimates could indicate a higher growth in passenger capacity than willactually occur.
The compound annual growth rates in passenger capacities for the global cruise industry and for us are asfollows:
GlobalCruise Industry
CarnivalCorporation & plc
2008 to 2013 . . . . . . . . . . . . . . . . . . . . . . . . . . . . . . . . . . . . . . . . . . . . . . . . . . . . . . . . . . 4.5% 4.8%2013 to 2014 . . . . . . . . . . . . . . . . . . . . . . . . . . . . . . . . . . . . . . . . . . . . . . . . . . . . . . . . . . 2.6% 2.4%2014 to 2017 . . . . . . . . . . . . . . . . . . . . . . . . . . . . . . . . . . . . . . . . . . . . . . . . . . . . . . . . . . 4.6% 3.2%
The number of cruise guests carried by the global cruise industry and by us are as follows:
Global Cruise Industry Carnival Corporation & plc
Year (a) North America
Europe,Australia, Asia
and Other Total Total2008 . . . . . . . . . . . . . . . . . . . . . . . . . 10,290,000 6,000,000 16,290,000 8,183,0002009 . . . . . . . . . . . . . . . . . . . . . . . . . 10,400,000 7,190,000 17,590,000 8,519,0002010 . . . . . . . . . . . . . . . . . . . . . . . . . 11,000,000 8,070,000 19,070,000 9,147,0002011 . . . . . . . . . . . . . . . . . . . . . . . . . 11,440,000 9,050,000 20,490,000 9,559,0002012 . . . . . . . . . . . . . . . . . . . . . . . . . 11,640,000 9,180,000 20,820,000 9,829,0002013 . . . . . . . . . . . . . . . . . . . . . . . . . 11,710,000 9,590,000 21,300,000 10,061,0002014 (b) . . . . . . . . . . . . . . . . . . . . . . 12,060,000 9,780,000 21,840,000 10,566,000
(a) The estimates of the total guests carried for 2008 through 2013 were obtained from G.P. Wild and are basedupon where the guests were sourced and not the cruise brands on which they sailed.
(b) The estimates of the total guests carried for 2014 are based on internally developed global guests’ growthrates.
The compound annual growth rates for the number of cruise guests carried by the global cruise industry and byus are as follows:
Global Cruise Industry Carnival Corporation & plc
Year (a) North America
Europe,Australia, Asia
and Other Total Total
2008 to 2013 . . . . . . . . . . . . . . . . . . . . . . 2.6% 9.8% 5.5% 4.2%2013 to 2014 . . . . . . . . . . . . . . . . . . . . . . 3.0% 2.0% 2.5% 5.0%
As we continue to expand our global presence, our revenues generated from guests sourced from outside the U.S.have grown to 57% in 2014, up from 50% in 2008.
11

C. Our Global Cruise Business
I. Cruise Programs
Our 100 ships sail to all of the world’s major cruise destinations and the percentage of our passenger capacitydeployed in each of these regions is as follows:
Region 2015 2014 2013Caribbean . . . . . . . . . . . . . . . . . . . . . . . . . . . . . . . . . . . . . . . . . . . . . . . . . . . . . . . . . . . . . . . . . . . . . . . . . . . . . . . . . 34% 35% 33%Mediterranean . . . . . . . . . . . . . . . . . . . . . . . . . . . . . . . . . . . . . . . . . . . . . . . . . . . . . . . . . . . . . . . . . . . . . . . . . . . . 15 17 19Europe without Mediterranean . . . . . . . . . . . . . . . . . . . . . . . . . . . . . . . . . . . . . . . . . . . . . . . . . . . . . . . . . . . . 13 12 12Australia . . . . . . . . . . . . . . . . . . . . . . . . . . . . . . . . . . . . . . . . . . . . . . . . . . . . . . . . . . . . . . . . . . . . . . . . . . . . . . . . . . 9 7 6Alaska . . . . . . . . . . . . . . . . . . . . . . . . . . . . . . . . . . . . . . . . . . . . . . . . . . . . . . . . . . . . . . . . . . . . . . . . . . . . . . . . . . . . 5 5 6Asia . . . . . . . . . . . . . . . . . . . . . . . . . . . . . . . . . . . . . . . . . . . . . . . . . . . . . . . . . . . . . . . . . . . . . . . . . . . . . . . . . . . . . . 6 5 4Other . . . . . . . . . . . . . . . . . . . . . . . . . . . . . . . . . . . . . . . . . . . . . . . . . . . . . . . . . . . . . . . . . . . . . . . . . . . . . . . . . . . . . 18 19 20
100% 100% 100%
II. Segment Information
Each of our nine leading global, regional and national cruise brands is an operating segment that we aggregateinto either the (1) North America or (2) Europe, Australia & Asia (“EAA”) reportable cruise segments based onthe similarity of their economic and other characteristics.
As of February 20, 2015, our cruise brands’ summary information is as follows:
Cruise BrandsPassenger
Capacity (a)Percentage of
Total CapacityNumber of
Cruise ShipsNorth AmericaCarnival Cruise Line . . . . . . . . . . . . . . . . . . . . . . . . . . . . . . . . . . . . . . . . . . 62,366 29% 24Princess Cruises (“Princess”) . . . . . . . . . . . . . . . . . . . . . . . . . . . . . . . . . . 44,090 21 18Holland America Line . . . . . . . . . . . . . . . . . . . . . . . . . . . . . . . . . . . . . . . . . 23,540 11 15Seabourn . . . . . . . . . . . . . . . . . . . . . . . . . . . . . . . . . . . . . . . . . . . . . . . . . . . . . . 1,782 1 5
North America Cruise Brands . . . . . . . . . . . . . . . . . . . . . . . . . . . . . . . 131,778 62 62
EAA (b)Costa Cruises (“Costa”) . . . . . . . . . . . . . . . . . . . . . . . . . . . . . . . . . . . . . . . 35,828 17 15AIDA Cruises (“AIDA”) . . . . . . . . . . . . . . . . . . . . . . . . . . . . . . . . . . . . . . 18,656 9 10P&O Cruises (UK) . . . . . . . . . . . . . . . . . . . . . . . . . . . . . . . . . . . . . . . . . . . . 14,736 7 7Cunard . . . . . . . . . . . . . . . . . . . . . . . . . . . . . . . . . . . . . . . . . . . . . . . . . . . . . . . . 6,694 3 3P&O Cruises (Australia) . . . . . . . . . . . . . . . . . . . . . . . . . . . . . . . . . . . . . . . 4,804 2 3
EAA Cruise Brands . . . . . . . . . . . . . . . . . . . . . . . . . . . . . . . . . . . . . . . . . 80,718 38 38
212,496 100% 100
(a) In accordance with cruise industry practice, passenger capacity is calculated based on the assumption of twopassengers per cabin even though some cabins can accommodate three or more passengers. For contractedcapacity increases, see Item 2. Business. C. “Our Global Cruise Business – Ships Under Contract forConstruction”.
(b) Carnival plc consists principally of the EAA cruise brands.
We also have a Cruise Support segment that includes our cruise port and related facilities located in Cozumel,Mexico; Grand Turk, Turks and Caicos Islands; Roatán, Honduras and Puerto Plata, Dominican Republic(currently under development), which are or will be, operated for the benefit of our cruise brands. Cruise Supportalso includes other services that are provided for the benefit of all our cruise brands.
In addition to our cruise operations, we own Holland America Princess Alaska Tours, the leading tour companyin Alaska and the Canadian Yukon, which complements our Alaska cruise operations. Our tour company ownsand operates 12 hotels or lodges, over 300 motorcoaches and 20 glass-domed railcars and is one of the fivelargest motorcoach companies in North America. This tour company and three cruise ships, the former CostaCelebration, Costa Europa and Grand Holiday, which we own and charter-out under long-term leases, compriseour Tour and Other segment as of February 20, 2015.
12
Stra
tegi
cR
epor
t
III. North America
Almost 55% of the cruise guests in the world are sourced from the North American region, where cruising is amainstream alternative to land-based vacations. Approximately 11.7 million North American-sourced guests tookmulti-night cruise vacations in 2013, and we estimate that 12.1 million guests cruised in 2014. According to aninternal survey, up to 60% of North American non-cruiser adults are likely to cruise in the next five years. As aresult of this and other favourable characteristics of the cruise industry, we expect increasing demand in thecruise segment of the North America vacation market.
The most popular location visited by North America-sourced cruise guests in 2014 was the Caribbean (includingThe Bahamas) and other locations include the Mediterranean Sea, Alaska, Northern Europe, Mexican Riviera,New England and Canada, Bermuda, Hawaii, the Panama Canal and other exotic locations, such as South andCentral America, the South Pacific Islands, Australia, New Zealand, China, Japan, South Korea, Vietnam,Singapore, Thailand and the Indian Ocean.
Carnival Cruise Line, Princess, Holland America Line and Seabourn source their guests primarily from NorthAmerica. Carnival Cruise Line also sources some of its guests from Australia. Princess also sources a growingnumber of guests from international regions, such as Australia, Asia, the UK and continental Europe. HollandAmerica and Seabourn also source some of their guests internationally, such as from Australia, the UK, theNetherlands and Germany. Cunard also sources a large portion of its guests from North America. See Item 2.Business. C. “Our Global Cruise Business – Australia” and “Our Global Cruise Business – Asia” for additionaldiscussion of Princess’ and Carnival Cruise Line’s operations in these regions.
CARNIVAL CRUISE LINE
Carnival Cruise Line is a leader in contemporary cruising and operates 24 ships designed to provide fun andexceptional vacation experiences that appeal to a wide variety of consumers, all at an outstanding value. Foundedin 1972, Carnival Cruise Line is one of the most recognizable brands in the cruise industry and carried4.5 million guests in 2014, the most of any individual cruise brand. Carnival Cruise Line identifies their targetcustomers as “The Spirited” or those who like to live life to the fullest, look at the glass as half full, feelcomfortable in their own skin and make their own fun. Carnival Cruise Line’s cruises have a broad appeal tofamilies, couples, singles and seniors and carried more than 700,000 children in 2014. Carnival Cruise Line hasone new ship scheduled to be delivered in April 2016 and another one in March 2018, which together willincrease its existing passenger capacity by 13%.
Carnival Cruise Line offers cruises generally from three to eight days with almost all of its ships departing from14 convenient U.S. home ports located along the Eastern seaboard and the Gulf and West coasts. Carnival CruiseLine is the leading provider of year-round cruises in The Bahamas, the Caribbean and Mexico and also operatesseasonal cruises in New England and Canada, Alaska, Hawaii and the Panama Canal.
The brand’s focus continues to be on enhancing its products and services with innovations that appeal to newconsumers, as well as past guests. In 2014, Carnival Cruise Line continued the rollout of its fleet wide Fun Ship®
2.0 product enhancement initiative. The Fun Ship® 2.0 program is transforming the line’s guest experiencethrough innovative dining, bar and entertainment concepts, as well as partnerships with popular celebrities andbrands. Entertainer George Lopez is the brand’s creative director for comedy and is enhancing the line’s fleetwide comedy clubs; Food Network star Guy Fieri has developed an onboard burger restaurant called Guy’sBurger Joint; leading video game manufacturer EA SPORTS helped create the first-ever EA SPORTS Bars atsea; and through a partnership with toy and game leader Hasbro, Inc. the line has created Hasbro, The GameShow, with larger-than-life adaptations of Hasbro’s iconic games. The many ground-breaking features of FunShip® 2.0 are best reflected in the Carnival Breeze and Carnival Sunshine. As of February 20, 2015, 12 ofCarnival Cruise Line’s ships have some Fun Ship® 2.0 features, with additional vessels scheduled to receivethem over the next few years.
In Spring 2016, the launch of Carnival Vista will continue the expansion of the Fun Ship® 2.0 enhancementprogram with the introduction of new ground-breaking features including SkyRide, a breakthrough suspendedopen-air cycling experience, the world’s first IMAX Theater on a ship, an expanded water park featuring the
13

colourful Kaleid-O-Slide, the line’s first raft-riding water tube slide, Seafood Shack, a delectable New England-inspired eatery, and an onboard brewery in the RedFrog Pub. These new Fun Ship® 2.0 features give CarnivalCruise Line yet another opportunity to continue to innovate and upgrade its products in exciting and ground-breaking new ways.
In 2014, Carnival Cruise Line entered into an exclusive partnership with Dr. Seuss Enterprises to create the newSeuss at Sea program and also unveiled Camp Ocean. Seuss at Sea has been rolled out on ten Carnival CruiseLine ships and will bring the beloved children’s brand and favourite characters to nearly the entire CarnivalCruise Line fleet by the end of 2015. Camp Ocean is an exciting new marine-themed program that immerseschildren ages two to 11 in the wonders of the sea through fun, engaging, hands on experiences that includeeducational games, art, music, role play and more. Camp Ocean is currently available on four Carnival CruiseLine ships and will be introduced fleet-wide by the end of 2016.
In 2014, Carnival Cruise Line introduced the Carnival LIVETM concert series, which is a new onboard offeringthat brings the best live music entertainment to the seas. The Carnival LIVETM concert series features a diverseroster of popular, well known musicians and bands who play a series of onboard concerts for its guests at selectports-of-call. During 2014, the Carnival LIVETM concert series featured 49 performances from 15 majorrecording artists on eight Carnival Cruise Line ships with more concerts scheduled for 2015. The CarnivalLIVETM initiative also includes enhancements to provide guests with a very high calibre of entertainment in barsand lounges onboard its ships.
PRINCESS
Princess is the world’s largest premium cruise line based on passenger capacity and operates a fleet of 18 ships.Princess offers 150 unique itineraries to more than 300 destinations, with cruises generally from seven to 15 dayswith longer exotic sailings from 28 to 104 days, including one world cruise. In 2013, Princess began offeringthree and four day cruises to provide guests, particularly first-time Princess cruisers, an opportunity to experiencethe Princess products and services on shorter voyages.
Princess, whose brand name was originally made famous by the Love Boat television show, has been providingcruises since 1965. In 2015, the line will celebrate its 50th anniversary with an array of celebratory activities andentertainment throughout the year to commemorate half a century of cruising capped with a nostalgic sailing toMexico departing exactly 50 years to the day that the line’s original ship set sail on its very first cruise. Princessrang in the 2015 New Year and its 50th anniversary in an unprecedented way with its first ever float in the worldfamous Rose Parade in Pasadena, California. As a special feature, the six original cast members of the Love Boattelevision show rode on the ship’s bow and “cruised down” the parade route.
The line’s newest ship, Regal Princess, which entered service in May 2014, was christened by the original cast ofthe Love Boat. This ship has a 3,560-passenger capacity, one of the largest in its fleet, and continues theevolution of the Princess products and services. Similar to Royal Princess, which entered service in 2013, RegalPrincess offers a variety of new features, including an over-the-water SeaWalk, which is a top-deck, glass-bottom walkway extending more than 28 feet beyond the ship’s side. The successful design platform of RoyalPrincess and Regal Princess will also be featured in the brands’ new 3,560-passenger capacity sister ship, whichis scheduled to be delivered in March 2017 and will increase the brand’s existing passenger capacity by 8%.
Princess is a leading cruise line in international and exotic destinations, including Europe, Australia, Asia, thePanama Canal, Hawaii and South America. Princess will have six ships sailing in 2015 throughout Europebetween the months of April and November. Princess is also a leading cruise line in Alaska and will continue todedicate seven ships to sailing there between the months of May and September 2015. Princess’ itineraries arewidely praised and have been awarded numerous times over the years by various travel magazines, such asTravel Weekly, Recommend Magazine and Cruise Critic. Some of Princess’ Caribbean cruise offerings feature aprivate island destination that Princess leases and operates, known as Princess Cays®, which is located on theisland of Eleuthera in The Bahamas.
Princess is widely recognized as an innovative, premium cruise line committed to helping its guests EscapeCompletely® from their daily routine and responsibilities. Designed with a warm, welcoming “comfortableelegance,” Princess’ ships provide a relaxed, rejuvenating retreat at sea, with signature amenities offeredconsistently across most of its fleet befitting its mission to be The Consummate Host® to its guests. Its mainatrium serves as the heart of the ship, featuring its International Café and specialty coffee bar, its Vines wine andseafood bar and a variety of entertainment throughout the day and evening. Its “Movies Under The Stars”
14
Stra
tegi
cR
epor
t

outdoor theatres recreate the drive-in movie experience out on deck, with first-run Hollywood movies and majorsporting events shown on a 330 square-foot poolside LED screen, complete with fresh-made popcorn. TheSanctuary, a spa-like retreat reserved just for adults, and unique “Ultimate Balcony Dining” course-by-coursedining option were industry firsts.
In January 2014, Princess introduced a new multi-media marketing campaign designed to redefine its brand anddifferentiate it from other cruise lines. The campaign promotes Princess as being uniquely qualified to provide itsguests with meaningful travel and life experiences in both the destinations travelled and onboard the ship so thatthey will Come Back NewSM from their Princess vacation. Several onboard product initiatives have beenintroduced to support its Come Back NewSM program including a “Chocolate Journey’s” dessert experiencefeaturing master chocolatier Norman Love, wines from the world’s cruising regions and a culinary academy forits guests. Ashore, Princess offers a comprehensive award-winning tours program, from the best of each region totransformative one-of-a-kind experiences. In addition, Princess continues to enhance travel agent support withthe Princess Academy educational program, voted Best Travel Agent Educational Program by Travel Weekly.Approximately 60,000 travel agents around the world have learned about Princess’ product and service offeringsand destinations through this program, making it one of the largest travel industry training programs in the world.
Also in 2014, Princess and Discovery Channel announced their collaboration to create Discovery at Sea, whichincludes interactive onboard activities and shore excursions designed to entertain and delight families onboardPrincess ships and will feature themed tours, science activities, hands-on programs and games. Beginning inearly 2015, the program will bring to life the nature, wildlife and history of the regions their guests are sailing.The content will be based on top-rated Discovery networks, such as Discovery Channel, TLC, Animal Planet andScience Channel and will feature elements of popular television shows, such as Shark Week, Mythbusters andDeadliest Catch.
HOLLAND AMERICA LINE
Holland America Line, which has been providing cruises for over 140 years, operates a fleet of 15 premium mid-sized ships. Holland America Line offers almost 500 cruises to over 400 ports in almost 100 countries andterritories on all seven continents. While its cruises are generally from seven to 21 days, the line also offerslonger, exotic Grand Voyages from 55 to 114 days, including a Grand World Voyage. Holland America Line isone of the leading cruise lines in Alaska and in 2015 will continue to dedicate seven ships to sailing therebetween the months of May and September. Europe also continues to be a key destination in 2015 with six shipssailing there between the months of April and November, offering itineraries throughout the region including theEastern and Western Mediterranean, the Baltic Sea, the Norwegian fjords, British Isles, Iceland and Atlanticcrossings. In the Caribbean, most of Holland America Line’s ships visit its award-winning private island in TheBahamas, Half Moon Cay, known for its pristine beaches, diverse shore excursions, exclusive beach cabanas andkid-friendly activities. Holland America Line has one new 2,650 passenger capacity ship, Koningsdam,scheduled to be delivered in February 2016 and a sister ship in November 2018. The passenger capacity ofHolland America Line will increase by 12% after taking into consideration these two newbuilds, net of their twoships that will be transferring to P&O Cruises (Australia) in November 2015.
Holland America Line’s mission is to create once-in-a-lifetime experiences for its guests every time they cruise.The brand continues to enjoy one of the highest rates of repeat cruisers. Holland America Line’s Signature ofExcellence products and services emphasize its dedication to all aspects of the guest experience, includingelegant accommodations, sophisticated five-star dining and award-winning service. Its mid-sized ships aredesigned for more intimate cruising and feature classically designed interiors, wraparound teak decks and privateverandas. In addition, Holland America Line ships have one of the most extensive collections of art and antiquesat sea.
All of Holland America Line’s ships have Culinary Arts Centers presented by Food & Wine magazine, whereguests enjoy cooking demonstrations, private cooking lessons, wine tastings and lifestyle seminars, as well ascuisine from the recipes of an esteemed Culinary Council including David Burke, Jacques Torres, ElizabethFalkner, Jonnie Boer, Mark Best and Master Chef Rudi Sodamin. In addition, the Digital Workshop powered byWindows, in collaboration with Microsoft®, offers complimentary photo and video editing classes. In theExplorations Café® created in partnership with The New York Times, guests will find specialty coffees, anextensive library and music listening stations. The Greenhouse Spa and Salon has extensive wellness and beautytreatments, fitness classes and exercise equipment. Other marquee partnerships bring guests unique onboardexperiences such as B.B. King’s Blues Club and Dancing with the Stars at Sea, featuring theme cruises, dancelessons and guest dance competitions developed in partnership with the hit television program.
15

SEABOURN
Seabourn provides ultra-luxury cruising vacations on smaller ships that focus on personalized service and guestrecognition, spacious all-suite accommodations, award-winning gourmet dining and unique experiences such asthe Officer on Deck culinary event and the complimentary Evening in Epheus shore event where guests enjoy aclassical music concert in the ancient ruins. Seabourn was voted the “Best Small-Ship Cruise Line” by readers ofTravel + Leisure in five of the past six years and Condé Nast Traveler for four of the past five years. In addition,Saveur named Seabourn “Best Culinary Cruise Line” by its panel of travel experts and editors for the past twoyears. Seabourn’s brand offers travellers a compelling value proposition that includes complimentary open barsthroughout the ship and fine wines during lunch and dinner. Seabourn pampers its guests with value-added extrassuch as Massage MomentsSM on deck and Caviar in the SurfSM beach parties. In 2014, the luxurious Spa atSeabourn onboard the intimate, all-suite Seabourn Odyssey was rated as the “Best Spa on a Cruise Ship” by thereaders of Condé Nast Traveler in the magazine’s annual poll of spa facilities worldwide. Readers also voted thespa facilities on three other Seabourn vessels among the top ten cruise ship spas.
Seabourn’s ships cruise to destinations throughout the world, including Europe, South Africa, Asia, the SouthPacific Islands, Australia, the Americas and Antarctica, with cruises generally from seven to 14 days, with someof longer length. In addition, Seabourn has introduced Extended Explorations, which is a novel way for travellersto enjoy longer cruises, with the added luxury of a wide range of choices regarding where and when they sail.The new, linked itineraries allow guests to deeply explore more extensive regions of the world on voyagesranging from 28 to more than 100 days. In 2014, Seabourn announced a multi-year agreement with the UnitedNations Educational Scientific and Cultural Organization (“UNESCO”) to support UNESCO’s mission ofsafeguarding unique cultural and natural features around the world. This program is designed to promotesustainable tourism and provide Seabourn’s guests with unique access to and a greater understanding andenhanced content at more than 150 World Heritage Sites visited by the line.
Seabourn currently operates three ships, which have between 450 and 458 passenger-capacity, and two 208-passenger capacity ships. The three larger ships offer more categories of luxury suites, more dining alternativesand have some of the largest spa facilities at sea. In response to the popularity of its spas with cruising travellers,Seabourn has created a new category of luxury accommodations called Penthouse Spa Suites, which have aspacious living area, private veranda, sweeping views of the ship and unlimited access to the spa. Penthouse SpaSuites are currently available on Seabourn Quest and Seabourn Odyssey and will be added to Seabourn Sojournin 2015.
All of the Seabourn ships have a service ratio of nearly one staff member per guest and an intimate, sociableatmosphere that has been the hallmark of the Seabourn lifestyle since it began its operations in 1988. Seabournhas two new 604-passenger capacity ships scheduled for delivery in November 2016 and April 2018. Thepassenger capacity of Seabourn will increase by 44% after taking into consideration these two newbuilds, net ofthe capacity of its three smaller ships that were sold in 2013, one of which left its fleet in April 2014 and theremaining two which will be leaving by May 2015.
IV. Europe, Australia & Asia
a. Europe
We believe that Europe is the largest leisure travel vacation region in the world. However, cruising in Europe todate has a lower level of penetration than in North America and represents a relatively small percentage of theEuropean vacation markets. Approximately 6.4 million European-sourced guests took multi-night cruisevacations in 2013 compared to 11.7 million North American-sourced guests. Additionally, we estimate that6.4 million European-sourced guests also cruised in 2014. Because of the relatively low penetration rates andother favourable characteristics of the cruise industry, we expect increased demand in the cruise segments of theEuropean vacation markets.
The most popular location visited by European-sourced cruise guests in 2014 was the Mediterranean Sea andother locations include Atlantic Isles (including the Canary Islands and Madeira), Northern Europe (includingScandinavia), the Caribbean, Bermuda, the Arabian Gulf and the Indian Ocean, China, Japan, South Korea, SouthAmerica, New York, New England and Canada.
16
Stra
tegi
cR
epor
t

1. United Kingdom
The UK provides the largest number of cruise guests sourced in Europe. Approximately 1.7 million UK-sourcedguests took a multi-night cruise vacation in 2013, and we estimate that a similar number of guests cruised in2014. Cruising in the UK is a well-established alternative to land-based vacations. P&O Cruises (UK) sourcessubstantially all its guests from the UK. Cunard sources approximately half of its guests from the UK and sourcesprincipally all of its other guests from North America, Germany and Australia.
P&O CRUISES (UK)
P&O Cruises (UK) is the leading and most recognized cruise brand in the UK and can trace its roots back 177years to the formation of the Peninsular Steam Navigation Company. P&O Cruises (UK) is dedicated toproviding the holiday of a lifetime to its British guests and operates a fleet of seven premium ships that vary insize from 700 to 3,100 lower berths. Three of its ships offer holidays exclusively for adults while the other shipsare well-suited for families. P&O Cruises (UK) has a new 3,647-passenger capacity ship, Britannia, scheduled tobe delivered in late February 2015, which will increase its existing passenger capacity by 25%. Britannia will bethe largest cruise ship built exclusively for the British market. British Broadcasting Corporation (“BBC”)Formula One racing presenter Suzi Perry started the engines of Britannia for the first time in 2014, as part of aseries of creative events leading up to the christening of this new ship.
P&O Cruises (UK)’s ships visit over 200 destinations worldwide, with cruises generally from seven to 17 days,with a number of longer voyages, including two world cruises of over 100 days in 2015. The line also offers anumber of shorter cruises designed to attract first time cruisers. In the summer, cruises generally depart fromSouthampton, England to the Mediterranean Sea, Scandinavia and the Baltic Sea, New England and Canada, theAtlantic Isles and the Caribbean. In the summer, P&O Cruises (UK) also offers seven or 14 day voyagesdeparting from Venice and Genoa, Italy and sailing in the Mediterranean. In the winter, the line generally offerscruises in the Caribbean, the Mediterranean, the Canary Islands and world cruises.
P&O Cruises (UK)’s fleet reflects the tastes and trends of contemporary Britain in ambiance, dining,entertainment and service. This is enhanced through partnerships with British celebrity chefs Marco PierreWhite, Atul Kochhar, James Martin and Eric Lanlard and with British wine expert Olly Smith. The line alsooffers cruises themed after the popular television series, Strictly Come Dancing from the BBC, whereprofessional dancers, judges and guests bring all the glamour of the ballroom to the sea. P&O Cruises (UK)provides an authentic, quality cruise experience and has an enviable reputation for trust and reliability,highlighted by high levels of customer loyalty.
In 2014, P&O Cruises (UK) introduced a new contemporary external design on Aurora that stylishly incorporatesthe national flag of the UK sweeping down the sides of its hull. The ship also has a blue funnel carrying anilluminated rising sun, which represents the Oriental part of the Peninsular and Oriental name. The new designsymbolizes the future while celebrating its British traditions. Britannia will also feature the new design when itenters service in 2015 and the remainder of the fleet will receive the design enhancements by the end of 2016.Britannia will include a number of new innovations for passengers, most notably the culinary school incollaboration with James Martin and the Limelight Club, which will combine great food with dazzlingentertainment.
CUNARD
Cunard celebrates its 175th anniversary in 2015. The line operates three premium/luxury ships, Queen Elizabeth,Queen Mary 2 and Queen Victoria, and has one of the youngest fleets in the cruise industry. During 2014, QueenMary 2 celebrated her 10th anniversary with an onboard concert by the world renowned singer, James Taylor,while she sailed on a Transatlantic crossing. During 2015, Cunard ships, which have between 2,000 and 2,600-passenger capacity, will sail a variety of seasonal itineraries including world cruises to destinations in NorthernEurope, the Mediterranean Sea and New England and Canada, as well as their iconic transatlantic voyages onQueen Mary 2. Most of Cunard’s cruises are generally from seven to 14 days with three world cruises of over100 days.
17

Cunard offers guests a unique experience that celebrates its British heritage and enjoys an enviable associationwith the British Royal Family. Her Majesty the Queen is Godmother to both Queen Elizabeth and Queen Mary 2.Cunard provides guests with the opportunity to relive the golden age of ocean travel and features sophisticatedfive-star dining, luxurious accommodations and award-winning White Star Service. Cunard’s premium/luxurycruise product enables its guests to enjoy a wide variety of shipboard amenities and entertainment, includingspas, cinemas, a planetarium onboard Queen Mary 2, libraries, traditional British pubs and theatres. Its renownedguest lecture program, Insights, includes prominent speakers and entertainers such as Buzz Aldrin, FW De Clerk,Kim Novak and Crosby Stills and Nash for 2015. Cunard ships also feature the Queen’s Grill and Princess Grill,which are renowned for their exclusive suites and intimate dining rooms. Together, these features furtherdistinguish this historic brand from all others and have made Cunard ships the Most Famous Ocean Liners In TheWorldSM.
2. Continental Europe
The main countries in continental Europe for sourcing cruise guests are Germany, Italy, France andSpain. Together, almost 3.6 million cruise guests were sourced from these countries for multi-night cruisevacations in 2013, and we estimate that a similar number of guests also cruised in 2014. The German cruiseindustry reached more than 1.7 million guests in 2014 and is the second largest source market in Europe, after theUK. The Italian cruise industry is the third largest in Europe with almost 870,000 guests in 2014. The French andSpanish cruise industries are the fourth and fifth largest in Europe with almost 520,000 guests and 470,000 guestsin 2014, respectively.
The principal sources for Costa’s guests are from Italy, China, France and Germany, although it also sources asignificant number of guests from Spain, Argentina and Brazil. AIDA sources substantially all of its guests fromGermany.
COSTA
Costa is Europe’s largest cruise line based on guests carried and passenger capacity. In 2014, Costa carried1.7 million guests sourced from around the world. It is also the number one cruise line in Italy and France andone of the largest cruise lines in the German cruise industry. Costa has been providing cruises for 67 years andoperates a fleet of 15 contemporary ships. In Germany, where we also own and operate AIDA, Costa offers amore traditional cruise product and services catering to a different guest profile than AIDA.
Costa calls on 270 ports around the world and offers 150 different itineraries, with cruises generally from sevento 11 days. In the summer, Costa deploys its ships in the Mediterranean Sea and Northern Europe. In the winter,Costa deploys its ships in Brazil and Argentina, the Mediterranean Sea, the Caribbean and the Arabian Gulf.Costa is an undisputed leader in the Mediterranean where it boasts a tradition spanning close to seven decadesand was the first cruise company to operate Mediterranean cruises year-round. See Item 2. Business. C. “OurGlobal Cruise Business – Asia” for additional discussion of Costa’s operations in Asia.
Costa’s new 3,692-passenger capacity ship, Costa Diadema, was delivered in October 2014 and increased itspassenger capacity by 11%. The brand’s new flagship offers unique onboard attractions, such as the Passeggiataal Mare (or Seaside Walk), a specifically-themed deck around the ship that resembles a gorgeous Italian Rivieraseafront with bars and restaurants. In 2015, Costa Diadema will take guests to the most celebrated destinations inthe Western Mediterranean and introduce new excursions, such as tastings and cycling tours, which enable itsguests to experience each port-of-call in a unique way. An exclusive feature on Costa Diadema will be StarLaser, a completely new area that will amaze guests with different styles of interactive laser games.
During 2014, Costa enhanced its international advertising activities to support its sales growth and launched anew advertising campaign to support its position as the world ambassador of Italy’s finest. Costa’s shipsrepresent the best of Italy by offering beautiful Italian art, unique interior decorations with superb Italianmosaics, precious Murano chandeliers, fine Italian wines, excellent Mediterranean food selections and unique
18
Stra
tegi
cR
epor
t
shops that carry well-known Italian fashion brands. Costa attracts international guests due to its multi-lingualservice and is considered in Europe to be a top vacation provider. Costa is also known for offering innovativeitineraries that combine the excitement of new destinations with pampering onboard service and ambiance. Thespectacular Samsara spa wellness centre includes a dedicated restaurant and cabins with direct access to the spa.
In 2014, Costa debuted a new style of cruising onboard three of its smaller ships with the advent of theneoCollection. The neoCollection cruises are an invitation to make the most of every minute and enjoy theholiday in a more leisurely way. This is a new type of Costa cruise experience that is tailored to suit individualtastes and allows each guest to go at their own pace, both onboard and ashore, making it an ideal vacation forcouples as well as groups of friends. The exclusive cruise itineraries include longer port calls and sailings todestinations inaccessible by larger cruise ships, including destinations declared UNESCO World Heritage Sites.The neoCollection offers 11 day sailings to the most attractive destinations in the Mediterranean Sea duringspring and summer, as well as 12 and 14 day cruises in Northern Europe also during the summer. TheneoCollection cruises offer a range of options, such as specially designed shore excursions for small groups andfine food and wine options based on the authentic cuisine of the regions visited.
AIDA
AIDA, which began operating in 1996, is the leader and most recognized cruise brand in the German cruiseindustry. Germany is our fastest growing European market and AIDA is our fastest growing cruise brand. AIDAhas taken delivery of seven ships in the past eight years and now operates ten premium ships featuring a resortcasual atmosphere. AIDA has one new ship scheduled to be delivered in September 2015 and another one inMarch 2016, which together will increase its existing passenger capacity by 35%.
AIDA’s two newbuilds are a new design, larger than AIDA’s current generation of vessels and combine anadvanced technological platform featuring a new energy efficient hull design along with innovative guestfeatures. These 3,286-passenger capacity ships feature several unique amenities, such as two foil-domed outsidedecks that can be used year-round, the new Four Elements Fun Park with the world’s largest water slide at sea, anice-skating rink, Lanai cabins with private winter gardens, as well as AIDA’s onboard hallmarks, such as atheatre in the centre of the ship’s atrium and a micro-brewery. AIDA’s brand image underlines its leadership inthe German speaking vacation market and highlights its product’s individuality, which is “Unique. Everytime…AIDA.”
AIDA offers its guests cruises generally from three to 21 days, while calling on over 190 ports. In the summer,AIDA ships generally sail in the North Sea, the Baltic Sea, the Atlantic, the Mediterranean Sea, the U.S. EastCoast and Canada. In the winter, AIDA ships generally sail in the Caribbean, Southeast Asia, the Arabian Gulf,Central America, the Atlantic Isles and the Mediterranean Sea.
AIDA’s product is especially tailored for German-speaking guests and includes a German-speaking crew as wellas German-style food and entertainment. AIDA’s ships include a variety of informal and formal dining options,including buffets, grills and exclusive restaurants. AIDA offers an exceptionally relaxed, yet active, cruisingexperience with an emphasis on a healthy and youthful lifestyle, choice, informality, family friendliness andactivity. In 2014, AIDA was voted Germany’s most family-friendly cruise company based on an independentsurvey. Family friendliness is a top priority onboard AIDA ships and is also a key component of its philosophy.This includes onboard facilities designed with children in mind, family-focused offerings, warm-heartedchildcare services and family-friendly cabins with connecting doors. These features provide the perfect vacationexperience for the entire family.
b. Australia
Approximately 840,000 Australian and New Zealand guests took multi-night cruise vacations in 2013, and weestimate that almost 950,000 guests cruised in 2014. Of these, over 70% sailed on Carnival Corporation & plcbranded vessels. Cruising in Australia is an established alternative to land-based vacations. However, due to thefavorable characteristics of the cruise industry, we expect increased demand in the cruise segment of theAustralian vacation market. By the end of 2015, we will dedicate nine ships year round and six ships on a
19

seasonal basis to serve this market through our P&O Cruises (Australia), Princess and Carnival Cruise Linebrands. Some of our other brands also source guests from Australia and New Zealand but to a lesser extent.Carnival Cruise Line and Princess are primarily marketed in North America, so we consider them North Americacruise brands for our cruise segment reporting, even though some of their ships are marketed principally toAustralians and New Zealanders during certain deployments.
P&O CRUISES (AUSTRALIA)
P&O Cruises (Australia) is a leader in the Australian cruise industry and is recognized by nine out of tenAustralians as the brand synonymous with cruising. P&O Cruises (Australia) was voted one of Australia’s mosttrusted brands by Readers Digest in 2014. With over 270,000 guests annually, P&O Cruises (Australia) carriedalmost 30% of all Australian and New Zealand cruise guests on its three contemporary ships in 2014. Its shipsoffer cruises generally from three day themed seabreaks to ten day explorer trips for guests of all ages and havebroad appeal to families, couples and groups of friends. In November 2015, P&O Cruises (Australia) will takedelivery of the 1,260-passenger capacity Ryndam and Statendam from Holland America Line, which will berefurbished and renamed Pacific Aria and Pacific Eden, respectively. These two ships will increase the line’sexisting capacity by 52%. As part of their refurbishments, these ships will feature the largest ever array ofrestaurant offerings including a market place of fresh food outlets that will replace the traditional cruise buffet.
P&O Cruises (Australia) sails to more South Pacific Island destinations than any other cruise line and it enablesguests to discover these islands from New Caledonia to Fiji. In addition, remote idyllic parts of Papua NewGuinea are also included in their itineraries. P&O Cruises (Australia) also offers year round itineraries toAustralia’s magnificent coast line and New Zealand. With a fleet of five ships, P&O (Australia) will have alarger footprint and will be able to open more of Australia and New Zealand for cruising, offering extendedseasons from existing homeports and adding new homeports and ports-of-call.
With almost 80 years of cruising experience, P&O Cruises (Australia) provides a quintessential holidayexperience for Australians and New Zealanders. The onboard atmosphere is laid back with a focus on great food,friendly service and exciting entertainment. Australians like to be active and the line caters to that by offeringnumerous activities while also giving its guests flexibility and freedom of choice during their cruises. In late2013, P&O Cruises (Australia) launched P&OEdgeTM, one of the most comprehensive adventure programs on thehigh seas. The P&OEdgeTM program provides its guests with the opportunity to climb, swing, race and jump theirway to parts of the ship never seen before by guests. The activities, which include repelling, ziplining, tight-ropebalancing, Segway obstacle courses, rock wall climbing and many more, have been specifically designed to makeuse of the ship’s existing architecture to create one of the largest adventure parks at sea.
PRINCESS
In 2015, Princess will deploy three premium ships on a year-round basis and another two on a seasonal basisfrom Australia. During 2015, Princess will have the largest Australian and New Zealand passenger capacitydeployment of any cruise brand. Princess’ ships visit the South Pacific Islands, Australia, New Zealand and Asiaand the cruises are generally from 11 to 17 days, with one world cruise of over 100 days.
CARNIVAL CRUISE LINE
In 2015, Carnival Cruise Line will continue to deploy two contemporary ships from Australia, one on a year-round basis and one seasonally-based. These ships offer cruises from three to 19 days to the South Pacific Islandsand New Zealand. These ships have been refurbished to ensure they are tailored to this market, pairing the bestmix of award winning American innovations to suit Australian tastes. Since October 2012 when Carnival CruiseLine began its Australia cruise program, the line has carried more than 200,000 guests and has proven extremelypopular in the cruise segment of the Australian vacation market, particularly among families.
c. Asia
20
Stra
tegi
cR
epor
t
Although in the early stages of development, we believe the cruise segment of the Asian vacation markets hassignificant long-term potential for growth. In 2013, the Asia Cruise Association (“ACA”) estimated that therewere roughly 1.3 million Asian-sourced passengers from the 12 primary source markets in Asia, of whichChinese-sourced were the largest share. The ACA also estimated that Asian demand for cruises has the ability toalmost triple to four million annual cruisers by 2020, with the Chinese source market potentially growing toroughly 1.6 million passengers. Accordingly, we view Asia as an important part of our global strategy andremain committed to capacity growth focused on the emerging vacation markets in this region. Over the pastthree years, we have increased our presence in the region by opening 12 sales and marketing offices in six Asiancountries and established a corporate office in Singapore.
We serve this market substantially through our Costa and Princess brands although some of our other brands alsosource guests from Asia. Princess is primarily marketed in North America, so we consider it a North Americacruise brand for our cruise segment reporting, even though some of its ships are marketed principally to Asiansduring certain deployments.
China
Over the past decade China has been, by far, the world’s fastest growing tourism source market. In 2012, China’sconsumer expenditures on travel abroad reached over $100 billion, making it the number one tourism sourcemarket in the world based on spending, according to the United Nations World Tourism Organization. Tourism isone of the most rapidly growing sectors in the Chinese economy as Chinese discretionary income has increasedat a compound average annual growth rate of over 10% over the past five years. More than 100 million Chinesetourists are expected to have travelled abroad in 2014. Since 2013, international cruise companies have increasedtheir investments in China, doubling the number of cruise ships, as well as increasing the routes and frequency ofsailings. As a result, the number of Chinese tourists taking cruises increased by more than 50% in 2014. Based onan internal survey, by 2017 China has the potential to become one of the largest cruise markets. By 2022, it isestimated that more than 75% of urban Chinese households will be in the middle class. Reflecting this potentialgrowth, the Chinese government has identified cruising as an industry to further develop and is makingsubstantial investments in cruise-related infrastructure, such as cruise port terminals and shipbuilding.
In 2006, we began sourcing our Chinese guests mostly from major areas, such as Shanghai, Beijing, Jiangsu andGuangdong, which have a combined population of approximately 230 million. We believe the cruise segment ofthe Chinese vacation market has significant long-term growth potential given its early stage of development withhealthy demand from these first-tier mega cities and areas, the large and growing middle-class population,cruising’s value proposition as a family oriented vacation alternative for the growing middle-class Chineseconsumer, the easing of travel restrictions, increasing support from the Chinese government and expansion oftheir international tourism aspirations. Due to the high importance we place on the emerging China cruisemarket, we relocated our Chief Operations Officer to China in 2014 to oversee our brands’ strategic initiativesand coordinate our growth strategy in China and the surrounding markets.
As we execute our strategy to accelerate growth in China, we have the benefit of eight years of local experienceto help guide our expansion and enhance our cruise products and services and make them even more attractive toour Chinese guests. As part of our strategy, we are exploring opportunities aimed at the development of adomestic cruise company and the formation of a domestic cruise shipbuilding company, as well as local portdevelopment, talent development and training, enhanced relationships with our distribution partners and sharingof supply chain and logistics expertise.
As we continue to redeploy our ships to the region, we carefully design itineraries to fit the lifestyle of ourChinese guests. For example, our ships deployed in China offer itineraries that average four to five days since ourChinese guests have significantly fewer vacation days compared to guests in more established markets. Also, thedestinations our ships visit are driven by our Chinese guests’ ability to obtain visas for international travel.Currently, Japan and South Korea are the preferred destinations for Chinese cruisers. However, as the cruisesegment of the Chinese vacation market continues to develop, we will continue to work on identifying anddeveloping new destinations that are both attractive and viable.
Currently, most cruises in China are regional. In the future, as we develop the cruise market and raise consumerawareness, we expect to increase our offerings of fly cruise packages.
21
COSTA
Costa began its China operations in 2006 and was the first international cruise line to home port a ship there.Costa operates two contemporary ships from China that are primarily marketed to the Chinese. Costa is addinganother ship, the 2,984-passenger capacity, Costa Serena, in April 2015, which will increase its capacity in Chinaby 74%. These ships offer a unique product, referred to as Italy at Sea, which provides a blend of both Italian-style hospitality, design, shopping experience and cuisine, as well as catering to Chinese-speaking guests’ desiresfor local cuisine and entertainment, gaming options and well-known luxury brands in their retail shops.
Costa offers its guests cruises generally from four to five days. One of its ships offers cruises to South Korea andJapan year-round. Costa’s other ship also sails from China to Japan and South Korea from the spring through thefall months. During the winter months, it sails from Singapore calling on ports in Malaysia and Thailand andfrom Hong Kong calling on ports in mainland China, Vietnam and the Philippines. Costa Serena will also sailyear-round from China to Japan and South Korea.
PRINCESS
In 2014, Princess successfully entered the cruise segment of the Chinese vacation market with its four-monthdeployment of the 2,678-passenger capacity Sapphire Princess on cruises departing from Shanghai. SapphirePrincess brings a new premium cruise experience, which the line calls “Princess Class” to the cruise segment ofthe Chinese vacation market with an onboard product that is also customized to meet the needs of its Chineseguests. Local offerings included World Leader dinners, Tai Chi at sea, Ocean View Hot Pot dinner, Adventuresin English enrichment classes and “Princess Night” stateroom amenities. The China season features itinerariesthat are generally from three to five days and include calls at several South Korean ports.
V. Ships Under Contract for Construction
As of February 20, 2015, summary information of our ships under contract for construction is as follows (a) :
Cruise Brands and Ships Expected Delivery Date Passenger Capacity
North AmericaCarnival Cruise LineCarnival Vista . . . . . . . . . . . . . . . . . . . . . . . . . . . . . . . . . . . . . . . . . . . 4/16 3,972Newbuild . . . . . . . . . . . . . . . . . . . . . . . . . . . . . . . . . . . . . . . . . . . . . . . . 3/18 3,954
Princess CruisesNewbuild . . . . . . . . . . . . . . . . . . . . . . . . . . . . . . . . . . . . . . . . . . . . . . . . 3/17 3,560
Holland America LineKoningsdam . . . . . . . . . . . . . . . . . . . . . . . . . . . . . . . . . . . . . . . . . . . . . 2/16 2,660Newbuild . . . . . . . . . . . . . . . . . . . . . . . . . . . . . . . . . . . . . . . . . . . . . . . . 11/18 2,650
SeabournSeabourn Encore . . . . . . . . . . . . . . . . . . . . . . . . . . . . . . . . . . . . . . . . 11/16 604Seabourn Ovation . . . . . . . . . . . . . . . . . . . . . . . . . . . . . . . . . . . . . . . 4/18 604
North America Cruise Brands . . . . . . . . . . . . . . . . . . . . . . . . . . . . . . . . 18,004
EAAP&O Cruises (UK)Britannia . . . . . . . . . . . . . . . . . . . . . . . . . . . . . . . . . . . . . . . . . . . . . . . . 2/15 3,647
AIDAAIDAprima . . . . . . . . . . . . . . . . . . . . . . . . . . . . . . . . . . . . . . . . . . . . . . 9/15 3,286Newbuild . . . . . . . . . . . . . . . . . . . . . . . . . . . . . . . . . . . . . . . . . . . . . . . . 3/16 3,286
EAA Cruise Brands . . . . . . . . . . . . . . . . . . . . . . . . . . . . . . . . . . . . . . . . . . 10,219
28,223
(a) Our ship construction agreements cannot be cancelled by either party without cause, and such cancellationwill subject the defaulting party to contractual liquidated damages. All of our ship construction contractsexcept AIDA’s are with Fincantieri in Italy. Our AIDA ship construction contracts are with Mitsubishi HeavyIndustries in Japan.
22
Stra
tegi
cR
epor
t

VI. Cruise Ports and Destination Developments
Our cruise brands provide guests with unique vacation experiences and additional home and transit ports throughthe development and management of new or enhanced cruise port facilities. Creating leading destinations as wellas securing preferred ports enables us to grow demand and deliver unique experiences to our guests. Ourinvolvement is usually in cooperation with governmental entities and local operators and typically includesproviding development and management expertise and financial commitments that are connected to long-termport usage and preferential berthing agreements. However, sometimes we provide direct financial support ordevelop the port infrastructure ourselves, including the development and operation of mixed-use commercialproperties. Commercial property lease revenues are included in other cruise revenues. We currently operate orare developing:
• Leased or owned port facilities or have interests in joint ventures that operate leased or owned portfacilities in Barcelona, Spain; Civitavecchia, Naples, Savona and Trieste, Italy; Hamburg, Germany;Juneau, Alaska; Long Beach, California and Marseilles, France for the benefit of our cruise brands and
• Leased or owned port facilities that we have developed, or are in the process of developing, asdestinations in Cozumel, Mexico; Grand Turk, Turks and Caicos Islands; Roatán, Honduras and PuertoPlata, Dominican Republic; as well as private island destinations in The Bahamas, Half Moon Cay andPrincess Cays®, primarily for the benefit of our North America cruise brands. The facility in PuertoPlata, Dominican Republic, known as Amber Cove, is a new port destination strategically located inthe central Caribbean cruise region and is expected to be opened in October 2015.
These destinations offer a variety of features, including shore excursions, cultural and historic exhibits, watersports, beaches, retail outlets and a variety of themed-dining options. These features come together to make eachof these ports-of-call a unique vacation experience for our guests.
In addition, we are involved with the development, enhancement and/or financing of government-owned andoperated cruise port facilities in Cape Canaveral, Fort Lauderdale and Miami, Florida; Galveston, Texas; NewOrleans, Louisiana; New York City, New York; San Juan, Puerto Rico and St. Maarten, Kingdom of theNetherlands.
VII. Cruise Ship Repair Facility
We own a 40% interest in Grand Bahamas Shipyard Ltd. (“GBSL”), which is the largest cruise ship dry-dockrepair facility in the world, to support our ship repair and maintenance programs. We utilize this facility, as wellas other ship repair facilities, for our regularly scheduled dry-dockings and certain emergency repairs as may berequired. This repair facility, located in Freeport, Grand Bahamas, has three dry-docks and can accommodatealmost all of our ships. As a result, our North America brand ships based in the Caribbean primarily use thisfacility given its proximity to their home ports. During 2014, we had 13 ships serviced at this facility. In addition,unaffiliated cruise ships and other types of ships, such as cargo and oil and gas tankers and offshore units, areserviced at this facility. GBSL generated total revenues of over $140 million in 2014, with a large portion beingderived from work on our cruise ships.
Royal Caribbean Cruises Ltd. (“RCCL”) also owns a 40% interest in GBSL and an unaffiliated entity owned byGrand Bahamas Port Authority owns the remaining 20%. We account for our investment in GBSL using theequity method, with our share of income or loss recorded in other nonoperating income or expense. AtNovember 30, 2014, our total net investment in, including notes receivable from, GBSL was $69 million. AtNovember 30, 2014, GBSL had $164 million of outstanding debt and accrued interest due in equal parts to RCCLand us.
VIII. Cruise Pricing and Payment Terms
Each of our cruise brands publishes prices for the upcoming seasons primarily through the internet, althoughpublished materials such as brochures and direct mailings are also used. Our brands have multiple pricing levelsthat vary by cruise line, category of cabin, ship, season, duration and itinerary. Cruise prices frequently change ina dynamic pricing environment and are impacted by a number of factors, including the number of availablecabins for sale in the marketplace and the level of guest demand. Some cruise prices are reduced through specialpromotions and early booking, past guest recognition and other programs. Conversely, some cruise prices areincreased due to higher demand.
23
Our bookings are generally taken several months in advance of the cruise departure date. Typically, the longerthe cruise itinerary the further in advance the bookings are made. This lead time allows us to manage our pricesin relation to demand for available cabins through the use of advanced revenue management capabilities andother initiatives, with the typical strategy of filling our ships while achieving the highest possible overall netrevenue yields. In addition, we have the ability to change ship itineraries and cruise durations over time tomaximize our net revenue yields. See Item 3. Business Review -“Key Performance Non-GAAP FinancialIndicators” within this Strategic Report for a discussion of net revenue yields.
The cruise ticket price typically includes the following:
• Accommodations,• Most meals, including snacks at numerous venues,• Access to amenities such as swimming pools, water slides, water parks, whirlpools, saunas, a health
club, a jogging track, basketball, table tennis, sun decks and libraries,• Child care and supervised youth programs,• Entertainment, such as theatrical shows, movies, comedy shows and musical performances and other
venues such as nightclubs, lounges and bars, themed parties and cooking demonstrations and• Access to exclusive private islands and destinations.
Our brands’ payment terms generally require that a guest pay a deposit to confirm their reservation and then paythe balance due before the departure date. In Australia and most of Europe, we are obligated to honor our guests’cruise payments made by them to their travel agents and tour operators regardless of whether we have receivedthese payments. Our guests utilize various forms of payment, such as credit and debit cards or direct debits, topay for their cruise ticket and onboard purchases, which results in us incurring fees, which are included incommissions, transportation and other, and onboard and other expenses.
Our guests are subject to a cancellation fee if they cancel their cruise within a pre-defined period before sailing,unless they purchase a vacation protection package for the ability to obtain a refund. We include this cancellationfee income in cruise passenger ticket revenues at the time of cancellation. Guests who purchase vacationprotection packages will receive all or a portion of their deposit value back in cash or in the form of a futurecruise credit, in accordance with the terms of the programs. We include the premiums for these vacationprotection packages in other cruise revenues. In addition, substantially all of our brands recommend that ourguests pay a voluntary hotel service charge, which is collected by us and directly paid out to our ships hotelservice staff.
As a convenience to our guests, we offer to arrange air transportation to and from airports near the home ports ofour ships. When a guest elects to purchase air transportation from us, both our revenues and expenses generallyincrease by approximately the same amount. Air transportation prices typically vary by gateway, ticket class,destination and other ticket restrictions. In 2014, approximately 11% of our guests purchased air transportationfrom us. In order to increase the level of our air transportation services, certain of our brands offer an air programthat includes competitive air prices (for both restricted/non-refundable and flexible fares) and provides our guestswith next port protection, which enables them to get to the next appropriate cruise port at no additional air cost ifthey miss their original port embarkation due to airline delays or other airline service disruptions. In addition, wecharter aircraft to facilitate our guests’ travel to distant locations for some of our European brands’ cruiseitineraries. We also offer ground transfers from and to the airport near the ship’s home port as part of our transferprograms. When a guest elects to purchase these transfer services these revenues are included in cruise passengerticket revenues.
IX. Onboard and Other Revenues
Onboard and other activities are provided either directly by us or by independent concessionaires, from which wereceive either a percentage of their revenues or a fee. In 2014, we earned 24% of our revenues from onboard andother revenue activities and services not included in the cruise ticket price including the following:
• Substantially all liquor and some non-alcoholic beverage sales, • Communication services,• Casino gaming, • Full service spas,• Shore excursions, • Specialty themed restaurants,• Gift shop sales, • Art sales and• Photo sales, • Laundry and dry cleaning services.
24
Stra
tegi
cR
epor
t
Our brands are working on innovative ways to enhance our guests’ onboard experiences and increasing ouronboard revenues, such as offering all-inclusive beverage and spa packages. We use various marketing andpromotional tools and are supported by point-of-sale systems permitting “cashless” transactions for the sale ofthese onboard and other products and services. As a convenience to our guests, all our brands allow their gueststo pre-book, and in most cases pre-pay, certain of their onboard and other revenue-producing activities inadvance of the cruise. Carnival Cruise Line also offers gift cards at more than 9,000 retail locations throughoutthe U.S. in 2015. The value of these gift cards can be applied to the guest’s cruise ticket price or their onboardpurchases.
We offer a variety of shore excursions at each ship’s ports-of-call that include general sightseeing, cultural tours,adventure outings and local boat rides and beach experiences. We typically utilize local operators who provideshore excursions with guides who speak the same languages as most of our shore excursion guests. For oursailings to destinations in Alaska, shore excursions are operated by our wholly owned company, HollandAmerica Princess Alaska Tours, or provided by local independent operators. We also offer revenue-producingactivities on the private islands and port destinations that we operate that include beach bars and restaurants,water sports, cabana rentals and chair lift and surf rider attractions.
Our casinos are all owned and operated directly by us and are equipped according to the unique requirements ofour individual brands, which are driven by the ships’ itineraries and the market from which their guests aresourced. We offer a wide variety of slot and gaming machines and a diverse mix of both traditional and specialtytable games designed to meet the desires of our guests. We have also developed marketing and promotionalarrangements with land-based casino companies in order to increase the number of casino players onboardcertain of our brands. The casinos are only open when our ships are at sea in international waters or whenotherwise permitted by law.
In conjunction with our cruise vacations, many of our cruise brands sell pre-and post-cruise land packages of oneto four days that include guided tours, hotel accommodations and related transportation services. In Alaska andthe Canadian Yukon, we utilize, to a large extent, our own hotel and transportation assets. The land portion ofthese Alaska and Yukon vacations vary in length from three to 13 days. Additionally, we earn revenues fromvarious promotional and other programs with destination retailers, parking facilities, credit card providers andother destination-based incentives.
X. Sales Relationships
We sell our cruises mainly through travel agents, including retail, online and home-based agents, as well aswholesalers, general sales agents and tour operators that serve our guests in their local markets. These partiestypically sell cabins to individuals and groups, but occasionally will charter a full or partial ship for incentive orother large events. Our individual cruise brands’ relationships with their travel agents are generally independentof each of our other brands. Our travel agent relationships are generally not exclusive and travel agents generallyreceive a base commission, plus the potential of additional commissions, including complimentary tourconductor cabins, based on the achievement of pre-defined sales volumes. Most travel agents also sell cruises andother vacations provided by our competitors. During fiscal 2014, no controlled group of travel agenciesaccounted for 10% or more of our revenues.
In China, we generally sell cruises to our Chinese-sourced guests by chartering our ships to travel organizationsthat have travel agent licenses authorized to sell travel products in China. There are a limited number of Chineseagencies that have these licenses. As we do not have a travel agent license, we are currently unable to sell cruisesor shore excursions directly to our guests. Those cruises that are not fully chartered are also sold through theselicensed outbound travel agencies who generally purchase groups of cabins from us.
Travel agents are an integral part of our long-term cruise distribution network and are critical to our success. Weutilize local sales teams to motivate travel agents to support our products and services with competitive sales andpricing policies and joint marketing and advertising programs. We also employ a wide variety of educationalprograms, including websites, training seminars and videos, to familiarize agents with our cruise brands and theirproducts and services. For example, Carnival Conversations is a series of events organized by Carnival CruiseLine that feature product training on the brand’s latest innovations, such as Fun Ship® 2.0.
Substantially all of our cruise brands offer interactive online and other education courses for travel professionalswho want to continue learning about the cruise industry and how to effectively sell our cruise products andservices. For example, our Costa brand continues to provide support of their trade partners by not only
25

reinforcing traditional training, such as their onboard sales academies, but also in the digital arena with thelaunch of Costa Extra, Costa Booking and “emotional quotation” online tools in 2014. Costa Extra, which is anonline community that is fully integrated with Costa’s booking engine and its contact center, serves as a socialnetwork dedicated to the Costa brand. It includes all the latest training materials, promotions for guests and trade,webinar functionality and capability for each travel agency to track its progress against targets. Costa’s Bookingengine is placed on the website of travel partners allowing them to better compete in the digital world.“Emotional quotation” provides the travel agents with a capability of sending a personalized website with detailsof a cruise that the guest is interested in during the booking process.
We are a customer service driven company and continue to invest in our service organization to assist travelagents and guests before, during and after their cruise. We believe that our support systems and infrastructure areamong the strongest in the vacation industry. Our investment in customer service includes the development ofemployees, processes and systems. We continually improve our systems within the reservations and customerrelationship management functions, emphasizing the continuing support and training of the travel agencycommunity.
All of our brands have developed internet booking engines to allow travel agents to book our cruises. We alsosupport travel agent booking capabilities through global distribution systems. We estimate that almost 70% ofour bookings from travel agents are made electronically.
All of our cruise brands have their own consumer websites that provide access to information about theirproducts and services to users and enable their guests to quickly and easily book cruises and other products andservices online, which is especially important to the millennial generation of cruisers. These sites interface withbrands’ social networks, blogs and other social media sites, which allow them to develop greater contact andinteraction with their guests before, during and after their cruise. We also employ vacation planners who supportour sales initiatives by offering our guests cruise planning expertise and other services.
XI. Marketing Activities
Guest feedback and research support the development of our overall marketing and business strategies to drivedemand for cruises and increase the number of first-time cruisers. We measure and evaluate key drivers of guestloyalty and satisfaction that provide valuable insights about guests’ cruise experiences and the likelihood ourguests will recommend our brands’ cruise products and services to others. For example, we measure our guests’net promoter scores to monitor our guests’ satisfaction with our products and services. We also regularly initiatecustomer research studies among guests, travel agents, tour operators and others for input on business decisionsthat enhance our cruise products and services for our guests. Furthermore, with increased collaboration betweenour brands and access to vast databases of past guest information, we are able to perform psychographicsegmentation studies that allow us to better understand our guests’ needs, wants and expectations. The results ofthese studies shape how we communicate, advertise and refine the booking process, overall onboard experience,as well as post-cruise interactions. Our ability to identify the psychographic mix is a powerful differentiator,which allows us to guide guests to the right experiences with the appropriate brands and build advocates for life.
Each of our brands has comprehensive marketing and advertising programs to promote their products andservices to vacationers and travel agents in their source markets. Each brand’s marketing activities are generallydesigned to reach a local market in the local language. The principal mediums used for marketing and advertisingare online display/advertising, online search, television, brand websites, direct mail, social media, e-mail,magazine, radio and outdoor billboards.
We continue to expand our marketing efforts to attract new guests online by leveraging the reach and impact ofdigital marketing and social media, such as Facebook, Twitter, YouTube, Blog, Google+, Flickr, Instagram andPinterest. This helps us cultivate guests as advocates of our brands, ships, itineraries and onboard products andservices. At the end of 2014, we had almost 10 million “Likes” on Facebook for all our brands. We also haveblogs hosted by ship captains, cruise and entertainment directors, executive pursers and special guests. We useTwitter to enhance our customer service and as part of our public relations strategies to inform the press, popularbloggers, fans and brand advocates of new developments and breaking news stories.
In 2014, we launched our first-ever multi-brand marketing initiative incorporating all nine of our brands withtelevision, digital, social and contest elements. The goal of this marketing program is to help inspire consumersto consider cruising as one of their top options when planning vacations and, ultimately, to grow demand forcruising with our portfolio of brands. The program elements are designed to educate consumers, and especially
26
Stra
tegi
cR
epor
t
non-cruisers, on why cruising is a great vacation experience at an exceptional value. The initiative also helpsconsumers understand how cruising has evolved with the portfolio of our brands offering the right cruiseexperience for everyone.
All of our cruise brands offer past guest recognition programs that reward repeat guests with special incentivessuch as reduced fares, gifts, onboard activity discounts, expedited ship embarkation and disembarkation andspecial onboard activities. In addition, some of our brands offer private-label credit cards to their guests thataccumulate award points for them to redeem for our products and services and also provide other loyaltybenefits. We earn revenue from the credit card providers based principally on new card issuances and the volumeof purchases through these credit cards which is included in our other revenues. Our cruise brands continue tooffer new enhancements and benefits to their past guest recognition programs.
XII. Seasonality
Our revenues from the sale of passenger tickets are seasonal. Historically, demand for cruises has been greatestduring our third fiscal quarter, which includes the Northern Hemisphere summer months. This higher demandduring the third quarter results in higher ticket prices and occupancy levels and, accordingly, the largest share ofour operating income is earned during this period. The seasonality of our results also increases due to ships beingtaken out-of-service for maintenance, which we schedule during non-peak demand periods. In addition,substantially all of Holland America Princess Alaska Tours’ revenue and net income is generated from Maythrough September in conjunction with the Alaska cruise season.
XIII. Competition
We compete with land-based vacation alternatives throughout the world, such as hotels, resorts (including all-inclusive resorts), theme parks, organized tours, casinos and vacation ownership properties. Our principal cruisecompetitors are RCCL, Norwegian Cruise Line Holdings, Ltd. (“NCL”) and MSC Cruises. RCCL and NCL eachown several brands as follows:
• RCCL owns Royal Caribbean International, Celebrity Cruises, Azamara Club Cruises, CDF Croisieresde France and Pullmantur.
• RCCL and TUI AG, the leading German tour operator, jointly own TUI Cruises, a German cruisecompetitor.
• NCL owns Norwegian Cruise Line, Oceania Cruises and Regent Seven Seas Cruises.
Almost 85% of all 2014 global cruise guests sailed with these competitors and us.
XIV. Governmental Regulations
a. Maritime Regulations
1. General
Our ships are regulated by numerous international, national, state and local laws, regulations, treaties and otherlegal requirements that govern health, environmental, safety and security matters in relation to our guests, crewand ships. These requirements change regularly, sometimes on a daily basis, depending on the itineraries of ourships and the ports and countries visited. If we violate or fail to comply with any of these laws, regulations,treaties and other requirements we could be fined or otherwise sanctioned by regulators. We are committed tocomplying with, or exceeding, all relevant maritime requirements. All of our ships, and the maritime industry asa whole, are subject to the maritime safety and security regulations established by the International MaritimeOrganization (“IMO”), a specialized agency of the United Nations, and its principal set of requirements asmandated through its International Convention for the Safety of Life at Sea (“SOLAS”).
Our ships are registered, or flagged, in The Bahamas, Bermuda, Italy, Malta, the Netherlands, Panama, Portugaland the UK, which are also referred to as Flag States. They are regulated by these Flag States throughinternational conventions that govern health, environmental, safety and security matters in relation to our guests,crew and ships. Representatives of each Flag State conduct periodic inspections, surveys and audits to verifycompliance with these requirements. In addition, we are subject to the decrees, directives, regulations andrequirements of the European Union (“EU”), the U.S. and more than 400 other international ports that our shipsvisit every year.
27
Our ships are also subject to periodic class surveys, including dry-docking inspections, by ship classificationsocieties to verify that our ships have been maintained in accordance with the rules of the classification societiesand that recommended repairs have been satisfactorily completed. Class certification is one of the necessarydocuments required for our cruise ships to be flagged in a specific country, obtain liability insurance and legallyoperate as passenger cruise ships. Dry-dock frequency, for example, is a statutory requirement mandated bySOLAS. Our ships dry-dock once or twice every five years, depending on the age of the ship. Dry-docking,which requires that the ship be temporarily taken out-of-service, typically lasts for one or more weeks dependingon the amount of work performed. Significant dry-dock work includes hull inspection and related activities, suchas scraping, pressure cleaning and bottom painting, and maintenance of steering and thruster equipment,propulsion engines, stabilizers and ballast tanks. While the ship is out of the water in dry-dock, we also performother repairs, maintenance and ship improvement work. To the extent practical, each ship’s crew including thehotel staff remain with the ship during the dry-dock period and assist in performing repair and maintenance workor participate in occupational, safety or other training.
As noted above, our ships are subject to inspection by the port regulatory authorities, which are also referred toas Port State Control, in the various countries that they visit. Such inspections include verification of compliancewith the maritime safety, security, environmental, customs, immigration, health and labour requirementsapplicable to each port, as well as with international requirements. Many countries have joined together to formregional port regulatory authorities. Agreements have been signed covering Europe and the North Atlantic, Asiaand the Pacific, the Caribbean, West and Central Africa, the Black Sea region, the Mediterranean Sea, the IndianOcean and other areas. In U.S. ports, these authorities include the U.S. Coast Guard and U.S. Customs andBorder Protection and in Canada, the Canadian Coast Guard. In Italian ports these authorities include the ItalianCoast Guard, Maritime Health and the State Police. In UK ports, these authorities include the UK Maritime &Coastguard Agency, the Department for Transport’s Maritime and Transport Security Division and the local porthealth authorities.
Although not required by regulations, we voluntarily publish Sustainability Reports that address governance,commitments, stakeholder engagement, environmental, labour, human rights, society, product responsibility,economic and other sustainability-related issues and performance indicators. These reports, which can be viewedat www.carnivalcorp.com and www.carnivalplc.com, were developed in accordance with the SustainabilityReporting Guidelines established by the Global Reporting Initiative, the de-facto global standard for reporting onenvironmental, social and governance policies, practices and performance.
Our Boards of Directors have Health, Environment, Safety & Security Committees (“HESS Committees”), whichare currently each comprised of three independent directors. The principal function of the HESS Committees isto assist the boards in fulfilling their responsibility to supervise and monitor our health, environment, safety,security and sustainability related policies, programs and initiatives at sea and ashore and compliance withrelated legal and regulatory requirements. The HESS Committees and our management team review allsignificant risks or exposures and associated mitigating actions. We continue to be committed to implementingappropriate measures to manage identified risks effectively. As part of our commitment in 2014, we appointed aChief Maritime Officer to oversee our global maritime operations, including maritime quality assurance andpolicy, shipbuilding, ship refits and research and development. To ensure that we are compliant with the legaland regulatory requirements and that these areas of our business operate in an efficient manner we continue to,among other things:
• Provide regular health, environmental, safety and security support, training, guidance and informationto guests, employees and others working on our behalf,
• Develop and implement effective and verifiable management systems to fulfil our health,environmental, safety, sustainability and security commitments,
• Perform regular shoreside and shipboard audits and take appropriate action when deficiencies areidentified,
• Report and investigate all health, environmental, safety and security incidents and take appropriateaction to prevent recurrence,
• Identify those employees responsible for managing health, safety, environment, security andsustainability programs and ensure that there are clear lines of accountability and
• Identify the aspects of our business that impact the environment and continue to take appropriate actionto minimize that impact.
We believe maritime safety, security, environmental, sustainability, health and labour matters will continue to beareas of focus by relevant government authorities where our cruise ships operate and, accordingly, we will likelybe subject to increasing compliance costs in the future.
28
Stra
tegi
cR
epor
t

2. Maritime Safety Regulations
The IMO has adopted safety standards as part of SOLAS, which apply to all of our ships. To help ensure guestand crew safety and security, SOLAS establishes, among other things, requirements for the following:
• Vessel design, • Life-saving and other equipment,• Structural features, • Fire protection and detection,• Construction and materials, • Safe management and operation and• Refurbishment standards, • Security.
All of our crew undergo regular safety training that meets or exceeds all international maritime regulations,including SOLAS requirements which are periodically revised. These requirements apply to existing ships andships under construction.
SOLAS requires implementation of the International Safety Management Code (“ISM Code”), which provides aninternational standard for the safe management and operation of ships and for pollution prevention. The ISMCode is mandatory for passenger vessel operators. Under the ISM Code, vessel operators are required to:
• Develop a Safety Management System (“SMS”) that includes, among other things, the adoption ofsafety and environmental protection policies setting forth instructions and procedures for operatingvessels safely and describing procedures for responding to emergencies and protecting theenvironment.
• Obtain a Document of Compliance (“DOC”) as well as a Safety Management Certificate (“SMC”) foreach vessel they operate. These documents are issued by the vessel’s Flag State and evidencecompliance with the SMS.
• Verify or renew DOCs and SMCs periodically in accordance with the ISM Code.
All of our shoreside and shipboard operations and ships are regularly audited by the national authorities andmaintain the required certificates of compliance in accordance with the ISM Code.
We continue to implement policies and procedures that demonstrate our continuing commitment to the safety ofour guests and crew. These policies and procedures include the following:
• Expansion and acceleration of training of our bridge and engine room officers in maritime related bestpractices at our training facilities in Almere, the Netherlands, and Rostock, Germany,
• Further standardization of our detailed bridge and engine resource management procedures on all ofour ships,
• Expansion of our existing oversight function to monitor bridge and engine room operations,• Identifying and standardizing best-practice policies and procedures in health, environment, safety and
security disciplines across the entire organization including on all our ships and• Further enhancing our processes for auditing and continuously improving our HESS performance
throughout our operations.
As members of the Cruise Lines International Association (“CLIA”), the global cruise industry trade association,we helped to develop and have implemented policies that are intended to enhance shipboard safety throughoutthe cruise industry. In some cases this calls for implementing best practices, which are in excess of existing legalrequirements. These policies include the following:
• Location of lifejacket stowage, • Local sounding smoke alarms,• Harmonization of bridge procedures, • Reporting of crimes and missing persons,• Recording the nationality of passengers, • Safeguarding children in youth activity centers,• Common elements of passenger musters, • Security incidents,• Passage planning, • Waste management and• Personnel access to the bridge, • Medical facilities.• Lifeboat loading for training purposes,
Further details on these and other policies can be found on www.cruising.org.
29
3. Maritime Security Regulations
Our ships are subject to numerous security requirements. These requirements include the International Ship andPort Facility Security Code, which is part of the broader SOLAS regulations, the U.S. Maritime TransportationSecurity Act of 2002, which addresses U.S. port and waterway security and the U.S. Cruise Vessel Security andSafety Act of 2010, which applies to all of our ships that embark or disembark passengers in the U.S. Theseregulations include requirements as to the following:
• Implementation of specific security measures, including onboard installation of a ship security alertsystem,
• Assessment of vessel security,• Efforts to identify and deter security threats,• Training, drills and exercises and• Security plans that may include guest, vehicle and baggage screening procedures, security patrols,
establishment of restricted areas, personnel identification procedures, access control measures andinstallation of surveillance equipment.
4. Maritime Environmental Regulations
We are subject to numerous international, national, state and local environmental laws, regulations and treatiesthat govern, among other things, air emissions, waste discharges, water management and disposal, and thestorage, handling, use and disposal of hazardous substances such as chemicals, solvents and paints. Irrespectiveof the existing legal requirements, we are committed to helping to preserve the environment and, in particular,the health of the world’s oceans as the success of our business is dependent on them. For example, we partnerwith environmental organizations, such as The Nature Conservancy, to support the protection of the globalmarine environment. We continue to make capital and other expenditures to comply with, and in many casesexceed, environmental laws, regulations and treaties.
Our environmental efforts are focused on, among other things, reducing emissions such as greenhouse gases(“GHGs”) (for example, carbon dioxide (“CO2”) or carbon dioxide equivalents (“CO2e”), sulphur oxide (“SOx”)and nitrogen oxide (“NOx”)). These emissions result from the combustion of the marine fuels consumed by ourships, which accounts for substantially all of our total GHG and other emissions. Accordingly, reducing fuelconsumption continues to be one of our most important cross-brand initiatives, which has and will continue tohelp reduce emissions and mitigate the impact of high fuel prices. We have and will continue to implement ourenergy-saving strategy through our environmental management systems. This strategy includes installing someof the best available energy reduction technologies on our ships, such as exhaust gas cleaning, propulsion, airconditioning and waste heat recovery systems, more efficient lighting and evaluating alternative fuels and newemission reduction technologies. In addition, we are designing more energy efficient ships that will enter ourfleet in the future, while continuing toward reducing the fuel consumption of our existing fleet.
We had voluntarily set a goal of delivering a 20% reduction (per unit) from our 2005 baseline of CO2 emissionrate from shipboard operations by 2015. We achieved our goal one year ahead of schedule and are currentlydeveloping new goals aimed at protecting the environment and further reducing our fuel consumption. Wemeasure our ability to use direct energy efficiently by calculating the amount of primary source energy weconsume. Our ship fuel consumption and emission rates and our total ship fuel GHG emissions are as follows:
PercentageChange Since
Measure Units 2014 2013 2008 2013 2008
Ship Fuel Consumption Rate . . . . . . . . . . . . . . . Grams Fuel/ALB-KM (a) 87 89 104 (2.2)% (16.3)%Ship Fuel GHG Emission Rate . . . . . . . . . . . . . Grams CO2e/ALB-KM (b) 274 280 327 (2.1)% (16.2)%SOx Emission Rate . . . . . . . . . . . . . . . . . . . . . . . . Kg SOx/NM (c) (e) 13.1 16.1 (e) (18.6)%(e)NOx Emission Rate . . . . . . . . . . . . . . . . . . . . . . . . Kg NOx/NM (c) (e) 22.5 24.8 (e) (9.3)%(e)Total Ship Fuel GHG Emissions (in
millions) . . . . . . . . . . . . . . . . . . . . . . . . . . . . . . . . Tonnes CO2e (d) 10.1 10.3 10.0 (1.9)% 1.0%
(a) We measure and report the ship fuel consumption rate in terms of grams of fuel per available lower berthkilometer (“ALB-KM”). This indicator enables us to make meaningful fuel consumption comparisons thattake into account changes in fleet size, itineraries and passenger capacity.
30
Stra
tegi
cR
epor
t
(b) We measure and report the ship fuel GHG emission rate in terms of grams of CO2e per ALB-KM. Thisindicator enables us to make meaningful GHG emission reduction comparisons that take into accountchanges in fleet size, itineraries and passenger capacity.
(c) We measure SOx and NOx emission rates in terms of total kilograms (“Kg”) of emissions per nautical mile(“NM”). Using an emission rate normalized by distance travelled allows us to compare our pollutantreduction efforts over the reporting periods.
(d) GHG emission data collection and calculations were performed in accordance with our GHG InventoryManagement Plan, the Greenhouse Gas Protocol and ISO 14064-3:2006.
(e) Information for 2014 is not available as of February 20, 2015. Percentage reduction presented is from 2008 to2013.
i. International Regulations
The principal international convention governing marine pollution prevention and response is the IMO’sInternational Convention for the Prevention of Pollution from Ships (“MARPOL”). MARPOL includesrequirements designed to prevent and minimize both accidental and operational pollution by oil, sewage, garbageand air emissions. To further these objectives, MARPOL sets forth specific requirements related to vesseloperations, equipment, recordkeeping and reporting that are designed to prevent and minimize pollution. All ofour ships must carry an International Oil Pollution Prevention Certificate, an International Sewage PollutionPrevention Certificate, an International Air Pollution Prevention Certificate and a Garbage Management Plan.The ship’s Flag State issues these certificates, which evidence their compliance with the MARPOL regulationsregarding prevention of pollution by oil, sewage, garbage and air emissions. Certain jurisdictions have notadopted MARPOL but have established various national, regional or local laws and regulations to apply to theseareas.
As noted above, MARPOL governs the prevention of pollution by oil from operational measures, as well as fromaccidental discharges. MARPOL requires that discharges of machinery space bilge water pass through pollutionprevention equipment that separates oil from the water and monitors the discharge to ensure that the effluent doesnot exceed 15 parts per million of oil. Our ships must have oily water separators with oil content monitorsinstalled and must maintain a record of certain engine room operations in an Oil Record Book. MARPOL alsorequires that our ships have Shipboard Oil Pollution Emergency Plans.
MARPOL also governs the discharge of sewage from ships and contains regulations regarding the ships’equipment and systems for the control of sewage discharge, the provision of facilities at ports and terminals forthe reception of sewage and requirements for survey and certification. MARPOL designates the Baltic Sea as a“Special Area” where sewage discharges from passenger ships are restricted. However, this restriction will onlytake effect upon notification of the existence of adequate reception facilities from countries whose coastlinesborder the Baltic Sea Special Area. The date this restriction will take effect is uncertain as the underlyingrequirements have not yet been finalized. These new requirements may affect our operations unless suitable portwaste facilities are available or new technologies for onboard waste treatment are developed. The cost ofcomplying with these new requirements is not determinable at this time.
MARPOL also governs the discharge of garbage from ships and requires a Garbage Management Plan and aGarbage Record Book. As a result of MARPOL regulations addressing garbage management, the discharge of allgarbage to sea is prohibited unless the discharge is expressly permitted by these regulations.
Furthermore, MARPOL addresses air emissions from vessels, establishes requirements for the prevention of airpollution from ships to reduce emissions of SOx, NOx and particulate matter. It also contains restrictions on theuse of ozone depleting substances (“ODS”) and requires the recording of ODS use, equipment containing ODS,the emission of ODS and the disposal of equipment containing ODS from ships.
As a means of managing and improving our environmental performance and compliance, we adhere to standardsset by the International Organization for Standardization (“ISO”), an international standard-setting body, whichproduces worldwide industrial and commercial standards. The environmental management systems of our brandsand ships are certified in accordance with ISO 14001, the environmental management standard that wasdeveloped to help organizations manage the environmental impacts of their processes, products and services. ISO14001 defines an approach to setting and achieving environmental objectives and targets, within a structuredmanagement framework. Additional MARPOL requirements are discussed below in Section iv. “Low SulphurFuel Regulations.”
31

ii. U.S. Federal and State Regulations
The Act to Prevent Pollution from Ships authorizes the implementation of MARPOL in the U.S. and imposesnumerous requirements on our ships, as discussed above. Administrative, civil and criminal penalties may beassessed for violations.
The Oil Pollution Act of 1990 (“OPA 90”) established a comprehensive federal liability regime, as well asprevention and response requirements, relating to discharges of oil in U.S. waters. The major requirementsinclude demonstrating financial responsibility up to the liability limits and having oil spill response plans inplace. We have Certificates of Financial Responsibility that demonstrate our ability to meet the maximumamount of OPA 90 related liability that our ships could be subject to for removal costs and damages, such asfrom an oil spill or a release of a hazardous substance. Under OPA 90, owners or operators of vessels operatingin U.S. waters must file Vessel Response Plans with the U.S. Coast Guard and must operate in compliance withthese plans. Our Vessel Response Plans have been submitted to the U.S. Coast Guard and we operate inaccordance with our plans. As OPA 90 expressly allows coastal states to impose liabilities and requirementsbeyond those imposed under federal law, many U.S. states have enacted laws more stringent than OPA 90. Someof these state laws impose unlimited liability for oil spills and contain more stringent financial responsibility andcontingency planning requirements.
The Clean Water Act (“CWA”) and other laws and regulations provide the U.S. Environmental ProtectionAgency (“EPA”) with the authority to regulate commercial vessels’ incidental discharges of ballast water, bilgewater, gray water, anti-fouling paints and other substances during normal operations within the U.S. three mileterritorial sea and inland waters.
Pursuant to the CWA authority, the U.S. National Pollutant Discharge Elimination System was designed tominimize pollution within U.S. territorial waters. For our affected ships, all of the requirements are laid out in theVessel General Permit (“VGP”), which is an EPA requirement. The VGP establishes effluent limits for 27specific discharges incidental to the normal operation of a vessel. In addition to these discharge and vesselspecific requirements, the VGP includes requirements for inspections, monitoring, reporting and record-keeping.
Our operations generate and require the transportation and disposal of both hazardous and non-hazardous solidwastes that are subject to the requirements of the U.S. Resource Conservation and Recovery Act. In general,vessel owners are required to determine if their wastes are hazardous, comply with certain standards for theproper management of hazardous wastes and use hazardous waste manifests for shipments to approved disposalfacilities.
In 1996, the U.S. National Invasive Species Act (“NISA”) was enacted in response to growing reports of harmfulorganisms being released into U.S. waters through ballast water taken on by vessels in foreign waters. The U.S.Coast Guard adopted regulations under NISA in July 2004 that impose mandatory ballast water managementpractices for all vessels equipped with ballast water tanks entering U.S. waters. These requirements can be metby performing mid-ocean ballast exchange, by retaining ballast water onboard the vessel or by usingenvironmentally sound ballast water treatment methods approved by the U.S. Coast Guard.
The U.S. Coast Guard issued a final rule, which went into effect in June 2012, establishing standards for theallowable concentration of living organisms in ballast water discharged in U.S. waters and requiring the phase-inof U.S. Coast Guard approved ballast water management systems. The standards are equivalent to those in theIMO convention. In most cases, affected vessels will be required to install and operate a ballast watermanagement system that has been approved by the U.S. Coast Guard. A vessel’s compliance date varies basedupon the date of construction and ballast water capacity. Ships constructed on or after December 1, 2013 mustcomply with these standards on delivery. Existing ships must comply by their first dry-dock after January 1,2016. However, as of February 20, 2015, no ballast water management systems have been approved by the U.S.Coast Guard and, accordingly, they are currently granting exemptions from this rule.
Most U.S. states that border navigable waterways or sea coasts have also enacted environmental regulations thatimpose strict liability for removal costs and damages resulting from a discharge of oil or a release of a hazardoussubstance. These laws may be more stringent than U.S. federal law and in some cases have no statutory limits ofliability.
The state of Alaska enacted legislation that prohibits certain discharges in designated Alaskan waters and setseffluent limits on others. Further, the state requires that certain discharges be reported and monitored to verify
32
Stra
tegi
cR
epor
t
compliance with the standards established by the legislation. Both the state and federal environmental regimes inAlaska are more stringent than the U.S. federal requirements with regard to discharge from vessels in other areas.The legislation also provides that repeat violators of the regulations could be prohibited from operating inAlaskan waters.
iii. EU Regulations
The EU has adopted a broad range of substantial environmental measures aimed at improving the quality of theenvironment for European citizens and providing them with a high quality of life. To support the implementationand enforcement of European environmental legislation, the EU has adopted directives on environmental liabilityand enforcement and a recommendation providing for minimum criteria for environmental inspections.
The European Commission’s (“EC”) strategy is to reduce atmospheric emissions from ships. The EC strategyseeks to implement SOx Emission Control Areas set out in MARPOL, as discussed below. In addition, the ECgoes beyond the IMO by requiring the use of low sulphur (less than 0.1%) marine gas oil while in EU ports.
iv. Low Sulphur Fuel Regulations
MARPOL Annex VI addresses air emissions from vessels in both auxiliary and main propulsion diesel engineson ships. Annex VI also specifies requirements for Emission Control Areas (“ECAs”) with stricter limitations onsulphur emissions in these areas. Starting in January 2015, ships operating in the Baltic Sea ECA, the North SeaECA, the North American ECA and the U.S. Caribbean ECA are required to use fuel with a sulphur content of nomore than 0.1% or use alternative emission reduction methods (“2015 ECA”).
The MARPOL global limit on fuel sulphur content outside of ECAs will be reduced to 0.5% on and after January2020. This 0.5% global standard will be subject to an IMO review by 2018 as to the availability of the requiredfuel oil to comply with this standard, taking into account the global fuel oil market supply and demand, ananalysis of trends in fuel oil markets and any other relevant issues. If the IMO determines that there isinsufficient fuel to comply with the 0.5% standard in January 2020, then this requirement will be delayed toJanuary 2025, at the latest. However, the EU Parliament and Council have set 2020 as the final date for the 0.5%fuel sulphur content limit to enter force, regardless of the 2018 IMO review results. This EU Sulphur Directivewill cover EU Member States’ territorial waters that are within 12 nautical miles of their coastline.
In conjunction with an affiliate we have and will continue to develop and test exhaust gas cleaning systems’(“EGCS”) designs that we believe will reduce the sulphur emission levels of our higher sulphur bunker fuel to orbelow the levels required under the 2015 ECA limits, the 2020 global standard and while in EU ports.Accordingly, we are installing EGCSs on many of our ships. In addition, to allow us sufficient time to installEGCSs on a reasonable schedule, we have received an exemption for 32 ships that regularly sail within the NorthAmerican and U.S. Caribbean ECAs that will delay the requirements to comply with the 2015 ECA limit throughagreed upon dates ending in 2016. EGCSs were installed on 13 ships during 2014 and by the end of 2015 weexpect to have EGCSs installed on 45 ships. We expect to have EGCSs installed on approximately 70% of ourfleet by the end of 2017. We expect these efforts should mitigate the majority of the impact from the 2015 ECA.We currently estimate that compliance with the 2015 ECA will result in higher 2015 fuel expenses of about $0.10per share, with that increase expected to be reduced by about half in 2016 and mostly offset in 2017. We willincur additional EGCS operating expenses as we benefit from the use of this technology.
As for the 2020 global standard, we believe that the magnitude of the fuel price increase from complying withthis standard is not reasonably determinable at this time due to the uncertainty of when the global standard willbecome effective, which could be as late as 2025, and other potential mitigating factors. However, we believe theincrease to our fuel expenses from complying with the 2020 global standard will ultimately not be material to ourconsolidated financial statements.
Beyond EGCS technology, as part of our emission abatement program, we have continued our work with localport authorities and the EPA to help promote the development of shore power connections in Juneau, Alaska;Long Beach, Los Angeles, San Francisco and San Diego, California; Seattle, Washington; Halifax, Nova Scotiaand Vancouver, British Columbia and have equipped 26 ships with shore power technology. This technologyenables our ships to use power from the local electricity provider rather than running their engines while in portto power their onboard services, and thus reducing our air emissions. Similarly, in an effort to continue ourcommitment to sustainability and to playing a leading role in matters of environmental protection in the cruiseindustry, AIDA began using a liquefied natural gas (“LNG”) hybrid barge for ecologically friendly and flexiblepower supply as an alternative to shore power, while its ships are moored in the port of Hamburg, Germany.
33
In the long-term, the cost impacts of achieving progressively lower sulphur emission requirements may be furthermitigated by the favourable impact of future changes in the supply and demand balance for marine and otherfuels, future developments of and investments in improved sulphur emission abatement technologies, the use ofalternative lower cost and lower emission fuels, such as LNG at sea and in port, and our continued efforts toimprove the overall fuel efficiency across our fleet. Since 2007, we have achieved a 25% cumulative reduction inunit fuel consumption by focusing on the following:
• Efficiency improvements in the areas of hull coatingsand designs,
• More efficient pumps, ventilationand waste heat recovery systems,
• Improved engine performance, • New itineraries• More advance engine designs, • More efficient propeller designs,• More efficient LED lighting, • Reduction in ship speeds and• More efficient air conditioning, which is the second
largest user of onboard energy after propulsion,• Increased energy use awareness and
training.
v. Greenhouse Gas Emissions
We have established objectives within the ISO 14001 environmental management systems of each of our brandsto further reduce fuel consumption rates and the resulting CO2 emission rates. Each year we have volunteered toparticipate in the Carbon Disclosure Project (“CDP”), which provides visibility of companies’ carbon footprintsand activities regarding carbon emissions. The CDP rates companies on the depth and scope of their disclosuresand the quality of their reporting. Our submission included details of our most recently compiled emissions dataand reduction efforts, along with our completion of an independent, third-party verification of our GHGemissions inventory.
In January 2013, the IMO approved measures to reduce emissions of GHGs from international shipping byadopting technical and operational measures for all ships. The technical measures apply to the design of newvessels, and the operational reduction measures apply to all vessels.
5. Maritime Health Regulations
We are committed to providing a healthy environment for all of our guests and crew. We collaborate with publichealth inspection programs throughout the world, such as the Centers for Disease Control and Prevention in theU.S. (“CDC”) and the SHIPSAN Project in the EU to ensure that development of these programs leads toenhanced health and hygiene onboard our ships. Through our collaborative efforts, we work with the authoritiesto develop and revise guidelines, review plans and conduct on-site inspections for all newbuilds and significantship renovations. In addition, we continue to maintain our ships by meeting, and often exceeding, applicablepublic health guidelines and requirements, complying with inspections, reporting communicable illnesses andconducting regular crew training and guest education programs.
In 2013, 10.1 million passengers embarked on CLIA member cruise ships from U.S. ports. That year, there werefour norovirus outbreaks on cruise ships departing from U.S. ports involving a total of 834 passengers, whichrepresents only 0.008% of cruise passengers on CLIA member cruise ships. By contrast, the CDC reported thereare approximately 20 million norovirus cases in a typical year in the U.S., or 6.3% of the U.S. population. It isestimated that 1 in 15 Americans contract the norovirus on land each year, compared to 1 in 12,000 cruise guestsreporting that they have contracted the norovirus on a cruise ship each year. Although outbreaks ofgastrointestinal illnesses on ships represent a small percentage of all outbreaks, the cruise industry has developedand implemented policies and practices to limit gastrointestinal illness onboard ships.
6. Maritime Labour Regulations
In 2006, the International Labour Organization, an agency of the United Nations that develops and overseesinternational labour standards, adopted a Consolidated Maritime Labour Convention (“MLC 2006”). MLC 2006contains a comprehensive set of global standards and includes a broad range of requirements, such as thedefinition of a seafarer, minimum age of seafarers, medical certificates, recruitment practices, training,repatriation, food, recreational facilities, health and welfare, hours of work and rest, accommodations, wages andentitlements. In August 2013, MLC 2006 became effective in certain countries in which we operate.
The International Convention on Standards of Training, Certification and Watchkeeping for Seafarers, asamended, establishes minimum standards relating to training, including security training, certification andwatchkeeping for our seafarers.
34
Stra
tegi
cR
epor
t
b. Consumer Regulations
Our ships that call on U.S. ports are regulated by the Federal Maritime Commission (“FMC”). Public Law 89-777, which is administered by the FMC, requires all our cruise brands that call on U.S. ports and embark ordisembark guests in U.S. ports to establish financial responsibility for their liability to passengers fornonperformance of transportation, for personal injury and for loss of life. The FMC’s regulations require that acruise line demonstrate its financial responsibility for nonperformance of transportation through a guarantee,escrow arrangement, surety bond or insurance. Currently, the amount required must be no less than 110% of thecruise line’s highest amount of customer deposits over a two-year period, up to a maximum coverage level of$22 million. Such maximum coverage amount will increase to $30 million by April 2015. Based on this increase,our required guarantee will be $150 million. Our Protection and Indemnity coverages are used to establish ourfinancial responsibility for personal injury and loss of life.
In some cases in the UK, continental Europe and Australia, we are required to obtain licenses from and postbonds or guarantees with various organizations in connection with the conduct of our business and/or our abilityto meet our liabilities in the event of nonperformance of obligations to consumers. The most significantrequirement relates to ABTA, formally known as the Association of British Travel Agents, which requires us tomaintain approximately $125 million of sterling-denominated bonds to cover certain of our brands’ UK customerdeposits. We are also required to pay to the UK Civil Aviation Authority a non-refundable £2.50 fee per guestwhen we arrange a flight as part of a cruise vacation.
In the other major countries where we source our guests, we are also required to establish financial responsibility,such as obtaining a guarantee from a reputable insurance company to ensure that, in case of insolvency, ourguests will be refunded their deposits and repatriated without additional cost if insolvency occurs after a cruisestarts. In Australia and most of Europe, we are obligated to honour our guests’ cruise payments made by them totheir travel agents and tour operators regardless of whether we receive these payments.
c. Regulations for Guests with Disabilities
Regulations regarding ship accessibility standards are expected to be issued in the U.S. As a result of theproposed new regulations, we expect that we will be required to make modifications to some of our ships but donot believe the cost of these will have a significant impact on our consolidated financial statements.
XV. Training
Our cruise brands are committed to providing appropriate hotel and marine-related training to ensure that ourshipboard crew, including officers, have the knowledge and skills to properly perform their jobs. We have amaritime training program for shipboard officers that includes two training facilities with one located in Almere,the Netherlands, known as the Center for Simulator Maritime Training (“CSMART”), and the other located inRostock, Germany. Our goal is to be a leader in delivering high quality professional maritime training.Participants receive a maritime training experience that fosters critical thinking, problem solving, ethical decisionmaking and skill development.
CSMART currently offers two full mission bridge simulators, six part-task bridge simulators and the ability tosimulate fixed propeller and azipod operations. In addition, CSMART offers two full mission engine control roomswith four machinery outstations and 16 part-task engine room simulators. The CSMART facility also features largeinstructional classrooms, meeting rooms and a catering facility. In 2014, we purchased land in Almere and arehaving a new CSMART training facility built to include four full mission bridge simulators and four full missionengine room simulators. In addition, the new facility will include training simulators for our shipboard safety,security and medical functions. We are also having on-site accommodations built for use by our shipboard officersduring their training sessions. The new training facility and accommodations are expected to open in mid-2016. Weexpect to train more than 6,000 shipboard officers annually at our expanded CSMART facility. Our training facilityin Rostock offers one full mission bridge simulator, one part-task bridge simulator and one part-task engine roomsimulator.
We have enhanced our HESS Management System risk assessment and management capabilities byimplementing shipboard quality assurance initiatives that will further strengthen bridge and engine control roomresource management training and operational performance. We have also established the European CruiseAcademy in Rostock, Germany, which offers advanced training certificates in the maritime sciences primarilyrelated to the cruise business.
35
D. Employees
Our shoreside operations have an average of 10,100 full-time and 2,800 part-time/seasonal employees. We alsoemploy an average of 81,200 crew members, including officers, onboard the 100 ships we currently operate, whichexcludes employees who are on a leave. Of our total employees, 23% are female and 77% are male. Two of the 9members of our Boards of Directors are female and seven are male. Our 10 executive officers are male. HollandAmerica Princess Alaska Tours significantly increases its work force during the late spring and summer months inconnection with the Alaskan cruise season, which seasonal employees are included above. We have entered intoagreements with unions covering certain employees on our ships and in our shoreside hotel and transportationoperations. We consider our employee and union relationships to be strong. The percentages of our shipboard andshoreside employees that are represented by collective bargaining agreements are 39% and 14%, respectively.
We source our shipboard officers primarily from Italy, the UK, Holland, Germany and Norway. The remainingcrew positions are sourced from around the world, with the largest contingent from the Philippines, Indonesiaand India. We utilize a limited number of manning agencies to help locate and hire most of our shipboardemployees. As manning agencies are located in the home countries of our crew, their knowledge of the localmarket and culture allows them to attract high volumes of qualified candidates. The services provided by ourmanning agencies may include interviewing, background and medical prescreenings, hiring, arranging airtransportation and managing medical repatriations.
E. Supply Chain
Our largest non-payroll operating expenditures are for fuel, food and beverages, travel agency services, portfacility utilization, repairs and maintenance including dry-docking, transportation services, advertising andmarketing, hotel and restaurant products and supplies, entertainment expenses and credit card fees. Our largestcapital investments are for the construction of new ships and improvements to existing ships, including EGCSand energy efficiency investments.
Although we utilize a select number of suppliers for most of our food and beverages, communication services, airtransportation services and hotel and restaurant products and supplies, most of these products and services areavailable from multiple sources at competitive prices. The use of a select number of suppliers enables us to,among other things, obtain volume discounts. We purchase fuel and port facility services at some of our ports-of-call from a limited number of maritime suppliers. Almost 50% of our fuel purchases are provided by sevensuppliers.
We are continually reviewing our supply chain procurement processes and have, or expect to, implementstrategic initiatives to reduce our costs, including as follows:
• Negotiating company-wide contracts for guest, crew and shoreside employees’ travel,• Reviewing our processes for purchasing food, beverages, hotel supplies, restaurant products and
technical spares to identify synergistic opportunities and to negotiate more favourable commercialterms,
• Combining warehousing facilities and optimizing logistics,• Negotiating company-wide contracts for port services and shore excursions and• Streamlining the use of manning agencies.
We perform our major dry-dock and ship improvement work at dry-dock facilities in The Bahamas, Europe, theU.S., Canada, Singapore and Australia. At February 20, 2015, we have agreements in place for the constructionof ten cruise ships with two shipyards. We also purchase repair, maintenance and refurbishment items from alimited number of maritime suppliers. We believe there are sufficient dry-dock and shipbuilding facilities andrelated suppliers to meet our anticipated repair, maintenance, ship improvement and newbuild requirements.
F. Communities in Which We Operate
We help to create a higher standard of living and quality of life in our home communities and those that we visit.We often meet with local government leaders to discuss business and community planning and ways to interactsustainably. We also promote the local destinations, develop some local ports and cruise terminals, provideemergency aid and support and make philanthropic donations in some of the communities that we operate.
36
Stra
tegi
cR
epor
t
G. Information Technology
With the increasing size and sophistication of cruise ships, the technologies employed to create guest experiencesand operate ships have grown ever more complex and integrated. Nearly every guest experience and operationalprocess employs cutting edge technologies, from the navigation, communication and radar equipment on thebridge to integrated commerce solutions that enable guests to purchase photos and schedule shore excursionsfrom their staterooms and staying connected with their family and friends back home. Our global informationtechnology model is designed to contribute to exceeding expectations of our guests, crew, shoreside employeesand other stakeholders. Our global technology model is focused on creating innovative platforms and solutions tocreate exceptional guest experiences while leveraging common technologies to drive process efficiency andeffectiveness across our portfolio of brands. In order to achieve our goals, we are focusing on five areas asfollows:
• Connectivity – to provide reliable guest connectivity at all times and geographies and deliver the bestpossible connectivity experience, improve crew morale through better connectivity with family andfriends and offer support for new services and products. For example, we expect to implement aninnovative “smart hybrid” network that combines land-based systems and advanced satelliteconnectivity to provide our guests and crew with faster and more consistent internet service regardlessof our ships’ locations.
• Applications – to offer consistently higher quality experience for guests, crew and employees, achievelower total cost of ownership, have more secure applications and have a stronger pipeline of solutions,
• Cybersecurity – to provide consistent protection of guest, employee and company data, develop bestpractices and tools to combat threats and malicious activity, ensure full compliance with applicableregulations and consistently model and implement a speedy response and recovery in case of anincident,
• Infrastructure – to become more cost-efficient, attain higher network availability and flexibility,achieve greater collaboration between our brands, make available a higher computer power/storagecapacity through leveraging our information technology assets, reduce disruptions and improveresponse time to incidents and
• Innovation – to create proprietary platforms that enable unique and differentiated guest experiencesacross our portfolio of brands while amplifying individual brand characteristics and avoiding duplicateefforts.
All of our brands have actively contributed in the design of the global information technology model and willcontinue communicating, coordinating and collaborating to maximize the business value of our informationtechnology investments by eliminating redundancies and driving synergies across the brands, identifying andleveraging best practices and establishing common standards.
H. Insurance
I. General
We maintain insurance to cover a number of risks associated with owning and operating our vessels and othernon-ship related risks. All such insurance policies are subject to coverage limits, exclusions and deductiblelevels. Insurance premiums are dependent on our own loss experience and the general premium requirements ofour insurers. We maintain certain levels of deductibles for substantially all the below-mentioned coverages, someof which have increased in recent years, and we may increase our deductibles further to mitigate future premiumincreases. We do not carry coverage related to loss of earnings or revenues from our ships or other operations.
II. Protection and Indemnity (“P&I”) Coverages
Liabilities, costs and expenses for illness and injury to crew, guest injury, pollution and other third party claimsin connection with our cruise activities are covered by our P&I clubs, which are mutual indemnity associationsowned by ship owners.
We are members of two P&I clubs, which are part of a worldwide group of P&I clubs, known as the InternationalGroup of P&I Clubs (the “IG”). The IG insures directly, and through broad and established reinsurance markets,a large portion of the world’s shipping fleets. Coverage is subject to the P&I clubs’ rules and the limits ofcoverage are determined by the IG.
37
III. Hull and Machinery Insurance
We maintain insurance on the hull and machinery of each of our ships for reasonable amounts as determined bymanagement. The coverage for hull and machinery is provided by large and well-established international marineinsurers. Most insurers make it a condition for insurance coverage that a ship be certified as “in class” by aclassification society that is a member of the International Association of Classification Societies (“IACS”). Allof our ships are routinely inspected and certified to be in class by an IACS member.
IV. War Risk Insurance
We maintain war risk insurance for legal liability to crew, guests and other third parties as well as loss or damageto our vessels arising from war or war-like actions, including terrorist incidents. Items excluded from thiscoverage are claims arising from chemical, nuclear and biological attacks. Our primary war risk insurancecoverage is provided by international marine insurers and our excess war risk insurance is provided by our twoP&I clubs. Under the terms of our war risk insurance coverage, which are typical for war risk policies in themarine industry, insurers can give us seven days’ notice that the insurance policies will be cancelled. However,the policies can be reinstated at different premium rates. This gives insurers the ability to increase our premiumsfollowing events that they determine have increased their risk.
V. Other Insurance
We maintain property insurance covering our shoreside assets and casualty insurance covering liabilities to thirdparties arising from our hotel and transportation businesses, shore excursion operations and shoreside operations,including our port and related commercial facilities. We also maintain workers compensation, directors andofficer’s liability and other insurance coverages.
I. Trademarks and Other Intellectual Property
We own and have registered or licensed numerous trademarks and domain names, which we believe are widelyrecognized and have considerable value. These intangible assets enable us to distinguish our cruise products andservices, ships and programs from those of our competitors. Our trademarks include the trade names of our cruisebrands, each of which we believe is a widely-recognized brand in the cruise industry, as well as our ship namesand a wide variety of cruise products and services. We have entered into license agreements for the use of theP&O name, the P&O flag and other relevant trademarks and domain names in relation to cruising and relatedactivities. We also have a license to use the “Love Boat” name and related marks. See Item 3. Business Review –“Critical Accounting Estimates – Asset Impairments” within this Strategic Report.
J. Taxation
A summary of our principal taxes and exemptions in the jurisdictions where our significant operations are locatedis as follows:
I. U.S. Income Tax
We are primarily foreign corporations engaged in the business of operating cruise ships in internationaltransportation. We also own and operate, among other businesses, the U.S. hotel and transportation business ofHolland America Princess Alaska Tours through U.S. corporations.
Our North American cruise ship businesses and certain ship-owning subsidiaries are engaged in a trade orbusiness within the U.S. Depending on its itinerary, any particular ship may generate income from sources withinthe U.S. We believe that our U.S. source income and the income of our ship-owning subsidiaries, to the extentderived from, or incidental to, the international operation of a ship or ships, is currently exempt from U.S. federalincome and branch profit taxes.
Our domestic U.S. operations, principally the hotel and transportation business of Holland America PrincessAlaska Tours, are subject to federal and state income taxation in the U.S.
a. Application of Section 883 of the Internal Revenue Code
In general, under Section 883 of the Internal Revenue Code, certain non-U.S. corporations (such as our NorthAmerican cruise ship businesses) are not subject to U.S. federal income tax or branch profits tax on U.S. source
38
Stra
tegi
cR
epor
t

income derived from, or incidental to, the international operation of a ship or ships. Applicable U.S. Treasuryregulations provide in general that a foreign corporation will qualify for the benefits of Section 883 if, in relevantpart, (i) the foreign country in which the foreign corporation is organized grants an equivalent exemption tocorporations organized in the U.S. (an “equivalent exemption jurisdiction”) and (ii) the foreign corporation meetsa defined publicly-traded test. Subsidiaries of foreign corporations that are organized in an equivalent exemptionjurisdiction and meet the publicly-traded test also benefit from Section 883. We believe that Panama is anequivalent exemption jurisdiction and Carnival Corporation currently qualifies as a publicly-traded corporationunder the regulations. Accordingly, substantially all of Carnival Corporation’s income is exempt from U.S.federal income and branch profit taxes.
Regulations under Section 883 list items that the Internal Revenue Service (“IRS”) does not consider to beincidental to ship operations. Among the items identified as not incidental are income from the sale of airtransportation, transfers, shore excursions and pre- and post-cruise land packages to the extent earned fromsources within the U.S.
b. Exemption Under Applicable Income Tax Treaties
We believe that the U.S. source transportation income earned by Carnival plc and its Italian resident subsidiarycurrently qualifies for exemption from U.S. federal income tax under applicable bilateral U.S. income taxtreaties.
c. U.S. State Income Tax
Carnival Corporation and Carnival plc and certain of their subsidiaries are subject to various U.S. state incometaxes generally imposed on each state’s portion of the U.S. source income subject to U.S. federal income taxes.However, the state of Alaska imposes an income tax on its allocated portion of the total income of our companiesdoing business in Alaska and certain of their subsidiaries.
II. UK and Australian Income Tax
Cunard, P&O Cruises (UK) and P&O Cruises (Australia) are divisions of Carnival plc and have elected to enterthe UK tonnage tax under a rolling 10-year term and, accordingly, reapply every year. Companies to which thetonnage tax regime applies pay corporation taxes on profits calculated by reference to the net tonnage ofqualifying ships. UK corporation tax is not chargeable under the normal UK tax rules on these brands’ relevantshipping income. Relevant shipping income includes income from the operation of qualifying ships and fromshipping related activities.
For a company to be eligible for the regime, it must be subject to UK corporation tax and, among other matters,operate qualifying ships that are strategically and commercially managed in the UK. Companies within UKtonnage tax are also subject to a seafarer training requirement.
Our UK non-shipping activities that do not qualify under the UK tonnage tax regime remain subject to normalUK corporation tax. Dividends received from subsidiaries of Carnival plc doing business outside the UK aregenerally exempt from UK corporation tax.
P&O Cruises (Australia) and all of the other cruise ships operated internationally by Carnival plc for the cruisesegment of the Australian vacation market are exempt from Australian corporation tax by virtue of the UK/Australian income tax treaty.
III. Italian and German Income Tax
In early 2015, Costa and AIDA will re-elect to enter the Italian tonnage tax regime through 2024 and can reapplyfor an additional ten-year period beginning in early 2025. Companies to which the tonnage tax regime appliespay corporation taxes on shipping profits calculated by reference to the net tonnage of qualifying ships.
Most of Costa’s and AIDA’s earnings not considered to be shipping profits for Italian tonnage tax purposes willbe taxed at an effective tax rate of 5.5% under the Italian international shipping tax regime since all of their shipsare Italian registered.
Substantially all of AIDA’s earnings are exempt from Italian and German corporation tax by virtue of the Italy/Germany income tax treaty.
39
IV. Income and Other Taxes in Asian Countries
Substantially all of our brands’ income from their international operation in Asian countries is exempt from localcorporation tax by virtue of relevant income tax treaties.
V. Other
In addition to or in place of income taxes, virtually all jurisdictions where our ships call impose taxes, fees andother charges based on guest counts, ship tonnage, passenger capacity or some other measure.
K. Industry and Market Data
This Strategic Report includes market share and industry data and forecasts that we obtained from industrypublications, third-party surveys and internal company surveys. Industry publications, including those fromCLIA, G.P. Wild and surveys and forecasts, generally state that the information contained therein has beenobtained from sources believed to be reliable. CLIA is a non-profit marketing and training organization formedin 1975 to promote cruising and offer support and training for the travel agent community in North America. Inaddition, CLIA participates in the regulatory and policy development process while supporting measures thatfoster a safe, secure and healthy cruise ship environment. Also, CLIA facilitates strategic relationships betweencruise industry suppliers and organizations, cruise lines, ports and shipyards and provides a forum for interactionwith governmental agencies. All CLIA information, obtained from the CLIA website www.cruising.org, relatesto the CLIA member cruise lines. In 2013, CLIA merged with similar organizations outside of North Americaand represents 63 cruise brands that operate 95% of cruise industry capacity. G.P Wild is an authoritative sourceof cruise industry statistics and publishes a number of reports and industry reviews. All G.P. Wild information isobtained from their annual Cruise Industry Statistical Review. All other references to third party information arepublicly available at nominal or no cost. We use the most currently available industry and market data to supportstatements as to our market positions. Although we believe that the industry publications and third-party sourcesare reliable, we have not independently verified any of the data. Similarly, while we believe our internalestimates with respect to our industry are reliable, they have not been verified by any independent sources. Whilewe are not aware of any misstatements regarding any industry data presented herein, our estimates, in particularas they relate to market share and our general expectations, involve risks and uncertainties and are subject tochange based on various factors, including those discussed under Item 4. Principal Risks and Uncertainties withinthis Strategic Report.
3. Business Review.
2014 Executive Overview
Overall, 2014 was a strong year as we turned the corner with improved earnings and positive net revenue yields,despite the loss of attractive itineraries due to geopolitical factors and large cruise industry capacity increases inthe Caribbean. We continued to gain momentum and achieved about a 1 percentage point increase in ROIC, aswe move towards our goal of double digit ROIC in the next three to four years, while maintaining a strongbalance sheet. (We define ROIC as the twelve-month non-GAAP earnings before interest divided by the monthlyaverage of debt plus equity minus construction-in-progress).
Non-GAAP net income for 2014 increased 24% to $1.5 billion ($1.2 billion U.S. GAAP). We saw strong profitimprovement at both our Carnival Cruise Line and Costa brands and enjoyed several early wins from our cross-brand collaboration efforts that contributed to our improved 2014 results, particularly in the area of onboardrevenues. The increase in our non-GAAP net income was driven by slightly higher net revenue yields (constantdollar), an increase in capacity and lower fuel prices and fuel consumption per ALBD (“available lower berthday”), partially offset by slightly higher net cruise costs excluding fuel per ALBD (constant dollar).
Our slightly higher net revenue yield (constant dollar) was due to a more than 3% increase in net onboard andother revenue yields, partially offset by slightly lower net passenger ticket revenue yields. The growth in netonboard and other revenue yields was driven by increases in primarily all the net onboard revenue categories onboth sides of the Atlantic. The slight decrease in net passenger ticket revenue yields was driven by our NorthAmerica brands’ facing a promotional pricing environment in the Caribbean resulting from the large increase incruise industry capacity, partially offset by improvements at our continental European brands.
40
Stra
tegi
cR
epor
t
Our moderate capacity growth was driven by our new ship deliveries, partially offset by our ship sales. During2014, we introduced Princess Cruises’ 3,560-passenger Regal Princess and Costa Cruises’ 3,692-passengerCosta Diadema. We are building new, innovative, purpose-built ships that are larger and more efficient and havea wider range of onboard amenities and features, which enable us to better compete for consumers’ vacationspend. These larger ships enable us to obtain greater economies of scale. In addition, we continue to makesubstantial investments in our existing ship enhancement programs to improve our onboard product offerings andenrich our guests’ vacation experiences. Furthermore, in 2014 we sold four of our smaller, less efficient vessels:Costa Celebration, Costa Voyager, Grand Holiday and Ocean Princess.
We benefited from a reduction in fuel prices, which resulted in $126 million of savings. In addition, we had analmost 5% reduction in fuel consumption per ALBD thus saving another $107 million of fuel expense comparedto 2013, which continued our multiple-year cumulative unit fuel consumption savings trend that has reached 25%since 2007. We achieved our stated goal of delivering a 20% reduction (per unit) in the intensity of carbondioxide emissions from our shipboard operations one year prior to our target date and are currently developingnew goals aimed at protecting the environment and further reducing our fuel consumption. We are installing newexhaust gas cleaning systems on our ships to achieve environmental objectives and mitigate the financial impactof the new 2015 low sulphur regulatory requirements. We are also implementing a series of new energy savingtechnology initiatives across our fleet in areas such as propulsion, air conditioning and waste heat recoverysystems as well as more efficient lighting in order to help reduce our carbon footprint and costs.
Our ability to generate significant operating cash flows allows us to internally fund our capital investments. Wegenerated $3.4 billion of cash from operations, 21% higher than last year, and used $2.5 billion to fund investingactivities, leaving us with almost $1.0 billion, most of which was returned to shareholders through our regularquarterly dividend. Our goal is to return “excess free cash flows” (defined as cash flows from operations lessinvesting activities and regularly scheduled quarterly dividends) to our shareholders in the form of additionaldividends and/or share buybacks.
We identified new strategies and tactics to strengthen our cruise ticket revenue management processes andsystems across our portfolio of brands, such as optimizing our pricing methodologies, improving our pricingmodels and increasing our brands’ coordination of our global fleet deployments. Our objectives are to drivegreater penetration, more effective capacity management and improve revenue yields. In addition, we havestarted to implement various demand creating initiatives as we strive to create additional demand for our brandsthat far outpaces supply, ultimately leading to higher revenue yields.
Our goal is to consistently exceed our guests’ expectations while providing them with a wide variety ofexceptional vacation experiences. To this end, we are conducting psychographic segmentation studies to gain amore insightful and impactful understanding of our guests’ needs, wants and expectations. We will then targetour advertising and promotions toward these specific guest segments in order to drive demand for our offeringsand better guide our guests to the cruise brand experience that best matches their tastes. These studies shouldenable us to better differentiate each brand in the minds of vacationers and consumers-at-large and adjust theproduct and service offerings of our brands.
Strong relationships with our travel agents are also vital to our success. In 2014, we continued to strengthen ourrelationship with the travel agent community by increasing our communication and outreach, implementingchanges based on travel agent feedback, increasing our trade marketing presence and improving our educationalprograms to assist agents in stimulating cruise demand. In 2014, our operating income in China significantlyincreased due to a combination of capacity growth and revenue yield improvement. We believe that we havesignificant opportunities to continue to grow our presence in China due to its large and growing middle-classpopulation and expansion of their international tourism. Due to the high strategic importance we place on theChina cruise market, in 2014 we relocated our Chief Operations Officer to China to more closely oversee ourbrands’ strategic initiatives, coordinate our growth strategy in China and the surrounding markets and liaise withChinese government officials. With the introduction of Costa Serena in 2015, we will have four ships homeported in China, which will represent a 140% increase in guest capacity over a two-year period and will offer ourChinese guests diversified cruise products with two brands targeting two different segments of travellers. As partof our China cruise strategy, we are exploring opportunities aimed at the development of a domestic cruisecompany and the formation of a domestic cruise shipbuilding company, as well as port development, talentdevelopment and training, enhanced relationships with our distribution partners and sharing of supply chain andlogistics expertise.
41
With 100 ships and 10.6 million guests in 2014, we have the scale to optimize our structure by utilizing ourcombined purchasing volumes and common technologies and implementing cross-brand initiatives aimed at costcontainment. In 2014, we continued working on expanding cross-brand contracting for food and beverages andbegan working on cross-brand contracting for air travel to further utilize the scale of our combined purchases.
Our uncompromising commitment to the safety and comfort of our guests and crew is paramount to the successof our business. We are developing a company-wide safety management system that standardizes our maritimerelated policies, procedures and processes and are increasing the amount of maritime safety, ship command andengine room management training for our shipboard officers at our expanding global training facility in theNetherlands. We are also updating our processes, systems and training surrounding fire prevention, detection andsuppression. Furthermore, we continue to make investments in our ships’ maritime systems to improve theirsafety and reliability, which also allows us to operate them more efficiently and sustainably.
We employ an average of 81,200 crew members, including officers, onboard the 100 ships we currently operate,which exclude crew who are on a leave. We also have an average of 10,100 full-time shoreside employees and2,800 part-time/seasonal employees. Our goal is to select, train and retain the finest shipboard and shoresideemployees because having a team of highly motivated and engaged employees is key to delivering vacationexperiences that exceed our guests’ expectations. We have structured our work processes and incentivecompensation plans to reflect a culture that enables our brands to better align their individual performance withour primary financial goals. Our management teams are aligned by geographic region to further optimize ouroperations, utilize our scale and better manage our performance. In 2014, we accelerated our cross-brandcollaboration and streamlined our non-guest facing operations within the Holland America Line, Princess andSeabourn group.
While we are well underway with certain initiatives discussed above and are already beginning to see theirpositive results, some of our initiatives will take longer to realize their full benefits due to our size and the natureof the cruise industry. Our strategic initiatives demonstrate the benefits of communicating, coordinating andcollaborating across our brands and will help us fulfil our vision to deliver unmatched joyful vacationexperiences and breakthrough total shareholder returns by exceeding guests’ expectations and achieving the fullbenefits inherent in our scale.
As of February 20, 2015, we have ten cruise ships scheduled to be delivered between late February 2015 andNovember 2018, some of which will replace existing capacity as older, smaller and less efficient ships exit ourfleet. We strategically time the introduction of additional ships into our brands to allow ample time for thoselines to further grow their guest base and absorb the new capacity. We have removed 16 ships from our fleetsince 2006 and have agreements in place to remove three more ships by March 2016. Based on our current shiporders and announced ship withdrawals, our net capacity growth rate is expected to be 2.0% in 2015 and 2.8%compounded annually through 2018. We are committed to measured capacity growth so that we achieve anoptimal balance of supply and demand to maximize our profitability in established cruise regions, such as NorthAmerica and Western Europe. We believe the increasing deployment of ships into the emerging Asia market mayfurther moderate the level of supply in North America and Western Europe.
Outlook for the 2015 First Quarter and Full Year
On December 19, 2014, we said that we expected our non-GAAP diluted earnings per share for the 2015 firstquarter and full year to be in the ranges of $0.07 to $0.11 and $2.30 to $2.60, respectively (see “Key PerformanceNon-GAAP Financial Indicators”). Our guidance was based on fuel prices of $421 per metric ton and $436 permetric ton for the 2015 first quarter and full year, respectively. In addition, our guidance was based on 2015 firstquarter and full year currency rates of $1.23 to the euro, $1.57 to sterling and $0.83 to the Australian dollar. Thefuel and currency assumptions used in our guidance change daily and, accordingly, our forecasts change dailybased on the changes in these assumptions.
The above forward-looking statements involve risks, uncertainties and assumptions with respect to us. There aremany factors that could cause our actual results to differ materially from those expressed above including, but notlimited to, general economic and business conditions, increases in fuel prices, incidents, spread of contagiousdiseases, adverse weather conditions, geopolitical events, negative publicity and other factors that couldadversely impact our revenues, costs and expenses. You should read the above forward-looking statementstogether with the discussion of these and other risks under Item 4. Principal Risks and Uncertainties within thisStrategic Report.
42
Stra
tegi
cR
epor
t
Critical Accounting Estimates
Our critical accounting estimates are those that we believe require our most significant judgments about theeffect of matters that are inherently uncertain. A discussion of our critical accounting estimates, the underlyingjudgments and uncertainties used to make them and the likelihood that materially different estimates would bereported under different conditions or using different assumptions is as follows:
Ship Accounting
Our most significant assets are our ships, including ship improvements and ships under construction, whichrepresent 80% of our total assets at November 30, 2014. We make several critical accounting estimates withrespect to our ship accounting. First, in order to compute our ships’ depreciation expense, which represented 11%of our cruise costs and expenses in 2014, we have to estimate the useful life of each of our ships as well as theirresidual values. Secondly, we account for ship improvement costs by capitalizing those costs that we believe addvalue to our ships and have a useful life greater than one year, and depreciate those improvements over theshorter of their or the ships’ estimated remaining useful life, while the costs of repairs and maintenance,including minor improvement costs and dry-dock expenses, are charged to expense as incurred. Finally, when werecord the retirement of a ship component that is included within the ship’s cost basis, we may have to estimatethe net book value of the asset being retired in order to remove it from the ship’s cost basis.
We determine the useful life of our ships and ship improvements based on our estimates of the period over whichthe assets will be of economic benefit to us, including the impact of long-term vacation market conditions,marketing and technical obsolescence, competition, physical deterioration, historical useful lives of similarly-built ships, regulatory constraints and maintenance requirements. In addition, we consider estimates of theweighted-average useful lives of the ships’ major component systems, such as the hull, cabins, main electric,superstructure and engines. Taking all this into consideration, we have estimated our new ships’ useful lives at 30years.
We determine the residual value of our ships based on our long-term estimates of their resale value at the end oftheir useful life to us but before the end of their physical and economic lives to others, historical resale values ofour and other cruise ships and viability of the secondary cruise ship market. We have estimated our residualvalues at 15% of our original ship cost.
Given the large size and complexity of our ships, ship accounting estimates require considerable judgment andare inherently uncertain. We do not have cost segregation studies performed to specifically componentize ourships. In addition, since we do not separately componentize our ships, we do not identify and track depreciationof original ship components. Therefore, we typically have to estimate the net book value of components that areretired, based primarily upon their replacement cost, their age and their original estimated useful lives.
If materially different conditions existed, or if we materially changed our assumptions of ship useful lives andresidual values, our depreciation expense, loss on retirement of ship components and net book value of our shipswould be materially different. In addition, if we change our assumptions in making our determinations as towhether improvements to a ship add value, the amounts we expense each year as repair and maintenance expensecould increase, which would be partially offset by a decrease in depreciation expense, resulting from a reductionin capitalized costs. Our 2014 ship depreciation expense would have increased by approximately $50 millionassuming we had reduced our estimated 30-year ship useful life estimate by one year at the time we took deliveryor acquired each of our ships. In addition, our 2014 ship depreciation expense would have increased byapproximately $205 million assuming we had estimated our ships to have no residual value at the time of theirdelivery or acquisition.
We believe that the estimates we made for ship accounting purposes are reasonable and our methods areconsistently applied in all material respects and, accordingly, result in depreciation expense that is based on arational and systematic method to equitably allocate the costs of our ships to the periods during which we usethem. In addition, we believe that the estimates we made are reasonable and our methods consistently applied inall material respects in determining (1) the useful life and residual values of our ships, including shipimprovements; (2) which improvement costs add value to our ships and (3) the net book value of ship componentassets being retired. Finally, we believe our critical ship accounting estimates are generally comparable withthose of other major cruise companies.
43
Asset Impairments
Impairment reviews of our cruise ships, goodwill and trademarks require us to make significant estimates todetermine the fair values of these assets and cruise brands.
For our cruise ships, we perform our impairment reviews, if required, at the individual cruise ship level, which isthe lowest level for which we maintain identifiable cash flows that are independent of the cash flows of otherassets and liabilities.
We believe it is probable that each of our cruise brands’ estimated fair value that carry goodwill at November 30,2014 exceeded their carrying value. We also believe that it is probable that the estimated fair value of each of ourcruise brands’ trademarks recorded at November 30, 2014 exceeded their carrying values.
The determination of fair value includes numerous assumptions that are subject to various risks and uncertainties,unless a comparable, viable actively-traded market exists, which is usually not the case for cruise ships, cruisebrands and trademarks. Our ships’ fair values are typically estimated based either on ship sales price negotiationsor discounted future cash flows. The principal assumptions used to calculate our discounted future cash flowsinclude forecasted future operating results over the expected period we believe the ships will have economicbenefit to us and their estimated residual values.
In performing annual assessments of our cruise brands that carry goodwill, qualitative factors that we consider todetermine their effect on each of the cruise brand’s estimated fair values include industry and market conditions,macroeconomic conditions, changes to WACC, overall financial performance, changes in fuel prices and capitalexpenditures. In determining the estimated fair values of cruise brands utilizing discounted future cash flowanalysis for our quantitative goodwill impairment tests, significant judgments are made related to forecastingfuture operating results, including net revenue yields and net cruise costs including fuel prices; capacity changes,including the expected rotation of vessels into, or out of, the cruise brand; capital expenditures; WACC of marketparticipants, adjusted for the risk attributable to the geographic region in which the cruise brand operates andterminal values. In addition, third-party appraisers are sometimes used to help determine fair values of cruisebrands and trademarks, and their valuation methodologies are also typically subject to uncertainties similar tothose discussed above.
In addition, in performing our annual assessments of our cruise brands’ significant trademarks, qualitative factorsthat we consider to determine their effect on each of the cruise brand’s recorded trademarks’ estimated fairvalues include industry and market conditions, macroeconomic conditions, changes to the WACC, changes inroyalty rates and overall financial performance. In determining our trademark estimated fair values for ourquantitative impairment tests, we also use discounted future cash flow analysis, which requires some of the samesignificant judgments discussed above. Specifically, determining the estimated amount of royalties that we arerelieved from having to pay for the use of the associated trademarks is based upon forecasted cruise revenues anda market participant’s royalty rate. The royalty rates are estimated primarily using comparable royaltyagreements for similar industries.
We believe that we have made reasonable estimates and judgments in determining whether our cruise ships,goodwill and trademarks have been impaired. However, if there is a change in assumptions used or if there is achange in the conditions or circumstances influencing fair values in the future, then we may need to recognize animpairment charge.
Contingencies
We periodically assess the potential liabilities related to any lawsuits or claims brought against us, as well as forother known unasserted claims, including environmental, legal, regulatory, guest and crew and tax matters. Inaddition, we periodically assess the recoverability of our trade and other receivables, charter-hire agreements andother counterparty credit exposures, such as contractual nonperformance by financial and other institutions withwhich we conduct significant business. Our credit exposure includes contingent obligations related to cashpayments received directly by travel agents and tour operators for cash collected by them on cruise sales inAustralia and most of Europe where we are obligated to honour our guests’ cruise payments made by them totheir travel agents and tour operators regardless of whether we have received these payments. While it istypically very difficult to determine the timing and ultimate outcome of these matters, we use our best judgmentto determine if it is highly probable, or probable for income tax matters, that we will incur an expense related tothe settlement or final adjudication of such matters and whether a reasonable estimation of such matters, if any,
44
Stra
tegi
cR
epor
t
can be made. In assessing probable losses, we make estimates of the amount of probable insurance recoveries, ifany, which are recorded as assets. We accrue a liability and establish a reserve when we believe a loss is highlyprobable, or probable for income tax matters, and the amount of the loss can be reasonably estimated inaccordance with IFRS. Such accruals and reserves are typically based on developments to date, management’sestimates of the outcomes of these matters, our experience in contesting, litigating and settling other similar non-income tax matters, historical claims experience, actuarially determined estimates of liabilities and any relatedinsurance coverages.
Given the inherent uncertainty related to the eventual outcome of these matters and potential insurancerecoveries, it is possible that all or some of these matters may be resolved for amounts materially different fromany provisions or disclosures that we may have made with respect to their resolution. In addition, as newinformation becomes available, we may need to reassess the amount of asset or liability that needs to be accruedrelated to our contingencies. All such revisions in our estimates could materially impact our results of operationsand financial position.
Results of Operations
We earn substantially all of our cruise revenues from the following:
• sales of passenger cruise tickets and, in some cases, the sale of air and other transportation to and fromairports near our ships’ home ports and cancellation fees. The cruise ticket price typically includesaccommodations, most meals, some non-alcoholic beverages and most onboard entertainment. We alsocollect fees, taxes and other charges from our guests, and
• sales of goods and services primarily onboard our ships not included in the cruise ticket price includingsubstantially all liquor and some non-alcoholic beverage sales, casino gaming, shore excursions, giftshop sales, photo sales, communication services, full service spas, specialty themed restaurants, cruisevacation protection programs and pre- and post-cruise land packages. These goods and services areprovided either directly by us or by independent concessionaires, from which we receive either apercentage of their revenues or a fee.
We incur cruise operating costs and expenses for the following:
• the costs of passenger cruise bookings, which represent costs that are directly associated with passengercruise ticket revenues, and include travel agent commissions, air and other transportation related costs,fees, taxes and other charges that vary with guest head counts and related credit and debit card or directdebit fees,
• onboard and other cruise costs, which represent costs that are directly associated with onboard andother revenues, and include the costs of liquor and some non-alcoholic beverages, costs of tangiblegoods sold by us in our gift shops and from our photo sales, communication costs, costs of cruisevacation protection programs, costs of pre- and post-cruise land packages and related credit and debitcard or direct debit fees. Concession revenues do not have significant associated expenses because thecosts and services incurred for concession revenues are borne by our concessionaires,
• fuel costs, which include fuel delivery costs,• payroll and related costs, which represent all costs related to our shipboard personnel, including deck
and engine crew, including officers, and hotel and administrative employees, while costs associatedwith our shoreside personnel are included in selling and administrative expenses,
• food costs, which include both our guest and crew food costs and• other ship operating expenses, which include port costs that do not vary with guest head counts, repairs
and maintenance, including minor improvements and dry-dock expenses, hotel costs, entertainment,gains and losses on ship sales, ship impairments, freight and logistics, insurance premiums and all othership operating expenses.
45

Statistical Information
Years Ended November 30,2014 2013
ALBDs (in thousands) (a) (b) . . . . . . . . . . . . . . . . . . . . . . . . . . . . . . . . . . . . . . . . . . . . . . . . . . . . . 76,000 74,033Occupancy percentage (c) . . . . . . . . . . . . . . . . . . . . . . . . . . . . . . . . . . . . . . . . . . . . . . . . . . . . . . . . 104.1% 105.1%Passengers carried (in thousands) . . . . . . . . . . . . . . . . . . . . . . . . . . . . . . . . . . . . . . . . . . . . . . . . . 10,566 10,061Fuel consumption in metric tons (in thousands) . . . . . . . . . . . . . . . . . . . . . . . . . . . . . . . . . . . 3,194 3,266Fuel consumption in metric tons per ALBD . . . . . . . . . . . . . . . . . . . . . . . . . . . . . . . . . . . . . . . 0.042 0.044Fuel cost per metric ton consumed . . . . . . . . . . . . . . . . . . . . . . . . . . . . . . . . . . . . . . . . . . . . . . . . $ 636 $ 676Currencies . . . . . . . . . . . . . . . . . . . . . . . . . . . . . . . . . . . . . . . . . . . . . . . . . . . . . . . . . . . . . . . . . . . . . . . .
U.S. dollar to €1 . . . . . . . . . . . . . . . . . . . . . . . . . . . . . . . . . . . . . . . . . . . . . . . . . . . . . . . . . . . . . . . $ 1.34 $ 1.32U.S. dollar to £1 . . . . . . . . . . . . . . . . . . . . . . . . . . . . . . . . . . . . . . . . . . . . . . . . . . . . . . . . . . . . . . . $ 1.66 $ 1.56U.S. dollar to Australian dollar . . . . . . . . . . . . . . . . . . . . . . . . . . . . . . . . . . . . . . . . . . . . . . . . . $ 0.91 $ 0.98
(a) ALBD is a standard measure of passenger capacity for the period that we use to approximate rate andcapacity variances, based on consistently applied formulas, that we use to perform analyses to determine themain non-capacity driven factors that cause our cruise revenues and expenses to vary. ALBDs assume thateach cabin we offer for sale accommodates two passengers and is computed by multiplying passengercapacity by revenue-producing ship operating days in the period.
(b) In 2014, we had a 2.7% capacity increase in ALBDs compared to 2013 comprised of a 4.3% capacityincrease in our North America brands and a minor capacity increase in our EAA brands.
Our North America brands’ capacity increase was caused by:
• the full year impact from one Princess 3,560-passenger capacity ship delivered in 2013;• the partial year impact from one Princess 3,560-passenger capacity ship delivered in 2014 and• fewer ship dry-dock days in 2014 compared to 2013.
In 2013, we had a 2.9% capacity increase in ALBDs compared to 2012 comprised of a 3.4% and 2.5%capacity increase in our EAA brands and North America brands, respectively.
Our EAA brands’ capacity increase was caused by:
• the full year impact from one AIDA 2,194-passenger capacity ship and one Costa 2,984-passengercapacity ship both delivered in 2012;
• the partial year impact from one AIDA 2,194-passenger capacity ship delivered in 2013 and• fewer ship dry-dock days in 2013 compared to 2012.
These increases were partially offset by the full year impact from the removal of two Costa ships andthe sale of one P&O Cruises (Australia) 1,462-passenger capacity ship all in 2012.
Our North America brands’ capacity increase was caused by:
• the full year impact from one Carnival Cruise Line 3,690-passenger capacity ship delivered in2012 and
• the partial year impact from one Princess 3,560-passenger capacity ship delivered in 2013.
These increases were partially offset by more ship dry-dock days in 2013 compared to 2012.
(c) In accordance with cruise industry practice, occupancy is calculated using a denominator of ALBDs, whichassumes two passengers per cabin even though some cabins can accommodate three or more passengers.Percentages in excess of 100% indicate that on average more than two passengers occupied some cabins.
2014 Compared to 2013
Revenues
Consolidated
Cruise passenger ticket revenues made up 75% of our 2014 total revenues. Cruise passenger ticket revenuesincreased by $241 million, or 2.1%, to $11.9 billion in 2014 from $11.6 billion in 2013.
46
Stra
tegi
cR
epor
t
This increase was caused by:
• $309 million – 2.7% capacity increase in ALBDs and• $102 million – foreign currency translational impact from a weaker U.S. dollar against the euro and
sterling, net of a stronger U.S. dollar against the Australian dollar (“2014 net currency impact”).
These increases were partially offset by:
• $114 million – 1.0 percentage point decrease in occupancy and• $37 million – decrease in cruise ticket pricing.
The remaining 25% of 2014 total revenues were substantially all comprised of onboard and other cruiserevenues, which increased by $182 million, or 5.1%, to $3.8 billion in 2014 from $3.6 billion in 2013. Thisincrease was principally due to our 2.7% capacity increase in ALBDs, which accounted for $96 million, andhigher onboard spending by our guests, which accounted for $92 million, partially offset by a 1.0 percentagepoint decrease in occupancy, which accounted for $36 million. Onboard and other revenues included concessionrevenues of $1.1 billion in both 2014 and 2013.
North America Brands
Cruise passenger ticket revenues made up 73% of our 2014 total revenues. Cruise passenger ticket revenuesincreased slightly by $19 million to $6.9 billion in 2014 from $6.8 billion in 2013.
This increase was caused by:
• $294 million – 4.3% capacity increase in ALBDs.
This increase was partially offset by:
• $130 million – 2.0 percentage point decrease in occupancy;• $75 million – decrease in cruise ticket pricing and• $58 million – decrease in air transportation revenues from guests who purchased their tickets from us.
Our cruise ticket pricing decrease was driven by the promotional pricing environment in the Caribbean resultingfrom the large increase in cruise industry capacity.
The remaining 27% of 2014 total revenues were comprised of onboard and other cruise revenues, whichincreased by $168 million, or 7.0%, to $2.6 billion in 2014 from $2.4 billion in 2013.
This increase was caused by:
• $103 million – 4.3% capacity increase in ALBDs;• $78 million – higher onboard spending by our guests and• $20 million – higher other third-party revenues.
These increases were partially offset by:
• $46 million – 2.0 percentage point decrease in occupancy.
Onboard and other revenues included concession revenues of $735 million in 2014 and $727 million in 2013.
EAA Brands
Cruise passenger ticket revenues made up 82% of our 2014 total revenues. Cruise passenger ticket revenuesincreased by $223 million, or 4.6%, to $5.0 billion in 2014 from $4.8 billion 2013.
This increase was substantially due to:
• $102 million – 2014 net currency impact;• $49 million – increase in air transportation revenues from guests who purchased their tickets from us;• $39 million – increase in cruise ticket pricing and $23 million – slight increase in occupancy.
47
The remaining 18% of 2014 total revenues were comprised of onboard and other cruise revenues, whichincreased by $19 million, or 1.7%, and remained at $1.1 billion in both 2014 and 2013. Onboard and otherrevenues included concession revenues of $367 million in 2014 and $370 million in 2013.
Costs and Expenses
Consolidated
Operating costs and expenses decreased by $221 million, or 2.1%, to $10.4 billion in 2014 from $10.6 billion in2013.
This decrease was caused by:
• $176 million – nonrecurrence in 2014 of impairment charges related to Costa Classica and CostaVoyager;
• $126 million – lower fuel prices;• $107 million – lower fuel consumption per ALBD;• $64 million – decreases in commissions, transportation and other related expenses primarily due to a
decrease in air transportation costs related to guests who purchased their tickets from us;• $56 million – nonrecurrence in 2014 of additional costs and expenses related to the 2013 voyage
disruptions, net of third-party insurance recoverables of $20 million;• $51 million – gains from the sales of Costa Voyager and Ocean Princess;• $40 million – lower dry-dock and other ship repair and maintenance expenses and• $38 million – 1.0 percentage point decrease in occupancy.
These decreases were partially offset by:
• $278 million – 2.7% capacity increase in ALBDs;• $59 million – 2014 net currency impact;• $53 million – impairment charges related to Costa Celebration and Grand Holiday and• $47 million – various other operating expenses, net.
Selling and administrative expenses increased by $175 million, or 9.3%, to $2.1 billion in 2014 from $1.9 billionin 2013.
Depreciation and amortization expenses increased by $47 million, or 3.0%, and remained at $1.6 billion in both2014 and 2013.
Our total costs and expenses as a percentage of revenues decreased to 89% in 2014 from 91% in 2013.
North America Brands
Operating costs and expenses decreased slightly by $22 million and remained at $6.3 billion in both 2014 and2013.
This decrease was caused by:
• $103 million – decreases in commissions, transportation and other related expenses primarily due to adecrease in air transportation costs related to guests who purchased their tickets from us;
• $87 million – lower fuel prices;• $58 million – lower fuel consumption per ALBD;• $56 million – nonrecurrence in 2014 of additional costs and expenses related to the 2013 voyage
disruptions, net of third-party insurance recoverables of $20 million;• $43 million – 2.0 percentage point decrease in occupancy;• $43 million – lower dry-dock and other ship repair and maintenance expenses and• $14 million – gain from the sale of Ocean Princess.
These decreases were partially offset by:
• $271 million – 4.3% capacity increase in ALBDs;• $39 million – nonrecurrence in 2014 of an intersegment transaction, which was fully offset in our
Cruise Support segment and• $72 million – various other operating expenses, net.
48
Stra
tegi
cR
epor
t
Our total costs and expenses as a percentage of revenues decreased to 89% in 2014 from 90% in 2013.
EAA Brands
Operating costs and expenses decreased by $223 million, or 5.4%, to $3.9 billion in 2014 from $4.1 billion in2013.
This decrease was caused by:
• $176 million – nonrecurrence in 2014 of impairment charges related to Costa Classica and CostaVoyager;
• $51 million – lower fuel consumption per ALBD;• $41 million – lower fuel prices;• $39 million – lower dry-dock and other ship repair and maintenance expenses;• $37 million – gain from the sale of Costa Voyager and• $37 million – various other operating expenses, net.
These decreases were partially offset by:
• $59 million – 2014 net currency impact;• $53 million – impairment charges related to Costa Celebration and Grand Holiday and• $46 million – increases in commissions, transportation and other related expenses principally due to an
increase in air transportation costs related to guests who purchased their tickets from us.
Our total costs and expenses as a percentage of revenues decreased to 86% in 2014 from 92% in 2013.
Operating Income
Our consolidated operating income increased by $440 million, or 33%, to $1.8 billion in 2014 from $1.4 billionin 2013. Our North America brands’ operating income increased by $105 million, or 11%, to $1.1 billion in 2014from $956 million in 2013, and our EAA brands’ operating income increased by $422 million, or 90%, to $893million in 2014 from $471 million in 2013. These changes were primarily due to the reasons discussed above.
Nonoperating Expense
Net interest expense decreased by $31 million, or 9.7%, to $288 million in 2014 from $319 million in 2013. In2014, losses on fuel derivatives, net of $271 million were substantially all comprised of unrealized losses, net,and in 2013 gains on fuel derivatives, net of $36 million were all comprised of unrealized gains, net.
Key Performance Non-GAAP Financial Indicators
We use net cruise revenues per ALBD (“net revenue yields”), net cruise costs per ALBD and net cruise costsexcluding fuel per ALBD as significant non-GAAP financial measures of our cruise segments’ financialperformance. These measures enable us to separate the impact of predictable capacity changes from the moreunpredictable rate changes that affect our business; gains and losses on ship sales and ship impairments, net; andrestructuring expenses that are not part of our core operating business. We believe these non-GAAP measuresprovide useful information to investors and expanded insight to measure our revenue and cost performance as asupplement to our U.S. GAAP consolidated financial statements.
Net revenue yields are commonly used in the cruise industry to measure a company’s cruise segment revenueperformance and for revenue management purposes. We use “net cruise revenues” rather than “gross cruiserevenues” to calculate net revenue yields. We believe that net cruise revenues is a more meaningful measure indetermining revenue yield than gross cruise revenues because it reflects the cruise revenues earned net of ourmost significant variable costs, which are travel agent commissions, cost of air and other transportation, certainother costs that are directly associated with onboard and other revenues and credit and debit cardfees. Substantially all of our remaining cruise costs are largely fixed, except for the impact of changing pricesand food expenses, once our ship capacity levels have been determined.
Net passenger ticket revenues reflect gross passenger ticket revenues, net of commissions, transportation andother costs. Net onboard and other revenues reflect gross onboard and other revenues, net of onboard and othercruise costs. Net passenger ticket revenue yields and net onboard and other revenue yields are computed bydividing net passenger ticket revenues and net onboard and other revenues by ALBDs.
49
Net cruise costs per ALBD and net cruise costs excluding fuel per ALBD are the most significant measures weuse to monitor our ability to control our cruise segments’ costs rather than gross cruise costs per ALBD. Weexclude the same variable costs that are included in the calculation of net cruise revenues to calculate net cruisecosts with and without fuel to avoid duplicating these variable costs in our non-GAAP financial measures. Inaddition, we exclude gains and losses on ship sales and ship impairments, net and restructuring expenses fromour calculation of net cruise costs with and without fuel as they are not considered part of our core operatingbusiness and, therefore, are not an indication of our future earnings performance. As such, we also believe it ismore meaningful for gains and losses on ship sales and ship impairments, net and restructuring expenses to beexcluded from our net income and earnings per share and, accordingly, we present non-GAAP net income andnon-GAAP earnings per share excluding these items.
In addition, because our EAA cruise brands utilize the euro, sterling and Australian dollar to measure their resultsand financial condition, the translation of those operations to our U.S. dollar reporting currency results indecreases in reported U.S. dollar revenues and expenses if the U.S. dollar strengthens against these foreigncurrencies and increases in reported U.S. dollar revenues and expenses if the U.S. dollar weakens against theseforeign currencies. Accordingly, we also monitor and report these non-GAAP financial measures assuming the2014 periods’ currency exchange rates have remained constant with the 2013 periods’ rates, respectively, or on a“constant dollar basis,” in order to remove the impact of changes in exchange rates on the translation of our EAAbrands. We believe that this is a useful measure since it facilitates a comparative view of the changes in ourbusiness in a fluctuating currency exchange rate environment.
Although our constant dollar basis measure removes the foreign currency translational impact as discussedabove, it does not remove the foreign currency transactional impact from changes in exchange rates on ourbrands’ revenues and expenses that are denominated in a currency other than their functional currency.Historically, the foreign currency transactional impact has not been significant when measuring the periodicchanges in our results of operations. However, given the continuing expansion of our global business and theheightened volatility in foreign currency exchange rates, we believe the foreign currency transactional impactwill be more significant in measuring our 2015 results compared to 2014 than in previous years. See“Quantitative and Qualitative Disclosures About Market Risk – Foreign Currency Exchange Rate Risks –Operational Currency Risks” below.
We believe that the goodwill, trademark and other impairment charges and restructuring expenses recognized in2014 and 2013 are special charges and, therefore, are also not an indication of our future earnings performance.As such, we believe it is more meaningful for these impairment charges and restructuring expenses to beexcluded from our net income and earnings per share and, accordingly, we present non-GAAP net income andnon-GAAP earnings per share excluding these charges.
Under U.S. GAAP, the realized and unrealized gains and losses on fuel derivatives not qualifying as fuel hedgesare recognized currently in earnings. We believe that unrealized gains and losses on fuel derivatives are not anindication of our earnings performance since they relate to future periods and may not ultimately be realized inour future earnings. Therefore, we believe it is more meaningful for the unrealized gains and losses on fuelderivatives to be excluded from our net income and earnings per share and, accordingly, we present non-GAAPnet income and non-GAAP earnings per share excluding these unrealized gains and losses.
We have not included in our earnings guidance the impact of unrealized gains and losses on fuel derivativesbecause these unrealized amounts involve a significant amount of uncertainty, and we do not believe they are anindication of our future earnings performance. Accordingly, our earnings guidance is presented on a non-GAAPbasis only. As a result, we did not present a reconciliation between forecasted non-GAAP diluted earnings pershare guidance and forecasted U.S. GAAP diluted earnings per share guidance, since we do not believe that thereconciliation information would be meaningful. However, we do forecast realized gains and losses on fuelderivatives by applying current Brent prices to the derivatives that settle in the forecast period.
Our consolidated financial statements are prepared in accordance with U.S. GAAP. The presentation of our non-GAAP financial information is not intended to be considered in isolation from, as substitute for, or superior to thefinancial information prepared in accordance with U.S. GAAP. There are no specific rules for determining ournon-GAAP current and constant dollar financial measures and, accordingly, they are susceptible to varyingcalculations, and it is possible that they may not be exactly comparable to the like-kind information presented byother companies, which is a potential risk associated with using these measures to compare us to othercompanies.
50
Stra
tegi
cR
epor
t
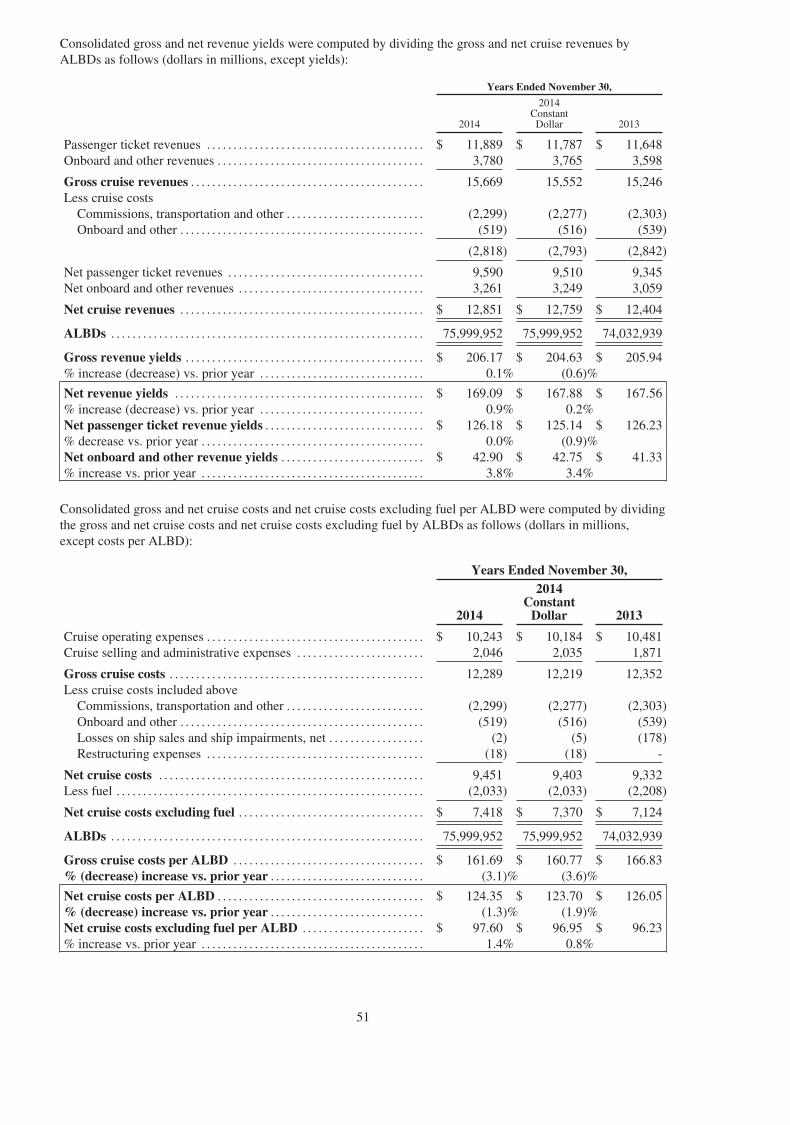
Consolidated gross and net revenue yields were computed by dividing the gross and net cruise revenues byALBDs as follows (dollars in millions, except yields):
Years Ended November 30,
2014
2014ConstantDollar 2013
Passenger ticket revenues . . . . . . . . . . . . . . . . . . . . . . . . . . . . . . . . . . . . . . . . . $ 11,889 $ 11,787 $ 11,648Onboard and other revenues . . . . . . . . . . . . . . . . . . . . . . . . . . . . . . . . . . . . . . . 3,780 3,765 3,598
Gross cruise revenues . . . . . . . . . . . . . . . . . . . . . . . . . . . . . . . . . . . . . . . . . . . . 15,669 15,552 15,246Less cruise costs
Commissions, transportation and other . . . . . . . . . . . . . . . . . . . . . . . . . . (2,299) (2,277) (2,303)Onboard and other . . . . . . . . . . . . . . . . . . . . . . . . . . . . . . . . . . . . . . . . . . . . . . (519) (516) (539)
(2,818) (2,793) (2,842)
Net passenger ticket revenues . . . . . . . . . . . . . . . . . . . . . . . . . . . . . . . . . . . . . 9,590 9,510 9,345Net onboard and other revenues . . . . . . . . . . . . . . . . . . . . . . . . . . . . . . . . . . . 3,261 3,249 3,059
Net cruise revenues . . . . . . . . . . . . . . . . . . . . . . . . . . . . . . . . . . . . . . . . . . . . . . $ 12,851 $ 12,759 $ 12,404
ALBDs . . . . . . . . . . . . . . . . . . . . . . . . . . . . . . . . . . . . . . . . . . . . . . . . . . . . . . . . . . . 75,999,952 75,999,952 74,032,939
Gross revenue yields . . . . . . . . . . . . . . . . . . . . . . . . . . . . . . . . . . . . . . . . . . . . . $ 206.17 $ 204.63 $ 205.94% increase (decrease) vs. prior year . . . . . . . . . . . . . . . . . . . . . . . . . . . . . . . 0.1% (0.6)%
Net revenue yields . . . . . . . . . . . . . . . . . . . . . . . . . . . . . . . . . . . . . . . . . . . . . . . $ 169.09 $ 167.88 $ 167.56% increase (decrease) vs. prior year . . . . . . . . . . . . . . . . . . . . . . . . . . . . . . . 0.9% 0.2%Net passenger ticket revenue yields . . . . . . . . . . . . . . . . . . . . . . . . . . . . . . $ 126.18 $ 125.14 $ 126.23% decrease vs. prior year . . . . . . . . . . . . . . . . . . . . . . . . . . . . . . . . . . . . . . . . . . 0.0% (0.9)%Net onboard and other revenue yields . . . . . . . . . . . . . . . . . . . . . . . . . . . $ 42.90 $ 42.75 $ 41.33% increase vs. prior year . . . . . . . . . . . . . . . . . . . . . . . . . . . . . . . . . . . . . . . . . . 3.8% 3.4%
Consolidated gross and net cruise costs and net cruise costs excluding fuel per ALBD were computed by dividingthe gross and net cruise costs and net cruise costs excluding fuel by ALBDs as follows (dollars in millions,except costs per ALBD):
Years Ended November 30,
2014
2014Constant
Dollar 2013
Cruise operating expenses . . . . . . . . . . . . . . . . . . . . . . . . . . . . . . . . . . . . . . . . . $ 10,243 $ 10,184 $ 10,481Cruise selling and administrative expenses . . . . . . . . . . . . . . . . . . . . . . . . 2,046 2,035 1,871
Gross cruise costs . . . . . . . . . . . . . . . . . . . . . . . . . . . . . . . . . . . . . . . . . . . . . . . . 12,289 12,219 12,352Less cruise costs included above
Commissions, transportation and other . . . . . . . . . . . . . . . . . . . . . . . . . . (2,299) (2,277) (2,303)Onboard and other . . . . . . . . . . . . . . . . . . . . . . . . . . . . . . . . . . . . . . . . . . . . . . (519) (516) (539)Losses on ship sales and ship impairments, net . . . . . . . . . . . . . . . . . . (2) (5) (178)Restructuring expenses . . . . . . . . . . . . . . . . . . . . . . . . . . . . . . . . . . . . . . . . . (18) (18) -
Net cruise costs . . . . . . . . . . . . . . . . . . . . . . . . . . . . . . . . . . . . . . . . . . . . . . . . . . 9,451 9,403 9,332Less fuel . . . . . . . . . . . . . . . . . . . . . . . . . . . . . . . . . . . . . . . . . . . . . . . . . . . . . . . . . . (2,033) (2,033) (2,208)
Net cruise costs excluding fuel . . . . . . . . . . . . . . . . . . . . . . . . . . . . . . . . . . . $ 7,418 $ 7,370 $ 7,124
ALBDs . . . . . . . . . . . . . . . . . . . . . . . . . . . . . . . . . . . . . . . . . . . . . . . . . . . . . . . . . . . 75,999,952 75,999,952 74,032,939
Gross cruise costs per ALBD . . . . . . . . . . . . . . . . . . . . . . . . . . . . . . . . . . . . $ 161.69 $ 160.77 $ 166.83% (decrease) increase vs. prior year . . . . . . . . . . . . . . . . . . . . . . . . . . . . . (3.1)% (3.6)%
Net cruise costs per ALBD . . . . . . . . . . . . . . . . . . . . . . . . . . . . . . . . . . . . . . . $ 124.35 $ 123.70 $ 126.05% (decrease) increase vs. prior year . . . . . . . . . . . . . . . . . . . . . . . . . . . . . (1.3)% (1.9)%Net cruise costs excluding fuel per ALBD . . . . . . . . . . . . . . . . . . . . . . . $ 97.60 $ 96.95 $ 96.23% increase vs. prior year . . . . . . . . . . . . . . . . . . . . . . . . . . . . . . . . . . . . . . . . . . 1.4% 0.8%
51

Non-GAAP diluted earnings per share was computed as follows (in millions, except per share data):
Years Ended November 30,2014 2013
Net income - dilutedU.S. GAAP net income . . . . . . . . . . . . . . . . . . . . . . . . . . . . . . . . . . . . . . . . . . . . . . . . . . . . . . $1,236 $1,078Losses on ship sales and ship impairments, net . . . . . . . . . . . . . . . . . . . . . . . . . . . . . . . . 2 (a) 163 (b)Goodwill, trademark and other impairment charges . . . . . . . . . . . . . . . . . . . . . . . . . . . - 27 (c)Restructuring expenses . . . . . . . . . . . . . . . . . . . . . . . . . . . . . . . . . . . . . . . . . . . . . . . . . . . . . . . 18 -Unrealized losses (gains) on fuel derivatives, net . . . . . . . . . . . . . . . . . . . . . . . . . . . . . . 268 (36)
Non-GAAP net income . . . . . . . . . . . . . . . . . . . . . . . . . . . . . . . . . . . . . . . . . . . . . . . . . . . . . . $1,524 $1,232
Weighted-average shares outstanding – diluted . . . . . . . . . . . . . . . . . . . . . . . . . . . . . . . 778 777
Earnings per share – dilutedU.S. GAAP earnings per share . . . . . . . . . . . . . . . . . . . . . . . . . . . . . . . . . . . . . . . . . . . . . . $ 1.59 $ 1.39Losses on ship sales and ship impairments, net . . . . . . . . . . . . . . . . . . . . . . . . . . . . . . . . - (a) 0.21 (b)Goodwill, trademark and other impairment charges . . . . . . . . . . . . . . . . . . . . . . . . . . . - 0.03 (c)Restructuring expenses . . . . . . . . . . . . . . . . . . . . . . . . . . . . . . . . . . . . . . . . . . . . . . . . . . . . . . . 0.02 -Unrealized losses (gains) on fuel derivatives, net . . . . . . . . . . . . . . . . . . . . . . . . . . . . . . 0.35 (0.05)
Non-GAAP earnings per share . . . . . . . . . . . . . . . . . . . . . . . . . . . . . . . . . . . . . . . . . . . . . . $ 1.96 $ 1.58
(a) Represents impairment charges of $22 million for Grand Celebration and $31 million for Grand Holiday,partially offset by gains of $37 million from the sale of Costa Voyager and $14 million from the sale ofOcean Princess.
(b) Substantially due to $176 million of impairment charges related to Costa Classica and Costa Voyager,partially offset by a $15 million gain in our Tour and Other segment from the sale of a former HollandAmerica Line ship, which was on charter to an unaffiliated entity.
(c) Represents impairment charges of $14 million for an investment and $13 million for Ibero’s remainingtrademarks’ carrying value.
Net cruise revenues increased by $447 million, or 3.6%, to $12.9 billion in 2014 from $12.4 billion in 2013. Thisincrease was caused by our 2.7% capacity increase in ALBDs, which accounted for $330 million, the 2014 netcurrency impact, which accounted for $92 million, and a slight increase in constant dollar net revenue yields,which accounted for $24 million. The increase in net revenue yields on a constant dollar basis was caused by a3.4% increase in net onboard and other revenue yields, partially offset by a slight decrease in net passenger ticketrevenue yields. The 3.4% increase in net onboard and other revenue yields resulted from a 3.7% increase fromour North America brands and a 2.8% increase from our EAA brands, which included increases in primarily allthe net onboard revenue categories. The slight decrease in net passenger ticket revenue yields was driven by ourNorth America brands’ promotional pricing environment in the Caribbean resulting from the large increase incruise industry capacity, partially offset by improvements at our continental European brands. Gross cruiserevenues increased by $423 million, or 2.8%, to $15.7 billion in 2014 from $15.2 billion in 2013 for largely thesame reasons as discussed above.
Net cruise costs excluding fuel increased by $294 million, or 4.1%, to $7.4 billion in 2014 from $7.1 billion in2013. The increase was caused by our 2.7% capacity increase in ALBDs, which accounted for $190 million, aslight increase in constant dollar net cruise costs excluding fuel per ALBD, which accounted for $55 million, andthe 2014 net currency impact, which accounted for $49 million.
Fuel costs decreased by $175 million, or 7.9%, to $2.0 billion in 2014 from $2.2 billion in 2013. This was causedby lower fuel prices, which accounted for $126 million, and lower fuel consumption per ALBD, which accountedfor $107 million, partially offset by our 2.7% capacity increase in ALBDs, which accounted for $59 million.
Gross cruise costs decreased slightly by $63 million to $12.3 billion in 2014 from $12.4 billion in 2013 forprincipally the same reasons as discussed above.
Liquidity, Financial Condition and Capital Resources
Our primary financial goals are to profitably grow our cruise business and increase our return on invested capital,reaching double digit returns in the next three to four years, while maintaining a strong balance sheet. Our ability
52
Stra
tegi
cR
epor
t
to generate significant operating cash flows allows us to internally fund our capital investments. Our goal is toreturn excess free cash flows to our shareholders in the form of additional dividends and/or share buybacks. Inaddition, we are committed to maintaining our strong investment grade credit ratings, which are among thehighest in the leisure travel industry. Other objectives of our capital structure policy are to maintain a sufficientlevel of liquidity with our available cash and cash equivalents and committed financings for immediate andfuture liquidity needs, and a reasonable debt maturity profile that is spread out over a number of years.
Based on our historical results, projections and financial condition, we believe that our future operating cashflows and liquidity will be sufficient to fund all of our expected capital projects including shipbuildingcommitments, ship improvements, debt service requirements, working capital needs and other firm commitmentsover the next several years. We believe that our ability to generate significant operating cash flows and ourstrong balance sheet as evidenced by our investment grade credit ratings provide us with the ability in mostfinancial credit market environments to obtain debt financing, as needed. Our future operating cash flows and ourability to issue debt can be adversely impacted by numerous factors outside our control including, but not limitedto, those noted under Item 4. Principal Risks and Uncertainties within this Strategic Report. If our long-termsenior unsecured credit ratings were to be downgraded or assigned a negative outlook, our access to and cost ofdebt financing may be negatively impacted.
At November 30, 2014, we had a working capital deficit of $5.4 billion. This deficit included $3.0 billion ofcurrent customer deposits, which represent the passenger revenues already collected for cruises departing overthe next twelve months and, accordingly, are substantially more like deferred revenue balances rather than actualcurrent cash liabilities. Our November 30, 2014 working capital deficit also included $1.7 billion of current debtobligations. We continue to generate significant cash from operations and have a strong balance sheet. Thisstrong balance sheet provides us with the ability to refinance our current debt obligations before, or as theybecome due, in most financial credit market environments. We also have our revolving credit facilities availableto provide long-term rollover financing should the need arise, or if we choose to do so. After excluding currentcustomer deposits and current debt obligations from our November 30, 2014 working capital deficit balance, ournon-GAAP adjusted working capital deficit was $661 million. Our business model, along with our strong balancesheet and unsecured revolving credit facilities, allows us to operate with a working capital deficit and still meetour operating, investing and financing needs. We believe we will continue to have working capital deficits for theforeseeable future.
At November 30, 2013, the U.S. dollar was $1.63 to sterling, $1.36 to the euro and $0.91 to the Australian dollar.Had these November 30, 2013 currency exchange rates been used to translate our November 30, 2014 non-U.S.dollar functional currency operations’ assets and liabilities instead of the November 30, 2014 U.S. dollarexchange rates of $1.56 to sterling, $1.25 to the euro and $0.85 to the Australian dollar, our total assets andliabilities would have been higher by $1.2 billion and $565 million, respectively.
Sources and Uses of Cash
Our business provided $3.4 billion of net cash from operations during 2014, an increase of $596 million, or 21%,compared to $2.8 billion in 2013. This increase was substantially due to more cash being provided from ouroperating results and an increase in customer deposits.
During 2014, our expenditures for capital projects were $2.6 billion, of which $1.5 billion was spent on ourongoing new shipbuilding program, substantially for Regal Princess and Costa Diadema. In addition to our newshipbuilding program, we had capital expenditures of $754 million for ship improvements and replacements and$305 million for information technology, buildings and improvements, and other assets. Furthermore, in 2014 wesold Costa Voyager and received $42 million in cash proceeds.
During 2014, we borrowed a net $617 million of short-term borrowings in connection with our availability of,and needs for, cash at various times throughout the year. In addition, during 2014 we repaid $2.5 billion of long-term debt, including early repayments of $839 million of three bank loans and $590 million of two export creditfacilities. Furthermore, during 2014 we borrowed $1.6 billion of new long-term debt under two export creditfacilities and three bank loans. Finally, during 2014 we paid cash dividends of $776 million.
53
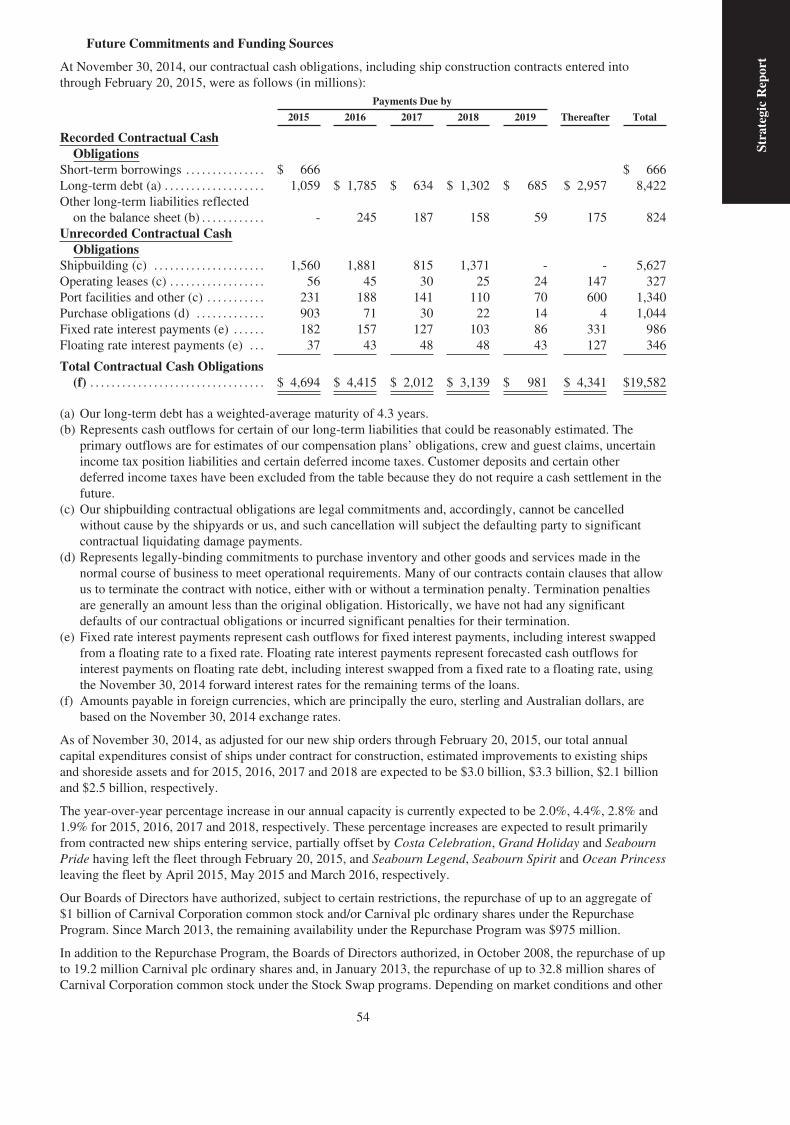
Future Commitments and Funding Sources
At November 30, 2014, our contractual cash obligations, including ship construction contracts entered intothrough February 20, 2015, were as follows (in millions):
Payments Due by
2015 2016 2017 2018 2019 Thereafter Total
Recorded Contractual CashObligations
Short-term borrowings . . . . . . . . . . . . . . . $ 666 $ 666Long-term debt (a) . . . . . . . . . . . . . . . . . . . 1,059 $ 1,785 $ 634 $ 1,302 $ 685 $ 2,957 8,422Other long-term liabilities reflected
on the balance sheet (b) . . . . . . . . . . . . - 245 187 158 59 175 824Unrecorded Contractual Cash
ObligationsShipbuilding (c) . . . . . . . . . . . . . . . . . . . . . 1,560 1,881 815 1,371 - - 5,627Operating leases (c) . . . . . . . . . . . . . . . . . . 56 45 30 25 24 147 327Port facilities and other (c) . . . . . . . . . . . 231 188 141 110 70 600 1,340Purchase obligations (d) . . . . . . . . . . . . . 903 71 30 22 14 4 1,044Fixed rate interest payments (e) . . . . . . 182 157 127 103 86 331 986Floating rate interest payments (e) . . . 37 43 48 48 43 127 346
Total Contractual Cash Obligations(f) . . . . . . . . . . . . . . . . . . . . . . . . . . . . . . . . . $ 4,694 $ 4,415 $ 2,012 $ 3,139 $ 981 $ 4,341 $19,582
(a) Our long-term debt has a weighted-average maturity of 4.3 years.(b) Represents cash outflows for certain of our long-term liabilities that could be reasonably estimated. The
primary outflows are for estimates of our compensation plans’ obligations, crew and guest claims, uncertainincome tax position liabilities and certain deferred income taxes. Customer deposits and certain otherdeferred income taxes have been excluded from the table because they do not require a cash settlement in thefuture.
(c) Our shipbuilding contractual obligations are legal commitments and, accordingly, cannot be cancelledwithout cause by the shipyards or us, and such cancellation will subject the defaulting party to significantcontractual liquidating damage payments.
(d) Represents legally-binding commitments to purchase inventory and other goods and services made in thenormal course of business to meet operational requirements. Many of our contracts contain clauses that allowus to terminate the contract with notice, either with or without a termination penalty. Termination penaltiesare generally an amount less than the original obligation. Historically, we have not had any significantdefaults of our contractual obligations or incurred significant penalties for their termination.
(e) Fixed rate interest payments represent cash outflows for fixed interest payments, including interest swappedfrom a floating rate to a fixed rate. Floating rate interest payments represent forecasted cash outflows forinterest payments on floating rate debt, including interest swapped from a fixed rate to a floating rate, usingthe November 30, 2014 forward interest rates for the remaining terms of the loans.
(f) Amounts payable in foreign currencies, which are principally the euro, sterling and Australian dollars, arebased on the November 30, 2014 exchange rates.
As of November 30, 2014, as adjusted for our new ship orders through February 20, 2015, our total annualcapital expenditures consist of ships under contract for construction, estimated improvements to existing shipsand shoreside assets and for 2015, 2016, 2017 and 2018 are expected to be $3.0 billion, $3.3 billion, $2.1 billionand $2.5 billion, respectively.
The year-over-year percentage increase in our annual capacity is currently expected to be 2.0%, 4.4%, 2.8% and1.9% for 2015, 2016, 2017 and 2018, respectively. These percentage increases are expected to result primarilyfrom contracted new ships entering service, partially offset by Costa Celebration, Grand Holiday and SeabournPride having left the fleet through February 20, 2015, and Seabourn Legend, Seabourn Spirit and Ocean Princessleaving the fleet by April 2015, May 2015 and March 2016, respectively.
Our Boards of Directors have authorized, subject to certain restrictions, the repurchase of up to an aggregate of$1 billion of Carnival Corporation common stock and/or Carnival plc ordinary shares under the RepurchaseProgram. Since March 2013, the remaining availability under the Repurchase Program was $975 million.
In addition to the Repurchase Program, the Boards of Directors authorized, in October 2008, the repurchase of upto 19.2 million Carnival plc ordinary shares and, in January 2013, the repurchase of up to 32.8 million shares ofCarnival Corporation common stock under the Stock Swap programs. Depending on market conditions and other
54
Stra
tegi
cR
epor
t
factors, we may repurchase shares of Carnival Corporation common stock and/or Carnival plc ordinary sharesunder the Repurchase Program and the Stock Swap programs concurrently. We use the Stock Swap programs insituations where we can obtain an economic benefit because either Carnival Corporation common stock orCarnival plc ordinary shares are trading at a price that is at a premium or discount to the price of Carnival plcordinary shares or Carnival Corporation common stock, as the case may be. Any realized economic benefit underthe Stock Swap programs is used for general corporate purposes, which could include repurchasing additionalstock under the Repurchase Program. Carnival plc ordinary share repurchases under both the RepurchaseProgram and the Stock Swap programs require annual shareholder approval. The existing shareholder approval islimited to a maximum of 21.5 million ordinary shares and is valid until the earlier of the conclusion of theCarnival plc 2015 annual general meeting or October 16, 2015. Finally, under the Stock Swap programs, anysales of the Carnival Corporation common stock and Carnival plc ordinary shares have been or will be registeredunder the Securities Act of 1933.
At February 20, 2015, the remaining availability under the Stock Swap programs was 18.1 million Carnival plcordinary shares and 32.0 million shares of Carnival Corporation common stock.
At November 30, 2014, we had liquidity of $4.9 billion. Our liquidity consisted of $92 million of cash and cashequivalents, which excludes $239 million of cash used for current operations, $2.3 billion available forborrowing under our revolving credit facilities, net of our commercial paper borrowings, and $2.5 billion underour committed future financings, which are comprised of ship export credit facilities. Of this $2.5 billion, $0.9billion and $1.6 billion are scheduled to be funded in 2015 and 2016, respectively. At November 30, 2014,substantially all of our revolving credit facilities are scheduled to mature in 2019, except for $300 million thatmatures in 2020. These commitments are from numerous large and well-established banks and export creditagencies, which we believe will honour their contractual agreements with us.
Substantially all of our debt agreements contain financial covenants and at November 30, 2014, we believe wewere in compliance with our debt covenants. In addition, based on, among other things, our forecasted operatingresults, financial condition and cash flows, we expect to be in compliance with our debt covenants for theforeseeable future. Generally, if an event of default under any debt agreement occurs, then pursuant to crossdefault acceleration clauses, substantially all of our outstanding debt and derivative contract payables couldbecome due, and all debt and derivative contracts could be terminated.
Off-Balance Sheet Arrangements
We are not a party to any off-balance sheet arrangements, including guarantee contracts, retained or contingentinterests, certain derivative instruments and variable interest entities that either have, or are reasonably likely tohave, a current or future material effect on our consolidated financial statements.
Quantitative and Qualitative Disclosures About Market Risk
Foreign Currency Exchange Rate Risks
Operational Currency Risks
We have foreign operations that have functional currencies other than the U.S. dollar, which result in foreigncurrency translational impacts. Our operations execute transactions in a number of currencies different than theirfunctional currencies, principally the euro, sterling and Australian and U.S. dollars, which result in foreigncurrency transactional impacts. Based on a 10% hypothetical change in all currency exchange rates that wereused in our December 19, 2014 guidance, we estimate that our 2015 first quarter and full year December 19,2014 non-GAAP guidance would change by $0.04 per share and $0.30 per share, respectively, including both theforeign currency translational and transactional impacts.
Investment Currency Risks
We have $403 million of foreign currency forwards that are designated as hedges of our net investments inforeign operations, which have a euro-denominated functional currency, thus partially offsetting this foreigncurrency exchange rate risk. Based on a 10% hypothetical change in the U.S. dollar to euro exchange rate as ofNovember 30, 2014, we estimate that these foreign currency forwards’ fair values would change by $40 million,which would be offset by a corresponding change of $40 million in the U.S. dollar value of our net investments.
55
Newbuild Currency Risks
In 2012, we entered into foreign currency zero cost collars that are designated as cash flow hedges for a portionof P&O Cruises (UK) Britannia’s euro-denominated shipyard payments. These collars mature in late February2015 at a weighted-average ceiling of $287 million and a weighted-average floor of $266 million. In 2014, weentered into foreign currency zero cost collars that are also designated as cash flow hedges for the remainingunhedged portion of Britannia’s euro-denominated shipyard payments. These collars also mature in late February2015 at a weighted-average ceiling of $281 million and a weighted-average floor of $274 million. If the spot rateis between the weighted average ceiling and floor rates on the date of maturity, then we would not owe or receiveany payments under these collars. At November 30, 2014, the estimated fair value of these outstanding foreigncurrency zero cost collars was a nominal liability. Based on a 10% hypothetical increase or decrease in theNovember 30, 2014 sterling rates to euro exchange rates, we estimate the fair value of these collars wouldincrease $26 million or decrease $27 million, respectively.
On January 22, 2015, we entered into foreign currency zero cost collars that are designated as cash flow hedgesfor a portion of a Princess and Seabourn newbuilds’ euro-denominated shipyard payments. The Princessnewbuild’s collars mature in March 2017 at a weighted-average ceiling of $590 million and a weighted-averagefloor of $504 million. The Seabourn newbuild’s collars mature in November 2016 at a weighted-average ceilingof $221 million and a weighted-average floor of $185 million. If the spot rate is between the weighted-averageceiling and floor rates on the date of maturity, then we would not owe or receive any payments under thesecollars.
At February 20, 2015, substantially all of our remaining newbuild currency exchange rate risk relates to euro-denominated newbuild construction payments for a Carnival Cruise Line, Holland America Line and Seabournnewbuild, which represent a total unhedged commitment of $1.7 billion. The functional currency cost of each ofthese ships will increase or decrease based on changes in the exchange rates until the payments are made underthe shipbuilding contract, or we enter into a foreign currency hedge. Based on a 10% hypothetical change in theU.S. dollar to euro exchange rates as of November 30, 2014, the unpaid cost of these ships would have acorresponding change of $171 million.
Interest Rate Risks
At November 30, 2014, we have interest rate swaps that have effectively changed $500 million of fixed rate debtto U.S. dollar LIBOR-based floating rate debt and $750 million of EURIBOR-based floating rate euro debt tofixed rate euro debt. Based on a 10% hypothetical change in the November 30, 2014 market interest rates, the fairvalue of all our debt and related interest rate swaps would change by $96 million. In addition, based on a 10%hypothetical change in the November 30, 2014 market interest rates, our annual interest expense on floating ratedebt, including the effect of our interest rate swaps, would change by an insignificant amount. Substantially all ofour fixed rate debt can only be called or prepaid by incurring additional costs.
Fuel Price Risks
Our exposure to market risk for changes in fuel prices substantially all relates to the consumption of fuel on ourships. We expect to consume approximately 3.2 million metric tons of fuel in 2015. Based on a 10% hypotheticalchange in our December 19, 2014 guidance’s forecasted average fuel price, we estimate that our 2015 fuelexpense, excluding the effect of zero cost collar fuel derivatives, would change by $139 million.
We mitigate a portion of our economic risk attributable to potential fuel price increases through the use of Brentzero cost collars. The actual fuel we use on our ships is marine fuel. At November 30, 2014, our fuel derivativescover a portion of our estimated fuel consumption through 2018. At November 30, 2014, the estimated fair valueof our outstanding fuel derivative contracts was a net liability of $229 million. Based on a 10% hypotheticalincrease or decrease in the November 30, 2014 Brent forward price curve, we estimate the fair value of our fuelderivatives would increase $127 million or decrease $152 million, respectively.
56
Stra
tegi
cR
epor
t
4. Principal Risks and Uncertainties.
You should carefully consider the specific risks and uncertainties set forth below and the other informationcontained within this Strategic Report, as these are important factors that could cause our actual results,performance or achievements to differ materially from our expected or historical results. Some of the statementswithin this Strategic Report and in the Carnival plc IFRS Financial Statements are “forward-lookingstatements.” For a discussion of those statements and of other factors to consider see the “Cautionary NoteConcerning Factors That May Affect Future Results” section below.
• General economic and business conditions may adversely impact consumer demand for vacations and,consequently, reduce our cruise brands’ net revenue yields and profitability.
Demand for cruises is in part dependent on the underlying perceived or actual economic condition of thecountries from which cruise companies source their guests. Adverse changes in the perceived or actual economicclimate, such as global or regional recessions, higher unemployment and underemployment rates; declines inincome levels; securities, real estate and other market declines and volatility; increasing taxation; higher fuelprices and healthcare costs; more restrictive credit markets; higher interest rates and changes in governmentalregulations, could reduce our potential vacationers’ discretionary incomes, net worth or their consumerconfidence. Consequently, this may negatively affect demand for vacations, including cruise vacations, which area discretionary purchase. Decreases in demand could lead to price reductions which, in turn, could reduce theprofitability of our business. These ticket price reductions may result in a less affluent guest base, which alongwith decreases in discretionary income or consumer confidence could also result in lower onboard revenues thatcould also have a negative effect on our net revenue yields and profitability. Given the mobility of our ships, wecan mitigate some of this risk by redeploying our ships to more profitable regions if guests’ demand change andif economic or other conditions warrant.
• Increases in fuel prices may adversely affect our operations, financial condition and liquidity.
Economic, market and political conditions around the world, such as fuel demand, regulatory requirements,supply disruptions and related infrastructure needs, make it difficult to predict the future price and availability offuel. Fuel costs accounted for 20% and 21% of our cruise operating expenses in 2014 and 2013, respectively.Future increases in the global price of fuel would increase the cost of our cruise ship operations as well as someof our other expenses, such as crew travel, freight and commodity prices. Furthermore, volatility in fuel pricescould have a material adverse effect on our operations, financial condition and liquidity. We may be unable toimplement additional fuel conservation initiatives and other best practices or increase ticket prices and collectfuel supplements, which would help to fully or partially offset these fuel price increases. See risks relating toenvironmental laws and regulations, continuing financial viability of air service providers and failures to keeppace with technology below for additional information regarding our fuel risks.
To mitigate a portion of our economic risk attributable to potential fuel price increases, we have established afuel derivatives program. To date under this program, we have bought Brent crude oil (“Brent”) call options andsold Brent put options, collectively referred to as zero cost collars, that establish ceiling and floor prices. Thesederivatives are based on Brent prices whereas the actual fuel used on our ships is marine fuel. Changes in theBrent prices may not show a high degree of correlation with changes in our underlying marine fuel prices. Inaddition, there can be no assurance that our fuel derivatives program will provide a sufficient level of protectionagainst increases in fuel prices or that our counterparties will be able to perform, such as in the case of acounterparty bankruptcy. The zero cost collars will reduce the benefit we currently expect to obtain from lower2015 fuel prices since the current Brent prices are below the floor of our 2015 zero cost collars. Also, the fuelderivative contracts may create significant volatility in our U.S. GAAP earnings due to volatility in fuel pricesover the contracts’ terms. We may be able to mitigate a portion of the risk of fuel price increases by continuing toreduce our fuel consumption. Furthermore, we expect to have EGCSs installed on approximately 70% of ourfleet by the end of 2017. We expect these efforts should mitigate the impact of the 2015 ECA.
We believe that our land-based vacation competitors’ operating costs are less affected by fuel price increasesthan cruise companies. Accordingly, fuel price increases may adversely impact cruise companies more than theirland-based competitors.
• Incidents, the spread of contagious diseases and threats thereof, adverse weather conditions or other naturaldisasters and other incidents affecting the health, safety, security and satisfaction of guests and crew couldhave an adverse effect on our sales and profitability.
57

The operation of cruise ships, hotels, land tours, port and related commercial facilities and shore excursionsinvolve the risk of incidents, including those caused by the improper operation or maintenance of ships,motorcoaches and trains; guest and crew illnesses, such as from the spread of contagious diseases; mechanicalfailures, fires and collisions and the resulting costs incurred on emergency ship repairs; repair delays;groundings; navigational errors; oil spills and other maritime and environmental mishaps; missing passengersand other incidents at sea or while in port or on land, which may cause injury and death, guest and crewdiscomfort and the alteration of itineraries or cancellation of a cruise or series of cruises or tours. Although ouruncompromising commitment to the safety and comfort of our guests and crew is paramount to the success of ourbusiness, our ships have been involved in accidents and other incidents in the past. We may experience similar orother incidents in the future, even though we have and will implement policies, procedures and best practices tolimit their future occurrence. These types of incidents may bring into question guest and crew health, safety,security and satisfaction and may adversely affect our brands’ reputations and demand for our brands, andcruising in general, and may affect our sales and profitability, may result in additional costs to our business,litigation against us and increasing government or other regulatory oversight.
In particular, our ability to effectively and efficiently operate shipboard and shoreside activities may be impactedby widespread public health issues/illnesses or health warnings resulting in, among other things, reduced demandfor cruises and cruise cancellations and employee absenteeism that could have an adverse effect on our sales andprofitability. We have, and will continue to, implement itinerary changes, crew training, guest and crewscreening, ship cleaning and medical protocols to limit the introduction and spread of contagious diseases, butsuch actions may not be sufficient to fully mitigate this risk. For example, a severe outbreak of the influenzavirus or some other pandemic could, among other things, disrupt our ability to embark/disembark passengers andcrew, disrupt air travel to and from ports, increase costs for prevention and treatment and adversely affect oursupply chain. This could also adversely impact cruise demand in areas unaffected by such an outbreak.
In addition, as mentioned above, our ships are subject to the risks of mechanical failures and accidents, for whichwe have had to incur repair and equipment replacement expenditures. If these occur in the future, we may beunable to procure spare parts or new equipment when needed or make repairs without incurring significantexpenditures or suspension of service. However, we do maintain certain strategic spare parts on our ships to helpmitigate this risk. A significant performance deficiency or problem on any one or more of our ships could havean adverse effect on our financial condition and results of operations.
Our cruise ships, hotels, land tours, port and related commercial facilities, shore excursions and other serviceproviders may be impacted by adverse weather patterns or other natural disasters, such as hurricanes,earthquakes, floods, fires, tornados, tsunamis, typhoons and volcanic eruptions. These events could result in,among other things, increased port related and other costs. It is possible that we could be forced to alteritineraries or cancel a cruise or a series of cruises or tours due to these or other factors, which would have anadverse effect on our sales and profitability.
The frequency of extreme weather events such as hurricanes and floods, which may be caused by climate change,may not only cause disruption, alteration, or cancellation of cruises but may also adversely impact commercialairline flights, other transport and shore excursion activities or prevent our guests from electing to cruisealtogether. Such extreme weather events may also disrupt the supply of provisions, fuel and shore power, andmay limit our ability to safely embark and disembark our guests. In addition, these extreme weather conditionscould result in increased wave and wind activity, which would make it more challenging to sail and dock ourships and could cause sea/motion sickness among guests and crew. These events could have an adverse impacton the safety and satisfaction of cruising and could have an adverse impact on our sales and profitability.Additionally, these extreme weather conditions could cause property damage to our ships, port and relatedcommercial and business facilities and other assets and impact our ability to provide our cruise products andservices as well as to obtain insurance coverage for operations in such areas at reasonable rates.
Furthermore, some of the same factors that impact our guests’ decisions to cruise with us may also impact ourability to employ qualified crew.
• The international political climate, armed conflicts, terrorist and pirate attacks, vessel seizures, and threatsthereof, and other world events affecting the safety and security of travel could adversely affect the demandfor cruises and could harm our sales and profitability.
Demand for cruises and other vacation options has been and is expected to continue to be affected by the public’sattitude towards the safety and security of travel. Factors including, but not limited to, past acts of terrorism,
58
Stra
tegi
cR
epor
t
threats of additional terrorist attacks, drug-related violence in Mexico, pirate attacks and vessel seizures off theeast and west coasts of Africa, national government travel advisories, political instability in North Africa, theMiddle East, the Baltics and elsewhere, geopolitical issues between China and Japan and general concerns overthe safety and security aspects of traveling have had a significant adverse impact on demand and pricing in thetravel and vacation industry in the past and may have an adverse impact in the future. Decreases in demand maylead to price reductions, which in turn would reduce our profitability. These types of events could also impact ourability to source qualified crew from throughout the world at competitive costs and, therefore, increase ourshipboard crew costs. We have implemented various safety and security policies and procedures to help mitigatethis risk, but it is still possible that they could occur.
• Negative publicity concerning the cruise industry in general or us in particular, including any adverseenvironmental impacts of cruising, could impact the demand for cruises, affect our reputation and harm oursales and profitability.
Incidents involving cruise ships, in particular our cruise ships, and media coverage thereof, as well as adversemedia publicity concerning the cruise vacation industry in general, or unusual weather patterns or other naturaldisasters or disruptions, such as hurricanes and earthquakes, could impact demand for our cruises. In addition,any events which impact the travel industry more generally may negatively impact guests’ ability or desire totravel to or from our ships or interrupt our ability to obtain services and goods from key vendors in our supplychain. Any of the foregoing could have an adverse impact on our result of operations and on the cruise industry’sperformance.
Maintaining a good reputation is critical to our business. Reports and media coverage of ship incidents at sea orwhile in port, including missing guests, improper conduct by our employees, guests or agents, crimes, dissatisfiedguests, crew and guest illnesses, such as incidents of stomach flu, parasitic outbreaks or other contagiousdiseases, security breaches, terrorist threats and attacks and other adverse events can result in negative publicity,which could lead to a negative perception regarding the safety of our ships and the satisfaction of our guests. Inaddition, negative publicity regarding adverse environmental impacts of cruising, such as climate change and oilspills, could diminish our reputation. The considerable expansion in the use of social media over recent years hasincreased the ways in which our reputation can be impacted, and the speed with which it can occur. Anything thatdamages our reputation, whether or not justified, could have an adverse impact on demand, which could lead toprice reductions and a reduction in our sales and profitability. We utilize the reach and impact of digitalmarketing and social media, such as Facebook, Twitter, YouTube, Blog, Google+, Flickr, Instagram andPinterest to provide accurate information to the media, popular bloggers, fans and brand advocates to mitigatesome of the risk of negative publicity.
• Geographic regions in which we try to expand our business may be slow to develop and ultimately notdevelop how we expect, thus resulting in the slower growth and profitability of our business.
As we expand our global presence in emerging markets, such as Asia, it requires, among other things, significantlevels of investments. We may not recover our investments in these markets, and we cannot be certain that thesemarkets will ultimately develop as we expect. Accordingly, our business expansion may not produce the returnsthat we had expected, which could adversely impact the growth and profitability of our business. We partiallymitigate this risk by targeting specific guest segments and develop various demand creating initiatives for ourbrands in these geographic segments.
• Changes in and compliance with environmental laws and regulations could adversely affect our operationsand thus impact our profitability.
Some environmental groups have lobbied for more stringent regulation of cruise ships. Some groups have alsogenerated negative publicity about the cruise business and its environmental impact. Various agencies andregulatory organizations have enacted or are considering new regulations or policies, such as stricter emissionlimits to reduce GHG effects, which could adversely impact the cruise industry.
The IMO has amended the MARPOL regulations to reduce emissions from ships. As described in “MaritimeEnvironmental Regulations” as referenced below, these changes will result in reductions in ship SOx emissionsby requiring progressive reductions in the sulphur content in fuel or the use of abatement technologies. Theselimits will be further reduced in designated ECAs, including ECAs that have been or could be proposed in otherprime cruising areas, such as around Australia, Hong Kong, Japan, the Mediterranean Sea and Mexico. As a
59

result of these amendments, we have elected to install EGCSs on certain of our ships, which we believe willenable our SOx emissions to meet the MARPOL current and probable future requirements without the use of lowsulphur fuel, in all material respects. However, if this type of technology is not widely used within the shippingindustry it is possible that there could be limited availability of high sulphur fuels because of low demand and thecost of such fuel may increase. The increase in fuel prices caused by these regulations may impact our otherexpenses including, but not limited to, crew travel, freight and commodity prices and may have an adverseimpact on our profitability.
From time to time initiatives to limit GHG emissions are introduced around the world. For example, numerousbills related to climate change have been introduced in the U.S. Congress, which could adversely impact ourbusiness. While not all are likely to become law, there are indications that additional climate change relatedmandates could be forthcoming, and they may significantly impact our costs, including, among other things,increasing fuel prices, including new taxes on bunker fuel, establishment of costly emissions trading schemes andincreasing newbuild and operational costs.
Environmental laws and regulations or liabilities arising from past or future releases of, or exposure to, hazardoussubstances or vessel discharges, including ballast water and waste disposal, could materially increase our cost ofcompliance or otherwise adversely affect our business, results of operations and financial condition. See Item 2.Business. C. “Our Global Cruise Business-Governmental Regulations – Maritime Regulations” for additionalinformation regarding these risks.
• Changes in and compliance with income tax laws and regulations and income tax treaties may adverselyaffect the taxation of our shipping income and our profitability.
We believe that substantially all of the income earned by Carnival Corporation, Carnival plc and their shipowning or operating subsidiaries qualifies for taxation based on ship tonnage and are exempt from taxation or areotherwise subject to minimal taxes in the jurisdictions where the entities are incorporated or do business.
We believe that Panama and the jurisdictions where the ship owning and operating subsidiaries of CarnivalCorporation are formed are equivalent exemption jurisdictions for purposes of Section 883 of the InternalRevenue Code. The laws of Panama and the other jurisdictions where our ships are owned or operated are subjectto change and, in the future, may no longer qualify as equivalent exemption jurisdictions.
The IRS interpretation of Section 883 could differ materially from ours. In addition, provisions of the InternalRevenue Code, including Section 883, are subject to legislative change at any time. Moreover, changes couldoccur in the future with respect to the trading volume or trading frequency of Carnival Corporation shares.Accordingly, it is possible that Carnival Corporation and its ship-owning or operating subsidiaries whose taxexemption is based on Section 883 could lose this exemption.
There is no authority that directly addresses the effect, if any, of a DLC arrangement on the availability ofbenefits under treaties and, accordingly, their application to our operations is not free from doubt. The applicabletreaties may be revoked by either applicable country, replaced or modified with new agreements that treatincome from international operation of ships differently than the agreements currently in force or may beinterpreted by one of its countries differently from us.
If we did not qualify for tonnage tax, exemption, treaties or minimal taxes, or if the laws that provide for thesetax systems were changed, we would have significantly higher income tax expense. In many jurisdictions, thebenefit of tonnage tax or preferential tax regimes would be replaced with taxation at normal statutory rates. In theabsence of Section 883 or an applicable income tax treaty in the U.S., we would be subject to the net income andbranch profits tax regimes of Section 882 and Section 884 of the Internal Revenue Code. In combination, theseprovisions would result in the taxation of our U.S. source shipping income, net of applicable deductions, at acurrent federal corporate income tax rate of up to 35%, state income tax rates would vary and our net after-taxincome would be potentially subject to a further branch profits tax of 30%.
We are subject to the continual examination of our income tax returns by tax authorities in the jurisdictionswhere we operate. There can be no assurance that the outcome from these examinations will not adversely affectour net income.
As budgetary constraints continue to adversely impact the jurisdictions in which we operate, or for other reasons,increases in income or other taxes affecting our operations may be imposed. Some social activist groups havelobbied for more taxation on income generated by cruise companies. Certain groups have also generated negative
60
Stra
tegi
cR
epor
t
publicity for us. In recent years, certain members of the U.S. Congress have proposed various forms oflegislation that would result in higher taxation on income generated by cruise companies. We continue to monitorglobal administrative, legislative and judicial tax related developments and evaluate a variety of possible coursesof action based upon such developments. However, there is no assurance that such actions, if taken, willsuccessfully mitigate any adverse income tax consequences.
• Lack of continuing availability of attractive, convenient and safe port destinations on terms that arefavourable or consistent with our expectations could adversely affect our net revenue yields and net income.
We believe that attractive, convenient and safe port destinations, including ports that are not overly congestedwith tourists, are major reasons why our guests choose a cruise versus an alternative vacation option. Thecontinuing availability of these types of ports on terms that are favourable or consistent with our expectations,including the port facilities where our guests embark and disembark, is affected by a number of factors including,but not limited to, existing capacity constraints (particularly during the Caribbean winter months andMediterranean summer months), security, safety and environmental concerns, adverse weather conditions andother natural disasters, financial and other limitations on port development in established or emerging markets,political instability, exclusivity arrangements that ports may have with our competitors, port operatorconsolidation, local governmental regulations and local community concerns about both port development andother adverse impacts on their communities from additional tourists. We work with port authorities and others toeducate them on the benefits derived from cruising as well as taking actions to address their concerns in order tohelp mitigate this risk. The inability to continue to utilize, maintain, rebuild, if necessary, and increase thenumber of ports that our ships call on could adversely affect our net revenue yields and net income.
• Continuing financial viability of our travel agent distribution system, air service providers and other keyvendors in our supply chain is essential to allowing us to profitably operate our business. In addition,reductions in the availability of, and increases in the prices for, the services and products provided by thesevendors can adversely impact our net income.
Primarily all of our guests book their cruises through independent travel agents, including wholesalers, generalsales agents and tour operators. These parties generally sell and market our cruises on a nonexclusive basis. Ourcompetitors may offer higher commissions and incentives and thus adversely impact our business. Significantdisruptions, contractions or consolidations to our travel agent distribution system, such as those caused by areduction in travel and related commission income as a result of an economic slowdown could have an adverseeffect on our sales and profitability. In addition, we currently extend credit to certain of our larger Europeantravel agents and tour operators and, accordingly, if such agents and operators cannot repay their debts to us, itwill adversely impact our cash flows and operations. However, we have entered into agreements with certain ofour larger European travel agents and tour operators in order to help mitigate this risk.
Many of our guests and substantially all our crew depend on scheduled or chartered commercial airline servicesto transport them to or from the airports near the ports where our cruises embark and disembark. Changes ordisruptions in commercial or chartered airline services as a result of strikes, labour unrest, financial instability orviability, adverse weather conditions, airport delays, consolidation of carriers, or other events or the lack ofavailability due to schedule changes or a high level of airline bookings could adversely affect our ability todeliver guests and crew to or from our cruise ships and increase our costs which would, in turn, have an adverseeffect on our results of operations. In addition, increases in the prices of airfares due to, among other things,rising fuel prices and airline consolidations would increase the overall vacation price to our guests and mayadversely affect demand for our cruises, as well as increase our airfare for our crew.
Travel agents may face increased pressure from our competitors, particularly in the North America market, to selland market these competitor cruises exclusively. If such exclusive arrangements were introduced, there can be noassurance that we will be able to find alternative distribution channels to ensure our customer base would not beaffected.
Economic downturns may impact the financial viability of other key vendors in our supply chain and theinterruption in the services or goods we purchase from them could adversely impact our operations andprofitability.
• Disruptions and other damages to our information technology and other networks and operations, andbreaches in data security could result in decreases in our net income.
61
Our ability to increase revenues and control costs, as well as our ability to serve guests most effectively dependsin part on the reliability of our sophisticated technologies and system networks. We use communicationapplications, information technology and other systems to manage our inventory of cabins held for sale and setpricing in order to maximize our revenue yields and to optimize the effectiveness and efficiency of our shoresideand shipboard operations. Gaining unauthorized access to digital systems and networks for purposes ofmisappropriating assets or sensitive financial, medical or other personal or business information, corrupting data,causing shoreside or shipboard operational disruptions and other cyber-related risks could adversely impact ourguest services and satisfaction, employee relationships, business plans, ship safety and our reputation. Globalcompanies are repeatedly being targeted to gain access to critical company, guest and other information. Inaddition, the operation and maintenance of our systems is in some cases dependent on third-party technologiesand service providers for which there is no certainty of uninterrupted availability or through which hackers couldgain access to sensitive information. These potential disruptions and cyber attacks could negatively affect costs,customer demand, system availability and pricing for our cruises. Carnival Corporation & plc help to mitigate theeffect of a cyber event by implementing and maintaining security controls to protect our corporate applications,network and company and customer data by focusing on protection, identification and recovery. Carnival alsocontinually reviews its security environment to address new security concerns that may impact our critical data.
Our principal offices are located in Australia, Germany, Italy, the UK and the U.S. Although we have developeddisaster recovery and similar business contingency plans, actual or threatened natural disasters (for example,hurricanes, earthquakes, floods, fires, tornados, tsunamis, typhoons and volcanic eruptions) or similar events inthese locations may have a material impact on our business continuity, reputation and results of operations.
• Overcapacity in the cruise ship and land-based vacation industry could have a negative impact on our netrevenue yields and increase operating costs.
Although cruising capacity in most of the established markets has grown at a slower pace in recent years, weexpect it to continue to increase in both the established and emerging markets. Since the cruise industry relies onlong-lived ships, we face the risk that our industry’s capacity will grow beyond its demand. The wider vacationindustry may also face increases in land-based vacation capacity, which may impact us as well. We typically aimto fill our new capacity at favourable revenue yields despite the new competing cruise and land-based capacitygrowth. Also, to the extent that we or our competitors deploy ships to a particular itinerary and the resultingcapacity in that region exceeds the demand, we may lower pricing and profitability may be lower than initiallyanticipated. Should net revenue yields be negatively impacted, our results of operations and financial conditioncould be adversely affected. In addition, increased cruise capacity could impact our ability to retain and attractqualified crew, including officers, at competitive rates and, therefore, increase our shipboard employee costs. Topartially mitigate this risk, we strategically time the introduction of new ships into our brands to allow ampletime to further grow their guest base and absorb our new capacity.
• Our decisions to self-insure against various risks or the inability to obtain insurance for certain risks atreasonable rates could result in higher expenses or lower revenues.
We seek to maintain comprehensive insurance coverage at commercially reasonable rates. We believe that ourcurrent coverage is adequate to protect us against most of the significant risks involved in the conduct of ourbusiness, although we do elect to self-insure or use higher deductibles for substantially all the insurable risks weface in order to minimize the cost of our insurance policies. Accordingly, we are not protected against all risks,such as loss of use of a ship, which could result in an unexpected decrease in our revenue in the event of anincident. We attempt to mitigate our risks that are not covered by insurance, although we cannot be certain suchprocesses and procedures will be successful. Further, significant incidents could result in higher insurancepremiums commencing on the policy renewal dates or the inability to obtain coverage.
We may also be subject to additional premium costs based not only on our own claims record but also on theclaims records of all other members of the P&I associations that we receive indemnity coverage for tort liability.We are also subject to additional P&I premium assessments for various reasons including, but not limited to,investment or underwriting shortfalls experienced by our P&I clubs. In addition, if we or other ship-ownerssustain significant losses, our ability to obtain future insurance coverage at commercially reasonable rates couldbe materially adversely affected.
Finally, we cannot be certain that affordable and viable direct insurance and reinsurance markets will beavailable to us in the future.
• Fluctuations in foreign currency exchange rates could adversely affect our financial results.
62
Stra
tegi
cR
epor
t
We earn revenues, pay expenses, purchase and own assets and incur liabilities in currencies other than the U.S.dollar; most significantly, the euro, sterling and Australian dollars. We derived 57%, 56% and 54% of ourrevenues from guests sourced from outside of the U.S. in 2014, 2013 and 2012, respectively. Because ourconsolidated financial statements are presented in U.S. dollars, we must translate revenues and expenses, as wellas assets and liabilities, into U.S. dollars at exchange rates in effect during or at the end of each reporting period.We report currency transactions in the functional currencies of our reporting units, excluding fuel which isalways transacted and reported in U.S. dollars regardless of the functional currency of the reporting unit.Furthermore, we convert a significant amount of these currencies into U.S. dollar. Therefore, the strengthening ofthe U.S. dollar against our other major currencies. will adversely affect our U.S. dollar financial results and willreduce the U.S. dollar amount received upon conversion of these currencies into U.S. dollars. We partiallymitigate some of our currency exchange rate risk by netting certain exposures to take advantage of any naturaloffsets and, when considered appropriate, through the use of derivative and nonderivative financial instruments,such as foreign currency forwards, options and swaps, foreign currency debt obligations and foreign currencycash balances.
Cautionary Note Concerning Factors That May Affect Future Results
Some of the statements, estimates or projections contained within this Strategic Report are “forward-lookingstatements” that involve risks, uncertainties and assumptions with respect to us, including some statementsconcerning future results, outlooks, plans, goals and other events which have not yet occurred. All statementsother than statements of historical facts are statements that could be deemed forward-looking statements. Thesestatements are based on current expectations, estimates, forecasts and projections about our business and theindustry in which we operate and the beliefs and assumptions of our management. We have tried, wheneverpossible, to identify these statements by using words like “will,” “may,” “could,” “should,” “would,” “believe,”“depends,” “expect,” “goal,” “anticipate,” “forecast,” “project,” “future,” “intend,” “plan,” “estimate,” “target,”“indicate” and similar expressions of future intent or the negative of such terms.
Forward-looking statements include those statements that may impact, among other things, the forecasting of ournon-GAAP earnings per share; net revenue yields; booking levels; pricing; occupancy; operating, financing andtax costs, including fuel expenses; net cruise costs per available lower berth day; estimates of ship depreciablelives and residual values; liquidity; goodwill, ship and trademark fair values and outlook.
Certain of the risks we are exposed to are identified within this Strategic Report. This Strategic Report containsimportant cautionary statements and a discussion of the known factors that we consider could materially affectthe accuracy of our forward-looking statements and adversely affect our business, results of operations andfinancial position. It is not possible to predict or identify all such risks. There may be additional risks that weconsider immaterial or which are not known.
Forward-looking statements should not be relied upon as a prediction of actual results. Subject to any continuingobligations under applicable law or any relevant stock exchange rules, we expressly disclaim any obligation todisseminate, after the date of this Strategic Report, any updates or revisions to any such forward-lookingstatements to reflect any change in expectations or events, conditions or circumstances on which any suchstatements are based.
5. Repurchase Authorizations and Stock Swap Programs.
A. Repurchase Authorizations
Our Boards of Directors have authorized, subject to certain restrictions, the repurchase of up to an aggregate of$1 billion of Carnival Corporation common stock and/or Carnival plc ordinary shares (the “RepurchaseProgram”). The Repurchase Program does not have an expiration date and may be discontinued by our Boards ofDirectors at any time. During the year ended November 30, 2014, there were no repurchases of CarnivalCorporation common stock or Carnival plc ordinary shares under the Repurchase Program. Since March 2013,the remaining availability under the Repurchase Program has been $975 million.
In addition to the Repurchase Program, the Boards of Directors authorized, in October 2008, the repurchase of upto 19.2 million Carnival plc ordinary shares and, in January 2013, the repurchase of up to 32.8 million shares ofCarnival Corporation common stock under the Stock Swap programs described below. At February 20, 2015, theremaining availability under the Stock Swap programs was 18.1 million Carnival plc ordinary shares and32.0 million shares of Carnival Corporation common stock.
63
Carnival plc ordinary share repurchases under both the Repurchase Program and the Stock Swap programsrequire annual shareholder approval. The existing shareholder approval is limited to a maximum of 21.5 millionordinary shares and is valid until the earlier of the conclusion of the Carnival plc 2015 annual general meeting orOctober 16, 2015. Depending on market conditions and other factors, we may repurchase shares of CarnivalCorporation common stock and/or Carnival plc ordinary shares under the Repurchase Program and the StockSwap programs concurrently.
B. Stock Swap Programs
We use the Stock Swap programs in situations where we can obtain an economic benefit because either CarnivalCorporation common stock or Carnival plc ordinary shares are trading at a price that is at a premium or discountto the price of Carnival plc ordinary shares or Carnival Corporation common stock, as the case may be. Anyrealized economic benefit under the Stock Swap programs is used for general corporate purposes, which couldinclude repurchasing additional stock under the Repurchase Program.
In the event Carnival Corporation common stock trades at a premium to Carnival plc ordinary shares, we mayelect to issue and sell shares of Carnival Corporation common stock through a sales agent, from time to time atprevailing market prices in ordinary brokers’ transactions, and use the sale proceeds to repurchase Carnival plcordinary shares in the UK market on at least an equivalent basis. Based on an authorization provided by the boardof directors in October 2008, Carnival Corporation was authorized to issue and sell up to 19.2 million shares ofits common stock in the U.S. market and had 18.1 million shares remaining at February 20, 2015. Any sales ofCarnival Corporation shares have been or will be registered under the Securities Act.
In the event Carnival Corporation common stock trades at a discount to Carnival plc ordinary shares, we mayelect to sell existing ordinary shares of Carnival plc, with such sales made by Carnival Corporation or CarnivalInvestments Limited through a sales agent, from time to time at prevailing market prices in ordinary brokers’transactions, and use the sale proceeds to repurchase shares of Carnival Corporation common stock in the U.S.market on at least an equivalent basis. Based on an authorization provided by the board of directors in January2013, Carnival Corporation or Carnival Investments Limited was authorized to sell up to 32.8 million Carnivalplc ordinary shares in the UK market and had 32.0 million shares remaining at February 20, 2015. Any sales ofCarnival plc ordinary shares have been or will be registered under the Securities Act.
This Strategic Report, as set out on pages 2 to 64, has been approved by the Board.
By order of the Board
Micky ArisonChairman of the Board of DirectorsFebruary 20, 2015
64
Stra
tegi
cR
epor
t

INTRODUCTORY NOTE TO THE CARNIVAL PLC IFRS FINANCIAL STATEMENTSFOR THE YEAR ENDED NOVEMBER 30, 2014
The Carnival plc consolidated IFRS Financial Statements on pages 66 to 110, which are required to satisfyreporting requirements of the Companies Act 2006, incorporate the results of Carnival plc and its subsidiariesand, accordingly, do not include the IFRS consolidated results and financial position of Carnival Corporationand its subsidiaries.
However, the Directors consider that, within the Carnival Corporation and Carnival plc dual listed companyarrangement, the most appropriate presentation of Carnival plc’s results and financial position is by referenceto the Carnival Corporation & plc U.S. GAAP consolidated financial statements (“DLC FinancialStatements”), which are included in Annex 1, but do not form part of these Carnival plc financial statements.
65
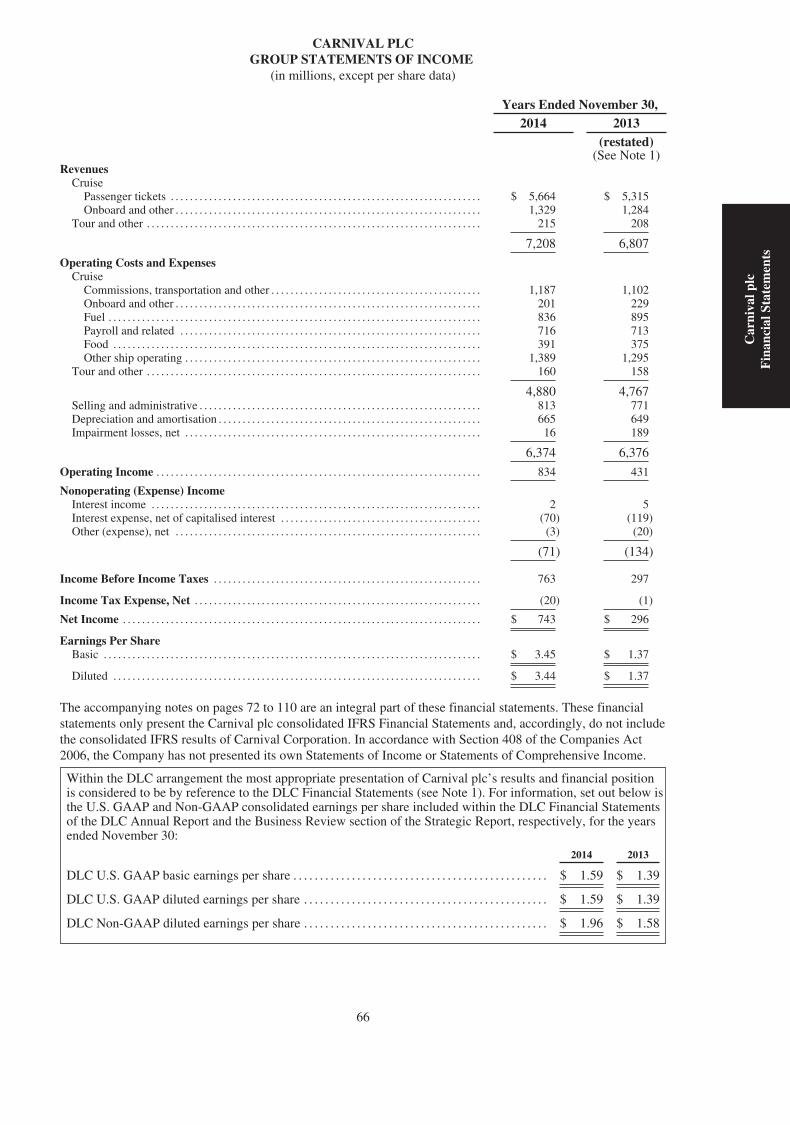
CARNIVAL PLCGROUP STATEMENTS OF INCOME
(in millions, except per share data)
Years Ended November 30,2014 2013
(restated)(See Note 1)
RevenuesCruise
Passenger tickets . . . . . . . . . . . . . . . . . . . . . . . . . . . . . . . . . . . . . . . . . . . . . . . . . . . . . . . . . . . . . . . . . $ 5,664 $ 5,315Onboard and other . . . . . . . . . . . . . . . . . . . . . . . . . . . . . . . . . . . . . . . . . . . . . . . . . . . . . . . . . . . . . . . . 1,329 1,284
Tour and other . . . . . . . . . . . . . . . . . . . . . . . . . . . . . . . . . . . . . . . . . . . . . . . . . . . . . . . . . . . . . . . . . . . . . . 215 208
7,208 6,807
Operating Costs and ExpensesCruise
Commissions, transportation and other . . . . . . . . . . . . . . . . . . . . . . . . . . . . . . . . . . . . . . . . . . . . 1,187 1,102Onboard and other . . . . . . . . . . . . . . . . . . . . . . . . . . . . . . . . . . . . . . . . . . . . . . . . . . . . . . . . . . . . . . . . 201 229Fuel . . . . . . . . . . . . . . . . . . . . . . . . . . . . . . . . . . . . . . . . . . . . . . . . . . . . . . . . . . . . . . . . . . . . . . . . . . . . . . 836 895Payroll and related . . . . . . . . . . . . . . . . . . . . . . . . . . . . . . . . . . . . . . . . . . . . . . . . . . . . . . . . . . . . . . . 716 713Food . . . . . . . . . . . . . . . . . . . . . . . . . . . . . . . . . . . . . . . . . . . . . . . . . . . . . . . . . . . . . . . . . . . . . . . . . . . . . 391 375Other ship operating . . . . . . . . . . . . . . . . . . . . . . . . . . . . . . . . . . . . . . . . . . . . . . . . . . . . . . . . . . . . . . 1,389 1,295
Tour and other . . . . . . . . . . . . . . . . . . . . . . . . . . . . . . . . . . . . . . . . . . . . . . . . . . . . . . . . . . . . . . . . . . . . . . 160 158
4,880 4,767Selling and administrative . . . . . . . . . . . . . . . . . . . . . . . . . . . . . . . . . . . . . . . . . . . . . . . . . . . . . . . . . . . 813 771Depreciation and amortisation . . . . . . . . . . . . . . . . . . . . . . . . . . . . . . . . . . . . . . . . . . . . . . . . . . . . . . . 665 649Impairment losses, net . . . . . . . . . . . . . . . . . . . . . . . . . . . . . . . . . . . . . . . . . . . . . . . . . . . . . . . . . . . . . . 16 189
6,374 6,376
Operating Income . . . . . . . . . . . . . . . . . . . . . . . . . . . . . . . . . . . . . . . . . . . . . . . . . . . . . . . . . . . . . . . . . . . . 834 431
Nonoperating (Expense) IncomeInterest income . . . . . . . . . . . . . . . . . . . . . . . . . . . . . . . . . . . . . . . . . . . . . . . . . . . . . . . . . . . . . . . . . . . . . 2 5Interest expense, net of capitalised interest . . . . . . . . . . . . . . . . . . . . . . . . . . . . . . . . . . . . . . . . . . (70) (119)Other (expense), net . . . . . . . . . . . . . . . . . . . . . . . . . . . . . . . . . . . . . . . . . . . . . . . . . . . . . . . . . . . . . . . . (3) (20)
(71) (134)
Income Before Income Taxes . . . . . . . . . . . . . . . . . . . . . . . . . . . . . . . . . . . . . . . . . . . . . . . . . . . . . . . . 763 297
Income Tax Expense, Net . . . . . . . . . . . . . . . . . . . . . . . . . . . . . . . . . . . . . . . . . . . . . . . . . . . . . . . . . . . . (20) (1)
Net Income . . . . . . . . . . . . . . . . . . . . . . . . . . . . . . . . . . . . . . . . . . . . . . . . . . . . . . . . . . . . . . . . . . . . . . . . . . . $ 743 $ 296
Earnings Per ShareBasic . . . . . . . . . . . . . . . . . . . . . . . . . . . . . . . . . . . . . . . . . . . . . . . . . . . . . . . . . . . . . . . . . . . . . . . . . . . . . . . $ 3.45 $ 1.37
Diluted . . . . . . . . . . . . . . . . . . . . . . . . . . . . . . . . . . . . . . . . . . . . . . . . . . . . . . . . . . . . . . . . . . . . . . . . . . . . . $ 3.44 $ 1.37
The accompanying notes on pages 72 to 110 are an integral part of these financial statements. These financialstatements only present the Carnival plc consolidated IFRS Financial Statements and, accordingly, do not includethe consolidated IFRS results of Carnival Corporation. In accordance with Section 408 of the Companies Act2006, the Company has not presented its own Statements of Income or Statements of Comprehensive Income.
Within the DLC arrangement the most appropriate presentation of Carnival plc’s results and financial positionis considered to be by reference to the DLC Financial Statements (see Note 1). For information, set out below isthe U.S. GAAP and Non-GAAP consolidated earnings per share included within the DLC Financial Statementsof the DLC Annual Report and the Business Review section of the Strategic Report, respectively, for the yearsended November 30:
2014 2013
DLC U.S. GAAP basic earnings per share . . . . . . . . . . . . . . . . . . . . . . . . . . . . . . . . . . . . . . . . . . . . . . . . $ 1.59 $ 1.39
DLC U.S. GAAP diluted earnings per share . . . . . . . . . . . . . . . . . . . . . . . . . . . . . . . . . . . . . . . . . . . . . . $ 1.59 $ 1.39
DLC Non-GAAP diluted earnings per share . . . . . . . . . . . . . . . . . . . . . . . . . . . . . . . . . . . . . . . . . . . . . . $ 1.96 $ 1.58
66
Car
niva
lplc
Fin
anci
alSt
atem
ents

CARNIVAL PLCGROUP STATEMENTS OF COMPREHENSIVE INCOME
(in millions)
Years Ended November 30,2014 2013
(restated)
Net Income . . . . . . . . . . . . . . . . . . . . . . . . . . . . . . . . . . . . . . . . . . . . . . . . . . . . . . . . . . . . . . . . . . . . . . $ 743 $296
Other Comprehensive (Loss) IncomeItems that will not be reclassified through the Statements of Income
Actuarial gains (losses) on post-employment benefit obligations . . . . . . . . . . . . . 6 (2)
Items that may be reclassified through the Statements of IncomeChanges in foreign currency translation adjustment . . . . . . . . . . . . . . . . . . . . . . . . . . (712) 329Net gains (losses) on hedges of net investments in foreign operations . . . . . . . . . 25 (10)Net (losses) gains on cash flow derivative hedges . . . . . . . . . . . . . . . . . . . . . . . . . . . . (37) 1
(724) 320
Other Comprehensive (Loss) Income . . . . . . . . . . . . . . . . . . . . . . . . . . . . . . . . . . . . . . . . . . . (718) 318
Total Comprehensive Income . . . . . . . . . . . . . . . . . . . . . . . . . . . . . . . . . . . . . . . . . . . . . . . . . . . $ 25 $614
The accompanying notes on pages 72 to 110 are an integral part of these financial statements. These financialstatements only present the Carnival plc consolidated IFRS Financial Statements and, accordingly, do not includethe consolidated IFRS results of Carnival Corporation.
Within the DLC arrangement the most appropriate presentation of Carnival plc’s results and financial positionis considered to be by reference to the DLC Financial Statements (see Note 1).
67
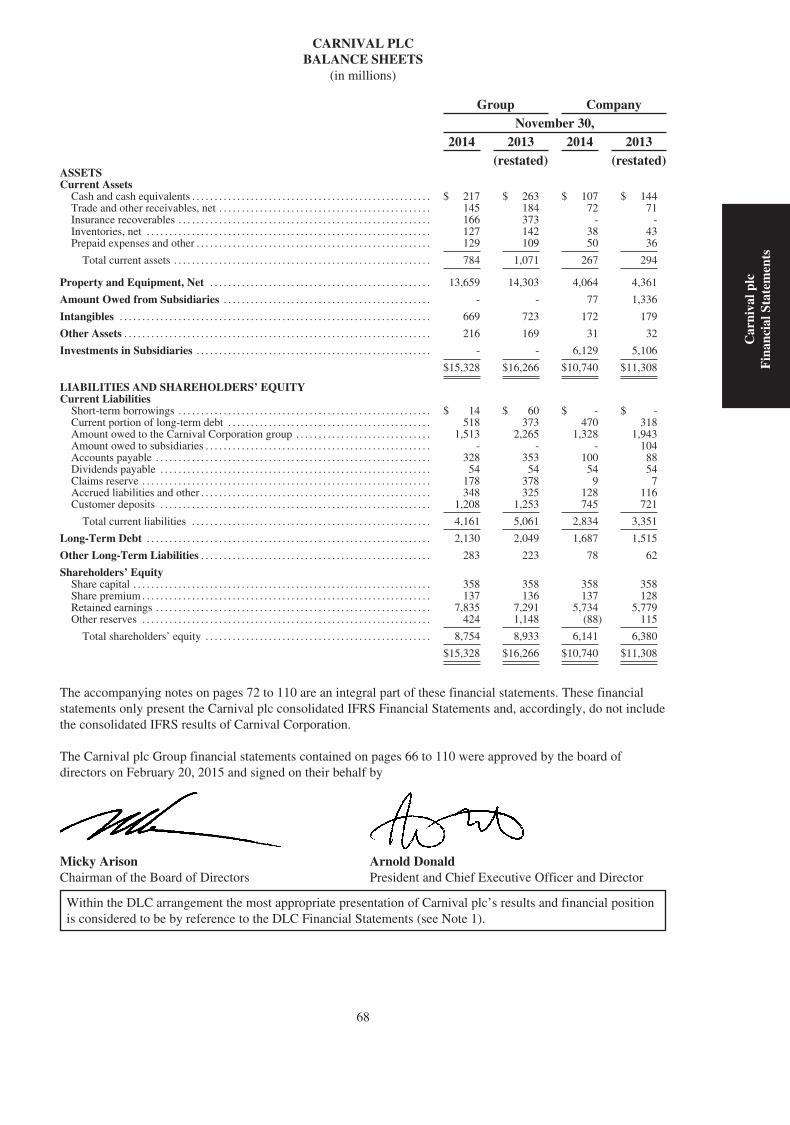
CARNIVAL PLCBALANCE SHEETS
(in millions)
Group CompanyNovember 30,
2014 2013 2014 2013(restated) (restated)
ASSETSCurrent Assets
Cash and cash equivalents . . . . . . . . . . . . . . . . . . . . . . . . . . . . . . . . . . . . . . . . . . . . . . . . . . . . . $ 217 $ 263 $ 107 $ 144Trade and other receivables, net . . . . . . . . . . . . . . . . . . . . . . . . . . . . . . . . . . . . . . . . . . . . . . . 145 184 72 71Insurance recoverables . . . . . . . . . . . . . . . . . . . . . . . . . . . . . . . . . . . . . . . . . . . . . . . . . . . . . . . . 166 373 - -Inventories, net . . . . . . . . . . . . . . . . . . . . . . . . . . . . . . . . . . . . . . . . . . . . . . . . . . . . . . . . . . . . . . . 127 142 38 43Prepaid expenses and other . . . . . . . . . . . . . . . . . . . . . . . . . . . . . . . . . . . . . . . . . . . . . . . . . . . . 129 109 50 36
Total current assets . . . . . . . . . . . . . . . . . . . . . . . . . . . . . . . . . . . . . . . . . . . . . . . . . . . . . . . . . 784 1,071 267 294
Property and Equipment, Net . . . . . . . . . . . . . . . . . . . . . . . . . . . . . . . . . . . . . . . . . . . . . . . . . 13,659 14,303 4,064 4,361
Amount Owed from Subsidiaries . . . . . . . . . . . . . . . . . . . . . . . . . . . . . . . . . . . . . . . . . . . . . . - - 77 1,336
Intangibles . . . . . . . . . . . . . . . . . . . . . . . . . . . . . . . . . . . . . . . . . . . . . . . . . . . . . . . . . . . . . . . . . . . . . 669 723 172 179
Other Assets . . . . . . . . . . . . . . . . . . . . . . . . . . . . . . . . . . . . . . . . . . . . . . . . . . . . . . . . . . . . . . . . . . . . 216 169 31 32
Investments in Subsidiaries . . . . . . . . . . . . . . . . . . . . . . . . . . . . . . . . . . . . . . . . . . . . . . . . . . . . - - 6,129 5,106
$15,328 $16,266 $10,740 $11,308
LIABILITIES AND SHAREHOLDERS’ EQUITYCurrent Liabilities
Short-term borrowings . . . . . . . . . . . . . . . . . . . . . . . . . . . . . . . . . . . . . . . . . . . . . . . . . . . . . . . . $ 14 $ 60 $ - $ -Current portion of long-term debt . . . . . . . . . . . . . . . . . . . . . . . . . . . . . . . . . . . . . . . . . . . . . 518 373 470 318Amount owed to the Carnival Corporation group . . . . . . . . . . . . . . . . . . . . . . . . . . . . . . 1,513 2,265 1,328 1,943Amount owed to subsidiaries . . . . . . . . . . . . . . . . . . . . . . . . . . . . . . . . . . . . . . . . . . . . . . . . . . - - - 104Accounts payable . . . . . . . . . . . . . . . . . . . . . . . . . . . . . . . . . . . . . . . . . . . . . . . . . . . . . . . . . . . . . 328 353 100 88Dividends payable . . . . . . . . . . . . . . . . . . . . . . . . . . . . . . . . . . . . . . . . . . . . . . . . . . . . . . . . . . . . 54 54 54 54Claims reserve . . . . . . . . . . . . . . . . . . . . . . . . . . . . . . . . . . . . . . . . . . . . . . . . . . . . . . . . . . . . . . . . 178 378 9 7Accrued liabilities and other . . . . . . . . . . . . . . . . . . . . . . . . . . . . . . . . . . . . . . . . . . . . . . . . . . . 348 325 128 116Customer deposits . . . . . . . . . . . . . . . . . . . . . . . . . . . . . . . . . . . . . . . . . . . . . . . . . . . . . . . . . . . . 1,208 1,253 745 721
Total current liabilities . . . . . . . . . . . . . . . . . . . . . . . . . . . . . . . . . . . . . . . . . . . . . . . . . . . . . 4,161 5,061 2,834 3,351
Long-Term Debt . . . . . . . . . . . . . . . . . . . . . . . . . . . . . . . . . . . . . . . . . . . . . . . . . . . . . . . . . . . . . . . 2,130 2,049 1,687 1,515
Other Long-Term Liabilities . . . . . . . . . . . . . . . . . . . . . . . . . . . . . . . . . . . . . . . . . . . . . . . . . . . 283 223 78 62
Shareholders’ EquityShare capital . . . . . . . . . . . . . . . . . . . . . . . . . . . . . . . . . . . . . . . . . . . . . . . . . . . . . . . . . . . . . . . . . . 358 358 358 358Share premium . . . . . . . . . . . . . . . . . . . . . . . . . . . . . . . . . . . . . . . . . . . . . . . . . . . . . . . . . . . . . . . . 137 136 137 128Retained earnings . . . . . . . . . . . . . . . . . . . . . . . . . . . . . . . . . . . . . . . . . . . . . . . . . . . . . . . . . . . . . 7,835 7,291 5,734 5,779Other reserves . . . . . . . . . . . . . . . . . . . . . . . . . . . . . . . . . . . . . . . . . . . . . . . . . . . . . . . . . . . . . . . . 424 1,148 (88) 115
Total shareholders’ equity . . . . . . . . . . . . . . . . . . . . . . . . . . . . . . . . . . . . . . . . . . . . . . . . . . 8,754 8,933 6,141 6,380
$15,328 $16,266 $10,740 $11,308
The accompanying notes on pages 72 to 110 are an integral part of these financial statements. These financialstatements only present the Carnival plc consolidated IFRS Financial Statements and, accordingly, do not includethe consolidated IFRS results of Carnival Corporation.
The Carnival plc Group financial statements contained on pages 66 to 110 were approved by the board ofdirectors on February 20, 2015 and signed on their behalf by
Micky Arison Arnold DonaldChairman of the Board of Directors President and Chief Executive Officer and Director
Within the DLC arrangement the most appropriate presentation of Carnival plc’s results and financial positionis considered to be by reference to the DLC Financial Statements (see Note 1).
68
Car
niva
lplc
Fin
anci
alSt
atem
ents
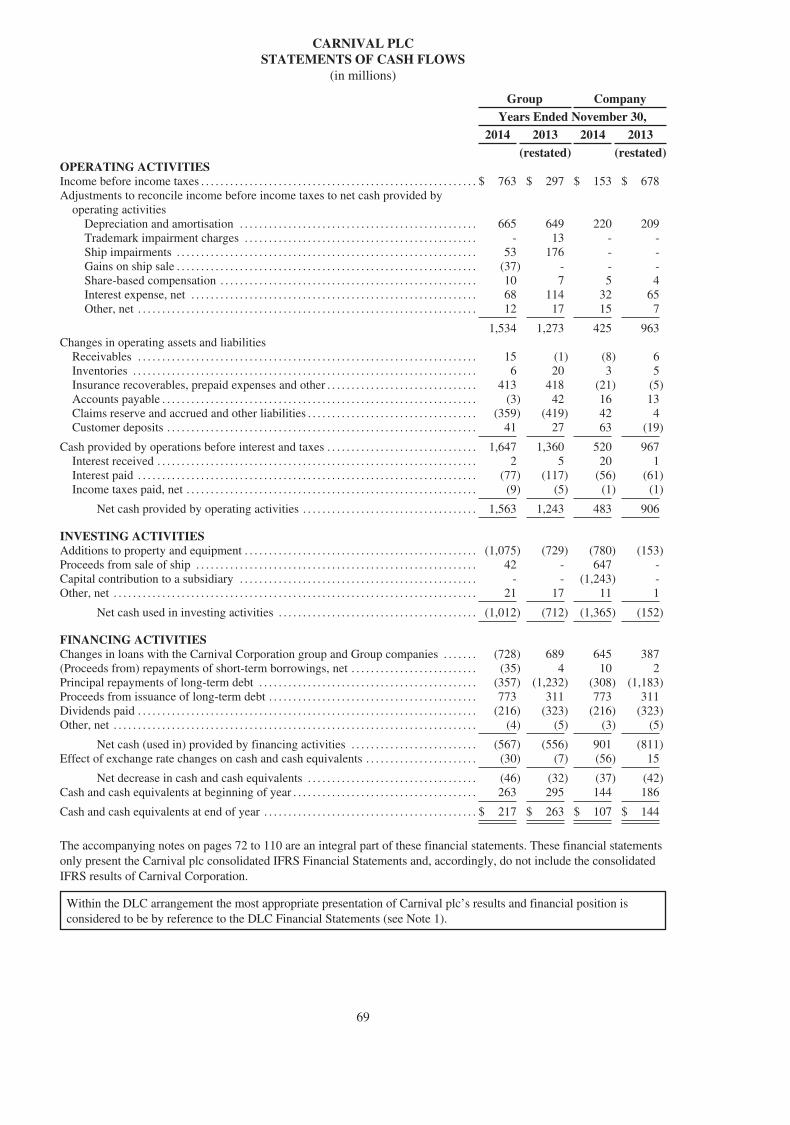
CARNIVAL PLCSTATEMENTS OF CASH FLOWS
(in millions)
Group CompanyYears Ended November 30,
2014 2013 2014 2013(restated) (restated)
OPERATING ACTIVITIESIncome before income taxes . . . . . . . . . . . . . . . . . . . . . . . . . . . . . . . . . . . . . . . . . . . . . . . . . . . . . . . . . $ 763 $ 297 $ 153 $ 678Adjustments to reconcile income before income taxes to net cash provided by
operating activitiesDepreciation and amortisation . . . . . . . . . . . . . . . . . . . . . . . . . . . . . . . . . . . . . . . . . . . . . . . . . 665 649 220 209Trademark impairment charges . . . . . . . . . . . . . . . . . . . . . . . . . . . . . . . . . . . . . . . . . . . . . . . . - 13 - -Ship impairments . . . . . . . . . . . . . . . . . . . . . . . . . . . . . . . . . . . . . . . . . . . . . . . . . . . . . . . . . . . . . . 53 176 - -Gains on ship sale . . . . . . . . . . . . . . . . . . . . . . . . . . . . . . . . . . . . . . . . . . . . . . . . . . . . . . . . . . . . . . (37) - - -Share-based compensation . . . . . . . . . . . . . . . . . . . . . . . . . . . . . . . . . . . . . . . . . . . . . . . . . . . . . 10 7 5 4Interest expense, net . . . . . . . . . . . . . . . . . . . . . . . . . . . . . . . . . . . . . . . . . . . . . . . . . . . . . . . . . . . 68 114 32 65Other, net . . . . . . . . . . . . . . . . . . . . . . . . . . . . . . . . . . . . . . . . . . . . . . . . . . . . . . . . . . . . . . . . . . . . . . 12 17 15 7
1,534 1,273 425 963Changes in operating assets and liabilities
Receivables . . . . . . . . . . . . . . . . . . . . . . . . . . . . . . . . . . . . . . . . . . . . . . . . . . . . . . . . . . . . . . . . . . . . . . 15 (1) (8) 6Inventories . . . . . . . . . . . . . . . . . . . . . . . . . . . . . . . . . . . . . . . . . . . . . . . . . . . . . . . . . . . . . . . . . . . . . . . 6 20 3 5Insurance recoverables, prepaid expenses and other . . . . . . . . . . . . . . . . . . . . . . . . . . . . . . . 413 418 (21) (5)Accounts payable . . . . . . . . . . . . . . . . . . . . . . . . . . . . . . . . . . . . . . . . . . . . . . . . . . . . . . . . . . . . . . . . . (3) 42 16 13Claims reserve and accrued and other liabilities . . . . . . . . . . . . . . . . . . . . . . . . . . . . . . . . . . . (359) (419) 42 4Customer deposits . . . . . . . . . . . . . . . . . . . . . . . . . . . . . . . . . . . . . . . . . . . . . . . . . . . . . . . . . . . . . . . . 41 27 63 (19)
Cash provided by operations before interest and taxes . . . . . . . . . . . . . . . . . . . . . . . . . . . . . . . 1,647 1,360 520 967Interest received . . . . . . . . . . . . . . . . . . . . . . . . . . . . . . . . . . . . . . . . . . . . . . . . . . . . . . . . . . . . . . . . . . 2 5 20 1Interest paid . . . . . . . . . . . . . . . . . . . . . . . . . . . . . . . . . . . . . . . . . . . . . . . . . . . . . . . . . . . . . . . . . . . . . . (77) (117) (56) (61)Income taxes paid, net . . . . . . . . . . . . . . . . . . . . . . . . . . . . . . . . . . . . . . . . . . . . . . . . . . . . . . . . . . . . (9) (5) (1) (1)
Net cash provided by operating activities . . . . . . . . . . . . . . . . . . . . . . . . . . . . . . . . . . . . 1,563 1,243 483 906
INVESTING ACTIVITIESAdditions to property and equipment . . . . . . . . . . . . . . . . . . . . . . . . . . . . . . . . . . . . . . . . . . . . . . . . (1,075) (729) (780) (153)Proceeds from sale of ship . . . . . . . . . . . . . . . . . . . . . . . . . . . . . . . . . . . . . . . . . . . . . . . . . . . . . . . . . . 42 - 647 -Capital contribution to a subsidiary . . . . . . . . . . . . . . . . . . . . . . . . . . . . . . . . . . . . . . . . . . . . . . . . . - - (1,243) -Other, net . . . . . . . . . . . . . . . . . . . . . . . . . . . . . . . . . . . . . . . . . . . . . . . . . . . . . . . . . . . . . . . . . . . . . . . . . . . 21 17 11 1
Net cash used in investing activities . . . . . . . . . . . . . . . . . . . . . . . . . . . . . . . . . . . . . . . . . (1,012) (712) (1,365) (152)
FINANCING ACTIVITIESChanges in loans with the Carnival Corporation group and Group companies . . . . . . . (728) 689 645 387(Proceeds from) repayments of short-term borrowings, net . . . . . . . . . . . . . . . . . . . . . . . . . . (35) 4 10 2Principal repayments of long-term debt . . . . . . . . . . . . . . . . . . . . . . . . . . . . . . . . . . . . . . . . . . . . . (357) (1,232) (308) (1,183)Proceeds from issuance of long-term debt . . . . . . . . . . . . . . . . . . . . . . . . . . . . . . . . . . . . . . . . . . . 773 311 773 311Dividends paid . . . . . . . . . . . . . . . . . . . . . . . . . . . . . . . . . . . . . . . . . . . . . . . . . . . . . . . . . . . . . . . . . . . . . . (216) (323) (216) (323)Other, net . . . . . . . . . . . . . . . . . . . . . . . . . . . . . . . . . . . . . . . . . . . . . . . . . . . . . . . . . . . . . . . . . . . . . . . . . . . (4) (5) (3) (5)
Net cash (used in) provided by financing activities . . . . . . . . . . . . . . . . . . . . . . . . . . (567) (556) 901 (811)Effect of exchange rate changes on cash and cash equivalents . . . . . . . . . . . . . . . . . . . . . . . (30) (7) (56) 15
Net decrease in cash and cash equivalents . . . . . . . . . . . . . . . . . . . . . . . . . . . . . . . . . . . (46) (32) (37) (42)Cash and cash equivalents at beginning of year . . . . . . . . . . . . . . . . . . . . . . . . . . . . . . . . . . . . . . 263 295 144 186
Cash and cash equivalents at end of year . . . . . . . . . . . . . . . . . . . . . . . . . . . . . . . . . . . . . . . . . . . . $ 217 $ 263 $ 107 $ 144
The accompanying notes on pages 72 to 110 are an integral part of these financial statements. These financial statementsonly present the Carnival plc consolidated IFRS Financial Statements and, accordingly, do not include the consolidatedIFRS results of Carnival Corporation.
Within the DLC arrangement the most appropriate presentation of Carnival plc’s results and financial position isconsidered to be by reference to the DLC Financial Statements (see Note 1).
69
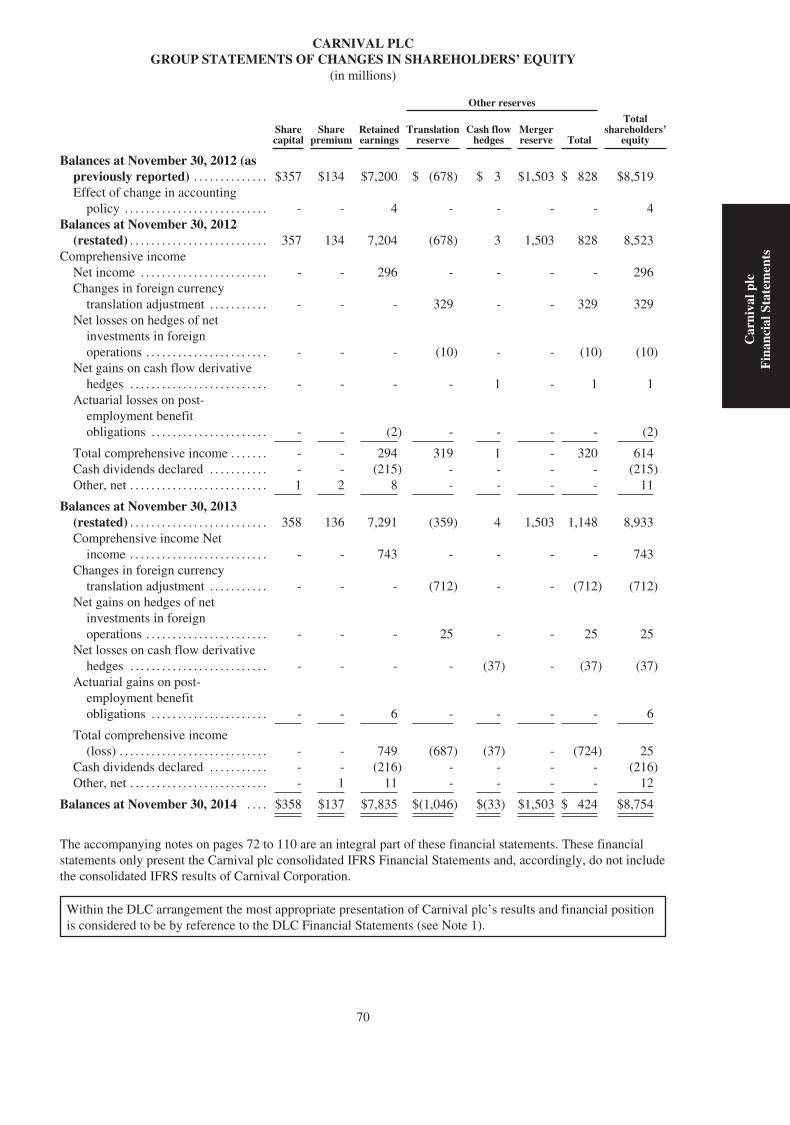
CARNIVAL PLCGROUP STATEMENTS OF CHANGES IN SHAREHOLDERS’ EQUITY
(in millions)
Other reserves
Sharecapital
Sharepremium
Retainedearnings
Translationreserve
Cash flowhedges
Mergerreserve Total
Totalshareholders’
equity
Balances at November 30, 2012 (aspreviously reported) . . . . . . . . . . . . . . $357 $134 $7,200 $ (678) $ 3 $1,503 $ 828 $8,519Effect of change in accounting
policy . . . . . . . . . . . . . . . . . . . . . . . . . . . - - 4 - - - - 4Balances at November 30, 2012
(restated) . . . . . . . . . . . . . . . . . . . . . . . . . . 357 134 7,204 (678) 3 1,503 828 8,523Comprehensive income
Net income . . . . . . . . . . . . . . . . . . . . . . . . - - 296 - - - - 296Changes in foreign currency
translation adjustment . . . . . . . . . . . - - - 329 - - 329 329Net losses on hedges of net
investments in foreignoperations . . . . . . . . . . . . . . . . . . . . . . . - - - (10) - - (10) (10)
Net gains on cash flow derivativehedges . . . . . . . . . . . . . . . . . . . . . . . . . . - - - - 1 - 1 1
Actuarial losses on post-employment benefitobligations . . . . . . . . . . . . . . . . . . . . . . - - (2) - - - - (2)
Total comprehensive income . . . . . . . - - 294 319 1 - 320 614Cash dividends declared . . . . . . . . . . . - - (215) - - - - (215)Other, net . . . . . . . . . . . . . . . . . . . . . . . . . . 1 2 8 - - - - 11
Balances at November 30, 2013(restated) . . . . . . . . . . . . . . . . . . . . . . . . . . 358 136 7,291 (359) 4 1,503 1,148 8,933Comprehensive income Net
income . . . . . . . . . . . . . . . . . . . . . . . . . . - - 743 - - - - 743Changes in foreign currency
translation adjustment . . . . . . . . . . . - - - (712) - - (712) (712)Net gains on hedges of net
investments in foreignoperations . . . . . . . . . . . . . . . . . . . . . . . - - - 25 - - 25 25
Net losses on cash flow derivativehedges . . . . . . . . . . . . . . . . . . . . . . . . . . - - - - (37) - (37) (37)
Actuarial gains on post-employment benefitobligations . . . . . . . . . . . . . . . . . . . . . . - - 6 - - - - 6
Total comprehensive income(loss) . . . . . . . . . . . . . . . . . . . . . . . . . . . . - - 749 (687) (37) - (724) 25
Cash dividends declared . . . . . . . . . . . - - (216) - - - - (216)Other, net . . . . . . . . . . . . . . . . . . . . . . . . . . - 1 11 - - - - 12
Balances at November 30, 2014 . . . . $358 $137 $7,835 $(1,046) $(33) $1,503 $ 424 $8,754
The accompanying notes on pages 72 to 110 are an integral part of these financial statements. These financialstatements only present the Carnival plc consolidated IFRS Financial Statements and, accordingly, do not includethe consolidated IFRS results of Carnival Corporation.
Within the DLC arrangement the most appropriate presentation of Carnival plc’s results and financial positionis considered to be by reference to the DLC Financial Statements (see Note 1).
70
Car
niva
lplc
Fin
anci
alSt
atem
ents
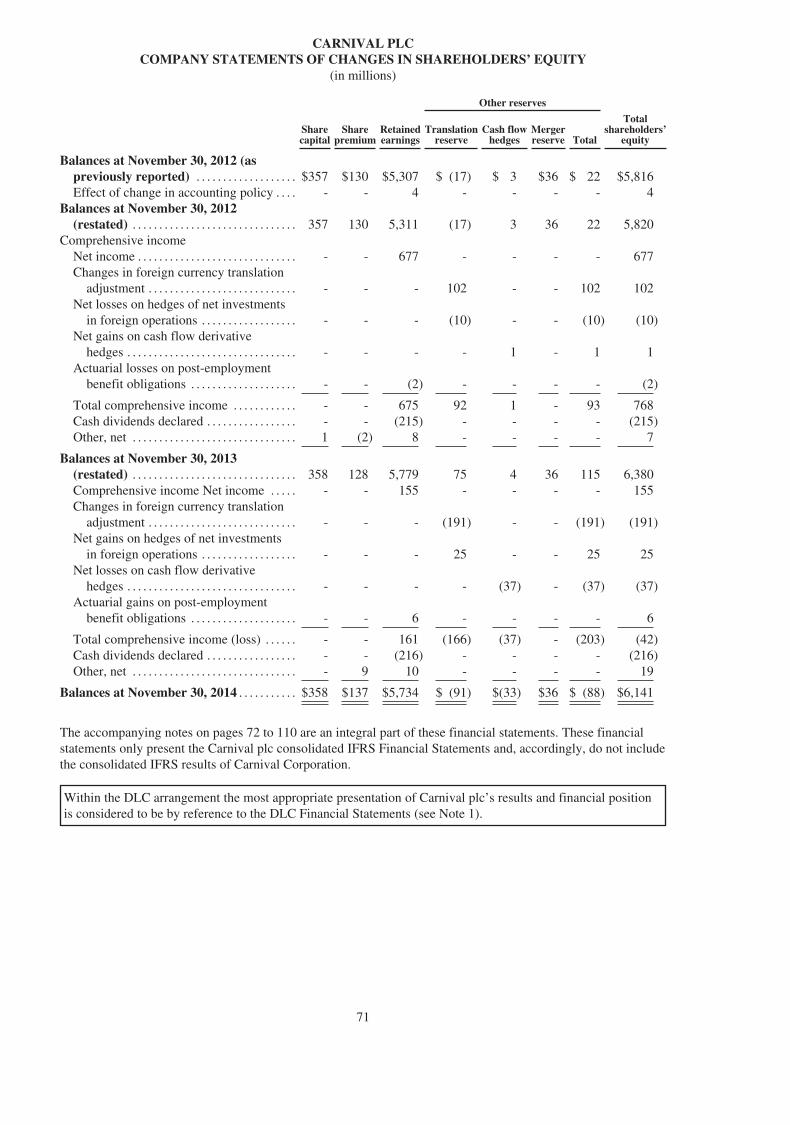
CARNIVAL PLCCOMPANY STATEMENTS OF CHANGES IN SHAREHOLDERS’ EQUITY
(in millions)
Other reserves
Sharecapital
Sharepremium
Retainedearnings
Translationreserve
Cash flowhedges
Mergerreserve Total
Totalshareholders’
equity
Balances at November 30, 2012 (aspreviously reported) . . . . . . . . . . . . . . . . . . . $357 $130 $5,307 $ (17) $ 3 $36 $ 22 $5,816Effect of change in accounting policy . . . . - - 4 - - - - 4
Balances at November 30, 2012(restated) . . . . . . . . . . . . . . . . . . . . . . . . . . . . . . . 357 130 5,311 (17) 3 36 22 5,820
Comprehensive incomeNet income . . . . . . . . . . . . . . . . . . . . . . . . . . . . . . - - 677 - - - - 677Changes in foreign currency translation
adjustment . . . . . . . . . . . . . . . . . . . . . . . . . . . . - - - 102 - - 102 102Net losses on hedges of net investments
in foreign operations . . . . . . . . . . . . . . . . . . - - - (10) - - (10) (10)Net gains on cash flow derivative
hedges . . . . . . . . . . . . . . . . . . . . . . . . . . . . . . . . - - - - 1 - 1 1Actuarial losses on post-employment
benefit obligations . . . . . . . . . . . . . . . . . . . . - - (2) - - - - (2)
Total comprehensive income . . . . . . . . . . . . - - 675 92 1 - 93 768Cash dividends declared . . . . . . . . . . . . . . . . . - - (215) - - - - (215)Other, net . . . . . . . . . . . . . . . . . . . . . . . . . . . . . . . 1 (2) 8 - - - - 7
Balances at November 30, 2013(restated) . . . . . . . . . . . . . . . . . . . . . . . . . . . . . . . 358 128 5,779 75 4 36 115 6,380Comprehensive income Net income . . . . . - - 155 - - - - 155Changes in foreign currency translation
adjustment . . . . . . . . . . . . . . . . . . . . . . . . . . . . - - - (191) - - (191) (191)Net gains on hedges of net investments
in foreign operations . . . . . . . . . . . . . . . . . . - - - 25 - - 25 25Net losses on cash flow derivative
hedges . . . . . . . . . . . . . . . . . . . . . . . . . . . . . . . . - - - - (37) - (37) (37)Actuarial gains on post-employment
benefit obligations . . . . . . . . . . . . . . . . . . . . - - 6 - - - - 6
Total comprehensive income (loss) . . . . . . - - 161 (166) (37) - (203) (42)Cash dividends declared . . . . . . . . . . . . . . . . . - - (216) - - - - (216)Other, net . . . . . . . . . . . . . . . . . . . . . . . . . . . . . . . - 9 10 - - - - 19
Balances at November 30, 2014 . . . . . . . . . . . $358 $137 $5,734 $ (91) $(33) $36 $ (88) $6,141
The accompanying notes on pages 72 to 110 are an integral part of these financial statements. These financialstatements only present the Carnival plc consolidated IFRS Financial Statements and, accordingly, do not includethe consolidated IFRS results of Carnival Corporation.
Within the DLC arrangement the most appropriate presentation of Carnival plc’s results and financial positionis considered to be by reference to the DLC Financial Statements (see Note 1).
71
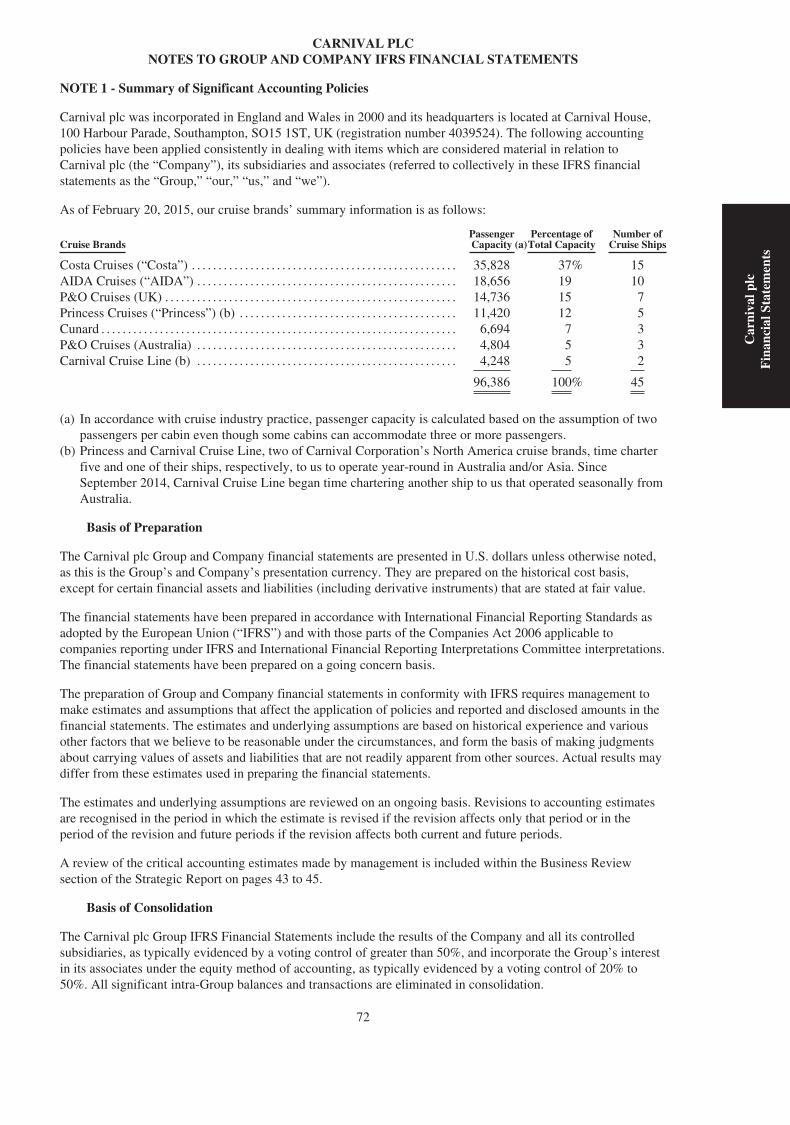
CARNIVAL PLCNOTES TO GROUP AND COMPANY IFRS FINANCIAL STATEMENTS
NOTE 1 - Summary of Significant Accounting Policies
Carnival plc was incorporated in England and Wales in 2000 and its headquarters is located at Carnival House,100 Harbour Parade, Southampton, SO15 1ST, UK (registration number 4039524). The following accountingpolicies have been applied consistently in dealing with items which are considered material in relation toCarnival plc (the “Company”), its subsidiaries and associates (referred to collectively in these IFRS financialstatements as the “Group,” “our,” “us,” and “we”).
As of February 20, 2015, our cruise brands’ summary information is as follows:
Cruise BrandsPassengerCapacity (a)
Percentage ofTotal Capacity
Number ofCruise Ships
Costa Cruises (“Costa”) . . . . . . . . . . . . . . . . . . . . . . . . . . . . . . . . . . . . . . . . . . . . . . . . . . 35,828 37% 15AIDA Cruises (“AIDA”) . . . . . . . . . . . . . . . . . . . . . . . . . . . . . . . . . . . . . . . . . . . . . . . . . 18,656 19 10P&O Cruises (UK) . . . . . . . . . . . . . . . . . . . . . . . . . . . . . . . . . . . . . . . . . . . . . . . . . . . . . . . 14,736 15 7Princess Cruises (“Princess”) (b) . . . . . . . . . . . . . . . . . . . . . . . . . . . . . . . . . . . . . . . . . 11,420 12 5Cunard . . . . . . . . . . . . . . . . . . . . . . . . . . . . . . . . . . . . . . . . . . . . . . . . . . . . . . . . . . . . . . . . . . . 6,694 7 3P&O Cruises (Australia) . . . . . . . . . . . . . . . . . . . . . . . . . . . . . . . . . . . . . . . . . . . . . . . . . 4,804 5 3Carnival Cruise Line (b) . . . . . . . . . . . . . . . . . . . . . . . . . . . . . . . . . . . . . . . . . . . . . . . . . 4,248 5 2
96,386 100% 45
(a) In accordance with cruise industry practice, passenger capacity is calculated based on the assumption of twopassengers per cabin even though some cabins can accommodate three or more passengers.
(b) Princess and Carnival Cruise Line, two of Carnival Corporation’s North America cruise brands, time charterfive and one of their ships, respectively, to us to operate year-round in Australia and/or Asia. SinceSeptember 2014, Carnival Cruise Line began time chartering another ship to us that operated seasonally fromAustralia.
Basis of Preparation
The Carnival plc Group and Company financial statements are presented in U.S. dollars unless otherwise noted,as this is the Group’s and Company’s presentation currency. They are prepared on the historical cost basis,except for certain financial assets and liabilities (including derivative instruments) that are stated at fair value.
The financial statements have been prepared in accordance with International Financial Reporting Standards asadopted by the European Union (“IFRS”) and with those parts of the Companies Act 2006 applicable tocompanies reporting under IFRS and International Financial Reporting Interpretations Committee interpretations.The financial statements have been prepared on a going concern basis.
The preparation of Group and Company financial statements in conformity with IFRS requires management tomake estimates and assumptions that affect the application of policies and reported and disclosed amounts in thefinancial statements. The estimates and underlying assumptions are based on historical experience and variousother factors that we believe to be reasonable under the circumstances, and form the basis of making judgmentsabout carrying values of assets and liabilities that are not readily apparent from other sources. Actual results maydiffer from these estimates used in preparing the financial statements.
The estimates and underlying assumptions are reviewed on an ongoing basis. Revisions to accounting estimatesare recognised in the period in which the estimate is revised if the revision affects only that period or in theperiod of the revision and future periods if the revision affects both current and future periods.
A review of the critical accounting estimates made by management is included within the Business Reviewsection of the Strategic Report on pages 43 to 45.
Basis of Consolidation
The Carnival plc Group IFRS Financial Statements include the results of the Company and all its controlledsubsidiaries, as typically evidenced by a voting control of greater than 50%, and incorporate the Group’s interestin its associates under the equity method of accounting, as typically evidenced by a voting control of 20% to50%. All significant intra-Group balances and transactions are eliminated in consolidation.
72
Car
niva
lplc
Fin
anci
alSt
atem
ents
Carnival Corporation and Carnival plc operate a dual listed company (“DLC”), known as Carnival Corporation &plc, whereby the businesses of Carnival Corporation and Carnival plc are combined through a number ofcontracts and through provisions in Carnival Corporation’s Articles of Incorporation and By-Laws and Carnivalplc’s Articles of Association. The two companies operate as if they are a single economic enterprise, but each hasretained its separate legal identity. Each company’s shares are publicly traded; on the New York Stock Exchange(“NYSE”) for Carnival Corporation and the London Stock Exchange for Carnival plc. In addition, Carnival plcAmerican Depository Shares are traded on the NYSE. The contracts governing the DLC arrangement providethat Carnival Corporation and Carnival plc each continue to have separate boards of directors, but the boards ofdirectors and senior executive management of both companies are identical. Further details relating to the DLCarrangement are included in Note 3 of the DLC Financial Statements, which are included in Annex 1, but do notform part of these Carnival plc financial statements.
In order to provide the Carnival Corporation and Carnival plc shareholders with the most meaningful picture oftheir economic interest in the DLC arrangement, consolidated financial statements of Carnival Corporation & plcare included in the DLC Annual Report. The DLC Financial Statements have been prepared under purchaseaccounting principles whereby the DLC transaction was accounted for as an acquisition of Carnival plc byCarnival Corporation.
The Group and Company IFRS Financial Statements are required to satisfy reporting requirements of theCompanies Act 2006 and do not include the IFRS consolidated results and financial position of CarnivalCorporation and its subsidiaries. Accordingly, the Directors consider that, within the DLC arrangement, the mostappropriate presentation of Carnival plc’s results and financial position is by reference to the U.S. generallyaccepted accounting principles (“U.S. GAAP”) DLC Financial Statements, on the basis that all significantfinancial and operating decisions affecting the DLC companies are made on the basis of U.S. GAAP informationand consequences. Accordingly, the DLC Financial Statements on pages 6 to 36 in the DLC Annual Report areprovided to shareholders as other information, which are included in Annex 1, but do not form part of theseCarnival plc financial statements. Finally, the Carnival plc Directors’ Report, Part II of the Carnival plcDirectors’ Remuneration Report and the Carnival plc Corporate Governance Report, included as Annexes A, Band C, respectively, to the Notice of Annual Meetings and Proxy Statement, dated February 20, 2015 (“ProxyStatement”), Part I of the Carnival plc Directors’ Remuneration Report, contained within the Proxy Statementand the Strategic Report are all included as part of the 2014 Carnival plc Annual Report. Additional informationrelated to environmental, social and governance issues can be found in our Strategic Report, Carnival plcDirectors’ Report and Carnival plc Corporate Governance Report.
The above mentioned Proxy Statement information can be found at the Carnival Corporation & plc website atwww.carnivalcorp.com or www.carnivalplc.com.
Cash and Cash Equivalents
Cash and cash equivalents include investments with maturities of three months or less at acquisition, which arestated at cost.
Inventories
Inventories consist substantially of food and beverages, hotel and restaurant products and supplies, fuel and giftshop merchandise held for resale, which are all carried at the lower of cost or net realisable value. Cost isdetermined using the weighted-average or first-in, first-out methods.
73
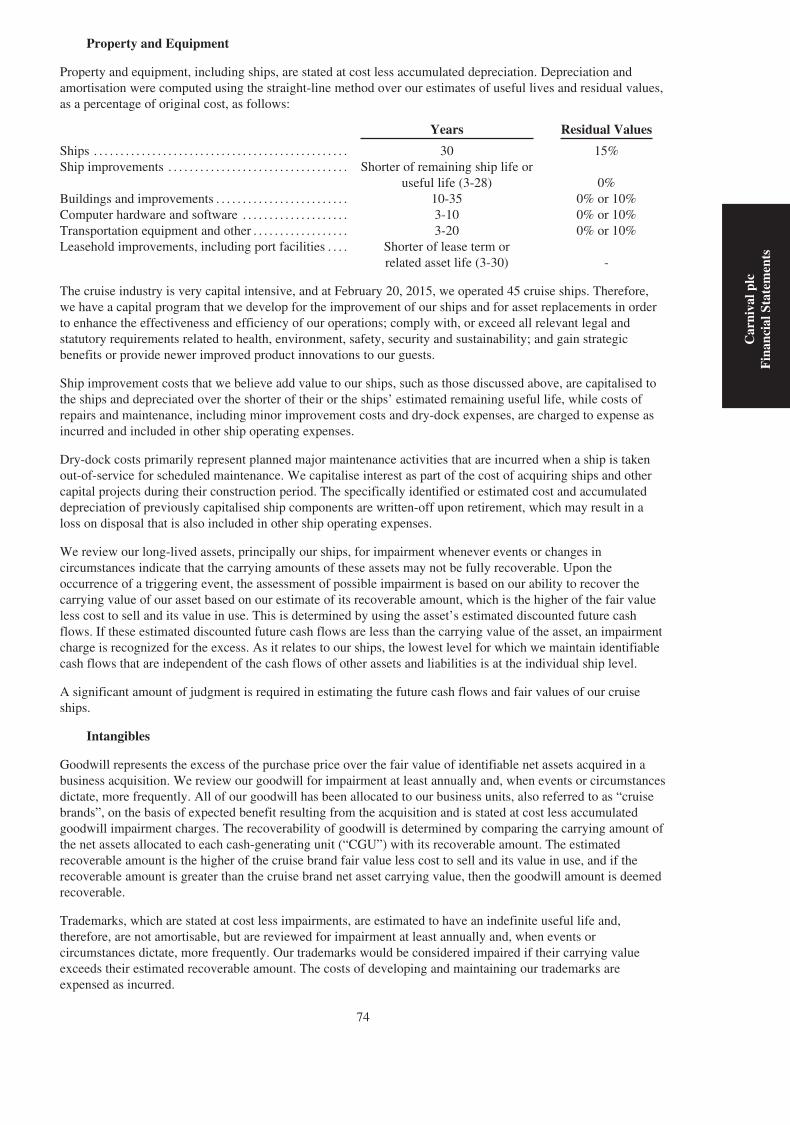
Property and Equipment
Property and equipment, including ships, are stated at cost less accumulated depreciation. Depreciation andamortisation were computed using the straight-line method over our estimates of useful lives and residual values,as a percentage of original cost, as follows:
Years Residual Values
Ships . . . . . . . . . . . . . . . . . . . . . . . . . . . . . . . . . . . . . . . . . . . . . . . . 30 15%Ship improvements . . . . . . . . . . . . . . . . . . . . . . . . . . . . . . . . . . Shorter of remaining ship life or
useful life (3-28) 0%Buildings and improvements . . . . . . . . . . . . . . . . . . . . . . . . . 10-35 0% or 10%Computer hardware and software . . . . . . . . . . . . . . . . . . . . 3-10 0% or 10%Transportation equipment and other . . . . . . . . . . . . . . . . . . 3-20 0% or 10%Leasehold improvements, including port facilities . . . . Shorter of lease term or
related asset life (3-30) -
The cruise industry is very capital intensive, and at February 20, 2015, we operated 45 cruise ships. Therefore,we have a capital program that we develop for the improvement of our ships and for asset replacements in orderto enhance the effectiveness and efficiency of our operations; comply with, or exceed all relevant legal andstatutory requirements related to health, environment, safety, security and sustainability; and gain strategicbenefits or provide newer improved product innovations to our guests.
Ship improvement costs that we believe add value to our ships, such as those discussed above, are capitalised tothe ships and depreciated over the shorter of their or the ships’ estimated remaining useful life, while costs ofrepairs and maintenance, including minor improvement costs and dry-dock expenses, are charged to expense asincurred and included in other ship operating expenses.
Dry-dock costs primarily represent planned major maintenance activities that are incurred when a ship is takenout-of-service for scheduled maintenance. We capitalise interest as part of the cost of acquiring ships and othercapital projects during their construction period. The specifically identified or estimated cost and accumulateddepreciation of previously capitalised ship components are written-off upon retirement, which may result in aloss on disposal that is also included in other ship operating expenses.
We review our long-lived assets, principally our ships, for impairment whenever events or changes incircumstances indicate that the carrying amounts of these assets may not be fully recoverable. Upon theoccurrence of a triggering event, the assessment of possible impairment is based on our ability to recover thecarrying value of our asset based on our estimate of its recoverable amount, which is the higher of the fair valueless cost to sell and its value in use. This is determined by using the asset’s estimated discounted future cashflows. If these estimated discounted future cash flows are less than the carrying value of the asset, an impairmentcharge is recognized for the excess. As it relates to our ships, the lowest level for which we maintain identifiablecash flows that are independent of the cash flows of other assets and liabilities is at the individual ship level.
A significant amount of judgment is required in estimating the future cash flows and fair values of our cruiseships.
Intangibles
Goodwill represents the excess of the purchase price over the fair value of identifiable net assets acquired in abusiness acquisition. We review our goodwill for impairment at least annually and, when events or circumstancesdictate, more frequently. All of our goodwill has been allocated to our business units, also referred to as “cruisebrands”, on the basis of expected benefit resulting from the acquisition and is stated at cost less accumulatedgoodwill impairment charges. The recoverability of goodwill is determined by comparing the carrying amount ofthe net assets allocated to each cash-generating unit (“CGU”) with its recoverable amount. The estimatedrecoverable amount is the higher of the cruise brand fair value less cost to sell and its value in use, and if therecoverable amount is greater than the cruise brand net asset carrying value, then the goodwill amount is deemedrecoverable.
Trademarks, which are stated at cost less impairments, are estimated to have an indefinite useful life and,therefore, are not amortisable, but are reviewed for impairment at least annually and, when events orcircumstances dictate, more frequently. Our trademarks would be considered impaired if their carrying valueexceeds their estimated recoverable amount. The costs of developing and maintaining our trademarks areexpensed as incurred.
74
Car
niva
lplc
Fin
anci
alSt
atem
ents
A significant amount of judgment is required in estimating the recoverable amounts of our cruise brands’goodwill and trademarks.
Revenue and Expense Recognition
Revenue comprises sales to third-parties and excludes VAT and other similar sales taxes. Guest cruise depositsrepresent unearned revenues and are initially included in customer deposit liabilities generally when received (seeBusiness Review section on page 53 within the Strategic Report for additional discussion of customer deposits).Customer deposits are subsequently recognised as cruise revenues, together with revenues from onboard and otheractivities, and all associated direct costs and expenses of a voyage are recognised as cruise costs and expenses, uponcompletion of voyages with durations of ten nights or less and on a pro rata basis for voyages in excess of tennights. The impact of recognising these shorter duration cruise revenues and costs and expenses on a completedvoyage basis versus on a pro rata basis is not significant. Future travel discount vouchers issued to guests areincluded as a reduction of cruise passenger ticket revenues when such vouchers are utilised. Guest cancellation feesare recognised in cruise passenger ticket revenues at the time of the cancellation.
Our sale to guests of air and other transportation to and from airports near the home ports of our ships and therelated cost of purchasing these services are included in cruise passenger ticket revenues and cruisetransportation costs, respectively. The proceeds that we collect from the sales of third-party shore excursions andon behalf of our onboard concessionaires, net of the amounts remitted to them, are included in onboard and othercruise revenues as concession revenues. All of these amounts are recognised on a completed voyage or pro ratabasis as discussed above.
Cruise passenger ticket revenues include fees, taxes and charges collected by us from our guests. A portion ofthese fees, taxes and charges vary with guest head counts and are directly imposed on a revenue-producingarrangement. This portion of the fees, taxes and charges is expensed in commissions, transportation and othercosts when the corresponding revenues are recognised. The remaining portion of fees, taxes and charges are alsoincluded in cruise passenger ticket revenues but are expensed in other ship operating expenses when thecorresponding revenues are recognised.
Revenues and expenses from our hotel and transportation operations, which are included in our Tour and Othersegment, are recognised at the time the services are performed or expenses are incurred. Revenues from the long-term leasing of ships, which are also included in our Tour and Other segment, are recognised ratably over theterm of the charter agreement using the straight-line method (see Note 2).
Insurance
We maintain insurance, including under Carnival Corporation & plc’s group risk sharing programs, to cover anumber of risks including illness and injury to crew, guest injuries, pollution, other third-party claims inconnection with our cruise activities, damages to hull and machinery for each of our ships, war risks, workers’compensation, employee health, directors’ and officers’ liability, property damages and general liabilities forthird-party claims. We recognise insurance recoverables from third-party insurers for incurred expenses at thetime the recovery is virtually certain and upon realisation for amounts in excess of incurred expenses. All of ourinsurance policies are subject to coverage limits, exclusions and deductible levels. The liabilities associated withcrew illnesses and crew and guest injury claims, including all legal costs, are estimated based on the specificmerits of the individual claims or actuarially estimated based on historical claims experience, loss developmentfactors and other assumptions. While we believe our estimated accrued claims reserves are adequate, the ultimatelosses will differ.
At November 30, 2014 and 2013, substantially all of our aggregated short-term and long-term insurancerecoverables are for crew, guest and other third-party claims related to our January 2012 ship incident. AtNovember 30, 2014 and 2013, the majority of our aggregated short-term and long-term claims reserves alsorelate to this January 2012 ship incident. At November 30, 2014 and 2013, our long-term insurance recoverablesand long-term claims reserve are included in other assets and other long-term liabilities, respectively, and are notmaterial.
Selling and Administrative Expenses
Selling expenses include a broad range of advertising, such as marketing and promotional expenses. Advertisingis charged to expense as incurred. Administrative expenses represent the costs of our shoreside ship support,reservations and other administrative functions, and includes salaries and related benefits, professional fees andoccupancy costs, which are typically expensed as incurred.
75
Foreign Currency Translations and Transactions
Each business determines its functional currency by reference to its primary economic environment. We translatethe assets and liabilities of our foreign operations that have functional currencies other than the U.S. dollar atexchange rates in effect at the balance sheet date. Revenues and expenses of these foreign operations aretranslated at weighted-average exchange rates for the period. Their equity is translated at historical rates and theresulting foreign currency translation adjustments are included in the translation reserve, which is a separatecomponent of other reserves within shareholders’ equity. Therefore, the U.S. dollar value of these non-equitytranslated items in our Group and Company financial statements will fluctuate from period to period, dependingon the changing value of the U.S. dollar versus these currencies.
We execute transactions in a number of different currencies, principally the U.S. dollar, euro, sterling andAustralian dollar. Exchange rate gains and losses arising from changes in foreign currency exchange ratesbetween the time an expense is recorded and when it is settled as well as the remeasurement of monetary assetsand liabilities, all denominated in a currency other than the functional currency of the entity involved, arerecognised currently in nonoperating earnings, unless such monetary liabilities have been designated to act ashedges of net investments in our foreign operations. These net gains or losses resulting from these “nonoperatingforeign currency transactions” were insignificant in 2014 and 2013. In addition, the unrealised gains or losses onour long-term intercompany receivables and payables denominated in a non-functional currency, which are notexpected to be repaid in the foreseeable future and are therefore considered to form part of our net investments,are recorded as foreign currency translation adjustments, which are included in the translation reserve.
Share-Based Compensation
We recognise compensation expense for all share-based compensation awards using the fair value method. Fortime-based share awards, we recognise compensation cost ratably using the straight-line attribution method overthe expected vesting period or to the retirement eligibility date, if less than the vesting period, when vesting is notcontingent upon any future performance. For performance-based share awards, we generally recognisecompensation cost ratably using the straight-line attribution method over the expected vesting period based onthe probability of the performance condition being achieved. If all or a portion of the performance condition isnot expected to be met, the appropriate amount of previously recognised compensation expense will be reversedand future compensation expense will be adjusted accordingly. For market-based share awards, we recognisecompensation cost ratably using the straight-line attribution method over the expected vesting period. If the targetmarket conditions are not expected to be met, compensation expense will still be recognised. In addition, weestimate the amount of expected forfeitures based on historical forfeiture experience when calculatingcompensation cost. If the actual forfeitures that occur are significantly different from the estimate, then we reviseour estimates.
Pensions
The Group operates both defined benefit and defined contribution plans. The net deficit or surplus for eachdefined benefit pension plan is calculated in accordance with IAS 19(R), based on the present value of thedefined benefit obligation at the balance sheet date less the fair value of the plan assets. The calculation isperformed by a qualified actuary using the projected unit credit method. The discount rate is the yield at thebalance sheet date on AA credit rated bonds or local equivalents that have maturity dates approximating theterms of the pension plans’ obligations.
Actuarial gains and losses that arise in calculating the defined benefit pension plans’ obligations are recognisedin the period in which they arise directly in the Group and Company’s comprehensive income.
The operating and financing costs of defined benefit pension plans are recognised in the Group and Company’sincome; current service costs are spread systematically over the expected average remaining service lives ofemployees and financing costs are recognised in the periods within which they arise. To the extent that thebenefits vest immediately, the expense is recognised immediately in the Group and Company’s income.
Defined contribution plan expenses are recognised in the period to which they relate. We contribute to theseplans based on employee contributions, salary levels and length of service.
76
Car
niva
lplc
Fin
anci
alSt
atem
ents
Derivatives and Other Financial Instruments
We utilise derivative and nonderivative financial instruments, such as foreign currency forwards, options andswaps, foreign currency debt obligations and foreign currency cash balances, to manage our exposure tofluctuations in certain foreign currency exchange rates, and interest rate swaps to manage our interest rateexposure in order to achieve a desired proportion of fixed and floating rate debt. Our policy is not to use anyfinancial instruments for trading or other speculative purposes.
All derivatives are recorded at fair value. The changes in fair value are recognised currently in earnings if thederivatives do not qualify as effective hedges. Subject to specific criteria, derivatives, financial assets andfinancial liabilities may be designated as forming hedge relationships, as a result of which changes in their fairvalue are offset in the Group and Company’s income or recognised directly in the Group and Company’scomprehensive income, depending on the nature of the hedge relationship. Hedging derivatives fall into threeclassifications: fair value hedges, cash flow hedges and hedges of a net investment. Changes in the fair value offair value hedge derivatives are offset against the changes in the fair value of the underlying hedged items in theGroup and Company’s income. The effective portion of the changes in fair value of cash flow hedge derivativesare recognised in the Group and Company’s comprehensive income until the underlying hedged item isrecognised in earnings or the forecasted transaction is no longer probable. Changes in the fair value of hedges ofa net investment are recognised in the Group and Company’s comprehensive income to offset a portion of thechange in the translated value of the net investment being hedged. In the event that a previously hedgedinvestment is sold or liquidated, the accumulated amount previously recognised from hedging is required to beremoved from the hedging reserve within shareholders’ equity and reflected in net income. We formallydocument hedging relationships for all derivative and nonderivative hedges and the underlying hedged items, aswell as our risk management objectives and strategies for undertaking the hedge transactions.
We classify the fair values of all derivative contracts as either current or long-term, depending on whether thematurity date of the derivative contract is within or beyond one year from the balance sheet date. The cash flowsfrom derivatives treated as hedges are classified in the Statements of Cash Flows in the same category as the itembeing hedged.
Interest-bearing debt and bank overdrafts are recorded at their initial fair value, which normally reflects theproceeds received by us, net of debt issuance costs, and subsequently stated at amortised cost, including accruedinterest. Any difference between the proceeds after debt issuance costs and the premium and redemption valuesare amortised to interest expense over the term of the debt, typically on a straight-line basis which approximatesthe effective interest method.
Income Taxes
Deferred income taxes are provided using the balance sheet liability method. Deferred income tax assets arerecognised to the extent that it is probable that future taxable income will be available against which thetemporary differences can be utilised. Deferred income taxes are measured at the average tax rates that areexpected to apply in the periods in which the timing differences are expected to reverse based on tax rates andlaws that have been enacted or substantially enacted by the balance sheet date. Current income taxes are the taxespayable on the taxable income for the year, applying current rates and any adjustments in respect of previousyears.
Earnings Per Share
Basic earnings per share is computed by dividing net income by the weighted-average number of ordinary sharesoutstanding during each period. Diluted earnings per share is computed by dividing net income by the weighted-average number of ordinary shares and common stock equivalents outstanding during each period.
Dividends
Dividend distributions are recognised in the period in which the dividends are declared, since under the DLCarrangement the declaration of a dividend by the boards of directors of Carnival Corporation and Carnival plcestablishes a liability for Carnival plc.
77
Changes in Accounting Policy and Disclosures
New and Amended Standards That Have Been Adopted By Us
• Amendments to IAS 19, “Employee Benefits,” effective for annual periods beginning on or afterJanuary 1, 2013;
• IAS 36, “Impairment of Assets,” effective for annual periods beginning on or after January 1,2014;
• IFRS 7, “Offsetting Financial Assets and Financial Liabilities,” effective for annual periodsbeginning on or after January 1, 2013 and
• IFRS 13, “Fair Value Measurement,” effective for annual periods beginning on or after January 1,2013.
The adoption of these new standards and amendments did not have a material impact on the Group or Companyresults and financial position. However, the impact of adopting Amendments to IAS 19 was an increase to theNovember 30, 2012 previously reported retained earnings of $4 million. A November 30, 2012 balance sheet wasnot prepared due to the insignificant impact of adopting the amendments to IAS 19.
NOTE 2 - Segment Information
IFRS 8 “Operating Segments” requires that an entity’s operating segments are reported on the same basis as theinternally reported information that is provided to the chief operating decision maker (“CODM”), who is thePresident and Chief Executive Officer of Carnival Corporation and Carnival plc.
As previously discussed, within the DLC arrangement the most appropriate presentation of Carnival plc’s resultsand financial position is by reference to the DLC Financial Statements, which are included in Annex 1, but do notform part of these Carnival plc financial statements. Accordingly, decisions to allocate resources and assessperformance for Carnival plc are made by the CODM upon review of the U.S. GAAP segment results across allof Carnival Corporation & plc’s cruise brands and other segments. Carnival Corporation & plc has threereportable cruise segments that are comprised of its (1) North America cruise brands, (2) Europe, Australia &Asia (“EAA”) cruise brands and (3) Cruise Support. In addition, Carnival Corporation & plc has a Tour andOther segment.
The Carnival Corporation & plc North America cruise segment includes Carnival Cruise Line, Holland AmericaLine, Princess and Seabourn. The Carnival Corporation & plc EAA cruise segment includes AIDA, Costa,Cunard, P&O Cruises (Australia), P&O Cruises (UK) and prior to November 2014, Ibero Cruises (“Ibero”).These individual cruise brand operating segments have been aggregated into two reportable segments based onthe similarity of their economic and other characteristics, including types of customers, regulatory environment,ship maintenance requirements, supporting systems and processes and products and services they provide. TheCarnival Corporation & plc Cruise Support segment represents certain of its port and related facilities and otherservices that are provided for the benefit of its cruise brands. The Carnival Corporation & plc Tour and Othersegment represents the hotel and transportation operations of Holland America Princess Alaska Tours. In 2012,this Tour and Other segment also included two ships that it chartered to an unaffiliated entity. In April 2013,Carnival Corporation sold one of these two ships and recognised a $15 million gain as a reduction of Tour andOther operating expenses. Accordingly, subsequent to this 2013 sale and through November 30, 2014, our Tourand Other segment included only one ship. The significant accounting policies of these segments are the same asthose described in Note 2 of the DLC Financial Statements, which are included in Annex 1, but do not form partof these Carnival plc financial statements.
78
Car
niva
lplc
Fin
anci
alSt
atem
ents
Selected information for the Carnival Corporation & plc segments and the reconciliation to the correspondingCarnival plc amounts as of and for the years ended November 30 was as follows (in millions):
RevenuesOperatingexpenses
Selling andadministrative
Depreciationand
amortisation
Operatingincome(loss)
Capitalexpenditures
Totalassets
2014North America Cruise
Brands (a) . . . . . . . . . . . $ 9,559 $ 6,418 $ 1,121 $ 959 $ 1,061 $ 1,315 $ 22,765EAA Cruise Brands
(b) . . . . . . . . . . . . . . . . . . . 6,148 3,914 725 616 893(c) 1,054 15,228Cruise Support . . . . . . . . . 90 39 200 25 (174) 156 1,023Tour and Other (a) . . . . . 215 160 8 35 12 58 516(f)Intersegment
elimination (a) . . . . . . . (128) (128) - - - - -
Carnival Corporation &plc – U.S. GAAP . . . . 15,884 10,403 2,054 1,635 1,792 2,583 39,532
Carnival Corporation,U.S. GAAP vs. IFRSdifferences andeliminations (d) . . . . . . (8,676) (5,523) (1,241) (970) (958) (1,508) (24,204)
Carnival plc – IFRS . . . . $ 7,208 $ 4,880 $ 813 $ 665 $ 834 $ 1,075 $ 15,328
2013 (restated)
North America CruiseBrands (a) . . . . . . . . . . . $ 9,370 $ 6,439 $ 1,048 $ 927 $ 956 $ 1,350 $ 22,448
EAA Cruise Brands(b) . . . . . . . . . . . . . . . . . . . 5,906 4,137 686 599 471(e) 642 16,126
Cruise Support . . . . . . . . . 96 31 136 26 (97) 108 1,016Tour and Other (a) . . . . . 210 143 9 36 22 49 514(f)Intersegment
elimination (a) . . . . . . . (126) (126) - - - - -
Carnival Corporation &plc – U.S. GAAP . . . . 15,456 10,624 1,879 1,588 1,352 2,149 40,104
Carnival Corporation,U.S. GAAP vs. IFRSdifferences andeliminations (d) . . . . . . (8,649) (5,857) (1,108) (939) (921) (1,420) (23,838)
Carnival plc – IFRS . . . . $ 6,807 $ 4,767 $ 771 $ 649 $ 431 $ 729 $ 16,266
(a) A portion of the North America cruise brands’ segment revenues includes revenues for the tour portion of acruise when a land tour package is sold along with a cruise by either Holland America Line or Princess.These intersegment tour revenues, which are included in the Tour and Other segment, are eliminated directlyagainst the North America cruise brands’ segment revenues and operating expenses in the line “Intersegmentelimination.”
(b) Carnival plc consists principally of the EAA cruise brands.(c) Includes impairment charges of $31 million and $22 million related to Grand Holiday and Grand
Celebration, respectively, partially offset by a $37 million gain on the sale of Costa Voyager.(d) Carnival Corporation consists primarily of cruise brands that do not form part of the Group; however, these
brands are included in Carnival Corporation & plc and thus represent substantially all of the reconcilingitems. These North American Carnival Corporation cruise brands are Carnival Cruise Line, Princess, HollandAmerica Line and Seabourn. The U.S. GAAP vs. IFRS accounting differences principally relate todifferences in the carrying value of ships and related depreciation expenses.
(e) Includes $13 million in 2013 of impairment losses related to Ibero’s trademarks.(f) Tour and Other segment assets primarily include hotels and lodges in the state of Alaska and the Canadian
Yukon, motorcoaches used for sightseeing and charters, glass-domed railcars, which run on the Alaska Railroadand Carnival Corporation & plc owned ships that it leased out under long-term charters to an unaffiliated entity.
79

IFRS 8 also requires disclosure of certain geographical information that is in addition to the requirement todisclose information reviewed by the CODM. The Group’s revenues by geographical areas, which are based onwhere our guests are sourced and not the cruise brands on which they sailed, were as follows (in millions):
Years Ended November 30,2014 2013
North America . . . . . . . . . . . . . . . . . . . . . . . . . . . . . . . . . . . . . . . . . . . . . . . . . . . . . . . . . . . . . . . . . . . . . $ 1,049 $ 880Europe . . . . . . . . . . . . . . . . . . . . . . . . . . . . . . . . . . . . . . . . . . . . . . . . . . . . . . . . . . . . . . . . . . . . . . . . . . . . . 4,925 4,675Australia and Asia . . . . . . . . . . . . . . . . . . . . . . . . . . . . . . . . . . . . . . . . . . . . . . . . . . . . . . . . . . . . . . . . . . 1,014 878Others . . . . . . . . . . . . . . . . . . . . . . . . . . . . . . . . . . . . . . . . . . . . . . . . . . . . . . . . . . . . . . . . . . . . . . . . . . . . . . 220 374
$ 7,208 $ 6,807
Substantially all of our cruise assets are ships and our cruise capital expenditures are substantially all incurred forships and ships under construction. Our ships move between geographic regions and, therefore, it is notmeaningful to allocate these ship assets and ship capital expenditures to particular regions. In addition, segmentinformation relating to liabilities is not reported to or used by the CODM in order to assess performance andallocate resources to a segment. Our Tour operations’ guests are primarily sourced from North America, which iswhere all our Tour operations’ assets and capital spending are located.
NOTE 3 - Income, Expense and Auditors’ Remuneration
Operating lease expenses were as follows (in millions):
Years Ended November 30,2014 2013
Ships . . . . . . . . . . . . . . . . . . . . . . . . . . . . . . . . . . . . . . . . . . . . . . . . . . . . . . . . . . . . . . . . . . . . . . . . . . . . $ 444 $ 337Property . . . . . . . . . . . . . . . . . . . . . . . . . . . . . . . . . . . . . . . . . . . . . . . . . . . . . . . . . . . . . . . . . . . . . . . . . 27 25Other . . . . . . . . . . . . . . . . . . . . . . . . . . . . . . . . . . . . . . . . . . . . . . . . . . . . . . . . . . . . . . . . . . . . . . . . . . . . 6 6
$ 477 $ 368
Auditors’ remuneration was as follows (in millions):
Fees payable to the Company’s auditor for the audit of theGroup and Company financial statements . . . . . . . . . . . . . . . . . . . . . . . . . . . . . . . . . $ 1 $ 1
Fees payable to the Company’s auditor and their associates for the audit ofthe Company’s subsidiaries pursuant to legislation . . . . . . . . . . . . . . . . . . . . . . . . 1 1
$ 2 $ 2
In addition, during 2014, there were non-audit service fees that were payable to the auditor of $0.3 million.
During 2014, the Group recognised:
• a $31 million and $22 million ship impairment charge related to Ibero’s Grand Holiday and GrandCelebration, respectively, and
• a $37 million gain from the sale of Costa Voyager.
During 2013, the Group recognised:
• a $73 million and $103 million ship impairment charge related to Costa Voyager and Costa Classica,respectively, and
• impairment charges of $13 million for Ibero’s remaining trademarks’ carrying value and $14 millionrelated to an investment.
Refer to Note 10 for ship impairments and sales discussion.
Selling and administrative expenses include advertising and promotion expenses of $292 million and $278million and payroll and related expenses of $388 million and $355 million in 2014 and 2013, respectively.
80
Car
niva
lplc
Fin
anci
alSt
atem
ents
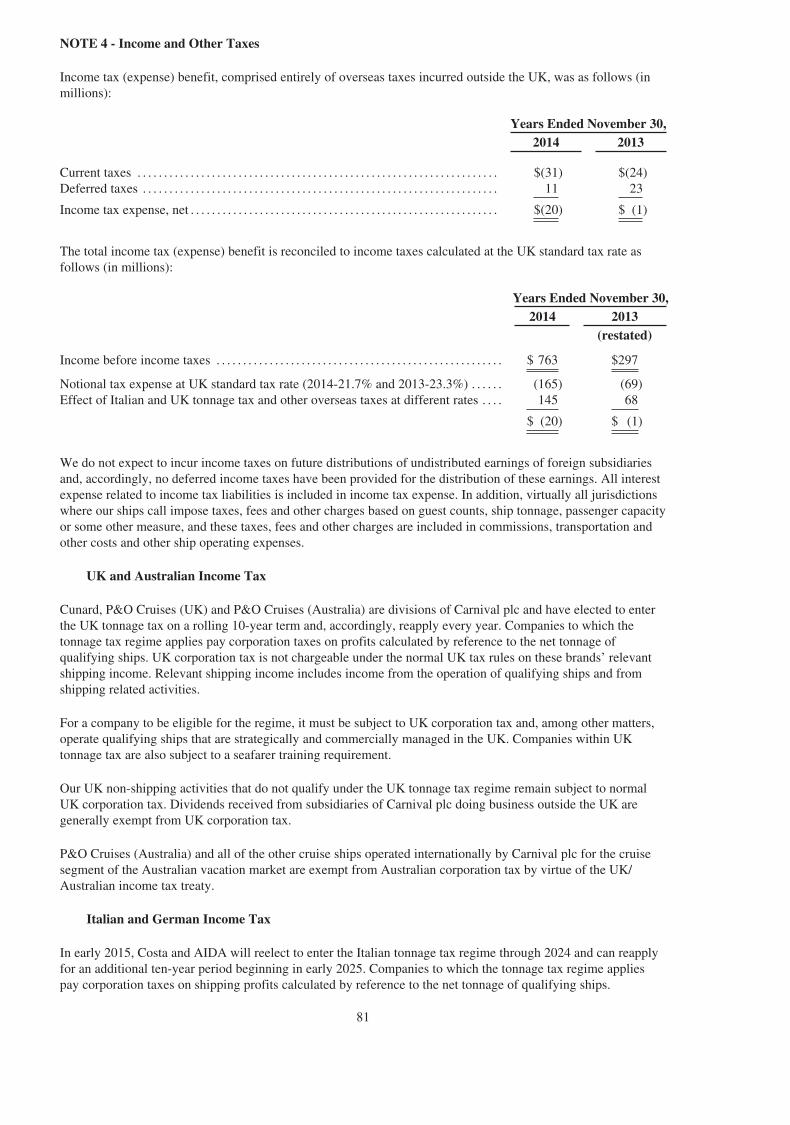
NOTE 4 - Income and Other Taxes
Income tax (expense) benefit, comprised entirely of overseas taxes incurred outside the UK, was as follows (inmillions):
Years Ended November 30,2014 2013
Current taxes . . . . . . . . . . . . . . . . . . . . . . . . . . . . . . . . . . . . . . . . . . . . . . . . . . . . . . . . . . . . . . . . . . . . $(31) $(24)Deferred taxes . . . . . . . . . . . . . . . . . . . . . . . . . . . . . . . . . . . . . . . . . . . . . . . . . . . . . . . . . . . . . . . . . . . 11 23
Income tax expense, net . . . . . . . . . . . . . . . . . . . . . . . . . . . . . . . . . . . . . . . . . . . . . . . . . . . . . . . . . . $(20) $ (1)
The total income tax (expense) benefit is reconciled to income taxes calculated at the UK standard tax rate asfollows (in millions):
Years Ended November 30,2014 2013
(restated)
Income before income taxes . . . . . . . . . . . . . . . . . . . . . . . . . . . . . . . . . . . . . . . . . . . . . . . . . . . . . . $ 763 $297
Notional tax expense at UK standard tax rate (2014-21.7% and 2013-23.3%) . . . . . . (165) (69)Effect of Italian and UK tonnage tax and other overseas taxes at different rates . . . . 145 68
$ (20) $ (1)
We do not expect to incur income taxes on future distributions of undistributed earnings of foreign subsidiariesand, accordingly, no deferred income taxes have been provided for the distribution of these earnings. All interestexpense related to income tax liabilities is included in income tax expense. In addition, virtually all jurisdictionswhere our ships call impose taxes, fees and other charges based on guest counts, ship tonnage, passenger capacityor some other measure, and these taxes, fees and other charges are included in commissions, transportation andother costs and other ship operating expenses.
UK and Australian Income Tax
Cunard, P&O Cruises (UK) and P&O Cruises (Australia) are divisions of Carnival plc and have elected to enterthe UK tonnage tax on a rolling 10-year term and, accordingly, reapply every year. Companies to which thetonnage tax regime applies pay corporation taxes on profits calculated by reference to the net tonnage ofqualifying ships. UK corporation tax is not chargeable under the normal UK tax rules on these brands’ relevantshipping income. Relevant shipping income includes income from the operation of qualifying ships and fromshipping related activities.
For a company to be eligible for the regime, it must be subject to UK corporation tax and, among other matters,operate qualifying ships that are strategically and commercially managed in the UK. Companies within UKtonnage tax are also subject to a seafarer training requirement.
Our UK non-shipping activities that do not qualify under the UK tonnage tax regime remain subject to normalUK corporation tax. Dividends received from subsidiaries of Carnival plc doing business outside the UK aregenerally exempt from UK corporation tax.
P&O Cruises (Australia) and all of the other cruise ships operated internationally by Carnival plc for the cruisesegment of the Australian vacation market are exempt from Australian corporation tax by virtue of the UK/Australian income tax treaty.
Italian and German Income Tax
In early 2015, Costa and AIDA will reelect to enter the Italian tonnage tax regime through 2024 and can reapplyfor an additional ten-year period beginning in early 2025. Companies to which the tonnage tax regime appliespay corporation taxes on shipping profits calculated by reference to the net tonnage of qualifying ships.
81

Most of Costa’s and AIDA’s earnings not considered to be shipping profits for Italian tonnage tax purposes willbe taxed at an effective tax rate of 5.5% under the Italian international shipping tax regime since all of their shipsare Italian registered.
Substantially all of AIDA’s earnings are exempt from Italian and German corporation tax by virtue of Italy/Germany income tax treaties.
Income and Other Taxes in Asian Countries
Substantially all of our brands’ income from their international operation in Asian countries is exempt from localcorporation tax by virtue of relevant income tax treaties.
U.S. and State Income Taxes
Our domestic U.S. operations, principally the hotel and transportation business of Holland America PrincessAlaska Tours, are subject to federal and state income taxation in the U.S.
Certain of the Company’s subsidiaries are subject to various U.S. state income taxes generally imposed on eachstate’s portion of the U.S. source income subject to U.S. federal income taxes. However, the state of Alaskaimposes an income tax on its allocated portion of the total income of our companies doing business in Alaska andcertain of their subsidiaries.
NOTE 5 - Dividends
The board of directors declared regular quarterly dividends for the first, second, third and fourth quarters at $0.25per share in 2014 and 2013, respectively. Our quarterly dividend declarations amounted to $54 million perquarter or an aggregate of $216 million in 2014 and $54 million, $54 million, $53 million and $54 million in thefirst, second, third and fourth quarters, respectively, or an aggregate of $215 million in 2013.
NOTE 6 - Earnings per Share
Our basic and diluted earnings per share were computed as follows (in millions, except per share data):
Years Ended November 30,2014 2013
(restated)
Net income for basic and diluted earnings per share . . . . . . . . . . . . . . . . . . . . . . . . . . . . . . . $ 743 $ 296
Weighted-average ordinary shares outstanding . . . . . . . . . . . . . . . . . . . . . . . . . . . . . . . . . . . . 215 215Dilutive effect of equity plans . . . . . . . . . . . . . . . . . . . . . . . . . . . . . . . . . . . . . . . . . . . . . . . . . . . . 1 1
Diluted weighted-average shares outstanding . . . . . . . . . . . . . . . . . . . . . . . . . . . . . . . . . . . . . 216 216
Basic earnings per share . . . . . . . . . . . . . . . . . . . . . . . . . . . . . . . . . . . . . . . . . . . . . . . . . . . . . . . . . . $3.45 $1.37
Diluted earnings per share . . . . . . . . . . . . . . . . . . . . . . . . . . . . . . . . . . . . . . . . . . . . . . . . . . . . . . . . $3.44 $1.37
As described in Note 1, Carnival Corporation and Carnival plc operate as a DLC. Under the contracts governingthe DLC arrangement, the Carnival Corporation & plc consolidated earnings accrue equally to each share ofCarnival Corporation common stock and each Carnival plc ordinary share. For this reason, the U.S. GAAPearnings per share for Carnival Corporation & plc are provided for information on page 66.
The weighted-average number of ordinary shares has been reduced for shares in the Company held by theCompany’s Employee Benefit Trust for the satisfaction of equity awards that have not vested unconditionally.These Employee Benefit Trust held shares do not receive any dividends.
The dilutive shares relate to ordinary shares to be issued on vesting of restricted stock units and performance-based share awards and the exercise of employee share options. Details of employee share-based compensationare discussed in Note 20.
82
Car
niva
lplc
Fin
anci
alSt
atem
ents
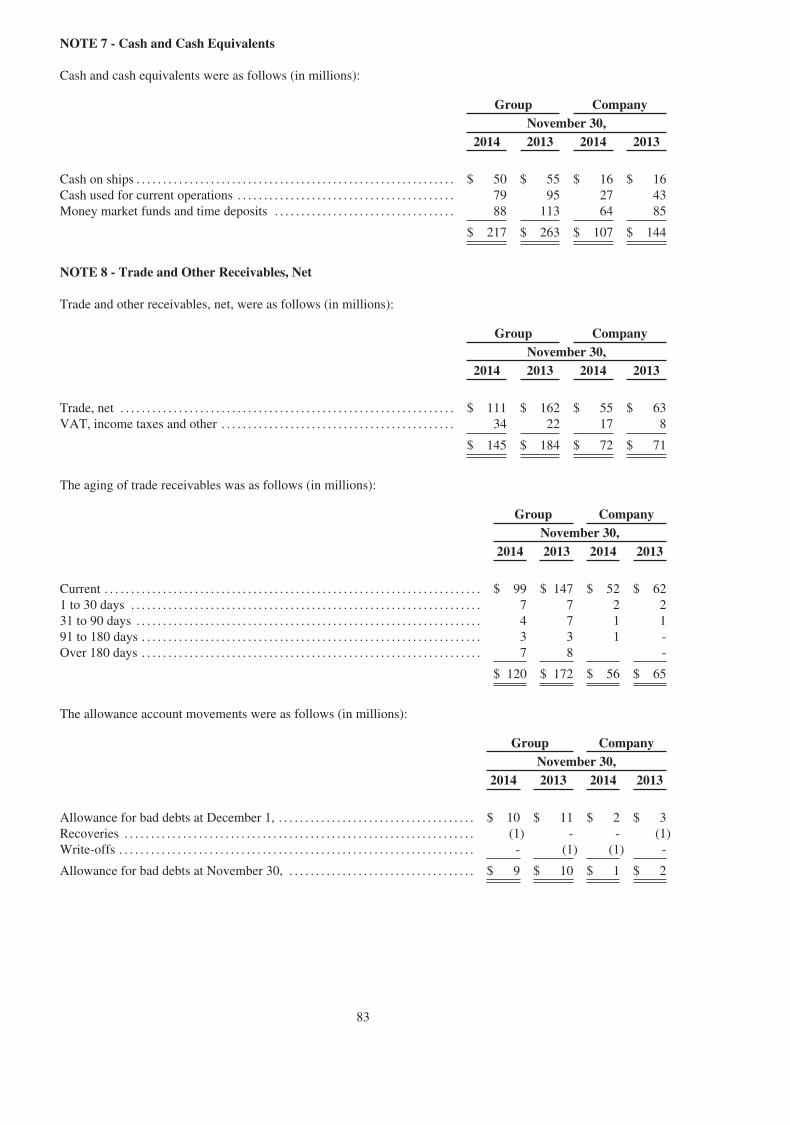
NOTE 7 - Cash and Cash Equivalents
Cash and cash equivalents were as follows (in millions):
Group CompanyNovember 30,
2014 2013 2014 2013
Cash on ships . . . . . . . . . . . . . . . . . . . . . . . . . . . . . . . . . . . . . . . . . . . . . . . . . . . . . . . . . . . . $ 50 $ 55 $ 16 $ 16Cash used for current operations . . . . . . . . . . . . . . . . . . . . . . . . . . . . . . . . . . . . . . . . . 79 95 27 43Money market funds and time deposits . . . . . . . . . . . . . . . . . . . . . . . . . . . . . . . . . . 88 113 64 85
$ 217 $ 263 $ 107 $ 144
NOTE 8 - Trade and Other Receivables, Net
Trade and other receivables, net, were as follows (in millions):
Group CompanyNovember 30,
2014 2013 2014 2013
Trade, net . . . . . . . . . . . . . . . . . . . . . . . . . . . . . . . . . . . . . . . . . . . . . . . . . . . . . . . . . . . . . . . $ 111 $ 162 $ 55 $ 63VAT, income taxes and other . . . . . . . . . . . . . . . . . . . . . . . . . . . . . . . . . . . . . . . . . . . . 34 22 17 8
$ 145 $ 184 $ 72 $ 71
The aging of trade receivables was as follows (in millions):
Group CompanyNovember 30,
2014 2013 2014 2013
Current . . . . . . . . . . . . . . . . . . . . . . . . . . . . . . . . . . . . . . . . . . . . . . . . . . . . . . . . . . . . . . . . . . . . . . . $ 99 $ 147 $ 52 $ 621 to 30 days . . . . . . . . . . . . . . . . . . . . . . . . . . . . . . . . . . . . . . . . . . . . . . . . . . . . . . . . . . . . . . . . . . 7 7 2 231 to 90 days . . . . . . . . . . . . . . . . . . . . . . . . . . . . . . . . . . . . . . . . . . . . . . . . . . . . . . . . . . . . . . . . . 4 7 1 191 to 180 days . . . . . . . . . . . . . . . . . . . . . . . . . . . . . . . . . . . . . . . . . . . . . . . . . . . . . . . . . . . . . . . . 3 3 1 -Over 180 days . . . . . . . . . . . . . . . . . . . . . . . . . . . . . . . . . . . . . . . . . . . . . . . . . . . . . . . . . . . . . . . . 7 8 -
$ 120 $ 172 $ 56 $ 65
The allowance account movements were as follows (in millions):
Group CompanyNovember 30,
2014 2013 2014 2013
Allowance for bad debts at December 1, . . . . . . . . . . . . . . . . . . . . . . . . . . . . . . . . . . . . . $ 10 $ 11 $ 2 $ 3Recoveries . . . . . . . . . . . . . . . . . . . . . . . . . . . . . . . . . . . . . . . . . . . . . . . . . . . . . . . . . . . . . . . . . . (1) - - (1)Write-offs . . . . . . . . . . . . . . . . . . . . . . . . . . . . . . . . . . . . . . . . . . . . . . . . . . . . . . . . . . . . . . . . . . . - (1) (1) -
Allowance for bad debts at November 30, . . . . . . . . . . . . . . . . . . . . . . . . . . . . . . . . . . . $ 9 $ 10 $ 1 $ 2
83

NOTE 9 - Inventories, Net
Inventories, net were as follows (in millions):
Group CompanyNovember 30,
2014 2013 2014 2013
Food and beverage provisions and hotel and restaurant products and supplies,net . . . . . . . . . . . . . . . . . . . . . . . . . . . . . . . . . . . . . . . . . . . . . . . . . . . . . . . . . . . . . . . . . . . . . . . . $ 73 $ 81 $ 24 $ 25
Fuel . . . . . . . . . . . . . . . . . . . . . . . . . . . . . . . . . . . . . . . . . . . . . . . . . . . . . . . . . . . . . . . . . . . . . . . . . 39 45 14 17Merchandise held for resale, net . . . . . . . . . . . . . . . . . . . . . . . . . . . . . . . . . . . . . . . . . . . . . 15 16 0 1
$ 127 $ 142 $ 38 $ 43
NOTE 10 - Property and Equipment
Property and equipment movements were as follows (in millions):
Group Company
Ships and shipimprovements
Otherproperty and
equipment TotalShips and shipimprovements
Otherproperty and
equipment Total
Cost at November 30, 2012 . . . . . . . . . . . . . . $16,928 $ 1,193 $18,121 $ 5,747 $ 89 $ 5,836Exchange movements . . . . . . . . . . . . . . . . . . . 557 52 609 - 7 7Additions . . . . . . . . . . . . . . . . . . . . . . . . . . . . . . . 615 114 729 145 8 153Disposals . . . . . . . . . . . . . . . . . . . . . . . . . . . . . . . (52) (18) (70) (32) (1) (33)
Cost at November 30, 2013 . . . . . . . . . . . . . . 18,048 1,341 19,389 5,860 103 5,963Exchange movements . . . . . . . . . . . . . . . . . . . (1,293) (85) (1,378) (272) (21) (293)Additions . . . . . . . . . . . . . . . . . . . . . . . . . . . . . . . 926 152 1,078 747 33 780Disposals . . . . . . . . . . . . . . . . . . . . . . . . . . . . . . . (141) (7) (148) (671) (2) (673)
Cost at November 30, 2014 . . . . . . . . . . . . . . $17,540 $ 1,401 $18,941 $ 5,664 $ 113 $ 5,777
Accumulated depreciation atNovember 30, 2012 . . . . . . . . . . . . . . . . . . . $ (3,654) $ (569) $ (4,223) $ (1,405) $ (43) $ (1,448)
Exchange movements . . . . . . . . . . . . . . . . . . . (53) (56) (109) 28 (2) 26Depreciation and amortisation . . . . . . . . . . . (569) (73) (642) (199) (10) (209)Impairments . . . . . . . . . . . . . . . . . . . . . . . . . . . . . (176) - (176) - - -Disposals . . . . . . . . . . . . . . . . . . . . . . . . . . . . . . . 46 18 64 27 2 29
Accumulated depreciation atNovember 30, 2013 . . . . . . . . . . . . . . . . . . . (4,406) (680) (5,086) (1,549) (53) (1,602)
Exchange movements . . . . . . . . . . . . . . . . . . . 305 77 382 80 7 87Depreciation and amortisation . . . . . . . . . . . (580) (85) (665) (206) (14) (220)Impairments (a) . . . . . . . . . . . . . . . . . . . . . . . . . (53) - (53) - - -Disposals . . . . . . . . . . . . . . . . . . . . . . . . . . . . . . . 135 5 140 20 2 22
Accumulated depreciation atNovember 30, 2014 . . . . . . . . . . . . . . . . . . . $ (4,599) $ (683) $ (5,282) $ (1,655) $ (58) $ (1,713)
Net book valueAt November 30, 2014 . . . . . . . . . . . . . . . . . . $12,941 $ 718 $13,659 $ 4,009 $ 55 $ 4,064
At November 30, 2013 . . . . . . . . . . . . . . . . . . $13,642 $ 661 $14,303 $ 4,311 $ 50 $ 4,361
(a) In November 2014, we entered into a bareboat charter/sale agreement under which the 1,440-passenger capacityGrand Holiday was chartered to an unrelated entity in January 2015 through March 2025. Under this agreement,ownership of Grand Holiday will be transferred to the buyer in March 2025. This transaction did not meet thecriteria to qualify as a finance lease and, accordingly, it will be accounted for as an operating lease whereby we willrecognize the charter revenue over the term of the agreement. As a result of this transaction, we performed a shipimpairment review and recognised a $31 million impairment charge during the fourth quarter of 2014. The
84
Car
niva
lplc
Fin
anci
alSt
atem
ents
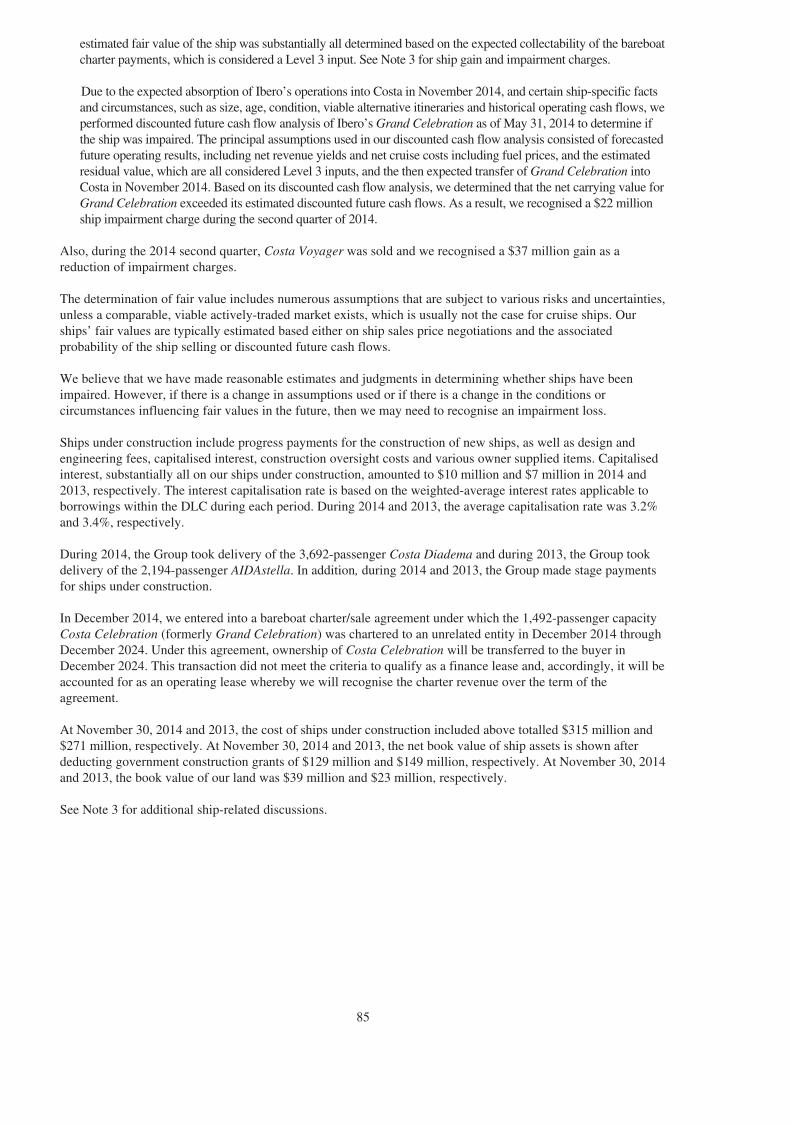
estimated fair value of the ship was substantially all determined based on the expected collectability of the bareboatcharter payments, which is considered a Level 3 input. See Note 3 for ship gain and impairment charges.
Due to the expected absorption of Ibero’s operations into Costa in November 2014, and certain ship-specific factsand circumstances, such as size, age, condition, viable alternative itineraries and historical operating cash flows, weperformed discounted future cash flow analysis of Ibero’s Grand Celebration as of May 31, 2014 to determine ifthe ship was impaired. The principal assumptions used in our discounted cash flow analysis consisted of forecastedfuture operating results, including net revenue yields and net cruise costs including fuel prices, and the estimatedresidual value, which are all considered Level 3 inputs, and the then expected transfer of Grand Celebration intoCosta in November 2014. Based on its discounted cash flow analysis, we determined that the net carrying value forGrand Celebration exceeded its estimated discounted future cash flows. As a result, we recognised a $22 millionship impairment charge during the second quarter of 2014.
Also, during the 2014 second quarter, Costa Voyager was sold and we recognised a $37 million gain as areduction of impairment charges.
The determination of fair value includes numerous assumptions that are subject to various risks and uncertainties,unless a comparable, viable actively-traded market exists, which is usually not the case for cruise ships. Ourships’ fair values are typically estimated based either on ship sales price negotiations and the associatedprobability of the ship selling or discounted future cash flows.
We believe that we have made reasonable estimates and judgments in determining whether ships have beenimpaired. However, if there is a change in assumptions used or if there is a change in the conditions orcircumstances influencing fair values in the future, then we may need to recognise an impairment loss.
Ships under construction include progress payments for the construction of new ships, as well as design andengineering fees, capitalised interest, construction oversight costs and various owner supplied items. Capitalisedinterest, substantially all on our ships under construction, amounted to $10 million and $7 million in 2014 and2013, respectively. The interest capitalisation rate is based on the weighted-average interest rates applicable toborrowings within the DLC during each period. During 2014 and 2013, the average capitalisation rate was 3.2%and 3.4%, respectively.
During 2014, the Group took delivery of the 3,692-passenger Costa Diadema and during 2013, the Group tookdelivery of the 2,194-passenger AIDAstella. In addition, during 2014 and 2013, the Group made stage paymentsfor ships under construction.
In December 2014, we entered into a bareboat charter/sale agreement under which the 1,492-passenger capacityCosta Celebration (formerly Grand Celebration) was chartered to an unrelated entity in December 2014 throughDecember 2024. Under this agreement, ownership of Costa Celebration will be transferred to the buyer inDecember 2024. This transaction did not meet the criteria to qualify as a finance lease and, accordingly, it will beaccounted for as an operating lease whereby we will recognise the charter revenue over the term of theagreement.
At November 30, 2014 and 2013, the cost of ships under construction included above totalled $315 million and$271 million, respectively. At November 30, 2014 and 2013, the net book value of ship assets is shown afterdeducting government construction grants of $129 million and $149 million, respectively. At November 30, 2014and 2013, the book value of our land was $39 million and $23 million, respectively.
See Note 3 for additional ship-related discussions.
85

NOTE 11 - Intangibles
Intangible movements were as follows (in millions):
Group CompanyGoodwill Trademarks Total Goodwill
At November 30, 2012 . . . . . . . . . . . . . . . . . . . . . . . . . . . . . . . . . . . . . . . $ 693 $ 13 $ 706 $ 176Ibero impairment charges (a) . . . . . . . . . . . . . . . . . . . . . . . . . . . . . . . . . - (13) (13) -Exchange movements . . . . . . . . . . . . . . . . . . . . . . . . . . . . . . . . . . . . . . . . 30 - 30 3
At November 30, 2013 . . . . . . . . . . . . . . . . . . . . . . . . . . . . . . . . . . . . . . . 723 - 723 179Exchange movements . . . . . . . . . . . . . . . . . . . . . . . . . . . . . . . . . . . . . . . . (54) - (54) (7)
At November 30, 2014 . . . . . . . . . . . . . . . . . . . . . . . . . . . . . . . . . . . . . . . $ 669 $ - $ 669 $ 172
(a) During 2013, we recognised a $13 million impairment loss to fully write-off Ibero’s trademarks’ carryingvalue.
At November 30, 2014 and 2013, all of our cruise brands carried goodwill, except for P&O Cruises (UK) andP&O Cruises (Australia), and the net book value of each of our CGUs’ or cruise brands’ goodwill balance was asfollows: AIDA, $143 million (2013 $157 million), Costa, $354 million (2013 $387 million) and Cunard $172million (2013 $179 million). As of July 31, 2014, we performed our annual goodwill impairment reviews toassess the recoverable amount of each cruise brand’s goodwill. For the impairment reviews, the estimatedrecoverable amounts were based on the higher of the cruise brands’ fair value less costs to sell and its value inuse. Recoverable amounts for our brands that carried goodwill were determined using the 10-year discountedfuture cash flow analysis. Our annual impairment reviews resulted in no goodwill impairments.
The principal assumptions, all of which are considered Level 3 inputs, used in our cash flow analyses relate toforecasting future operating results and are as follows:
- net revenue yields and net cruise costs including fuel prices;- capacity changes, including the expected deployment of vessels into, or out of, the cruise brands,
including, but not limited to, the new ships discussed in Note 22;- weighted-average cost of capital pre-tax discount rates, which ranged from 9.0% to 11.1% of market
participants, adjusted for the risk attributable to the geographic region in which the brands operate and- capital expenditures, terminal values and a range of 2.0% to 3.0% for long-term perpetuity growth
rates.
The cash flows were estimated based on those a market participant would expect to derive from the businesses.For all the cruise brands, we used relevant past experience in determining an estimate of future cash flows.
For AIDA we have significant headroom and based on the sensitivity analysis performed no reasonably possiblechanges in the assumptions would cause the carrying amount of the brands’ goodwill to exceed its recoverableamount.
The determination of our cruise brands’ goodwill recoverable amounts includes numerous assumptions that aresubject to various risks and uncertainties. We believe that we have made reasonable estimates and judgments indetermining whether our goodwill has been impaired. However, if there is a change in assumptions used or ifthere is a change in the conditions or circumstances influencing fair values in the future, then we may need torecognise an impairment charge.
The fair value of the Cunard goodwill currently exceeds the carrying value by more than $480 million. Changesin assumptions would cause the recoverable amount to fall below the carrying amount as follows:
- a reduction in the perpetuity growth rate after 10 years from an assumed increase of 2.5% compared toan assumed negative growth rate of 3.3% or
- an increase in the discount rate from the 9.0% assumption applied to a revised assumption of 11.4% ormore or
86
Car
niva
lplc
Fin
anci
alSt
atem
ents
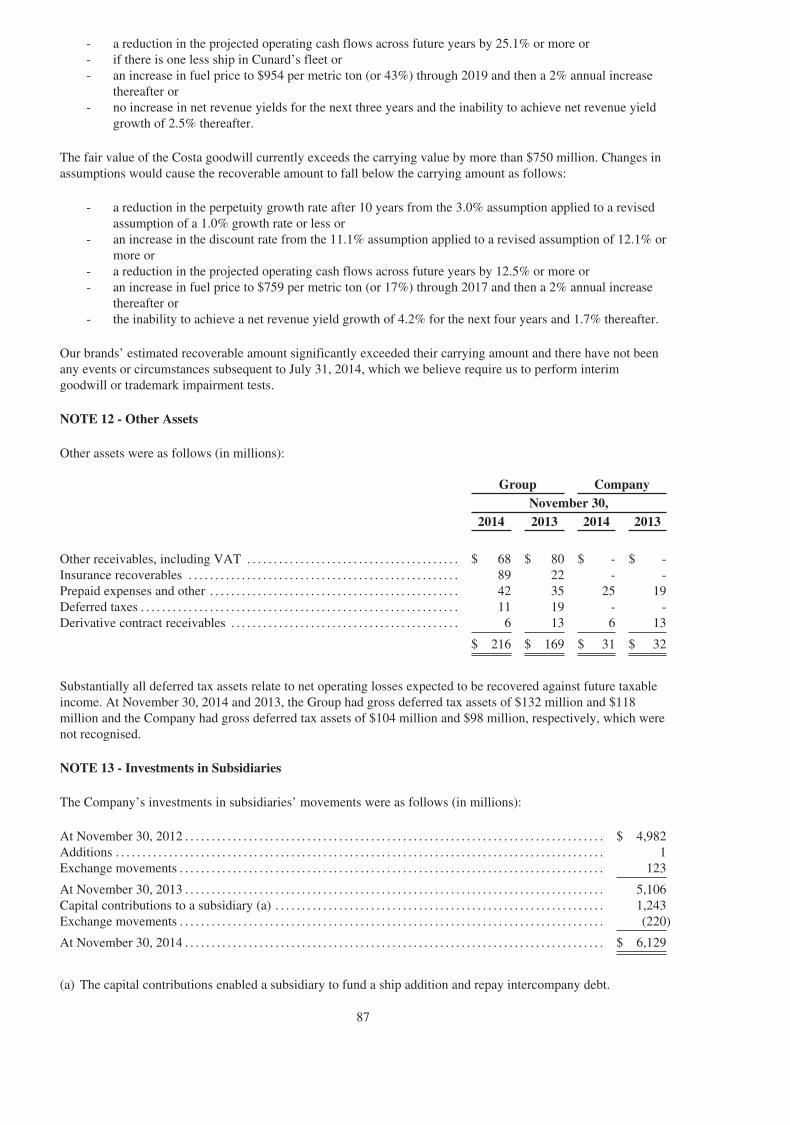
- a reduction in the projected operating cash flows across future years by 25.1% or more or- if there is one less ship in Cunard’s fleet or- an increase in fuel price to $954 per metric ton (or 43%) through 2019 and then a 2% annual increase
thereafter or- no increase in net revenue yields for the next three years and the inability to achieve net revenue yield
growth of 2.5% thereafter.
The fair value of the Costa goodwill currently exceeds the carrying value by more than $750 million. Changes inassumptions would cause the recoverable amount to fall below the carrying amount as follows:
- a reduction in the perpetuity growth rate after 10 years from the 3.0% assumption applied to a revisedassumption of a 1.0% growth rate or less or
- an increase in the discount rate from the 11.1% assumption applied to a revised assumption of 12.1% ormore or
- a reduction in the projected operating cash flows across future years by 12.5% or more or- an increase in fuel price to $759 per metric ton (or 17%) through 2017 and then a 2% annual increase
thereafter or- the inability to achieve a net revenue yield growth of 4.2% for the next four years and 1.7% thereafter.
Our brands’ estimated recoverable amount significantly exceeded their carrying amount and there have not beenany events or circumstances subsequent to July 31, 2014, which we believe require us to perform interimgoodwill or trademark impairment tests.
NOTE 12 - Other Assets
Other assets were as follows (in millions):
Group CompanyNovember 30,
2014 2013 2014 2013
Other receivables, including VAT . . . . . . . . . . . . . . . . . . . . . . . . . . . . . . . . . . . . . . . . $ 68 $ 80 $ - $ -Insurance recoverables . . . . . . . . . . . . . . . . . . . . . . . . . . . . . . . . . . . . . . . . . . . . . . . . . . . 89 22 - -Prepaid expenses and other . . . . . . . . . . . . . . . . . . . . . . . . . . . . . . . . . . . . . . . . . . . . . . . 42 35 25 19Deferred taxes . . . . . . . . . . . . . . . . . . . . . . . . . . . . . . . . . . . . . . . . . . . . . . . . . . . . . . . . . . . . 11 19 - -Derivative contract receivables . . . . . . . . . . . . . . . . . . . . . . . . . . . . . . . . . . . . . . . . . . . 6 13 6 13
$ 216 $ 169 $ 31 $ 32
Substantially all deferred tax assets relate to net operating losses expected to be recovered against future taxableincome. At November 30, 2014 and 2013, the Group had gross deferred tax assets of $132 million and $118million and the Company had gross deferred tax assets of $104 million and $98 million, respectively, which werenot recognised.
NOTE 13 - Investments in Subsidiaries
The Company’s investments in subsidiaries’ movements were as follows (in millions):
At November 30, 2012 . . . . . . . . . . . . . . . . . . . . . . . . . . . . . . . . . . . . . . . . . . . . . . . . . . . . . . . . . . . . . . . . . . . . . . . . . . . . . . . $ 4,982Additions . . . . . . . . . . . . . . . . . . . . . . . . . . . . . . . . . . . . . . . . . . . . . . . . . . . . . . . . . . . . . . . . . . . . . . . . . . . . . . . . . . . . . . . . . . . . 1Exchange movements . . . . . . . . . . . . . . . . . . . . . . . . . . . . . . . . . . . . . . . . . . . . . . . . . . . . . . . . . . . . . . . . . . . . . . . . . . . . . . . . 123
At November 30, 2013 . . . . . . . . . . . . . . . . . . . . . . . . . . . . . . . . . . . . . . . . . . . . . . . . . . . . . . . . . . . . . . . . . . . . . . . . . . . . . . . 5,106Capital contributions to a subsidiary (a) . . . . . . . . . . . . . . . . . . . . . . . . . . . . . . . . . . . . . . . . . . . . . . . . . . . . . . . . . . . . . . 1,243Exchange movements . . . . . . . . . . . . . . . . . . . . . . . . . . . . . . . . . . . . . . . . . . . . . . . . . . . . . . . . . . . . . . . . . . . . . . . . . . . . . . . . (220)
At November 30, 2014 . . . . . . . . . . . . . . . . . . . . . . . . . . . . . . . . . . . . . . . . . . . . . . . . . . . . . . . . . . . . . . . . . . . . . . . . . . . . . . . $ 6,129
(a) The capital contributions enabled a subsidiary to fund a ship addition and repay intercompany debt.
87

We have taken advantage of section 410(2) of the Companies Act 2006 to provide information only in relation toour principal subsidiary undertakings, which are the subsidiary undertakings whose results or financial position,in the opinion of our directors, principally affect the amounts shown in these Group consolidated IFRS financialstatements. At November 30, 2014, the Company’s principal operating subsidiary was Costa Crociere S.p.A.,which is incorporated in Italy and is 99.97% directly owned by the Company, and principally affects the figuresshown in the Group financial statements. This subsidiary owns and operates the Costa and AIDA cruise brandsand through November 2014, the Ibero cruise brand. P&O Cruises (UK), P&O Cruises (Australia), Cunard andthe leased ships of Princess and Carnival Cruise Line brands are divisions of the Company, whereas AIDA is abranch of Costa. The full information for all our subsidiary undertakings will be annexed to our next annualreturn made to the UK Registrar of Companies.
The following wholly owned UK subsidiaries are exempt from the requirement to prepare individual auditedaccounts or individual accounts (as further specified below) for the year ended November 30, 2014:
CompanyCompanies House
Registration Number
P&O Princess Cruises International Limited (a) . . . . . . . . . . . . . . . . . . . . . . . . . . . . . . . . . . . . . . . . . 03902746SeaVacations Limited (a) . . . . . . . . . . . . . . . . . . . . . . . . . . . . . . . . . . . . . . . . . . . . . . . . . . . . . . . . . . . . . . . 03681272SeaVacations UK Limited (a) . . . . . . . . . . . . . . . . . . . . . . . . . . . . . . . . . . . . . . . . . . . . . . . . . . . . . . . . . . 03633566Carnival (UK) Limited (b) . . . . . . . . . . . . . . . . . . . . . . . . . . . . . . . . . . . . . . . . . . . . . . . . . . . . . . . . . . . . . . 03141044Costa Cruise Lines UK Limited (b) . . . . . . . . . . . . . . . . . . . . . . . . . . . . . . . . . . . . . . . . . . . . . . . . . . . . . 02482631P&O Princess American Holdings (b) . . . . . . . . . . . . . . . . . . . . . . . . . . . . . . . . . . . . . . . . . . . . . . . . . . 01453164P&O Princess Cruises Pension Trustee Limited (b) . . . . . . . . . . . . . . . . . . . . . . . . . . . . . . . . . . . . . 04069014P&O Travel Limited (b) . . . . . . . . . . . . . . . . . . . . . . . . . . . . . . . . . . . . . . . . . . . . . . . . . . . . . . . . . . . . . . . . 00773151
(a) Exempt from preparing individual audited accounts by virtue of Section 479A of the Companies Act 2006.(b) Exempt from preparing individual accounts by virtue of Section 394A of the Companies Act 2006 and from
filing individual accounts by virtue of section 448 of the Companies Act 2006.
In order to obtain the above exemptions, the Company has guaranteed the outstanding liabilities to which each ofthe above companies is subject at November 30, 2014.
88
Car
niva
lplc
Fin
anci
alSt
atem
ents
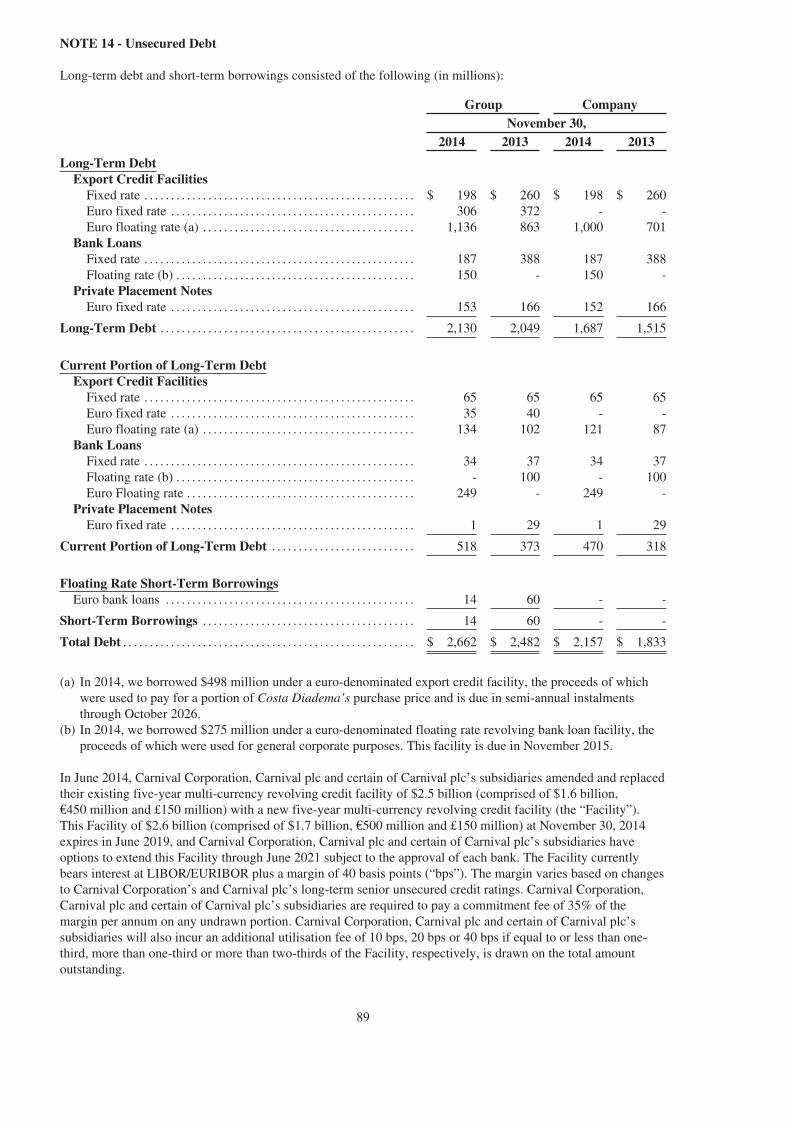
NOTE 14 - Unsecured Debt
Long-term debt and short-term borrowings consisted of the following (in millions):
Group CompanyNovember 30,
2014 2013 2014 2013
Long-Term DebtExport Credit Facilities
Fixed rate . . . . . . . . . . . . . . . . . . . . . . . . . . . . . . . . . . . . . . . . . . . . . . . . . . . $ 198 $ 260 $ 198 $ 260Euro fixed rate . . . . . . . . . . . . . . . . . . . . . . . . . . . . . . . . . . . . . . . . . . . . . . 306 372 - -Euro floating rate (a) . . . . . . . . . . . . . . . . . . . . . . . . . . . . . . . . . . . . . . . . 1,136 863 1,000 701
Bank LoansFixed rate . . . . . . . . . . . . . . . . . . . . . . . . . . . . . . . . . . . . . . . . . . . . . . . . . . . 187 388 187 388Floating rate (b) . . . . . . . . . . . . . . . . . . . . . . . . . . . . . . . . . . . . . . . . . . . . . 150 - 150 -
Private Placement NotesEuro fixed rate . . . . . . . . . . . . . . . . . . . . . . . . . . . . . . . . . . . . . . . . . . . . . . 153 166 152 166
Long-Term Debt . . . . . . . . . . . . . . . . . . . . . . . . . . . . . . . . . . . . . . . . . . . . . . . . 2,130 2,049 1,687 1,515
Current Portion of Long-Term DebtExport Credit Facilities
Fixed rate . . . . . . . . . . . . . . . . . . . . . . . . . . . . . . . . . . . . . . . . . . . . . . . . . . . 65 65 65 65Euro fixed rate . . . . . . . . . . . . . . . . . . . . . . . . . . . . . . . . . . . . . . . . . . . . . . 35 40 - -Euro floating rate (a) . . . . . . . . . . . . . . . . . . . . . . . . . . . . . . . . . . . . . . . . 134 102 121 87
Bank LoansFixed rate . . . . . . . . . . . . . . . . . . . . . . . . . . . . . . . . . . . . . . . . . . . . . . . . . . . 34 37 34 37Floating rate (b) . . . . . . . . . . . . . . . . . . . . . . . . . . . . . . . . . . . . . . . . . . . . . - 100 - 100Euro Floating rate . . . . . . . . . . . . . . . . . . . . . . . . . . . . . . . . . . . . . . . . . . . 249 - 249 -
Private Placement NotesEuro fixed rate . . . . . . . . . . . . . . . . . . . . . . . . . . . . . . . . . . . . . . . . . . . . . . 1 29 1 29
Current Portion of Long-Term Debt . . . . . . . . . . . . . . . . . . . . . . . . . . . 518 373 470 318
Floating Rate Short-Term BorrowingsEuro bank loans . . . . . . . . . . . . . . . . . . . . . . . . . . . . . . . . . . . . . . . . . . . . . . . 14 60 - -
Short-Term Borrowings . . . . . . . . . . . . . . . . . . . . . . . . . . . . . . . . . . . . . . . . 14 60 - -
Total Debt . . . . . . . . . . . . . . . . . . . . . . . . . . . . . . . . . . . . . . . . . . . . . . . . . . . . . . . $ 2,662 $ 2,482 $ 2,157 $ 1,833
(a) In 2014, we borrowed $498 million under a euro-denominated export credit facility, the proceeds of whichwere used to pay for a portion of Costa Diadema’s purchase price and is due in semi-annual instalmentsthrough October 2026.
(b) In 2014, we borrowed $275 million under a euro-denominated floating rate revolving bank loan facility, theproceeds of which were used for general corporate purposes. This facility is due in November 2015.
In June 2014, Carnival Corporation, Carnival plc and certain of Carnival plc’s subsidiaries amended and replacedtheir existing five-year multi-currency revolving credit facility of $2.5 billion (comprised of $1.6 billion,€450 million and £150 million) with a new five-year multi-currency revolving credit facility (the “Facility”).This Facility of $2.6 billion (comprised of $1.7 billion, €500 million and £150 million) at November 30, 2014expires in June 2019, and Carnival Corporation, Carnival plc and certain of Carnival plc’s subsidiaries haveoptions to extend this Facility through June 2021 subject to the approval of each bank. The Facility currentlybears interest at LIBOR/EURIBOR plus a margin of 40 basis points (“bps”). The margin varies based on changesto Carnival Corporation’s and Carnival plc’s long-term senior unsecured credit ratings. Carnival Corporation,Carnival plc and certain of Carnival plc’s subsidiaries are required to pay a commitment fee of 35% of themargin per annum on any undrawn portion. Carnival Corporation, Carnival plc and certain of Carnival plc’ssubsidiaries will also incur an additional utilisation fee of 10 bps, 20 bps or 40 bps if equal to or less than one-third, more than one-third or more than two-thirds of the Facility, respectively, is drawn on the total amountoutstanding.
89
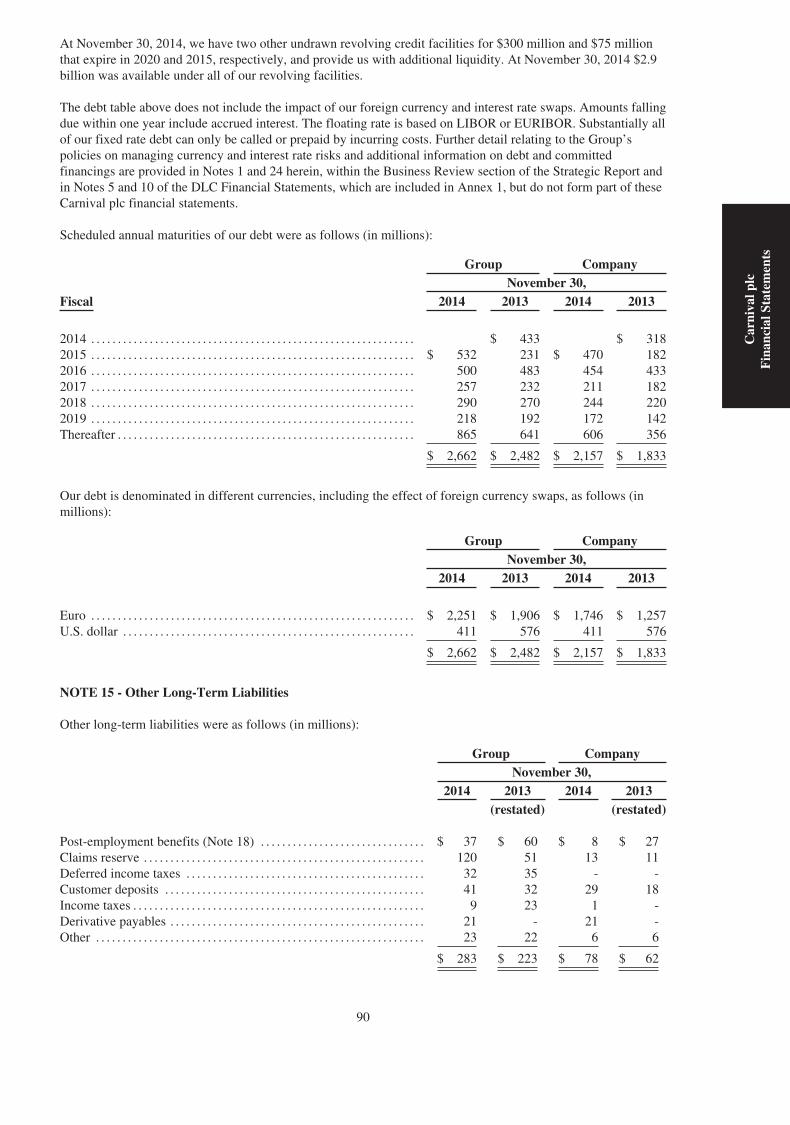
At November 30, 2014, we have two other undrawn revolving credit facilities for $300 million and $75 millionthat expire in 2020 and 2015, respectively, and provide us with additional liquidity. At November 30, 2014 $2.9billion was available under all of our revolving facilities.
The debt table above does not include the impact of our foreign currency and interest rate swaps. Amounts fallingdue within one year include accrued interest. The floating rate is based on LIBOR or EURIBOR. Substantially allof our fixed rate debt can only be called or prepaid by incurring costs. Further detail relating to the Group’spolicies on managing currency and interest rate risks and additional information on debt and committedfinancings are provided in Notes 1 and 24 herein, within the Business Review section of the Strategic Report andin Notes 5 and 10 of the DLC Financial Statements, which are included in Annex 1, but do not form part of theseCarnival plc financial statements.
Scheduled annual maturities of our debt were as follows (in millions):
Group CompanyNovember 30,
Fiscal 2014 2013 2014 2013
2014 . . . . . . . . . . . . . . . . . . . . . . . . . . . . . . . . . . . . . . . . . . . . . . . . . . . . . . . . . . . . . $ 433 $ 3182015 . . . . . . . . . . . . . . . . . . . . . . . . . . . . . . . . . . . . . . . . . . . . . . . . . . . . . . . . . . . . . $ 532 231 $ 470 1822016 . . . . . . . . . . . . . . . . . . . . . . . . . . . . . . . . . . . . . . . . . . . . . . . . . . . . . . . . . . . . . 500 483 454 4332017 . . . . . . . . . . . . . . . . . . . . . . . . . . . . . . . . . . . . . . . . . . . . . . . . . . . . . . . . . . . . . 257 232 211 1822018 . . . . . . . . . . . . . . . . . . . . . . . . . . . . . . . . . . . . . . . . . . . . . . . . . . . . . . . . . . . . . 290 270 244 2202019 . . . . . . . . . . . . . . . . . . . . . . . . . . . . . . . . . . . . . . . . . . . . . . . . . . . . . . . . . . . . . 218 192 172 142Thereafter . . . . . . . . . . . . . . . . . . . . . . . . . . . . . . . . . . . . . . . . . . . . . . . . . . . . . . . . 865 641 606 356
$ 2,662 $ 2,482 $ 2,157 $ 1,833
Our debt is denominated in different currencies, including the effect of foreign currency swaps, as follows (inmillions):
Group CompanyNovember 30,
2014 2013 2014 2013
Euro . . . . . . . . . . . . . . . . . . . . . . . . . . . . . . . . . . . . . . . . . . . . . . . . . . . . . . . . . . . . . $ 2,251 $ 1,906 $ 1,746 $ 1,257U.S. dollar . . . . . . . . . . . . . . . . . . . . . . . . . . . . . . . . . . . . . . . . . . . . . . . . . . . . . . . 411 576 411 576
$ 2,662 $ 2,482 $ 2,157 $ 1,833
NOTE 15 - Other Long-Term Liabilities
Other long-term liabilities were as follows (in millions):
Group CompanyNovember 30,
2014 2013 2014 2013(restated) (restated)
Post-employment benefits (Note 18) . . . . . . . . . . . . . . . . . . . . . . . . . . . . . . . $ 37 $ 60 $ 8 $ 27Claims reserve . . . . . . . . . . . . . . . . . . . . . . . . . . . . . . . . . . . . . . . . . . . . . . . . . . . . . 120 51 13 11Deferred income taxes . . . . . . . . . . . . . . . . . . . . . . . . . . . . . . . . . . . . . . . . . . . . . 32 35 - -Customer deposits . . . . . . . . . . . . . . . . . . . . . . . . . . . . . . . . . . . . . . . . . . . . . . . . . 41 32 29 18Income taxes . . . . . . . . . . . . . . . . . . . . . . . . . . . . . . . . . . . . . . . . . . . . . . . . . . . . . . . 9 23 1 -Derivative payables . . . . . . . . . . . . . . . . . . . . . . . . . . . . . . . . . . . . . . . . . . . . . . . . 21 - 21 -Other . . . . . . . . . . . . . . . . . . . . . . . . . . . . . . . . . . . . . . . . . . . . . . . . . . . . . . . . . . . . . . 23 22 6 6
$ 283 $ 223 $ 78 $ 62
90
Car
niva
lplc
Fin
anci
alSt
atem
ents
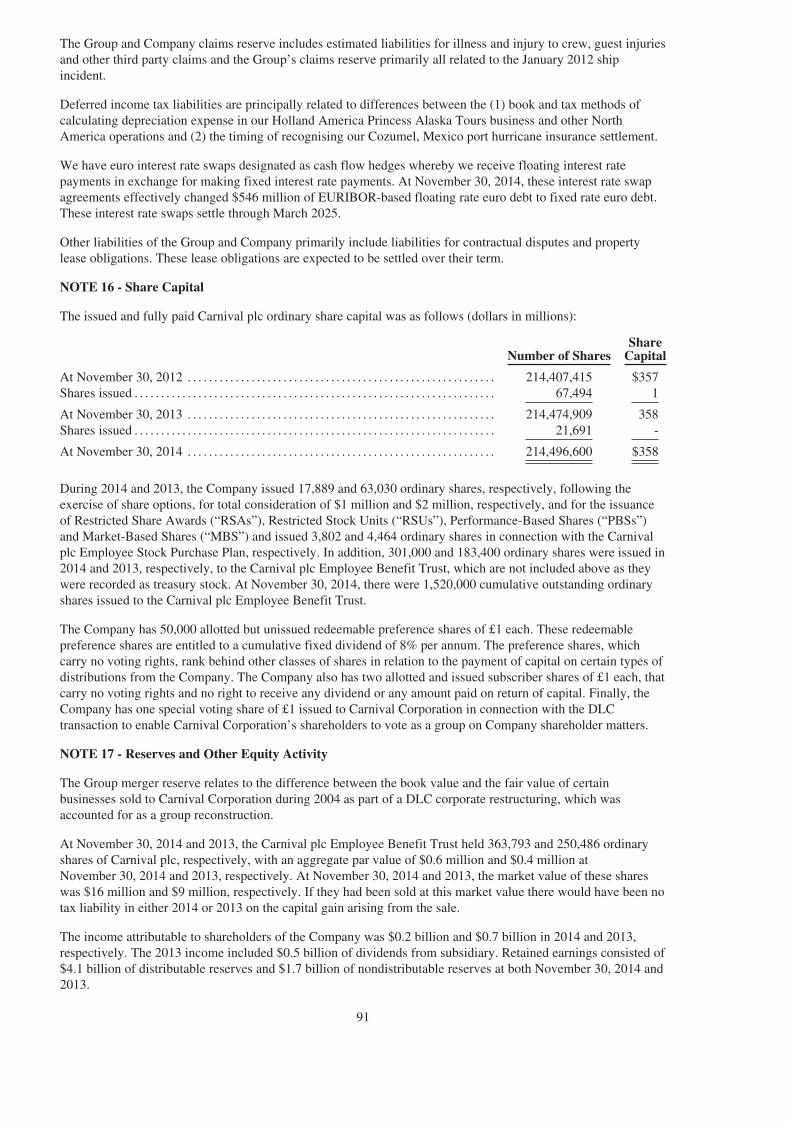
The Group and Company claims reserve includes estimated liabilities for illness and injury to crew, guest injuriesand other third party claims and the Group’s claims reserve primarily all related to the January 2012 shipincident.
Deferred income tax liabilities are principally related to differences between the (1) book and tax methods ofcalculating depreciation expense in our Holland America Princess Alaska Tours business and other NorthAmerica operations and (2) the timing of recognising our Cozumel, Mexico port hurricane insurance settlement.
We have euro interest rate swaps designated as cash flow hedges whereby we receive floating interest ratepayments in exchange for making fixed interest rate payments. At November 30, 2014, these interest rate swapagreements effectively changed $546 million of EURIBOR-based floating rate euro debt to fixed rate euro debt.These interest rate swaps settle through March 2025.
Other liabilities of the Group and Company primarily include liabilities for contractual disputes and propertylease obligations. These lease obligations are expected to be settled over their term.
NOTE 16 - Share Capital
The issued and fully paid Carnival plc ordinary share capital was as follows (dollars in millions):
Number of SharesShare
Capital
At November 30, 2012 . . . . . . . . . . . . . . . . . . . . . . . . . . . . . . . . . . . . . . . . . . . . . . . . . . . . . . . . . . 214,407,415 $357Shares issued . . . . . . . . . . . . . . . . . . . . . . . . . . . . . . . . . . . . . . . . . . . . . . . . . . . . . . . . . . . . . . . . . . . . 67,494 1
At November 30, 2013 . . . . . . . . . . . . . . . . . . . . . . . . . . . . . . . . . . . . . . . . . . . . . . . . . . . . . . . . . . 214,474,909 358Shares issued . . . . . . . . . . . . . . . . . . . . . . . . . . . . . . . . . . . . . . . . . . . . . . . . . . . . . . . . . . . . . . . . . . . . 21,691 -
At November 30, 2014 . . . . . . . . . . . . . . . . . . . . . . . . . . . . . . . . . . . . . . . . . . . . . . . . . . . . . . . . . . 214,496,600 $358
During 2014 and 2013, the Company issued 17,889 and 63,030 ordinary shares, respectively, following theexercise of share options, for total consideration of $1 million and $2 million, respectively, and for the issuanceof Restricted Share Awards (“RSAs”), Restricted Stock Units (“RSUs”), Performance-Based Shares (“PBSs”)and Market-Based Shares (“MBS”) and issued 3,802 and 4,464 ordinary shares in connection with the Carnivalplc Employee Stock Purchase Plan, respectively. In addition, 301,000 and 183,400 ordinary shares were issued in2014 and 2013, respectively, to the Carnival plc Employee Benefit Trust, which are not included above as theywere recorded as treasury stock. At November 30, 2014, there were 1,520,000 cumulative outstanding ordinaryshares issued to the Carnival plc Employee Benefit Trust.
The Company has 50,000 allotted but unissued redeemable preference shares of £1 each. These redeemablepreference shares are entitled to a cumulative fixed dividend of 8% per annum. The preference shares, whichcarry no voting rights, rank behind other classes of shares in relation to the payment of capital on certain types ofdistributions from the Company. The Company also has two allotted and issued subscriber shares of £1 each, thatcarry no voting rights and no right to receive any dividend or any amount paid on return of capital. Finally, theCompany has one special voting share of £1 issued to Carnival Corporation in connection with the DLCtransaction to enable Carnival Corporation’s shareholders to vote as a group on Company shareholder matters.
NOTE 17 - Reserves and Other Equity Activity
The Group merger reserve relates to the difference between the book value and the fair value of certainbusinesses sold to Carnival Corporation during 2004 as part of a DLC corporate restructuring, which wasaccounted for as a group reconstruction.
At November 30, 2014 and 2013, the Carnival plc Employee Benefit Trust held 363,793 and 250,486 ordinaryshares of Carnival plc, respectively, with an aggregate par value of $0.6 million and $0.4 million atNovember 30, 2014 and 2013, respectively. At November 30, 2014 and 2013, the market value of these shareswas $16 million and $9 million, respectively. If they had been sold at this market value there would have been notax liability in either 2014 or 2013 on the capital gain arising from the sale.
The income attributable to shareholders of the Company was $0.2 billion and $0.7 billion in 2014 and 2013,respectively. The 2013 income included $0.5 billion of dividends from subsidiary. Retained earnings consisted of$4.1 billion of distributable reserves and $1.7 billion of nondistributable reserves at both November 30, 2014 and2013.
91

Our board of directors have authorised, subject to certain restrictions, the repurchase of up to an aggregate of$1.0 billion of Carnival plc ordinary shares and/or Carnival Corporation common stock (the “RepurchaseProgram”). The Repurchase Program does not have an expiration date and may be discontinued by the boards ofdirectors at any time. During 2014 and 2013, there were no repurchases of Carnival plc ordinary shares under theRepurchase Program. Since March 2013, the remaining availability under the Repurchase Program has been$975 million.
In addition to the Repurchase Program, the board of directors authorised, in October 2008, the repurchase of upto 19.2 million Carnival plc ordinary shares and, in January 2013, the repurchase of up to 32.8 million ofCarnival Corporation common stock under the Stock Swap Programs described below. Depending on marketconditions and other factors, we may repurchase shares of Carnival Corporation common stock and/or Carnivalplc ordinary shares under the Repurchase Program and Stock Swap Programs concurrently. CarnivalCorporation & plc use the Stock Swap Programs in situations where it can obtain an economic benefit becauseeither Carnival Corporation common stock or Carnival plc ordinary shares are trading at a price that is at apremium or discount to the price of Carnival plc ordinary shares or Carnival Corporation common stock, as thecase may be. Any realized economic benefit under the Stock Swap Programs is used for general corporatepurposes, which could include repurchasing additional stock under the Repurchase Program. During 2014, noCarnival Corporation common stock or Carnival plc ordinary shares were sold or repurchased under the StockSwap Programs. During 2013, Carnival Investments Limited, a subsidiary of Carnival Corporation, sold0.9 million of Carnival plc ordinary shares for net proceeds of $35 million. Substantially all of the net proceedsfrom these sales were used to repurchase 0.9 million shares of Carnival Corporation common stock. Pursuant toour Stock Swap Programs, Carnival Corporation sold these Carnival plc ordinary shares owned by CarnivalInvestments Limited only to the extent it was able to repurchase shares of Carnival Corporation common stock inthe U.S. market on at least an equivalent basis. At February 20, 2015, the remaining availability under the StockSwap Programs was 18.1 million Carnival plc ordinary shares and 32.0 million shares of Carnival Corporationcommon stock.
Finally, the Carnival plc ordinary share repurchases under both the Repurchase Program and the Stock SwapPrograms require annual shareholder approval. The existing shareholder approval is limited to a maximum of21.5 million ordinary shares and is valid until the earlier of the conclusion of the Carnival plc 2015 annualgeneral meeting or October 16, 2015.
See the Statements of Changes in Shareholders’ Equity for movements in capital and other reserves.
NOTE 18 - Post-Employment Benefits
Employee Benefit Plans
Carnival plc is a contributing employer to three defined benefit pension plans: the P&O Princess Cruises (UK)Pension Scheme (“Company’s UK Plan”), the multiemployer Merchant Navy Officers Pension Fund(“MNOPF”) and the multiemployer Merchant Navy Ratings Pension Fund (“MNRPF”). The defined benefitplans are formally valued triennially by independent qualified actuaries. The valuations for these plans have beencarried out at regular intervals, as required by the applicable UK regulations.
The Company’s UK Plan’s assets are managed on behalf of the trustee by independent fund managers. TheCompany’s UK Plan is closed to new membership.
The MNOPF is a funded defined benefit multiemployer plan in which British officers employed by companieswithin the Group have participated and continue to participate. The MNOPF is divided into two sections, the“New Section” and the “Old Section”, each of which covers a different group of participants, with the OldSection closed to further benefit accrual and to new membership and the New Section is only closed to newmembership. The MNOPF is accounted for as a defined benefit plan. Based on the most recent actuarial reviewof the New Section at March 31, 2014, it was determined that this plan was 87% funded and the deficits are to berecovered through funding contributions from participating employers.
The Old Section covers predecessor employers’ officers employed prior to 1978 and is fully funded. InDecember 2012, the fund’s trustee completed a buy-in of the Old Section liabilities with a third-party insurer,whereby the insurer will pay the officers’ pension liabilities as they become due. Therefore, we believe ourobligation to share in any future funding is remote.
92
Car
niva
lplc
Fin
anci
alSt
atem
ents
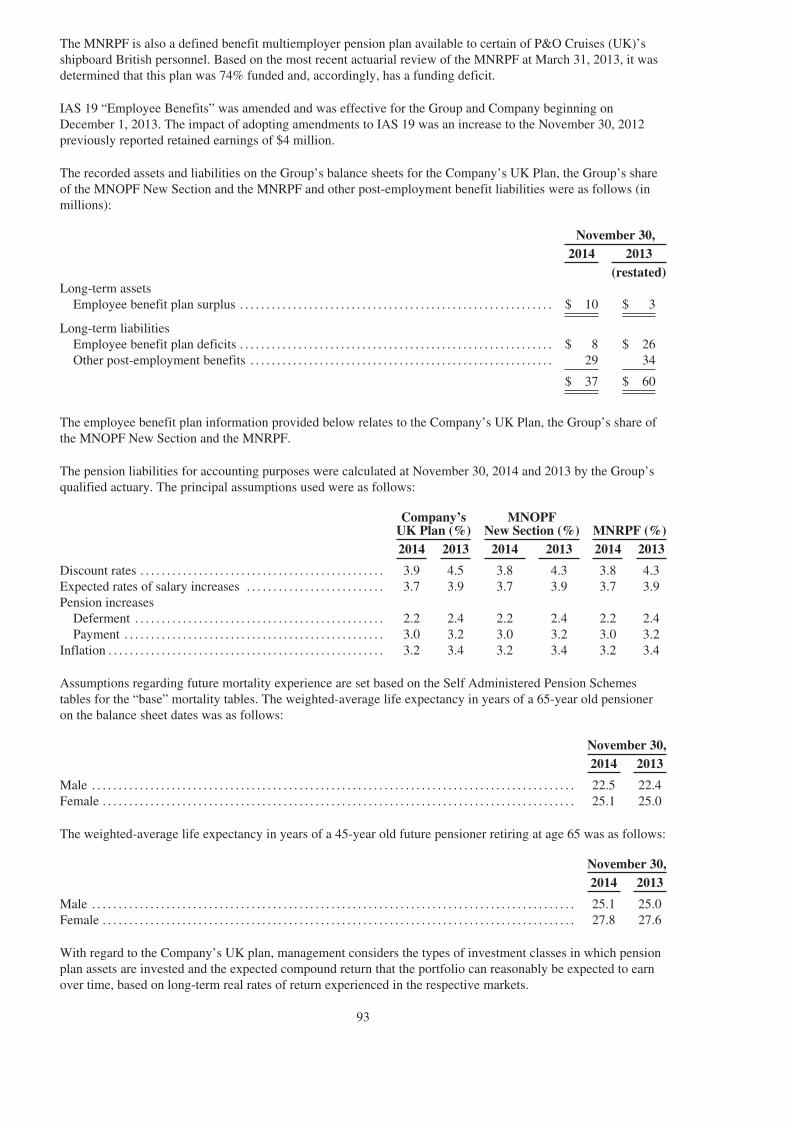
The MNRPF is also a defined benefit multiemployer pension plan available to certain of P&O Cruises (UK)’sshipboard British personnel. Based on the most recent actuarial review of the MNRPF at March 31, 2013, it wasdetermined that this plan was 74% funded and, accordingly, has a funding deficit.
IAS 19 “Employee Benefits” was amended and was effective for the Group and Company beginning onDecember 1, 2013. The impact of adopting amendments to IAS 19 was an increase to the November 30, 2012previously reported retained earnings of $4 million.
The recorded assets and liabilities on the Group’s balance sheets for the Company’s UK Plan, the Group’s shareof the MNOPF New Section and the MNRPF and other post-employment benefit liabilities were as follows (inmillions):
November 30,2014 2013
(restated)Long-term assets
Employee benefit plan surplus . . . . . . . . . . . . . . . . . . . . . . . . . . . . . . . . . . . . . . . . . . . . . . . . . . . . . . . . . . . $ 10 $ 3
Long-term liabilitiesEmployee benefit plan deficits . . . . . . . . . . . . . . . . . . . . . . . . . . . . . . . . . . . . . . . . . . . . . . . . . . . . . . . . . . . $ 8 $ 26Other post-employment benefits . . . . . . . . . . . . . . . . . . . . . . . . . . . . . . . . . . . . . . . . . . . . . . . . . . . . . . . . . 29 34
$ 37 $ 60
The employee benefit plan information provided below relates to the Company’s UK Plan, the Group’s share ofthe MNOPF New Section and the MNRPF.
The pension liabilities for accounting purposes were calculated at November 30, 2014 and 2013 by the Group’squalified actuary. The principal assumptions used were as follows:
Company’sUK Plan (%)
MNOPFNew Section (%) MNRPF (%)
2014 2013 2014 2013 2014 2013
Discount rates . . . . . . . . . . . . . . . . . . . . . . . . . . . . . . . . . . . . . . . . . . . . . . 3.9 4.5 3.8 4.3 3.8 4.3Expected rates of salary increases . . . . . . . . . . . . . . . . . . . . . . . . . . 3.7 3.9 3.7 3.9 3.7 3.9Pension increases
Deferment . . . . . . . . . . . . . . . . . . . . . . . . . . . . . . . . . . . . . . . . . . . . . . . 2.2 2.4 2.2 2.4 2.2 2.4Payment . . . . . . . . . . . . . . . . . . . . . . . . . . . . . . . . . . . . . . . . . . . . . . . . . 3.0 3.2 3.0 3.2 3.0 3.2
Inflation . . . . . . . . . . . . . . . . . . . . . . . . . . . . . . . . . . . . . . . . . . . . . . . . . . . . 3.2 3.4 3.2 3.4 3.2 3.4
Assumptions regarding future mortality experience are set based on the Self Administered Pension Schemestables for the “base” mortality tables. The weighted-average life expectancy in years of a 65-year old pensioneron the balance sheet dates was as follows:
November 30,2014 2013
Male . . . . . . . . . . . . . . . . . . . . . . . . . . . . . . . . . . . . . . . . . . . . . . . . . . . . . . . . . . . . . . . . . . . . . . . . . . . . . . . . . . . . . . . . . . . 22.5 22.4Female . . . . . . . . . . . . . . . . . . . . . . . . . . . . . . . . . . . . . . . . . . . . . . . . . . . . . . . . . . . . . . . . . . . . . . . . . . . . . . . . . . . . . . . . . 25.1 25.0
The weighted-average life expectancy in years of a 45-year old future pensioner retiring at age 65 was as follows:
November 30,2014 2013
Male . . . . . . . . . . . . . . . . . . . . . . . . . . . . . . . . . . . . . . . . . . . . . . . . . . . . . . . . . . . . . . . . . . . . . . . . . . . . . . . . . . . . . . . . . . . 25.1 25.0Female . . . . . . . . . . . . . . . . . . . . . . . . . . . . . . . . . . . . . . . . . . . . . . . . . . . . . . . . . . . . . . . . . . . . . . . . . . . . . . . . . . . . . . . . . 27.8 27.6
With regard to the Company’s UK plan, management considers the types of investment classes in which pensionplan assets are invested and the expected compound return that the portfolio can reasonably be expected to earnover time, based on long-term real rates of return experienced in the respective markets.
93
The amounts recognised in the balance sheets for these plans were determined as follows (in millions):
November 30,2014 2013
(restated)
Present value of obligations . . . . . . . . . . . . . . . . . . . . . . . . . . . . . . . . . . . . . . . . . . . . . . . . . . . . . . . . . . . . . . . $ (572) $ (543)Fair value of plans’ assets . . . . . . . . . . . . . . . . . . . . . . . . . . . . . . . . . . . . . . . . . . . . . . . . . . . . . . . . . . . . . . . . . 583 537
Net assets (liabilities) before restriction on assets . . . . . . . . . . . . . . . . . . . . . . . . . . . . . . . . . . . . . . . . . . 11 (6)
Restriction on assets . . . . . . . . . . . . . . . . . . . . . . . . . . . . . . . . . . . . . . . . . . . . . . . . . . . . . . . . . . . . . . . . . . . . . . (9) (17)
Net assets (liabilities) recognized in balance sheet . . . . . . . . . . . . . . . . . . . . . . . . . . . . . . . . . . . . . . . . . $ 2 $ (23)
Actuarial gains and losses for these plans were as follows (in millions):
Years Ended November 30,2014 2013 2012 2011 2010
(restated)
(Losses) gains on plans’ liabilities . . . . . . . . . . . . . . . $(37) $(37) $(20) $(13) $ 19Gains (losses) on plans’ assets, including
restriction on assets.. . . . . . . . . . . . . . . . . . . . . . . . . . . 41 34 15 7 (3)
$ 4 $ (3) $ (5) $ (6) $ 16
The cumulative actuarial losses recognised in the Group or Company Statements of Shareholders’ Equity atNovember 30, 2014 and 2013 for these plans were $34 million and $38 million, respectively.
The amounts recognised in the Group Statements of Income for these plans were as follows (in millions):
Years EndedNovember 30,
2014 2013(restated)
Current service cost . . . . . . . . . . . . . . . . . . . . . . . . . . . . . . . . . . . . . . . . . . . . . . . . . . . . . . . . . . . . . . . . . . . . . . . . . $ 7 $ 7Past service cost and losses on settlements . . . . . . . . . . . . . . . . . . . . . . . . . . . . . . . . . . . . . . . . . . . . . . . . . . . 2 -
Service cost . . . . . . . . . . . . . . . . . . . . . . . . . . . . . . . . . . . . . . . . . . . . . . . . . . . . . . . . . . . . . . . . . . . . . . . . . . . . . . . . . 9 7Interest cost on defined benefit obligation . . . . . . . . . . . . . . . . . . . . . . . . . . . . . . . . . . . . . . . . . . . . . . . . . . . 24 20Interest income on scheme assets . . . . . . . . . . . . . . . . . . . . . . . . . . . . . . . . . . . . . . . . . . . . . . . . . . . . . . . . . . . . (23) (19)
Net interest on defined benefit liability . . . . . . . . . . . . . . . . . . . . . . . . . . . . . . . . . . . . . . . . . . . . . . . . . . . . . . 1 1Administrative expenses . . . . . . . . . . . . . . . . . . . . . . . . . . . . . . . . . . . . . . . . . . . . . . . . . . . . . . . . . . . . . . . . . . . . . 2 1
Cost recognised in Group Statements of Income . . . . . . . . . . . . . . . . . . . . . . . . . . . . . . . . . . . . . . . . . . . . . $ 12 $ 9
Our estimated contributions expected to be paid into these plans during 2015 are $6 million for the Company’sUK Plan and $1 million for the MNOPF New Section.
Analysis of the movements in the balance sheet assets (liabilities) for these plans was as follows (in millions):
2014 2013(restated)
Net liabilities at December 1 . . . . . . . . . . . . . . . . . . . . . . . . . . . . . . . . . . . . . . . . . . . . . . . . . . . . . . . . . . . . . . . . $ (23) $(24)Expenses (see above) . . . . . . . . . . . . . . . . . . . . . . . . . . . . . . . . . . . . . . . . . . . . . . . . . . . . . . . . . . . . . . . . . . . . . . . . (12) (9)Amounts recognised in the Group Statements of Comprehensive Income . . . . . . . . . . . . . . . . . . . . 4 (3)Employer contributions . . . . . . . . . . . . . . . . . . . . . . . . . . . . . . . . . . . . . . . . . . . . . . . . . . . . . . . . . . . . . . . . . . . . . 32 17Exchange movements . . . . . . . . . . . . . . . . . . . . . . . . . . . . . . . . . . . . . . . . . . . . . . . . . . . . . . . . . . . . . . . . . . . . . . . 1 (4)
Net assets/(liabilities) at November 30 . . . . . . . . . . . . . . . . . . . . . . . . . . . . . . . . . . . . . . . . . . . . . . . . . . . . . . . $ 2 $(23)
94
Car
niva
lplc
Fin
anci
alSt
atem
ents
Changes in the present value of defined benefit obligations for these plans were as follows (in millions):
2014 2013(restated)
Present value of obligations at December 1 . . . . . . . . . . . . . . . . . . . . . . . . . . . . . . . . . . . . . . . . . . . . . . . . . $ 543 $ 486Current service cost . . . . . . . . . . . . . . . . . . . . . . . . . . . . . . . . . . . . . . . . . . . . . . . . . . . . . . . . . . . . . . . . . . . . . . . . 7 7Interest cost . . . . . . . . . . . . . . . . . . . . . . . . . . . . . . . . . . . . . . . . . . . . . . . . . . . . . . . . . . . . . . . . . . . . . . . . . . . . . . . . 24 20Contributions from employees . . . . . . . . . . . . . . . . . . . . . . . . . . . . . . . . . . . . . . . . . . . . . . . . . . . . . . . . . . . . . 1 1Benefits paid . . . . . . . . . . . . . . . . . . . . . . . . . . . . . . . . . . . . . . . . . . . . . . . . . . . . . . . . . . . . . . . . . . . . . . . . . . . . . . . (17) (14)Past service cost . . . . . . . . . . . . . . . . . . . . . . . . . . . . . . . . . . . . . . . . . . . . . . . . . . . . . . . . . . . . . . . . . . . . . . . . . . . 2 -Actuarial losses on plan liabilities . . . . . . . . . . . . . . . . . . . . . . . . . . . . . . . . . . . . . . . . . . . . . . . . . . . . . . . . . . 37 10Gain due to change in share of MNOPF . . . . . . . . . . . . . . . . . . . . . . . . . . . . . . . . . . . . . . . . . . . . . . . . . . . . - 27Exchange movements . . . . . . . . . . . . . . . . . . . . . . . . . . . . . . . . . . . . . . . . . . . . . . . . . . . . . . . . . . . . . . . . . . . . . . (25) 6
Present value of obligations at November 30 . . . . . . . . . . . . . . . . . . . . . . . . . . . . . . . . . . . . . . . . . . . . . . . $ 572 $ 543
The sensitivity of plan liabilities to changes in certain key assumptions were as follows:
- 0.5% reduction in the discount rate results in an increase of $55 million;- 0.5% increase in inflation rate results in an increase of $39 million and- 1 year increase in life expectancy would result in an increase of $16 million.
Changes in the fair value of these plans’ assets were as follows (in millions):
2014 2013(restated)
Fair value of plans’ assets at December 1 . . . . . . . . . . . . . . . . . . . . . . . . . . . . . . . . . . . . . . . . . . . . . . . . . $ 537 $ 453Interest income on scheme assets . . . . . . . . . . . . . . . . . . . . . . . . . . . . . . . . . . . . . . . . . . . . . . . . . . . . . . . . . 23 19Return on scheme assets greater than discount rate . . . . . . . . . . . . . . . . . . . . . . . . . . . . . . . . . . . . . . . . 35 20Employer contributions . . . . . . . . . . . . . . . . . . . . . . . . . . . . . . . . . . . . . . . . . . . . . . . . . . . . . . . . . . . . . . . . . . . 32 17Contributions from employees . . . . . . . . . . . . . . . . . . . . . . . . . . . . . . . . . . . . . . . . . . . . . . . . . . . . . . . . . . . . 1 1Benefits paid . . . . . . . . . . . . . . . . . . . . . . . . . . . . . . . . . . . . . . . . . . . . . . . . . . . . . . . . . . . . . . . . . . . . . . . . . . . . . (17) (14)Loss due to change in share of MNOPF . . . . . . . . . . . . . . . . . . . . . . . . . . . . . . . . . . . . . . . . . . . . . . . . . . . - 29Administrative expenses . . . . . . . . . . . . . . . . . . . . . . . . . . . . . . . . . . . . . . . . . . . . . . . . . . . . . . . . . . . . . . . . . . (2) (1)Exchange movements . . . . . . . . . . . . . . . . . . . . . . . . . . . . . . . . . . . . . . . . . . . . . . . . . . . . . . . . . . . . . . . . . . . . . (26) 13
Fair value of plans’ assets at November 30 . . . . . . . . . . . . . . . . . . . . . . . . . . . . . . . . . . . . . . . . . . . . . . . . $ 583 $ 537
The actual gains on these plans’ assets in 2014 and 2013 were $58 million and $39 million, respectively.
These plans’ assets were comprised as follows (in millions, except percentages):
November 30,2014 2013
% %Equities . . . . . . . . . . . . . . . . . . . . . . . . . . . . . . . . . . . . . . . . . . . . . . . . . . . . . . . . . . . . . . . . . . . . . $ 238 40.8 $ 256 47.6Property . . . . . . . . . . . . . . . . . . . . . . . . . . . . . . . . . . . . . . . . . . . . . . . . . . . . . . . . . . . . . . . . . . . . . 14 2.4 14 2.6Corporate bonds . . . . . . . . . . . . . . . . . . . . . . . . . . . . . . . . . . . . . . . . . . . . . . . . . . . . . . . . . . . . . 96 16.5 93 17.3Fixed interest gilts . . . . . . . . . . . . . . . . . . . . . . . . . . . . . . . . . . . . . . . . . . . . . . . . . . . . . . . . . . . 116 19.8 90 16.7Liability matching investments . . . . . . . . . . . . . . . . . . . . . . . . . . . . . . . . . . . . . . . . . . . . . . 119 20.5 84 15.8
583 100.0 537 100.0
Restriction on assets (a) . . . . . . . . . . . . . . . . . . . . . . . . . . . . . . . . . . . . . . . . . . . . . . . . . . . . . (9) (17)
$ 574 $ 520
(a) These assets are restricted because they related to a multiemployer plan.
95

The Company’s net pension balance represents substantially all of the Group’s funded employee benefit plans.
Other Post-Employment Benefits
At November 30, 2014 and 2013, other post-employment benefit liabilities included $8 million and $9 million,respectively, for a deferred bonus agreement to make annual payments to a former executive director through2019. In addition, under Italian employment legislation Costa is required to maintain a staff leaving indemnity.Under the indemnity employees are entitled to receive a payment, calculated by reference to their length ofservice and salary up to December 31, 2006, if they cease employment with Costa. These payments are notconditional on employees reaching normal retirement age and following amendments to the legislation generateno further benefit accrual after December 31, 2006. At November 30, 2014 and 2013, Costa had accrued aliability of $11 million and $12 million, respectively.
Defined Contribution Plans
The Group has several defined contribution plans available to most of its shore staff employees. During 2014 and2013, the Group expensed $8 million each year for these plans.
NOTE 19 - Key Management
The aggregate compensation of the Group’s key management was as follows (in millions):
Years Ended November 30,2014 2013
Fees . . . . . . . . . . . . . . . . . . . . . . . . . . . . . . . . . . . . . . . . . . . . . . . . . . . . . . . . . . . . . . . . . . . . . . . . . . . . . $ 1 $ 1Salaries and benefits . . . . . . . . . . . . . . . . . . . . . . . . . . . . . . . . . . . . . . . . . . . . . . . . . . . . . . . . . . . . . 2 4Performance related bonuses . . . . . . . . . . . . . . . . . . . . . . . . . . . . . . . . . . . . . . . . . . . . . . . . . . . . . 4 6
Total short-term employment benefits . . . . . . . . . . . . . . . . . . . . . . . . . . . . . . . . . . . . . . . . . . . . 7 11Share-based compensation . . . . . . . . . . . . . . . . . . . . . . . . . . . . . . . . . . . . . . . . . . . . . . . . . . . . . . . 8 13
$ 15 $ 24
The key management, which consists of the board of directors, has responsibility and authority for controlling,directing and planning Carnival plc’s activities. Their aggregate compensation includes amounts paid by bothCarnival Corporation and Carnival plc.
During 2014 and 2013, there were no exercises of share options by executive directors of Carnival plc ordinaryshares. Further details on Directors’ remuneration, including RSA, RSU, PBS and MBS awards, share optionsand pension entitlements, are set out in Parts I and II of the Carnival plc Directors’ Remuneration Report.
NOTE 20 - Employees
The average number of our employees was as follows:
Years Ended November 30,2014 2013
Shore staff . . . . . . . . . . . . . . . . . . . . . . . . . . . . . . . . . . . . . . . . . . . . . . . . . . . . . . . . . . . . . . . . . . . . . . . 6,493 6,337Sea staff . . . . . . . . . . . . . . . . . . . . . . . . . . . . . . . . . . . . . . . . . . . . . . . . . . . . . . . . . . . . . . . . . . . . . . . . . 29,112 29,429
35,605 35,766
The aggregate payroll and related expenses included in both cruise operating expenses and selling andadministrative expenses were as follows (in millions):
Years Ended November 30,2014 2013
Salaries, wages and benefits . . . . . . . . . . . . . . . . . . . . . . . . . . . . . . . . . . . . . . . . . . . . . . . . . . . . . . . . $ 838 $ 883Social security and payroll taxes . . . . . . . . . . . . . . . . . . . . . . . . . . . . . . . . . . . . . . . . . . . . . . . . . . . . 55 60Pensions . . . . . . . . . . . . . . . . . . . . . . . . . . . . . . . . . . . . . . . . . . . . . . . . . . . . . . . . . . . . . . . . . . . . . . . . . . . 27 22Share-based compensation . . . . . . . . . . . . . . . . . . . . . . . . . . . . . . . . . . . . . . . . . . . . . . . . . . . . . . . . . 10 7
$ 930 $ 972
96
Car
niva
lplc
Fin
anci
alSt
atem
ents

Share-based compensation included $0.2 million in both 2014 and 2013 that were recharged by CarnivalCorporation in respect of RSU, PBS and MBS awards, and options granted over Carnival Corporation commonstock to certain U.S.-based Carnival plc Group employees.
Equity Plans
We issue our share-based compensation awards under the Carnival plc stock plan, which has 8.4 million sharesavailable for future grant at November 30, 2014. This plan allows us to issue Time-Based Share (“TBS”) awards,which include RSA, RSU, PBS and MBS awards and stock options (collectively “equity awards”). Equity awardsare principally granted to management level employees and members of our boards of directors. The plans areadministered by a committee of our independent directors (the “Committee”) that determines which employeesare eligible to participate, the monetary value or number of shares for which equity awards are to be granted andthe amounts that may be exercised or sold within a specified term. These plans allow us to fulfill our equityaward obligations using shares purchased in the open market or with unissued or treasury shares. Certain equityawards provide for accelerated vesting if we have a change in control, as defined.
Our total share-based compensation expense was $10 million and $7 million in 2014 and 2013, respectively, thevast majority of which is included in selling and administrative and the remainder in cruise payroll and relatedexpenses.
TBS, PBS and MBS Awards
Carnival plc grants RSUs, which substantially all vest at the end of three years and accrue forfeitable dividendequivalents on each outstanding RSU, in the form of additional RSUs, based on dividends declared and have novoting rights. The share-based compensation expense for TBS awards is based on the quoted market price of theCarnival plc shares on the date of grant.
In 2014 and 2013, the Committee approved PBS awards to be granted to certain key Carnival plc executives. Theshare-based compensation expense for these PBS awards is based on the quoted market price of the Carnival plcshares and expected total shareholder return rank relative to certain peer companies on the date of grant and theprobability of Carnival Corporation & plc annual earnings target for each year over a three-year period beingachieved. Our 2014 PBS awards also have a return on invested capital target. The PBS awards granted in 2014and 2013 provide an opportunity to earn from zero to 200% and zero to 187.5%, respectively, of the number oftarget shares underlying the award achieved for each year over a three-year period.
In 2012, the Committee approved PBS awards to be granted to certain key Carnival plc executives. The share-based compensation expense for these PBS awards is based on the quoted market price of the Carnival plc shareson the date of grant and the probability of Carnival Corporation & plc earnings per share growth over a three-year period being achieved. These PBS awards provide an opportunity to earn from zero to 200% of the numberof target shares underlying the award achieved at the end of the third year. All PBS awards will accrue forfeitabledividend equivalents based on dividends declared and have no voting rights.
In 2014, the Committee approved MBS awards to be granted to certain of our senior executives. The MBSawards were valued at $3 million as of the date of the grant. The share based compensation expense for MBSawards were based on the quoted market price of the Carnival plc ordinary shares on the date of grant and theprobability of certain market conditions being achieved. One-half of the MBS awards are expensed evenly over athree-year period and the remaining half are expensed evenly over a four-year period.
The Group awarded 252,042 RSUs, 50,778 PBSs and 41,479 MBSs at a weighted-average price of £27.72 in2014 and 316,271 RSUs and 398,748 PBSs at a weighted-average price of £24.82 in 2013, respectively,principally to certain officers and management level employees.
97
Prior to granting RSUs, PBSs and MBSs, the Committee granted options over ordinary shares, under the Carnivalplc 2005 Employee Share Plan and the Carnival plc Executive Share Option Plan, which have maximum terms ofup to seven years for options granted after October 2006. Options granted prior to October 2006 have maximumterms of up to ten years. The number and weighted-average exercise price of Carnival plc options were asfollows:
2014 2013
Number ofoptions
Weighted-averageexercise
priceNumber of
options
Weighted-averageexercise
price
Outstanding at December 1 . . . . . . . . . . . . . . . . . . . . . . . . . . . . . . . 739,707 $ 45.82 1,371,196 $ 45.88Exercised . . . . . . . . . . . . . . . . . . . . . . . . . . . . . . . . . . . . . . . . . . . . . . . . (17,889) $ 39.87 (63,231) $ 25.57Forfeited or expired . . . . . . . . . . . . . . . . . . . . . . . . . . . . . . . . . . . . . . (463,894) $ 42.54 (568,258) $ 50.47
Outstanding and exercisable at November 30 . . . . . . . . . . . . . 257,924 $ 46.55 739,707 $ 45.82
At November 30, 2014, our outstanding options had an exercise price ranging from $40.00 to $49.99 and aweighted-average remaining life of 0.3 years.
The obligations underlying the Company’s stock options, RSUs, PBS and MBS awards are settled through theissuance of Carnival plc ordinary shares.
NOTE 21 - Related Party Transactions
Group
During 2014 and 2013, Holland America Line and Princess purchased land tours from us totalling $128 millionand $126 million, respectively, and packaged these land tours for sale with their cruises. In addition, during 2014and 2013, we sold $3 million each year of pre- and post-cruise vacations, shore excursions and transportationservices to the Carnival Corporation group.
At November 30, 2014 and 2013, we owed $1.5 billion and $2.3 billion, respectively, to the Carnival Corporationgroup, which was unsecured and repayable on demand. Of our total liability to the Carnival Corporation group atNovember 30, 2014, $152 million is euro-denominated and bears interest, and the remaining balance of $1.3billion is non-interest bearing.
Within the DLC arrangement, there are instances where we provide services to Carnival Corporation groupcompanies, and also where Carnival Corporation group companies provide services to us. For example, weparticipate in Carnival Corporation & plc’s group risk-sharing programs related to hull and machinery for shipsand crew and guest claims. Additional disclosures of related party transactions are discussed in Note 3 of theDLC Financial Statements, which are included in Annex 1, but do not form part of these Carnival plc financialstatements.
Within our operational and organisational structure, the key management personnel, as defined under IAS 24“Related Party Disclosures,” consists of the Directors of the Company. Details of the Directors’ remuneration areprovided in the Carnival plc Directors’ Remuneration Report and any relevant transactions are given in the“Certain Relationships and Related Party Transactions” section, both of which are included within the ProxyStatement. The aggregate emoluments of our key management are shown in Note 19.
Company
At November 30, 2014 and 2013, Carnival Corporation owned 1,115,450, or 0.5% of the Company’s ordinaryshares, which are non-voting. During 2014 and 2013, Carnival Investment Limited did not purchase any ordinaryshares of Carnival plc. At November 30, 2014 and 2013, Carnival Investments Limited owned 30,848,634 or14.3% of the Company’s ordinary shares, which are also non-voting.
During 2013, Carnival Investments Limited sold 0.9 million of Carnival plc ordinary shares for net proceeds of$35 million. Substantially all of the net proceeds from these sales were used to repurchase 0.9 million shares ofCarnival Corporation common stock. Pursuant to our Stock Swap Programs, Carnival Corporation sold theseCarnival plc ordinary shares owned by Carnival Investments Limited only to the extent it was able to repurchaseshares of Carnival Corporation common stock in the U.S. market on at least an equivalent basis.
98
Car
niva
lplc
Fin
anci
alSt
atem
ents
In 2014 and 2013, Carnival Corporation and Carnival Investments Limited received dividends on their Carnivalplc ordinary shares in the aggregate amount of $32 million and $49 million, respectively.
During 2014, the Company had multi-year ship charter agreements with Princess for three ships (2013 threeships) and Carnival Cruise Line for one ship operating year-round in Australia and/or Asia. In addition, Princesstime chartered another two ships during 2014 seasonally in Australia or Asia to the Company and sinceSeptember 2014, Carnival Cruise Line began time chartering another ship to us that operated seasonally fromAustralia. Both the year-round and seasonal charters are accounted for as operating leases. Princess and CarnivalCruise Line are subsidiaries of Carnival Corporation. The total charter payments in 2014 and 2013 were $444million and $337 million, respectively, which were included in other ship operating expenses.
During 2014, the Company continued to provide a guarantee to the MNOPF for certain employees who havetransferred between subsidiaries of the Company.
The key management personnel of the Company comprise members of the boards of directors. Except for someshare-based compensation and some fees for UK-based services, the Directors did not receive any remunerationfrom the Company in 2014 and 2013, as their emoluments were borne by other companies within the DLC.Details of the Company’s share-based compensation to Directors are disclosed in the Carnival plc Directors’Remuneration Report, which is included in the Proxy Statement. The Company did not have any transactionswith the Directors during 2014 and 2013, other than those discussed in our Directors’ Remunerations Report.
Transactions with Subsidiaries
The Company enters into loans with its subsidiaries at floating rates of interest, generally at rates agreed tobetween the parties from time to time. At November 30, 2014, the Company had a receivable from its subsidiarytotalling $62 million of a floating rate euro-denominated loan. In addition at November 30, 2014, the Companyhad net receivables of $15 million from its subsidiaries, which are callable on demand. At November 30, 2013,the Company had net payables of $104 million due to its subsidiaries, which were payable on demand.
NOTE 22 - Commitments
Group
At November 30, 2014, we had three ships under contract for construction with an aggregate passenger capacityof more than 10,200 lower berths with two for AIDA and one for P&O Cruises (UK). The estimated total cost ofthese ships is $2.0 billion, which includes the contract prices with the shipyards, design and engineering fees,capitalised interest, construction oversight costs and various owner supplied items. We have paid $0.3 billionthrough November 30, 2014 and our remaining cruise ship commitments, aggregated based on each ship’sdelivery date, are expected to be $1.1 billion and $0.6 billion in 2015 and 2016, respectively.
Future minimum lease and port facility commitments, aggregated based on the lease and port facility expirationdates, for noncancellable operating leases and port facility agreements were as follows (in millions):
November 30,
Fiscal 2014 2013
2014 . . . . . . . . . . . . . . . . . . . . . . . . . . . . . . . . . . . . . . . . . . . . . . . . . . . . . . . . . . . . . . . . . . . . . . . . . . . . . . . . . . . . . . . . . $ 772015 . . . . . . . . . . . . . . . . . . . . . . . . . . . . . . . . . . . . . . . . . . . . . . . . . . . . . . . . . . . . . . . . . . . . . . . . . . . . . . . . . . . . . . . . . $ 567 3442016 . . . . . . . . . . . . . . . . . . . . . . . . . . . . . . . . . . . . . . . . . . . . . . . . . . . . . . . . . . . . . . . . . . . . . . . . . . . . . . . . . . . . . . . . . 9 122017 . . . . . . . . . . . . . . . . . . . . . . . . . . . . . . . . . . . . . . . . . . . . . . . . . . . . . . . . . . . . . . . . . . . . . . . . . . . . . . . . . . . . . . . . . 6 82018 . . . . . . . . . . . . . . . . . . . . . . . . . . . . . . . . . . . . . . . . . . . . . . . . . . . . . . . . . . . . . . . . . . . . . . . . . . . . . . . . . . . . . . . . . 15 142019 . . . . . . . . . . . . . . . . . . . . . . . . . . . . . . . . . . . . . . . . . . . . . . . . . . . . . . . . . . . . . . . . . . . . . . . . . . . . . . . . . . . . . . . . . 11 -Thereafter . . . . . . . . . . . . . . . . . . . . . . . . . . . . . . . . . . . . . . . . . . . . . . . . . . . . . . . . . . . . . . . . . . . . . . . . . . . . . . . . . . . 465 450
Total . . . . . . . . . . . . . . . . . . . . . . . . . . . . . . . . . . . . . . . . . . . . . . . . . . . . . . . . . . . . . . . . . . . . . . . . . . . . . . . . . . . $1,073 $ 905
Company
At November 30, 2014 and 2013, the Company had $751 million and $768 million, respectively, of contractedcapital commitments relating to ship construction contracts. Ship capital commitments included contractpayments to the shipyards, design and engineering fees, capitalised interest, construction oversight costs andvarious owner supplied items.
99
NOTE 23 - Contingent Liabilities
The cross guarantees provided to and from Carnival Corporation as a result of the DLC arrangement, as furtherdiscussed within Notes 3, 5 and 10 of the DLC Financial Statements, which are included in Annex 1, but do notform part of these Carnival plc financial statements and within the Business Review section of the StrategicReport, provide that Carnival plc has guaranteed all Carnival Corporation’s indebtedness and certain other oftheir monetary obligations and Carnival Corporation has provided similar guarantees to Carnival plc.
Some of the debt contracts that we enter into include indemnification provisions that obligate the Group to makepayments to the counterparty if certain events occur. These contingencies generally relate to changes in taxes andchanges in laws that increase lender capital costs and other similar costs. The indemnification clauses are oftenstandard contractual terms and were entered into in the normal course of business. There are no stated or notionalamounts included in the indemnification clauses, and the Group is not able to estimate the maximum potentialamount of future payments, if any, under these indemnification clauses. The Group has not been required tomake any material payments under such indemnification clauses in the past and, under current circumstances, wedo not believe a request for material future indemnification payments is probable.
As a result of the January 2012 ship incident, litigation claims, enforcement actions, regulatory actions andinvestigations, including, but not limited to, those arising from personal injury, loss of life, loss of or damage topersonal property, business interruption losses or environmental damage to any affected coastal waters and thesurrounding areas, have been and may be asserted or brought against various parties, including us. The existingassertions are ongoing and there are significant jurisdictional uncertainties. The ultimate outcome of thesematters cannot be determined at this time. However, we do not expect these matters to have a significant impacton our results of operations because we have insurance coverage for these types of third-party claims.
Additionally, in the normal course of our business, various claims and lawsuits have been filed or are pendingagainst us. Most of these claims and lawsuits are covered by insurance and, accordingly, the maximum amount ofour liability, net of any insurance recoverables, is typically limited to our self-insurance retention levels.Management believes the ultimate outcome of these claims and lawsuits will not have a material adverse impacton the Group and Company financial statements.
NOTE 24 - Financial Instruments
Fair Value Measurements
IFRS establishes a fair value hierarchy that prioritises the inputs used to measure fair value. The hierarchy givesthe highest priority to unadjusted quoted prices in active markets for identical assets or liabilities (Level 1measurement) and the lowest priority to unobservable inputs (Level 3 measurement). This hierarchy requiresentities to maximise the use of observable inputs and minimise the use of unobservable inputs. The three levelsof inputs used to measure fair value are as follows:
• Level 1 measurements are based on unadjusted quoted prices in active markets for identical assets or liabilitiesthat we have the ability to access. Valuation of these items does not entail a significant amount of judgment.
• Level 2 measurements are based on quoted prices for similar assets or liabilities in active markets, quotedprices for identical or similar assets or liabilities in markets that are not active or market data other than quotedprices that are observable for the assets or liabilities.
• Level 3 measurements are based on unobservable data that are supported by little or no market activity and aresignificant to the fair value of the assets or liabilities.
There were no transfers between Level 1, Level 2 and Level 3 during 2014 and 2013. The fair value is the pricethat would be received to sell an asset or paid to transfer a liability in an orderly transaction between independentand knowledgeable market participants at the measurement date. Therefore, even when market assumptions arenot readily available, our own assumptions are set to reflect those that we believe market participants would usein pricing the asset or liability at the measurement date.
The fair value measurement of a financial asset or financial liability must reflect the nonperformance risk of thecounterparty and us. Therefore, the impact of our counterparty’s creditworthiness was considered when in anasset position, and our creditworthiness was considered when in a liability position in the fair value measurementof our financial instruments. Creditworthiness did not have a significant impact on the fair values of our financial
100
Car
niva
lplc
Fin
anci
alSt
atem
ents

instruments at November 30, 2014 and 2013. Both the counterparties and we are expected to continue to performunder the contractual terms of the instruments. Considerable judgment may be required in interpreting marketdata used to develop the estimates of fair value. Accordingly, certain estimates of fair value presented herein arenot necessarily indicative of the amounts that could be realised in a current or future market exchange.
The fair value of cross guarantees within the DLC arrangement (see Note 23) are not significant at November 30,2014 or 2013, and are not expected to result in any material loss.
Financial Instruments that are Not Measured at Fair Value on a Recurring Basis
Financial assets were as follows (in millions):
Group
November 30, 2014 November 30, 2013Fair Value Fair Value
CarryingValue Level 1 Level 2 Level 3
CarryingValue Level 1 Level 2 Level 3
Cash and cash equivalents (a) . . . . . . . . . . $ 129 $ 129 $ - $ - $ 149 $ 149 $ - $ -Long-term other assets (b) . . . . . . . . . . . . . 14 - - 13 15 - - 15
$ 143 $ 129 $ - $ 13 $ 164 $ 149 $ - $ 15
Company
November 30, 2014 November 30, 2013Fair Value Fair Value
CarryingValue Level 1 Level 2 Level 3
CarryingValue Level 1 Level 2 Level 3
Cash and cash equivalents (a) . . . . . . . . . . $ 43 $ 43 $ - $ - $ 59 $ 59 $ - $ -
$ 43 $ 43 $ - $ - $ 59 $ 59 $ - $ -
(a) Cash and cash equivalents are comprised of cash on hand, and at November 30, 2013 also include timedeposits. Due to their short maturities the carrying values approximate their fair values.
(b) At November 30, 2014 and 2013, long term other assets were substantially all comprised of notes and otherreceivables. The fair values of our notes receivable were estimated using risk-adjusted discount rates.
101

The carrying and estimated fair values of debt at November 30, 2014 and 2013 were as follows (in millions) (a):
Group
November 30, 2014 November 30, 2013Fair Value Fair Value
CarryingValue Level 1 Level 2 Level 3
CarryingValue Level 1 Level 2 Level 3
Floating rateEuro export credit facilities . . . . . . . . . . $1,270 $ - $1,236 $ - $ 965 $ - $ 958 $ -Bank loans . . . . . . . . . . . . . . . . . . . . . . . . . . 150 - 149 - 100 - 100 -Euro bank loan . . . . . . . . . . . . . . . . . . . . . . 249 - 248 - - - - -Short-term euro bank loans . . . . . . . . . . 14 - 14 - 60 - 60 -
$1,683 $ - $1,647 $ - $1,125 $ - $1,118 $ -
Fixed rateBearing interest at 2.0% to 2.9% . . . . . $ - $ - $ - $ - $ 150 $ - $ 159 $ -Bearing interest at 3.0% to 3.9% . . . . . 396 - 428 - 486 - 520 -Bearing interest at 4.0% to 4.9% . . . . . 430 - 466 - 527 - 577 -Bearing interest at 6.0% to 6.9% . . . . . - - - - 26 - 29 -Bearing interest at 7.0% to 7.9% . . . . . 153 - 178 - 168 - 202 -
$ 979 $ - $1,072 $ - $1,357 $ - $1,487 $ -
Company
Floating rateEuro export credit facilities . . . . . . . . . . $1,121 $ - $1,090 $ - $ 788 $ - $ 779 $ -Euro bank loan . . . . . . . . . . . . . . . . . . . . . . 249 - 248 - - - - -Bank loans . . . . . . . . . . . . . . . . . . . . . . . . . . 150 - 149 - 100 - 100 -
$1,520 $ - $1,487 $ - $ 888 $ - $ 879 $ -
Fixed rateBearing interest at 2.0% to 2.9% . . . . . $ - $ - $ - $ - $ 150 $ - $ 159 $ -Bearing interest at 3.0% to 3.9% . . . . . 221 - 239 - 275 - 298 -Bearing interest at 4.0% to 4.9% . . . . . 263 - 279 - 326 - 354 -Bearing interest at 6.0% to 6.9% . . . . . - - - - 26 - 29 -Bearing interest at 7.0% to 7.9% . . . . . 153 - 178 - 168 - 202 -
$ 637 $ - $ 696 $ - $ 945 $ - $1,042 $ -
(a) Debt does not include the impact of interest rate swaps. The net difference between the fair value of our fixedrate debt and its carrying value was due to the market interest rates in existence at November 30, 2014 and2013 being lower than the fixed interest rates on these debt obligations, including the impact of any changesin our credit ratings. At November 30, 2014 and 2013, the net difference between the fair value of ourfloating rate debt and its carrying value was due to the market interest rates in existence at November 30,2014 and 2013 being slightly higher and slightly lower, respectively, than the floating interest rates on thesedebt obligations, including the impact of any changes in our credit ratings. The fair values of our publicly-traded notes were based on their unadjusted quoted market prices in markets that are not sufficiently active tobe Level 1 and, accordingly, are considered Level 2. The fair values of our other debt were estimated basedon appropriate market interest rates being applied to this debt.
102
Car
niva
lplc
Fin
anci
alSt
atem
ents
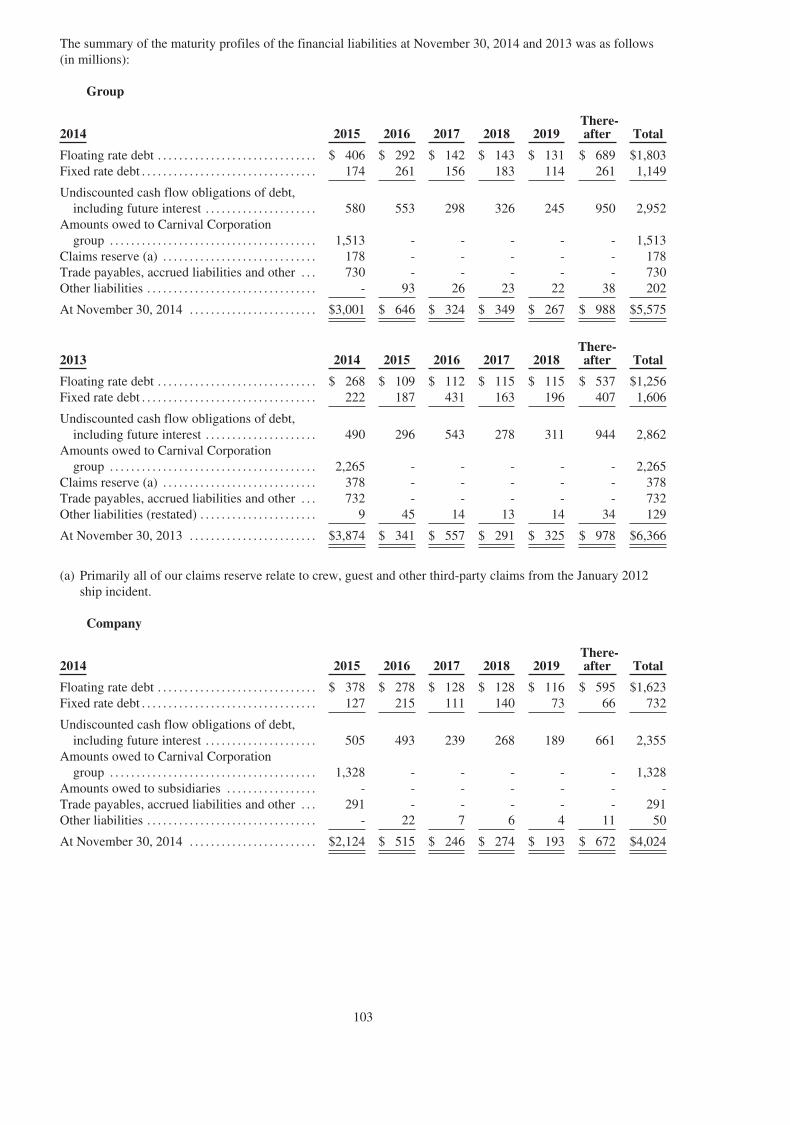
The summary of the maturity profiles of the financial liabilities at November 30, 2014 and 2013 was as follows(in millions):
Group
2014 2015 2016 2017 2018 2019There-after Total
Floating rate debt . . . . . . . . . . . . . . . . . . . . . . . . . . . . . . $ 406 $ 292 $ 142 $ 143 $ 131 $ 689 $1,803Fixed rate debt . . . . . . . . . . . . . . . . . . . . . . . . . . . . . . . . . 174 261 156 183 114 261 1,149
Undiscounted cash flow obligations of debt,including future interest . . . . . . . . . . . . . . . . . . . . . 580 553 298 326 245 950 2,952
Amounts owed to Carnival Corporationgroup . . . . . . . . . . . . . . . . . . . . . . . . . . . . . . . . . . . . . . . 1,513 - - - - - 1,513
Claims reserve (a) . . . . . . . . . . . . . . . . . . . . . . . . . . . . . 178 - - - - - 178Trade payables, accrued liabilities and other . . . 730 - - - - - 730Other liabilities . . . . . . . . . . . . . . . . . . . . . . . . . . . . . . . . - 93 26 23 22 38 202
At November 30, 2014 . . . . . . . . . . . . . . . . . . . . . . . . $3,001 $ 646 $ 324 $ 349 $ 267 $ 988 $5,575
2013 2014 2015 2016 2017 2018There-after Total
Floating rate debt . . . . . . . . . . . . . . . . . . . . . . . . . . . . . . $ 268 $ 109 $ 112 $ 115 $ 115 $ 537 $1,256Fixed rate debt . . . . . . . . . . . . . . . . . . . . . . . . . . . . . . . . . 222 187 431 163 196 407 1,606
Undiscounted cash flow obligations of debt,including future interest . . . . . . . . . . . . . . . . . . . . . 490 296 543 278 311 944 2,862
Amounts owed to Carnival Corporationgroup . . . . . . . . . . . . . . . . . . . . . . . . . . . . . . . . . . . . . . . 2,265 - - - - - 2,265
Claims reserve (a) . . . . . . . . . . . . . . . . . . . . . . . . . . . . . 378 - - - - - 378Trade payables, accrued liabilities and other . . . 732 - - - - - 732Other liabilities (restated) . . . . . . . . . . . . . . . . . . . . . . 9 45 14 13 14 34 129
At November 30, 2013 . . . . . . . . . . . . . . . . . . . . . . . . $3,874 $ 341 $ 557 $ 291 $ 325 $ 978 $6,366
(a) Primarily all of our claims reserve relate to crew, guest and other third-party claims from the January 2012ship incident.
Company
2014 2015 2016 2017 2018 2019There-after Total
Floating rate debt . . . . . . . . . . . . . . . . . . . . . . . . . . . . . . $ 378 $ 278 $ 128 $ 128 $ 116 $ 595 $1,623Fixed rate debt . . . . . . . . . . . . . . . . . . . . . . . . . . . . . . . . . 127 215 111 140 73 66 732
Undiscounted cash flow obligations of debt,including future interest . . . . . . . . . . . . . . . . . . . . . 505 493 239 268 189 661 2,355
Amounts owed to Carnival Corporationgroup . . . . . . . . . . . . . . . . . . . . . . . . . . . . . . . . . . . . . . . 1,328 - - - - - 1,328
Amounts owed to subsidiaries . . . . . . . . . . . . . . . . . - - - - - - -Trade payables, accrued liabilities and other . . . 291 - - - - - 291Other liabilities . . . . . . . . . . . . . . . . . . . . . . . . . . . . . . . . - 22 7 6 4 11 50
At November 30, 2014 . . . . . . . . . . . . . . . . . . . . . . . . $2,124 $ 515 $ 246 $ 274 $ 193 $ 672 $4,024
103

2013 2014 2015 2016 2017 2018There-after Total
Floating rate debt . . . . . . . . . . . . . . . . . . . . . . . . . . . . $ 192 $ 93 $ 95 $ 97 $ 98 $ 409 $ 984Fixed rate debt . . . . . . . . . . . . . . . . . . . . . . . . . . . . . . 169 135 381 115 149 148 1,097
Undiscounted cash flow obligations of debt,including future interest . . . . . . . . . . . . . . . . . . . 361 228 476 212 247 557 2,081
Amounts owed to Carnival Corporationgroup . . . . . . . . . . . . . . . . . . . . . . . . . . . . . . . . . . . . . 1,943 - - - - - 1,943
Amounts owed to subsidiaries . . . . . . . . . . . . . . . 104 - - - - - 104Trade payables, accrued liabilities and
other . . . . . . . . . . . . . . . . . . . . . . . . . . . . . . . . . . . . . . 265 - - - - - 265Other liabilities (restated) . . . . . . . . . . . . . . . . . . . . 3 28 1 1 2 8 43
At November 30, 2013 . . . . . . . . . . . . . . . . . . . . . . $ 2,676 $ 256 $ 477 $ 213 $ 249 $ 565 $ 4,436
Substantially all financial liabilities are held at amortised cost. The fair values of our financial liabilities notincluded in the table above approximate their book values.
As noted below the Group’s liquidity is considered on a consolidated Carnival Corporation & plc basis. Includedin the “Future Commitments and Funding Sources” section within the Business Review section of the StrategicReport is a schedule of the maturity profiles of the recorded and unrecorded contractual cash obligations ofCarnival Corporation & plc at November 30, 2014.
Financial Instruments that are Measured at Fair Value on a Recurring Basis
The estimated fair value and basis of valuation of our financial instrument assets and (liabilities) that aremeasured at fair value on a recurring basis were as follows (in millions):
Group
November 30, 2014 November 30, 2013Level 1 Level 2 Level 1 Level 2
AssetsCash equivalents (a) . . . . . . . . . . . . . . . . . . . . . . . . . . . . . . . . . . . . . . . . . . . . . $ 88 $ - $ 114 $ -Marketable securities held in rabbi trust (b). . . . . . . . . . . . . . . . . . . . . . . $ 1 $ - $ 2 $ -Derivatives
Net investment hedges (c) . . . . . . . . . . . . . . . . . . . . . . . . . . . . . . . . . . . . . $ - $ 12 $ - $ 2Interest rate swaps (d) . . . . . . . . . . . . . . . . . . . . . . . . . . . . . . . . . . . . . . . . . $ - $ - $ - $ 3Foreign currency zero cost collars (e) . . . . . . . . . . . . . . . . . . . . . . . . . . $ - $ - $ - $ 8
LiabilitiesDerivatives
Net investment hedges (c) . . . . . . . . . . . . . . . . . . . . . . . . . . . . . . . . . . . . . $ - $ - $ - $ (4)Interest rate swaps (d) . . . . . . . . . . . . . . . . . . . . . . . . . . . . . . . . . . . . . . . . . $ - $ (28) $ - $ (7)Foreign currency zero cost collars (e) . . . . . . . . . . . . . . . . . . . . . . . . . . $ - $ (1) $ - $ -
Company
AssetsCash equivalents (a) . . . . . . . . . . . . . . . . . . . . . . . . . . . . . . . . . . . . . . . . . . . . . $ 64 $ - $ 85 $ -Derivatives
Net investment hedges (c) . . . . . . . . . . . . . . . . . . . . . . . . . . . . . . . . . . . . . $ - $ 12 $ - $ 2Interest rate swaps (d) . . . . . . . . . . . . . . . . . . . . . . . . . . . . . . . . . . . . . . . . . $ - $ - $ - $ 3Foreign currency zero cost collars (e) . . . . . . . . . . . . . . . . . . . . . . . . . . $ - $ - $ - $ 8
LiabilitiesDerivatives
Net investment hedges (c) . . . . . . . . . . . . . . . . . . . . . . . . . . . . . . . . . . . . . $ - $ - $ - $ (4)Interest rate swaps (d) . . . . . . . . . . . . . . . . . . . . . . . . . . . . . . . . . . . . . . . . . $ - $ (28) $ - $ (7)Foreign currency zero cost collars (e) . . . . . . . . . . . . . . . . . . . . . . . . . . $ - $ (1) $ - $ -
104
Car
niva
lplc
Fin
anci
alSt
atem
ents
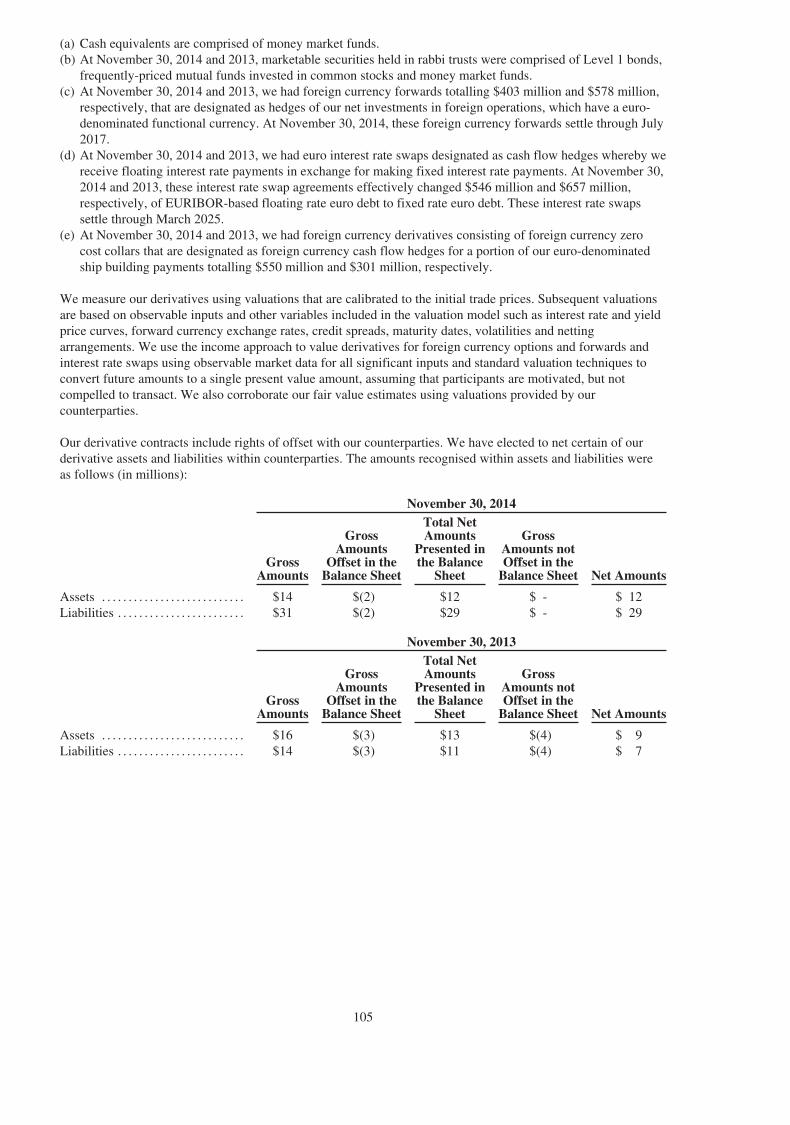
(a) Cash equivalents are comprised of money market funds.(b) At November 30, 2014 and 2013, marketable securities held in rabbi trusts were comprised of Level 1 bonds,
frequently-priced mutual funds invested in common stocks and money market funds.(c) At November 30, 2014 and 2013, we had foreign currency forwards totalling $403 million and $578 million,
respectively, that are designated as hedges of our net investments in foreign operations, which have a euro-denominated functional currency. At November 30, 2014, these foreign currency forwards settle through July2017.
(d) At November 30, 2014 and 2013, we had euro interest rate swaps designated as cash flow hedges whereby wereceive floating interest rate payments in exchange for making fixed interest rate payments. At November 30,2014 and 2013, these interest rate swap agreements effectively changed $546 million and $657 million,respectively, of EURIBOR-based floating rate euro debt to fixed rate euro debt. These interest rate swapssettle through March 2025.
(e) At November 30, 2014 and 2013, we had foreign currency derivatives consisting of foreign currency zerocost collars that are designated as foreign currency cash flow hedges for a portion of our euro-denominatedship building payments totalling $550 million and $301 million, respectively.
We measure our derivatives using valuations that are calibrated to the initial trade prices. Subsequent valuationsare based on observable inputs and other variables included in the valuation model such as interest rate and yieldprice curves, forward currency exchange rates, credit spreads, maturity dates, volatilities and nettingarrangements. We use the income approach to value derivatives for foreign currency options and forwards andinterest rate swaps using observable market data for all significant inputs and standard valuation techniques toconvert future amounts to a single present value amount, assuming that participants are motivated, but notcompelled to transact. We also corroborate our fair value estimates using valuations provided by ourcounterparties.
Our derivative contracts include rights of offset with our counterparties. We have elected to net certain of ourderivative assets and liabilities within counterparties. The amounts recognised within assets and liabilities wereas follows (in millions):
November 30, 2014
GrossAmounts
GrossAmounts
Offset in theBalance Sheet
Total NetAmounts
Presented inthe Balance
Sheet
GrossAmounts notOffset in the
Balance Sheet Net Amounts
Assets . . . . . . . . . . . . . . . . . . . . . . . . . . . $14 $(2) $12 $ - $ 12Liabilities . . . . . . . . . . . . . . . . . . . . . . . . $31 $(2) $29 $ - $ 29
November 30, 2013
GrossAmounts
GrossAmounts
Offset in theBalance Sheet
Total NetAmounts
Presented inthe Balance
Sheet
GrossAmounts notOffset in the
Balance Sheet Net Amounts
Assets . . . . . . . . . . . . . . . . . . . . . . . . . . . $16 $(3) $13 $(4) $ 9Liabilities . . . . . . . . . . . . . . . . . . . . . . . . $14 $(3) $11 $(4) $ 7
105

Capital Management
Within the DLC arrangement, the consolidated Carnival Corporation & plc group’s primary financial goals are toprofitably grow its cruise business and increase its return on invested capital, reaching double digit returns in thenext three to four years while maintaining a strong balance sheet. Their ability to generate significant operatingcash flows allows Carnival Corporation & plc to internally fund its capital investments. Carnival Corporation &plc’s goal is to return excess free cash flows to its shareholders in the form of additional dividends and/or sharebuybacks. In addition, Carnival Corporation & plc is committed to maintaining its strong investment grade creditratings, which are among the highest in the leisure travel industry. Other objectives of its capital structure policyare to maintain a sufficient level of liquidity with its available cash and cash equivalents and committedfinancings for immediate and future liquidity needs and a reasonable debt maturity profile that is spread out overa number of years. The Group manages its capital on a consolidated Carnival Corporation & plc basis, applyingU.S. GAAP. For additional information see the “Liquidity, Financial Condition and Capital Resources” sectionwithin the Business Review section of the Strategic Report. The net debt to capital ratio of the Group atNovember 30, 2014 and 2013 was calculated as follows (in millions):
2014 2013(restated)
Total debt . . . . . . . . . . . . . . . . . . . . . . . . . . . . . . . . . . . . . . . . . . . . . . . . . . . . . . . . . . . . . . . . . . . . . . . . . . . . . . . $ 2,662 $ 2,482Less cash and cash equivalents . . . . . . . . . . . . . . . . . . . . . . . . . . . . . . . . . . . . . . . . . . . . . . . . . . . . . . . . . . (217) (263)
Net debt . . . . . . . . . . . . . . . . . . . . . . . . . . . . . . . . . . . . . . . . . . . . . . . . . . . . . . . . . . . . . . . . . . . . . . . . . . . . . . . . 2,445 2,219Shareholders’ equity . . . . . . . . . . . . . . . . . . . . . . . . . . . . . . . . . . . . . . . . . . . . . . . . . . . . . . . . . . . . . . . . . . . . 8,754 8,933
Total capital . . . . . . . . . . . . . . . . . . . . . . . . . . . . . . . . . . . . . . . . . . . . . . . . . . . . . . . . . . . . . . . . . . . . . . . . . . . . $ 11,199 $ 11,152
Net debt to capital ratio . . . . . . . . . . . . . . . . . . . . . . . . . . . . . . . . . . . . . . . . . . . . . . . . . . . . . . . . . . . . . . . . . 21.8% 19.9%
At November 30, 2014 and 2013, the net debt to capital ratio for the consolidated Carnival Corporation & plcgroup, applying U.S. GAAP and prepared on the same basis as above, was 26.5% and 27.0%, respectively.Substantially all of our Group and Company debt agreements, including our Facility, contain one or morefinancial covenants that require us, among other things, to maintain minimum debt service coverage andminimum shareholders’ equity and to limit our debt to capital and debt to equity ratios and the amounts of oursecured assets and secured and other indebtedness. Generally, if an event of default under any debt agreementoccurs, including those held by Carnival Corporation, then pursuant to cross default acceleration clauses,substantially all of our outstanding debt and derivative contract payables could become due, and all debt andderivative contracts could be terminated. At November 30, 2014, we believe we were in compliance with all ofour debt covenants.
Liquidity Risk
Within the DLC arrangement, liquidity and liquidity risk is assessed on a consolidated Carnival Corporation &plc basis and there are cross guarantees between the two parent companies that result in there being littlesubstantive difference in the availability of debt financing for either Carnival Corporation or Carnival plc.Typically, the Carnival Corporation & plc debt financing agreements allow for either Carnival Corporation orCarnival plc to draw under the facilities, with the non-borrowing parent as guarantor. For additional informationsee the “Liquidity, Financial Condition and Capital Resources” section within the Business Review section of theStrategic Report.
As noted in the “Future Commitments and Funding Sources” section within the Business Review section of theStrategic Report, at November 30, 2014 the consolidated Carnival Corporation & plc group had $2.3 billionavailable for borrowing under its revolving credit facilities, net of its commercial paper borrowings and $2.5billion under committed future financings, in addition to $92 million of cash and cash equivalents, whichexcludes $239 million of cash on hand used for current operations.
106
Car
niva
lplc
Fin
anci
alSt
atem
ents
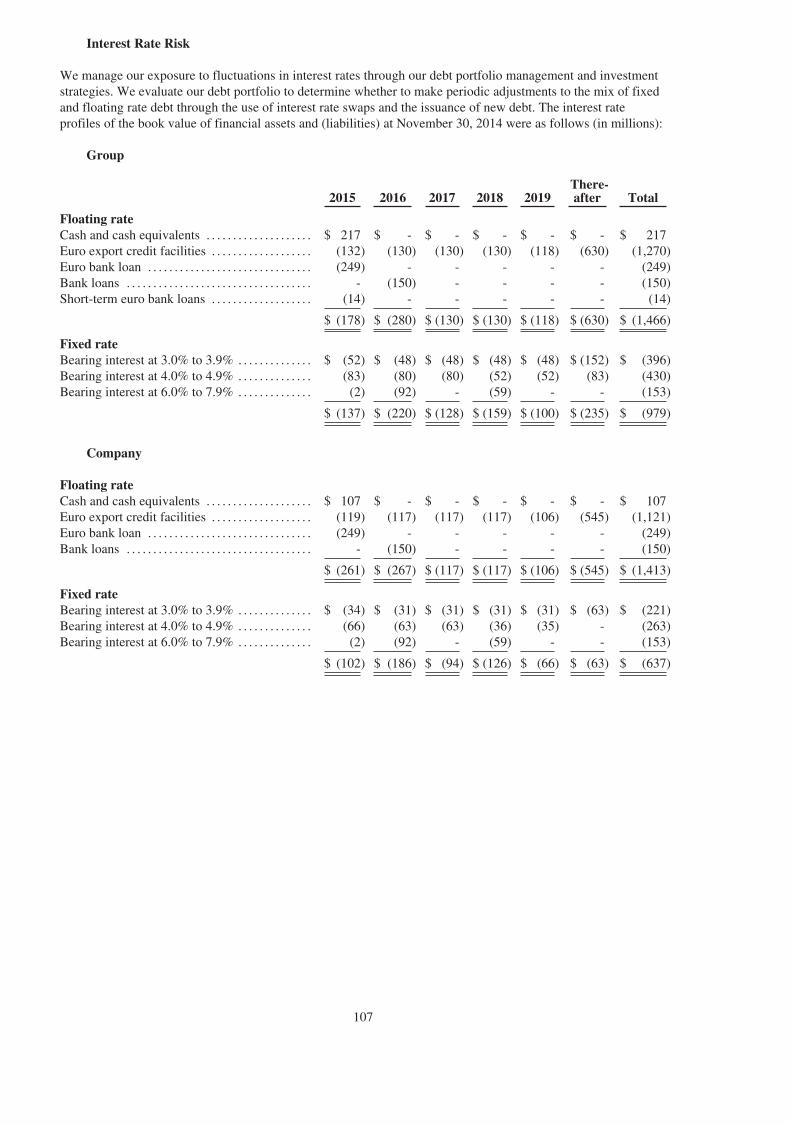
Interest Rate Risk
We manage our exposure to fluctuations in interest rates through our debt portfolio management and investmentstrategies. We evaluate our debt portfolio to determine whether to make periodic adjustments to the mix of fixedand floating rate debt through the use of interest rate swaps and the issuance of new debt. The interest rateprofiles of the book value of financial assets and (liabilities) at November 30, 2014 were as follows (in millions):
Group
2015 2016 2017 2018 2019There-after Total
Floating rateCash and cash equivalents . . . . . . . . . . . . . . . . . . . . $ 217 $ - $ - $ - $ - $ - $ 217Euro export credit facilities . . . . . . . . . . . . . . . . . . . (132) (130) (130) (130) (118) (630) (1,270)Euro bank loan . . . . . . . . . . . . . . . . . . . . . . . . . . . . . . . (249) - - - - - (249)Bank loans . . . . . . . . . . . . . . . . . . . . . . . . . . . . . . . . . . . - (150) - - - - (150)Short-term euro bank loans . . . . . . . . . . . . . . . . . . . (14) - - - - - (14)
$ (178) $ (280) $ (130) $ (130) $ (118) $ (630) $ (1,466)
Fixed rateBearing interest at 3.0% to 3.9% . . . . . . . . . . . . . . $ (52) $ (48) $ (48) $ (48) $ (48) $ (152) $ (396)Bearing interest at 4.0% to 4.9% . . . . . . . . . . . . . . (83) (80) (80) (52) (52) (83) (430)Bearing interest at 6.0% to 7.9% . . . . . . . . . . . . . . (2) (92) - (59) - - (153)
$ (137) $ (220) $ (128) $ (159) $ (100) $ (235) $ (979)
Company
Floating rateCash and cash equivalents . . . . . . . . . . . . . . . . . . . . $ 107 $ - $ - $ - $ - $ - $ 107Euro export credit facilities . . . . . . . . . . . . . . . . . . . (119) (117) (117) (117) (106) (545) (1,121)Euro bank loan . . . . . . . . . . . . . . . . . . . . . . . . . . . . . . . (249) - - - - - (249)Bank loans . . . . . . . . . . . . . . . . . . . . . . . . . . . . . . . . . . . - (150) - - - - (150)
$ (261) $ (267) $ (117) $ (117) $ (106) $ (545) $ (1,413)
Fixed rateBearing interest at 3.0% to 3.9% . . . . . . . . . . . . . . $ (34) $ (31) $ (31) $ (31) $ (31) $ (63) $ (221)Bearing interest at 4.0% to 4.9% . . . . . . . . . . . . . . (66) (63) (63) (36) (35) - (263)Bearing interest at 6.0% to 7.9% . . . . . . . . . . . . . . (2) (92) - (59) - - (153)
$ (102) $ (186) $ (94) $ (126) $ (66) $ (63) $ (637)
107
The interest rate profiles of financial assets and (liabilities) at November 30, 2013 were as follows (in millions):
Group
2014 2015 2016 2017 2018There-after Total
Floating rateCash and cash equivalents . . . . . . . . . . . . . . . . . $ 263 $ - $ - $ - $ - $ - $ 263Euro export credit facilities . . . . . . . . . . . . . . . (102) (98) (98) (98) (98) (471) (965)Bank loans . . . . . . . . . . . . . . . . . . . . . . . . . . . . . . . . (100) - - - - - (100)Short-term euro bank loans . . . . . . . . . . . . . . . . (60) - - - - - (60)
$ 1 $ (98) $ (98) $ (98) $ (98) $ (471) $ (862)
Fixed rateBearing interest at 2.0% to 2.9% . . . . . . . . . . $ - $ - $ (150) $ - $ - $ - $ (150)Bearing interest at 3.0% to 3.9% . . . . . . . . . . (59) (51) (51) (51) (52) (222) (486)Bearing interest at 4.0% to 4.9% . . . . . . . . . . (85) (80) (81) (81) (54) (146) (527)Bearing interest at 6.0% to 6.9% . . . . . . . . . . (26) - - - - - (26)Bearing interest at 7.0% to 7.9% . . . . . . . . . . (1) - (102) - (65) - (168)
$ (171) $ (131) $ (384) $ (132) $ (171) $ (368) $ (1,357)
Company
Floating rateCash and cash equivalents . . . . . . . . . . . . . . . . . $ 144 $ - $ - $ - $ - $ - $ 144Euro export credit facilities . . . . . . . . . . . . . . . (86) (85) (85) (85) (85) (362) (788)Bank loans . . . . . . . . . . . . . . . . . . . . . . . . . . . . . . . . (100) - - - - - (100)
$ (42) $ (85) $ (85) $ (85) $ (85) $ (362) $ (744)
Fixed rateBearing interest at 2.0% to 2.9% . . . . . . . . . . $ - $ - $ (150) $ - $ - $ - $ (150)Bearing interest at 3.0% to 3.9% . . . . . . . . . . (38) (33) (33) (34) (34) (103) (275)Bearing interest at 4.0% to 4.9% . . . . . . . . . . (67) (62) (62) (63) (36) (36) (326)Bearing interest at 6.0% to 6.9% . . . . . . . . . . (26) - - - - - (26)Bearing interest at 7.0% to 7.9% . . . . . . . . . . (1) - (102) - (65) - (168)
$ (132) $ (95) $ (347) $ (97) $ (135) $ (139) $ (945)
The Group and Company have fixed and floating rate debt and use interest rate swaps to manage our interest rateexposure in order to achieve a desired proportion of fixed and floating rate debt. Based upon a 10% hypotheticalchange in the November 30, 2014 market interest rates, our annual interest expense on floating rate debt wouldchange by an insignificant amount. Substantially all of our fixed rate debt can only be called or prepaid byincurring costs, therefore, it is unlikely we will be able to take significant steps in the short-term to mitigate ourfixed rate debt exposure in the event of a significant decrease in market interest rates. Within the DLCarrangement, interest rate risks are considered on a combined Carnival Corporation & plc basis. For additionalinformation see the Business Review section of the Strategic Report and Note 10 of the DLC FinancialStatements, which are included in Annex 1, but do not form part of these Carnival plc financial statements.
Foreign Currency Exchange Rate Risks
We manage our exposure to fluctuations in foreign currency exchange rates through our normal operating andfinancing activities, including netting certain exposures to take advantage of any natural offsets and, whenconsidered appropriate, through the use of derivative and nonderivative financial instruments, such as foreigncurrency forwards, options and swaps, foreign currency debt obligations and foreign currency cash balances. Ourprimary focus is to manage the economic foreign currency exchange risks faced by our operations, which are theultimate foreign currency exchange risks that would be realized by us if we exchanged one currency for another,and not accounting risks. While we will continue to monitor our exposure to these economic risks, we do notcurrently hedge our foreign currency exchange risks with derivative or nonderivative financial instruments, withthe exception of certain of our ship commitments and net investments in foreign operations. The financialimpacts of the hedging instruments we do employ generally offset the changes in the underlying exposures beinghedged.
108
Car
niva
lplc
Fin
anci
alSt
atem
ents
Operational Currency Risk
Our European and Australian cruise brands generate significant revenues and incur significant expenses in theireuro, sterling or Australian dollar functional currency, which subjects us to “foreign currency translational” riskrelated to these currencies. Accordingly, exchange rate fluctuations of the euro, sterling and Australian dollaragainst the U.S. dollar will affect our reported financial results since the reporting currency for our consolidatedfinancial statements is the U.S. dollar. Any strengthening of the U.S. dollar against these foreign currencies hasthe financial statement effect of decreasing the U.S. dollar values reported for these cruise brands’ revenues andexpenses. Any weakening of the U.S. dollar has the opposite effect.
Most of our brands also have non-functional currency risk related to their international sales operations, whichhas become an increasingly larger part of most of their businesses over time, and principally includes the euro,sterling and Australian and U.S. dollars. In addition, all of our brands have non-functional currency expenses fora portion of their operating expenses. Accordingly, we also have “foreign currency transactional” risks related tochanges in the exchange rates for our brands’ revenues and expenses that are in a currency other than theirfunctional currency. However, these brands’ revenues and expenses in non-functional currencies create somedegree of natural offset from these currency exchange movements. In addition, we monitor this foreign currencytransactional risk in order to measure its impact on our results of operations. Based on a 10% hypothetical changein all currency exchange rates that were used in Carnival Corporation & plc’s December 19, 2014 guidance,Carnival Corporation & plc’s estimated full year non-GAAP guidance would change by $0.30 per share,including both foreign currency translational and transactional impacts. For additional information see theBusiness Review section of the Strategic Report and Note 10 of the DLC Financial Statements, which areincluded in Annex 1, but do not form part of these Carnival plc financial statements.
Investment Currency Risk
At November 30, 2014, substantially all of the Group net operating assets were denominated in euros, sterlingand Australian dollars. As a result of this currency composition, the Group’s U.S. dollar consolidated balancesheet can be affected by currency movements. The Group partially mitigates the effect of such movements byentering into foreign currency forwards and having some borrowings in the same currencies as those in which theassets are denominated.
The exchange rates for each of our major currencies as of and for the year ended November 30, 2014 and 2013were as follows:
2014 2013£:U.S.$ euro:U.S.$ Aus:U.S.$ £:U.S.$ euro:U.S.$ Aus:U.S.$
November 30 exchange rates . . . . . . . . . . 1.56 1.25 0.85 1.63 1.36 0.91Average yearly exchange rates . . . . . . . . 1.65 1.34 0.91 1.56 1.32 0.98
At November 30, the fair value of derivatives included in the Group and Company balance sheets atNovember 30, 2014 and 2013 were as follows (in millions):
2014 2013Notional Assets Liabilities Notional Assets Liabilities
Foreign currency forwards-net investmenthedges . . . . . . . . . . . . . . . . . . . . . . . . . . . . . . . . . . . . $ 403 $ 12 $ - $ 578 $ - $ 2
Debt related interest rate swaps-cash flowhedge . . . . . . . . . . . . . . . . . . . . . . . . . . . . . . . . . . . . . $ 546 - 28 $ 657 - 4
Foreign currency zero cost collars-ships . . . . . $ 550 - 1 $ 301 8 -
$ 12 $ 29 $ 8 $ 6
At November 30, 2014, the Group and Company have $403 million of foreign currency forwards that aredesignated as hedges of our net investments in foreign operations, which have a euro-denominated functionalcurrency, thus partially offsetting this foreign currency exchange rate risk. Based on a 10% hypothetical changein the U.S. dollar to euro exchange rate as of November 30, 2014, we estimate that these foreign currencyforwards’ fair values would change by $40 million, which would be offset by a corresponding change of $40million in the U.S. dollar value of our net investments. In addition, based on a 10% hypothetical change in the
109
U.S. dollar to euro, sterling and Australian dollar exchange rates at November 30, 2014, which are the functionalcurrencies we translate into our U.S. dollar reporting currency, we estimate our 2014 cumulative translationadjustment would have changed by $511 million.
There are no amounts excluded from the assessment of hedge effectiveness, and there are no credit risk relatedcontingent features in our derivative agreements. The amount of estimated cash flow hedges’ unrealised gainsand losses that are expected to be reclassified to earnings in the next twelve months is not significant.Ineffectiveness arising on cash flow hedges was not material during 2014 and 2013 and, accordingly, all cashflow hedges were considered effective.
Newbuild Currency Risk
Our shipbuilding contracts are typically denominated in euros. Our decisions regarding whether or not to hedge anon-functional currency ship commitment for our UK brands are made on a case-by-case basis, taking intoconsideration the amount and duration of the exposure, market volatility, economic trends, our overall expectednet cash flows by currency and other offsetting risks. We use foreign currency derivative contracts and have usednonderivative financial instruments to manage foreign currency exchange rates risk for some of our shipconstruction payments.
In 2012, we entered into foreign currency zero cost collars that are designated as cash flow hedges for a portionof P&O Cruises (UK) Britannia’s euro-denominated shipyard payments. These collars mature in late February2015 at a weighted-average ceiling of $287 million and a weighted-average floor of $266 million. In 2014, weentered into additional foreign currency zero cost collars that are also designated as cash flow hedges for theremaining portion of Britannia’s euro-denominated shipyard payments. These collars also mature in lateFebruary 2015 at a weighted-average ceiling of $281 million, and a weighted-average floor of $274 million. Ifthe spot rate is between the weighted-average ceiling and floor rates on the date of maturity, then we would notowe or receive any payments under these collars. At November 30, 2014, the estimated fair value of theseoutstanding foreign currency zero cost collars was a nominal liability. Based on a 10% hypothetical increase ordecrease in the November 30, 2014 sterling rates to euro exchange rates, we estimate the fair value of thesecollars would increase $26 million or decrease $27 million, respectively. Additional detail relating to the Group’sand Company’s financial risk management objectives and policies is included in Note 1, the Business Reviewsection of the Strategic Report and Note 10 of the DLC Financial Statements, which are included in Annex 1, butdo not form part of these Carnival plc financial statements.
Credit Risk
As part of our ongoing control procedures, we monitor concentrations of credit risk associated with financial andother institutions with which we conduct significant business. Our maximum exposure under foreign currencycontracts and interest rate swap agreements that are in-the-money, which were not material at November 30,2014, is the replacement cost, net of any collateral received or contractually allowed offset, in the event ofnonperformance by the counterparties to the contracts, all of which are currently our lending banks. We seek tominimise credit risk exposure, including counterparty nonperformance primarily associated with our cashequivalents, investments, committed financing facilities, derivative instruments, insurance contracts and new shipprogress payment guarantees, by normally conducting business with large, well-established financial institutions,insurance companies and export credit agencies, and by diversifying our counterparties. In addition, we haveguidelines regarding credit ratings and investment maturities that we follow to help safeguard liquidity andminimise risk. We normally do require collateral and/or guarantees to support notes receivable on significantasset sales, long-term ship charters and new ship progress payments to shipyards. We currently believe the risk ofnonperformance by any of our significant counterparties is remote.
We also monitor the creditworthiness of travel agencies and tour operators in Asia, Australia and Europe andcredit and debit card providers to which we extend credit in the normal course of our business, which includescharter-hire agreements in Asia prior to sailing. Our credit exposure also includes contingent obligations relatedto cash payments received directly by travel agents and tour operators for cash collected by them on cruise salesin Australia and most of Europe where we are obligated to honour our guests’ cruise payments made by them totheir travel agents and tour operators regardless of whether we have received these payments. Concentrations ofcredit risk associated with these receivables, charter-hire agreements and contingent obligations are notconsidered to be material, primarily due to the large number of unrelated accounts within our customer base, theamount of these contingent obligations and their short maturities. We have experienced only minimal creditlosses on our trade receivables and related contingent obligations. We do not normally require collateral or othersecurity to support normal credit sales.
110
Car
niva
lplc
Fin
anci
alSt
atem
ents
Independent auditors’ report to the members of Carnival plc
Report on the financial statements
Our opinionIn our opinion:
• Carnival plc’s Group financial statements and Company financial statements (the “financial statements”)give a true and fair view of:
• the state of the Group’s and of the Company’s affairs as at November 30, 2014; and• the Group’s profit and the Group’s and the Company’s cash flows for the year then ended;
• the Group financial statements have been properly prepared in accordance with International FinancialReporting Standards (“IFRSs”) as adopted by the European Union;
• the Company financial statements have been properly prepared in accordance with International FinancialReporting Standards (“IFRSs”) as adopted by the European Union and as applied in accordance with theprovisions of the Companies Act 2006; and
• the financial statements have been prepared in accordance with the requirements of the Companies Act 2006and, as regards the Group financial statements, Article 4 of the IAS Regulation.
What we have audited
Carnival plc’s financial statements comprise:• the Group and Company balance sheets as at November 30, 2014;• the Group statement of income and statement of comprehensive income for the year then ended;• the Group and Company statements of cash flows for the year then ended;• the Group and Company statements of changes in shareholders’ equity for the year then ended; and• the notes to the financial statements, which include a summary of significant accounting policies and other
explanatory information.
Certain required disclosures have been presented elsewhere in the Carnival plc Annual Report Documents (the“Annual Report”), rather than in the notes to the financial statements. These are cross-referenced from thefinancial statements and are identified as audited.
The financial reporting framework that has been applied in the preparation of the financial statements isapplicable law and IFRSs as adopted by the European Union and, as regards the Company financial statements,as applied in accordance with the provisions of the Companies Act 2006.
The Carnival Corporation consolidated financial statements for 2014, prepared under U.S. Generally AcceptedAccounting Principles (referred to as either “The Carnival Corporation & plc Annual Report” or the “DLCFinancial Statements”), which are included in Annex 1 of the Carnival plc Strategic Report and IFRS financialstatements, as other information, do not form part of the Carnival plc IFRS Financial Statements and as such arenot within the scope of this opinion.
111
Our audit approachOverview
• Overall group materiality: $38 million, which represents 5% of average incomebefore taxes from continuing operations for the past four years, adjusted for thegoodwill, trademarks and ship impairment charges to avoid the volatility that suchitems would create.
• Carnival plc has six operating units which fall into three reporting segments. Threeoperating units were subject to an audit of their complete financial information dueto their size.
The areas of audit focus were:• Impairment reviews of Costa Cruises (“Costa”) and Cunard goodwill and the
carrying value of certain Costa, Ibero Cruises (“Ibero”) and P&O Cruises (UK)(“P&O (UK)”) ships.
• Costa Concordia incident (the “January 2012 ship incident”).• Risk of fraud in relation to revenue recognition.
The scope of our audit and our areas of focusWe conducted our audit in accordance with International Standards on Auditing (UK and Ireland) (“ISAs (UK &Ireland)”).
We designed our audit by determining materiality and assessing the risks of material misstatement in thefinancial statements. In particular, we looked at where the directors made subjective judgements, for example inrespect of significant accounting estimates that involved making assumptions and considering future events thatare inherently uncertain. As in all of our audits, we also addressed the risk of management override of internalcontrols, including evaluating whether there was evidence of bias by the directors that represented a risk ofmaterial misstatement due to fraud.
The risks of material misstatement that had the greatest effect on our audit, including the allocation of ourresources and effort, are identified as “areas of focus” in the table below. We have also set out how we tailoredour audit to address these specific areas in order to provide an opinion on the financial statements as a whole, andany comments we make on the results of our procedures should be read in this context. This is not a complete listof all risks identified by our audit.
112
Car
niva
lplc
Fin
anci
alSt
atem
ents

Area of focus How our audit addressed the area of focusImpairment reviews of Costa and Cunard Goodwill and of certainCosta, Ibero and P&O (UK) shipsThe Group holds significant amounts of goodwill and property,plant and equipment in the form of ships on the balance sheetrelated to its cruise brands (“brands”), as detailed in Notes 10 and11 to the financial statements. The risk is that these balances areoverstated and need to be impaired.In determining whether the carrying value of goodwill and certainships are impaired or not, the directors are required to makejudgements about the future performance of these brands andships, including whether the ships will remain in use or be sold.The economic conditions in the Italian, Spanish and UK marketsled the directors to evaluate the carrying value of certain Costa,Ibero and P&O (UK) ships.We continued to focus on the valuation of Costa, which had agoodwill carrying value of $354 million because the performanceof this brand over the past 3 years has been impacted by theJanuary 2012 ship incident.We focussed on the valuation of Cunard, which had a goodwillcarrying value of $172 million as the UK cruise market hascontinued to experience economic pressures, which could erodethe headroom previously assessed.Costa’s and Cunard’s goodwill valuations are dependent oncontinuing net revenue yield growth and operationalimprovements. As such we focussed on the assumptions thedirectors made about the growth rates in these areas.No goodwill impairment charge was taken as a result of thedirectors’ review.The ship valuations are either dependent on continuing netrevenue yield growth and operational improvements, where theship is expected to remain in use, or for those that are expected tobe disposed; then the valuation is dependent on expected saleproceeds. As such we focussed on the assumptions the directorsmade about the growth rates in these areas or the expected saleproceeds considering recent ship sales in assessing the carryingvalue of vessels.As a result of these reviews an impairment charge of $53 millionwas taken on two Ibero ships.
We evaluated the directors’ future cash flow forecasts, and theprocess by which they were prepared, for Costa and Cunard andfor those ships that experienced an event that would potentiallytrigger an impairment review in the current year, includingcomparing the forecasts to the latest Board approved plans. Weevaluated the reasonableness of the directors’ forecasts, throughconsidering their historical forecasting accuracy. In addition, wechallenged:Š the directors’ key assumptions for changes to net revenue
yield, net cruise costs (including fuel prices), new shipadditions and remaining useful life of the ships, bycomparing them to current revenue booking and costtrends, as well as historical results and economic andexternal industry data;
Š the long-term growth rates in the forecasts, by comparingthem to external industry forecasts;
Š the discount rate applied to the goodwill assessments byassessing the cost of capital for the Group; and
Š the discount rate applied to the ship assessments byassessing the cost of capital of the brand and country.
We found the assumptions to be consistent with ourexpectations as a result of performing a sensitivity analysis oneach of the key assumptions, particularly considering theexpected growth in net revenue yields across their key markets,changes to cruise costs, including the impact of fuelconsumption and price changes, new ship additions, long-termgrowth rate, the discount rate and the remaining life of the shipsand how the actual results compared to previous forecasts. ForCosta and Cunard we consider that lower than expected growthin the net revenue yields, adverse economic conditions or aninability to achieve the planned results could reasonably beexpected to give rise to an impairment charge in the future. Thisis consistent with management’s assessment as detailed in Note11.We also considered recent ship sales compared to the carryingvalue of the vessels and the likelihood of management beingable to redeploy ships into other markets, should the need arise,where carrying values could be recovered and took into accountinstances where this had occurred in the past.Our testing provided us with evidence to support management’sassessment of the impairment charge for the two Ibero ships.
113
Area of focus How our audit addressed the area of focusThe 2012 ship incidentThe Group holds a significant provision of $255 million andlargely an offsetting insurance recoverable on the balance sheet inrelation to this January 2012 ship incident (Notes 12 & 15). Therisk is that these balances are not correctly stated.During the course of the year the ship was re-floated andtransported to a ship yard in Genoa, Italy for recycling.The directors have had to continue to make judgements about theexposure to wreck removal costs, environmental site restorationand legal claims as well as the amounts recoverable underinsurance.We continued to focus on the completeness and accuracy of theprovision recognised at year end as well as the valuation of thecarrying value of the insurance recoverable and the associatedpresentation in the financial statements.
We examined the terms of the wreckage removal contract andheld independent discussions with the Group’s insuranceproviders regarding the status of the insurance claim under thecontract.In evaluating the wreck removal costs and incident related legalclaims from guests and crew, we evaluated the views of bothinternal and external legal counsel of the Group. We alsoexamined the evidence available from the costs incurred todate.We evaluated the Group’s accounting for the insurance claim;the cash received to date and considered the collectability of theinsurance recoverable. We also challenged the directors’assumptions relating to the remaining costs to be incurred,taking into account the expected future costs and reports of theengineers contracted by the Group and the insurance providers.Based on this we did not identify any material omissions fromthe provision and we found that there was evidence to supportthe directors’ conclusion that it was appropriate to recognise theinsurance recoverable on the balance sheet on a gross basis.
Risks of fraud in relation to revenue recognitionWe focused on the timing of revenue recognition in the finalmonths of the accounting period to check that revenue wasrecorded in the correct period relating to cruises that straddle theyear end and for revenue that has been received in advance of thecruise departure, which is deferred until the voyage has takenplace.
We examined the appropriateness of the Group’s accountingpolicy surrounding revenue recognition and its compliance withIFRSs as adopted by the EU, and tested the application of thispolicy, with particular emphasis on the risks identified opposite.Where appropriate we evaluated the relevant InformationTechnology systems and tested the operating effectiveness ofthe internal controls over the recording of revenue against aspecific voyage in the period and we evaluated the Group’s cutoff straddle adjustment for voyages where the duration spannedthe year end by comparing management’s estimate to data suchas voyage departure dates, duration, and voyage revenue andcost records.At the year end we tested the revenue received in advance of thecruise taking place with reference to cruise voyage schedulesand a sample of bookings to determine the appropriateness ofrelated customer deposits which have been deferred.We also tested journal entries posted to revenue accounts toidentify any unusual or irregular items, and the reconciliationsbetween the revenue systems used by the Group and itsfinancial ledgers.Based on our testing we did not identify any materialmisstatements.
How we tailored the audit scope
We tailored the scope of our audit to ensure that we performed enough work to be able to give an opinion on thefinancial statements as a whole, taking into account the geographic structure of the Group, the accountingprocesses and controls, and the industry in which the Group operates.
Carnival plc has six operating units which fall into three reporting segments. Three operating units, Costa, AIDACruises and Carnival UK (Cunard and P&O (UK)), were subject to an audit of their complete financialinformation, due to their size, by local component audit teams. We visited the Costa and Carnival UK operatingunits to review the component teams’ work and to meet local management. As it related to the AIDA componentteam we met and reviewed their work via the use of video conferences and Webex’s. Additionally, specific auditprocedures were performed on certain balances and transactions in respect of other operating units, including thecarrying value of certain ships. This together with additional procedures performed at the Group level, gave usthe evidence we needed for our opinion on the financial statements as a whole.
MaterialityThe scope of our audit is influenced by our application of materiality. We set certain quantitative thresholds formateriality. These, together with qualitative considerations, helped us to determine the scope of our audit and thenature, timing and extent of our audit procedures and to evaluate the effect of misstatements, both individuallyand on the financial statements as a whole.
114
Car
niva
lplc
Fin
anci
alSt
atem
ents
Based on our professional judgement, we determined materiality for the financial statements as a whole asfollows:
Overall Group materiality $38 million (2013: $38 million).
How we determined it 5% of average income before taxes from continuing operations of the past fouryears, adjusted for the goodwill, trademarks and ship impairment charges.
Rationale for benchmarkapplied
We believe that the average income before taxes from continuing operations of thepast four years, adjusted for the goodwill, trademarks and ship impairment charges(“items”) provides us with a consistent year on year basis for determiningmateriality by considering the impact of the January 2012 ship incident on overallcontinuing operations during this period and eliminating the disproportionateimpact of these items. We also looked at other benchmarks, such as using thecurrent year net income before tax, rather than an average, and noted thatmateriality would be unchanged.
We agreed with the Audit Committee that we would report to them misstatements identified during our auditabove $1.9 million (2013: $1.9 million) as well as misstatements below that amount that, in our view, warrantedreporting for qualitative reasons.
Going concernUnder the Listing Rules we are required to review the Directors’ statement, set out on page C-11 in Annex C tothe Proxy Statement, in relation to going concern. We have nothing to report having performed our review.
As noted in the Directors’ statement, the directors have concluded that it is appropriate to prepare the financialstatements using the going concern basis of accounting. The going concern basis presumes that the Group andCompany have adequate resources to remain in operation, and that the directors intend them to do so, for at leastone year from the date the financial statements were signed. As part of our audit we have concluded that thedirectors’ use of the going concern basis is appropriate.
However, because not all future events or conditions can be predicted, these statements are not a guarantee as tothe Group’s and Company’s ability to continue as a going concern.
Other required reporting
Consistency of other informationCompanies Act 2006 opinionIn our opinion the information given in the Strategic Report, included within the Annual Report, and the Carnivalplc Directors’ Report, set out in Annex A to the Proxy Statement, for the financial year for which the financialstatements are prepared is consistent with the financial statements.
ISAs (UK & Ireland) reportingUnder ISAs (UK & Ireland) we are required to report to you if, in our opinion:
• Information in the Annual Report is:- materially inconsistent with the information in the audited financial
statements; or- apparently materially incorrect based on, or materially inconsistent with, our
knowledge of the Group and Company acquired in the course of performingour audit; or
- otherwise misleading.
We have noexceptions to reportarising from thisresponsibility.
• the statement given by the directors on page A-8 in Annex A to the ProxyStatement, in accordance with provision C.1.1 of the UK Corporate GovernanceCode (“the Code”), that they consider the Annual Report taken as a whole to befair, balanced and understandable and provides the information necessary formembers to assess the Group’s and Company’s performance, business model andstrategy is materially inconsistent with our knowledge of the Group and Companyacquired in the course of performing our audit.
We have noexceptions to reportarising from thisresponsibility.
• the section of the Annual Report on pages C-4 to C-5 and C-6 to C-9 in Annex C tothe Proxy Statement, as required by provision C.3.8 of the Code, describing thework of the Audit Committee does not appropriately address matterscommunicated by us to the Audit Committee.
We have noexceptions to reportarising from thisresponsibility.
115
Adequacy of accounting records and information and explanations receivedUnder the Companies Act 2006 we are required to report to you if, in our opinion:• we have not received all the information and explanations we require for our audit; or• adequate accounting records have not been kept by the Company, or returns adequate for our audit have not
been received from branches not visited by us; or• the Company financial statements and the part of the Directors’ Remuneration Report to be audited are not
in agreement with the accounting records and returns.
We have no exceptions to report arising from this responsibility.
Directors’ remuneration
Directors’ remuneration report - Companies Act 2006 opinion
In our opinion, the part of the Directors’ Remuneration Report in Annex B to the Proxy Statement, datedFebruary 20, 2015, to be audited has been properly prepared in accordance with the Companies Act 2006.
Other Companies Act 2006 reporting
Under the Companies Act 2006 we are required to report to you if, in our opinion, certain disclosures ofdirectors’ remuneration specified by law are not made. We have no exceptions to report arising from thisresponsibility.
Corporate governance statementUnder the Listing Rules we are required to review the part of the Corporate Governance Statement relating to theCompany’s compliance with nine provisions of the UK Corporate Governance Code. We have nothing to reporthaving performed our review.
Responsibilities for the financial statements and the audit
Our responsibilities and those of the directorsAs explained more fully in the Statement of directors’ responsibilities set out on page A-8 in Annex A to theProxy Statement, the directors are responsible for the preparation of the financial statements and for beingsatisfied that they give a true and fair view.
Our responsibility is to audit and express an opinion on the financial statements in accordance with applicablelaw and ISAs (UK & Ireland). Those standards require us to comply with the Auditing Practices Board’s EthicalStandards for Auditors.
This report, including the opinions, has been prepared for and only for the Company’s members as a body inaccordance with Chapter 3 of Part 16 of the Companies Act 2006 and for no other purpose. We do not, in givingthese opinions, accept or assume responsibility for any other purpose or to any other person to whom this reportis shown or into whose hands it may come save where expressly agreed by our prior consent in writing.
What an audit of financial statements involvesAn audit involves obtaining evidence about the amounts and disclosures in the financial statements sufficient togive reasonable assurance that the financial statements are free from material misstatement, whether caused byfraud or error. This includes an assessment of:
• whether the accounting policies are appropriate to the Group’s and the Company’s circumstances and havebeen consistently applied and adequately disclosed;
• the reasonableness of significant accounting estimates made by the directors; and• the overall presentation of the financial statements.
We primarily focus our work in these areas by assessing the directors’ judgements against available evidence,forming our own judgements, and evaluating the disclosures in the financial statements.
116
Car
niva
lplc
Fin
anci
alSt
atem
ents
We test and examine information, using sampling and other auditing techniques, to the extent we considernecessary to provide a reasonable basis for us to draw conclusions. We obtain audit evidence through testing theeffectiveness of controls, substantive procedures or a combination of both.
In addition, we read all the financial and non-financial information in the Annual Report to identify materialinconsistencies with the audited financial statements and to identify any information that is apparently materiallyincorrect based on, or materially inconsistent with, the knowledge acquired by us in the course of performing theaudit. If we become aware of any apparent material misstatements or inconsistencies we consider theimplications for our report.
Nicholas Smith (Senior Statutory Auditor)for and on behalf of PricewaterhouseCoopers LLPChartered Accountants and Statutory AuditorsLondonFebruary 20, 2015
(a) The maintenance and integrity of the Carnival plc website is the responsibility of the directors; the workcarried out by the auditors does not involve consideration of these matters and, accordingly, the Auditorsaccept no responsibility for any changes that may have occurred to the financial statements since they wereinitially presented on the website.
(b) Legislation in the United Kingdom governing the preparation and dissemination of financial statementsmay differ from legislation in other jurisdictions.
117
2014 ANNUAL REPORT
Ann
ex1
DL
CA
nnua
lRep
ort

CARNIVAL CORPORATION & PLC2014 ANNUAL REPORT
TABLE OF CONTENTS
COMPANY . . . . . . . . . . . . . . . . . . . . . . . . . . . . . . . . . . . . . . . . . . . . . . . . . . . . . . . . . . . . . . . . . . . . . . . . . . . . . 1HIGHLIGHTS . . . . . . . . . . . . . . . . . . . . . . . . . . . . . . . . . . . . . . . . . . . . . . . . . . . . . . . . . . . . . . . . . . . . . . . . . . . 1CHIEF EXECUTIVE OFFICER’S LETTER TO SHAREHOLDERS . . . . . . . . . . . . . . . . . . . . . . . . . . . . . . . 2SHAREHOLDER BENEFIT . . . . . . . . . . . . . . . . . . . . . . . . . . . . . . . . . . . . . . . . . . . . . . . . . . . . . . . . . . . . . . . 5CONSOLIDATED FINANCIAL STATEMENTS
CONSOLIDATED STATEMENTS OF INCOME . . . . . . . . . . . . . . . . . . . . . . . . . . . . . . . . . . . . . . . . . . . . 6CONSOLIDATED STATEMENTS OF COMPREHENSIVE INCOME . . . . . . . . . . . . . . . . . . . . . . . . . . . 7CONSOLIDATED BALANCE SHEETS . . . . . . . . . . . . . . . . . . . . . . . . . . . . . . . . . . . . . . . . . . . . . . . . . . . . 8CONSOLIDATED STATEMENTS OF CASH FLOWS . . . . . . . . . . . . . . . . . . . . . . . . . . . . . . . . . . . . . . . . 9CONSOLIDATED STATEMENTS OF SHAREHOLDERS’ EQUITY . . . . . . . . . . . . . . . . . . . . . . . . . . . . 10NOTES TO CONSOLIDATED FINANCIAL STATEMENTS . . . . . . . . . . . . . . . . . . . . . . . . . . . . . . . . . . 11
MANAGEMENT’S REPORT ON INTERNAL CONTROL OVER FINANCIAL REPORTING . . . . . . . . . . 37REPORT OF INDEPENDENT REGISTERED CERTIFIED PUBLIC ACCOUNTING FIRM . . . . . . . . . . . . 38MANAGEMENT’S DISCUSSION AND ANALYSIS OF FINANCIAL CONDITION AND RESULTS OF
OPERATIONS . . . . . . . . . . . . . . . . . . . . . . . . . . . . . . . . . . . . . . . . . . . . . . . . . . . . . . . . . . . . . . . . . . . . . . . . 39SELECTED FINANCIAL DATA . . . . . . . . . . . . . . . . . . . . . . . . . . . . . . . . . . . . . . . . . . . . . . . . . . . . . . . . . . . 61MARKET PRICE FOR COMMON STOCK AND ORDINARY SHARES . . . . . . . . . . . . . . . . . . . . . . . . . . . 62STOCK PERFORMANCE GRAPHS . . . . . . . . . . . . . . . . . . . . . . . . . . . . . . . . . . . . . . . . . . . . . . . . . . . . . . . . . 63SELECTED QUARTERLY FINANCIAL DATA (UNAUDITED) . . . . . . . . . . . . . . . . . . . . . . . . . . . . . . . . . 65CORPORATE AND OTHER INFORMATION . . . . . . . . . . . . . . . . . . . . . . . . . . . . . . . . . . . . . . . . . . . . . . . . 67
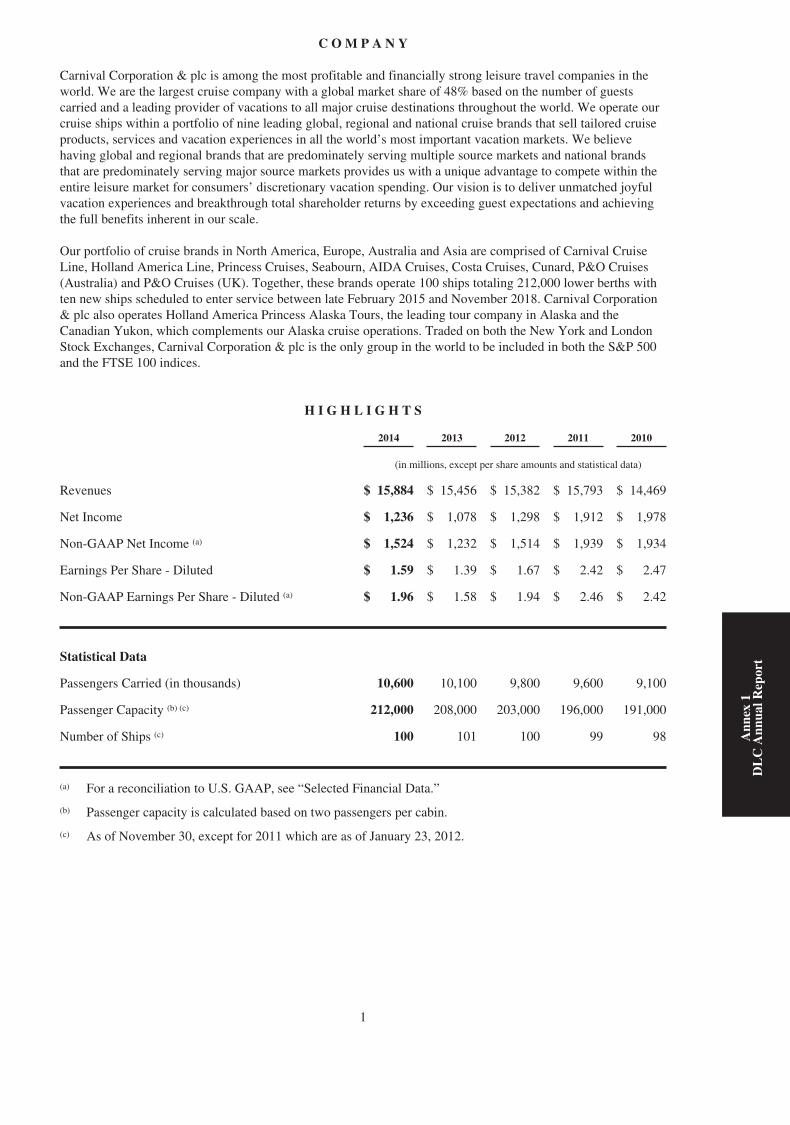
C O M P A N Y
Carnival Corporation & plc is among the most profitable and financially strong leisure travel companies in theworld. We are the largest cruise company with a global market share of 48% based on the number of guestscarried and a leading provider of vacations to all major cruise destinations throughout the world. We operate ourcruise ships within a portfolio of nine leading global, regional and national cruise brands that sell tailored cruiseproducts, services and vacation experiences in all the world’s most important vacation markets. We believehaving global and regional brands that are predominately serving multiple source markets and national brandsthat are predominately serving major source markets provides us with a unique advantage to compete within theentire leisure market for consumers’ discretionary vacation spending. Our vision is to deliver unmatched joyfulvacation experiences and breakthrough total shareholder returns by exceeding guest expectations and achievingthe full benefits inherent in our scale.
Our portfolio of cruise brands in North America, Europe, Australia and Asia are comprised of Carnival CruiseLine, Holland America Line, Princess Cruises, Seabourn, AIDA Cruises, Costa Cruises, Cunard, P&O Cruises(Australia) and P&O Cruises (UK). Together, these brands operate 100 ships totaling 212,000 lower berths withten new ships scheduled to enter service between late February 2015 and November 2018. Carnival Corporation& plc also operates Holland America Princess Alaska Tours, the leading tour company in Alaska and theCanadian Yukon, which complements our Alaska cruise operations. Traded on both the New York and LondonStock Exchanges, Carnival Corporation & plc is the only group in the world to be included in both the S&P 500and the FTSE 100 indices.
H I G H L I G H T S
2014 2013 2012 2011 2010
(in millions, except per share amounts and statistical data)
Revenues $ 15,884 $ 15,456 $ 15,382 $ 15,793 $ 14,469
Net Income $ 1,236 $ 1,078 $ 1,298 $ 1,912 $ 1,978
Non-GAAP Net Income (a) $ 1,524 $ 1,232 $ 1,514 $ 1,939 $ 1,934
Earnings Per Share - Diluted $ 1.59 $ 1.39 $ 1.67 $ 2.42 $ 2.47
Non-GAAP Earnings Per Share - Diluted (a) $ 1.96 $ 1.58 $ 1.94 $ 2.46 $ 2.42
Statistical Data
Passengers Carried (in thousands) 10,600 10,100 9,800 9,600 9,100
Passenger Capacity (b) (c) 212,000 208,000 203,000 196,000 191,000
Number of Ships (c) 100 101 100 99 98
(a) For a reconciliation to U.S. GAAP, see “Selected Financial Data.”
(b) Passenger capacity is calculated based on two passengers per cabin.
(c) As of November 30, except for 2011 which are as of January 23, 2012.
1
Ann
ex1
DL
CA
nnua
lRep
ort
CHIEF EXECUTIVE OFFICER’S LETTER TO SHAREHOLDERS
Dear Shareholders,
Achieving positive revenue yields and earnings growth of nearly 25 percent over 2013, we reached a significantinflection point for our company. Looking ahead, we are working hard to enable growth to accelerate in the yearsto come as we aggressively work toward delivering double-digit return on invested capital (“ROIC”).
In 2014, we achieved non-GAAP net income exceeding $1.5 billion and cash from operations of nearly $3.5billion, while containing costs and overcoming our share of obstacles, including the loss of higher yieldingitineraries due to geopolitical concerns and historically high industry capacity increases in the Caribbean. Thesestrong results were well above our 2014 guidance and a credit to the outstanding efforts of our 120,000 shipboardand shoreside team members who create exceptional vacation experiences each and every day for our more than10.5 million guests across the globe.
Our earnings growth in 2014 was driven by improved performance at our Costa Cruises and Carnival Cruise Linebrands. Costa experienced a further improvement in perception with an almost doubling of trust and confidencein Italy. Significantly, the brand experienced continued yield growth as well as improved profitability throughcollaboration across our Continental European brands.
Carnival Cruise Line was recognized as the most improved in consumer perception of any brand in any categoryin the United States in 2014 by YouGov. A number of initiatives introduced by Carnival Cruise Line such as theCarnival LIVE concert series, children’s programs Camp Ocean and Seuss at Sea, as well as the Great VacationGuarantee, are clearly resonating with guests.
New product initiatives and innovative marketing campaigns implemented across our brands over the past yearare driving increased demand. We experienced a sustained improvement in booking trends throughout 2014 andare gaining momentum in our efforts to drive ticket prices and onboard revenues higher.
THE PATH TO DOUBLE DIGIT ROIC
Measured Capacity Growth
In 2014, we continued progress toward enhancing our fleet while maintaining our commitment to measuredcapacity growth. We delivered two spectacular ships, Regal Princess and Costa Diadema. These new shipintroductions generated substantial media coverage and positive buzz, including the star studded North Americandebut of Regal Princess which featured a reunion of the “Love Boat” cast and 25 guest stars who appeared on thehit TV show. The delivery of Costa Diadema was equally stunning and included a festive inaugural in Genoa,Italy.
As we continue to advance our fleet, we have a number of ships that we expect to replace with newer, larger andmore fuel efficient vessels over time. These new ships will be more than double the size of those they arereplacing, offer higher yielding balcony cabins, more than 20 percent lower unit costs and greater than 35 percentimproved fuel efficiency.
We recently signed orders for three new ships for delivery in 2018 bringing the total order book to 10 vesselsover a four-year period. We also sold four of our smaller, less-efficient ships resulting in only a 3 percent netcapacity increase over this period and reinforcing our commitment to measured capacity growth.
Accelerating Demand
At the same time we are striving to drive additional demand. Cruising captures just a small percentage of theoverall vacation market. Consequently, our biggest opportunity is to increase cruise consideration amongconsumers. We have a number of initiatives underway to attract first-time cruisers through increased demand inestablished markets, as well as expansion into new markets.
We are continually implementing product enhancements across all our brands, and striving to deliver an evenbetter guest experience to increase retention and life-long advocacy. “Word of mouth” remains the most powerfultool in attracting first-time cruise guests.
We are unwaveringly focused on increasing demand on all fronts. That includes a significant public relationseffort across all brands to deliver our message to consumers that cruising is a great experience, at a great value.In fact, we enjoyed a significant increase in our collective share of voice globally in 2014 with our number ofpositive mentions more than doubling.
We have increased our investment in advertising, having spent over $600 million in 2014. We launched newmarketing campaigns in multiple regions. In North America, Carnival Cruise Line was the National Cruise Lineadvertiser of the Winter Olympics telecast while Princess Cruises launched its first television campaign in 10years. In addition, both Costa Cruises in Europe and P&O Cruises in the UK launched new advertisingcampaigns.
2

As we began 2015, we aired a new commercial on Super Bowl Sunday – the world’s biggest marketing stage.Our company’s first major multi-brand marketing initiative extended well beyond the Super Bowl itselfgarnering nearly 5 billion media impressions even before the game aired and more than 10 billion totalimpressions to date.
These efforts collectively help to drive demand for our brands that outpaces capacity, ultimately leading to higheryields.
New Market Opportunities
Asia, and in particular, China continues to be a focus for emerging market development, where we expectdouble-digit growth over the next few years. We expect China to be the largest cruise market in the world overtime. We were the first to enter the market through our Costa Cruises brand in 2006 and are currently the largestcruise operator in mainland China. This year we will lead the industry with four ships which will homeport out ofMainland China and more than 12 marketing offices in the region. To coordinate our growth strategy, our ChiefOperations Officer, Alan Buckelew, has relocated to China and we have entered into several strategic agreementsfocused on expanding the cruise industry in China.
We signed a memorandum of understanding (“MOU”) with China State Shipbuilding Corporation, China’slargest shipyard, and Italian shipbuilder, Fincantieri, to explore the possibility of shipbuilding and other strategicpartnerships to foster growth. We also signed a MOU with China Merchants Group, China’s oldest stateenterprise, to explore joint ventures in port and destination development, as well as other areas to successfullydevelop our industry.
We have clearly established a solid foothold as the largest cruise operator home-porting in China, and ourdevelopment strategy is accelerating.
Working Together to Unlock Our Potential
I feel strongly that our brands must remain independent, especially concerning the guest interface, yet worktogether to unlock the potential of leveraging our scale and collective expertise. We began 2014 with the first-ever global leadership team meeting that brought together our top 65 leaders from around the world and achievedremarkable alignment on our vision and top priorities. By strengthening our communication and coordination, weenjoyed some early wins on our revenue and cost cross-brand collaboration efforts.
We furthered our never-ending pursuit of capturing insights from our guests beginning with our segmentationstudy in North America, the first we have done across brands and the largest ever done in our industry. Weconducted extensive interviews with over 40,000 respondents and mined our 30 million past-guest database forinsight to help grow demand and onboard revenue.
We elevated our level of cross-brand global deployment planning to drive greater penetration and more effectivecapacity management. Additionally, we conducted our first deep dive examination of our revenue managementsystems to share best practices and identify gaps, new opportunities and tools.
Some early wins on our cost containment efforts already contributed $20 million of savings in 2014. Weanticipate another $70 to $80 million in cost reductions to benefit 2015 and have further opportunity to helpoffset inflation in the broader base of non-fuel purchases over time.
Sustainable Operations
We recognize our reputation and success depend on sustainable and transparent operations. We are committed toensuring cruising is the most enjoyable vacation experience possible for our guests. We maintain thiscommitment by keeping our guests and crewmembers safe, by protecting the environment, by developing ourworkforce, by strengthening our stakeholder relations, enhancing the port communities that our ships visit andmaintaining our fiscal strength.
Increasing our fuel efficiency remains at the cornerstone of our sustainability efforts. It is gratifying to say wehave reduced our unit fuel consumption by 25 percent since 2007, meeting our stated goal of delivering a 20percent reduction (per unit) in carbon emissions ahead of schedule. Over that time, our effort has saved over 1billion gallons of fuel and $2.5 billion in fuel costs. This efficiency improvement is a testament to the breadth ofefforts undertaken to reduce consumption.
Moreover, we have taken the lead on developing technology to mitigate the impact of new low-sulfur fuel usagerequirements which came into effect in January while maintaining our commitment to the pristine environmentsin which we have the great pleasure to sail. We are aggressively installing new air emissions technology onapproximately 70 percent of our fleet by 2017 while at the same time rolling out other energy efficienttechnology. These advancements are an important investment in the environment and lay a solid foundation forsustainable earnings improvement.
3
Ann
ex1
DL
CA
nnua
lRep
ort
EXECUTING ALONG THE PATH
We believe we are executing along a clear path toward double-digit ROIC. We improved ROIC by nearly onepercentage point in 2014 and expect another percentage point of improvement in 2015. We continue to managethe total capital plan with a keen eye toward exceeding guest expectations, while at the same time maintainingfiscal discipline.
Our collective efforts created significant value for shareholders in fiscal 2014, with our share price advancingover 22 percent as well as returning nearly $800 million in dividends.
Importantly, the ground work for continued progress is laid and we are firmly on a path to deliver double-digitROIC in the next three to four years.
In closing, I thank our Board for their counsel and support throughout the past year and I thank our managementfor their strong leadership in moving our company forward. For his contribution, I especially thank Gerry Cahill,an invaluable leader who retired after more than 20 years, and most recently served as President and CEO of theCarnival Cruise Line brand. We welcome Christine Duffy, the new head of Carnival Cruise Line, OrlandoAshford, the new head of Holland America Line and Neil Palombo, the new head of Costa Cruises — threestrong additions to our very capable leadership team.
Our business, or any business, is all about the people. One out of every two guests who cruise anywhere in theworld cruise on one of our nine brands and 100 ships. That is only possible because of the extraordinary effortsof our employees worldwide who passionately and consistently deliver joyful and memorable vacationexperiences for our guests, as well as our travel agent partners around the globe who support our brands. I thankthem all. My sincerest appreciation to our shareholders and, of course, our more than 10.5 million valued guestsfor choosing to spend their vacation with us. I look forward to welcoming you aboard again soon.
Arnold W. DonaldPresident and Chief Executive OfficerFebruary 20, 2015
4
SHAREHOLDER BENEFITCarnival Corporation & plc is pleased to extend the following benefit to our shareholders:
NORTH AMERICABRANDS
CONTINENTALEUROPEBRANDS
UNITED KINGDOMBRANDS
AUSTRALIABRANDS
Onboard credit per stateroom on sailings of 14 days or longer US $250 €200 £150 A$250Onboard credit per stateroom on sailings of 7 to 13 days US $100 € 75 £ 60 A$100Onboard credit per stateroom on sailings of 6 days or less US $ 50 € 40 £ 30 A$ 50
The benefit is applicable on sailings through July 31, 2016 aboard the brands listed below. Certain restrictions apply. Applications to receivethese benefits should be made at least two weeks prior to cruise departure date.
This benefit is available to shareholders holding a minimum of 100 shares of Carnival Corporation or Carnival plc. Employees, travel agentscruising at travel agent rates, tour conductors or anyone cruising on a reduced-rate or complimentary basis are excluded from this offer. Thisbenefit is not transferable, cannot be exchanged for cash and, cannot be used for casino credits/charges and gratuities charged to your onboardaccount. Only one onboard credit per shareholder-occupied stateroom. Reservations must be made by February 29, 2016.
Please provide by fax or by mail your name, reservation number, ship and sailing date, along with proof of ownership of Carnival Corporationor Carnival plc shares (for example, photocopy of shareholder proxy card, shares certificate, a dividend tax voucher or a current brokerage ornominee statement with your brokerage account number blacked out) to your travel agent or to the cruise line you have selected below.
NORTH AMERICA BRANDS
CARNIVAL CRUISE LINE*
Guest Administration3655 N.W. 87th AvenueMiami, FL 33178Tel 800 438 6744 ext. 70450Fax 305 406 6102
PRINCESS CRUISES*
Booking Support24303 Town Center Drive, Suite 200Santa Clarita, CA 91355Tel 800 872 6779 ext. 30317Fax 661 753 0180
HOLLAND AMERICA LINE
World Cruise Reservations300 Elliott Avenue WestSeattle, WA 98119Tel 800 522 3399Fax 206 281 0627
SEABOURN
Seabourn Reservations300 Elliott Avenue WestSeattle, WA 98119Tel 800 929 9391Fax 206 501 2900
CUNARD*
Booking Support24303 Town Center Drive, Suite 200Santa Clarita, CA 91355Tel 800 872 6779 ext. 30317Fax 661 753 0180
COSTA CRUISES*
Guest Services Administration200 S. Park Road, Suite 200Hollywood, FL 33021Tel 800 462 6782Fax 954 266 5868
CONTINENTAL EUROPE BRANDS
COSTA CRUISES*
Manager of ReservationPiazza Piccapietra, 4816121 Genoa, ItalyTel 39 0 10 548 3800Fax 39 0 10 999 7019
AIDA CRUISES
Manager of ReservationsAm Strande 3d18055 Rostock, GermanyTel 49 0 381 2027 0805Fax 49 0 381 2027 0804
UNITED KINGDOM BRANDS
P & O CRUISES (UK),CUNARD*PRINCESS CRUISES (UK)*
Carnival UKCarnival House100 Harbour ParadeSouthampton SO15 1STUnited Kingdom
P & O CRUISES (UK)Tel 44 0 843 374 0111Fax 44 0 238 065 7360
CUNARDTel 44 0 843 374 0000Fax 44 0 238 065 7360
PRINCESS CRUISES (UK)Tel 44 0 843 373 0333Fax 44 0 238 065 7509
AUSTRALIA BRANDS
P & O CRUISES (AUSTRALIA),PRINCESS CRUISES*CARNIVAL CRUISE LINE*
Customer Service ManagerPO Box 2006North Sydney NSW 2059Tel 61 2 8 424 8800Fax 61 2 8 424 9161
* The onboard credit for Carnival CruiseLine, Costa Cruises, Cunard and PrincessCruises is determined based on theoperational currency onboard the vessel.
5
Ann
ex1
DL
CA
nnua
lRep
ort
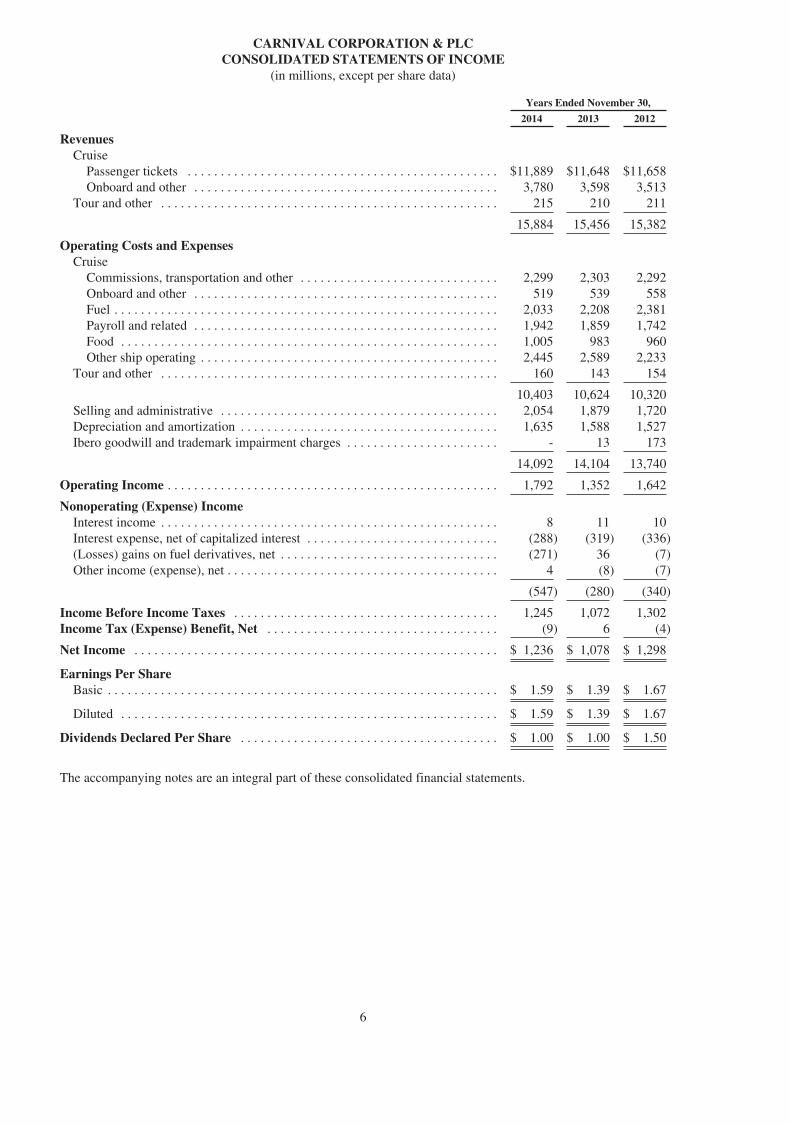
CARNIVAL CORPORATION & PLCCONSOLIDATED STATEMENTS OF INCOME
(in millions, except per share data)
Years Ended November 30,
2014 2013 2012
RevenuesCruise
Passenger tickets . . . . . . . . . . . . . . . . . . . . . . . . . . . . . . . . . . . . . . . . . . . . . . . $11,889 $11,648 $11,658Onboard and other . . . . . . . . . . . . . . . . . . . . . . . . . . . . . . . . . . . . . . . . . . . . . . 3,780 3,598 3,513
Tour and other . . . . . . . . . . . . . . . . . . . . . . . . . . . . . . . . . . . . . . . . . . . . . . . . . . . 215 210 211
15,884 15,456 15,382
Operating Costs and ExpensesCruise
Commissions, transportation and other . . . . . . . . . . . . . . . . . . . . . . . . . . . . . . 2,299 2,303 2,292Onboard and other . . . . . . . . . . . . . . . . . . . . . . . . . . . . . . . . . . . . . . . . . . . . . . 519 539 558Fuel . . . . . . . . . . . . . . . . . . . . . . . . . . . . . . . . . . . . . . . . . . . . . . . . . . . . . . . . . . 2,033 2,208 2,381Payroll and related . . . . . . . . . . . . . . . . . . . . . . . . . . . . . . . . . . . . . . . . . . . . . . 1,942 1,859 1,742Food . . . . . . . . . . . . . . . . . . . . . . . . . . . . . . . . . . . . . . . . . . . . . . . . . . . . . . . . . 1,005 983 960Other ship operating . . . . . . . . . . . . . . . . . . . . . . . . . . . . . . . . . . . . . . . . . . . . . 2,445 2,589 2,233
Tour and other . . . . . . . . . . . . . . . . . . . . . . . . . . . . . . . . . . . . . . . . . . . . . . . . . . . 160 143 154
10,403 10,624 10,320Selling and administrative . . . . . . . . . . . . . . . . . . . . . . . . . . . . . . . . . . . . . . . . . . 2,054 1,879 1,720Depreciation and amortization . . . . . . . . . . . . . . . . . . . . . . . . . . . . . . . . . . . . . . . 1,635 1,588 1,527Ibero goodwill and trademark impairment charges . . . . . . . . . . . . . . . . . . . . . . . - 13 173
14,092 14,104 13,740
Operating Income . . . . . . . . . . . . . . . . . . . . . . . . . . . . . . . . . . . . . . . . . . . . . . . . . . 1,792 1,352 1,642
Nonoperating (Expense) IncomeInterest income . . . . . . . . . . . . . . . . . . . . . . . . . . . . . . . . . . . . . . . . . . . . . . . . . . . 8 11 10Interest expense, net of capitalized interest . . . . . . . . . . . . . . . . . . . . . . . . . . . . . (288) (319) (336)(Losses) gains on fuel derivatives, net . . . . . . . . . . . . . . . . . . . . . . . . . . . . . . . . . (271) 36 (7)Other income (expense), net . . . . . . . . . . . . . . . . . . . . . . . . . . . . . . . . . . . . . . . . . 4 (8) (7)
(547) (280) (340)
Income Before Income Taxes . . . . . . . . . . . . . . . . . . . . . . . . . . . . . . . . . . . . . . . . 1,245 1,072 1,302Income Tax (Expense) Benefit, Net . . . . . . . . . . . . . . . . . . . . . . . . . . . . . . . . . . . (9) 6 (4)
Net Income . . . . . . . . . . . . . . . . . . . . . . . . . . . . . . . . . . . . . . . . . . . . . . . . . . . . . . . $ 1,236 $ 1,078 $ 1,298
Earnings Per ShareBasic . . . . . . . . . . . . . . . . . . . . . . . . . . . . . . . . . . . . . . . . . . . . . . . . . . . . . . . . . . . $ 1.59 $ 1.39 $ 1.67
Diluted . . . . . . . . . . . . . . . . . . . . . . . . . . . . . . . . . . . . . . . . . . . . . . . . . . . . . . . . . $ 1.59 $ 1.39 $ 1.67
Dividends Declared Per Share . . . . . . . . . . . . . . . . . . . . . . . . . . . . . . . . . . . . . . . $ 1.00 $ 1.00 $ 1.50
The accompanying notes are an integral part of these consolidated financial statements.
6
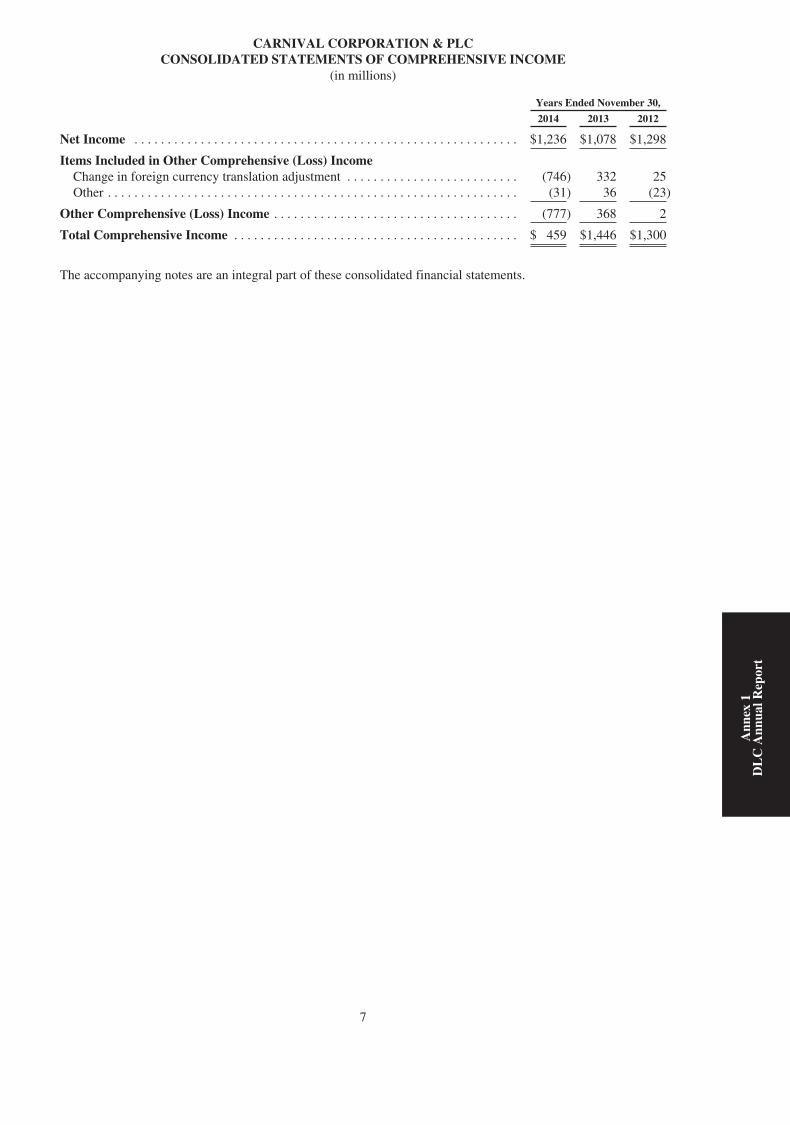
CARNIVAL CORPORATION & PLCCONSOLIDATED STATEMENTS OF COMPREHENSIVE INCOME
(in millions)
Years Ended November 30,
2014 2013 2012
Net Income . . . . . . . . . . . . . . . . . . . . . . . . . . . . . . . . . . . . . . . . . . . . . . . . . . . . . . . . . . $1,236 $1,078 $1,298
Items Included in Other Comprehensive (Loss) IncomeChange in foreign currency translation adjustment . . . . . . . . . . . . . . . . . . . . . . . . . . (746) 332 25Other . . . . . . . . . . . . . . . . . . . . . . . . . . . . . . . . . . . . . . . . . . . . . . . . . . . . . . . . . . . . . . (31) 36 (23)
Other Comprehensive (Loss) Income . . . . . . . . . . . . . . . . . . . . . . . . . . . . . . . . . . . . . (777) 368 2
Total Comprehensive Income . . . . . . . . . . . . . . . . . . . . . . . . . . . . . . . . . . . . . . . . . . . $ 459 $1,446 $1,300
The accompanying notes are an integral part of these consolidated financial statements.
7
Ann
ex1
DL
CA
nnua
lRep
ort

CARNIVAL CORPORATION & PLCCONSOLIDATED BALANCE SHEETS
(in millions, except par values)
November 30,
2014 2013
ASSETSCurrent Assets
Cash and cash equivalents . . . . . . . . . . . . . . . . . . . . . . . . . . . . . . . . . . . . . . . . . . . . . . . . . . $ 331 $ 462Trade and other receivables, net . . . . . . . . . . . . . . . . . . . . . . . . . . . . . . . . . . . . . . . . . . . . . 332 405Insurance recoverables . . . . . . . . . . . . . . . . . . . . . . . . . . . . . . . . . . . . . . . . . . . . . . . . . . . . 154 381Inventories . . . . . . . . . . . . . . . . . . . . . . . . . . . . . . . . . . . . . . . . . . . . . . . . . . . . . . . . . . . . . . 364 374Prepaid expenses and other . . . . . . . . . . . . . . . . . . . . . . . . . . . . . . . . . . . . . . . . . . . . . . . . . 322 315
Total current assets . . . . . . . . . . . . . . . . . . . . . . . . . . . . . . . . . . . . . . . . . . . . . . . . . . . . . 1,503 1,937
Property and Equipment, Net . . . . . . . . . . . . . . . . . . . . . . . . . . . . . . . . . . . . . . . . . . . . . . . 32,773 32,905Goodwill . . . . . . . . . . . . . . . . . . . . . . . . . . . . . . . . . . . . . . . . . . . . . . . . . . . . . . . . . . . . . . . . . 3,127 3,210Other Intangibles . . . . . . . . . . . . . . . . . . . . . . . . . . . . . . . . . . . . . . . . . . . . . . . . . . . . . . . . . . 1,270 1,292Other Assets . . . . . . . . . . . . . . . . . . . . . . . . . . . . . . . . . . . . . . . . . . . . . . . . . . . . . . . . . . . . . . 859 760
$39,532 $40,104
LIABILITIES AND SHAREHOLDERS’ EQUITYCurrent Liabilities
Short-term borrowings . . . . . . . . . . . . . . . . . . . . . . . . . . . . . . . . . . . . . . . . . . . . . . . . . . . . . $ 666 $ 60Current portion of long-term debt . . . . . . . . . . . . . . . . . . . . . . . . . . . . . . . . . . . . . . . . . . . . 1,059 1,408Accounts payable . . . . . . . . . . . . . . . . . . . . . . . . . . . . . . . . . . . . . . . . . . . . . . . . . . . . . . . . . 626 639Claims reserve . . . . . . . . . . . . . . . . . . . . . . . . . . . . . . . . . . . . . . . . . . . . . . . . . . . . . . . . . . . 262 456Accrued liabilities and other . . . . . . . . . . . . . . . . . . . . . . . . . . . . . . . . . . . . . . . . . . . . . . . . 1,276 1,126Customer deposits . . . . . . . . . . . . . . . . . . . . . . . . . . . . . . . . . . . . . . . . . . . . . . . . . . . . . . . . 3,032 3,031
Total current liabilities . . . . . . . . . . . . . . . . . . . . . . . . . . . . . . . . . . . . . . . . . . . . . . . . . . . 6,921 6,720
Long-Term Debt . . . . . . . . . . . . . . . . . . . . . . . . . . . . . . . . . . . . . . . . . . . . . . . . . . . . . . . . . . 7,363 8,092Other Long-Term Liabilities . . . . . . . . . . . . . . . . . . . . . . . . . . . . . . . . . . . . . . . . . . . . . . . . 960 736Commitments and ContingenciesShareholders’ Equity
Common stock of Carnival Corporation, $0.01 par value; 1,960 shares authorized; 652shares at 2014 and 651 shares at 2013 issued . . . . . . . . . . . . . . . . . . . . . . . . . . . . . . . . . 7 7
Ordinary shares of Carnival plc, $1.66 par value; 216 shares at 2014 and 2013 issued . . . 358 358Additional paid-in capital . . . . . . . . . . . . . . . . . . . . . . . . . . . . . . . . . . . . . . . . . . . . . . . . . . 8,384 8,325Retained earnings . . . . . . . . . . . . . . . . . . . . . . . . . . . . . . . . . . . . . . . . . . . . . . . . . . . . . . . . 19,242 18,782Accumulated other comprehensive (loss) income . . . . . . . . . . . . . . . . . . . . . . . . . . . . . . . . (616) 161Treasury stock, 59 shares at 2014 and 2013 of Carnival Corporation and 32 shares at
2014 and 2013 of Carnival plc, at cost . . . . . . . . . . . . . . . . . . . . . . . . . . . . . . . . . . . . . . (3,087) (3,077)
Total shareholders’ equity . . . . . . . . . . . . . . . . . . . . . . . . . . . . . . . . . . . . . . . . . . . . . . 24,288 24,556
$39,532 $40,104
The accompanying notes are an integral part of these consolidated financial statements.
8

CARNIVAL CORPORATION & PLCCONSOLIDATED STATEMENTS OF CASH FLOWS
(in millions)
Years Ended November 30,
2014 2013 2012
OPERATING ACTIVITIESNet income . . . . . . . . . . . . . . . . . . . . . . . . . . . . . . . . . . . . . . . . . . . . . . . . . . . . . . . . $ 1,236 $ 1,078 $ 1,298Adjustments to reconcile net income to net cash provided by operating activities
Depreciation and amortization . . . . . . . . . . . . . . . . . . . . . . . . . . . . . . . . . . . . . . . 1,635 1,588 1,527Losses on ship sales and ship impairments, net . . . . . . . . . . . . . . . . . . . . . . . . . . 2 163 49Goodwill, trademark and other impairment charges . . . . . . . . . . . . . . . . . . . . . . - 27 173Share-based compensation . . . . . . . . . . . . . . . . . . . . . . . . . . . . . . . . . . . . . . . . . . 52 42 39Losses (gains) on fuel derivatives, net . . . . . . . . . . . . . . . . . . . . . . . . . . . . . . . . . 271 (36) 7Other, net . . . . . . . . . . . . . . . . . . . . . . . . . . . . . . . . . . . . . . . . . . . . . . . . . . . . . . . 35 35 12
Changes in operating assets and liabilitiesReceivables . . . . . . . . . . . . . . . . . . . . . . . . . . . . . . . . . . . . . . . . . . . . . . . . . . . . . 75 (128) (15)Inventories . . . . . . . . . . . . . . . . . . . . . . . . . . . . . . . . . . . . . . . . . . . . . . . . . . . . . . 1 19 (16)Insurance recoverables, prepaid expenses and other . . . . . . . . . . . . . . . . . . . . . . 401 402 148Accounts payable . . . . . . . . . . . . . . . . . . . . . . . . . . . . . . . . . . . . . . . . . . . . . . . . . 9 79 (24)Claims reserves and accrued and other liabilities . . . . . . . . . . . . . . . . . . . . . . . . (379) (330) (192)Customer deposits . . . . . . . . . . . . . . . . . . . . . . . . . . . . . . . . . . . . . . . . . . . . . . . . 92 (105) (7)
Net cash provided by operating activities . . . . . . . . . . . . . . . . . . . . . . . . . . . . 3,430 2,834 2,999
INVESTING ACTIVITIESAdditions to property and equipment . . . . . . . . . . . . . . . . . . . . . . . . . . . . . . . . . . . (2,583) (2,149) (2,332)Proceeds from sale of ships . . . . . . . . . . . . . . . . . . . . . . . . . . . . . . . . . . . . . . . . . . . 42 70 46Insurance proceeds for a ship . . . . . . . . . . . . . . . . . . . . . . . . . . . . . . . . . . . . . . . . . . - - 508Other, net . . . . . . . . . . . . . . . . . . . . . . . . . . . . . . . . . . . . . . . . . . . . . . . . . . . . . . . . . 34 23 6
Net cash used in investing activities . . . . . . . . . . . . . . . . . . . . . . . . . . . . . . . . (2,507) (2,056) (1,772)
FINANCING ACTIVITIESProceeds from (repayments of) short-term borrowings, net . . . . . . . . . . . . . . . . . . 617 4 (224)Principal repayments of long-term debt . . . . . . . . . . . . . . . . . . . . . . . . . . . . . . . . . (2,466) (2,212) (1,052)Proceeds from issuance of long-term debt . . . . . . . . . . . . . . . . . . . . . . . . . . . . . . . . 1,626 2,687 946Dividends paid . . . . . . . . . . . . . . . . . . . . . . . . . . . . . . . . . . . . . . . . . . . . . . . . . . . . . (776) (1,164) (779)Purchases of treasury stock . . . . . . . . . . . . . . . . . . . . . . . . . . . . . . . . . . . . . . . . . . . - (138) (90)Sales of treasury stock . . . . . . . . . . . . . . . . . . . . . . . . . . . . . . . . . . . . . . . . . . . . . . . - 35 -Other, net . . . . . . . . . . . . . . . . . . . . . . . . . . . . . . . . . . . . . . . . . . . . . . . . . . . . . . . . . (29) 8 9
Net cash used in financing activities . . . . . . . . . . . . . . . . . . . . . . . . . . . . . . . . (1,028) (780) (1,190)
Effect of exchange rate changes on cash and cash equivalents . . . . . . . . . . . . . . . . (26) (1) (22)
Net (decrease) increase in cash and cash equivalents . . . . . . . . . . . . . . . . . . . (131) (3) 15Cash and cash equivalents at beginning of year . . . . . . . . . . . . . . . . . . . . . . . . . . . 462 465 450
Cash and cash equivalents at end of year . . . . . . . . . . . . . . . . . . . . . . . . . . . . . . . . $ 331 $ 462 $ 465
The accompanying notes are an integral part of these consolidated financial statements.
9
Ann
ex1
DL
CA
nnua
lRep
ort
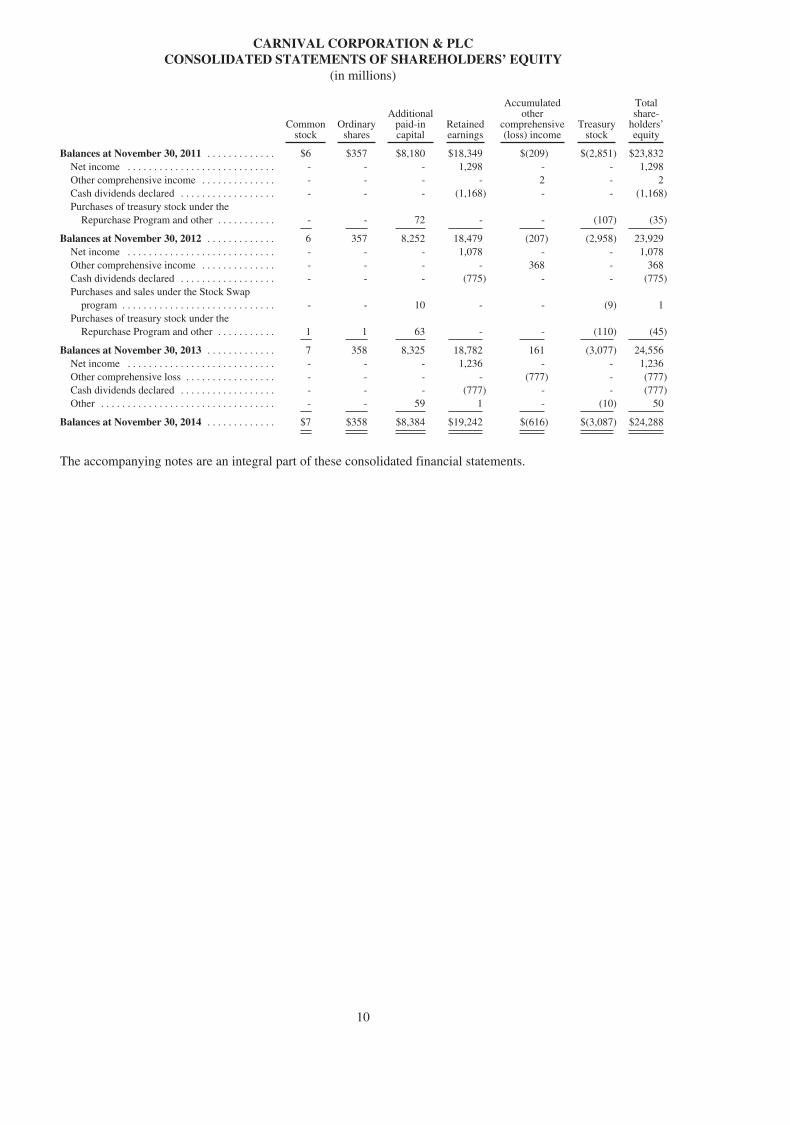
CARNIVAL CORPORATION & PLCCONSOLIDATED STATEMENTS OF SHAREHOLDERS’ EQUITY
(in millions)
Commonstock
Ordinaryshares
Additionalpaid-incapital
Retainedearnings
Accumulatedother
comprehensive(loss) income
Treasurystock
Totalshare-
holders’equity
Balances at November 30, 2011 . . . . . . . . . . . . . $6 $357 $8,180 $18,349 $(209) $(2,851) $23,832Net income . . . . . . . . . . . . . . . . . . . . . . . . . . . . - - - 1,298 - - 1,298Other comprehensive income . . . . . . . . . . . . . . - - - - 2 - 2Cash dividends declared . . . . . . . . . . . . . . . . . . - - - (1,168) - - (1,168)Purchases of treasury stock under the
Repurchase Program and other . . . . . . . . . . . - - 72 - - (107) (35)
Balances at November 30, 2012 . . . . . . . . . . . . . 6 357 8,252 18,479 (207) (2,958) 23,929Net income . . . . . . . . . . . . . . . . . . . . . . . . . . . . - - - 1,078 - - 1,078Other comprehensive income . . . . . . . . . . . . . . - - - - 368 - 368Cash dividends declared . . . . . . . . . . . . . . . . . . - - - (775) - - (775)Purchases and sales under the Stock Swap
program . . . . . . . . . . . . . . . . . . . . . . . . . . . . . - - 10 - - (9) 1Purchases of treasury stock under the
Repurchase Program and other . . . . . . . . . . . 1 1 63 - - (110) (45)
Balances at November 30, 2013 . . . . . . . . . . . . . 7 358 8,325 18,782 161 (3,077) 24,556Net income . . . . . . . . . . . . . . . . . . . . . . . . . . . . - - - 1,236 - - 1,236Other comprehensive loss . . . . . . . . . . . . . . . . . - - - - (777) - (777)Cash dividends declared . . . . . . . . . . . . . . . . . . - - - (777) - - (777)Other . . . . . . . . . . . . . . . . . . . . . . . . . . . . . . . . . - - 59 1 - (10) 50
Balances at November 30, 2014 . . . . . . . . . . . . . $7 $358 $8,384 $19,242 $(616) $(3,087) $24,288
The accompanying notes are an integral part of these consolidated financial statements.
10
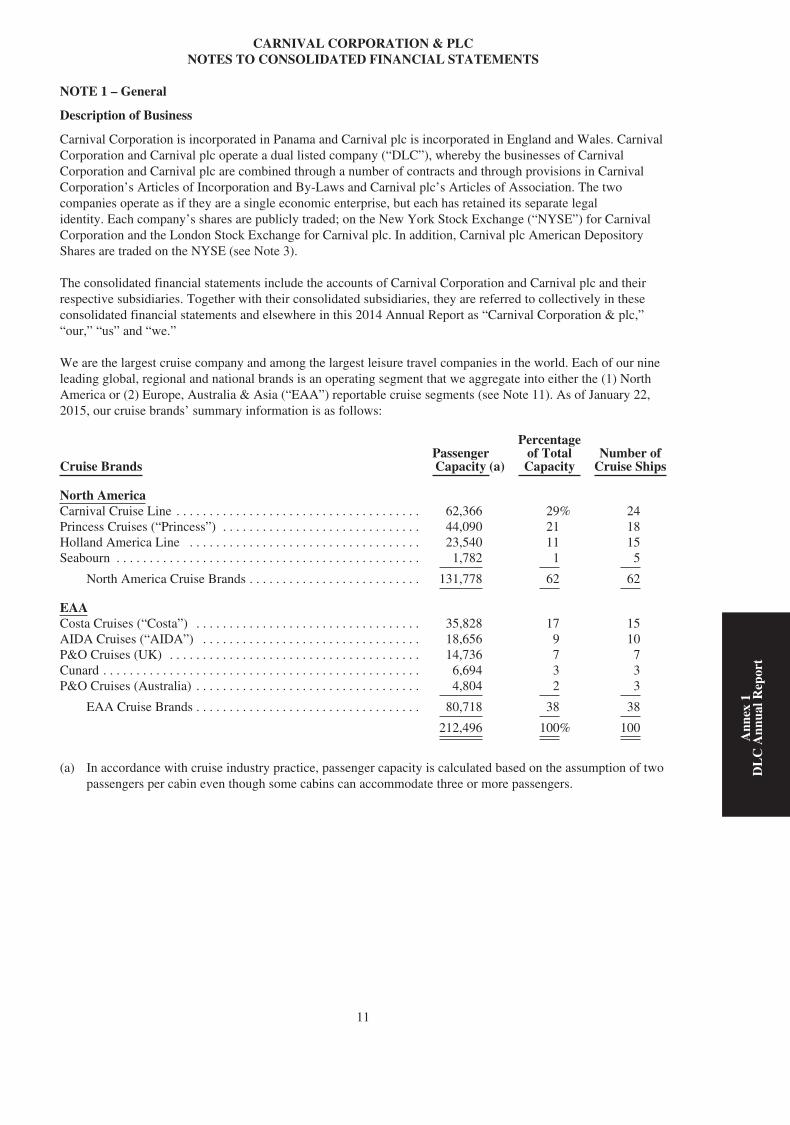
CARNIVAL CORPORATION & PLCNOTES TO CONSOLIDATED FINANCIAL STATEMENTS
NOTE 1 – General
Description of Business
Carnival Corporation is incorporated in Panama and Carnival plc is incorporated in England and Wales. CarnivalCorporation and Carnival plc operate a dual listed company (“DLC”), whereby the businesses of CarnivalCorporation and Carnival plc are combined through a number of contracts and through provisions in CarnivalCorporation’s Articles of Incorporation and By-Laws and Carnival plc’s Articles of Association. The twocompanies operate as if they are a single economic enterprise, but each has retained its separate legalidentity. Each company’s shares are publicly traded; on the New York Stock Exchange (“NYSE”) for CarnivalCorporation and the London Stock Exchange for Carnival plc. In addition, Carnival plc American DepositoryShares are traded on the NYSE (see Note 3).
The consolidated financial statements include the accounts of Carnival Corporation and Carnival plc and theirrespective subsidiaries. Together with their consolidated subsidiaries, they are referred to collectively in theseconsolidated financial statements and elsewhere in this 2014 Annual Report as “Carnival Corporation & plc,”“our,” “us” and “we.”
We are the largest cruise company and among the largest leisure travel companies in the world. Each of our nineleading global, regional and national brands is an operating segment that we aggregate into either the (1) NorthAmerica or (2) Europe, Australia & Asia (“EAA”) reportable cruise segments (see Note 11). As of January 22,2015, our cruise brands’ summary information is as follows:
Cruise BrandsPassengerCapacity (a)
Percentageof TotalCapacity
Number ofCruise Ships
North AmericaCarnival Cruise Line . . . . . . . . . . . . . . . . . . . . . . . . . . . . . . . . . . . . . 62,366 29% 24Princess Cruises (“Princess”) . . . . . . . . . . . . . . . . . . . . . . . . . . . . . . 44,090 21 18Holland America Line . . . . . . . . . . . . . . . . . . . . . . . . . . . . . . . . . . . 23,540 11 15Seabourn . . . . . . . . . . . . . . . . . . . . . . . . . . . . . . . . . . . . . . . . . . . . . . 1,782 1 5
North America Cruise Brands . . . . . . . . . . . . . . . . . . . . . . . . . . 131,778 62 62
EAACosta Cruises (“Costa”) . . . . . . . . . . . . . . . . . . . . . . . . . . . . . . . . . . 35,828 17 15AIDA Cruises (“AIDA”) . . . . . . . . . . . . . . . . . . . . . . . . . . . . . . . . . 18,656 9 10P&O Cruises (UK) . . . . . . . . . . . . . . . . . . . . . . . . . . . . . . . . . . . . . . 14,736 7 7Cunard . . . . . . . . . . . . . . . . . . . . . . . . . . . . . . . . . . . . . . . . . . . . . . . . 6,694 3 3P&O Cruises (Australia) . . . . . . . . . . . . . . . . . . . . . . . . . . . . . . . . . . 4,804 2 3
EAA Cruise Brands . . . . . . . . . . . . . . . . . . . . . . . . . . . . . . . . . . 80,718 38 38
212,496 100% 100
(a) In accordance with cruise industry practice, passenger capacity is calculated based on the assumption of twopassengers per cabin even though some cabins can accommodate three or more passengers.
11
Ann
ex1
DL
CA
nnua
lRep
ort
NOTE 2 – Summary of Significant Accounting Policies
Basis of Presentation
We consolidate entities over which we have control, as typically evidenced by a voting control of greater than 50%or for which we are the primary beneficiary, whereby we have the power to direct the most significant activities andthe obligation to absorb significant losses or receive significant benefits from the entity (see Note 3). We do notseparately present our noncontrolling interests in the consolidated financial statements since the amounts areinsignificant. For affiliates we do not control but where significant influence over financial and operating policiesexists, as typically evidenced by a voting control of 20% to 50%, the investment is accounted for using the equitymethod.
Preparation of Financial Statements
The preparation of our consolidated financial statements in conformity with accounting principles generallyaccepted in the United States of America requires management to make estimates and assumptions that affect theamounts reported and disclosed in our financial statements. Actual results may differ from the estimates used inpreparing our consolidated financial statements. All significant intercompany balances and transactions areeliminated in consolidation. Certain prior period amounts have been reclassified in the Consolidated BalanceSheets and the Consolidated Statements of Cash Flows to conform to the current period presentation. Thereclassifications in the Consolidated Statements of Cash Flows had no impact on net cash provided by operatingactivities and net cash used in investing and financing activities.
Cash and Cash Equivalents
Cash and cash equivalents include investments with maturities of three months or less at acquisition, which arestated at cost. At November 30, 2014 and 2013, cash and cash equivalents are comprised of cash on hand, moneymarket funds and time deposits.
Inventories
Inventories consist substantially of food and beverages, hotel and restaurant products and supplies, fuel and giftshop merchandise held for resale, which are all carried at the lower of cost or market. Cost is determined usingthe weighted-average or first-in, first-out methods.
Property and Equipment
Property and equipment are stated at cost. Depreciation and amortization were computed using the straight-linemethod over our estimates of useful lives and residual values, as a percentage of original cost, as follows:
YearsResidualValues
Ships . . . . . . . . . . . . . . . . . . . . . . . . . . . . . . . . . . . . . . . . . . . . . . . . . . . 30 15%Ship improvements . . . . . . . . . . . . . . . . . . . . . . . . . . . . . . . . . . . . . . . . Shorter of remaining ship
life or useful life (3-28)0%
Buildings and improvements . . . . . . . . . . . . . . . . . . . . . . . . . . . . . . . . 10-35 0% or 10%Computer hardware and software . . . . . . . . . . . . . . . . . . . . . . . . . . . . 3-10 0% or 10%Transportation equipment and other . . . . . . . . . . . . . . . . . . . . . . . . . . 3-20 0% or 10%Leasehold improvements, including port facilities . . . . . . . . . . . . . . . Shorter of lease term or
related asset life (3-30)-
The cruise industry is very capital intensive, and at January 22, 2015, we operated 100 cruise ships. Therefore,we have a capital program that we develop for the improvement of our ships and for asset replacements in orderto enhance the effectiveness and efficiency of our operations; comply with, or exceed all relevant legal andstatutory requirements related to health, environment, safety, security and sustainability; and gain strategicbenefits or provide newer improved product innovations to our guests.
Ship improvement costs that we believe add value to our ships, such as those discussed above, are capitalized tothe ships and depreciated over the shorter of their or the ships’ estimated remaining useful life, while costs ofrepairs and maintenance, including minor improvement costs and dry-dock expenses, are charged to expense asincurred and included in other ship operating expenses. Dry-dock costs primarily represent planned major
12
maintenance activities that are incurred when a ship is taken out-of-service for scheduled maintenance. Wecapitalize interest as part of the cost of acquiring ships and other capital projects during their construction period.The specifically identified or estimated cost and accumulated depreciation of previously capitalized shipcomponents are written-off upon retirement, which may result in a loss on disposal that is also included in othership operating expenses.
We review our long-lived assets, principally our ships, for impairment whenever events or changes incircumstances indicate that the carrying amounts of these assets may not be fully recoverable. Upon theoccurrence of a triggering event, the assessment of possible impairment is based on our ability to recover thecarrying value of our asset, which is determined by using the asset’s estimated undiscounted future cash flows. Ifthese estimated undiscounted future cash flows are less than the carrying value of the asset, an impairment chargeis recognized for the excess, if any, of the asset’s carrying value over its estimated fair value. As it relates to ourships, the lowest level for which we maintain identifiable cash flows that are independent of the cash flows ofother assets and liabilities is at the individual ship level.
A significant amount of judgment is required in estimating the future cash flows and fair values of our cruiseships.
Intangibles
Goodwill represents the excess of the purchase price over the fair value of identifiable net assets acquired in abusiness acquisition. We review our goodwill for impairment at least annually and, when events or circumstancesdictate, more frequently. All of our goodwill has been allocated to our reporting units, also referred to as “cruisebrands.” The impairment review for goodwill allows us to first assess qualitative factors to determine whether itis necessary to perform the more detailed two-step quantitative goodwill impairment test. We would perform thequantitative test if our qualitative assessment determined it is more-likely-than-not that a cruise brand’s estimatedfair value is less than its carrying amount. We may also elect to bypass the qualitative assessment and proceeddirectly to the quantitative test for any cruise brand. When performing the quantitative test, if the estimated fairvalue of the cruise brand exceeds its carrying value, no further analysis or write-down of goodwill is required.However, if the estimated fair value of the cruise brand is less than the carrying value of its net assets, theestimated fair value of the cruise brand is assigned to all its underlying assets and liabilities, including bothrecognized and unrecognized tangible and intangible assets, based on their fair values. If necessary, goodwill isthen written down to its implied fair value.
Trademarks represent substantially all of our other intangibles. For certain acquisitions, we have allocated a portion ofthe purchase prices to the acquiree’s identified trademarks. Trademarks are estimated to have an indefinite useful lifeand, therefore, are not amortizable, but are reviewed for impairment at least annually and, when events orcircumstances dictate, more frequently. The impairment review for trademarks also allows us to first assess qualitativefactors to determine whether it is necessary to perform a more detailed quantitative trademark impairment test. Wewould perform the quantitative test if our qualitative assessment determined it was more-likely-than-not that thetrademarks are impaired. We may also elect to bypass the qualitative assessment and proceed directly to thequantitative test. Our trademarks would be considered impaired if their carrying value exceeds their estimated fairvalue. The costs of developing and maintaining our trademarks are expensed as incurred.
A significant amount of judgment is also required in estimating the fair values of our cruise brands andtrademarks.
Revenue and Expense Recognition
Guest cruise deposits represent unearned revenues and are initially included in customer deposit liabilities whenreceived. Customer deposits are subsequently recognized as cruise revenues, together with revenues fromonboard and other activities, and all associated direct costs and expenses of a voyage are recognized as cruisecosts and expenses, upon completion of voyages with durations of ten nights or less and on a pro rata basis forvoyages in excess of ten nights. The impact of recognizing these shorter duration cruise revenues and costs andexpenses on a completed voyage basis versus on a pro rata basis is not significant. Future travel discountvouchers issued to guests are included as a reduction of cruise passenger ticket revenues when such vouchers areutilized. Guest cancellation fees are recognized in cruise passenger ticket revenues at the time of the cancellation.
Our sale to guests of air and other transportation to and from airports near the home ports of our ships and therelated cost of purchasing these services are included in cruise passenger ticket revenues and cruise
13
Ann
ex1
DL
CA
nnua
lRep
ort
transportation costs, respectively. The proceeds that we collect from the sales of third-party shore excursions andon behalf of our onboard concessionaires, net of the amounts remitted to them, are included in onboard and othercruise revenues as concession revenues. All of these amounts are recognized on a completed voyage or pro ratabasis as discussed above.
Cruise passenger ticket revenues include fees, taxes and charges collected by us from our guests. A portion ofthese fees, taxes and charges vary with guest head counts and are directly imposed on a revenue-producingarrangement. This portion of the fees, taxes and charges is expensed in commissions, transportation and othercosts when the corresponding revenues are recognized. These fees, taxes and charges included in passenger ticketrevenues and commissions, transportation and other costs were $532 million, $517 million and $477 million in2014, 2013 and 2012, respectively. The remaining portion of fees, taxes and charges are also included in cruisepassenger ticket revenues but are expensed in other ship operating expenses when the corresponding revenues arerecognized.
Revenues and expenses from our hotel and transportation operations, which are included in our Tour and Othersegment, are recognized at the time the services are performed or expenses are incurred. Revenues from the long-term leasing of ships, which are also included in our Tour and Other segment, are recognized ratably over theterm of the charter agreement using the straight-line method (see Note 11).
Insurance
We maintain insurance to cover a number of risks including illness and injury to crew, guest injuries, pollution,other third-party claims in connection with our cruise activities, damages to hull and machinery for each of ourships, war risks, workers’ compensation, employee health, directors and officers liability, property damages andgeneral liabilities for third-party claims. We recognize insurance recoverables from third-party insurers forincurred expenses at the time the recovery is probable and upon realization for amounts in excess of incurredexpenses. All of our insurance policies are subject to coverage limits, exclusions and deductible levels. Theliabilities associated with crew illnesses and crew and guest injury claims, including all legal costs, are estimatedbased on the specific merits of the individual claims or actuarially estimated based on historical claimsexperience, loss development factors and other assumptions. While we believe our estimated accrued claimsreserves are adequate, the ultimate losses will differ.
At November 30, 2014 and 2013, substantially all of our aggregated short-term and long-term insurancerecoverables are for crew, guest and other third-party claims related to the January 2012 ship incident. AtNovember 30, 2014 and 2013, the majority of our aggregated short-term and long-term claims reserves alsorelate to this January 2012 ship incident. At November 30, 2014 and 2013, our long-term insurance recoverablesand long-term claims reserve are included in other assets and other long-term liabilities, respectively, and are notmaterial.
Selling and Administrative Expenses
Selling expenses include a broad range of advertising, such as marketing and promotional expenses. Advertisingis charged to expense as incurred, except for media production costs. Brochures and media production costs arerecorded as prepaid expenses and charged to expense as consumed or upon the first airing of the advertisement,respectively. Advertising expenses totaled $623 million, $588 million and $527 million in 2014, 2013 and 2012,respectively. Administrative expenses represent the costs of our shoreside ship support, reservations and otheradministrative functions, and includes salaries and related benefits, professional fees and occupancy costs, whichare typically expensed as incurred.
Foreign Currency Translations and Transactions
Each business determines its functional currency by reference to its primary economic environment. We translatethe assets and liabilities of our foreign operations that have functional currencies other than the U.S. dollar atexchange rates in effect at the balance sheet date. Revenues and expenses of these foreign operations aretranslated at weighted-average exchange rates for the period. Their equity is translated at historical rates and theresulting foreign currency translation adjustments are included as a component of accumulated othercomprehensive income (“AOCI”), which is a separate component of shareholders’ equity. Therefore, the U.S.dollar value of the non-equity translated items in our consolidated financial statements will fluctuate from periodto period, depending on the changing value of the U.S. dollar versus these currencies.
We execute transactions in a number of different currencies, principally the U.S. dollar, euro, sterling andAustralian dollar. Exchange rate gains and losses arising from changes in foreign currency exchange rates
14
between the time an expense is recorded and when it is settled as well as the remeasurement of monetary assetsand liabilities, all denominated in a currency other than the functional currency of the entity involved, arerecognized currently in nonoperating earnings, unless such monetary liabilities have been designated to act ashedges of net investments in our foreign operations. The net gains or losses resulting from these “nonoperatingforeign currency transactions” were insignificant in 2014, 2013 and 2012. In addition, the unrealized gains orlosses on our long-term intercompany receivables denominated in a non-functional currency, which are notexpected to be repaid in the foreseeable future and are therefore considered to form part of our net investments,are recorded as foreign currency translation adjustments, which are included as a component of AOCI.
Share-Based Compensation
We recognize compensation expense for all share-based compensation awards using the fair value method. Fortime-based share awards, we recognize compensation cost ratably using the straight-line attribution method over theexpected vesting period or to the retirement eligibility date, if less than the vesting period, when vesting is notcontingent upon any future performance. For performance-based share awards, we generally recognizecompensation cost ratably using the straight-line attribution method over the expected vesting period based on theprobability of the performance condition being achieved. If all or a portion of the performance condition is notexpected to be met, the appropriate amount of previously recognized compensation expense will be reversed andfuture compensation expense will be adjusted accordingly. For market-based share awards, we recognizecompensation cost ratably using the straight-line attribution method over the expected vesting period. If the targetmarket conditions are not expected to be met, compensation expense will still be recognized. In addition, weestimate the amount of expected forfeitures based on historical forfeiture experience when calculating compensationcost. If the actual forfeitures that occur are significantly different from the estimate, then we revise our estimates.
Earnings Per Share
Basic earnings per share is computed by dividing net income by the weighted-average number of sharesoutstanding during each period. Diluted earnings per share is computed by dividing net income by the weighted-average number of shares and common stock equivalents outstanding during each period. For earnings per sharepurposes, Carnival Corporation common stock and Carnival plc ordinary shares are considered a single class ofshares since they have equivalent rights (see Note 3).
NOTE 3 – DLC Arrangement
In 2003, Carnival Corporation and Carnival plc completed a DLC transaction, which implemented CarnivalCorporation and Carnival plc’s DLC arrangement. The contracts governing the DLC arrangement provide thatCarnival Corporation and Carnival plc each continue to have separate boards of directors, but the boards andsenior executive management of both companies are identical. The constitutional documents of each of thecompanies also provide that, on most matters, the holders of the common equity of both companies effectivelyvote as a single body. On specified matters where the interests of Carnival Corporation’s shareholders may differfrom the interests of Carnival plc’s shareholders (a “class rights action” such as transactions primarily designedto amend or unwind the DLC arrangement), each shareholder body will vote separately as a class. Generally, noclass rights action will be implemented unless approved by both shareholder bodies.
Upon the closing of the DLC transaction, Carnival Corporation and Carnival plc also executed the Equalizationand Governance Agreement, which provides for the equalization of dividends and liquidation distributions basedon an equalization ratio and contains provisions relating to the governance of the DLC arrangement. Because theequalization ratio is 1 to 1, one Carnival plc ordinary share is entitled to the same distributions, subject to theterms of the Equalization and Governance Agreement, as one share of Carnival Corporation common stock. In aliquidation of either company or both companies, if the hypothetical potential per share liquidation distributionsto each company’s shareholders are not equivalent, taking into account the relative value of the two companies’assets and the indebtedness of each company, to the extent that one company has greater net assets so that anyliquidation distribution to its shareholders would not be equivalent on a per share basis, the company with theability to make a higher net distribution is required to make a payment to the other company to equalize thepossible net distribution to shareholders, subject to certain exceptions.
At the closing of the DLC transaction, Carnival Corporation and Carnival plc also executed deeds of guarantee.Under the terms of Carnival Corporation’s deed of guarantee, Carnival Corporation has agreed to guarantee allindebtedness and certain other monetary obligations of Carnival plc that are incurred under agreements enteredinto on or after the closing date of the DLC transaction. The terms of Carnival plc’s deed of guarantee mirror
15
Ann
ex1
DL
CA
nnua
lRep
ort
those of Carnival Corporation’s. In addition, Carnival Corporation and Carnival plc have each extended theirrespective deeds of guarantee to the other’s pre-DLC indebtedness and certain other monetary obligations, oralternatively have provided standalone guarantees in lieu of utilization of these deeds of guarantee, thuseffectively cross guaranteeing all Carnival Corporation and Carnival plc indebtedness and certain other monetaryobligations. Each deed of guarantee provides that the creditors to whom the obligations are owed are intendedthird-party beneficiaries of such deed of guarantee.
The deeds of guarantee are governed and construed in accordance with the laws of the Isle of Man. Subject to theterms of the deeds of guarantee, the holders of indebtedness and other obligations that are subject to the deeds ofguarantee will have recourse to both Carnival plc and Carnival Corporation, though a Carnival plc creditor mustfirst make written demand on Carnival plc and a Carnival Corporation creditor on Carnival Corporation. Oncethe written demand is made by letter or other form of notice, the holders of indebtedness or other obligations mayimmediately commence an action against the relevant guarantor. Accordingly, there is no requirement under thedeeds of guarantee to obtain a judgment, take other enforcement actions or wait any period of time prior to takingsteps against the relevant guarantor. All actions or proceedings arising out of or in connection with the deeds ofguarantee must be exclusively brought in courts in England.
Under the terms of the DLC transaction documents, Carnival Corporation and Carnival plc are permitted totransfer assets between the companies, make loans to or investments in each other and otherwise enter intointercompany transactions. The companies have entered into some of these types of transactions and may enterinto additional transactions in the future to take advantage of the flexibility provided by the DLC arrangement,and to operate both companies as a single unified economic enterprise in the most effective manner. In addition,under the terms of the Equalization and Governance Agreement and the deeds of guarantee, the cash flows andassets of one company are required to be used to pay the obligations of the other company, if necessary.
Given the DLC arrangement, we believe that providing separate financial statements for each of CarnivalCorporation and Carnival plc would not present a true and fair view of the economic realities of their operations.Accordingly, separate financial statements for both Carnival Corporation and Carnival plc have not beenpresented.
NOTE 4 – Property and Equipment
Property and equipment consisted of the following (in millions):
November 30,
2014 2013
Ships, including ship improvements . . . . . . . . . . . . . . . . . . . . . . . . . . . . . . . . . . . . . . . . . . $ 42,886 $ 42,367Ships under construction . . . . . . . . . . . . . . . . . . . . . . . . . . . . . . . . . . . . . . . . . . . . . . . . . . 533 535
43,419 42,902Land, buildings and improvements, including leasehold improvements and port
facilities . . . . . . . . . . . . . . . . . . . . . . . . . . . . . . . . . . . . . . . . . . . . . . . . . . . . . . . . . . . . . 1,088 971Computer hardware and software, transportation equipment and other . . . . . . . . . . . . . . . 1,322 1,251
Total property and equipment . . . . . . . . . . . . . . . . . . . . . . . . . . . . . . . . . . . . . . . . . . . . . . 45,829 45,124Less accumulated depreciation and amortization . . . . . . . . . . . . . . . . . . . . . . . . . . . . . . . . (13,056) (12,219)
$ 32,773 (a) $ 32,905 (a)
(a) At November 30, 2014 and 2013, the net carrying values of ships and ships under construction for our NorthAmerica, EAA, Cruise Support and Tour and Other segments were $18.6 billion, $12.6 billion, $0.3 billionand $0.1 billion and $18.3 billion, $13.2 billion, $0.3 billion and $0.1 billion, respectively.
Ships under construction include progress payments for the construction of new ships, as well as design andengineering fees, capitalized interest, construction oversight costs and various owner supplied items. Capitalizedinterest, substantially all included in our ships under construction, amounted to $21 million, $15 million and $17million in 2014, 2013 and 2012, respectively.
Repairs and maintenance expenses, including minor improvement costs and dry-dock expenses, were $918million, $954 million and $832 million in 2014, 2013 and 2012, respectively, and are substantially all included inother ship operating expenses.
16
During 2012, we wrote-off the net carrying value of a ship related to the January 2012 ship incident and received€395 million (or $508 million) of hull and machinery insurance proceeds for the total loss of the ship. As a result,in 2012 we recognized €14 million (or $17 million) of proceeds in excess of the net carrying value of the ship asa reduction of other ship operating expenses. In addition, during 2012 we incurred $28 million of January 2012ship incident-related expenses, that were not covered by insurance and are principally included in other shipoperating expenses. See Note 7 for a discussion of loss contingencies related to the January 2012 ship incident.
See Note 10 for a discussion regarding ship sales and impairments.
NOTE 5 – Unsecured Debt
Long-term debt and short-term borrowings consisted of the following (in millions):
November 30, 2014 November 30,
Interest RatesMaturitiesThrough 2014 (a) 2013 (a)
Long-Term DebtExport Credit FacilitiesFixed rate (b) . . . . . . . . . . . . . . . . . . . . . . . . . . . . . . . . . . 4.2% to 5.5% 2020 $ 1,358 $ 1,684Euro fixed rate (b) . . . . . . . . . . . . . . . . . . . . . . . . . . . . . . 3.8% to 4.5% 2025 340 408Floating rate (c) . . . . . . . . . . . . . . . . . . . . . . . . . . . . . . . . 1.4% to 1.6% 2026 1,031 1,196Euro floating rate (b)(d) . . . . . . . . . . . . . . . . . . . . . . . . . 0.3% to 1.2% 2026 1,909 1,742Bank LoansFixed rate (b)(e) . . . . . . . . . . . . . . . . . . . . . . . . . . . . . . . - - - 650Euro fixed rate (b) . . . . . . . . . . . . . . . . . . . . . . . . . . . . . . 3.9% 2021 221 276Floating rate (b)(e)(f) . . . . . . . . . . . . . . . . . . . . . . . . . . . 0.7% to 1.2% 2019 800 850Euro floating rate (b)(g) . . . . . . . . . . . . . . . . . . . . . . . . . 0.7% 2015 249 138Private Placement NotesFixed rate . . . . . . . . . . . . . . . . . . . . . . . . . . . . . . . . . . . . 5.9% to 6.0% 2016 116 116Euro fixed rate (b) . . . . . . . . . . . . . . . . . . . . . . . . . . . . . . 6.9% to 7.3% 2018 153 194Publicly-Traded NotesFixed rate . . . . . . . . . . . . . . . . . . . . . . . . . . . . . . . . . . . . 1.2% to 7.1% 2028 2,219 2,219Other . . . . . . . . . . . . . . . . . . . . . . . . . . . . . . . . . . . . . . . 3.8% to 7.3% 2030 26 27Short-Term BorrowingsEuro bank loans (h) . . . . . . . . . . . . . . . . . . . . . . . . . . . . . 1.3% 2015 13 60U.S. dollar-denominated commercial paper (h) . . . . . . . 0.4% 2015 653 -
Total Debt . . . . . . . . . . . . . . . . . . . . . . . . . . . . . . . 9,088 9,560Less short-term borrowings . . . . . . . . . . . . . . . . . . . . . . (666) (60)Less current portion of long-term debt . . . . . . . . . . . . . . (1,059) (1,408)
Total Long-term Debt . . . . . . . . . . . . . . . . . . . . . . $ 7,363 $ 8,092
(a) The debt table does not include the impact of our foreign currency and interest rate swaps. At November 30,2014, 67% and 33% (69% and 31% at November 30, 2013) of our debt was U.S. dollar and euro-denominated, respectively, including the effect of foreign currency swaps. At November 30, 2014, 52% and48% (59% and 41% at November 30, 2013) of our debt bore fixed and floating interest rates, respectively,including the effect of interest rate swaps. Substantially all of our fixed rate debt can only be called orprepaid by incurring additional costs. In addition, substantially all of our debt agreements, including ourmain revolving credit facility, contain one or more financial covenants that require us, among other things,to maintain minimum debt service coverage and minimum shareholders’ equity and to limit our debt tocapital and debt to equity ratios and the amounts of our secured assets and secured and other indebtedness.Generally, if an event of default under any debt agreement occurs, then pursuant to cross defaultacceleration clauses, substantially all of our outstanding debt and derivative contract payables (see Note 10)could become due, and all debt and derivative contracts could be terminated. At November 30, 2014, webelieve we were in compliance with all of our debt covenants.
(b) Includes $2.4 billion of debt whose interest rates, and in the case of our main revolver its commitment fees,would increase upon a downgrade in the long-term senior unsecured credit ratings of Carnival Corporationor Carnival plc.
(c) In 2014, we repaid an aggregate of $590 million outstanding under two export credit facilities prior to theirmaturities through May 2024. In addition, in 2014 we borrowed $554 million under an export credit facility,the proceeds of which were used to pay for a portion of Regal Princess’ purchase price and is due in semi-annual installments through May 2026.
17
Ann
ex1
DL
CA
nnua
lRep
ort

(d) In 2014, we borrowed $498 million under a euro-denominated export credit facility, the proceeds of whichwere used to pay for a portion of Costa Diadema’s purchase price and is due in semi-annual installmentsthrough October 2026.
(e) In 2014, we restructured two floating rate bank loan facilities that had an aggregate outstanding balance of$250 million and were previously due through 2016. The restructuring converted the terms into perpetualone-year maturities and added a $150 million tranche, which was used to repay a portion of a $500 millionfixed rate bank loan in 2014 prior to its 2015 maturity date. We can terminate this facility at any time uponthree days notice, and the bank can terminate the facility at any time upon one-year’s notice.
(f) In 2014, we borrowed $150 million under a floating rate bank loan, which is due in September 2019. Weused the net proceeds of this loan for general corporate purposes.
(g) In 2014, we borrowed $275 million under a euro-denominated floating rate revolving bank loan facility, theproceeds of which were used for general corporate purposes. This facility has a perpetual term although wecan terminate it at any time, and the bank can terminate the facility at any time upon nine months notice.
(h) The interest rate associated with our short-term borrowings represents an aggregate-weighted averageinterest rate.
At November 30, 2014, the scheduled annual maturities of our debt were as follows (in millions):
Fiscal
2015 2016 2017 2018 2019 Thereafter Total
Short-term borrowings . . . . . . . . . . . . . . . . . . . . . $ 666 $ - $ - $ - $ - $ - $ 666Long-term debt . . . . . . . . . . . . . . . . . . . . . . . . . . . 1,059 1,785 634 1,302 685 2,957 8,422
$1,725 $1,785 $634 $1,302 $685 $2,957 $9,088
Debt issuance costs are generally amortized to interest expense using the straight-line method, whichapproximates the effective interest method, over the term of the debt. In addition, all debt issue discounts areamortized to interest expense using the effective interest rate method over the term of the notes.
Committed Ship Financings
We have unsecured euro and U.S. dollar long-term export credit committed ship financings in order to pay for aportion of our ships’ purchase prices. These commitments, if drawn, are repayable semi-annually over 12 years.We have the option to cancel each one at specified dates prior to the underlying ship’s delivery date.
At January 22, 2015, our committed ship financings are as follows:
Cruise Brands and Ships
Fiscal YearScheduled for
Funding Amount(in millions)
North AmericaCarnival Cruise LineCarnival Vista . . . . . . . . . . . . . . . . . . . . . . . . . . . . . . . . . . . . . . . . . . . . . . . . . . . . . . . 2016 $ 483
Holland America LineKoningsdam . . . . . . . . . . . . . . . . . . . . . . . . . . . . . . . . . . . . . . . . . . . . . . . . . . . . . . . . . 2016 379
SeabournNewbuild (a) . . . . . . . . . . . . . . . . . . . . . . . . . . . . . . . . . . . . . . . . . . . . . . . . . . . . . . . . 2016 204
North America Cruise Brands . . . . . . . . . . . . . . . . . . . . . . . . . . . . . . . . . . . . . . . . . 1,066
EAAAIDAAIDAprima (a) . . . . . . . . . . . . . . . . . . . . . . . . . . . . . . . . . . . . . . . . . . . . . . . . . . . . . . . 2015 393Newbuild (a) . . . . . . . . . . . . . . . . . . . . . . . . . . . . . . . . . . . . . . . . . . . . . . . . . . . . . . . . 2016 393
P&O Cruises (UK)Britannia (a) . . . . . . . . . . . . . . . . . . . . . . . . . . . . . . . . . . . . . . . . . . . . . . . . . . . . . . . . 2015 480
EAA Cruise Brands . . . . . . . . . . . . . . . . . . . . . . . . . . . . . . . . . . . . . . . . . . . . . . . . . 1,266
$2,332
(a) Commitments are euro-denominated.
18
Revolving Credit Facilities
In June 2014, Carnival Corporation, Carnival plc and certain of Carnival plc’s subsidiaries amended and replacedtheir existing five-year multi-currency revolving credit facility of $2.5 billion (comprised of $1.6 billion,€450 million and £150 million) with a new five-year multi-currency revolving credit facility (the “Facility”). ThisFacility of $2.6 billion (comprised of $1.7 billion, €500 million and £150 million) at November 30, 2014 expires inJune 2019, and we have options to extend this Facility through June 2021 subject to the approval of each bank. TheFacility currently bears interest at LIBOR/EURIBOR plus a margin of 40 basis points (“bps”). The margin variesbased on changes to Carnival Corporation’s and Carnival plc’s long-term senior unsecured credit ratings. We arerequired to pay a commitment fee of 35% of the margin per annum on any undrawn portion. We will also incur anadditional utilization fee of 10 bps, 20 bps or 40 bps if equal to or less than one-third, more than one-third or morethan two-thirds of the Facility, respectively, is drawn on the total amount outstanding.
At November 30, 2014, we have two other undrawn revolving credit facilities for $300 million and $75 millionthat expire in 2020 and 2015, respectively, and provide us with additional liquidity. At November 30, 2014, $2.9billion was available under all of our revolving credit facilities.
NOTE 6 – Commitments
Ship Commitments
At November 30, 2014, as adjusted for our new ship orders through January 22, 2015, we had ten ships undercontract for construction with an aggregate passenger capacity of more than 28,200 lower berths. The estimatedtotal cost of these ships is $6.2 billion, which includes the contract prices with the shipyards, design andengineering fees, capitalized interest, construction oversight costs and various owner supplied items. We havepaid $0.5 billion through November 30, 2014 and anticipate paying $1.6 billion, $1.9 billion, $0.8 billion and$1.4 billion of the remaining estimated total costs in 2015, 2016, 2017 and 2018, respectively.
Operating Leases, Port Facilities and Other Commitments
Rent expense under our operating leases, principally for office and warehouse space, was $63 million, $61 millionand $57 million in 2014, 2013 and 2012, respectively.
At November 30, 2014, minimum amounts payable for our operating leases, with initial or remaining terms inexcess of one year, and for the annual usage of port facilities and other contractual commitments with remainingterms in excess of one year, were as follows (in millions):
Fiscal
Thereafter Total2015 2016 2017 2018 2019
Operating leases . . . . . . . . . . $ 56 $ 45 $ 30 $ 25 $24 $147 $ 327Port facilities and other . . . . . 231 188 141 110 70 600 1,340
$287 $233 $171 $135 $94 $747 $1,667
NOTE 7 – Contingencies
Litigation
As a result of the January 2012 ship incident, litigation claims, enforcement actions, regulatory actions andinvestigations, including, but not limited to, those arising from personal injury, loss of life, loss of or damage topersonal property, business interruption losses or environmental damage to any affected coastal waters and thesurrounding areas, have been and may be asserted or brought against various parties, including us. The existingassertions are ongoing and there are significant jurisdictional uncertainties. The ultimate outcome of thesematters cannot be determined at this time. However, we do not expect these matters to have a significant impacton our results of operations because we have insurance coverage for these types of third-party claims.
The UK Maritime & Coastguard Agency and the U.S. Department of Justice are investigating allegations thatCaribbean Princess breached international pollution laws. We are cooperating with the investigations, includingconducting our own internal investigation into the matter. The ultimate outcome of this matter cannot bedetermined at this time. However, we do not expect it to have a significant impact on our results of operations.
19
Ann
ex1
DL
CA
nnua
lRep
ort

Additionally, in the normal course of our business, various claims and lawsuits have been filed or are pendingagainst us. Most of these claims and lawsuits are covered by insurance and, accordingly, the maximum amount ofour liability, net of any insurance recoverables, is typically limited to our self-insurance retention levels.Management believes the ultimate outcome of these claims and lawsuits will not have a material adverse impacton our consolidated financial statements.
Contingent Obligations – Lease Out and Lease Back Type (“LILO”) Transactions
At November 30, 2014, Carnival Corporation had estimated contingent obligations totaling $397 million,excluding termination payments as discussed below, to participants in LILO transactions for two of its ships. Atthe inception of these leases, the aggregate of the net present value of these obligations was paid by CarnivalCorporation to a group of major financial institutions, who agreed to act as payment undertakers and directly paythese obligations. As a result, these contingent obligations are considered extinguished and neither the funds northe contingent obligations have been included in our Consolidated Balance Sheets.
In the event that Carnival Corporation were to default on its contingent obligations and assuming performance byall other participants, we estimate that it would, as of November 30, 2014, be responsible for a terminationpayment of $31 million. In 2017, Carnival Corporation has the right to exercise options that would terminatethese LILO transactions at no cost to it.
If the credit rating of one of the financial institutions who is directly paying the contingent obligations falls belowAA-, or below A- for the other financial institution, then Carnival Corporation will be required to replace theapplicable financial institution with another financial institution whose credit rating is at least AA or meets otherspecified credit requirements. In such circumstances, it would incur additional costs, although we estimate thatthey would not be material to our consolidated financial statements. The financial institution payment undertakersubject to the AA- credit rating threshold has a credit rating of AA, and the financial institution subject to theA-credit rating threshold has a credit rating of A+. If Carnival Corporation’s credit rating, which is BBB+, fallsbelow BBB, it will be required to provide a standby letter of credit for $36 million, or, alternatively, providemortgages for this aggregate amount on these two ships.
Contingent Obligations – Indemnifications
Some of the debt contracts that we enter into include indemnification provisions that obligate us to makepayments to the counterparty if certain events occur. These contingencies generally relate to changes in taxes andchanges in laws that increase lender capital costs and other similar costs. The indemnification clauses are oftenstandard contractual terms and were entered into in the normal course of business. There are no stated or notionalamounts included in the indemnification clauses, and we are not able to estimate the maximum potential amountof future payments, if any, under these indemnification clauses. We have not been required to make any materialpayments under such indemnification clauses in the past and, under current circumstances, we do not believe arequest for material future indemnification payments is probable.
NOTE 8 – Taxation
A summary of our principal taxes and exemptions in the jurisdictions where our significant operations are locatedis as follows:
U.S. Income Tax
We are primarily foreign corporations engaged in the business of operating cruise ships in internationaltransportation. We also own and operate, among other businesses, the U.S. hotel and transportation business ofHolland America Princess Alaska Tours through U.S. corporations.
Our North American cruise ship businesses and certain ship-owning subsidiaries are engaged in a trade orbusiness within the U.S. Depending on its itinerary, any particular ship may generate income from sources withinthe U.S. We believe that our U.S. source income and the income of our ship-owning subsidiaries, to the extentderived from, or incidental to, the international operation of a ship or ships, is currently exempt from U.S. federalincome and branch profit taxes.
In general, under Section 883 of the Internal Revenue Code, certain non-U.S. corporations (such as our NorthAmerican cruise ship businesses) are not subject to U.S. federal income tax or branch profits tax on U.S. sourceincome derived from, or incidental to, the international operation of a ship or ships. Applicable U.S. Treasury
20
regulations provide in general that a foreign corporation will qualify for the benefits of Section 883 if, in relevantpart, (i) the foreign country in which the foreign corporation is organized grants an equivalent exemption tocorporations organized in the U.S. (an “equivalent exemption jurisdiction”) and (ii) the foreign corporation meetsa defined publicly-traded test. Subsidiaries of foreign corporations that are organized in an equivalent exemptionjurisdiction and meet the publicly-traded test also benefit from Section 883. We believe that Panama is anequivalent exemption jurisdiction and Carnival Corporation currently qualifies as a publicly-traded corporationunder the regulations. Accordingly, substantially all of Carnival Corporation’s income is exempt from U.S.federal income and branch profit taxes.
Regulations under Section 883 list items that the Internal Revenue Service (“IRS”) does not consider to beincidental to ship operations. Among the items identified as not incidental are income from the sale of airtransportation, transfers, shore excursions and pre- and post-cruise land packages to the extent earned fromsources within the U.S.
We believe that the U.S. source transportation income earned by Carnival plc and its Italian resident subsidiarycurrently qualifies for exemption from U.S. federal income tax under applicable bilateral U.S. income taxtreaties.
Our domestic U.S. operations, principally the hotel and transportation business of Holland America PrincessAlaska Tours, are subject to federal and state income taxation in the U.S.
Carnival Corporation and Carnival plc and certain of their subsidiaries are subject to various U.S. state incometaxes generally imposed on each state’s portion of the U.S. source income subject to U.S. federal income taxes.However, the state of Alaska imposes an income tax on its allocated portion of the total income of our companiesdoing business in Alaska and certain of their subsidiaries.
UK and Australian Income Tax
Cunard, P&O Cruises (UK) and P&O Cruises (Australia) are divisions of Carnival plc and have elected to enterthe UK tonnage tax on a rolling 10-year term and, accordingly, reapply every year. Companies to which thetonnage tax regime applies pay corporation taxes on profits calculated by reference to the net tonnage ofqualifying ships. UK corporation tax is not chargeable under the normal UK tax rules on these brands’ relevantshipping income. Relevant shipping income includes income from the operation of qualifying ships and fromshipping related activities.
For a company to be eligible for the regime, it must be subject to UK corporation tax and, among other matters,operate qualifying ships that are strategically and commercially managed in the UK. Companies within UKtonnage tax are also subject to a seafarer training requirement.
Our UK non-shipping activities that do not qualify under the UK tonnage tax regime remain subject to normalUK corporation tax. Dividends received from subsidiaries of Carnival plc doing business outside the UK aregenerally exempt from UK corporation tax.
P&O Cruises (Australia) and all of the other cruise ships operated internationally by Carnival plc for the cruisesegment of the Australian vacation market are exempt from Australian corporation tax by virtue of the UK/Australian income tax treaty.
Italian and German Income Tax
In early 2015, Costa and AIDA will reelect to enter the Italian tonnage tax regime through 2024 and can reapplyfor an additional ten-year period beginning in early 2025. Companies to which the tonnage tax regime appliespay corporation taxes on shipping profits calculated by reference to the net tonnage of qualifying ships.
Most of Costa’s and AIDA’s earnings not considered to be shipping profits for Italian tonnage tax purposes willbe taxed at an effective tax rate of 5.5% under the Italian International shipping tax regime since all of their shipsare Italian registered.
Substantially all of AIDA’s earnings are exempt from Italian and German corporation tax by virtue of the Italy/Germany income tax treaty.
Income and Other Taxes in Asian Countries
Substantially all of our brands’ income from their international operation in Asian countries is exempt from localcorporation tax by virtue of relevant income tax treaties.
21
Ann
ex1
DL
CA
nnua
lRep
ort
Other
We recognize income tax benefits for uncertain tax positions, based solely on their technical merits, when it ismore likely than not to be sustained upon examination by the relevant tax authority. The tax benefit to berecognized is measured as the largest amount of benefit that is greater than 50% likely of being realized uponultimate resolution. All interest expense related to income tax liabilities is included in income tax expense. Basedon all known facts and circumstances and current tax law, we believe that the total amount of our uncertainincome tax position liabilities and related accrued interest are not significant to our financial position.
We do not expect to incur income taxes on future distributions of undistributed earnings of foreign subsidiariesand, accordingly, no deferred income taxes have been provided for the distribution of these earnings. In additionto or in place of income taxes, virtually all jurisdictions where our ships call impose taxes, fees and other chargesbased on guest counts, ship tonnage, passenger capacity or some other measure, and these taxes, fees and othercharges are included in commissions, transportation and other costs and other ship operating expenses.
NOTE 9 – Shareholders’ Equity
Carnival Corporation’s Articles of Incorporation authorize its Board of Directors, at its discretion, to issue up to40 million shares of preferred stock. At November 30, 2014 and 2013, no Carnival Corporation preferred stockhad been issued and only a nominal amount of Carnival plc preference shares had been issued. Our Boards ofDirectors have authorized, subject to certain restrictions, the repurchase of up to an aggregate of $1 billion ofCarnival Corporation common stock and/or Carnival plc ordinary shares (the “Repurchase Program”). TheRepurchase Program does not have an expiration date and may be discontinued by our Boards of Directors at anytime.
During 2014, there were no repurchases of Carnival Corporation common stock under the Repurchase Program.In 2013 and 2012, we repurchased 2.8 million and 2.6 million shares of Carnival Corporation common stock for$103 million and $90 million, respectively, under the Repurchase Program. During 2014, 2013 and 2012, therewere no repurchases of Carnival plc ordinary shares under the Repurchase Program. Since March 2013, theremaining availability under the Repurchase Program has been $975 million.
In addition to the Repurchase Program, the Boards of Directors authorized, in October 2008, the repurchase of upto 19.2 million Carnival plc ordinary shares and, in January 2013, the repurchase of up to 32.8 million shares ofCarnival Corporation common stock under the Stock Swap programs described below. Depending on marketconditions and other factors, we may repurchase shares of Carnival Corporation common stock and/or Carnivalplc ordinary shares under the Repurchase Program and the Stock Swap programs concurrently. We use the StockSwap programs in situations where we can obtain an economic benefit because either Carnival Corporationcommon stock or Carnival plc ordinary shares are trading at a price that is at a premium or discount to the priceof Carnival plc ordinary shares or Carnival Corporation common stock, as the case may be. Any realizedeconomic benefit under the Stock Swap programs is used for general corporate purposes, which could includerepurchasing additional stock under the Repurchase Program. Carnival plc ordinary share repurchases under boththe Repurchase Program and the Stock Swap programs require annual shareholder approval. The existingshareholder approval is limited to a maximum of 21.5 million ordinary shares and is valid until the earlier of theconclusion of the Carnival plc 2015 annual general meeting or October 16, 2015. At January 22, 2015, theremaining availability under the Stock Swap programs was 18.1 million Carnival plc ordinary shares and32.0 million shares of Carnival Corporation common stock.
During 2014 and 2012, no Carnival Corporation common stock or Carnival plc ordinary shares were sold orrepurchased under the Stock Swap programs. During 2013, Carnival Investments Limited, a wholly ownedsubsidiary of Carnival Corporation, sold 0.9 million of Carnival plc ordinary shares for net proceeds of $35million. Substantially all of the net proceeds from these sales were used to repurchase 0.9 million shares ofCarnival Corporation common stock. Pursuant to our Stock Swap programs, Carnival Corporation sold theseCarnival plc ordinary shares owned by Carnival Investments Limited only to the extent it was able to repurchaseshares of Carnival Corporation common stock in the U.S. market on at least an equivalent basis. During 2013, noCarnival Corporation common stock was sold or Carnival plc ordinary shares were repurchased under the StockSwap programs.
At November 30, 2014, there were 15.9 million shares of Carnival Corporation common stock reserved forissuance under its employee benefit and dividend reinvestment plans. At November 30, 2014, there were8.4 million ordinary shares of Carnival plc authorized for future issuance under its employee benefit plans.
22

On November 15, 2012, our Boards of Directors declared a special dividend to holders of Carnival Corporationcommon stock and Carnival plc ordinary shares of $0.50 per share, or $0.4 billion, which was paid in December2012. The special dividend was in addition to our $0.25 per share regular 2012 quarterly dividend.
Accumulated other comprehensive (loss) income was as follows (in millions):
November 30,
2014 2013
Cumulative foreign currency translation adjustments, net . . . . . . . . . . . . . . . . . . . . . . . . . . . . . . $(512) $234Unrecognized pension expenses . . . . . . . . . . . . . . . . . . . . . . . . . . . . . . . . . . . . . . . . . . . . . . . . . . (90) (97)Unrealized losses on marketable securities . . . . . . . . . . . . . . . . . . . . . . . . . . . . . . . . . . . . . . . . . . (5) (7)Net (losses) gains on cash flow derivative hedges . . . . . . . . . . . . . . . . . . . . . . . . . . . . . . . . . . . . (9) 31
$(616) $161
During 2014, $18 million of unrecognized pension expenses were reclassified out of accumulated othercomprehensive (loss) income, of which $12 million and $6 million were included in payroll and related expensesand selling and administrative expenses, respectively.
NOTE 10 – Fair Value Measurements, Derivative Instruments and Hedging Activities
Fair Value Measurements
U.S. accounting standards establish a fair value hierarchy that prioritizes the inputs used to measure fair value.The hierarchy gives the highest priority to unadjusted quoted prices in active markets for identical assets orliabilities (Level 1 measurement) and the lowest priority to unobservable inputs (Level 3 measurement). Thishierarchy requires entities to maximize the use of observable inputs and minimize the use of unobservable inputs.The three levels of inputs used to measure fair value are as follows:
• Level 1 measurements are based on unadjusted quoted prices in active markets for identical assets orliabilities that we have the ability to access. Valuation of these items does not entail a significant amount ofjudgment.
• Level 2 measurements are based on quoted prices for similar assets or liabilities in active markets, quotedprices for identical or similar assets or liabilities in markets that are not active or market data other thanquoted prices that are observable for the assets or liabilities.
• Level 3 measurements are based on unobservable data that are supported by little or no market activity andare significant to the fair value of the assets or liabilities.
Fair value is the price that would be received to sell an asset or paid to transfer a liability in an orderly transactionbetween independent and knowledgeable market participants at the measurement date. Therefore, even whenmarket assumptions are not readily available, our own assumptions are set to reflect those that we believe marketparticipants would use in pricing the asset or liability at the measurement date.
The fair value measurement of a financial asset or financial liability must reflect the nonperformance risk of thecounterparty and us. Therefore, the impact of our counterparty’s creditworthiness was considered when in anasset position, and our creditworthiness was considered when in a liability position in the fair value measurementof our financial instruments. Creditworthiness did not have a significant impact on the fair values of our financialinstruments at November 30, 2014 and 2013. Both the counterparties and we are expected to continue to performunder the contractual terms of the instruments. Considerable judgment may be required in interpreting marketdata used to develop the estimates of fair value. Accordingly, certain estimates of fair value presented herein arenot necessarily indicative of the amounts that could be realized in a current or future market exchange.
23
Ann
ex1
DL
CA
nnua
lRep
ort

Financial Instruments that are Not Measured at Fair Value on a Recurring Basis
The estimated carrying and fair values and basis of valuation of our financial instrument assets and liabilities thatare not measured at fair value on a recurring basis were as follows (in millions):
November 30, 2014 November 30, 2013
CarryingValue
Fair Value CarryingValue
Fair Value
Level 1 Level 2 Level 3 Level 1 Level 2 Level 3
AssetsCash and cash equivalents (a) . . . . . . $ 240 $240 $ - $ - $ 349 $349 $ - $ -Restricted cash (b) . . . . . . . . . . . . . . 11 11 - - - - - -Long-term other assets (c) . . . . . . . . 156 1 103 49 110 1 58 50
Total . . . . . . . . . . . . . . . . . . . . . . . $ 407 $252 $ 103 $49 $ 459 $350 $ 58 $50
LiabilitiesFixed rate debt (d) . . . . . . . . . . . . . . . $4,433 $ - $4,743 $ - $5,574 $ - $5,941 $ -Floating rate debt (d) . . . . . . . . . . . . 4,655 - 4,562 - 3,986 - 3,997 -
Total . . . . . . . . . . . . . . . . . . . . . . . $9,088 $ - $9,305 $ - $9,560 $ - $9,938 $ -
(a) Cash and cash equivalents are comprised of cash on hand, and at November 30, 2013 also include timedeposits. Due to their short maturities, the carrying values approximate their fair values.
(b) Restricted cash is comprised of a money market deposit account.
(c) At November 30, 2014 and 2013, long-term other assets were substantially all comprised of notes and otherreceivables. The fair values of our Level 1 and Level 2 notes and other receivables were based on estimatedfuture cash flows discounted at appropriate market interest rates. The fair values of our Level 3 notesreceivable were estimated using risk-adjusted discount rates.
(d) Debt does not include the impact of interest rate swaps. The net difference between the fair value of ourfixed rate debt and its carrying value was due to the market interest rates in existence at November 30, 2014and 2013 being lower than the fixed interest rates on these debt obligations, including the impact of anychanges in our credit ratings. At November 30, 2014 and 2013, the net difference between the fair value ofour floating rate debt and its carrying value was due to the market interest rates in existence atNovember 30, 2014 and 2013 being slightly higher and slightly lower, respectively, than the floating interestrates on these debt obligations, including the impact of any changes in our credit ratings. The fair values ofour publicly-traded notes were based on their unadjusted quoted market prices in markets that are notsufficiently active to be Level 1 and, accordingly, are considered Level 2. The fair values of our other debtwere estimated based on appropriate market interest rates being applied to this debt.
Financial Instruments that are Measured at Fair Value on a Recurring Basis
The estimated fair value and basis of valuation of our financial instrument assets and liabilities that are measuredat fair value on a recurring basis were as follows (in millions):
November 30, 2014 November 30, 2013
Level 1 Level 2 Level 3 Level 1 Level 2 Level 3
AssetsCash equivalents (a) . . . . . . . . . . . . . . . . . . . . . . . . . $ 91 $ - $ - $113 $ - $ -Restricted cash (b) . . . . . . . . . . . . . . . . . . . . . . . . . . 19 - - 28 - -Marketable securities held in rabbi trusts (c) . . . . . . 113 9 - 113 10 -Derivative financial instruments (d) . . . . . . . . . . . . - 14 - - 60 -Long-term other asset (e) . . . . . . . . . . . . . . . . . . . . . - - 20 - - 17
Total . . . . . . . . . . . . . . . . . . . . . . . . . . . . . . . . . . . $223 $ 23 $ 20 $254 $ 70 $ 17
LiabilitiesDerivative financial instruments (d) . . . . . . . . . . . . $ - $278 $ - $ - $ 31 $ -
Total . . . . . . . . . . . . . . . . . . . . . . . . . . . . . . . . . . . $ - $278 $ - $ - $ 31 $ -
(a) Cash equivalents are comprised of money market funds.
(b) The majority of restricted cash is comprised of money market funds.
24
(c) At November 30, 2014 and 2013, marketable securities held in rabbi trusts were comprised of Level 1bonds, frequently-priced mutual funds invested in common stocks, money market funds and Level 2 otherinvestments. Their use is restricted to funding certain deferred compensation and non-qualified U.S. pensionplans.
(d) See “Derivative Instruments and Hedging Activities” section below for detailed information regarding ourderivative financial instruments.
(e) Long-term other asset is comprised of an auction-rate security. The fair value was based on a broker quotein an inactive market, which is considered a Level 3 input. During 2014, there were no purchases or salespertaining to this auction-rate security and, accordingly, the change in its fair value was based solely on thestrengthening of the underlying credit.
We measure our derivatives using valuations that are calibrated to the initial trade prices. Subsequent valuationsare based on observable inputs and other variables included in the valuation models such as interest rate, yieldand commodity price curves, forward currency exchange rates, credit spreads, maturity dates, volatilities andnetting arrangements. We use the income approach to value derivatives for foreign currency options andforwards, interest rate swaps and fuel derivatives using observable market data for all significant inputs andstandard valuation techniques to convert future amounts to a single present value amount, assuming thatparticipants are motivated, but not compelled to transact. We also corroborate our fair value estimates usingvaluations provided by our counterparties.
Nonfinancial Instruments that are Measured at Fair Value on a Nonrecurring Basis
Sales and Impairments of Ships
In November 2014, we sold the 672-passenger capacity Ocean Princess for a total gain of $24 million, of which$14 million was recognized in the fourth quarter of 2014 as a reduction in other ship operating expenses. Weprovided $66 million of financing to the buyer, which is due in semi-annual installments through November2019. Prior to the ship’s delivery in March 2016, we will continue to operate it under a bareboat charteragreement. As a result of the sale-leaseback accounting for this transaction, the remaining gain of $10 millionwill be recognized as a reduction in other ship operating expenses over the term of the bareboat charteragreement through March 2016.
In November 2014, we entered into a bareboat charter/sale agreement under which the 1,440-passenger capacityGrand Holiday was chartered to an unrelated entity in January 2015 through March 2025. Under this agreement,ownership of Grand Holiday will be transferred to the buyer in March 2025. This transaction did not meet thecriteria to qualify as a sales-type lease and, accordingly, it will be accounted for as an operating lease wherebywe will recognize the charter revenue over the term of the agreement. As a result of this transaction, weperformed a ship impairment review and recognized a $31 million impairment charge in other ship operatingexpenses during the fourth quarter of 2014. The estimated fair value of the ship was substantially all determinedbased on the expected collectability of the bareboat charter payments, which is considered a Level 3 input.
Due to the expected absorption of Ibero Cruises’ (“Ibero”) operations into Costa in November 2014, and certainship specific facts and circumstances, such as size, age, condition, viable alternative itineraries and historicaloperating cash flows, we performed an undiscounted future cash flow analysis of Ibero’s Grand Celebration asof May 31, 2014 to determine if the ship was impaired. The principal assumptions used in our undiscounted cashflow analysis consisted of forecasted future operating results, including net revenue yields and net cruise costsincluding fuel prices, and the estimated residual value, which are all considered Level 3 inputs, and the thenexpected transfer of Grand Celebration into Costa in November 2014. Based on its undiscounted cash flowanalysis, we determined that the net carrying value for Grand Celebration exceeded its estimated undiscountedfuture cash flows. Accordingly, we then estimated the May 31, 2014 fair value of this ship based on itsdiscounted future cash flows and compared the estimated fair value to its net carrying value. As a result, werecognized a $22 million ship impairment charge in other ship operating expenses during the second quarter of2014.
In December 2014, we entered into a bareboat charter/sale agreement under which the 1,492-passenger capacityCosta Celebration (formerly Grand Celebration) was chartered to an unrelated entity in December 2014 throughDecember 2024. Under this agreement, ownership of Costa Celebration will be transferred to the buyer inDecember 2024. This transaction did not meet the criteria to qualify as a sales-type lease and, accordingly, it willbe accounted for as an operating lease whereby we will recognize the charter revenue over the term of theagreement.
25
Ann
ex1
DL
CA
nnua
lRep
ort

During the third quarter of 2013, we recognized $73 million and $103 million of impairment charges related toCosta Voyager and Costa Classica, respectively. In November 2013, Costa Voyager was taken out-of-service,and during the second quarter of 2014 Costa Voyager was sold and we recognized a $37 million gain as areduction in other ship operating expenses. The estimated fair values of these ships at the time of impairmentwere based on their undiscounted cash flow analyses, which included principal assumptions similar to most ofthose discussed above for Grand Celebration.
During 2012, Costa Allegra suffered damage and, accordingly, we decided to withdraw this ship from operationsresulting in a $34 million impairment charge, which is included in other ship operating expenses. In addition,during 2012, we incurred $17 million for Costa Allegra incident-related expenses, which are principally includedin other ship operating expenses. In October 2012, we sold Costa Allegra. Furthermore, during 2012, werecognized $23 million of ship impairment charges related to Seabourn Legend and Seabourn Pride in other shipoperating expenses. The estimated fair value for all three of these ships was determined based on their salesvalue, which is considered a Level 3 input.
In 2014, 2013 and 2012, we recognized $53 million, $176 million and $57 million, respectively, of shipimpairment charges in other ship operating expenses.
Valuation of Goodwill and Other Intangibles
The reconciliation of the changes in the carrying amounts of our goodwill, which goodwill has been allocated toour North America and EAA cruise brands, was as follows (in millions):
North AmericaCruise Brands
EAACruise Brands Total
Balance at November 30, 2012 . . . . . . . . . . . . . . . . . . . . . . . . . . . . . . . $1,898 $1,276 $3,174Foreign currency translation adjustment . . . . . . . . . . . . . . . . . . . . . . . . - 36 36
Balance at November 30, 2013 . . . . . . . . . . . . . . . . . . . . . . . . . . . . . . . 1,898 1,312 3,210Foreign currency translation adjustment . . . . . . . . . . . . . . . . . . . . . . . . - (83) (83)
Balance at November 30, 2014 . . . . . . . . . . . . . . . . . . . . . . . . . . . . . . . $1,898 $1,229 $3,127
At July 31, 2014, all of our cruise brands carried goodwill, except for Ibero and Seabourn. As of that date, weperformed our annual goodwill impairment reviews, which included performing a qualitative assessment for allcruise brands that carried goodwill, except for Carnival Cruise Line, Cunard and P&O Cruises (UK). Qualitativefactors such as industry and market conditions, macroeconomic conditions, changes to the weighted-average costof capital (“WACC”), overall financial performance, changes in fuel prices and capital expenditures wereconsidered in the qualitative assessment to determine how changes in these factors would affect each of thesecruise brands’ estimated fair values. Based on our qualitative assessments, we determined it was more-likely-than-not that each of these cruise brands’ estimated fair values exceeded their carrying values and, therefore, wedid not proceed to the two-step quantitative goodwill impairment reviews.
As of July 31, 2014, we also performed our annual goodwill impairment reviews of Carnival Cruise Line’s,Cunard’s and P&O Cruises (UK)’s goodwill. We did not perform a qualitative assessment but instead proceededdirectly to step one of the two-step quantitative goodwill impairment review and compared each of CarnivalCruise Line’s, Cunard’s and P&O Cruises (UK)’s estimated fair value to the carrying value of their allocated netassets. Their estimated cruise brand fair value was based on a discounted future cash flow analysis. The principalassumptions used in our cash flow analyses consisted of forecasted future operating results, including net revenueyields and net cruise costs including fuel prices; capacity changes, including the expected rotation of vessels into,or out of, Carnival Cruise Line, Cunard and P&O Cruises (UK); capital expenditures; WACC of marketparticipants, adjusted for the risk attributable to the geographic regions in which Carnival Cruise Line, Cunardand P&O Cruises (UK) operate and terminal values, which are all considered Level 3 inputs. Based on thediscounted cash flow analyses, we determined that each of Carnival Cruise Line’s, Cunard’s and P&O Cruises(UK)’s estimated fair value significantly exceeded their carrying value and, therefore, we did not proceed to steptwo of the impairment reviews.
At November 30, 2014, accumulated goodwill impairment charges were $153 million, which are all related toIbero and were recognized in 2012.
26
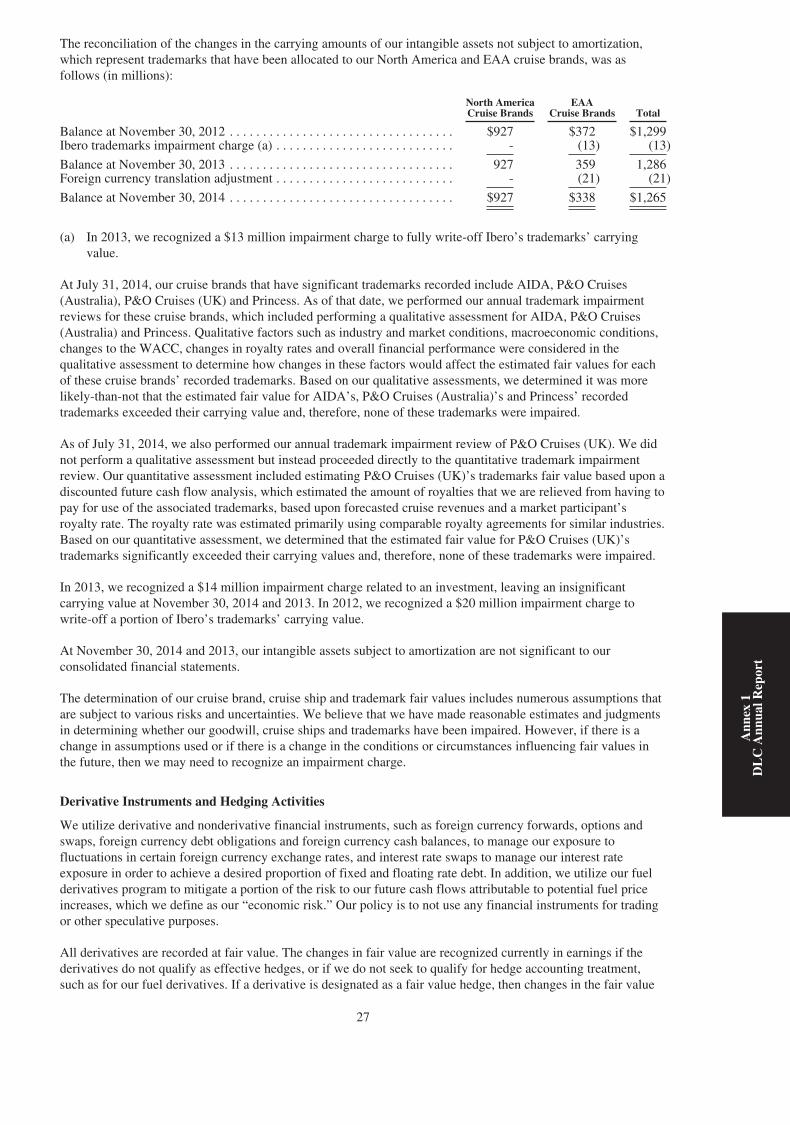
The reconciliation of the changes in the carrying amounts of our intangible assets not subject to amortization,which represent trademarks that have been allocated to our North America and EAA cruise brands, was asfollows (in millions):
North AmericaCruise Brands
EAACruise Brands Total
Balance at November 30, 2012 . . . . . . . . . . . . . . . . . . . . . . . . . . . . . . . . . . $927 $372 $1,299Ibero trademarks impairment charge (a) . . . . . . . . . . . . . . . . . . . . . . . . . . . - (13) (13)
Balance at November 30, 2013 . . . . . . . . . . . . . . . . . . . . . . . . . . . . . . . . . . 927 359 1,286Foreign currency translation adjustment . . . . . . . . . . . . . . . . . . . . . . . . . . . - (21) (21)
Balance at November 30, 2014 . . . . . . . . . . . . . . . . . . . . . . . . . . . . . . . . . . $927 $338 $1,265
(a) In 2013, we recognized a $13 million impairment charge to fully write-off Ibero’s trademarks’ carryingvalue.
At July 31, 2014, our cruise brands that have significant trademarks recorded include AIDA, P&O Cruises(Australia), P&O Cruises (UK) and Princess. As of that date, we performed our annual trademark impairmentreviews for these cruise brands, which included performing a qualitative assessment for AIDA, P&O Cruises(Australia) and Princess. Qualitative factors such as industry and market conditions, macroeconomic conditions,changes to the WACC, changes in royalty rates and overall financial performance were considered in thequalitative assessment to determine how changes in these factors would affect the estimated fair values for eachof these cruise brands’ recorded trademarks. Based on our qualitative assessments, we determined it was morelikely-than-not that the estimated fair value for AIDA’s, P&O Cruises (Australia)’s and Princess’ recordedtrademarks exceeded their carrying value and, therefore, none of these trademarks were impaired.
As of July 31, 2014, we also performed our annual trademark impairment review of P&O Cruises (UK). We didnot perform a qualitative assessment but instead proceeded directly to the quantitative trademark impairmentreview. Our quantitative assessment included estimating P&O Cruises (UK)’s trademarks fair value based upon adiscounted future cash flow analysis, which estimated the amount of royalties that we are relieved from having topay for use of the associated trademarks, based upon forecasted cruise revenues and a market participant’sroyalty rate. The royalty rate was estimated primarily using comparable royalty agreements for similar industries.Based on our quantitative assessment, we determined that the estimated fair value for P&O Cruises (UK)’strademarks significantly exceeded their carrying values and, therefore, none of these trademarks were impaired.
In 2013, we recognized a $14 million impairment charge related to an investment, leaving an insignificantcarrying value at November 30, 2014 and 2013. In 2012, we recognized a $20 million impairment charge towrite-off a portion of Ibero’s trademarks’ carrying value.
At November 30, 2014 and 2013, our intangible assets subject to amortization are not significant to ourconsolidated financial statements.
The determination of our cruise brand, cruise ship and trademark fair values includes numerous assumptions thatare subject to various risks and uncertainties. We believe that we have made reasonable estimates and judgmentsin determining whether our goodwill, cruise ships and trademarks have been impaired. However, if there is achange in assumptions used or if there is a change in the conditions or circumstances influencing fair values inthe future, then we may need to recognize an impairment charge.
Derivative Instruments and Hedging Activities
We utilize derivative and nonderivative financial instruments, such as foreign currency forwards, options andswaps, foreign currency debt obligations and foreign currency cash balances, to manage our exposure tofluctuations in certain foreign currency exchange rates, and interest rate swaps to manage our interest rateexposure in order to achieve a desired proportion of fixed and floating rate debt. In addition, we utilize our fuelderivatives program to mitigate a portion of the risk to our future cash flows attributable to potential fuel priceincreases, which we define as our “economic risk.” Our policy is to not use any financial instruments for tradingor other speculative purposes.
All derivatives are recorded at fair value. The changes in fair value are recognized currently in earnings if thederivatives do not qualify as effective hedges, or if we do not seek to qualify for hedge accounting treatment,such as for our fuel derivatives. If a derivative is designated as a fair value hedge, then changes in the fair value
27
Ann
ex1
DL
CA
nnua
lRep
ort
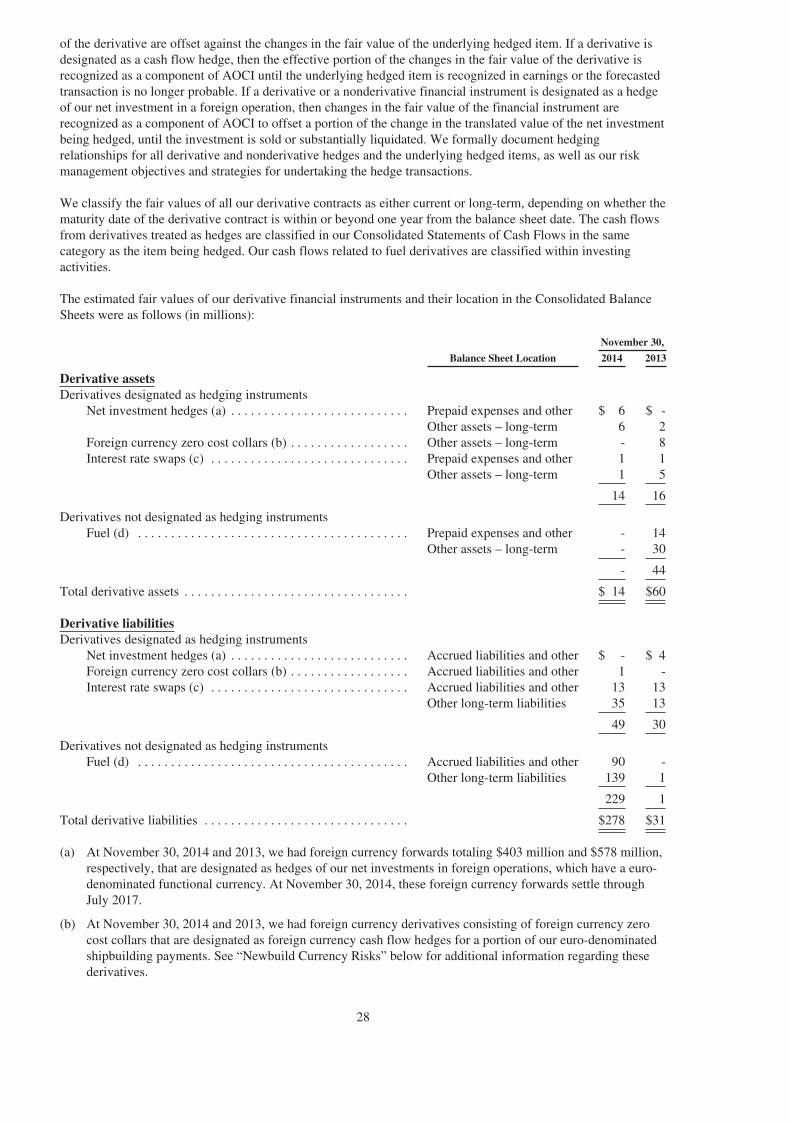
of the derivative are offset against the changes in the fair value of the underlying hedged item. If a derivative isdesignated as a cash flow hedge, then the effective portion of the changes in the fair value of the derivative isrecognized as a component of AOCI until the underlying hedged item is recognized in earnings or the forecastedtransaction is no longer probable. If a derivative or a nonderivative financial instrument is designated as a hedgeof our net investment in a foreign operation, then changes in the fair value of the financial instrument arerecognized as a component of AOCI to offset a portion of the change in the translated value of the net investmentbeing hedged, until the investment is sold or substantially liquidated. We formally document hedgingrelationships for all derivative and nonderivative hedges and the underlying hedged items, as well as our riskmanagement objectives and strategies for undertaking the hedge transactions.
We classify the fair values of all our derivative contracts as either current or long-term, depending on whether thematurity date of the derivative contract is within or beyond one year from the balance sheet date. The cash flowsfrom derivatives treated as hedges are classified in our Consolidated Statements of Cash Flows in the samecategory as the item being hedged. Our cash flows related to fuel derivatives are classified within investingactivities.
The estimated fair values of our derivative financial instruments and their location in the Consolidated BalanceSheets were as follows (in millions):
November 30,
Balance Sheet Location 2014 2013
Derivative assetsDerivatives designated as hedging instruments
Net investment hedges (a) . . . . . . . . . . . . . . . . . . . . . . . . . . . Prepaid expenses and other $ 6 $ -Other assets – long-term 6 2
Foreign currency zero cost collars (b) . . . . . . . . . . . . . . . . . . Other assets – long-term - 8Interest rate swaps (c) . . . . . . . . . . . . . . . . . . . . . . . . . . . . . . Prepaid expenses and other 1 1
Other assets – long-term 1 5
14 16
Derivatives not designated as hedging instrumentsFuel (d) . . . . . . . . . . . . . . . . . . . . . . . . . . . . . . . . . . . . . . . . . Prepaid expenses and other - 14
Other assets – long-term - 30
- 44
Total derivative assets . . . . . . . . . . . . . . . . . . . . . . . . . . . . . . . . . . $ 14 $60
Derivative liabilitiesDerivatives designated as hedging instruments
Net investment hedges (a) . . . . . . . . . . . . . . . . . . . . . . . . . . . Accrued liabilities and other $ - $ 4Foreign currency zero cost collars (b) . . . . . . . . . . . . . . . . . . Accrued liabilities and other 1 -Interest rate swaps (c) . . . . . . . . . . . . . . . . . . . . . . . . . . . . . . Accrued liabilities and other 13 13
Other long-term liabilities 35 13
49 30
Derivatives not designated as hedging instrumentsFuel (d) . . . . . . . . . . . . . . . . . . . . . . . . . . . . . . . . . . . . . . . . . Accrued liabilities and other 90 -
Other long-term liabilities 139 1
229 1
Total derivative liabilities . . . . . . . . . . . . . . . . . . . . . . . . . . . . . . . $278 $31
(a) At November 30, 2014 and 2013, we had foreign currency forwards totaling $403 million and $578 million,respectively, that are designated as hedges of our net investments in foreign operations, which have a euro-denominated functional currency. At November 30, 2014, these foreign currency forwards settle throughJuly 2017.
(b) At November 30, 2014 and 2013, we had foreign currency derivatives consisting of foreign currency zerocost collars that are designated as foreign currency cash flow hedges for a portion of our euro-denominatedshipbuilding payments. See “Newbuild Currency Risks” below for additional information regarding thesederivatives.
28
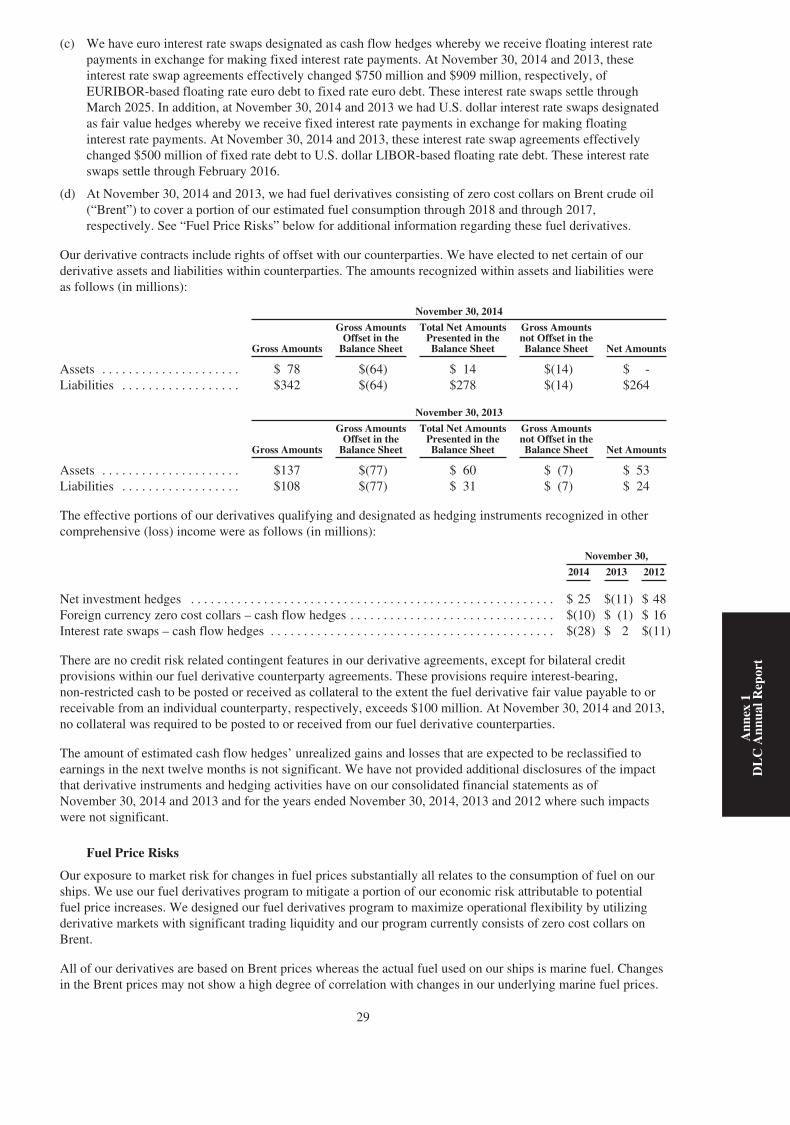
(c) We have euro interest rate swaps designated as cash flow hedges whereby we receive floating interest ratepayments in exchange for making fixed interest rate payments. At November 30, 2014 and 2013, theseinterest rate swap agreements effectively changed $750 million and $909 million, respectively, ofEURIBOR-based floating rate euro debt to fixed rate euro debt. These interest rate swaps settle throughMarch 2025. In addition, at November 30, 2014 and 2013 we had U.S. dollar interest rate swaps designatedas fair value hedges whereby we receive fixed interest rate payments in exchange for making floatinginterest rate payments. At November 30, 2014 and 2013, these interest rate swap agreements effectivelychanged $500 million of fixed rate debt to U.S. dollar LIBOR-based floating rate debt. These interest rateswaps settle through February 2016.
(d) At November 30, 2014 and 2013, we had fuel derivatives consisting of zero cost collars on Brent crude oil(“Brent”) to cover a portion of our estimated fuel consumption through 2018 and through 2017,respectively. See “Fuel Price Risks” below for additional information regarding these fuel derivatives.
Our derivative contracts include rights of offset with our counterparties. We have elected to net certain of ourderivative assets and liabilities within counterparties. The amounts recognized within assets and liabilities wereas follows (in millions):
November 30, 2014
Gross Amounts
Gross AmountsOffset in the
Balance Sheet
Total Net AmountsPresented in theBalance Sheet
Gross Amountsnot Offset in theBalance Sheet Net Amounts
Assets . . . . . . . . . . . . . . . . . . . . . $ 78 $(64) $ 14 $(14) $ -Liabilities . . . . . . . . . . . . . . . . . . $342 $(64) $278 $(14) $264
November 30, 2013
Gross Amounts
Gross AmountsOffset in the
Balance Sheet
Total Net AmountsPresented in theBalance Sheet
Gross Amountsnot Offset in theBalance Sheet Net Amounts
Assets . . . . . . . . . . . . . . . . . . . . . $137 $(77) $ 60 $ (7) $ 53Liabilities . . . . . . . . . . . . . . . . . . $108 $(77) $ 31 $ (7) $ 24
The effective portions of our derivatives qualifying and designated as hedging instruments recognized in othercomprehensive (loss) income were as follows (in millions):
November 30,
2014 2013 2012
Net investment hedges . . . . . . . . . . . . . . . . . . . . . . . . . . . . . . . . . . . . . . . . . . . . . . . . . . . . . . . $ 25 $(11) $ 48Foreign currency zero cost collars – cash flow hedges . . . . . . . . . . . . . . . . . . . . . . . . . . . . . . . $(10) $ (1) $ 16Interest rate swaps – cash flow hedges . . . . . . . . . . . . . . . . . . . . . . . . . . . . . . . . . . . . . . . . . . . $(28) $ 2 $(11)
There are no credit risk related contingent features in our derivative agreements, except for bilateral creditprovisions within our fuel derivative counterparty agreements. These provisions require interest-bearing,non-restricted cash to be posted or received as collateral to the extent the fuel derivative fair value payable to orreceivable from an individual counterparty, respectively, exceeds $100 million. At November 30, 2014 and 2013,no collateral was required to be posted to or received from our fuel derivative counterparties.
The amount of estimated cash flow hedges’ unrealized gains and losses that are expected to be reclassified toearnings in the next twelve months is not significant. We have not provided additional disclosures of the impactthat derivative instruments and hedging activities have on our consolidated financial statements as ofNovember 30, 2014 and 2013 and for the years ended November 30, 2014, 2013 and 2012 where such impactswere not significant.
Fuel Price Risks
Our exposure to market risk for changes in fuel prices substantially all relates to the consumption of fuel on ourships. We use our fuel derivatives program to mitigate a portion of our economic risk attributable to potentialfuel price increases. We designed our fuel derivatives program to maximize operational flexibility by utilizingderivative markets with significant trading liquidity and our program currently consists of zero cost collars onBrent.
All of our derivatives are based on Brent prices whereas the actual fuel used on our ships is marine fuel. Changesin the Brent prices may not show a high degree of correlation with changes in our underlying marine fuel prices.
29
Ann
ex1
DL
CA
nnua
lRep
ort
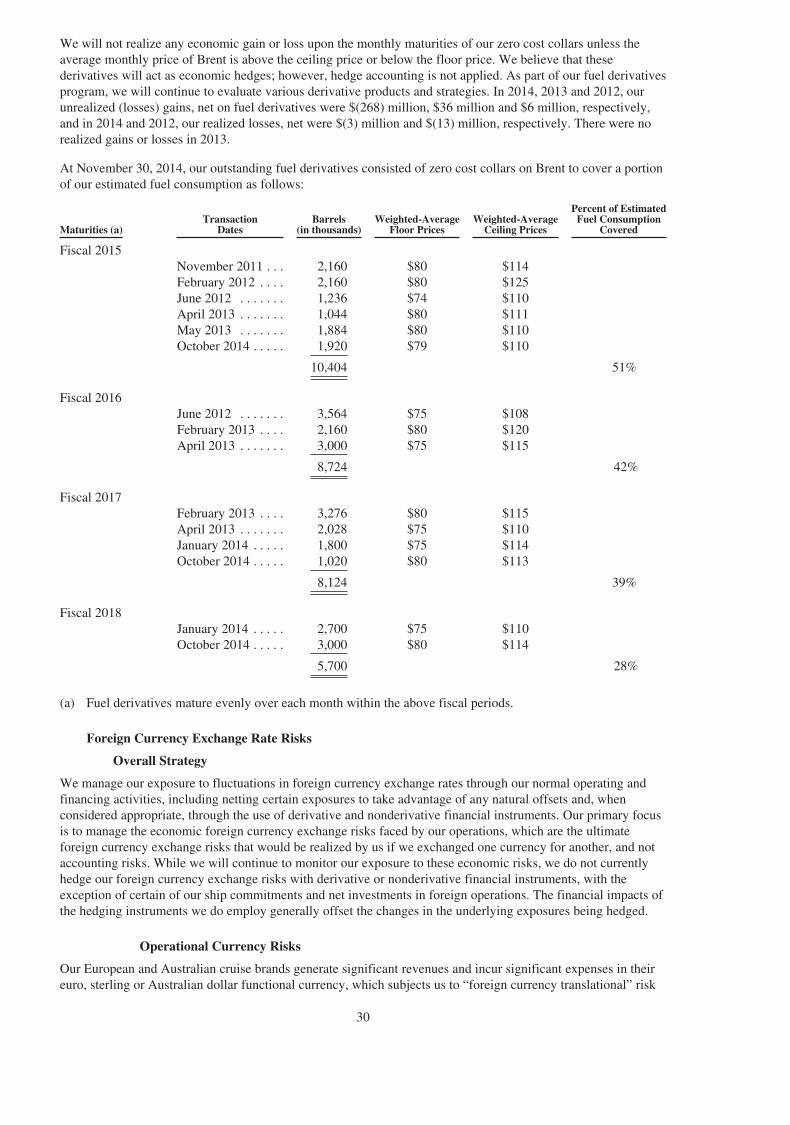
We will not realize any economic gain or loss upon the monthly maturities of our zero cost collars unless theaverage monthly price of Brent is above the ceiling price or below the floor price. We believe that thesederivatives will act as economic hedges; however, hedge accounting is not applied. As part of our fuel derivativesprogram, we will continue to evaluate various derivative products and strategies. In 2014, 2013 and 2012, ourunrealized (losses) gains, net on fuel derivatives were $(268) million, $36 million and $6 million, respectively,and in 2014 and 2012, our realized losses, net were $(3) million and $(13) million, respectively. There were norealized gains or losses in 2013.
At November 30, 2014, our outstanding fuel derivatives consisted of zero cost collars on Brent to cover a portionof our estimated fuel consumption as follows:
Maturities (a)Transaction
DatesBarrels
(in thousands)Weighted-Average
Floor PricesWeighted-Average
Ceiling Prices
Percent of EstimatedFuel Consumption
Covered
Fiscal 2015November 2011 . . . 2,160 $80 $114February 2012 . . . . 2,160 $80 $125June 2012 . . . . . . . 1,236 $74 $110April 2013 . . . . . . . 1,044 $80 $111May 2013 . . . . . . . 1,884 $80 $110October 2014 . . . . . 1,920 $79 $110
10,404 51%
Fiscal 2016June 2012 . . . . . . . 3,564 $75 $108February 2013 . . . . 2,160 $80 $120April 2013 . . . . . . . 3,000 $75 $115
8,724 42%
Fiscal 2017February 2013 . . . . 3,276 $80 $115April 2013 . . . . . . . 2,028 $75 $110January 2014 . . . . . 1,800 $75 $114October 2014 . . . . . 1,020 $80 $113
8,124 39%
Fiscal 2018January 2014 . . . . . 2,700 $75 $110October 2014 . . . . . 3,000 $80 $114
5,700 28%
(a) Fuel derivatives mature evenly over each month within the above fiscal periods.
Foreign Currency Exchange Rate Risks
Overall Strategy
We manage our exposure to fluctuations in foreign currency exchange rates through our normal operating andfinancing activities, including netting certain exposures to take advantage of any natural offsets and, whenconsidered appropriate, through the use of derivative and nonderivative financial instruments. Our primary focusis to manage the economic foreign currency exchange risks faced by our operations, which are the ultimateforeign currency exchange risks that would be realized by us if we exchanged one currency for another, and notaccounting risks. While we will continue to monitor our exposure to these economic risks, we do not currentlyhedge our foreign currency exchange risks with derivative or nonderivative financial instruments, with theexception of certain of our ship commitments and net investments in foreign operations. The financial impacts ofthe hedging instruments we do employ generally offset the changes in the underlying exposures being hedged.
Operational Currency Risks
Our European and Australian cruise brands generate significant revenues and incur significant expenses in theireuro, sterling or Australian dollar functional currency, which subjects us to “foreign currency translational” risk
30

related to these currencies. Accordingly, exchange rate fluctuations of the euro, sterling and Australian dollaragainst the U.S. dollar will affect our reported financial results since the reporting currency for our consolidatedfinancial statements is the U.S. dollar. Any strengthening of the U.S. dollar against these foreign currencies hasthe financial statement effect of decreasing the U.S. dollar values reported for these cruise brands’ revenues andexpenses. Any weakening of the U.S. dollar has the opposite effect.
Most of our brands also have non-functional currency risk related to their international sales operations, whichhas become an increasingly larger part of most of their businesses over time, and principally includes the euro,sterling and Australian and U.S. dollars. In addition, all of our brands have non-functional currency expenses fora portion of their operating expenses. Accordingly, we also have “foreign currency transactional” risks related tochanges in the exchange rates for our brands’ revenues and expenses that are in a currency other than theirfunctional currency. However, these brands’ revenues and expenses in non-functional currencies create somedegree of natural offset from these currency exchange movements. In addition, we monitor this foreign currencytransactional risk in order to measure its impact on our results of operations.
Investment Currency Risks
We consider our investments in foreign operations to be denominated in relatively stable currencies and of along-term nature. We partially mitigate our net investment currency exposures by denominating a portion of ourforeign currency intercompany payables in our foreign operations’ functional currencies, substantially allsterling. As of November 30, 2014 and 2013, we have designated $2.4 billion and $2.2 billion, respectively, ofour foreign currency intercompany payables as nonderivative hedges of our net investments in foreignoperations. Accordingly, we have included $359 million and $234 million of cumulative foreign currencytransaction nonderivative gains in the cumulative translation adjustment component of AOCI at November 30,2014 and 2013, respectively, which offsets a portion of the losses recorded in AOCI upon translating our foreignoperations’ net assets into U.S. dollars. During 2014, 2013 and 2012, we recognized foreign currencynonderivative transaction gains (losses) of $125 million, $(9) million and $39 million, respectively, in thecumulative translation adjustment component of AOCI.
Newbuild Currency Risks
Our shipbuilding contracts are typically denominated in euros. Our decisions regarding whether or not to hedge anon-functional currency ship commitment for our cruise brands are made on a case-by-case basis, taking intoconsideration the amount and duration of the exposure, market volatility, economic trends, our overall expectednet cash flows by currency and other offsetting risks. We use foreign currency derivative contracts and have usednonderivative financial instruments to manage foreign currency exchange rate risk for some of our shipconstruction payments.
In July 2012, we entered into foreign currency zero cost collars that are designated as cash flow hedges for aportion of P&O Cruises (UK) Britannia’s euro-denominated shipyard payments. These collars mature inFebruary 2015 at a weighted-average ceiling of $287 million and a weighted-average floor of $266 million. InJune 2014, we entered into additional foreign currency zero cost collars that are also designated as cash flowhedges for the remaining portion of Britannia’s euro-denominated shipyard payments. These collars also maturein February 2015 at a weighted-average ceiling of $281 million and a weighted-average floor of $274 million. Ifthe spot rate is between the weighted-average ceiling and floor rates on the date of maturity, then we would notowe or receive any payments under these collars.
On January 22, 2015, we entered into foreign currency zero cost collars that are designated as cash flow hedges fora portion of a Princess and Seabourn newbuilds’ euro-denominated shipyard payments. The Princess newbuild’scollars mature in March 2017 at a weighted-average ceiling of $590 million and a weighted-average floor of $504million. The Seabourn newbuild’s collars mature in November 2016 at a weighted-average ceiling of $221 millionand a weighted-average floor of $185 million. If the spot rate is between the weighted-average ceiling and floorrates on the date of maturity, then we would not owe or receive any payments under these collars.
At January 22, 2015, substantially all of our remaining newbuild currency exchange rate risk relates to euro-denominated newbuild construction payments for a Carnival Cruise Line, Holland America Line and Seabournnewbuild, which represent a total unhedged commitment of $1.7 billion.
The cost of shipbuilding orders that we may place in the future that is denominated in a different currency thanour cruise brands’ or the shipyards’ functional currency is expected to be affected by foreign currency exchangerate fluctuations. These foreign currency exchange rate fluctuations may affect our desire to order new cruiseships.
31
Ann
ex1
DL
CA
nnua
lRep
ort
Interest Rate Risks
We manage our exposure to fluctuations in interest rates through our debt portfolio management and investmentstrategies. We evaluate our debt portfolio to determine whether to make periodic adjustments to the mix of fixedand floating rate debt through the use of interest rate swaps and the issuance of new debt or the early retirementof existing debt. At November 30, 2014, 52% and 48% (59% and 41% at November 30, 2013) of our debt borefixed and floating interest rates, respectively, including the effect of interest rate swaps. In addition, to the extentthat we have excess cash available for investment, we purchase high quality short-term investments with floatinginterest rates, which offset a portion of the impact of interest rate fluctuations arising from our floating interestrate debt portfolio.
Concentrations of Credit Risk
As part of our ongoing control procedures, we monitor concentrations of credit risk associated with financial andother institutions with which we conduct significant business. Our maximum exposure under foreign currencyand fuel derivative contracts and interest rate swap agreements that are in-the-money, which were not material atNovember 30, 2014, is the replacement cost, net of any collateral received or contractually allowed offset, in theevent of nonperformance by the counterparties to the contracts, all of which are currently our lending banks. Weseek to minimize credit risk exposure, including counterparty nonperformance primarily associated with our cashequivalents, investments, committed financing facilities, contingent obligations, derivative instruments,insurance contracts and new ship progress payment guarantees, by normally conducting business with large,well-established financial institutions, insurance companies and export credit agencies, and by diversifying ourcounterparties. In addition, we have guidelines regarding credit ratings and investment maturities that we followto help safeguard liquidity and minimize risk. We normally do require collateral and/or guarantees to supportnotes receivable on significant asset sales, long-term ship charters and new ship progress payments toshipyards. We currently believe the risk of nonperformance by any of our significant counterparties is remote.
We also monitor the creditworthiness of travel agencies and tour operators in Asia, Australia and Europe andcredit and debit card providers to which we extend credit in the normal course of our business, which includescharter-hire agreements in Asia prior to sailing. Our credit exposure also includes contingent obligations relatedto cash payments received directly by travel agents and tour operators for cash collected by them on cruise salesin Australia and most of Europe where we are obligated to honor our guests’ cruise payments made by them totheir travel agents and tour operators regardless of whether we have received these payments. Concentrations ofcredit risk associated with these receivables, charter-hire agreements and contingent obligations are notconsidered to be material, primarily due to the large number of unrelated accounts within our customer base, theamount of these contingent obligations and their short maturities. We have experienced only minimal creditlosses on our trade receivables and related contingent obligations. We do not normally require collateral or othersecurity to support normal credit sales.
NOTE 11 – Segment Information
We have three reportable cruise segments that are comprised of our (1) North America cruise brands, (2) EAAcruise brands and (3) Cruise Support. In addition, we have a Tour and Other segment. Our segments are reportedon the same basis as the internally reported information that is provided to our chief operating decision maker(“CODM”), who is the President and Chief Executive Officer of Carnival Corporation and Carnival plc.Decisions to allocate resources and assess performance for Carnival Corporation & plc are made by the CODMupon review of the segment results across all of our cruise brands and other segments.
Our North America cruise segment includes Carnival Cruise Line, Holland America Line, Princess andSeabourn. Our EAA cruise segment includes AIDA, Costa, Cunard, P&O Cruises (Australia), P&O Cruises (UK)and prior to November 2014, Ibero. These individual cruise brand operating segments have been aggregated intotwo reportable segments based on the similarity of their economic and other characteristics, including types ofcustomers, regulatory environment, ship maintenance requirements, supporting systems and processes andproducts and services they provide. Our Cruise Support segment represents certain of our port and relatedfacilities and other services that are provided for the benefit of our cruise brands. Our Tour and Other segmentrepresents the hotel and transportation operations of Holland America Princess Alaska Tours. In 2012, our Tourand Other segment also included two ships that we chartered to an unaffiliated entity. In April 2013, we sold oneof these two ships and recognized a $15 million gain as a reduction of Tour and Other operating expenses.Accordingly, subsequent to this 2013 sale and through November 30, 2014, our Tour and Other segment includedonly one ship. The significant accounting policies of our segments are the same as those described in Note2 – “Summary of Significant Accounting Policies.”
32

Selected information for our segments as of and for the years ended November 30 was as follows (in millions):
RevenuesOperatingexpenses
Sellingand
administrative
Depreciationand
amortization
Operatingincome(loss)
Capitalexpenditures
Totalassets
2014
North America Cruise Brands (a) . . . $ 9,559 $ 6,418 $1,121 $ 959 $1,061 $1,315 $22,765EAA Cruise Brands . . . . . . . . . . . . . . 6,148 3,914 725 616 893 1,054 15,228Cruise Support . . . . . . . . . . . . . . . . . 90 39 200 25 (174) 156 1,023Tour and Other (a) . . . . . . . . . . . . . . 215 160 8 35 12 58 516 (c)Intersegment elimination (a) . . . . . . . (128) (128) - - - - -
$15,884 $10,403 $2,054 $1,635 $1,792 $2,583 $39,532
2013
North America Cruise Brands (a) . . . $ 9,370 $ 6,439 $1,048 $ 927 $ 956 $1,350 $22,448EAA Cruise Brands . . . . . . . . . . . . . . 5,906 4,137 686 599 471(b) 642 16,126Cruise Support . . . . . . . . . . . . . . . . . 96 31 136 26 (97) 108 1,016Tour and Other (a) . . . . . . . . . . . . . . 210 143 9 36 22 49 514 (c)Intersegment elimination (a) . . . . . . . (126) (126) - - - - -
$15,456 $10,624 $1,879 $1,588 $1,352 $2,149 $40,104
2012
North America Cruise Brands (a) . . . $ 9,364 $ 6,240 $ 949 $ 898 $1,277 $ 990 $21,893EAA Cruise Brands . . . . . . . . . . . . . . 5,827 4,010 650 561 433(b) 1,291 15,894Cruise Support . . . . . . . . . . . . . . . . . 86 22 114 28 (78) 33 888Tour and Other (a) . . . . . . . . . . . . . . 211 154 7 40 10 18 486 (c)Intersegment elimination (a) . . . . . . . (106) (106) - - - - -
$15,382 $10,320 $1,720 $1,527 $1,642 $2,332 $39,161
(a) A portion of the North America cruise brands’ segment revenues includes revenues for the tour portion of acruise when a land tour package is sold along with a cruise by either Holland America Line or Princess.These intersegment tour revenues, which are included in our Tour and Other segment, are eliminateddirectly against the North America cruise brands’ segment revenues and operating expenses in the line“Intersegment elimination.”
(b) Includes $13 million in 2013 and $173 million in 2012 of impairment charges related to Ibero’s goodwilland trademarks.
(c) Tour and Other segment assets primarily include hotels and lodges in the state of Alaska and the CanadianYukon, motorcoaches used for sightseeing and charters, glass-domed railcars, which run on the AlaskaRailroad, and our owned ships that we leased out under long-term charters to an unaffiliated entity.
Non-U.S. revenues for our cruise brands represent sales generated from outside the U.S. principally by non-U.S.travel agents and tour operators. Substantially all of our long-lived assets are located outside of the U.S. andconsist of our ships and ships under construction.
Revenues by geographic areas, which are based on where our guests are sourced and not the cruise brands onwhich they sailed, were as follows (in millions):
Years Ended November 30,
2014 2013 2012
North America . . . . . . . . . . . . . . . . . . . . . . . . . . . . . . . . . . . . . . . . . . . . . . . . . . . . . $ 7,762 $ 7,738 $ 7,952Europe . . . . . . . . . . . . . . . . . . . . . . . . . . . . . . . . . . . . . . . . . . . . . . . . . . . . . . . . . . . 5,676 5,426 5,367Australia and Asia . . . . . . . . . . . . . . . . . . . . . . . . . . . . . . . . . . . . . . . . . . . . . . . . . . 2,097 1,772 1,506Other . . . . . . . . . . . . . . . . . . . . . . . . . . . . . . . . . . . . . . . . . . . . . . . . . . . . . . . . . . . . . 349 520 557
$15,884 $15,456 $15,382
NOTE 12 – Compensation Plans
Equity Plans
We issue our share-based compensation awards under the Carnival Corporation and Carnival plc stock plans,which have an aggregate of 18.6 million shares available for future grant at November 30, 2014. These plans
33
Ann
ex1
DL
CA
nnua
lRep
ort
allow us to issue time-based share (“TBS”) awards, which include restricted stock awards (“RSAs”) andrestricted stock units (“RSUs”), performance-based share (“PBS”) awards, market-based share (“MBS”) awardsand stock options (collectively “equity awards”). Equity awards are principally granted to management levelemployees and members of our Boards of Directors. The plans are administered by a committee of ourindependent directors (the “Committee”) that determines which employees are eligible to participate, themonetary value or number of shares for which equity awards are to be granted and the amounts that may beexercised or sold within a specified term. These plans allow us to fulfill our equity award obligations usingshares purchased in the open market or with unissued or treasury shares. Certain equity awards provide foraccelerated vesting if we have a change in control, as defined.
Our total share-based compensation expense was $52 million, $42 million and $39 million in 2014, 2013 and2012, respectively, of which $48 million, $39 million and $36 million has been included in selling andadministrative expenses in 2014, 2013 and 2012, respectively, and $4 million in 2014 and $3 million in both2013 and 2012 in cruise payroll and related expenses.
TBS, PBS and MBS Awards
RSAs generally have the same rights as Carnival Corporation common stock, except for transfer restrictions andforfeiture provisions. RSAs have been granted to certain officers and non-executive board members and vest atthe end of three years, except for shares released from restriction to satisfy retirement eligible tax obligations(“tax release shares”). In addition, Carnival Corporation and Carnival plc grant RSUs, which also vest at the endof three years, except for tax release shares, and accrue forfeitable dividend equivalents on each outstandingRSU, in the form of additional RSUs, based on dividends declared. The share-based compensation expense forTBS awards is based on the quoted market price of the Carnival Corporation or Carnival plc shares on the date ofgrant.
In 2014 and 2013, the Committee approved PBS awards to be granted to certain key Carnival Corporation & plcexecutives. The share-based compensation expense for these PBS awards is based on the quoted market price ofthe Carnival Corporation or Carnival plc shares and expected total shareholder return rank relative to certain peercompanies on the date of grant and the probability of our annual earnings target for each year over a three-yearperiod being achieved. Our 2014 PBS awards also have a return on invested capital (“ROIC”) target. The PBSawards granted in 2014 and 2013 provide an opportunity to earn from zero to 200% and zero to 187.5%,respectively, of the number of target shares underlying the award achieved for each year over a three-year period.
In 2012, the Committee approved PBS awards to be granted to certain key Carnival Corporation & plcexecutives. The share-based compensation expense for these PBS awards is based on the quoted market price ofthe Carnival Corporation or Carnival plc shares on the date of grant and the probability of our earnings per sharegrowth over a three-year period being achieved. These PBS awards provide an opportunity to earn from zero to200% of the number of target shares underlying the award achieved at the end of the third year. All PBS awardswill accrue forfeitable dividend equivalents based on dividends declared.
In 2014 and 2013, the Committee approved MBS awards to be granted to certain senior executives. The MBSawards granted in 2014 and 2013 were valued at $13 million and $4 million, respectively, as of the date of grant.The share-based compensation expense for all of the MBS awards were based on the quoted market prices of theCarnival Corporation common stock or the Carnival plc ordinary shares on the date of grant and the probabilityof certain market conditions being achieved. One-half of all of the MBS awards are expensed evenly over athree-year period and the remaining half are expensed evenly over a four-year period.
During the year ended November 30, 2014, TBS, PBS and MBS award activity was as follows:
TBS Awards PBS Awards MBS Awards
Shares
Weighted-Average
Grant Date FairValue Shares
Weighted-Average
Grant Date FairValue Shares
Weighted-Average
Grant Date FairValue
Outstanding at November 30, 2013 3,026,701 $37.01 510,839 $35.91 93,457 $47.03Granted . . . . . . . . . . . . . . . . . . . . . 1,184,099 $41.89 228,506 $36.63 176,763 $73.14Vested . . . . . . . . . . . . . . . . . . . . . . (862,232) $45.97 (31,698) $33.29 - $ -Forfeited . . . . . . . . . . . . . . . . . . . . (138,518) $39.27 (134,860) $42.40 - $ -
Outstanding at November 30, 2014 3,210,050 $36.30 572,787 $34.82 270,220 $64.11
34
The total grant date fair value of TBS, PBS and MBS awards vested was $41 million, $42 million and $52million in 2014, 2013 and 2012, respectively. As of November 30, 2014, there was $55 million of totalunrecognized compensation cost related to TBS, PBS and MBS awards. As of November 30, 2014, the totalunrecognized compensation costs are expected to be recognized over a weighted-average period of 0.9 years forboth TBS and PBS awards and 1.5 years for MBS awards.
Stock Option Plans
In 2007 and 2008, the Committee decided to cease granting stock options to our employees and non-executiveboard members, respectively, and to instead grant them TBS awards. A combined summary of CarnivalCorporation and Carnival plc stock option activity during the year ended November 30, 2014 related to stockoptions previously granted was as follows:
SharesWeighted-Average
Exercise Price
Weighted-Average
RemainingContractual
Term
AggregateIntrinsic
Value (a)
(in years) (in millions)
Outstanding at November 30, 2013 . . . . . . . . . . . . . . . . 3,922,172 $48.42Exercised . . . . . . . . . . . . . . . . . . . . . . . . . . . . . . . . . . . . (17,889) $39.87Forfeited or expired . . . . . . . . . . . . . . . . . . . . . . . . . . . . (2,845,027) $46.88
Outstanding and exercisable at November 30, 2014 . . . 1,059,256 $51.36 0.4 $ -
(a) The aggregate intrinsic value represents the amount by which the fair value of underlying stock exceeds theoption exercise price at November 30, 2014.
As of the dates of exercise, there was a nominal intrinsic value of options exercised in 2014 and a total of $3million and $7 million in 2013 and 2012, respectively. As of November 30, 2014, there is no unrecognizedcompensation cost as there were no unvested stock options. Our stock options will expire through 2016.
Defined Benefit Pension Plans
We have several single-employer defined benefit pension plans, which cover some of our shipboard andshoreside employees. The U.S. and UK shoreside employee plans are closed to new membership and are fundedat or above the level required by U.S. or UK regulations. Substantially all of the remaining defined benefit plansare unfunded. In determining all of our plans’ benefit obligations at November 30, 2014 and 2013, we assumedweighted-average discount rates of 3.5% and 4.0%, respectively. The net asset or net liability positions underthese single-employer defined benefit pension plans are not material.
In addition, we participate in two multiemployer defined benefit pension plans in the UK, the British MerchantNavy Officers Pension Fund (registration number 10005645) (“MNOPF”), and the British Merchant NavyRatings Pension Fund (registration number 10005646) (“MNRPF”), which are referred to as “the multiemployerplans.” The MNOPF is divided into two sections, the “New Section” and the “Old Section.” The multiemployerplans are maintained for the benefit of the employees of the participating employers who make contributions tothe plans. However, contributions made by employers, including us, may be used to provide benefits toemployees of other participating employers, and if any of the participating employers withdraw from themultiemployer plans or fail to make their required contributions, any unfunded obligations would be theresponsibility of the remaining participating employers. We are contractually obligated to make all requiredcontributions as determined by the plans’ trustees. All of our multiemployer plans are closed to new membership,and the MNOPF Old Section is also closed to further benefit accrual and is fully funded. Based on the mostrecent actuarial reviews of the MNOPF New Section and the MNRPF at March 31, 2014 and March 31, 2013,respectively, it was determined that these plans were 87% and 74% funded, respectively. The multiemployerplans have implemented recovery plans, as appropriate, whereby their estimated funding deficits are to berecovered through funding contributions from participating employers.
We expense our portion of the MNOPF deficit as amounts are invoiced by, and become due and payable to, thetrustees. In 2014 and 2012, our contributions to the MNOPF fund were not material and did not exceed 5% oftotal contributions to the fund. In 2013, we received and paid in full a special assessment invoice from theMNOPF trustee for our additional share of the MNOPF New Section deficit. Accordingly, we expensed theinvoice of $15 million in cruise payroll and related expense in 2013, which exceeded 5% of total contributions to
35
Ann
ex1
DL
CA
nnua
lRep
ort
the fund. In addition, we accrue and expense our portion of the MNRPF deficit based on our estimated probableobligation from the most recent actuarial review. In 2014, we expensed $18 million of our estimated probableobligation relating to our allocated share of the MNRPF deficit in cruise payroll and related expenses. As ofNovember 30, 2014, our remaining estimated obligation of the MNRPF deficit was $13 million after contributing$24 million in 2014. In 2014, our contributions to the MNRPF are expected to exceed 5% of total contributionsto the fund. In 2013 and 2012, our contributions to the MNRPF were not material and did not exceed 5% of totalcontributions to the fund. It is possible that we will be required to fund and expense additional amounts for themultiemployer plans in the future, however, such amounts are not expected to be material to our consolidatedfinancial statements.
Total expense for all defined benefit pension plans, including the multiemployer plans, was $69 million, $62million and $45 million in 2014, 2013 and 2012, respectively.
Defined Contribution Plans
We have several defined contribution plans available to most of our employees. We contribute to these plansbased on employee contributions, salary levels and length of service. Total expense for these plans was $25million in both 2014 and 2013 and $22 million in 2012.
NOTE 13 – Earnings Per Share
Our basic and diluted earnings per share were computed as follows (in millions, except per share data):
Years Ended November 30,
2014 2013 2012
Net income for basic and diluted earnings per share . . . . . . . . . . . . . . . . . . . . . . . . . . . . $1,236 $1,078 $1,298
Weighted-average common and ordinary shares outstanding . . . . . . . . . . . . . . . . . . . . . 776 775 778Dilutive effect of equity plans . . . . . . . . . . . . . . . . . . . . . . . . . . . . . . . . . . . . . . . . . . . . . 2 2 1
Diluted weighted-average shares outstanding . . . . . . . . . . . . . . . . . . . . . . . . . . . . . . . . . 778 777 779
Basic and diluted earnings per share . . . . . . . . . . . . . . . . . . . . . . . . . . . . . . . . . . . . . . . . $ 1.59 $ 1.39 $ 1.67
Anti-dilutive equity awards excluded from diluted earnings per share computations . . . 1 4 8
NOTE 14 – Supplemental Cash Flow Information
Cash paid for interest, net of capitalized interest, was $297 million, $301 million and $347 million in 2014, 2013and 2012, respectively. In addition, cash paid for income taxes, net of recoveries, was $5 million in 2014 and $4million in both 2013 and 2012.
36
MANAGEMENT’S REPORT ON INTERNAL CONTROL OVER FINANCIAL REPORTING
Our management is responsible for establishing and maintaining adequate internal control over financialreporting, as such term is defined in the Securities Exchange Act of 1934 Rule 13a-15(f). Under the supervisionand with the participation of our management, including our President and Chief Executive Officer and our ChiefFinancial Officer, we conducted an evaluation of the effectiveness of our internal control over financial reportingbased on the 1992 Internal Control – Integrated Framework, issued by the Committee of SponsoringOrganizations of the Treadway Commission (“COSO Framework”). Based on our evaluation under the COSOFramework, our management concluded that our internal control over financial reporting was effective as ofNovember 30, 2014.
PricewaterhouseCoopers LLP, the independent registered certified public accounting firm that audited ourconsolidated financial statements, has also audited the effectiveness of our internal control over financialreporting as of November 30, 2014 as stated in their report, which is included in this 2014 Annual Report.
Arnold W. Donald David BernsteinPresident andChief Executive Officer
Chief Financial OfficerJanuary 29, 2015
January 29, 2015
37
Ann
ex1
DL
CA
nnua
lRep
ort
REPORT OF INDEPENDENT REGISTERED CERTIFIED PUBLIC ACCOUNTING FIRM
To the Boards of Directors and Shareholders of Carnival Corporation and Carnival plc:
In our opinion, the accompanying consolidated balance sheets and the related consolidated statements of income,comprehensive income, cash flows and shareholders’ equity present fairly, in all material respects, the financialposition of Carnival Corporation & plc (comprising Carnival Corporation and Carnival plc and their respectivesubsidiaries, the “Company”) at November 30, 2014 and November 30, 2013, and the results of their operationsand their cash flows for each of the three years in the period ended November 30, 2014 in conformity withaccounting principles generally accepted in the United States of America. Also in our opinion, the Companymaintained, in all material respects, effective internal control over financial reporting as of November 30, 2014,based on criteria established in the 1992 Internal Control – Integrated Framework, issued by the Committee ofSponsoring Organizations of the Treadway Commission (“COSO Framework”). The Company’s management isresponsible for these financial statements, for maintaining effective internal control over financial reporting andfor its assessment of the effectiveness of internal control over financial reporting, included in Management’sReport on Internal Control Over Financial Reporting. Our responsibility is to express opinions on these financialstatements and on the Company’s internal control over financial reporting based on our integrated audits. Weconducted our audits in accordance with the standards of the Public Company Accounting Oversight Board(United States). Those standards require that we plan and perform the audits to obtain reasonable assurance aboutwhether the financial statements are free of material misstatement and whether effective internal control overfinancial reporting was maintained in all material respects. Our audits of the financial statements includedexamining, on a test basis, evidence supporting the amounts and disclosures in the financial statements, assessingthe accounting principles used and significant estimates made by management, and evaluating the overallfinancial statement presentation. Our audit of internal control over financial reporting included obtaining anunderstanding of internal control over financial reporting, assessing the risk that a material weakness exists, andtesting and evaluating the design and operating effectiveness of internal control based on the assessed risk. Ouraudits also included performing such other procedures as we considered necessary in the circumstances. Webelieve that our audits provide a reasonable basis for our opinions.
A company’s internal control over financial reporting is a process designed to provide reasonable assuranceregarding the reliability of financial reporting and the preparation of financial statements for external purposes inaccordance with generally accepted accounting principles. A company’s internal control over financial reportingincludes those policies and procedures that (i) pertain to the maintenance of records that, in reasonable detail,accurately and fairly reflect the transactions and dispositions of the assets of the company; (ii) provide reasonableassurance that transactions are recorded as necessary to permit preparation of financial statements in accordancewith generally accepted accounting principles, and that receipts and expenditures of the company are being madeonly in accordance with authorizations of management and directors of the company; and (iii) provide reasonableassurance regarding prevention or timely detection of unauthorized acquisition, use, or disposition of thecompany’s assets that could have a material effect on the financial statements.
Because of its inherent limitations, internal control over financial reporting may not prevent or detectmisstatements. Also, projections of any evaluation of effectiveness to future periods are subject to the risk thatcontrols may become inadequate because of changes in conditions, or that the degree of compliance with thepolicies or procedures may deteriorate.
Miami, FloridaJanuary 29, 2015
38
MANAGEMENT’S DISCUSSION AND ANALYSIS OF FINANCIAL CONDITION AND RESULTS OFOPERATIONS
Cautionary Note Concerning Factors That May Affect Future Results
Some of the statements, estimates or projections contained in this 2014 Annual Report are “forward-lookingstatements” that involve risks, uncertainties and assumptions with respect to us, including some statementsconcerning future results, outlooks, plans, goals and other events which have not yet occurred. These statementsare intended to qualify for the safe harbors from liability provided by Section 27A of the Securities Act of 1933and Section 21E of the Securities Exchange Act of 1934. All statements other than statements of historical factsare statements that could be deemed forward-looking. These statements are based on current expectations,estimates, forecasts and projections about our business and the industry in which we operate and the beliefs andassumptions of our management. We have tried, whenever possible, to identify these statements by using wordslike “will,” “may,” “could,” “should,” “would,” “believe,” “depends,” “expect,” “goal,” “anticipate,” “forecast,”“project,” “future,” “intend,” “plan,” “estimate,” “target,” “indicate” and similar expressions of future intent orthe negative of such terms.
Forward-looking statements include those statements that may impact, among other things, the forecasting of ournon-GAAP earnings per share; net revenue yields; booking levels; pricing; occupancy; operating, financing andtax costs, including fuel expenses; net cruise costs per available lower berth day; estimates of ship depreciablelives and residual values; liquidity; goodwill, ship and trademark fair values and outlook. Because forward-looking statements involve risks and uncertainties, there are many factors that could cause our actual results,performance or achievements to differ materially from those expressed or implied in this 2014 Annual Report.This note contains important cautionary statements of the known factors that we consider could materially affectthe accuracy of our forward-looking statements and adversely affect our business, results of operations andfinancial position. It is not possible to predict or identify all such risks. There may be additional risks that weconsider immaterial or which are unknown. These factors include, but are not limited to, the following:
– general economic and business conditions;– increases in fuel prices;– incidents, the spread of contagious diseases and threats thereof, adverse weather conditions or other natural
disasters and other incidents affecting the health, safety, security and satisfaction of guests and crew;– the international political climate, armed conflicts, terrorist and pirate attacks, vessel seizures, and threats
thereof, and other world events affecting the safety and security of travel;– negative publicity concerning the cruise industry in general or us in particular, including any adverse
environmental impacts of cruising;– geographic regions in which we try to expand our business may be slow to develop and ultimately not
develop how we expect;– economic, market and political factors that are beyond our control, which could increase our operating,
financing and other costs;– changes in and compliance with laws and regulations relating to the protection of persons with disabilities,
employment, environment, health, safety, security, tax and other regulations under which we operate;– our inability to implement our shipbuilding programs and ship repairs, maintenance and refurbishments on
terms that are favorable or consistent with our expectations;– increases to our repairs and maintenance expenses and refurbishment costs as our fleet ages;– lack of continuing availability of attractive, convenient and safe port destinations on terms that are favorable
or consistent with our expectations;– continuing financial viability of our travel agent distribution system, air service providers and other key
vendors in our supply chain and reductions in the availability of, and increases in the prices for, the servicesand products provided by these vendors;
– disruptions and other damages to our information technology and other networks and operations, andbreaches in data security;
– failure to keep pace with developments in technology;– competition from and overcapacity in the cruise ship and land-based vacation industry;– loss of key personnel or our ability to recruit or retain qualified personnel;– union disputes and other employee relationship issues;– disruptions in the global financial markets or other events that may negatively affect the ability of our
counterparties and others to perform their obligations to us;– the continued strength of our cruise brands and our ability to implement our strategies;– additional risks to our international operations not generally applicable to our U.S. operations;– our decisions to self-insure against various risks or our inability to obtain insurance for certain risks at
reasonable rates;
39
Ann
ex1
DL
CA
nnua
lRep
ort
– litigation, enforcement actions, fines or penalties;– fluctuations in foreign currency exchange rates;– whether our future operating cash flow will be sufficient to fund future obligations and whether we will be
able to obtain financing, if necessary, in sufficient amounts and on terms that are favorable or consistentwith our expectations;
– risks associated with our DLC arrangement;– uncertainties of a foreign legal system as Carnival Corporation and Carnival plc are not U.S. corporations
and– the ability of a small group of shareholders to effectively control the outcome of shareholder voting.
Forward-looking statements should not be relied upon as a prediction of actual results. Subject to any continuingobligations under applicable law or any relevant stock exchange rules, we expressly disclaim any obligation todisseminate, after the date of this 2014 Annual Report, any updates or revisions to any such forward-lookingstatements to reflect any change in expectations or events, conditions or circumstances on which any suchstatements are based.
2014 Executive Overview
Overall, 2014 was a strong year as we turned the corner with improved earnings and positive net revenue yields,despite the loss of attractive itineraries due to geopolitical factors and large cruise industry capacity increases inthe Caribbean. We continued to gain momentum and achieved about a 1 percentage point increase in ROIC, aswe move towards our goal of double digit ROIC in the next three to four years, while maintaining a strongbalance sheet. (We define ROIC as the twelve-month non-GAAP earnings before interest divided by the monthlyaverage of debt plus equity minus construction-in-progress.)
Non-GAAP net income for 2014 increased 24% to $1.5 billion ($1.2 billion U.S. GAAP). We saw strong profitimprovement at both our Carnival Cruise Line and Costa brands and enjoyed several early wins from our cross-brand collaboration efforts that contributed to our improved 2014 results, particularly in the area of onboardrevenues. The increase in our non-GAAP net income was driven by slightly higher net revenue yields (constantdollar), an increase in capacity and lower fuel prices and fuel consumption per ALBD (“available lower berthday”), partially offset by slightly higher net cruise costs excluding fuel per ALBD (constant dollar).
Our slightly higher net revenue yield (constant dollar) was due to a more than 3% increase in net onboard andother revenue yields, partially offset by slightly lower net passenger ticket revenue yields. The growth in netonboard and other revenue yields was driven by increases in primarily all the net onboard revenue categories onboth sides of the Atlantic. The slight decrease in net passenger ticket revenue yields was driven by our NorthAmerica brands’ facing a promotional pricing environment in the Caribbean resulting from the large increase incruise industry capacity, partially offset by improvements at our continental European brands.
Our moderate capacity growth was driven by our new ship deliveries, partially offset by our ship sales. During2014, we introduced Princess Cruises’ 3,560-passenger Regal Princess and Costa Cruises’ 3,692-passengerCosta Diadema. We are building new, innovative, purpose-built ships that are larger and more efficient and havea wider range of onboard amenities and features, which enable us to better compete for consumers’ vacationspend. These larger ships enable us to obtain greater economies of scale. In addition, we continue to makesubstantial investments in our existing ship enhancement programs to improve our onboard product offerings andenrich our guests’ vacation experiences. Furthermore, in 2014 we sold four of our smaller, less efficient vessels:Costa Celebration, Costa Voyager, Grand Holiday and Ocean Princess.
We benefited from a reduction in fuel prices, which resulted in $126 million of savings. In addition, we had analmost 5% reduction in fuel consumption per ALBD thus saving another $107 million of fuel expense comparedto 2013, which continued our multiple-year cumulative unit fuel consumption savings trend that has reached 25%since 2007. We achieved our stated goal of delivering a 20% reduction (per unit) in the intensity of carbondioxide emissions from our shipboard operations one year prior to our target date and are currently developingnew goals aimed at protecting the environment and further reducing our fuel consumption. We are installing newexhaust gas cleaning systems on our ships to achieve environmental objectives and mitigate the financial impactof the new 2015 low sulfur regulatory requirements. We are also implementing a series of new energy savingtechnology initiatives across our fleet in areas such as propulsion, air conditioning and waste heat recoverysystems as well as more efficient lighting in order to help reduce our carbon footprint and costs.
Our ability to generate significant operating cash flows allows us to internally fund our capital investments. Wegenerated $3.4 billion of cash from operations, 21% higher than last year, and used $2.5 billion to fund investing
40
activities, leaving us with almost $1.0 billion, most of which was returned to shareholders through our regularquarterly dividend. Our goal is to return “excess free cash flows” (defined as cash flows from operations lessinvesting activities and regularly scheduled quarterly dividends) to our shareholders in the form of additionaldividends and/or share buybacks.
We identified new strategies and tactics to strengthen our cruise ticket revenue management processes andsystems across our portfolio of brands, such as optimizing our pricing methodologies, improving our pricingmodels and increasing our brands’ coordination of our global fleet deployments. Our objectives are to drivegreater penetration, more effective capacity management and improve revenue yields. In addition, we havestarted to implement various demand creating initiatives as we strive to create additional demand for our brandsthat far outpaces supply, ultimately leading to higher revenue yields.
Our goal is to consistently exceed our guests’ expectations while providing them with a wide variety ofexceptional vacation experiences. To this end, we are conducting psychographic segmentation studies to gain amore insightful and impactful understanding of our guests’ needs, wants and expectations. We will then targetour advertising and promotions toward these specific guest segments in order to drive demand for our offeringsand better guide our guests to the cruise brand experience that best matches their tastes. These studies shouldenable us to better differentiate each brand in the minds of vacationers and consumers-at-large and adjust theproduct and service offerings of our brands.
Strong relationships with our travel agents are also vital to our success. In 2014, we continued to strengthen ourrelationship with the travel agent community by increasing our communication and outreach, implementingchanges based on travel agent feedback, increasing our trade marketing presence and improving our educationalprograms to assist agents in stimulating cruise demand.
In 2014, our operating income in China significantly increased due to a combination of capacity growth andrevenue yield improvement. We believe that we have significant opportunities to continue to grow our presencein China due to its large and growing middle-class population and expansion of their international tourism. Dueto the high strategic importance we place on the China cruise market, in 2014 we relocated our Chief OperationsOfficer to China to more closely oversee our brands’ strategic initiatives, coordinate our growth strategy in Chinaand the surrounding markets and liaise with Chinese government officials. With the introduction of Costa Serenain 2015, we will have four ships home ported in China, which will represent a 140% increase in guest capacityover a two-year period and will offer our Chinese guests diversified cruise products with two brands targetingtwo different segments of travelers. As part of our China cruise strategy, we are exploring opportunities aimed atthe development of a domestic cruise company and the formation of a domestic cruise shipbuilding company, aswell as port development, talent development and training, enhanced relationships with our distribution partnersand sharing of supply chain and logistics expertise.
With 100 ships and 10.6 million guests in 2014, we have the scale to optimize our structure by utilizing ourcombined purchasing volumes and common technologies and implementing cross-brand initiatives aimed at costcontainment. In 2014, we continued working on expanding cross-brand contracting for food and beverages andbegan working on cross-brand contracting for air travel to further utilize the scale of our combined purchases.
Our uncompromising commitment to the safety and comfort of our guests and crew is paramount to the successof our business. We are developing a company-wide safety management system that standardizes our maritimerelated policies, procedures and processes and are increasing the amount of maritime safety, ship command andengine room management training for our shipboard officers at our expanding global training facility in theNetherlands. We are also updating our processes, systems and training surrounding fire prevention, detection andsuppression. Furthermore, we continue to make investments in our ships’ maritime systems to improve theirsafety and reliability, which also allows us to operate them more efficiently and sustainably.
We employ an average of 81,200 crew members, including officers, onboard the 100 ships we currently operate,which exclude crew who are on a leave. We also have an average of 10,100 full-time shoreside employees and2,800 part-time/seasonal employees. Our goal is to select, train and retain the finest shipboard and shoresideemployees because having a team of highly motivated and engaged employees is key to delivering vacationexperiences that exceed our guests’ expectations. We have structured our work processes and incentivecompensation plans to reflect a culture that enables our brands to better align their individual performance withour primary financial goals. Our management teams are aligned by geographic region to further optimize ouroperations, utilize our scale and better manage our performance. In 2014, we accelerated our cross-brandcollaboration and streamlined our non-guest facing operations within the Holland America Line, Princess andSeabourn group.
41
Ann
ex1
DL
CA
nnua
lRep
ort
While we are well underway with certain initiatives discussed above and are already beginning to see theirpositive results, some of our initiatives will take longer to realize their full benefits due to our size and the natureof the cruise industry. Our strategic initiatives demonstrate the benefits of communicating, coordinating andcollaborating across our brands and will help us fulfill our vision to deliver unmatched joyful vacationexperiences and breakthrough total shareholder returns by exceeding guests’ expectations and achieving the fullbenefits inherent in our scale.
As of January 22, 2015, we have ten cruise ships scheduled to be delivered between February 2015 andNovember 2018, some of which will replace existing capacity as older, smaller and less efficient ships exit ourfleet. We strategically time the introduction of additional ships into our brands to allow ample time for thoselines to further grow their guest base and absorb the new capacity. We have removed 16 ships from our fleetsince 2006 and have agreements in place to remove three more ships by March 2016. Based on our current shiporders and announced ship withdrawals, our net capacity growth rate is expected to be 2.0% in 2015 and 2.8%compounded annually through 2018. We are committed to measured capacity growth so that we achieve anoptimal balance of supply and demand to maximize our profitability in established cruise regions, such as NorthAmerica and Western Europe. We believe the increasing deployment of ships into the emerging Asia market mayfurther moderate the level of supply in North America and Western Europe.
Outlook for the 2015 First Quarter and Full Year
On December 19, 2014, we said that we expected our non-GAAP diluted earnings per share for the 2015 firstquarter and full year to be in the ranges of $0.07 to $0.11 and $2.30 to $2.60, respectively (see “Key PerformanceNon-GAAP Financial Indicators”). Our guidance was based on fuel prices of $421 per metric ton and $436 permetric ton for the 2015 first quarter and full year, respectively. In addition, our guidance was based on 2015 firstquarter and full year currency rates of $1.23 to the euro, $1.57 to sterling and $0.83 to the Australian dollar. Thefuel and currency assumptions used in our guidance change daily and, accordingly, our forecasts change dailybased on the changes in these assumptions.
The above forward-looking statements involve risks, uncertainties and assumptions with respect to us. There aremany factors that could cause our actual results to differ materially from those expressed above including, but notlimited to, general economic and business conditions, increases in fuel prices, incidents, spread of contagiousdiseases, adverse weather conditions, geopolitical events, negative publicity and other factors that couldadversely impact our revenues, costs and expenses. You should read the above forward-looking statementstogether with the discussion of these and other risks under “Cautionary Note Concerning Factors That MayAffect Future Results.”
Critical Accounting Estimates
Our critical accounting estimates are those that we believe require our most significant judgments about theeffect of matters that are inherently uncertain. A discussion of our critical accounting estimates, the underlyingjudgments and uncertainties used to make them and the likelihood that materially different estimates would bereported under different conditions or using different assumptions is as follows:
Ship Accounting
Our most significant assets are our ships, including ship improvements and ships under construction, whichrepresent 80% of our total assets at November 30, 2014. We make several critical accounting estimates withrespect to our ship accounting. First, in order to compute our ships’ depreciation expense, which represented 11%of our cruise costs and expenses in 2014, we have to estimate the useful life of each of our ships as well as theirresidual values. Secondly, we account for ship improvement costs by capitalizing those costs that we believe addvalue to our ships and have a useful life greater than one year, and depreciate those improvements over theshorter of their or the ships’ estimated remaining useful life, while the costs of repairs and maintenance,including minor improvement costs and dry-dock expenses, are charged to expense as incurred. Finally, when werecord the retirement of a ship component that is included within the ship’s cost basis, we may have to estimatethe net book value of the asset being retired in order to remove it from the ship’s cost basis.
We determine the useful life of our ships and ship improvements based on our estimates of the period over whichthe assets will be of economic benefit to us, including the impact of long-term vacation market conditions,marketing and technical obsolescence, competition, physical deterioration, historical useful lives of similarly-built ships, regulatory constraints and maintenance requirements. In addition, we consider estimates of the
42

weighted-average useful lives of the ships’ major component systems, such as the hull, cabins, main electric,superstructure and engines. Taking all this into consideration, we have estimated our new ships’ useful lives at 30years.
We determine the residual value of our ships based on our long-term estimates of their resale value at the end oftheir useful life to us but before the end of their physical and economic lives to others, historical resale values ofour and other cruise ships and viability of the secondary cruise ship market. We have estimated our residualvalues at 15% of our original ship cost.
Given the large size and complexity of our ships, ship accounting estimates require considerable judgment andare inherently uncertain. We do not have cost segregation studies performed to specifically componentize ourships. In addition, since we do not separately componentize our ships, we do not identify and track depreciationof original ship components. Therefore, we typically have to estimate the net book value of components that areretired, based primarily upon their replacement cost, their age and their original estimated useful lives.
If materially different conditions existed, or if we materially changed our assumptions of ship useful lives andresidual values, our depreciation expense, loss on retirement of ship components and net book value of our shipswould be materially different. In addition, if we change our assumptions in making our determinations as towhether improvements to a ship add value, the amounts we expense each year as repair and maintenance expensecould increase, which would be partially offset by a decrease in depreciation expense, resulting from a reductionin capitalized costs. Our 2014 ship depreciation expense would have increased by approximately $50 millionassuming we had reduced our estimated 30-year ship useful life estimate by one year at the time we took deliveryor acquired each of our ships. In addition, our 2014 ship depreciation expense would have increased byapproximately $205 million assuming we had estimated our ships to have no residual value at the time of theirdelivery or acquisition.
We believe that the estimates we made for ship accounting purposes are reasonable and our methods areconsistently applied in all material respects and, accordingly, result in depreciation expense that is based on arational and systematic method to equitably allocate the costs of our ships to the periods during which we usethem. In addition, we believe that the estimates we made are reasonable and our methods consistently applied inall material respects in determining (1) the useful life and residual values of our ships, including shipimprovements; (2) which improvement costs add value to our ships and (3) the net book value of ship componentassets being retired. Finally, we believe our critical ship accounting estimates are generally comparable withthose of other major cruise companies.
Asset Impairments
Impairment reviews of our cruise ships, goodwill and trademarks require us to make significant estimates todetermine the fair values of these assets and cruise brands.
For our cruise ships, we perform our impairment reviews, if required, at the individual cruise ship level, which isthe lowest level for which we maintain identifiable cash flows that are independent of the cash flows of otherassets and liabilities. See Note 10 – “Fair Value Measurements, Derivative Instruments and Hedging Activities”in the consolidated financial statements for a discussion of ship impairment charges recorded in 2014, 2013 and2012.
We believe it is more-likely-than-not (“MLTN”) that each of our cruise brands’ estimated fair value that carrygoodwill at November 30, 2014 exceeded their carrying value. We also believe that it is MLTN that theestimated fair value of each of our cruise brands’ trademarks recorded at November 30, 2014 exceeded theircarrying values. See Note 10 – “Fair Value Measurements, Derivative Instruments and Hedging Activities” in theconsolidated financial statements for additional discussion of our goodwill and trademark impairment reviews.
The determination of fair value includes numerous assumptions that are subject to various risks and uncertainties,unless a comparable, viable actively-traded market exists, which is usually not the case for cruise ships, cruisebrands and trademarks. Our ships’ fair values are typically estimated based either on ship sales price negotiationsor discounted future cash flows. The principal assumptions used to calculate our discounted future cash flowsinclude forecasted future operating results over the expected period we believe the ships will have economicbenefit to us and their estimated residual values.
In performing qualitative assessments of our cruise brands that carry goodwill, qualitative factors that weconsider to determine their effect on each of the cruise brand’s estimated fair values include industry and marketconditions, macroeconomic conditions, changes to WACC, overall financial performance, changes in fuel prices
43
Ann
ex1
DL
CA
nnua
lRep
ort
and capital expenditures. In determining the estimated fair values of cruise brands utilizing discounted futurecash flow analysis for our quantitative goodwill impairment tests, significant judgments are made related toforecasting future operating results, including net revenue yields and net cruise costs including fuel prices;capacity changes, including the expected rotation of vessels into, or out of, the cruise brand; capital expenditures;WACC of market participants, adjusted for the risk attributable to the geographic region in which the cruisebrand operates and terminal values. In addition, third-party appraisers are sometimes used to help determine fairvalues of cruise brands and trademarks, and their valuation methodologies are also typically subject touncertainties similar to those discussed above.
In addition, in performing our qualitative assessments of our cruise brands’ significant trademarks, qualitativefactors that we consider to determine their effect on each of the cruise brand’s recorded trademarks’ estimatedfair values include industry and market conditions, macroeconomic conditions, changes to the WACC, changesin royalty rates and overall financial performance. In determining our trademark estimated fair values for ourquantitative impairment tests, we also use discounted future cash flow analysis, which requires some of the samesignificant judgments discussed above. Specifically, determining the estimated amount of royalties that we arerelieved from having to pay for the use of the associated trademarks is based upon forecasted cruise revenues anda market participant’s royalty rate. The royalty rates are estimated primarily using comparable royaltyagreements for similar industries.
We believe that we have made reasonable estimates and judgments in determining whether our cruise ships,goodwill and trademarks have been impaired. However, if there is a change in assumptions used or if there is achange in the conditions or circumstances influencing fair values in the future, then we may need to recognize animpairment charge.
Contingencies
We periodically assess the potential liabilities related to any lawsuits or claims brought against us, as well as forother known unasserted claims, including environmental, legal, regulatory, guest and crew and tax matters. Inaddition, we periodically assess the recoverability of our trade and other receivables, charter-hire agreements andother counterparty credit exposures, such as contractual nonperformance by financial and other institutions withwhich we conduct significant business. Our credit exposure includes contingent obligations related to cashpayments received directly by travel agents and tour operators for cash collected by them on cruise sales inAustralia and most of Europe where we are obligated to honor our guests’ cruise payments made by them to theirtravel agents and tour operators regardless of whether we have received these payments. While it is typically verydifficult to determine the timing and ultimate outcome of these matters, we use our best judgment to determine ifit is probable, or MLTN for income tax matters, that we will incur an expense related to the settlement or finaladjudication of such matters and whether a reasonable estimation of such probable or MLTN loss, if any, can bemade. In assessing probable losses, we make estimates of the amount of probable insurance recoveries, if any,which are recorded as assets. We accrue a liability and establish a reserve when we believe a loss is probable orMLTN for income tax matters, and the amount of the loss can be reasonably estimated in accordance with U.S.generally accepted accounting principles (“U.S. GAAP”). Such accruals and reserves are typically based ondevelopments to date, management’s estimates of the outcomes of these matters, our experience in contesting,litigating and settling other similar non-income tax matters, historical claims experience, actuarially determinedestimates of liabilities and any related insurance coverages. See Note 7 – “Contingencies,” Note 8 – “Taxation”and Note 10 – “Fair Value Measurements, Derivative Instruments and Hedging Activities” in the consolidatedfinancial statements for additional information concerning our contingencies.
Given the inherent uncertainty related to the eventual outcome of these matters and potential insurancerecoveries, it is possible that all or some of these matters may be resolved for amounts materially different fromany provisions or disclosures that we may have made with respect to their resolution. In addition, as newinformation becomes available, we may need to reassess the amount of asset or liability that needs to be accruedrelated to our contingencies. All such revisions in our estimates could materially impact our results of operationsand financial position.
Results of Operations
We earn substantially all of our cruise revenues from the following:
– sales of passenger cruise tickets and, in some cases, the sale of air and other transportation to and fromairports near our ships’ home ports and cancellation fees. The cruise ticket price typically includesaccommodations, most meals, some non-alcoholic beverages and most onboard entertainment. We alsocollect fees, taxes and other charges from our guests, and
44
– sales of goods and services primarily onboard our ships not included in the cruise ticket price includingsubstantially all liquor and some non-alcoholic beverage sales, casino gaming, shore excursions, gift shopsales, photo sales, communication services, full service spas, specialty themed restaurants, cruise vacationprotection programs and pre- and post-cruise land packages. These goods and services are provided eitherdirectly by us or by independent concessionaires, from which we receive either a percentage of theirrevenues or a fee.
We incur cruise operating costs and expenses for the following:
– the costs of passenger cruise bookings, which represent costs that are directly associated with passenger cruiseticket revenues, and include travel agent commissions, air and other transportation related costs, fees, taxes andother charges that vary with guest head counts and related credit and debit card or direct debit fees,
– onboard and other cruise costs, which represent costs that are directly associated with onboard and otherrevenues, and include the costs of liquor and some non-alcoholic beverages, costs of tangible goods sold byus in our gift shops and from our photo sales, communication costs, costs of cruise vacation protectionprograms, costs of pre- and post-cruise land packages and related credit and debit card or direct debitfees. Concession revenues do not have significant associated expenses because the costs and servicesincurred for concession revenues are borne by our concessionaires,
– fuel costs, which include fuel delivery costs,– payroll and related costs, which represent all costs related to our shipboard personnel, including deck and
engine crew, including officers, and hotel and administrative employees, while costs associated with ourshoreside personnel are included in selling and administrative expenses,
– food costs, which include both our guest and crew food costs and– other ship operating expenses, which include port costs that do not vary with guest head counts, repairs and
maintenance, including minor improvements and dry-dock expenses, hotel costs, entertainment, gains andlosses on ship sales, ship impairments, freight and logistics, insurance premiums and all other ship operatingexpenses.
For segment information related to our North America and EAA cruise brands’ revenues, expenses, operatingincome and other financial information, see Note 11 – “Segment Information” in the consolidated financialstatements.
Statistical Information
Years Ended November 30,
2014 2013 2012
ALBDs (in thousands) (a)(b) . . . . . . . . . . . . . . . . . . . . . . . . . . . . . . . . . . . . . . . . . . 76,000 74,033 71,976Occupancy percentage (c) . . . . . . . . . . . . . . . . . . . . . . . . . . . . . . . . . . . . . . . . . . . . 104.1% 105.1% 105.5%Passengers carried (in thousands) . . . . . . . . . . . . . . . . . . . . . . . . . . . . . . . . . . . . . . 10,566 10,061 9,829Fuel consumption in metric tons (in thousands) . . . . . . . . . . . . . . . . . . . . . . . . . . . 3,194 3,266 3,354Fuel consumption in metric tons per ALBD . . . . . . . . . . . . . . . . . . . . . . . . . . . . . . 0.042 0.044 0.047Fuel cost per metric ton consumed . . . . . . . . . . . . . . . . . . . . . . . . . . . . . . . . . . . . . . $ 636 $ 676 $ 710Currencies
U.S. dollar to €1 . . . . . . . . . . . . . . . . . . . . . . . . . . . . . . . . . . . . . . . . . . . . . . . . . . $ 1.34 $ 1.32 $ 1.28U.S. dollar to £1 . . . . . . . . . . . . . . . . . . . . . . . . . . . . . . . . . . . . . . . . . . . . . . . . . . $ 1.66 $ 1.56 $ 1.58U.S. dollar to Australian dollar . . . . . . . . . . . . . . . . . . . . . . . . . . . . . . . . . . . . . . $ 0.91 $ 0.98 $ 1.03
(a) ALBD is a standard measure of passenger capacity for the period that we use to approximate rate andcapacity variances, based on consistently applied formulas, that we use to perform analyses to determine themain non-capacity driven factors that cause our cruise revenues and expenses to vary. ALBDs assume thateach cabin we offer for sale accommodates two passengers and is computed by multiplying passengercapacity by revenue-producing ship operating days in the period.
(b) In 2014, we had a 2.7% capacity increase in ALBDs compared to 2013 comprised of a 4.3% capacityincrease in our North America brands and a minor capacity increase in our EAA brands.
Our North America brands’ capacity increase was caused by:
– the full year impact from one Princess 3,560-passenger capacity ship delivered in 2013;– the partial year impact from one Princess 3,560-passenger capacity ship delivered in 2014 and– fewer ship dry-dock days in 2014 compared to 2013.
45
Ann
ex1
DL
CA
nnua
lRep
ort
In 2013, we had a 2.9% capacity increase in ALBDs compared to 2012 comprised of a 3.4% and 2.5%capacity increase in our EAA brands and North America brands, respectively.
Our EAA brands’ capacity increase was caused by:
– the full year impact from one AIDA 2,194-passenger capacity ship and one Costa 2,984-passengercapacity ship both delivered in 2012;
– the partial year impact from one AIDA 2,194-passenger capacity ship delivered in 2013 and– fewer ship dry-dock days in 2013 compared to 2012.
These increases were partially offset by the full year impact from the removal of two Costa ships andthe sale of one P&O Cruises (Australia) 1,462-passenger capacity ship all in 2012.
Our North America brands’ capacity increase was caused by:
– the full year impact from one Carnival Cruise Line 3,690-passenger capacity ship delivered in2012 and
– the partial year impact from one Princess 3,560-passenger capacity ship delivered in 2013.
These increases were partially offset by more ship dry-dock days in 2013 compared to 2012.
(c) In accordance with cruise industry practice, occupancy is calculated using a denominator of ALBDs, whichassumes two passengers per cabin even though some cabins can accommodate three or morepassengers. Percentages in excess of 100% indicate that on average more than two passengers occupiedsome cabins.
2014 Compared to 2013
Revenues
Consolidated
Cruise passenger ticket revenues made up 75% of our 2014 total revenues. Cruise passenger ticket revenuesincreased by $241 million, or 2.1%, to $11.9 billion in 2014 from $11.6 billion in 2013.
This increase was caused by:
– $309 million – 2.7% capacity increase in ALBDs and– $102 million – foreign currency translational impact from a weaker U.S. dollar against the euro and sterling,
net of a stronger U.S. dollar against the Australian dollar (“2014 net currency impact”).
These increases were partially offset by:
– $114 million – 1.0 percentage point decrease in occupancy and– $37 million – decrease in cruise ticket pricing.
The remaining 25% of 2014 total revenues were substantially all comprised of onboard and other cruiserevenues, which increased by $182 million, or 5.1%, to $3.8 billion in 2014 from $3.6 billion in 2013. Thisincrease was principally due to our 2.7% capacity increase in ALBDs, which accounted for $96 million, andhigher onboard spending by our guests, which accounted for $92 million, partially offset by a 1.0 percentagepoint decrease in occupancy, which accounted for $36 million. Onboard and other revenues included concessionrevenues of $1.1 billion in both 2014 and 2013.
North America Brands
Cruise passenger ticket revenues made up 73% of our 2014 total revenues. Cruise passenger ticket revenuesincreased slightly by $19 million to $6.9 billion in 2014 from $6.8 billion in 2013.
This increase was caused by:
– $294 million – 4.3% capacity increase in ALBDs.
This increase was partially offset by:
– $130 million – 2.0 percentage point decrease in occupancy;– $75 million – decrease in cruise ticket pricing and– $58 million – decrease in air transportation revenues from guests who purchased their tickets from us.
46
Our cruise ticket pricing decrease was driven by the promotional pricing environment in the Caribbean resultingfrom the large increase in cruise industry capacity.
The remaining 27% of 2014 total revenues were comprised of onboard and other cruise revenues, whichincreased by $168 million, or 7.0%, to $2.6 billion in 2014 from $2.4 billion in 2013.
This increase was caused by:
– $103 million – 4.3% capacity increase in ALBDs;– $78 million – higher onboard spending by our guests and– $20 million – higher other third-party revenues.
These increases were partially offset by:
– $46 million – 2.0 percentage point decrease in occupancy.
Onboard and other revenues included concession revenues of $735 million in 2014 and $727 million in 2013.
EAA Brands
Cruise passenger ticket revenues made up 82% of our 2014 total revenues. Cruise passenger ticket revenuesincreased by $223 million, or 4.6%, to $5.0 billion in 2014 from $4.8 billion 2013.
This increase was substantially due to:
– $102 million – 2014 net currency impact;– $49 million – increase in air transportation revenues from guests who purchased their tickets from us;– $39 million – increase in cruise ticket pricing and– $23 million – slight increase in occupancy.
The remaining 18% of 2014 total revenues were comprised of onboard and other cruise revenues, whichincreased by $19 million, or 1.7%, and remained at $1.1 billion in both 2014 and 2013. Onboard and otherrevenues included concession revenues of $367 million in 2014 and $370 million in 2013.
Costs and Expenses
Consolidated
Operating costs and expenses decreased by $221 million, or 2.1%, to $10.4 billion in 2014 from $10.6 billion in2013.
This decrease was caused by:
– $176 million – nonrecurrence in 2014 of impairment charges related to Costa Classica and Costa Voyager;– $126 million – lower fuel prices;– $107 million – lower fuel consumption per ALBD;– $64 million – decreases in commissions, transportation and other related expenses primarily due to a
decrease in air transportation costs related to guests who purchased their tickets from us;– $56 million – nonrecurrence in 2014 of additional costs and expenses related to the 2013 voyage
disruptions, net of third-party insurance recoverables of $20 million;– $51 million – gains from the sales of Costa Voyager and Ocean Princess;– $40 million – lower dry-dock and other ship repair and maintenance expenses and– $38 million – 1.0 percentage point decrease in occupancy.
These decreases were partially offset by:
– $278 million – 2.7% capacity increase in ALBDs;– $59 million – 2014 net currency impact;– $53 million – impairment charges related to Costa Celebration and Grand Holiday and– $47 million – various other operating expenses, net.
Selling and administrative expenses increased by $175 million, or 9.3%, to $2.1 billion in 2014 from $1.9 billionin 2013.
Depreciation and amortization expenses increased by $47 million, or 3.0%, and remained at $1.6 billion in both2014 and 2013.
47
Ann
ex1
DL
CA
nnua
lRep
ort
Our total costs and expenses as a percentage of revenues decreased to 89% in 2014 from 91% in 2013.
North America Brands
Operating costs and expenses decreased slightly by $22 million and remained at $6.3 billion in both 2014 and2013.
This decrease was caused by:
– $103 million – decreases in commissions, transportation and other related expenses primarily due to adecrease in air transportation costs related to guests who purchased their tickets from us;
– $87 million – lower fuel prices;– $58 million – lower fuel consumption per ALBD;– $56 million – nonrecurrence in 2014 of additional costs and expenses related to the 2013 voyage
disruptions, net of third-party insurance recoverables of $20 million;– $43 million – 2.0 percentage point decrease in occupancy;– $43 million – lower dry-dock and other ship repair and maintenance expenses and– $14 million – gain from the sale of Ocean Princess.
These decreases were partially offset by:
– $271 million – 4.3% capacity increase in ALBDs;– $39 million – nonrecurrence in 2014 of an intersegment transaction, which was fully offset in our Cruise
Support segment and– $72 million – various other operating expenses, net.
Our total costs and expenses as a percentage of revenues decreased to 89% in 2014 from 90% in 2013.
EAA Brands
Operating costs and expenses decreased by $223 million, or 5.4%, to $3.9 billion in 2014 from $4.1 billion in2013.
This decrease was caused by:
– $176 million – nonrecurrence in 2014 of impairment charges related to Costa Classica and Costa Voyager;– $51 million – lower fuel consumption per ALBD;– $41 million – lower fuel prices;– $39 million – lower dry-dock and other ship repair and maintenance expenses;– $37 million – gain from the sale of Costa Voyager and– $37 million – various other operating expenses, net.
These decreases were partially offset by:
– $59 million – 2014 net currency impact;– $53 million – impairment charges related to Costa Celebration and Grand Holiday and– $46 million – increases in commissions, transportation and other related expenses principally due to an
increase in air transportation costs related to guests who purchased their tickets from us.
Our total costs and expenses as a percentage of revenues decreased to 86% in 2014 from 92% in 2013.
Operating Income
Our consolidated operating income increased by $440 million, or 33%, to $1.8 billion in 2014 from $1.4 billionin 2013. Our North America brands’ operating income increased by $105 million, or 11%, to $1.1 billion in 2014from $956 million in 2013, and our EAA brands’ operating income increased by $422 million, or 90%, to $893million in 2014 from $471 million in 2013. These changes were primarily due to the reasons discussed above.
Nonoperating Expense
Net interest expense decreased by $31 million, or 9.7%, to $288 million in 2014 from $319 million in 2013. In2014, losses on fuel derivatives, net of $271 million were substantially all comprised of unrealized losses, net,and in 2013 gains on fuel derivatives, net of $36 million were all comprised of unrealized gains, net.
48
Key Performance Non-GAAP Financial Indicators
We use net cruise revenues per ALBD (“net revenue yields”), net cruise costs per ALBD and net cruise costsexcluding fuel per ALBD as significant non-GAAP financial measures of our cruise segments’ financialperformance. These measures enable us to separate the impact of predictable capacity changes from the moreunpredictable rate changes that affect our business; gains and losses on ship sales and ship impairments, net; andrestructuring expenses that are not part of our core operating business. We believe these non-GAAP measuresprovide useful information to investors and expanded insight to measure our revenue and cost performance as asupplement to our U.S. GAAP consolidated financial statements.
Net revenue yields are commonly used in the cruise industry to measure a company’s cruise segment revenueperformance and for revenue management purposes. We use “net cruise revenues” rather than “gross cruiserevenues” to calculate net revenue yields. We believe that net cruise revenues is a more meaningful measure indetermining revenue yield than gross cruise revenues because it reflects the cruise revenues earned net of ourmost significant variable costs, which are travel agent commissions, cost of air and other transportation, certainother costs that are directly associated with onboard and other revenues and credit and debit cardfees. Substantially all of our remaining cruise costs are largely fixed, except for the impact of changing pricesand food expenses, once our ship capacity levels have been determined.
Net passenger ticket revenues reflect gross passenger ticket revenues, net of commissions, transportation andother costs. Net onboard and other revenues reflect gross onboard and other revenues, net of onboard and othercruise costs. Net passenger ticket revenue yields and net onboard and other revenue yields are computed bydividing net passenger ticket revenues and net onboard and other revenues by ALBDs.
Net cruise costs per ALBD and net cruise costs excluding fuel per ALBD are the most significant measures weuse to monitor our ability to control our cruise segments’ costs rather than gross cruise costs per ALBD. Weexclude the same variable costs that are included in the calculation of net cruise revenues to calculate net cruisecosts with and without fuel to avoid duplicating these variable costs in our non-GAAP financial measures. Inaddition, we exclude gains and losses on ship sales and ship impairments, net and restructuring expenses fromour calculation of net cruise costs with and without fuel as they are not considered part of our core operatingbusiness and, therefore, are not an indication of our future earnings performance. As such, we also believe it ismore meaningful for gains and losses on ship sales and ship impairments, net and restructuring expenses to beexcluded from our net income and earnings per share and, accordingly, we present non-GAAP net income andnon-GAAP earnings per share excluding these items.
In addition, because our EAA cruise brands utilize the euro, sterling and Australian dollar to measure their resultsand financial condition, the translation of those operations to our U.S. dollar reporting currency results indecreases in reported U.S. dollar revenues and expenses if the U.S. dollar strengthens against these foreigncurrencies and increases in reported U.S. dollar revenues and expenses if the U.S. dollar weakens against theseforeign currencies. Accordingly, we also monitor and report these non-GAAP financial measures assuming the2014 and 2013 periods’ currency exchange rates have remained constant with the 2013 and 2012 periods’ rates,respectively, or on a “constant dollar basis,” in order to remove the impact of changes in exchange rates on thetranslation of our EAA brands. We believe that this is a useful measure since it facilitates a comparative view ofthe changes in our business in a fluctuating currency exchange rate environment.
Although our constant dollar basis measure removes the foreign currency translational impact as discussedabove, it does not remove the foreign currency transactional impact from changes in exchange rates on ourbrands’ revenues and expenses that are denominated in a currency other than their functional currency.Historically, the foreign currency transactional impact has not been significant when measuring the periodicchanges in our results of operations. However, given the continuing expansion of our global business and theheightened volatility in foreign currency exchange rates, we believe the foreign currency transactional impactwill be more significant in measuring our 2015 results compared to 2014 than in previous years. See“Quantitative and Qualitative Disclosures About Market Risk” for a further discussion of the 2015 impact offoreign currency exchange rate changes.
We believe that the goodwill, trademark and other impairment charges and restructuring expenses recognized in2014, 2013 and 2012 are special charges and, therefore, are also not an indication of our future earningsperformance. As such, we believe it is more meaningful for these impairment charges and restructuring expensesto be excluded from our net income and earnings per share and, accordingly, we present non-GAAP net incomeand non-GAAP earnings per share excluding these charges.
49
Ann
ex1
DL
CA
nnua
lRep
ort
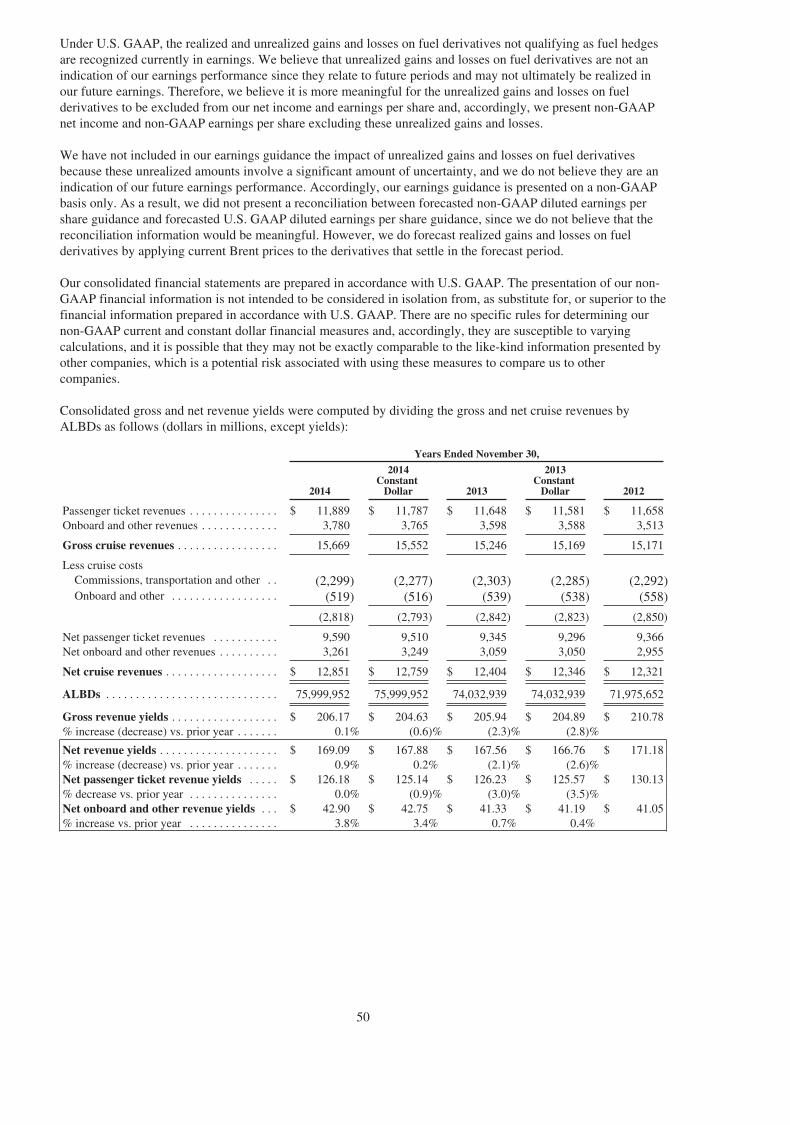
Under U.S. GAAP, the realized and unrealized gains and losses on fuel derivatives not qualifying as fuel hedgesare recognized currently in earnings. We believe that unrealized gains and losses on fuel derivatives are not anindication of our earnings performance since they relate to future periods and may not ultimately be realized inour future earnings. Therefore, we believe it is more meaningful for the unrealized gains and losses on fuelderivatives to be excluded from our net income and earnings per share and, accordingly, we present non-GAAPnet income and non-GAAP earnings per share excluding these unrealized gains and losses.
We have not included in our earnings guidance the impact of unrealized gains and losses on fuel derivativesbecause these unrealized amounts involve a significant amount of uncertainty, and we do not believe they are anindication of our future earnings performance. Accordingly, our earnings guidance is presented on a non-GAAPbasis only. As a result, we did not present a reconciliation between forecasted non-GAAP diluted earnings pershare guidance and forecasted U.S. GAAP diluted earnings per share guidance, since we do not believe that thereconciliation information would be meaningful. However, we do forecast realized gains and losses on fuelderivatives by applying current Brent prices to the derivatives that settle in the forecast period.
Our consolidated financial statements are prepared in accordance with U.S. GAAP. The presentation of our non-GAAP financial information is not intended to be considered in isolation from, as substitute for, or superior to thefinancial information prepared in accordance with U.S. GAAP. There are no specific rules for determining ournon-GAAP current and constant dollar financial measures and, accordingly, they are susceptible to varyingcalculations, and it is possible that they may not be exactly comparable to the like-kind information presented byother companies, which is a potential risk associated with using these measures to compare us to othercompanies.
Consolidated gross and net revenue yields were computed by dividing the gross and net cruise revenues byALBDs as follows (dollars in millions, except yields):
Years Ended November 30,
2014
2014Constant
Dollar 2013
2013Constant
Dollar 2012
Passenger ticket revenues . . . . . . . . . . . . . . . $ 11,889 $ 11,787 $ 11,648 $ 11,581 $ 11,658Onboard and other revenues . . . . . . . . . . . . . 3,780 3,765 3,598 3,588 3,513
Gross cruise revenues . . . . . . . . . . . . . . . . . 15,669 15,552 15,246 15,169 15,171
Less cruise costsCommissions, transportation and other . . (2,299) (2,277) (2,303) (2,285) (2,292)Onboard and other . . . . . . . . . . . . . . . . . . (519) (516) (539) (538) (558)
(2,818) (2,793) (2,842) (2,823) (2,850)
Net passenger ticket revenues . . . . . . . . . . . 9,590 9,510 9,345 9,296 9,366Net onboard and other revenues . . . . . . . . . . 3,261 3,249 3,059 3,050 2,955
Net cruise revenues . . . . . . . . . . . . . . . . . . . $ 12,851 $ 12,759 $ 12,404 $ 12,346 $ 12,321
ALBDs . . . . . . . . . . . . . . . . . . . . . . . . . . . . . 75,999,952 75,999,952 74,032,939 74,032,939 71,975,652
Gross revenue yields . . . . . . . . . . . . . . . . . . $ 206.17 $ 204.63 $ 205.94 $ 204.89 $ 210.78% increase (decrease) vs. prior year . . . . . . . 0.1% (0.6)% (2.3)% (2.8)%
Net revenue yields . . . . . . . . . . . . . . . . . . . . $ 169.09 $ 167.88 $ 167.56 $ 166.76 $ 171.18% increase (decrease) vs. prior year . . . . . . . 0.9% 0.2% (2.1)% (2.6)%Net passenger ticket revenue yields . . . . . $ 126.18 $ 125.14 $ 126.23 $ 125.57 $ 130.13% decrease vs. prior year . . . . . . . . . . . . . . . 0.0% (0.9)% (3.0)% (3.5)%Net onboard and other revenue yields . . . $ 42.90 $ 42.75 $ 41.33 $ 41.19 $ 41.05% increase vs. prior year . . . . . . . . . . . . . . . 3.8% 3.4% 0.7% 0.4%
50

Consolidated gross and net cruise costs and net cruise costs excluding fuel per ALBD were computed by dividingthe gross and net cruise costs and net cruise costs excluding fuel by ALBDs as follows (dollars in millions,except costs per ALBD):
Years Ended November 30,
2014
2014Constant
Dollar 2013
2013Constant
Dollar 2012
Cruise operating expenses . . . . . . . . . . . . . . . .$ 10,243 $ 10,184 $ 10,481 $ 10,434 $ 10,166Cruise selling and administrative expenses . . . 2,046 2,035 1,871 1,864 1,713
Gross cruise costs . . . . . . . . . . . . . . . . . . . . . . 12,289 12,219 12,352 12,298 11,879Less cruise costs included above
Commissions, transportation and other . . . . (2,299) (2,277) (2,303) (2,285) (2,292)Onboard and other . . . . . . . . . . . . . . . . . . . . (519) (516) (539) (538) (558)Losses on ship sales and ship impairments,
net . . . . . . . . . . . . . . . . . . . . . . . . . . . . . . . (2) (5) (178) (167) (49)Restructuring expenses . . . . . . . . . . . . . . . . . (18) (18) - - -
Net cruise costs . . . . . . . . . . . . . . . . . . . . . . . . 9,451 9,403 9,332 9,308 8,980Less fuel . . . . . . . . . . . . . . . . . . . . . . . . . . . . . . (2,033) (2,033) (2,208) (2,208) (2,381)
Net cruise costs excluding fuel . . . . . . . . . . . .$ 7,418 $ 7,370 $ 7,124 $ 7,100 $ 6,599
ALBDs . . . . . . . . . . . . . . . . . . . . . . . . . . . . . . . 75,999,952 75,999,952 74,032,939 74,032,939 71,975,652
Gross cruise costs per ALBD . . . . . . . . . . . . .$ 161.69 $ 160.77 $ 166.83 $ 166.12 $ 165.04% (decrease) increase vs. prior year . . . . . . . . . (3.1)% (3.6)% 1.1% 0.6%
Net cruise costs per ALBD . . . . . . . . . . . . . . .$ 124.35 $ 123.70 $ 126.05 $ 125.74 $ 124.77% (decrease) increase vs. prior year . . . . . . . . . (1.3)% (1.9)% 1.0% 0.8%Net cruise costs excluding fuel per ALBD . .$ 97.60 $ 96.95 $ 96.23 $ 95.91 $ 91.69% increase vs. prior year . . . . . . . . . . . . . . . . . 1.4% 0.8% 4.9% 4.6%
Non-GAAP diluted earnings per share was computed as follows (in millions, except per share data):
Years Ended November 30,
2014 2013 2012
Net income – dilutedU.S. GAAP net income . . . . . . . . . . . . . . . . . . . . . . . . . . . . . . . . . . . . . . . $1,236 $1,078 $1,298Losses on ship sales and ship impairments, net . . . . . . . . . . . . . . . . . . . . . 2 (a) 163 (b) 49 (c)Goodwill, trademark and other impairment charges . . . . . . . . . . . . . . . . . - 27 (d) 173 (e)Restructuring expenses . . . . . . . . . . . . . . . . . . . . . . . . . . . . . . . . . . . . . . . 18 - -Unrealized losses (gains) on fuel derivatives, net . . . . . . . . . . . . . . . . . . . 268 (36) (6)
Non-GAAP net income . . . . . . . . . . . . . . . . . . . . . . . . . . . . . . . . . . . . . . $1,524 $1,232 $1,514
Weighted-average shares outstanding – diluted . . . . . . . . . . . . . . . . . . . . . 778 777 779
Earnings per share – dilutedU.S. GAAP earnings per share . . . . . . . . . . . . . . . . . . . . . . . . . . . . . . . . . $ 1.59 $ 1.39 $ 1.67Losses on ship sales and ship impairments, net . . . . . . . . . . . . . . . . . . . . . . - (a) 0.21 (b) 0.06 (c)Goodwill, trademark and other impairment charges . . . . . . . . . . . . . . . . . . - 0.03 (d) 0.22 (e)Restructuring expenses . . . . . . . . . . . . . . . . . . . . . . . . . . . . . . . . . . . . . . . . 0.02 - -Unrealized losses (gains) on fuel derivatives, net . . . . . . . . . . . . . . . . . . . . 0.35 (0.05) (0.01)
Non-GAAP earnings per share . . . . . . . . . . . . . . . . . . . . . . . . . . . . . . . . . $ 1.96 $ 1.58 $ 1.94
(See next page for footnotes.)
(a) Represents impairment charges of $22 million for Grand Celebration and $31 million for Grand Holiday,partially offset by gains of $37 million from the sale of Costa Voyager and $14 million from the sale ofOcean Princess.
(b) Substantially due to $176 million of impairment charges related to Costa Classica and Costa Voyager,partially offset by a $15 million gain in our Tour and Other segment from the sale of a former HollandAmerica Line ship, which was on charter to an unaffiliated entity.
51
Ann
ex1
DL
CA
nnua
lRep
ort

(c) Represents impairment charges of $34 million for Costa Allegra and $23 million for two Seabourn ships,partially offset by an $8 million gain on the sale of Pacific Sun.
(d) Represents impairment charges of $14 million for an investment and $13 million for Ibero’s remainingtrademarks’ carrying value.
(e) Represents impairment charges for Ibero’s goodwill and trademarks.
Net cruise revenues increased by $447 million, or 3.6%, to $12.9 billion in 2014 from $12.4 billion in 2013. Thisincrease was caused by our 2.7% capacity increase in ALBDs, which accounted for $330 million, the 2014 netcurrency impact, which accounted for $92 million, and a slight increase in constant dollar net revenue yields,which accounted for $24 million. The increase in net revenue yields on a constant dollar basis was caused by a3.4% increase in net onboard and other revenue yields, partially offset by a slight decrease in net passenger ticketrevenue yields. The 3.4% increase in net onboard and other revenue yields resulted from a 3.7% increase fromour North America brands and a 2.8% increase from our EAA brands, which included increases in primarily allthe net onboard revenue categories. The slight decrease in net passenger ticket revenue yields was driven by ourNorth America brands’ promotional pricing environment in the Caribbean resulting from the large increase incruise industry capacity, partially offset by improvements at our continental European brands. Gross cruiserevenues increased by $423 million, or 2.8%, to $15.7 billion in 2014 from $15.2 billion in 2013 for largely thesame reasons as discussed above.
Net cruise costs excluding fuel increased by $294 million, or 4.1%, to $7.4 billion in 2014 from $7.1 billion in2013. The increase was caused by our 2.7% capacity increase in ALBDs, which accounted for $190 million, aslight increase in constant dollar net cruise costs excluding fuel per ALBD, which accounted for $55 million, andthe 2014 net currency impact, which accounted for $49 million.
Fuel costs decreased by $175 million, or 7.9%, to $2.0 billion in 2014 from $2.2 billion in 2013. This was causedby lower fuel prices, which accounted for $126 million, and lower fuel consumption per ALBD, which accountedfor $107 million, partially offset by our 2.7% capacity increase in ALBDs, which accounted for $59 million.
Gross cruise costs decreased slightly by $63 million to $12.3 billion in 2014 from $12.4 billion in 2013 forprincipally the same reasons as discussed above.
2013 Compared to 2012
Revenues
Consolidated
Cruise passenger ticket revenues made up 75% of our 2013 total revenues. Cruise passenger ticket revenuesdecreased slightly by $10 million to $11.6 billion in 2013 from $11.7 billion in 2012.
This decrease was caused by:
– $358 million – decrease in cruise ticket pricing and– $42 million – decrease in occupancy.
These decreases were offset by:
– $333 million – 2.9% capacity increase in ALBDs and– $67 million – foreign currency translational impact from a weaker U.S. dollar against the euro, net of a
stronger U.S. dollar against the sterling and Australian dollar (“2013 net currency impact”).
The remaining 25% of 2013 total revenues were substantially all comprised of onboard and other cruiserevenues, which increased by $85 million, or 2.4%, to $3.6 billion in 2013 from $3.5 billion in 2012. Thisincrease was caused by our 2.9% capacity increase in ALBDs, which accounted for $100 million, partially offsetby lower other revenues, which accounted for $23 million. Onboard and other revenues included concessionrevenues of $1.1 billion in 2013, which were flat compared to 2012.
North America Brands
Cruise passenger ticket revenues made up 74% of our 2013 total revenues. Cruise passenger ticket revenuesdecreased slightly by $40 million to $6.8 billion in 2013 from $6.9 billion in 2012.
52

This decrease was caused by:
– $168 million – decrease in cruise ticket pricing and– $79 million – slight decrease in occupancy.
These decreases were partially offset by:
– $173 million – 2.5% capacity increase in ALBDs and– $37 million – increase in air transportation revenues from guests who purchased their tickets from us.
Our cruise ticket pricing decline was driven by promotional pricing at Carnival Cruise Line.
The remaining 26% of 2013 total revenues were comprised of onboard and other cruise revenues, whichincreased slightly by $27 million and remained at $2.4 billion in both 2013 and 2012. This increase was causedby our 2.5% capacity increase in ALBDs, which accounted for $60 million, partially offset by a slight decrease inoccupancy, which accounted for $27 million. Onboard and other revenues included concession revenues of $727million in both 2013 and 2012.
EAA Brands
Cruise passenger ticket revenues made up 81% of our 2013 total revenues. Cruise passenger ticket revenuesincreased slightly by $33 million and remained at $4.8 billion in both 2013 and 2012.
This increase was caused by:
– $163 million – 3.4% capacity increase in ALBDs;– $67 million – 2013 net currency impact and– $47 million – slight increase in occupancy.
These increases were partially offset by:
– $191 million – decrease in cruise ticket pricing and– $44 million – decrease in air transportation revenues from guests who purchased their tickets from us.
Our cruise ticket pricing decline, which was affected by the ongoing challenging economic environment inEurope, was caused by our European brands.
The remaining 19% of 2013 total revenues were comprised of onboard and other cruise revenues, whichincreased by $45 million, or 4.3% to $1.1 billion in 2013 from $1.0 billion in 2012. This increase was principallydue to our 3.4% capacity increase in ALBDs, which accounted for $36 million. Onboard and other revenuesincluded concession revenues of $370 million in 2013 and $356 million in 2012.
Costs and Expenses
Consolidated
Operating costs and expenses increased by $304 million, or 2.9%, to $10.6 billion in 2013 from $10.3 billion in2012.
This increase was caused by:
– $291 million – 2.9% capacity increase in ALBDs;– $176 million – impairment charges related to Costa Classica and Costa Voyager;– $56 million – additional costs and expenses related to the 2013 voyage disruptions, net of third-party
insurance recoverables of $20 million;– $46 million – 2013 net currency impact;– $46 million – higher dry-dock and other ship repair and maintenance expenses;– $34 million – nonrecurrence in 2013 of Costa’s insurance proceeds for a ship in excess of its net book value
(“Costa’s excess insurance proceeds”) and Cunard’s litigation settlement;– $20 million – higher insurance premiums;– $15 million – MNOPF special expense assessment and– $14 million – new market development initiative costs.
53
Ann
ex1
DL
CA
nnua
lRep
ort
These increases were partially offset by:
– $131 million – lower fuel consumption per ALBD;– $111 million – lower fuel prices;– $65 million – decreases in commissions, transportation and other related expenses driven by lower cruise
ticket pricing, partially offset by increases in air transportation costs related to guests who purchased theirtickets from us;
– $34 million – nonrecurrence in 2013 of the 2012 Costa Allegra ship impairment charge;– $29 million – nonrecurrence in 2013 of the January 2012 ship incident-related expenses and– $24 million – various other operating expenses, net.
Selling and administrative expenses increased by $159 million, or 9.2%, to $1.9 billion in 2013 from $1.7 billionin 2012.
Depreciation and amortization expenses increased by $61 million, or 4.0%, to $1.6 billion in 2013 from $1.5billion in 2012.
In 2013, a $13 million impairment charge was recorded for Ibero’s trademarks. In 2012, $173 million ofimpairment charges were recorded for Ibero’s goodwill and trademarks. See Note 10 – “Fair ValueMeasurements, Derivative Instruments and Hedging Activities” in the consolidated financial statements foradditional discussion of these impairment charges.
Our total costs and expenses as a percentage of revenues increased to 91% in 2013 from 89% in 2012.
North America Brands
Operating costs and expenses increased by $179 million, or 2.9%, to $6.3 billion in 2013 from $6.1 billion in2012.
This increase was caused by:
– $154 million – 2.5% capacity increase in ALBDs;– $63 million – higher dry-dock and other ship repair and maintenance expenses;– $56 million – additional costs and expenses related to the 2013 voyage disruptions, net of third-party
insurance recoverables of $20 million;– $23 million – increases in commissions, transportation and other related expenses driven by increases in air
transportation costs related to guests who purchased their tickets from us, partially offset by the impact oflower cruise ticket pricing;
– $14 million – new market development initiative costs and– $45 million – various other operating expenses, net.
These increases were partially offset by:
– $58 million – lower fuel consumption per ALBD;– $53 million – lower fuel prices;– $39 million – intersegment transaction, which was fully offset in our Cruise Support segment and– $26 million – slight decrease in occupancy.
Selling and administrative expenses increased by $99 million, or 10%, to $1.0 billion in 2013 from $949 millionin 2012. The increase was caused by higher advertising spend, which accounted for $57 million, new marketdevelopment initiative costs, which accounted for $26 million, and our 2.5% capacity increase in ALBDs, whichaccounted for $24 million.
Our total costs and expenses as a percentage of revenues increased to 90% in 2013 from 86% in 2012.
EAA Brands
Operating costs and expenses increased by $127 million, or 3.2%, $4.1 billion in 2013 from $4.0 billion in 2012.
This increase was caused by:
– $176 million – impairment charges related to Costa Classica and Costa Voyager;– $136 million – 3.4% capacity increase in ALBDs;
54

– $46 million – 2013 net currency impact;– $34 million – nonrecurrence in 2013 of Costa’s excess insurance proceeds and Cunard’s litigation
settlement and– $9 million – MNOPF special expense assessment.
These increases were partially offset by:
– $100 million – decreases in commissions, transportation and other related expenses driven by lower cruiseticket pricing and a decrease in air transportation costs related to guests who purchased their tickets from us;
– $72 million – lower fuel consumption per ALBD;– $58 million – lower fuel prices;– $34 million – nonrecurrence in 2013 of the 2012 Costa Allegra impairment charge and– $29 million – nonrecurrence in 2013 of the January 2012 ship incident-related expenses.
In 2013, a $13 million impairment charge was recorded for Ibero’s trademarks. In 2012, $173 million ofimpairment charges were recorded for Ibero’s goodwill and trademarks.
Our total costs and expenses as a percentage of revenues decreased to 92% in 2013 from 93% in 2012.
Operating Income
Our consolidated operating income decreased by $290 million, or 18%, to $1.4 billion in 2013 from $1.6 billionin 2012. Our North America brands’ operating income decreased by $321 million, or 25%, to $956 million in2013 from $1.3 billion in 2012, and our EAA brands’ operating income increased by $38 million, or 8.8%, to$471 million in 2013 from $433 million in 2012. These changes were primarily due to the reasons discussedabove.
Key Performance Non-GAAP Financial Indicators
Net cruise revenues increased slightly by $83 million to $12.4 billion in 2013 from $12.3 billion in 2012. Thiswas caused by our 2.9% capacity increase in ALBDs, which accounted for $352 million, and the 2013 netcurrency impact, which accounted for $58 million, partially offset by a 2.6% decrease in constant dollar netrevenue yields, which accounted for $327 million. The 2.6% decrease in net revenue yields on a constant dollarbasis was caused by a 3.5% decrease in net passenger ticket revenue yields, partially offset by a slight increase innet onboard and other revenue yields. The 3.5% decrease in net passenger ticket revenue yields was driven byour North America brands’ 3.8% net yield decrease, which was driven by promotional pricing at Carnival CruiseLine. In addition, our EAA brands’ net passenger ticket revenue yields decreased 2.8%, which was affected bythe ongoing challenging economic environment in Europe. Although Costa’s net passenger ticket revenue yieldsincreased, they were more than offset by decreases at our other European brands. Gross cruise revenues increasedslightly by $75 million and remained at $15.2 billion in both 2013 and 2012 for largely the same reasons asdiscussed above.
Net cruise costs excluding fuel increased by $525 million, or 8.0%, to $7.1 billion in 2013 from $6.6 billion in2012. The increase was caused by a 4.6% increase in constant dollar net cruise costs excluding fuel per ALBD,which accounted for $313 million, our 2.9% capacity increase in ALBDs, which accounted for $189 million, andthe 2013 net currency impact, which accounted for $23 million.
The 4.6% increase in constant dollar net cruise costs excluding fuel per ALBD was caused by:
– $56 million – additional costs and expenses related to the 2013 voyage disruptions, net of third-partyinsurance recoverables of $20 million;
– $46 million – higher dry-dock and other ship repair and maintenance expenses;– $44 million – higher advertising spend;– $40 million – new market development initiative costs;– $34 million – nonrecurrence in 2013 of Costa’s excess insurance proceeds and Cunard’s litigation
settlement;– $20 million – higher insurance premiums;– $15 million – MNOPF special expense assessment and– $87 million – various other operating expenses, net.
These increases were partially offset by:
– $29 million – nonrecurrence in 2013 of the January 2012 ship incident-related expenses.
55
Ann
ex1
DL
CA
nnua
lRep
ort

Fuel costs decreased by $173 million, or 7.3%, to $2.2 billion in 2013 from $2.4 billion in 2012. This was causedby a 5.3% decrease in fuel consumption per ALBD, which accounted for $131 million, and lower fuel prices,which accounted for $111 million, partially offset by our 2.9% capacity increase in ALBDs, which accounted for$68 million.
Gross cruise costs increased by $473 million, or 4.0% to $12.4 billion in 2013 from $11.9 billion in 2012 forprincipally the same reasons as discussed above.
Liquidity, Financial Condition and Capital Resources
Our primary financial goals are to profitably grow our cruise business and increase our return on invested capital,reaching double digit returns in the next three to four years, while maintaining a strong balance sheet. Our abilityto generate significant operating cash flows allows us to internally fund our capital investments. Our goal is toreturn excess free cash flows to our shareholders in the form of additional dividends and/or share buybacks. Inaddition, we are committed to maintaining our strong investment grade credit ratings, which are among thehighest in the leisure travel industry. Other objectives of our capital structure policy are to maintain a sufficientlevel of liquidity with our available cash and cash equivalents and committed financings for immediate andfuture liquidity needs, and a reasonable debt maturity profile that is spread out over a number of years.
Based on our historical results, projections and financial condition, we believe that our future operating cashflows and liquidity will be sufficient to fund all of our expected capital projects including shipbuildingcommitments, ship improvements, debt service requirements, working capital needs and other firm commitmentsover the next several years. We believe that our ability to generate significant operating cash flows and ourstrong balance sheet as evidenced by our investment grade credit ratings provide us with the ability in mostfinancial credit market environments to obtain debt financing, as needed. Our future operating cash flows and ourability to issue debt can be adversely impacted by numerous factors outside our control including, but not limitedto, those noted under “Cautionary Note Concerning Factors That May Affect Future Results.” If our long-termsenior unsecured credit ratings were to be downgraded or assigned a negative outlook, our access to and cost ofdebt financing may be negatively impacted.
At November 30, 2014, we had a working capital deficit of $5.4 billion. This deficit included $3.0 billion ofcurrent customer deposits, which represent the passenger revenues already collected for cruises departing overthe next twelve months and, accordingly, are substantially more like deferred revenue balances rather than actualcurrent cash liabilities. Our November 30, 2014 working capital deficit also included $1.7 billion of current debtobligations. We continue to generate significant cash from operations and have a strong balance sheet. Thisstrong balance sheet provides us with the ability to refinance our current debt obligations before, or as theybecome due, in most financial credit market environments. We also have our revolving credit facilities availableto provide long-term rollover financing should the need arise, or if we choose to do so. After excluding currentcustomer deposits and current debt obligations from our November 30, 2014 working capital deficit balance, ournon-GAAP adjusted working capital deficit was $661 million. Our business model, along with our strong balancesheet and unsecured revolving credit facilities, allows us to operate with a working capital deficit and still meetour operating, investing and financing needs. We believe we will continue to have working capital deficits for theforeseeable future.
At November 30, 2013, the U.S. dollar was $1.63 to sterling, $1.36 to the euro and $0.91 to the Australian dollar.Had these November 30, 2013 currency exchange rates been used to translate our November 30, 2014 non-U.S.dollar functional currency operations’ assets and liabilities instead of the November 30, 2014 U.S. dollarexchange rates of $1.56 to sterling, $1.25 to the euro and $0.85 to the Australian dollar, our total assets andliabilities would have been higher by $1.2 billion and $565 million, respectively.
Sources and Uses of Cash
Our business provided $3.4 billion of net cash from operations during 2014, an increase of $596 million, or 21%,compared to $2.8 billion in 2013. This increase was substantially due to more cash being provided from ouroperating results and an increase in customer deposits.
During 2014, our expenditures for capital projects were $2.6 billion, of which $1.5 billion was spent on ourongoing new shipbuilding program, substantially for Regal Princess and Costa Diadema. In addition to our newshipbuilding program, we had capital expenditures of $754 million for ship improvements and replacements and$305 million for information technology, buildings and improvements, and other assets. Furthermore, in 2014 wesold Costa Voyager and received $42 million in cash proceeds.
56
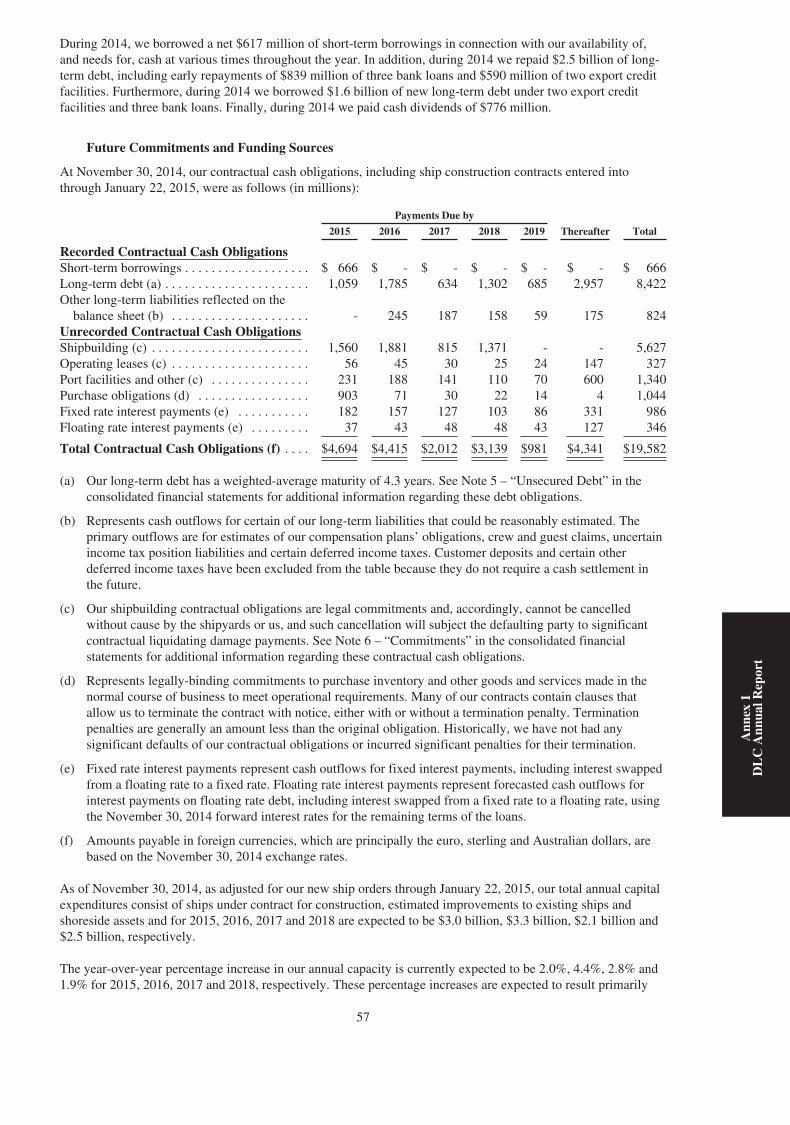
During 2014, we borrowed a net $617 million of short-term borrowings in connection with our availability of,and needs for, cash at various times throughout the year. In addition, during 2014 we repaid $2.5 billion of long-term debt, including early repayments of $839 million of three bank loans and $590 million of two export creditfacilities. Furthermore, during 2014 we borrowed $1.6 billion of new long-term debt under two export creditfacilities and three bank loans. Finally, during 2014 we paid cash dividends of $776 million.
Future Commitments and Funding Sources
At November 30, 2014, our contractual cash obligations, including ship construction contracts entered intothrough January 22, 2015, were as follows (in millions):
Payments Due by
2015 2016 2017 2018 2019 Thereafter Total
Recorded Contractual Cash ObligationsShort-term borrowings . . . . . . . . . . . . . . . . . . . $ 666 $ - $ - $ - $ - $ - $ 666Long-term debt (a) . . . . . . . . . . . . . . . . . . . . . . 1,059 1,785 634 1,302 685 2,957 8,422Other long-term liabilities reflected on the
balance sheet (b) . . . . . . . . . . . . . . . . . . . . . - 245 187 158 59 175 824Unrecorded Contractual Cash ObligationsShipbuilding (c) . . . . . . . . . . . . . . . . . . . . . . . . 1,560 1,881 815 1,371 - - 5,627Operating leases (c) . . . . . . . . . . . . . . . . . . . . . 56 45 30 25 24 147 327Port facilities and other (c) . . . . . . . . . . . . . . . 231 188 141 110 70 600 1,340Purchase obligations (d) . . . . . . . . . . . . . . . . . 903 71 30 22 14 4 1,044Fixed rate interest payments (e) . . . . . . . . . . . 182 157 127 103 86 331 986Floating rate interest payments (e) . . . . . . . . . 37 43 48 48 43 127 346
Total Contractual Cash Obligations (f) . . . . $4,694 $4,415 $2,012 $3,139 $981 $4,341 $19,582
(a) Our long-term debt has a weighted-average maturity of 4.3 years. See Note 5 – “Unsecured Debt” in theconsolidated financial statements for additional information regarding these debt obligations.
(b) Represents cash outflows for certain of our long-term liabilities that could be reasonably estimated. Theprimary outflows are for estimates of our compensation plans’ obligations, crew and guest claims, uncertainincome tax position liabilities and certain deferred income taxes. Customer deposits and certain otherdeferred income taxes have been excluded from the table because they do not require a cash settlement inthe future.
(c) Our shipbuilding contractual obligations are legal commitments and, accordingly, cannot be cancelledwithout cause by the shipyards or us, and such cancellation will subject the defaulting party to significantcontractual liquidating damage payments. See Note 6 – “Commitments” in the consolidated financialstatements for additional information regarding these contractual cash obligations.
(d) Represents legally-binding commitments to purchase inventory and other goods and services made in thenormal course of business to meet operational requirements. Many of our contracts contain clauses thatallow us to terminate the contract with notice, either with or without a termination penalty. Terminationpenalties are generally an amount less than the original obligation. Historically, we have not had anysignificant defaults of our contractual obligations or incurred significant penalties for their termination.
(e) Fixed rate interest payments represent cash outflows for fixed interest payments, including interest swappedfrom a floating rate to a fixed rate. Floating rate interest payments represent forecasted cash outflows forinterest payments on floating rate debt, including interest swapped from a fixed rate to a floating rate, usingthe November 30, 2014 forward interest rates for the remaining terms of the loans.
(f) Amounts payable in foreign currencies, which are principally the euro, sterling and Australian dollars, arebased on the November 30, 2014 exchange rates.
As of November 30, 2014, as adjusted for our new ship orders through January 22, 2015, our total annual capitalexpenditures consist of ships under contract for construction, estimated improvements to existing ships andshoreside assets and for 2015, 2016, 2017 and 2018 are expected to be $3.0 billion, $3.3 billion, $2.1 billion and$2.5 billion, respectively.
The year-over-year percentage increase in our annual capacity is currently expected to be 2.0%, 4.4%, 2.8% and1.9% for 2015, 2016, 2017 and 2018, respectively. These percentage increases are expected to result primarily
57
Ann
ex1
DL
CA
nnua
lRep
ort
from contracted new ships entering service, partially offset by Costa Celebration, Grand Holiday and SeabournPride having left the fleet through January 22, 2015, and Seabourn Legend, Seabourn Spirit and Ocean Princessleaving the fleet by April 2015, May 2015 and March 2016, respectively.
Our Boards of Directors have authorized, subject to certain restrictions, the repurchase of up to an aggregate of$1 billion of Carnival Corporation common stock and/or Carnival plc ordinary shares under the RepurchaseProgram. Since March 2013, the remaining availability under the Repurchase Program was $975 million. SeeNote 9 – “Shareholders’ Equity” in the consolidated financial statements for a further discussion of theRepurchase Program.
In addition to the Repurchase Program, the Boards of Directors authorized, in October 2008, the repurchase of upto 19.2 million Carnival plc ordinary shares and, in January 2013, the repurchase of up to 32.8 million shares ofCarnival Corporation common stock under the Stock Swap programs. Depending on market conditions and otherfactors, we may repurchase shares of Carnival Corporation common stock and/or Carnival plc ordinary sharesunder the Repurchase Program and the Stock Swap programs concurrently. We use the Stock Swap programs insituations where we can obtain an economic benefit because either Carnival Corporation common stock orCarnival plc ordinary shares are trading at a price that is at a premium or discount to the price of Carnival plcordinary shares or Carnival Corporation common stock, as the case may be. Any realized economic benefit underthe Stock Swap programs is used for general corporate purposes, which could include repurchasing additionalstock under the Repurchase Program. Carnival plc ordinary share repurchases under both the RepurchaseProgram and the Stock Swap programs require annual shareholder approval. The existing shareholder approval islimited to a maximum of 21.5 million ordinary shares and is valid until the earlier of the conclusion of theCarnival plc 2015 annual general meeting or October 16, 2015. Finally, under the Stock Swap programs, anysales of the Carnival Corporation common stock and Carnival plc ordinary shares have been or will be registeredunder the Securities Act of 1933.
At January 22, 2015, the remaining availability under the Stock Swap programs was 18.1 million Carnival plcordinary shares and 32.0 million shares of Carnival Corporation common stock. See Note 9 – “Shareholders’Equity” in the consolidated financial statements for a further discussion of the Stock Swap programs.
At November 30, 2014, we had liquidity of $4.9 billion. Our liquidity consisted of $92 million of cash and cashequivalents, which excludes $239 million of cash used for current operations, $2.3 billion available forborrowing under our revolving credit facilities, net of our commercial paper borrowings, and $2.5 billion underour committed future financings, which are comprised of ship export credit facilities. Of this $2.5 billion, $0.9billion and $1.6 billion are scheduled to be funded in 2015 and 2016, respectively. At November 30, 2014,substantially all of our revolving credit facilities are scheduled to mature in 2019, except for $300 million thatmatures in 2020. These commitments are from numerous large and well-established banks and export creditagencies, which we believe will honor their contractual agreements with us.
Substantially all of our debt agreements contain financial covenants as described in Note 5 – “Unsecured Debt”in the consolidated financial statements. At November 30, 2014, we believe we were in compliance with our debtcovenants. In addition, based on, among other things, our forecasted operating results, financial condition andcash flows, we expect to be in compliance with our debt covenants for the foreseeable future. Generally, if anevent of default under any debt agreement occurs, then pursuant to cross default acceleration clauses,substantially all of our outstanding debt and derivative contract payables could become due, and all debt andderivative contracts could be terminated.
Off-Balance Sheet Arrangements
We are not a party to any off-balance sheet arrangements, including guarantee contracts, retained or contingentinterests, certain derivative instruments and variable interest entities that either have, or are reasonably likely tohave, a current or future material effect on our consolidated financial statements.
Quantitative and Qualitative Disclosures About Market Risk
For a discussion of our hedging strategies and market risks, see the discussion below and Note 10 – “Fair ValueMeasurements, Derivative Instruments and Hedging Activities” in the consolidated financial statements.
58
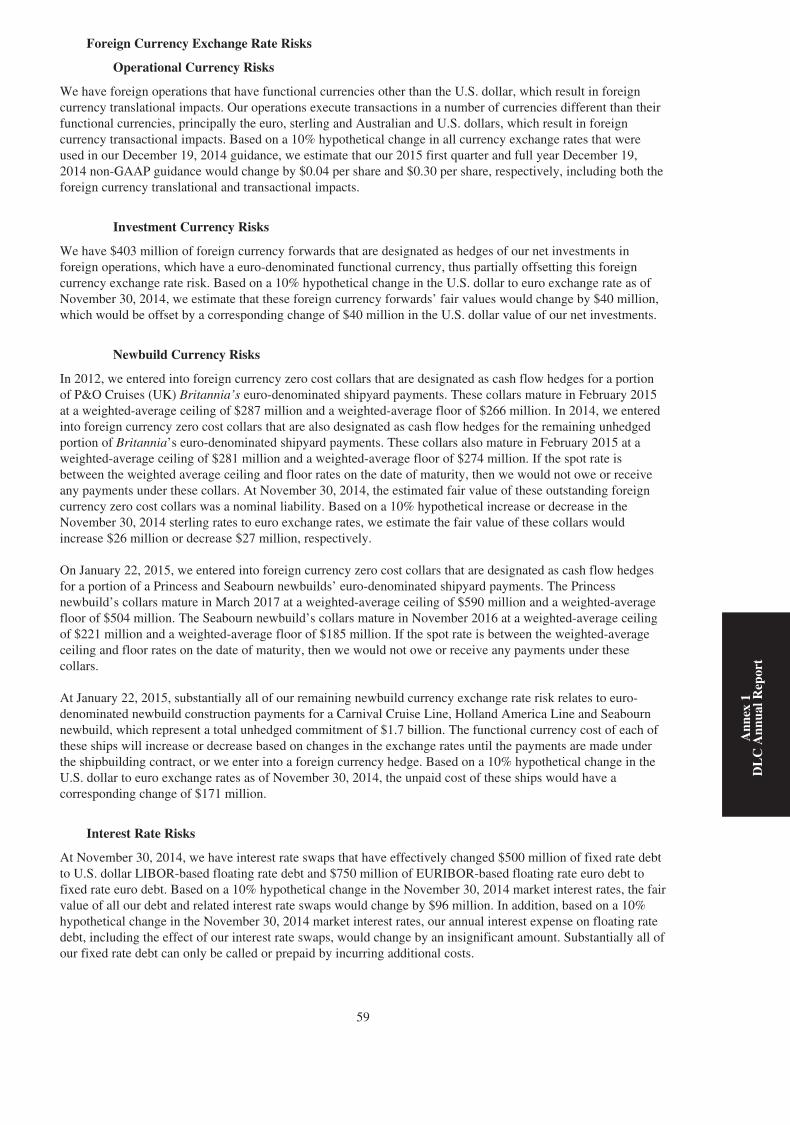
Foreign Currency Exchange Rate Risks
Operational Currency Risks
We have foreign operations that have functional currencies other than the U.S. dollar, which result in foreigncurrency translational impacts. Our operations execute transactions in a number of currencies different than theirfunctional currencies, principally the euro, sterling and Australian and U.S. dollars, which result in foreigncurrency transactional impacts. Based on a 10% hypothetical change in all currency exchange rates that wereused in our December 19, 2014 guidance, we estimate that our 2015 first quarter and full year December 19,2014 non-GAAP guidance would change by $0.04 per share and $0.30 per share, respectively, including both theforeign currency translational and transactional impacts.
Investment Currency Risks
We have $403 million of foreign currency forwards that are designated as hedges of our net investments inforeign operations, which have a euro-denominated functional currency, thus partially offsetting this foreigncurrency exchange rate risk. Based on a 10% hypothetical change in the U.S. dollar to euro exchange rate as ofNovember 30, 2014, we estimate that these foreign currency forwards’ fair values would change by $40 million,which would be offset by a corresponding change of $40 million in the U.S. dollar value of our net investments.
Newbuild Currency Risks
In 2012, we entered into foreign currency zero cost collars that are designated as cash flow hedges for a portionof P&O Cruises (UK) Britannia’s euro-denominated shipyard payments. These collars mature in February 2015at a weighted-average ceiling of $287 million and a weighted-average floor of $266 million. In 2014, we enteredinto foreign currency zero cost collars that are also designated as cash flow hedges for the remaining unhedgedportion of Britannia’s euro-denominated shipyard payments. These collars also mature in February 2015 at aweighted-average ceiling of $281 million and a weighted-average floor of $274 million. If the spot rate isbetween the weighted average ceiling and floor rates on the date of maturity, then we would not owe or receiveany payments under these collars. At November 30, 2014, the estimated fair value of these outstanding foreigncurrency zero cost collars was a nominal liability. Based on a 10% hypothetical increase or decrease in theNovember 30, 2014 sterling rates to euro exchange rates, we estimate the fair value of these collars wouldincrease $26 million or decrease $27 million, respectively.
On January 22, 2015, we entered into foreign currency zero cost collars that are designated as cash flow hedgesfor a portion of a Princess and Seabourn newbuilds’ euro-denominated shipyard payments. The Princessnewbuild’s collars mature in March 2017 at a weighted-average ceiling of $590 million and a weighted-averagefloor of $504 million. The Seabourn newbuild’s collars mature in November 2016 at a weighted-average ceilingof $221 million and a weighted-average floor of $185 million. If the spot rate is between the weighted-averageceiling and floor rates on the date of maturity, then we would not owe or receive any payments under thesecollars.
At January 22, 2015, substantially all of our remaining newbuild currency exchange rate risk relates to euro-denominated newbuild construction payments for a Carnival Cruise Line, Holland America Line and Seabournnewbuild, which represent a total unhedged commitment of $1.7 billion. The functional currency cost of each ofthese ships will increase or decrease based on changes in the exchange rates until the payments are made underthe shipbuilding contract, or we enter into a foreign currency hedge. Based on a 10% hypothetical change in theU.S. dollar to euro exchange rates as of November 30, 2014, the unpaid cost of these ships would have acorresponding change of $171 million.
Interest Rate Risks
At November 30, 2014, we have interest rate swaps that have effectively changed $500 million of fixed rate debtto U.S. dollar LIBOR-based floating rate debt and $750 million of EURIBOR-based floating rate euro debt tofixed rate euro debt. Based on a 10% hypothetical change in the November 30, 2014 market interest rates, the fairvalue of all our debt and related interest rate swaps would change by $96 million. In addition, based on a 10%hypothetical change in the November 30, 2014 market interest rates, our annual interest expense on floating ratedebt, including the effect of our interest rate swaps, would change by an insignificant amount. Substantially all ofour fixed rate debt can only be called or prepaid by incurring additional costs.
59
Ann
ex1
DL
CA
nnua
lRep
ort

Fuel Price Risks
Our exposure to market risk for changes in fuel prices substantially all relates to the consumption of fuel on ourships. We expect to consume approximately 3.2 million metric tons of fuel in 2015. Based on a 10% hypotheticalchange in our December 19, 2014 guidances’ forecasted average fuel price, we estimate that our 2015 fuelexpense, excluding the effect of zero cost collar fuel derivatives, would change by $139 million.
We mitigate a portion of our economic risk attributable to potential fuel price increases through the use of Brentzero cost collars. The actual fuel we use on our ships is marine fuel. See Note 10 – “Fair Value Measurements,Derivative Instruments and Hedging Activities” in the consolidated financial statements for additional discussionof our fuel derivatives.
At November 30, 2014, our fuel derivatives cover a portion of our estimated fuel consumption through 2018. AtNovember 30, 2014, the estimated fair value of our outstanding fuel derivative contracts was a net liability of$229 million. Based on a 10% hypothetical increase or decrease in the November 30, 2014 Brent forward pricecurve, we estimate the fair value of our fuel derivatives would increase $127 million or decrease $152 million,respectively.
60

SELECTED FINANCIAL DATA
The selected consolidated financial data presented below for 2010 through 2014 and as of the end of each suchyear, except for the statistical data, are derived from our audited consolidated financial statements and should beread in conjunction with those consolidated financial statements and the related notes.
Years Ended November 30,
2014 2013 2012 2011 2010
(dollars in millions, except per share, per ton and currency data)
Statements of Income DataRevenues . . . . . . . . . . . . . . . . . . . . . . . . . . . . . . . . . . . . $15,884 $15,456 $15,382 $15,793 $14,469Operating income . . . . . . . . . . . . . . . . . . . . . . . . . . . . . $ 1,792 $ 1,352 $ 1,642 $ 2,255 $ 2,347Net income (a) . . . . . . . . . . . . . . . . . . . . . . . . . . . . . . . $ 1,236 $ 1,078 $ 1,298 $ 1,912 $ 1,978Earnings per share
Basic . . . . . . . . . . . . . . . . . . . . . . . . . . . . . . . . . . . . . $ 1.59 $ 1.39 $ 1.67 $ 2.43 $ 2.51Diluted . . . . . . . . . . . . . . . . . . . . . . . . . . . . . . . . . . . $ 1.59 $ 1.39 $ 1.67 $ 2.42 $ 2.47
Non-GAAP net income (a) . . . . . . . . . . . . . . . . . . . . . . $ 1,524 $ 1,232 $ 1,514 $ 1,939 $ 1,934Non-GAAP earnings per share – diluted (a) . . . . . . . . $ 1.96 $ 1.58 $ 1.94 $ 2.46 $ 2.42Dividends declared per share . . . . . . . . . . . . . . . . . . . . $ 1.00 $ 1.00 $ 1.50(b) $ 1.00 $ 0.40Statements of Cash Flow DataCash provided by operating activities . . . . . . . . . . . . . $ 3,430 $ 2,834 $ 2,999 $ 3,766 $ 3,818Cash used in investing activities . . . . . . . . . . . . . . . . . . $ 2,507 $ 2,056 $ 1,772(c) $ 2,646 $ 3,501Capital expenditures . . . . . . . . . . . . . . . . . . . . . . . . . . . $ 2,583 $ 2,149 $ 2,332 $ 2,696 $ 3,579Cash used in financing activities . . . . . . . . . . . . . . . . . $ 1,028 $ 780 $ 1,190 $ 1,093 $ 404Dividends paid . . . . . . . . . . . . . . . . . . . . . . . . . . . . . . . $ 776 $ 1,164 $ 779 $ 671 $ 237
Statistical DataALBDs (in thousands) . . . . . . . . . . . . . . . . . . . . . . . . . 76,000 74,033 71,976 69,971 66,545Occupancy percentage . . . . . . . . . . . . . . . . . . . . . . . . . 104.1% 105.1% 105.5% 106.2% 105.6%Passengers carried (in thousands) . . . . . . . . . . . . . . . . . 10,566 10,061 9,829 9,559 9,147Fuel consumption in metric tons (in thousands) . . . . . . 3,194 3,266 3,354 3,395 3,319Fuel consumption in metric tons per ALBD . . . . . . . . 0.042 0.044 0.047 0.049 0.050Fuel cost per metric ton consumed . . . . . . . . . . . . . . . . $ 636 $ 676 $ 710 $ 646 $ 489Currencies
U.S. dollar to €1 . . . . . . . . . . . . . . . . . . . . . . . . . . . . $ 1.34 $ 1.32 $ 1.28 $ 1.40 $ 1.33U.S. dollar to £1 . . . . . . . . . . . . . . . . . . . . . . . . . . . . $ 1.66 $ 1.56 $ 1.58 $ 1.60 $ 1.55U.S. dollar to Australian dollar . . . . . . . . . . . . . . . . . $ 0.91 $ 0.98 $ 1.03 $ 1.03 $ 0.91
As of November 30,
2014 2013 2012 2011 2010
(dollars in millions)
Balance Sheet and Other DataTotal assets . . . . . . . . . . . . . . . . . . . . . . . . . . . . . . . . . . $39,532 $40,104 $39,161 $38,637 $37,490Total debt . . . . . . . . . . . . . . . . . . . . . . . . . . . . . . . . . . . $ 9,088 $ 9,560 $ 8,902 $ 9,353 $ 9,364Total shareholders’ equity . . . . . . . . . . . . . . . . . . . . . . $24,288 $24,556 $23,929 $23,832 $23,031Total debt to capital (d) . . . . . . . . . . . . . . . . . . . . . . . . 27.2% 28.0% 27.1% 28.2% 28.9%
(See next page for footnotes.)
61
Ann
ex1
DL
CA
nnua
lRep
ort
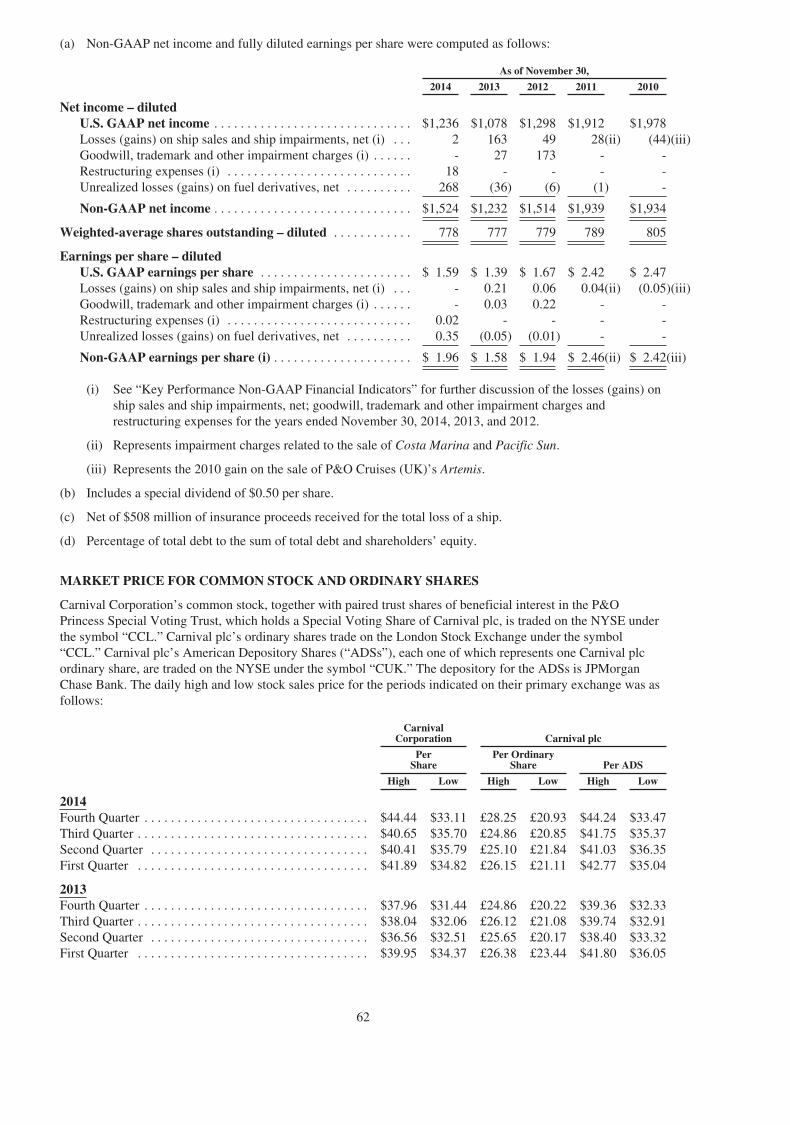
(a) Non-GAAP net income and fully diluted earnings per share were computed as follows:
As of November 30,
2014 2013 2012 2011 2010
Net income – dilutedU.S. GAAP net income . . . . . . . . . . . . . . . . . . . . . . . . . . . . . . $1,236 $1,078 $1,298 $1,912 $1,978Losses (gains) on ship sales and ship impairments, net (i) . . . 2 163 49 28(ii) (44)(iii)Goodwill, trademark and other impairment charges (i) . . . . . . - 27 173 - -Restructuring expenses (i) . . . . . . . . . . . . . . . . . . . . . . . . . . . . 18 - - - -Unrealized losses (gains) on fuel derivatives, net . . . . . . . . . . 268 (36) (6) (1) -
Non-GAAP net income . . . . . . . . . . . . . . . . . . . . . . . . . . . . . . $1,524 $1,232 $1,514 $1,939 $1,934
Weighted-average shares outstanding – diluted . . . . . . . . . . . . 778 777 779 789 805
Earnings per share – dilutedU.S. GAAP earnings per share . . . . . . . . . . . . . . . . . . . . . . . $ 1.59 $ 1.39 $ 1.67 $ 2.42 $ 2.47Losses (gains) on ship sales and ship impairments, net (i) . . . - 0.21 0.06 0.04(ii) (0.05)(iii)Goodwill, trademark and other impairment charges (i) . . . . . . - 0.03 0.22 - -Restructuring expenses (i) . . . . . . . . . . . . . . . . . . . . . . . . . . . . 0.02 - - - -Unrealized losses (gains) on fuel derivatives, net . . . . . . . . . . 0.35 (0.05) (0.01) - -
Non-GAAP earnings per share (i) . . . . . . . . . . . . . . . . . . . . . $ 1.96 $ 1.58 $ 1.94 $ 2.46(ii) $ 2.42(iii)
(i) See “Key Performance Non-GAAP Financial Indicators” for further discussion of the losses (gains) onship sales and ship impairments, net; goodwill, trademark and other impairment charges andrestructuring expenses for the years ended November 30, 2014, 2013, and 2012.
(ii) Represents impairment charges related to the sale of Costa Marina and Pacific Sun.
(iii) Represents the 2010 gain on the sale of P&O Cruises (UK)’s Artemis.
(b) Includes a special dividend of $0.50 per share.
(c) Net of $508 million of insurance proceeds received for the total loss of a ship.
(d) Percentage of total debt to the sum of total debt and shareholders’ equity.
MARKET PRICE FOR COMMON STOCK AND ORDINARY SHARES
Carnival Corporation’s common stock, together with paired trust shares of beneficial interest in the P&OPrincess Special Voting Trust, which holds a Special Voting Share of Carnival plc, is traded on the NYSE underthe symbol “CCL.” Carnival plc’s ordinary shares trade on the London Stock Exchange under the symbol“CCL.” Carnival plc’s American Depository Shares (“ADSs”), each one of which represents one Carnival plcordinary share, are traded on the NYSE under the symbol “CUK.” The depository for the ADSs is JPMorganChase Bank. The daily high and low stock sales price for the periods indicated on their primary exchange was asfollows:
CarnivalCorporation Carnival plc
PerShare
Per OrdinaryShare Per ADS
High Low High Low High Low
2014Fourth Quarter . . . . . . . . . . . . . . . . . . . . . . . . . . . . . . . . . . $44.44 $33.11 £28.25 £20.93 $44.24 $33.47Third Quarter . . . . . . . . . . . . . . . . . . . . . . . . . . . . . . . . . . . $40.65 $35.70 £24.86 £20.85 $41.75 $35.37Second Quarter . . . . . . . . . . . . . . . . . . . . . . . . . . . . . . . . . $40.41 $35.79 £25.10 £21.84 $41.03 $36.35First Quarter . . . . . . . . . . . . . . . . . . . . . . . . . . . . . . . . . . . $41.89 $34.82 £26.15 £21.11 $42.77 $35.04
2013Fourth Quarter . . . . . . . . . . . . . . . . . . . . . . . . . . . . . . . . . . $37.96 $31.44 £24.86 £20.22 $39.36 $32.33Third Quarter . . . . . . . . . . . . . . . . . . . . . . . . . . . . . . . . . . . $38.04 $32.06 £26.12 £21.08 $39.74 $32.91Second Quarter . . . . . . . . . . . . . . . . . . . . . . . . . . . . . . . . . $36.56 $32.51 £25.65 £20.17 $38.40 $33.32First Quarter . . . . . . . . . . . . . . . . . . . . . . . . . . . . . . . . . . . $39.95 $34.37 £26.38 £23.44 $41.80 $36.05
62
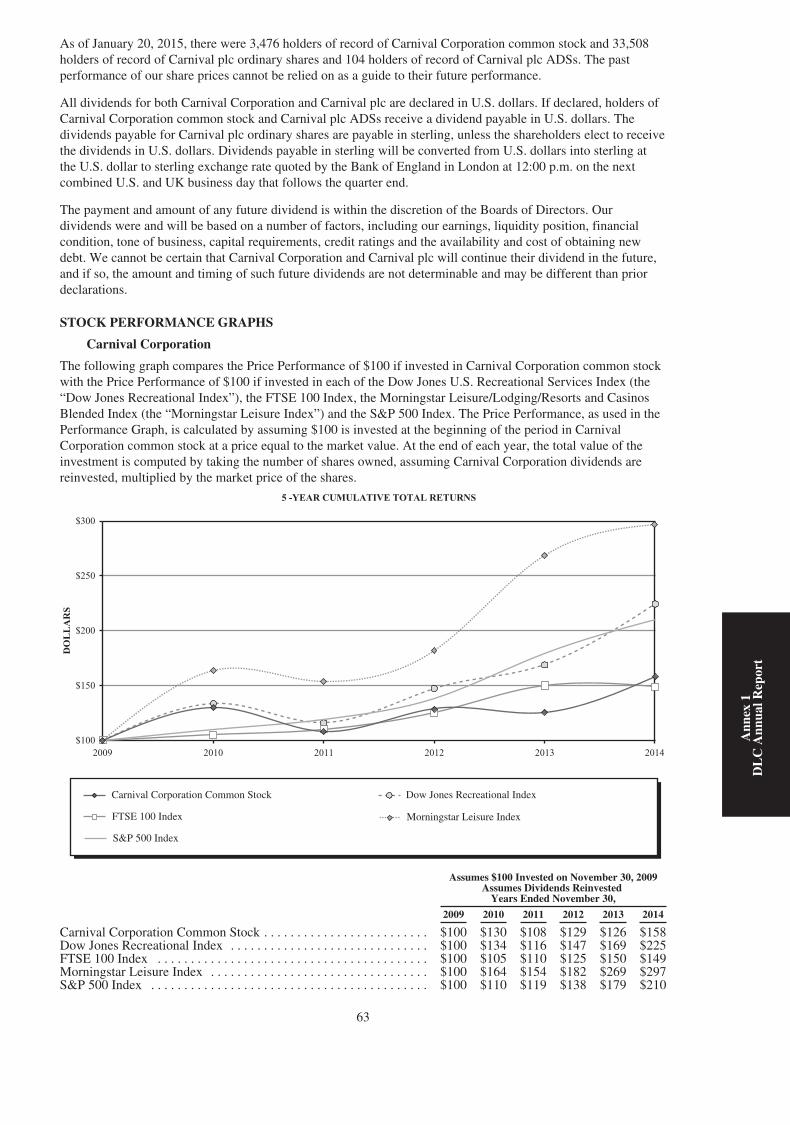
As of January 20, 2015, there were 3,476 holders of record of Carnival Corporation common stock and 33,508holders of record of Carnival plc ordinary shares and 104 holders of record of Carnival plc ADSs. The pastperformance of our share prices cannot be relied on as a guide to their future performance.
All dividends for both Carnival Corporation and Carnival plc are declared in U.S. dollars. If declared, holders ofCarnival Corporation common stock and Carnival plc ADSs receive a dividend payable in U.S. dollars. Thedividends payable for Carnival plc ordinary shares are payable in sterling, unless the shareholders elect to receivethe dividends in U.S. dollars. Dividends payable in sterling will be converted from U.S. dollars into sterling atthe U.S. dollar to sterling exchange rate quoted by the Bank of England in London at 12:00 p.m. on the nextcombined U.S. and UK business day that follows the quarter end.
The payment and amount of any future dividend is within the discretion of the Boards of Directors. Ourdividends were and will be based on a number of factors, including our earnings, liquidity position, financialcondition, tone of business, capital requirements, credit ratings and the availability and cost of obtaining newdebt. We cannot be certain that Carnival Corporation and Carnival plc will continue their dividend in the future,and if so, the amount and timing of such future dividends are not determinable and may be different than priordeclarations.
STOCK PERFORMANCE GRAPHS
Carnival Corporation
The following graph compares the Price Performance of $100 if invested in Carnival Corporation common stockwith the Price Performance of $100 if invested in each of the Dow Jones U.S. Recreational Services Index (the“Dow Jones Recreational Index”), the FTSE 100 Index, the Morningstar Leisure/Lodging/Resorts and CasinosBlended Index (the “Morningstar Leisure Index”) and the S&P 500 Index. The Price Performance, as used in thePerformance Graph, is calculated by assuming $100 is invested at the beginning of the period in CarnivalCorporation common stock at a price equal to the market value. At the end of each year, the total value of theinvestment is computed by taking the number of shares owned, assuming Carnival Corporation dividends arereinvested, multiplied by the market price of the shares.
Carnival Corporation Common Stock Dow Jones Recreational Index
S&P 500 Index
FTSE 100 Index Morningstar Leisure Index
5 -YEAR CUMULATIVE TOTAL RETURNS
DO
LL
AR
S
2009 2010 2011 2012 2013 2014$100
$150
$200
$250
$300
Assumes $100 Invested on November 30, 2009Assumes Dividends Reinvested
Years Ended November 30,
2009 2010 2011 2012 2013 2014
Carnival Corporation Common Stock . . . . . . . . . . . . . . . . . . . . . . . . . $100 $130 $108 $129 $126 $158Dow Jones Recreational Index . . . . . . . . . . . . . . . . . . . . . . . . . . . . . . $100 $134 $116 $147 $169 $225FTSE 100 Index . . . . . . . . . . . . . . . . . . . . . . . . . . . . . . . . . . . . . . . . . $100 $105 $110 $125 $150 $149Morningstar Leisure Index . . . . . . . . . . . . . . . . . . . . . . . . . . . . . . . . . $100 $164 $154 $182 $269 $297S&P 500 Index . . . . . . . . . . . . . . . . . . . . . . . . . . . . . . . . . . . . . . . . . . $100 $110 $119 $138 $179 $210
63
Ann
ex1
DL
CA
nnua
lRep
ort
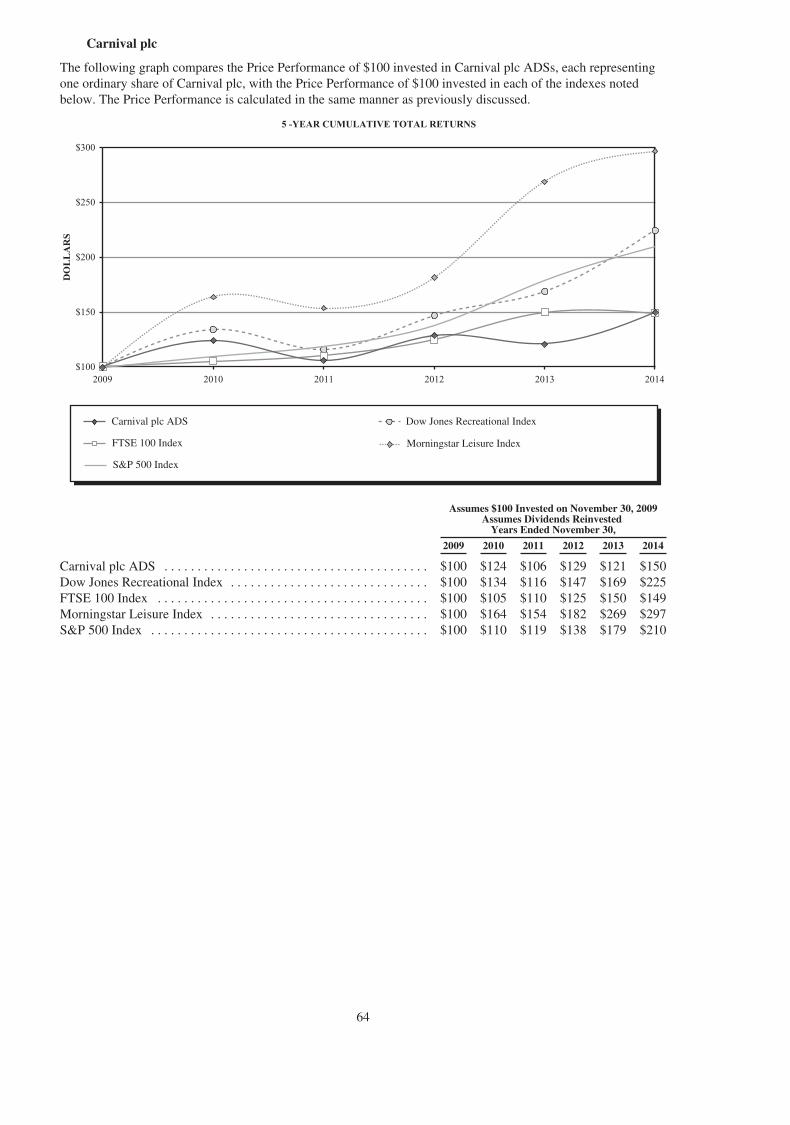
Carnival plc
The following graph compares the Price Performance of $100 invested in Carnival plc ADSs, each representingone ordinary share of Carnival plc, with the Price Performance of $100 invested in each of the indexes notedbelow. The Price Performance is calculated in the same manner as previously discussed.
Carnival plc ADS Dow Jones Recreational Index
S&P 500 Index
FTSE 100 Index Morningstar Leisure Index
5 -YEAR CUMULATIVE TOTAL RETURNS
DO
LL
AR
S
2009 2010 2011 2012 2013 2014$100
$150
$200
$250
$300
Assumes $100 Invested on November 30, 2009Assumes Dividends Reinvested
Years Ended November 30,
2009 2010 2011 2012 2013 2014
Carnival plc ADS . . . . . . . . . . . . . . . . . . . . . . . . . . . . . . . . . . . . . . . . $100 $124 $106 $129 $121 $150Dow Jones Recreational Index . . . . . . . . . . . . . . . . . . . . . . . . . . . . . . $100 $134 $116 $147 $169 $225FTSE 100 Index . . . . . . . . . . . . . . . . . . . . . . . . . . . . . . . . . . . . . . . . . $100 $105 $110 $125 $150 $149Morningstar Leisure Index . . . . . . . . . . . . . . . . . . . . . . . . . . . . . . . . . $100 $164 $154 $182 $269 $297S&P 500 Index . . . . . . . . . . . . . . . . . . . . . . . . . . . . . . . . . . . . . . . . . . $100 $110 $119 $138 $179 $210
64
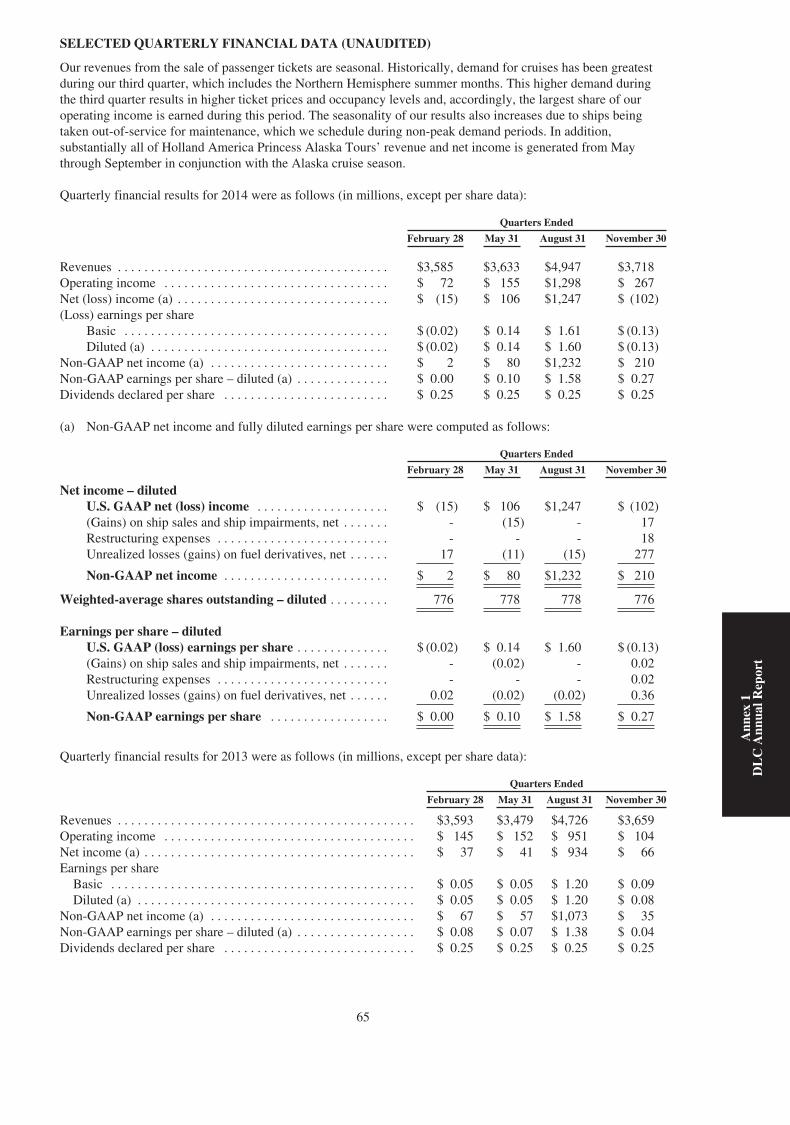
SELECTED QUARTERLY FINANCIAL DATA (UNAUDITED)
Our revenues from the sale of passenger tickets are seasonal. Historically, demand for cruises has been greatestduring our third quarter, which includes the Northern Hemisphere summer months. This higher demand duringthe third quarter results in higher ticket prices and occupancy levels and, accordingly, the largest share of ouroperating income is earned during this period. The seasonality of our results also increases due to ships beingtaken out-of-service for maintenance, which we schedule during non-peak demand periods. In addition,substantially all of Holland America Princess Alaska Tours’ revenue and net income is generated from Maythrough September in conjunction with the Alaska cruise season.
Quarterly financial results for 2014 were as follows (in millions, except per share data):
Quarters Ended
February 28 May 31 August 31 November 30
Revenues . . . . . . . . . . . . . . . . . . . . . . . . . . . . . . . . . . . . . . . . . $3,585 $3,633 $4,947 $3,718Operating income . . . . . . . . . . . . . . . . . . . . . . . . . . . . . . . . . . $ 72 $ 155 $1,298 $ 267Net (loss) income (a) . . . . . . . . . . . . . . . . . . . . . . . . . . . . . . . . $ (15) $ 106 $1,247 $ (102)(Loss) earnings per share
Basic . . . . . . . . . . . . . . . . . . . . . . . . . . . . . . . . . . . . . . . . $ (0.02) $ 0.14 $ 1.61 $ (0.13)Diluted (a) . . . . . . . . . . . . . . . . . . . . . . . . . . . . . . . . . . . . $ (0.02) $ 0.14 $ 1.60 $ (0.13)
Non-GAAP net income (a) . . . . . . . . . . . . . . . . . . . . . . . . . . . $ 2 $ 80 $1,232 $ 210Non-GAAP earnings per share – diluted (a) . . . . . . . . . . . . . . $ 0.00 $ 0.10 $ 1.58 $ 0.27Dividends declared per share . . . . . . . . . . . . . . . . . . . . . . . . . $ 0.25 $ 0.25 $ 0.25 $ 0.25
(a) Non-GAAP net income and fully diluted earnings per share were computed as follows:
Quarters Ended
February 28 May 31 August 31 November 30
Net income – dilutedU.S. GAAP net (loss) income . . . . . . . . . . . . . . . . . . . . $ (15) $ 106 $1,247 $ (102)(Gains) on ship sales and ship impairments, net . . . . . . . - (15) - 17Restructuring expenses . . . . . . . . . . . . . . . . . . . . . . . . . . - - - 18Unrealized losses (gains) on fuel derivatives, net . . . . . . 17 (11) (15) 277
Non-GAAP net income . . . . . . . . . . . . . . . . . . . . . . . . . $ 2 $ 80 $1,232 $ 210
Weighted-average shares outstanding – diluted . . . . . . . . . 776 778 778 776
Earnings per share – dilutedU.S. GAAP (loss) earnings per share . . . . . . . . . . . . . . $ (0.02) $ 0.14 $ 1.60 $ (0.13)(Gains) on ship sales and ship impairments, net . . . . . . . - (0.02) - 0.02Restructuring expenses . . . . . . . . . . . . . . . . . . . . . . . . . . - - - 0.02Unrealized losses (gains) on fuel derivatives, net . . . . . . 0.02 (0.02) (0.02) 0.36
Non-GAAP earnings per share . . . . . . . . . . . . . . . . . . $ 0.00 $ 0.10 $ 1.58 $ 0.27
Quarterly financial results for 2013 were as follows (in millions, except per share data):
Quarters Ended
February 28 May 31 August 31 November 30
Revenues . . . . . . . . . . . . . . . . . . . . . . . . . . . . . . . . . . . . . . . . . . . . . $3,593 $3,479 $4,726 $3,659Operating income . . . . . . . . . . . . . . . . . . . . . . . . . . . . . . . . . . . . . . $ 145 $ 152 $ 951 $ 104Net income (a) . . . . . . . . . . . . . . . . . . . . . . . . . . . . . . . . . . . . . . . . . $ 37 $ 41 $ 934 $ 66Earnings per share
Basic . . . . . . . . . . . . . . . . . . . . . . . . . . . . . . . . . . . . . . . . . . . . . . $ 0.05 $ 0.05 $ 1.20 $ 0.09Diluted (a) . . . . . . . . . . . . . . . . . . . . . . . . . . . . . . . . . . . . . . . . . . $ 0.05 $ 0.05 $ 1.20 $ 0.08
Non-GAAP net income (a) . . . . . . . . . . . . . . . . . . . . . . . . . . . . . . . $ 67 $ 57 $1,073 $ 35Non-GAAP earnings per share – diluted (a) . . . . . . . . . . . . . . . . . . $ 0.08 $ 0.07 $ 1.38 $ 0.04Dividends declared per share . . . . . . . . . . . . . . . . . . . . . . . . . . . . . $ 0.25 $ 0.25 $ 0.25 $ 0.25
65
Ann
ex1
DL
CA
nnua
lRep
ort
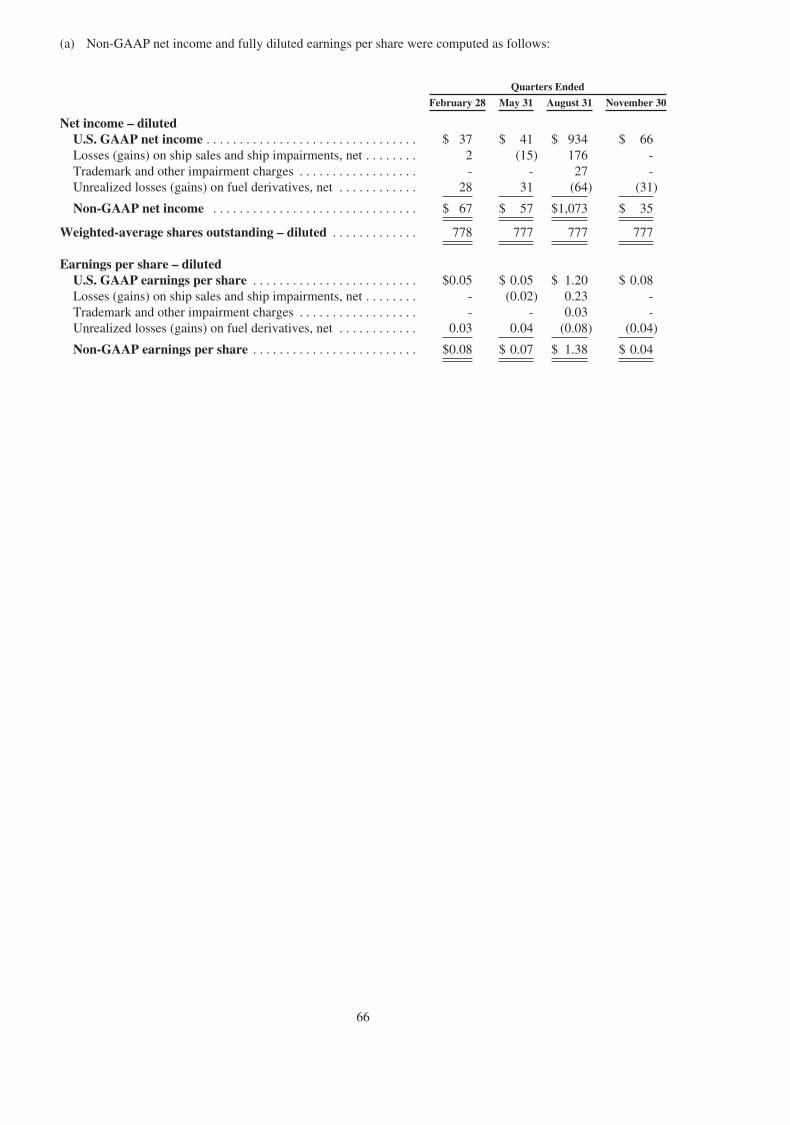
(a) Non-GAAP net income and fully diluted earnings per share were computed as follows:
Quarters Ended
February 28 May 31 August 31 November 30
Net income – dilutedU.S. GAAP net income . . . . . . . . . . . . . . . . . . . . . . . . . . . . . . . . $ 37 $ 41 $ 934 $ 66Losses (gains) on ship sales and ship impairments, net . . . . . . . . 2 (15) 176 -Trademark and other impairment charges . . . . . . . . . . . . . . . . . . - - 27 -Unrealized losses (gains) on fuel derivatives, net . . . . . . . . . . . . 28 31 (64) (31)
Non-GAAP net income . . . . . . . . . . . . . . . . . . . . . . . . . . . . . . . $ 67 $ 57 $1,073 $ 35
Weighted-average shares outstanding – diluted . . . . . . . . . . . . . 778 777 777 777
Earnings per share – dilutedU.S. GAAP earnings per share . . . . . . . . . . . . . . . . . . . . . . . . . $0.05 $ 0.05 $ 1.20 $ 0.08Losses (gains) on ship sales and ship impairments, net . . . . . . . . - (0.02) 0.23 -Trademark and other impairment charges . . . . . . . . . . . . . . . . . . - - 0.03 -Unrealized losses (gains) on fuel derivatives, net . . . . . . . . . . . . 0.03 0.04 (0.08) (0.04)
Non-GAAP earnings per share . . . . . . . . . . . . . . . . . . . . . . . . . $0.08 $ 0.07 $ 1.38 $ 0.04
66

CORPORATE AND OTHER INFORMATION
SENIOR OFFICERS
CARNIVAL CORPORATION & PLCMicky ArisonChairman of the Board
Arnold W. DonaldPresident and Chief Executive Officer
David BernsteinChief Financial Officer
Alan B. BuckelewChief Operations Officer
Arnaldo PerezGeneral Counsel and Secretary
CARNIVAL UKDavid DingleChairman
COSTA GROUPMichael ThammChief Executive Officer
HOLLAND AMERICA GROUPStein KruseChief Executive Officer
BOARD OF DIRECTORS
Micky Arison 3
Chairman of the BoardCarnival Corporation & plc
Sir Jonathon Band 4
Former First Sea Lord andChief of Naval StaffBritish Navy
Arnold W. Donald 3
President and Chief Executive OfficerCarnival Corporation & plc
Richard J. Glasier 1, 2, 5
Former President andChief Executive OfficerArgosy Gaming Company
Debra Kelly-Ennis 4
Former President and Chief ExecutiveOfficerDiageo Canada, Inc.
Sir John Parker 4, 5
Chairman of Anglo American plc andVice Chairman of DP World Limited
Stuart Subotnick 1, 3, 5
President and Chief Executive OfficerMetromedia Company
Laura Weil 1, 2
Former Executive Vice President andChief Operating OfficerNew York & Company, Inc.
Randall J. Weisenburger 1, 2, 5
Managing MemberMile26 Capital LLC
1 Audit Committee2 Compensation Committee3 Executive Committee4 Health, Environmental, Safety &
Security Committee5 Nominating & Governance Committee
DIRECTORS EMERITUS AND LIFEPRESIDENTS
Ted Arison (1924-1999)Chairman Emeritus, Carnival Corporation
Maks Birnbach (1920-2007)Director Emeritus, Carnival Corporation
A. Kirk LantermanChairman EmeritusHolland America Line Inc.
Meshulam Zonis (1933-2009)Director Emeritus, Carnival Corporation
Uzi ZuckerDirector Emeritus, Carnival Corporation &plc
Horst RaheLife President of AIDA Cruises
The Lord Sterling ofPlaistow GCVO, CBELife President of P&O Cruises
OTHER INFORMATION
Corporate HeadquartersCarnival CorporationCarnival Place3655 N.W. 87th AvenueMiami, Florida 33178-2428 U.S.A.305-599-2600
Registered OfficeCarnival plcCarnival House100 Harbour ParadeSouthampton S015 1ST UK44 (0) 23 8065 5000
Independent RegisteredCertified Public Accounting FirmPricewaterhouseCoopers LLP1441 Brickell Avenue, Suite 1100Miami, Florida 33131-2330 U.S.A.
Registrars, Stock Transfer Agents andDividend Reinvestment PlanAdministratorsCarnival CorporationComputershare Investor ServicesP.O. Box 30170College Station, Texas 77842-3170 U.S.A.800-568-3476 (U.S.A, U.S.A Territories andCanada)781-575-2879 (Outside U.S.A, U.S.ATerritories and Canada)
Carnival plcEquiniti LimitedAspect House, Spencer RoadLancing, West Sussex BN99 6DA UK0871 384 2665 (UK)44 121 415 7107 (Outside UK)
Legal CounselGibson, Dunn & Crutcher LLP1050 Connecticut Avenue, N.W.Washington D.C. 20036-5306 U.S.A.
Other Shareholder InformationCopies of our joint Annual Report onForm 10-K, joint Quarterly Reports onForm 10-Q, joint Current Reports on Form8-K, Carnival plc Annual Accounts and allamendments to those reports, press releasesand other documents, as well as informationon our cruise brands are available throughour website at www.carnivalcorp.com orwww.carnivalplc.com.
67

Carnival House 100 Harbour Parade, Southampton SO15 1st, United Kingdom www.carnivalplc.com