Embed Size (px)
Citation preview
May 2016
The following investment strategy was compiled by Callan Associates Inc. from information provided by the Idaho Board of Land Commissioners and other sources believed to be reliable. All written comments in this report are objectively stated and are based on facts gathered in good faith.
This report is for informational purposes only and should not be construed as legal or tax advice on any matter. Any decision you make on the basis of the content is your sole responsibility. You should consult with legal and tax advisers before applying any of this information to your particular situation. Reference to or inclusion in this report of any product, service or entity should not be construed as a recommendation, approval, affiliation, or endorsement of such product, service or entity by Callan.
Strategic Re-Investment Plan
Idaho Board of Land Commissioners
v0506 ATTACHMENT 1
Knowledge. Experience. Integrity.
Table of Contents
Idaho Board of Land Commissioners Strategic Re-Investment Plan
Purpose and Background ____________________________________________________________________ 1
Comparison of Investment Options ____________________________________________________________ 2
Commentary ______________________________________________________________________________ 3
Financial Assets Farmland Timberland
Conclusions and Next Steps _________________________________________________________________ 8
Appendices ______________________________________________________________________________ 10
Timberland Market Overview • Timberland Supply and Demand Dynamics • Timberland Capital Market Flows and Transaction Data • Timberland Historical Performance • Expected Returns
Farmland Market Overview • Farmland Supply and Demand Dynamics • Farmland Capital Market Flows and Transaction Data • Farmland Historical Performance • Farmland Expected Returns • Ways to Invest in Farmland • Conclusions and Implications for Investment • Cropland Per Acre Prices and Percentage Change • Resource Dimensions Idaho Farmland Information • Farmland Risks
Historical Returns and Correlations for Farmland, Timberland, and Commercial Real Estate Glossary of Terms
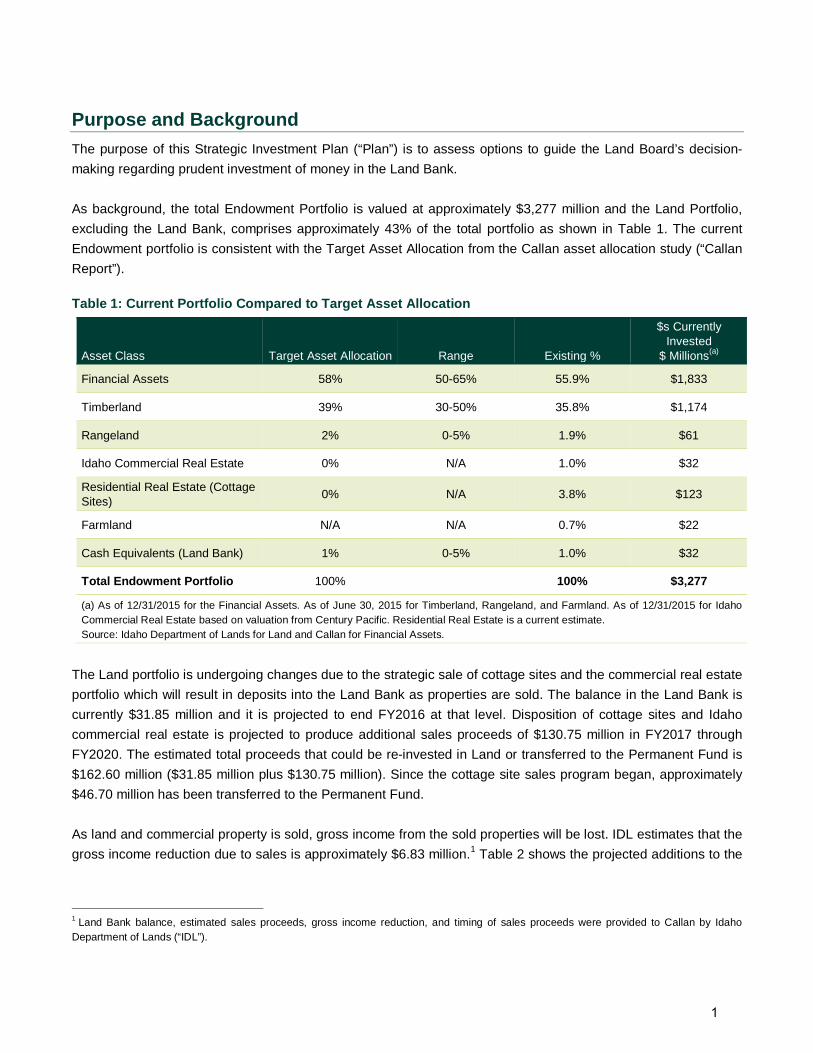
Purpose and Background The purpose of this Strategic Investment Plan (“Plan”) is to assess options to guide the Land Board’s decision-making regarding prudent investment of money in the Land Bank. As background, the total Endowment Portfolio is valued at approximately $3,277 million and the Land Portfolio, excluding the Land Bank, comprises approximately 43% of the total portfolio as shown in Table 1. The current Endowment portfolio is consistent with the Target Asset Allocation from the Callan asset allocation study (“Callan Report”).
Table 1: Current Portfolio Compared to Target Asset Allocation
Asset Class Target Asset Allocation Range Existing %
$s Currently Invested
$ Millions(a)
Financial Assets 58% 50-65% 55.9% $1,833
Timberland 39% 30-50% 35.8% $1,174
Rangeland 2% 0-5% 1.9% $61
Idaho Commercial Real Estate 0% N/A 1.0% $32
Residential Real Estate (Cottage Sites) 0% N/A 3.8% $123
Farmland N/A N/A 0.7% $22
Cash Equivalents (Land Bank) 1% 0-5% 1.0% $32
Total Endowment Portfolio 100% 100% $3,277
(a) As of 12/31/2015 for the Financial Assets. As of June 30, 2015 for Timberland, Rangeland, and Farmland. As of 12/31/2015 for Idaho Commercial Real Estate based on valuation from Century Pacific. Residential Real Estate is a current estimate. Source: Idaho Department of Lands for Land and Callan for Financial Assets.
The Land portfolio is undergoing changes due to the strategic sale of cottage sites and the commercial real estate portfolio which will result in deposits into the Land Bank as properties are sold. The balance in the Land Bank is currently $31.85 million and it is projected to end FY2016 at that level. Disposition of cottage sites and Idaho commercial real estate is projected to produce additional sales proceeds of $130.75 million in FY2017 through FY2020. The estimated total proceeds that could be re-invested in Land or transferred to the Permanent Fund is $162.60 million ($31.85 million plus $130.75 million). Since the cottage site sales program began, approximately $46.70 million has been transferred to the Permanent Fund. As land and commercial property is sold, gross income from the sold properties will be lost. IDL estimates that the gross income reduction due to sales is approximately $6.83 million.1 Table 2 shows the projected additions to the
1 Land Bank balance, estimated sales proceeds, gross income reduction, and timing of sales proceeds were provided to Callan by Idaho Department of Lands (“IDL”).
1
Land Bank by year, the corresponding Land Bank balance if no investments are made, and the annual and cumulative reduction in gross income.
Table 2: Projected Additions to the Land Bank and Reduction in Gross Income Due to Sales
Prior
Periods FY2016
$MM FY2017
$MM FY2018
$MM FY2019
$MM FY2020
$MM
Additions to Land Bank $51.7 $26.85 $53.15 $34.85 $30.15 $12.60
Transfers to Permanent Fund $46.7 $0 $0 $0 $0 $5.00
Land Bank Balance2 $5.00 $31.85 $85.00 $119.85 $150.00 $157.60
Reduction in Gross Income3 from Sales N/A $1.82 $3.42 $1.09 $0.50 $0
Cumulative Reduction in Gross Income N/A $1.82 $5.24 $6.33 $6.83 $6.83
Using the Land Bank Balance on Table 2 and holding the value of the total portfolio constant, the Land Bank Balance, as a percentage of the total portfolio, rises from 1% currently to 2.6% at the end of FY2017 to just under 5% by the end of FY2020 which is in the recommended range of 0-5%.
Comparison of Investment Options The Callan report suggested a framework for making investment decisions for timberland and farmland (Items 1-5 below). These and other relevant decision-making factors (Items 6-8 below) are applicable to establishing priorities for investment of the Land Bank.
1. Is the investment consistent with the overall asset allocation and objectives of the total portfolio as set forth in the Investment Policy Statement and in the Strategic and Annual Plans?
2. Comparison of the risk adjusted return and the net return relative to other choices (e.g. stocks, bonds, other land types). In other words, what are the other choices for investment?
3. Does it make a difference and move the needle from an overall portfolio perspective? 4. Completion of a full underwriting of the potential investment including upside, base case, and downside
scenarios with identification of assumptions and risks alongside of the returns (both the return gross of fees and net of all fees and costs);
5. Detailed outline of the business plan for the investment and the plan for execution including consideration of the internal and external resources required to execute the plan and associated costs;
6. Market fundamentals; 7. Availability of transactions; and 8. Institutional investment trends, processes, and implementation for timberland and farmland.
Callan believes there are three investment options for the Land Bank proceeds: Financial Assets (Permament Fund), Idaho Farmland, and Idaho Timberland. Table 3 summarizes the investment options with commentary on each option following the table. 2 Assumes no acquisitions are completed and transfers to the Permanent Fund occur after 5 years. 3 Gross income is before deduction of IDL management expenses
2
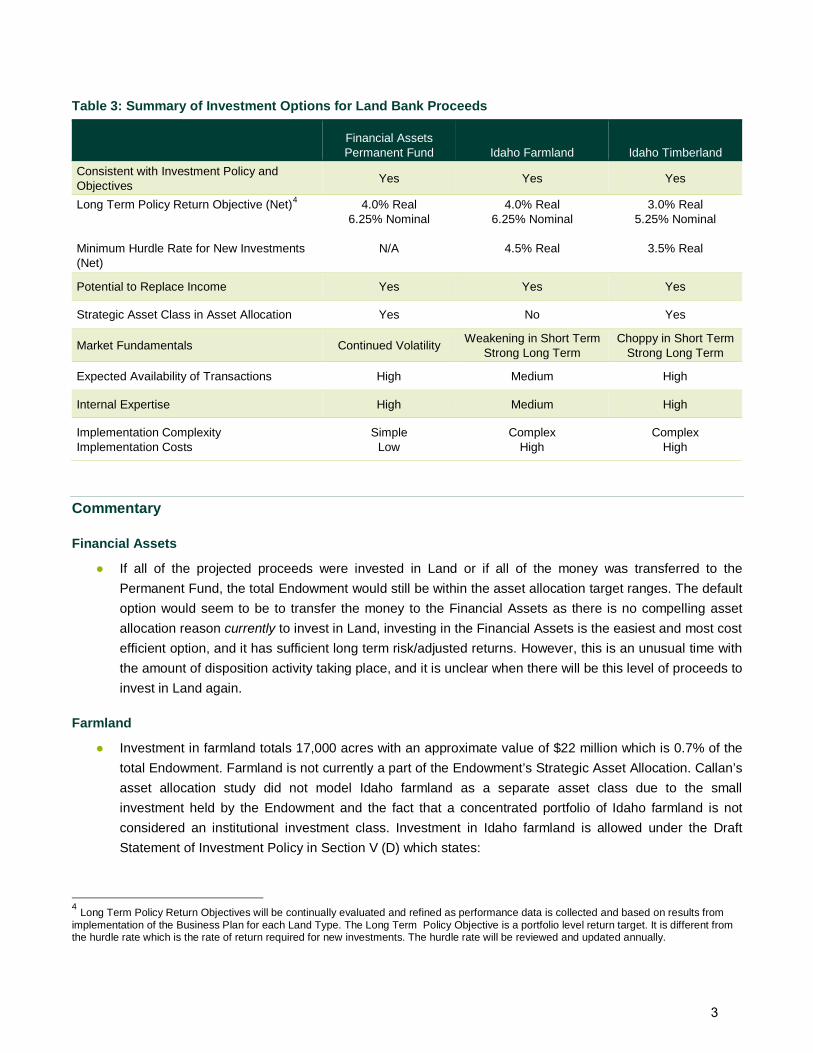
Table 3: Summary of Investment Options for Land Bank Proceeds
Financial Assets Permanent Fund Idaho Farmland Idaho Timberland
Consistent with Investment Policy and Objectives Yes Yes Yes
Long Term Policy Return Objective (Net)4 Minimum Hurdle Rate for New Investments (Net)
4.0% Real 6.25% Nominal
N/A
4.0% Real 6.25% Nominal
4.5% Real
3.0% Real 5.25% Nominal
3.5% Real
Potential to Replace Income Yes Yes Yes
Strategic Asset Class in Asset Allocation Yes No Yes
Market Fundamentals Continued Volatility Weakening in Short Term Strong Long Term
Choppy in Short Term Strong Long Term
Expected Availability of Transactions High Medium High
Internal Expertise High Medium High
Implementation Complexity Implementation Costs
Simple Low
Complex High
Complex High
Commentary
Financial Assets
● If all of the projected proceeds were invested in Land or if all of the money was transferred to the Permanent Fund, the total Endowment would still be within the asset allocation target ranges. The default option would seem to be to transfer the money to the Financial Assets as there is no compelling asset allocation reason currently to invest in Land, investing in the Financial Assets is the easiest and most cost efficient option, and it has sufficient long term risk/adjusted returns. However, this is an unusual time with the amount of disposition activity taking place, and it is unclear when there will be this level of proceeds to invest in Land again.
Farmland
● Investment in farmland totals 17,000 acres with an approximate value of $22 million which is 0.7% of the total Endowment. Farmland is not currently a part of the Endowment’s Strategic Asset Allocation. Callan’s asset allocation study did not model Idaho farmland as a separate asset class due to the small investment held by the Endowment and the fact that a concentrated portfolio of Idaho farmland is not considered an institutional investment class. Investment in Idaho farmland is allowed under the Draft Statement of Investment Policy in Section V (D) which states:
4 Long Term Policy Return Objectives will be continually evaluated and refined as performance data is collected and based on results from implementation of the Business Plan for each Land Type. The Long Term Policy Objective is a portfolio level return target. It is different from the hurdle rate which is the rate of return required for new investments. The hurdle rate will be reviewed and updated annually.
3
“In addition to asset allocation, the Land Board may, from time to time, authorize or adopt strategic policies. “Strategic Policies” are actions by the Land Board to allow investment in asset types that have not been singled out as “asset classes” in the asset allocation process, to overweight a particular sector within an asset class, or to employ particular strategies in the investment of the Endowment Assets. The purposes of these actions are either to increase the return above the expected return or to reduce risk. Any such policy would include consideration of the change in risk and the impact on the Distribution Policy.”
● As noted previously, we have not modeled the investment characteristics of Idaho farmland. For Idaho
farmland, we have considered the short return series of the Idaho farmland properties reported to the
National Council of Real Estate Investment Fiduciaries (NCREIF). These are all row crop properties which is what we assume would be the target of any additional investment in farmland by the Land Board.
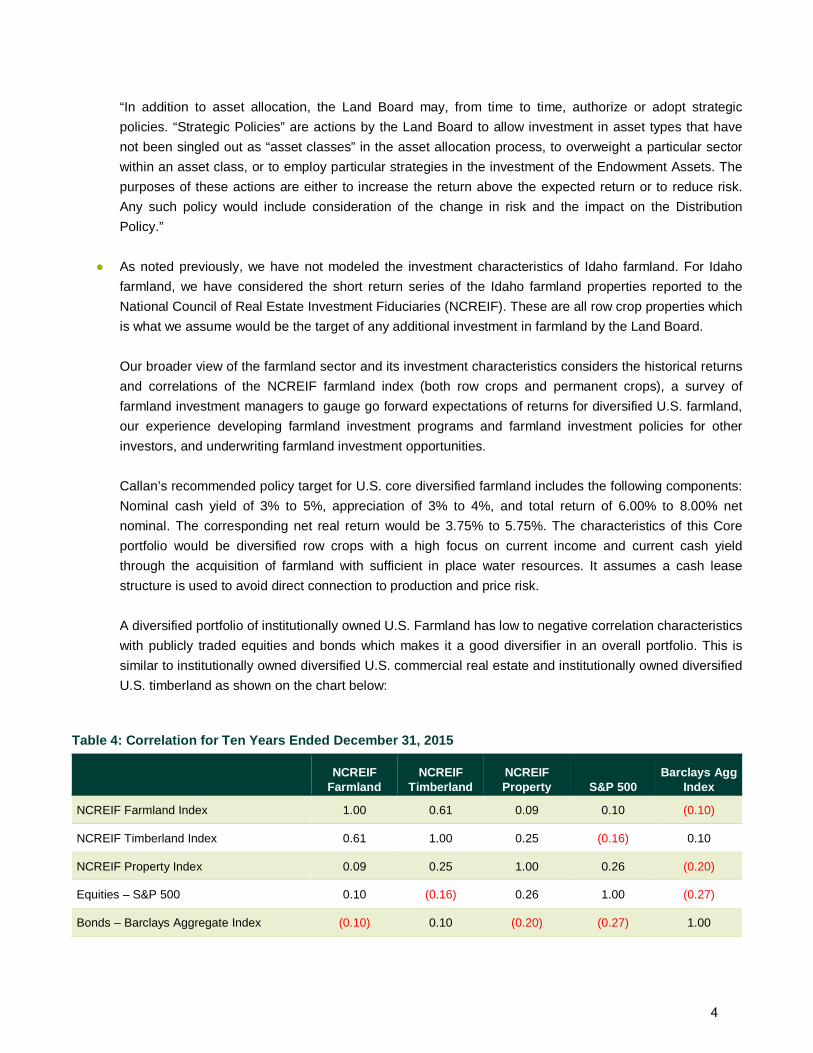
Our broader view of the farmland sector and its investment characteristics considers the historical returns and correlations of the NCREIF farmland index (both row crops and permanent crops), a survey of farmland investment managers to gauge go forward expectations of returns for diversified U.S. farmland, our experience developing farmland investment programs and farmland investment policies for other investors, and underwriting farmland investment opportunities. Callan’s recommended policy target for U.S. core diversified farmland includes the following components: Nominal cash yield of 3% to 5%, appreciation of 3% to 4%, and total return of 6.00% to 8.00% net nominal. The corresponding net real return would be 3.75% to 5.75%. The characteristics of this Core portfolio would be diversified row crops with a high focus on current income and current cash yield through the acquisition of farmland with sufficient in place water resources. It assumes a cash lease structure is used to avoid direct connection to production and price risk. A diversified portfolio of institutionally owned U.S. Farmland has low to negative correlation characteristics with publicly traded equities and bonds which makes it a good diversifier in an overall portfolio. This is similar to institutionally owned diversified U.S. commercial real estate and institutionally owned diversified U.S. timberland as shown on the chart below:
Table 4: Correlation for Ten Years Ended December 31, 2015
NCREIF
Farmland NCREIF
Timberland NCREIF Property S&P 500
Barclays Agg Index
NCREIF Farmland Index 1.00 0.61 0.09 0.10 (0.10)
NCREIF Timberland Index 0.61 1.00 0.25 (0.16) 0.10
NCREIF Property Index 0.09 0.25 1.00 0.26 (0.20)
Equities – S&P 500 0.10 (0.16) 0.26 1.00 (0.27)
Bonds – Barclays Aggregate Index (0.10) 0.10 (0.20) (0.27) 1.00
4
● From a market perspective, pricing in the sector is adjusting as the commodities markets continue to experience turmoil; however, there is ample capital for investment from other institutions and individuals that is supporting pricing above that which is justified by the fundamentals. Pricing was mentioned as a significant risk by every one of the institutional buyers and managers of farmland that Callan surveyed, which suggests careful underwriting is of particular importance currently. Access to water is another risk that is being more closely considered and control over water resources is a requirement for institutional buyers. Evaluation of a potential tenants’ credit and financial strength has taken on heightened importance as commodity prices and credit has tightened. Callan understands that the conflict auction leasing process used by the Land Board does not allow for evaluation of tenant financial strength and credit of the high bidder. IDL noted that if an applicant is 18 years old and not in default with the state and were the high bidder, the bid would be accepted and there would not be an opportunity to evaluate the financial position.
● The long term fundamentals for farmland are compelling. Strong demand for farmland is expected to continue to meet the increasing global demand for food, fiber,and energy, as well as to satisfy institutional investor demand for diversifying, inflation-hedging assets. The relatively fixed supply of land capable of supporting agriculture is another favorable factor supporting the investment case for farmland.
● The availability of transactions in farmland is expected to be less than timberland and the pace of
investment is slower than timberland due to the the limited pool of investment transactions every year. There is not a pool of closed end funds that are reaching maturity and selling assets like in timberland. Investors tend to buy and hold, the asset class is popular with significant competition for transactions, and operators/farmers have had strong balance sheets for acquiring farmland, with limited financial pressure/incentive to sell. Access to transaction deal flow via relationships with institutional and local owner/operators is critical to building a portfolio.
● Implementation is characterized as complex because it involves sourcing transactions, completing due diligence, and hiring third party advisors. Costs of implementation are relatively high due to costs of external land advisors, transaction costs including brokers, legal fees, title work, environmental, etc., the costs of internal staff time, and the opportunity cost of holding money in the Land Bank versus investing in the Financial assets (which could be positive or negative depending on the returns of the IDLE pool versus the Financial Assets over the timeframe in which proceeds are in the Land Bank).
● Institutional ownership of farmland in Idaho (as reported to NCREIF) totals $280 million in 32 properties with total acreage of 57,086 acres. This equates to an average investment per property of $8.75 million and an average per acre value of $4,904. All properties are annual row crops. These owners represent potential competition to IDL for larger transactions ($5 million+) but not for smaller transactions which IDL may want to consider in its acquisition strategy. On the disposition side, should the Land Board wish to sell farmland, the institutional owners would likely not be buyers as the transaction size would be too small for those buyers if they could only purchase 320 acres. The ability to achieve liquidity would depend on local buyers.
5
● We find no compelling reason that the net returns the Land Board should accept from additional investment in Idaho farmland (annual row crops) should be less than those of a diversified U.S. core farmland portfolio. The non-diversified nature of the Idaho only investment is a reason to require higher returns. Callan recommends that additional investment in Farmland be pursued if Core investments can be found such that the minimum net returns are competitive with both the Long Term Policy Return Objective for the Financial Asset portfolio and the Farmland Portfolio, as well as, noted above, diversified U.S. core farmland. The recommended Hurdle Rate is a minimum net real return of 4.5% which equates to a 6.75% net nominal return, assuming inflation of 2.25%. Of course, the risk profile of each transaction and market dynamics will dictate the return that will be required, such that some transactions may have returns above the Hurdle Rate. Setting the Hurdle Rate above the Long Term Policy Returns for both the Financial Asset Portfolio and the Farmland Portfolio, will keep the focus on finding transactions that are accretive. The expected return of a farmland investment should include both income and appreciation with a focus on income to provide income replacement for the portfolio; however, for the returns to be competitive, investments will need to also have appreciation and the plan for managing each investment should have a strategy for realizing the appreciation. The lease structure will be an important mechanism to insure the income and inflation hedging characteristics of farmland and the total returns are achieved.
● Callan does not recommend setting a hard target for the amount of dollars to be invested in Farmland, but rather allowing the investment decision to be driven by the opportunities.
● Investment in a diversified portfolio of U.S. farmland may be another way to enhance the risk/return of the Endowment portfolio. In the next asset allocation study, the impact on the Endowment of investment in diversified U.S. farmland could be studied as a complement to the existing Idaho farmland portfolio. Diversification geographically as well as by row and permanent crops could be considered. The external and internal resources and investment vehicles that would be required to implement a diversified allocation efficiently would also be examined.
Timberland
● Callan recommends pursuing additional investment in timberland in Idaho provided investments can be sourced with appropriate net returns. Additional investment is supported by the asset allocation study which indicates portfolio risk/return will be maintained with additional investment in timberland provided new investments have a net projected return at or above the returns of the existing portfolio with a similar level of risk. In Callan’s study, the existing timberland portfolio had an expected net 10 year compounded return of 5.70% (3.45% net real return). The recommended Hurdle Rate for Timberland is a minimum net real return of 3.5% which equates to a
6
5.75% net nominal return, assuming 2.25% inflation. The risk profile of each transaction and market dynamics will dictate the return that will be required, such that some transactions may have returns above the Hurdle Rate.
● Callan does not recommend setting a hard target for the amount of dollars to be invested, but rather allowing the investment decision to be driven by the opportunities. The range for timberland is 30-50% of the total Endowment portfolio. If attractive opportunities are found, all of the projected proceeds in the Land could be invested in timberland and timberland would remain in the target 30-50% range, assuming the total portfolio remains at or above the current value.
● Investment in additional timberland is a way to replace lost income from the sales of cabin sites and commercial real estate.
● Market dynamics in the timberland industry include increasing transaction flow. There have been several large institutional portfolios of timberland brought to the market in the U.S. Several closed-end commingled funds are nearing their expirations, which will result in timberland for sale. Additionally, multiple timberland investment organizations are undergoing changes which could result in additional deal flow from manager disruption and terminated vehicles. The environment with substantial availability of properties for sale and projected to be for sale may help to moderate pricing. The availability of transactions is in marked contrast to prior years and the Land Board should take advantage of the increased transaction flow.
● Similar to Farmland, implementation is characterized as complex.
● Callan believes that the Land Board has a competitive advantage in timberland investing compared to other institutional investors and owners of timberland given its experienced Staff, existing portfolio, long term investment horizon, and cost of capital.
● IDL has a management structure and monitoring resources in place to execute the business plan for the assets.
Conclusions and Next Steps This is an unusual time for the Endowment due to the amount of disposition activity taking place. Based on the current Asset Management Plan, it does not appear that after FY 2020, there will again be the level of proceeds to invest in Land. Therefore, the Land Board should consider using Land Bank proceeds to invest in Timberland and Farmland, provided the targeted Hurdle Rates can be met or exceeded and an institutional investment process is used. To be credible in the market with potential sellers, IDL needs to be able to represent to sellers that it has money to fund transactions (subject to the Land Board due diligence, underwriting, and approval process) which will require money to remain in the Land Bank while transactions are found.
7
Investment in Land transactions requires time to identify and execute. A logical next step is to have IDL establish a pipeline of transactions to substantiate their investment thesis that attractive transactions can be found in Timberland and Farmland. The pipeline should be documented via a pipeline report/deal log which is updated and discussed with the Land Board each quarter to track progress. A pipeline report/deal log is a standard tool that is used by third party investment managers. The Land Bank money will be available over time, in increments. This means IDL will need to source and execute transactions according to the timing and amount of proceeds for each underlying endowment. It is currently IDL’s intention to purchase properties such that the underlying endowment would own an undivided interest. Money will not be commingled from endowments to make purchases whereby each endowment would own its pro rata share of the property, either by acreage or by a share of the economics. Priorities should be set in terms of the size of transactions and the number that IDL can reasonably expect to diligence and close given current resourcing. Pursuing a fewer number of large transactions for each endowment will be more efficient both in terms of staff time and transaction costs. If high priority, larger transactions are expected then money should be earmarked to insure it is available to match the transaction timeframe. A formal transaction allocation process should be established and documented to insure that transactions are allocated fairly to each endowment. This may involve suitability screens such as transaction size. IDL has proposed a transaction allocation process that would allocate a deal to the endowment with money that has been waiting the longest in the Land Bank. Underwriting should include upside, base case, and downside scenarios with identification of assumptions and risks alongside of the returns. The underwriting should include an evaluation of income, appreciation, and total return on a gross of fees and net of fees basis, calculated in accordance with industry standards. A detailed outline of the business plan for the investment should be completed as part of the underwriting including consideration of the internal and external resources required to execute the plan and associated costs, to insure there is a plan for producing the returns that are projected. If IDL does not have the inhouse capabilities to implement an institutional investment process, external investment management advisory expertise will be required.
8
Appendices
9
Timberland Market Overview
Timberland Supply and Demand Dynamics
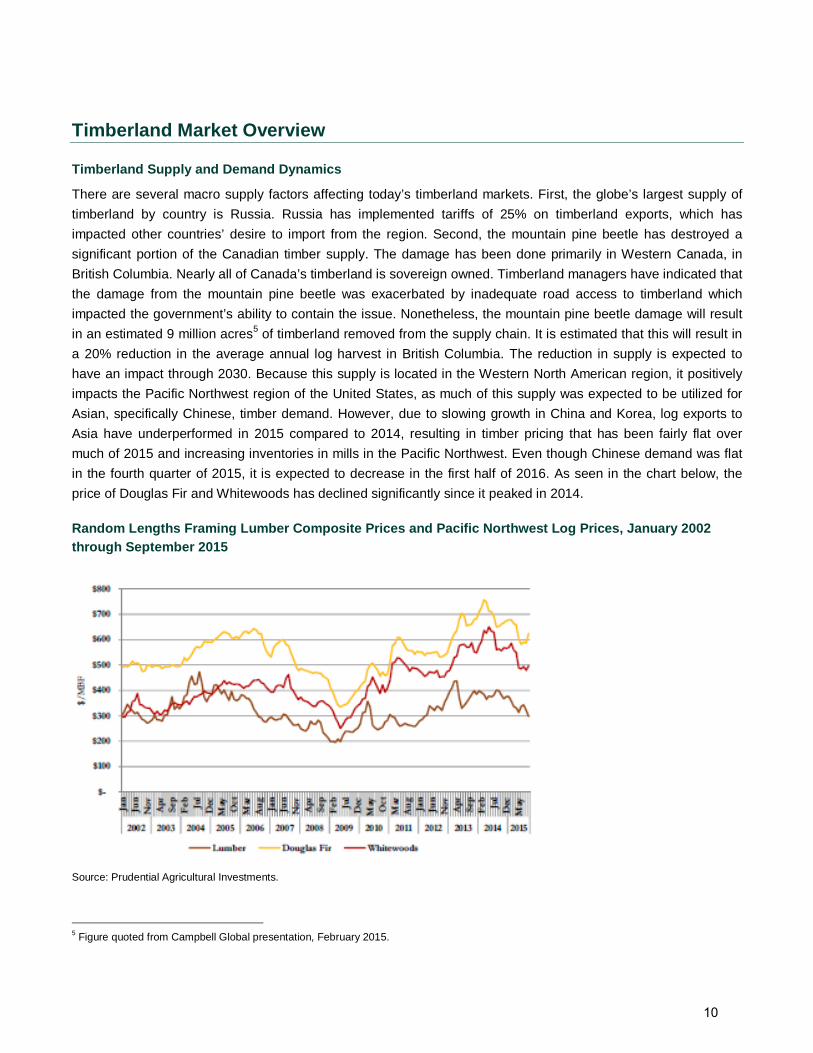
There are several macro supply factors affecting today’s timberland markets. First, the globe’s largest supply of timberland by country is Russia. Russia has implemented tariffs of 25% on timberland exports, which has impacted other countries’ desire to import from the region. Second, the mountain pine beetle has destroyed a significant portion of the Canadian timber supply. The damage has been done primarily in Western Canada, in British Columbia. Nearly all of Canada’s timberland is sovereign owned. Timberland managers have indicated that the damage from the mountain pine beetle was exacerbated by inadequate road access to timberland which impacted the government’s ability to contain the issue. Nonetheless, the mountain pine beetle damage will result in an estimated 9 million acres5 of timberland removed from the supply chain. It is estimated that this will result in a 20% reduction in the average annual log harvest in British Columbia. The reduction in supply is expected to have an impact through 2030. Because this supply is located in the Western North American region, it positively impacts the Pacific Northwest region of the United States, as much of this supply was expected to be utilized for Asian, specifically Chinese, timber demand. However, due to slowing growth in China and Korea, log exports to Asia have underperformed in 2015 compared to 2014, resulting in timber pricing that has been fairly flat over much of 2015 and increasing inventories in mills in the Pacific Northwest. Even though Chinese demand was flat in the fourth quarter of 2015, it is expected to decrease in the first half of 2016. As seen in the chart below, the price of Douglas Fir and Whitewoods has declined significantly since it peaked in 2014.
Random Lengths Framing Lumber Composite Prices and Pacific Northwest Log Prices, January 2002 through September 2015
Source: Prudential Agricultural Investments.
5 Figure quoted from Campbell Global presentation, February 2015.
10
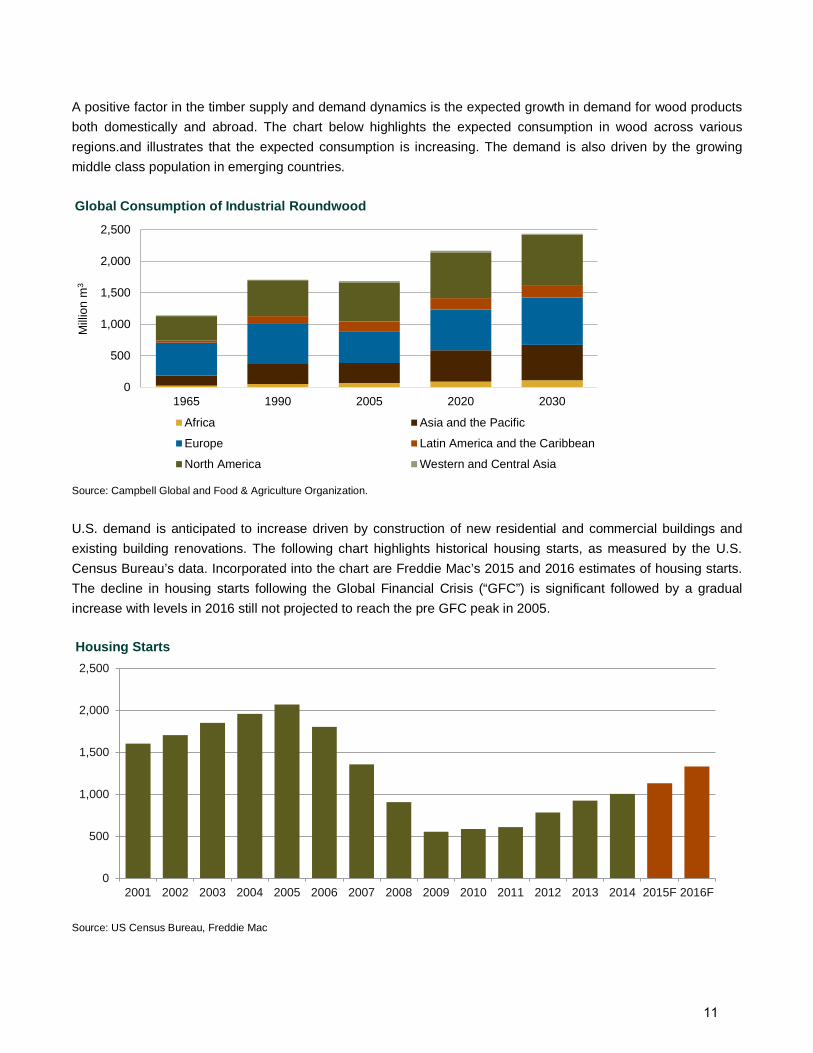
A positive factor in the timber supply and demand dynamics is the expected growth in demand for wood products both domestically and abroad. The chart below highlights the expected consumption in wood across various regions.and illustrates that the expected consumption is increasing. The demand is also driven by the growing middle class population in emerging countries.
Source: Campbell Global and Food & Agriculture Organization.
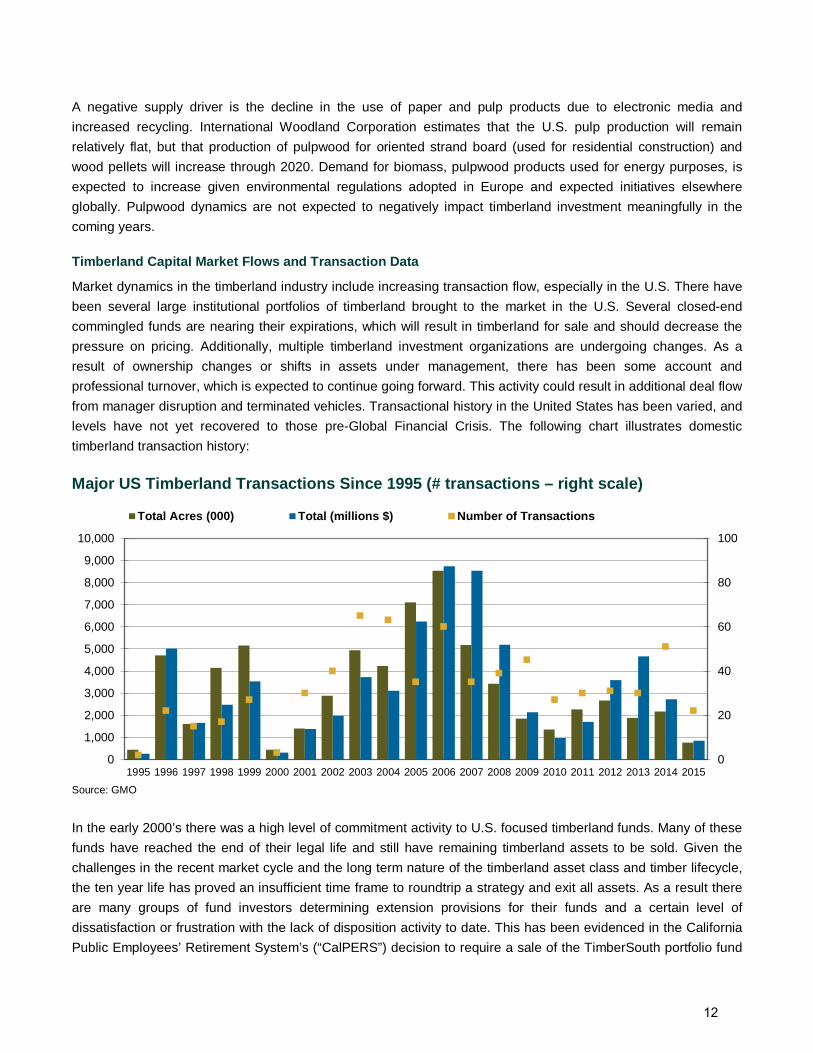
U.S. demand is anticipated to increase driven by construction of new residential and commercial buildings and existing building renovations. The following chart highlights historical housing starts, as measured by the U.S. Census Bureau’s data. Incorporated into the chart are Freddie Mac’s 2015 and 2016 estimates of housing starts. The decline in housing starts following the Global Financial Crisis (“GFC”) is significant followed by a gradual increase with levels in 2016 still not projected to reach the pre GFC peak in 2005.
Source: US Census Bureau, Freddie Mac
0
500
1,000
1,500
2,000
2,500
1965 1990 2005 2020 2030
Mill
ion
m3
Global Consumption of Industrial Roundwood
Africa Asia and the Pacific
Europe Latin America and the Caribbean
North America Western and Central Asia
0
500
1,000
1,500
2,000
2,500
2001 2002 2003 2004 2005 2006 2007 2008 2009 2010 2011 2012 2013 2014 2015F 2016F
Housing Starts
11
A negative supply driver is the decline in the use of paper and pulp products due to electronic media and increased recycling. International Woodland Corporation estimates that the U.S. pulp production will remain relatively flat, but that production of pulpwood for oriented strand board (used for residential construction) and wood pellets will increase through 2020. Demand for biomass, pulpwood products used for energy purposes, is expected to increase given environmental regulations adopted in Europe and expected initiatives elsewhere globally. Pulpwood dynamics are not expected to negatively impact timberland investment meaningfully in the coming years.
Timberland Capital Market Flows and Transaction Data
Market dynamics in the timberland industry include increasing transaction flow, especially in the U.S. There have been several large institutional portfolios of timberland brought to the market in the U.S. Several closed-end commingled funds are nearing their expirations, which will result in timberland for sale and should decrease the pressure on pricing. Additionally, multiple timberland investment organizations are undergoing changes. As a result of ownership changes or shifts in assets under management, there has been some account and professional turnover, which is expected to continue going forward. This activity could result in additional deal flow from manager disruption and terminated vehicles. Transactional history in the United States has been varied, and levels have not yet recovered to those pre-Global Financial Crisis. The following chart illustrates domestic timberland transaction history: Major US Timberland Transactions Since 1995 (# transactions – right scale)
Source: GMO
In the early 2000’s there was a high level of commitment activity to U.S. focused timberland funds. Many of these funds have reached the end of their legal life and still have remaining timberland assets to be sold. Given the challenges in the recent market cycle and the long term nature of the timberland asset class and timber lifecycle, the ten year life has proved an insufficient time frame to roundtrip a strategy and exit all assets. As a result there are many groups of fund investors determining extension provisions for their funds and a certain level of dissatisfaction or frustration with the lack of disposition activity to date. This has been evidenced in the California Public Employees’ Retirement System’s (“CalPERS”) decision to require a sale of the TimberSouth portfolio fund
0
20
40
60
80
100
0
1,000
2,000
3,000
4,000
5,000
6,000
7,000
8,000
9,000
10,000
1995 1996 1997 1998 1999 2000 2001 2002 2003 2004 2005 2006 2007 2008 2009 2010 2011 2012 2013 2014 2015
Total Acres (000) Total (millions $) Number of Transactions
12
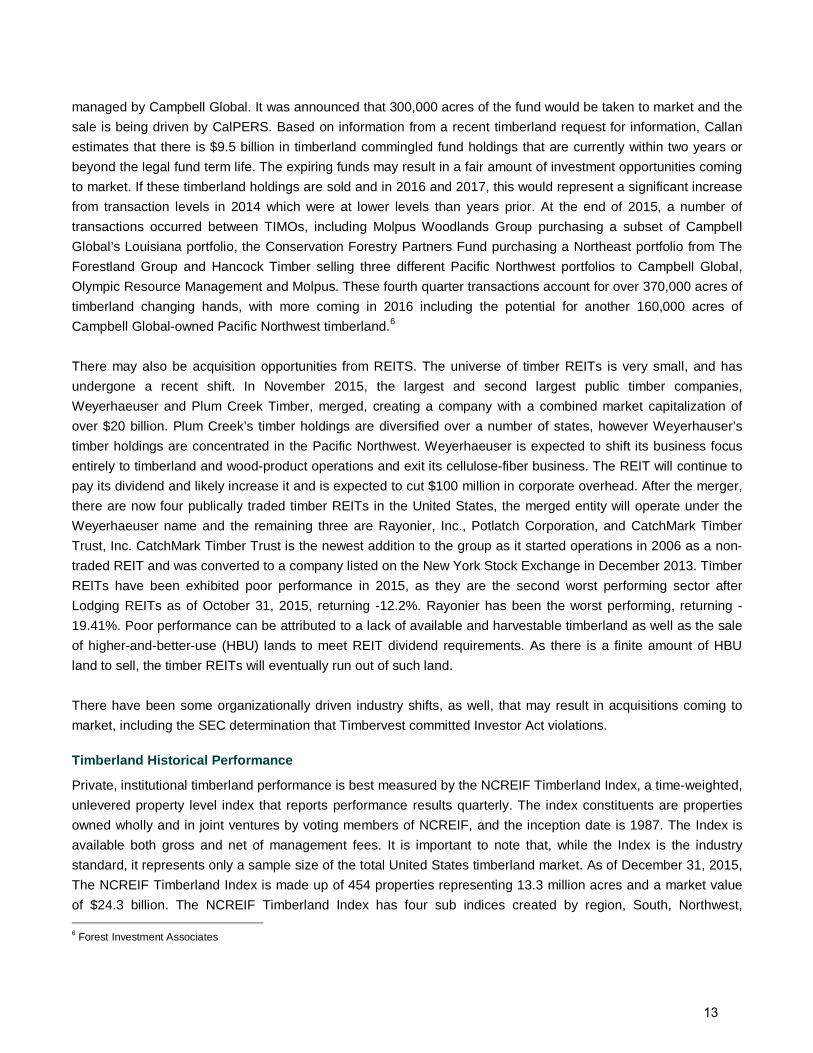
managed by Campbell Global. It was announced that 300,000 acres of the fund would be taken to market and the sale is being driven by CalPERS. Based on information from a recent timberland request for information, Callan estimates that there is $9.5 billion in timberland commingled fund holdings that are currently within two years or beyond the legal fund term life. The expiring funds may result in a fair amount of investment opportunities coming to market. If these timberland holdings are sold and in 2016 and 2017, this would represent a significant increase from transaction levels in 2014 which were at lower levels than years prior. At the end of 2015, a number of transactions occurred between TIMOs, including Molpus Woodlands Group purchasing a subset of Campbell Global’s Louisiana portfolio, the Conservation Forestry Partners Fund purchasing a Northeast portfolio from The Forestland Group and Hancock Timber selling three different Pacific Northwest portfolios to Campbell Global, Olympic Resource Management and Molpus. These fourth quarter transactions account for over 370,000 acres of timberland changing hands, with more coming in 2016 including the potential for another 160,000 acres of Campbell Global-owned Pacific Northwest timberland.6 There may also be acquisition opportunities from REITS. The universe of timber REITs is very small, and has undergone a recent shift. In November 2015, the largest and second largest public timber companies, Weyerhaeuser and Plum Creek Timber, merged, creating a company with a combined market capitalization of over $20 billion. Plum Creek’s timber holdings are diversified over a number of states, however Weyerhauser’s timber holdings are concentrated in the Pacific Northwest. Weyerhaeuser is expected to shift its business focus entirely to timberland and wood-product operations and exit its cellulose-fiber business. The REIT will continue to pay its dividend and likely increase it and is expected to cut $100 million in corporate overhead. After the merger, there are now four publically traded timber REITs in the United States, the merged entity will operate under the Weyerhaeuser name and the remaining three are Rayonier, Inc., Potlatch Corporation, and CatchMark Timber Trust, Inc. CatchMark Timber Trust is the newest addition to the group as it started operations in 2006 as a non-traded REIT and was converted to a company listed on the New York Stock Exchange in December 2013. Timber REITs have been exhibited poor performance in 2015, as they are the second worst performing sector after Lodging REITs as of October 31, 2015, returning -12.2%. Rayonier has been the worst performing, returning -19.41%. Poor performance can be attributed to a lack of available and harvestable timberland as well as the sale of higher-and-better-use (HBU) lands to meet REIT dividend requirements. As there is a finite amount of HBU land to sell, the timber REITs will eventually run out of such land. There have been some organizationally driven industry shifts, as well, that may result in acquisitions coming to market, including the SEC determination that Timbervest committed Investor Act violations.
Timberland Historical Performance
Private, institutional timberland performance is best measured by the NCREIF Timberland Index, a time-weighted, unlevered property level index that reports performance results quarterly. The index constituents are properties owned wholly and in joint ventures by voting members of NCREIF, and the inception date is 1987. The Index is available both gross and net of management fees. It is important to note that, while the Index is the industry standard, it represents only a sample size of the total United States timberland market. As of December 31, 2015, The NCREIF Timberland Index is made up of 454 properties representing 13.3 million acres and a market value of $24.3 billion. The NCREIF Timberland Index has four sub indices created by region, South, Northwest, 6 Forest Investment Associates
13
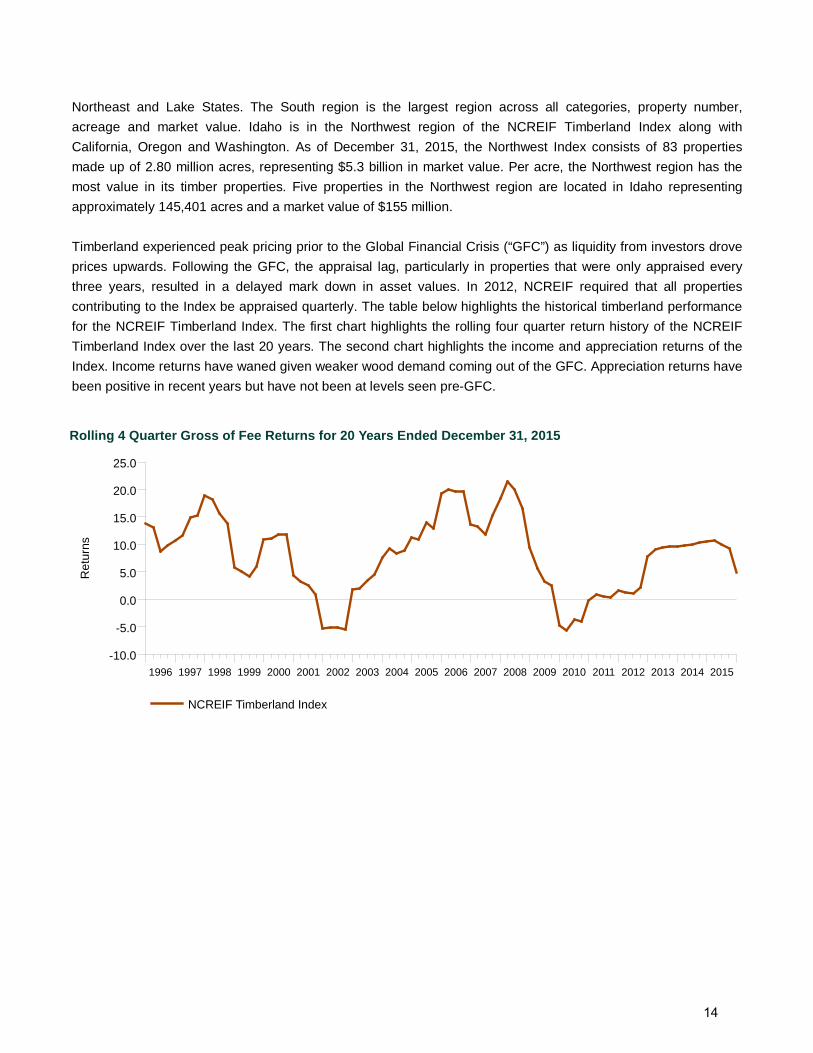
Northeast and Lake States. The South region is the largest region across all categories, property number, acreage and market value. Idaho is in the Northwest region of the NCREIF Timberland Index along with California, Oregon and Washington. As of December 31, 2015, the Northwest Index consists of 83 properties made up of 2.80 million acres, representing $5.3 billion in market value. Per acre, the Northwest region has the most value in its timber properties. Five properties in the Northwest region are located in Idaho representing approximately 145,401 acres and a market value of $155 million. Timberland experienced peak pricing prior to the Global Financial Crisis (“GFC”) as liquidity from investors drove prices upwards. Following the GFC, the appraisal lag, particularly in properties that were only appraised every three years, resulted in a delayed mark down in asset values. In 2012, NCREIF required that all properties contributing to the Index be appraised quarterly. The table below highlights the historical timberland performance for the NCREIF Timberland Index. The first chart highlights the rolling four quarter return history of the NCREIF Timberland Index over the last 20 years. The second chart highlights the income and appreciation returns of the Index. Income returns have waned given weaker wood demand coming out of the GFC. Appreciation returns have been positive in recent years but have not been at levels seen pre-GFC.
1996 1997 1998 1999 2000 2001 2002 2003 2004 2005 2006 2007 2008 2009 2010 2011 2012 2013 2014 2015-10.0
-5.0
0.0
5.0
10.0
15.0
20.0
25.0
Rolling 4 Quarter Gross of Fee Returns for 20 Years Ended December 31, 2015
Ret
urns
NCREIF Timberland Index
14
87 88 89 90 91 92 93 94 95 96 97 98 99 00 01 02 03 04 05 06 07 08 09 10 11 12 13 14 15-15.0-10.0
-5.00.05.0
10.015.020.025.030.035.0
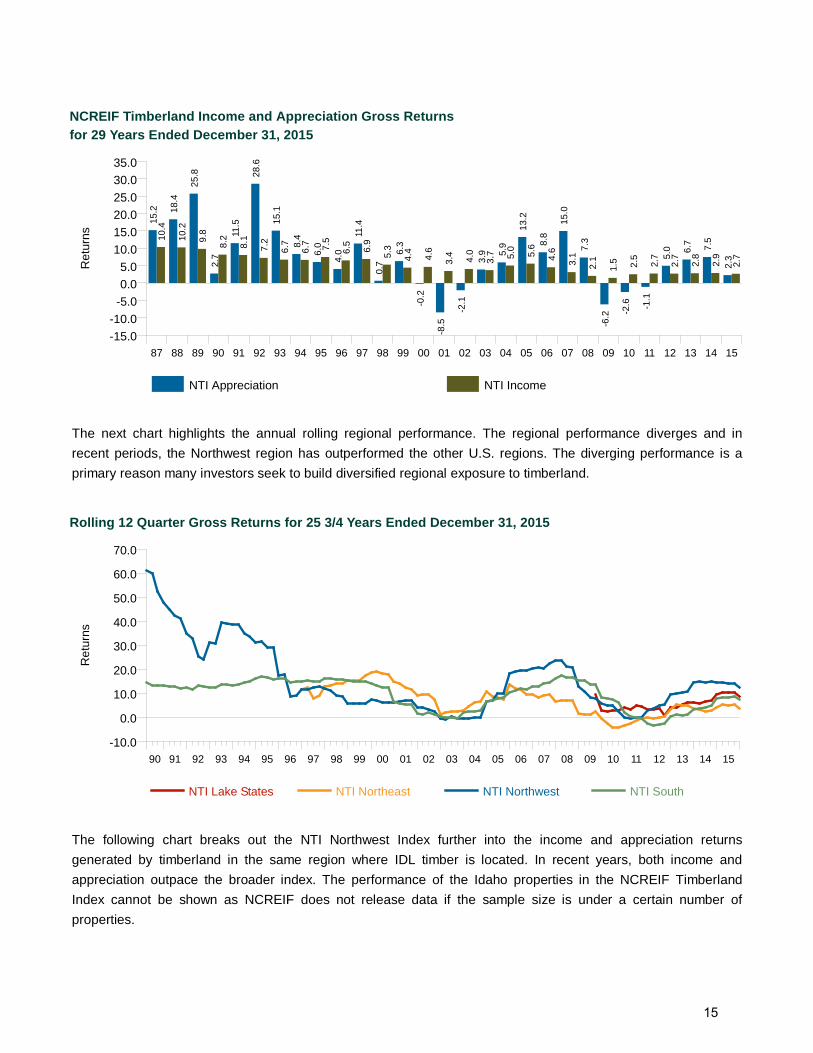
for 29 Years Ended December 31, 2015NCREIF Timberland Income and Appreciation Gross Returns
Ret
urns
NTI Appreciation NTI Income
15.2 18
.4
25.8
2.7
11.5
28.6
15.1
8.4
6.0
4.0
11.4
0.7
6.3
-0.2
-8.5
-2.1
3.9 5.
9
13.2
8.8
15.0
7.3
-6.2 -2
.6 -1.1
5.0 6.
7 7.5
2.3
10.4
10.2
9.8
8.2
8.1
7.2
6.7
6.7 7.5
6.5
6.9
5.3
4.4
4.6
3.4 4.0
3.7 5.0 5.6
4.6
3.1
2.1
1.5 2.5
2.7
2.7
2.8
2.9
2.7
The next chart highlights the annual rolling regional performance. The regional performance diverges and in recent periods, the Northwest region has outperformed the other U.S. regions. The diverging performance is a primary reason many investors seek to build diversified regional exposure to timberland.
90 91 92 93 94 95 96 97 98 99 00 01 02 03 04 05 06 07 08 09 10 11 12 13 14 15-10.0
0.0
10.0
20.0
30.0
40.0
50.0
60.0
70.0
Rolling 12 Quarter Gross Returns for 25 3/4 Years Ended December 31, 2015
NTI Lake States NTI Northeast NTI Northwest NTI South
Ret
urns
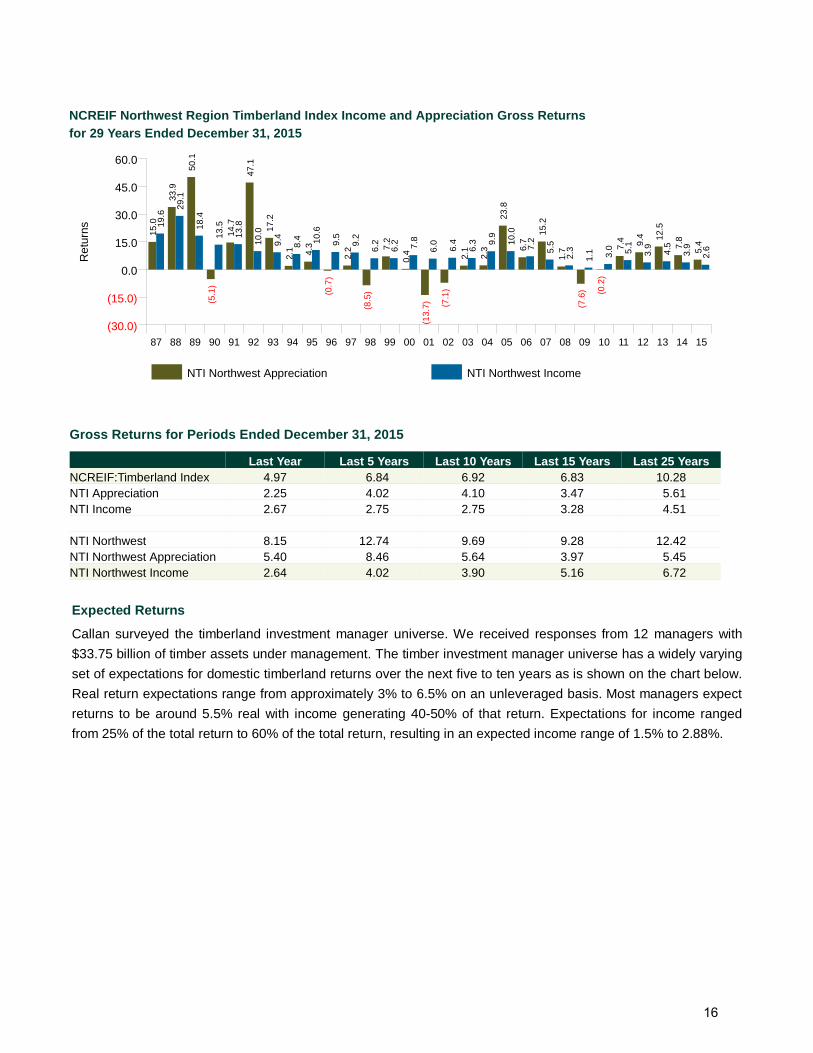
The following chart breaks out the NTI Northwest Index further into the income and appreciation returns generated by timberland in the same region where IDL timber is located. In recent years, both income and appreciation outpace the broader index. The performance of the Idaho properties in the NCREIF Timberland Index cannot be shown as NCREIF does not release data if the sample size is under a certain number of properties.
15
87 88 89 90 91 92 93 94 95 96 97 98 99 00 01 02 03 04 05 06 07 08 09 10 11 12 13 14 15(30.0)
(15.0)
0.0
15.0
30.0
45.0
60.0
for 29 Years Ended December 31, 2015NCREIF Northwest Region Timberland Index Income and Appreciation Gross Returns
Ret
urns
NTI Northwest Appreciation NTI Northwest Income
15.0
33.9
50.1
(5.1
)
14.7
47.1
17.2
2.1 4.3
(0.7
)
2.2
(8.5
)
7.2
0.4
(13.
7) (7.1
)
2.1
2.3
23.8
6.7
15.2
1.7
(7.6
) (0.2
)
7.4 9.4 12
.5
7.8
5.4
19.6
29.1
18.4
13.5
13.8
10.0
9.4
8.4 10
.6
9.5
9.2
6.2
6.2 7.8
6.0
6.4
6.3 9.
9
10.0
7.2
5.5
2.3
1.1 3.0 5.1
3.9
4.5
3.9
2.6
Gross Returns for Periods Ended December 31, 2015
Last Year Last 5 Years Last 10 Years Last 15 Years Last 25 YearsNCREIF:Timberland Index 4.97 6.84 6.92 6.83 10.28NTI Appreciation 2.25 4.02 4.10 3.47 5.61NTI Income 2.67 2.75 2.75 3.28 4.51
NTI Northwest 8.15 12.74 9.69 9.28 12.42NTI Northwest Appreciation 5.40 8.46 5.64 3.97 5.45NTI Northwest Income 2.64 4.02 3.90 5.16 6.72 Expected Returns
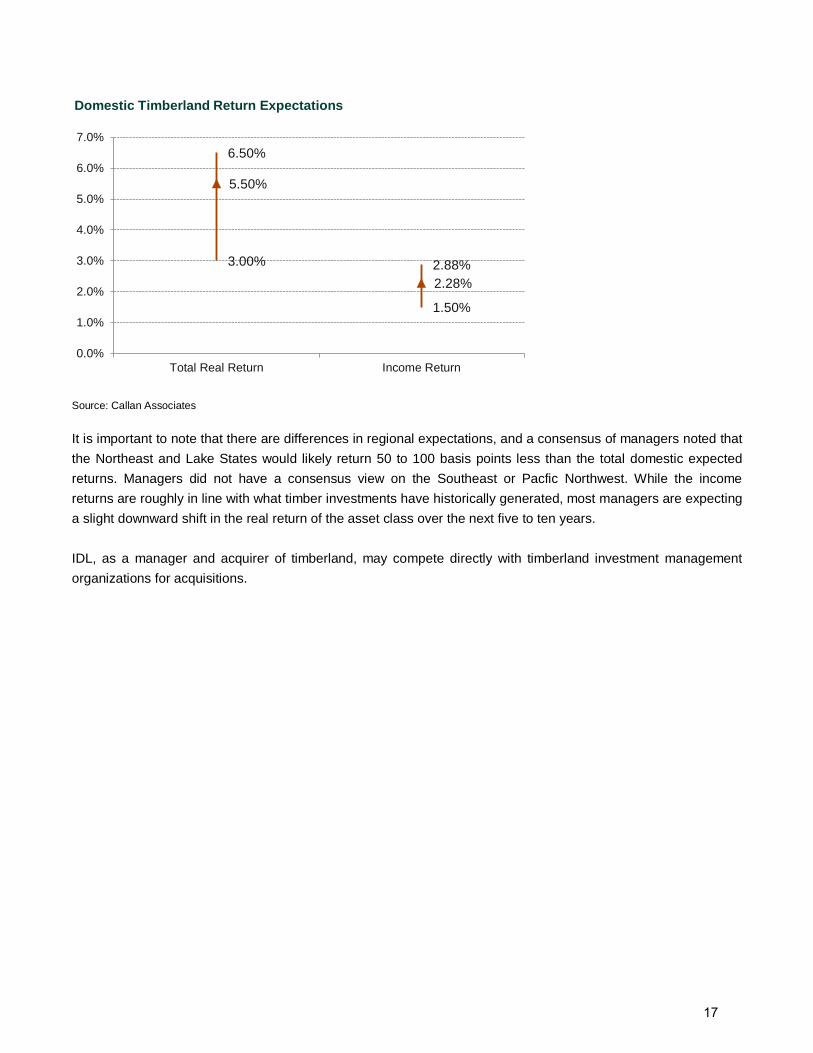
Callan surveyed the timberland investment manager universe. We received responses from 12 managers with $33.75 billion of timber assets under management. The timber investment manager universe has a widely varying set of expectations for domestic timberland returns over the next five to ten years as is shown on the chart below. Real return expectations range from approximately 3% to 6.5% on an unleveraged basis. Most managers expect returns to be around 5.5% real with income generating 40-50% of that return. Expectations for income ranged from 25% of the total return to 60% of the total return, resulting in an expected income range of 1.5% to 2.88%.
16
Source: Callan Associates
It is important to note that there are differences in regional expectations, and a consensus of managers noted that the Northeast and Lake States would likely return 50 to 100 basis points less than the total domestic expected returns. Managers did not have a consensus view on the Southeast or Pacfic Northwest. While the income returns are roughly in line with what timber investments have historically generated, most managers are expecting a slight downward shift in the real return of the asset class over the next five to ten years. IDL, as a manager and acquirer of timberland, may compete directly with timberland investment management organizations for acquisitions.
6.50%
2.88% 3.00%
1.50%
5.50%
2.28%
0.0%
1.0%
2.0%
3.0%
4.0%
5.0%
6.0%
7.0%
Total Real Return Income Return
Domestic Timberland Return Expectations
17
Farmland Market Overview
Farmland Supply and Demand Dynamics
The current outlook for farmland is based on long term positive supply and demand dynamics that support appreciation of both agricultural commodities and farmland. The primary factors supporting the positive long term outlook are increasing global population, a growing middle class in developing economies who demand better diets and more meat, and a relatively fixed supply of farmland around the world. According to projections by the UN FAO under their baseline scenario, between 2005-07 and 2050, world food production needs to increase by 60% to meet increasing demand from population growth. While some additional land has (and may continue to) come into production, rising population has translated to arable land and permanent cropland available for cultivation to decline steadily on a per capital basis.7 Increases in food production will need to come from increases in productivity, not increases in arable land. Productivity gains are no longer outpacing population growth, instead demand growth is outstripping productivity increases which makes the supply of land more valuable. In the near term, macro risks are contributing to decelerating fundamentals and declining prices in some regions of the country. Weaker economic growth, particularly in China and Europe which are key export markets, is contributing to commodity price weakness and reduced demand. Additionally in China, higher currency devaluation and cost cutting at state owned enterprises in response to the government crackdown on corruption is further negatively impacting the demand for many agricultural products. Globally, supplies of commodity crops are at near record levels. There is downward pressure on cash rents in the central region of the United States due to the negative commodity price outlook. Corn, soybean, cotton, rice, and wheat are being adversely affected by low commodity prices putting pressure on rents and values. Nut prices have generally remained stable to strong due to consumer demand which has kept farm profitability and farmland values strong in California. Continually rising nut prices, now in the fourth year, combined with drought conditions in California may point to higher levels of risk for California properties.8 Statewide, properties with that are irrigated have continued to see strong pricing. There are predictions of softening in the market for certain types of nuts including pecans and pistachios due both to supply and demand factors. Almond prices have already declined precipitously due to a drop in overseas demand and a bumper crop domestically. Rising interest rates will increase costs for farm operators and could negatively influence farmland values. Lenders are pulling back on credit particularly in the Corn Belt, creating pressure on farmers. A prolonged strengthening of the dollar could negatively impact exports. Water availability and regulatory risk associated with water resources has moved to the forefront of investors’ minds. Beginning in 2011, cropland values started to show significant per acre value increases before beginning to moderate in the past year, although there are still substantial disparities by region as shown on the next two
7 GMO, “A Farmland Investment Primer,” July 2014 8 Mesirow Financial Agriculture Management 3Q2015 Summary
18
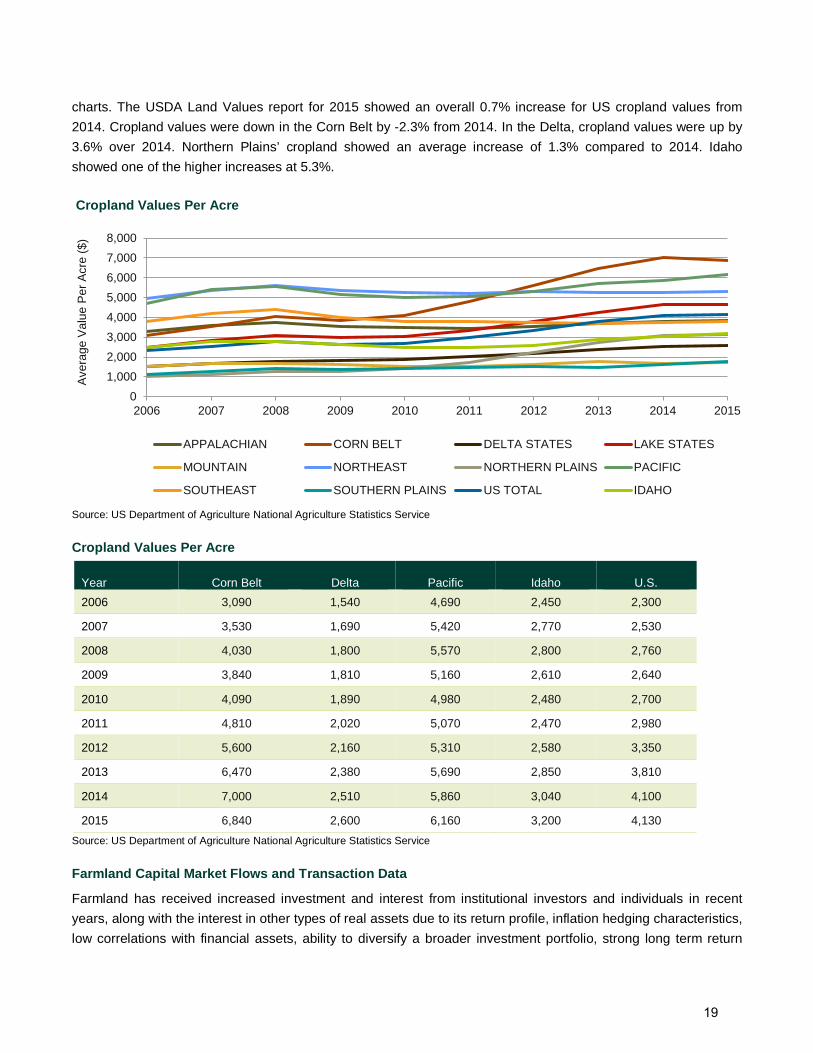
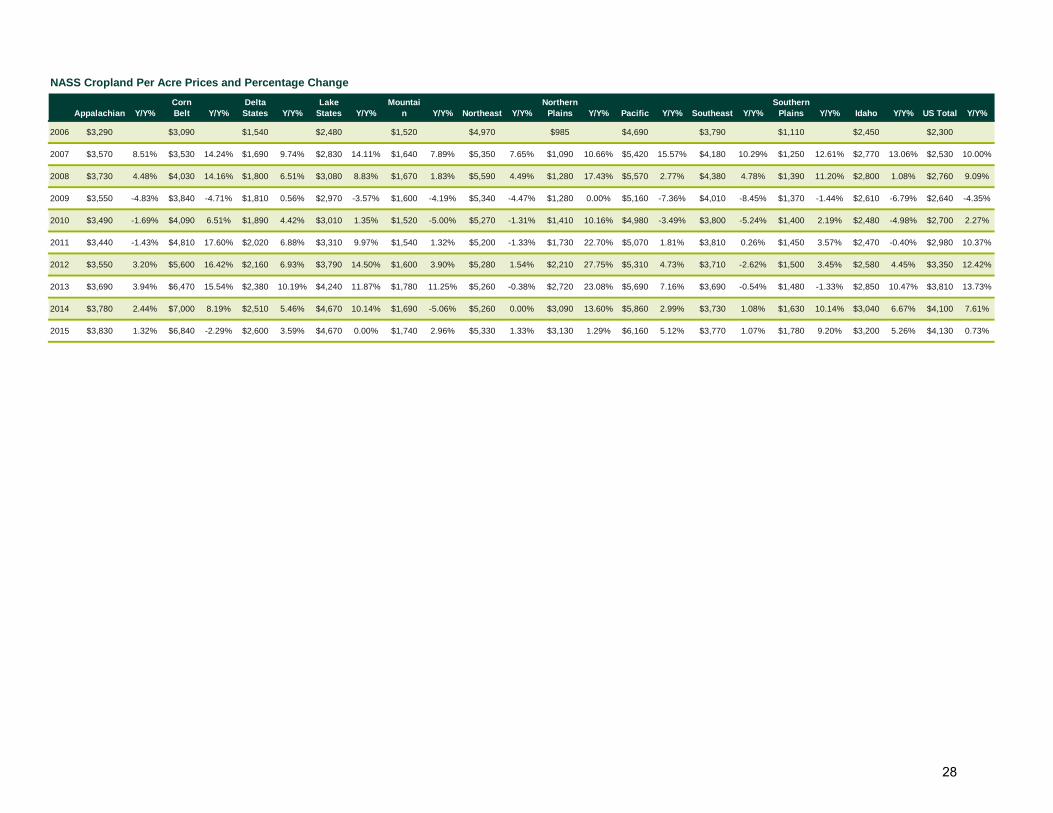
charts. The USDA Land Values report for 2015 showed an overall 0.7% increase for US cropland values from 2014. Cropland values were down in the Corn Belt by -2.3% from 2014. In the Delta, cropland values were up by 3.6% over 2014. Northern Plains’ cropland showed an average increase of 1.3% compared to 2014. Idaho showed one of the higher increases at 5.3%.
Source: US Department of Agriculture National Agriculture Statistics Service
Cropland Values Per Acre
Year Corn Belt Delta Pacific Idaho U.S. 2006 3,090 1,540 4,690 2,450 2,300
2007 3,530 1,690 5,420 2,770 2,530
2008 4,030 1,800 5,570 2,800 2,760
2009 3,840 1,810 5,160 2,610 2,640
2010 4,090 1,890 4,980 2,480 2,700
2011 4,810 2,020 5,070 2,470 2,980
2012 5,600 2,160 5,310 2,580 3,350
2013 6,470 2,380 5,690 2,850 3,810
2014 7,000 2,510 5,860 3,040 4,100
2015 6,840 2,600 6,160 3,200 4,130 Source: US Department of Agriculture National Agriculture Statistics Service
Farmland Capital Market Flows and Transaction Data
Farmland has received increased investment and interest from institutional investors and individuals in recent years, along with the interest in other types of real assets due to its return profile, inflation hedging characteristics, low correlations with financial assets, ability to diversify a broader investment portfolio, strong long term return
01,0002,0003,0004,0005,0006,0007,0008,000
2006 2007 2008 2009 2010 2011 2012 2013 2014 2015
Ave
rage
Val
ue P
er A
cre
($)
Cropland Values Per Acre
APPALACHIAN CORN BELT DELTA STATES LAKE STATES
MOUNTAIN NORTHEAST NORTHERN PLAINS PACIFIC
SOUTHEAST SOUTHERN PLAINS US TOTAL IDAHO
19
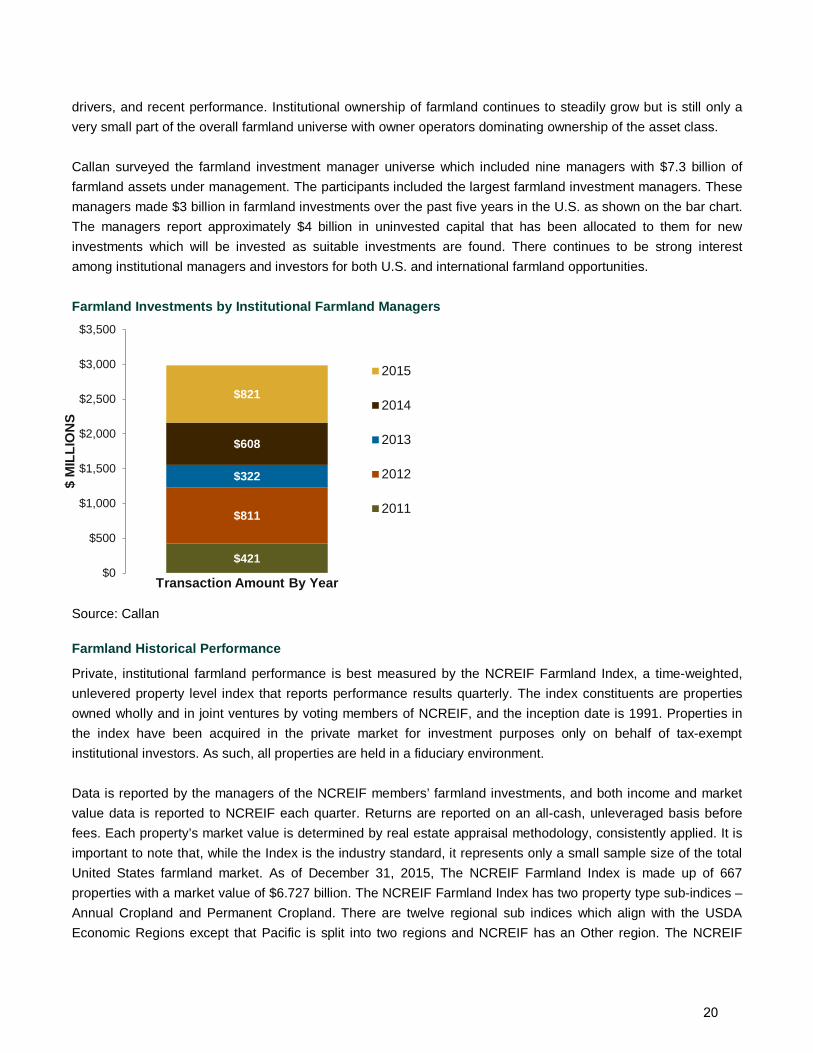
drivers, and recent performance. Institutional ownership of farmland continues to steadily grow but is still only a very small part of the overall farmland universe with owner operators dominating ownership of the asset class. Callan surveyed the farmland investment manager universe which included nine managers with $7.3 billion of farmland assets under management. The participants included the largest farmland investment managers. These managers made $3 billion in farmland investments over the past five years in the U.S. as shown on the bar chart. The managers report approximately $4 billion in uninvested capital that has been allocated to them for new investments which will be invested as suitable investments are found. There continues to be strong interest among institutional managers and investors for both U.S. and international farmland opportunities. Farmland Investments by Institutional Farmland Managers
Source: Callan
Farmland Historical Performance
Private, institutional farmland performance is best measured by the NCREIF Farmland Index, a time-weighted, unlevered property level index that reports performance results quarterly. The index constituents are properties owned wholly and in joint ventures by voting members of NCREIF, and the inception date is 1991. Properties in the index have been acquired in the private market for investment purposes only on behalf of tax-exempt institutional investors. As such, all properties are held in a fiduciary environment. Data is reported by the managers of the NCREIF members’ farmland investments, and both income and market value data is reported to NCREIF each quarter. Returns are reported on an all-cash, unleveraged basis before fees. Each property’s market value is determined by real estate appraisal methodology, consistently applied. It is important to note that, while the Index is the industry standard, it represents only a small sample size of the total United States farmland market. As of December 31, 2015, The NCREIF Farmland Index is made up of 667 properties with a market value of $6.727 billion. The NCREIF Farmland Index has two property type sub-indices – Annual Cropland and Permanent Cropland. There are twelve regional sub indices which align with the USDA Economic Regions except that Pacific is split into two regions and NCREIF has an Other region. The NCREIF
$421
$811
$322
$608
$821
$0
$500
$1,000
$1,500
$2,000
$2,500
$3,000
$3,500
$ M
ILLI
ON
S
Transaction Amount By Year
2015
2014
2013
2012
2011
20
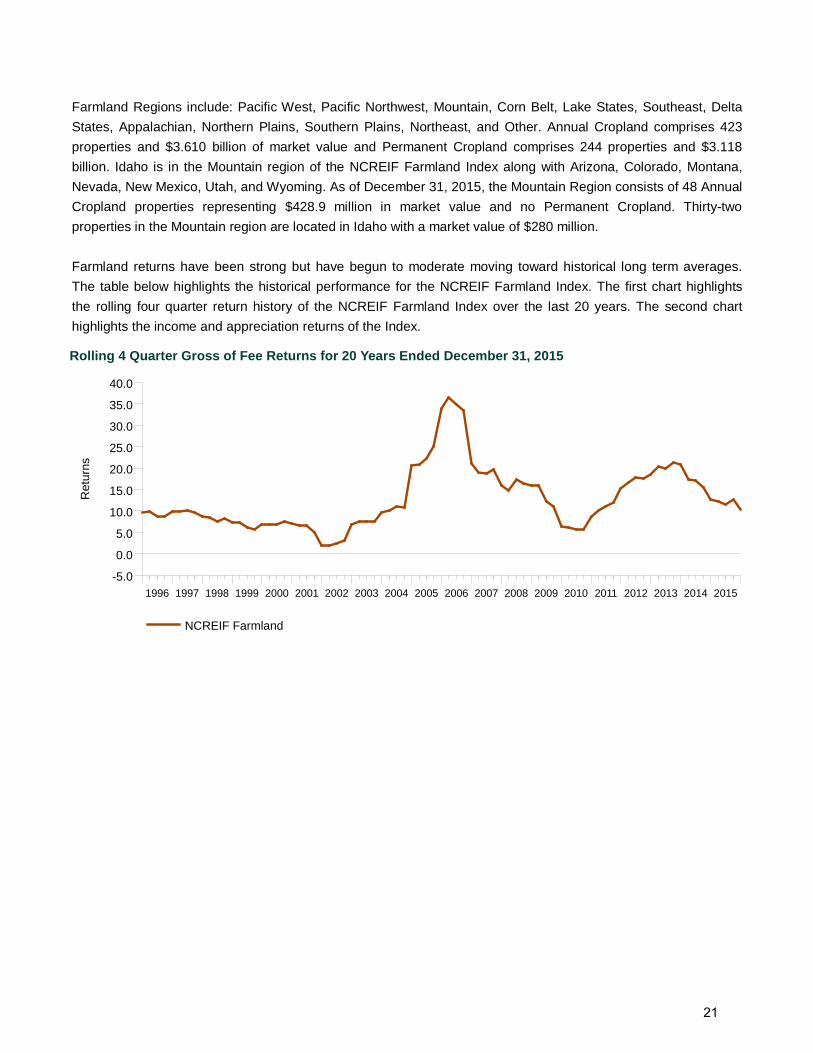
Farmland Regions include: Pacific West, Pacific Northwest, Mountain, Corn Belt, Lake States, Southeast, Delta States, Appalachian, Northern Plains, Southern Plains, Northeast, and Other. Annual Cropland comprises 423 properties and $3.610 billion of market value and Permanent Cropland comprises 244 properties and $3.118 billion. Idaho is in the Mountain region of the NCREIF Farmland Index along with Arizona, Colorado, Montana, Nevada, New Mexico, Utah, and Wyoming. As of December 31, 2015, the Mountain Region consists of 48 Annual Cropland properties representing $428.9 million in market value and no Permanent Cropland. Thirty-two properties in the Mountain region are located in Idaho with a market value of $280 million. Farmland returns have been strong but have begun to moderate moving toward historical long term averages. The table below highlights the historical performance for the NCREIF Farmland Index. The first chart highlights the rolling four quarter return history of the NCREIF Farmland Index over the last 20 years. The second chart highlights the income and appreciation returns of the Index.
1996 1997 1998 1999 2000 2001 2002 2003 2004 2005 2006 2007 2008 2009 2010 2011 2012 2013 2014 2015-5.0
0.0
5.0
10.0
15.0
20.0
25.0
30.0
35.0
40.0
Rolling 4 Quarter Gross of Fee Returns for 20 Years Ended December 31, 2015
Ret
urns
NCREIF Farmland
21
91 92 93 94 95 96 97 98 99 00 01 02 03 04 05 06 07 08 09 10 11 12 13 14 15-10.0
-5.0
0.0
5.0
10.0
15.0
20.0
25.0
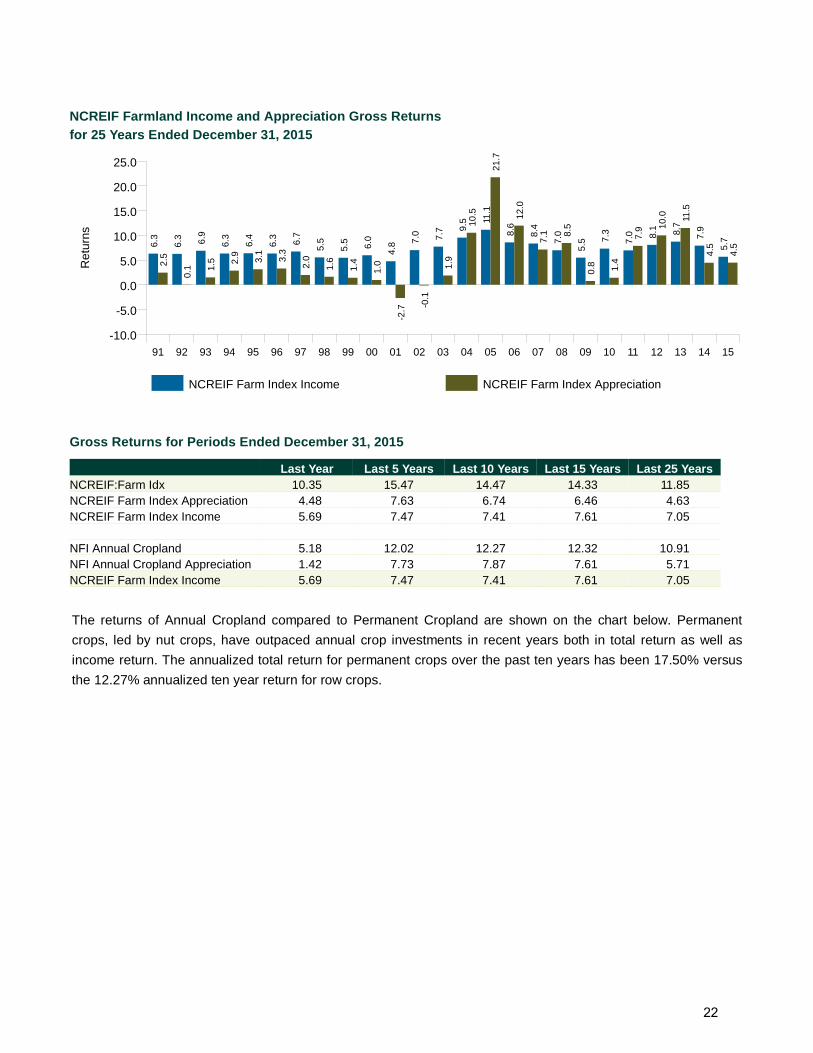
for 25 Years Ended December 31, 2015NCREIF Farmland Income and Appreciation Gross Returns
Ret
urns
NCREIF Farm Index Income NCREIF Farm Index Appreciation
6.3
6.3 6.9
6.3
6.4
6.3 6.7
5.5
5.5 6.0
4.8 7.
0 7.7 9.
5 11.1
8.6
8.4
7.0
5.5 7.
3
7.0 8.
1 8.7
7.9
5.7
2.5
0.1 1.
5 2.9
3.1
3.3
2.0
1.6
1.4
1.0
-2.7 -0
.1
1.9
10.5
21.7
12.0
7.1 8.
5
0.8 1.4
7.9 10
.0 11.5
4.5
4.5
Gross Returns for Periods Ended December 31, 2015
Last Year Last 5 Years Last 10 Years Last 15 Years Last 25 YearsNCREIF:Farm Idx 10.35 15.47 14.47 14.33 11.85NCREIF Farm Index Appreciation 4.48 7.63 6.74 6.46 4.63NCREIF Farm Index Income 5.69 7.47 7.41 7.61 7.05
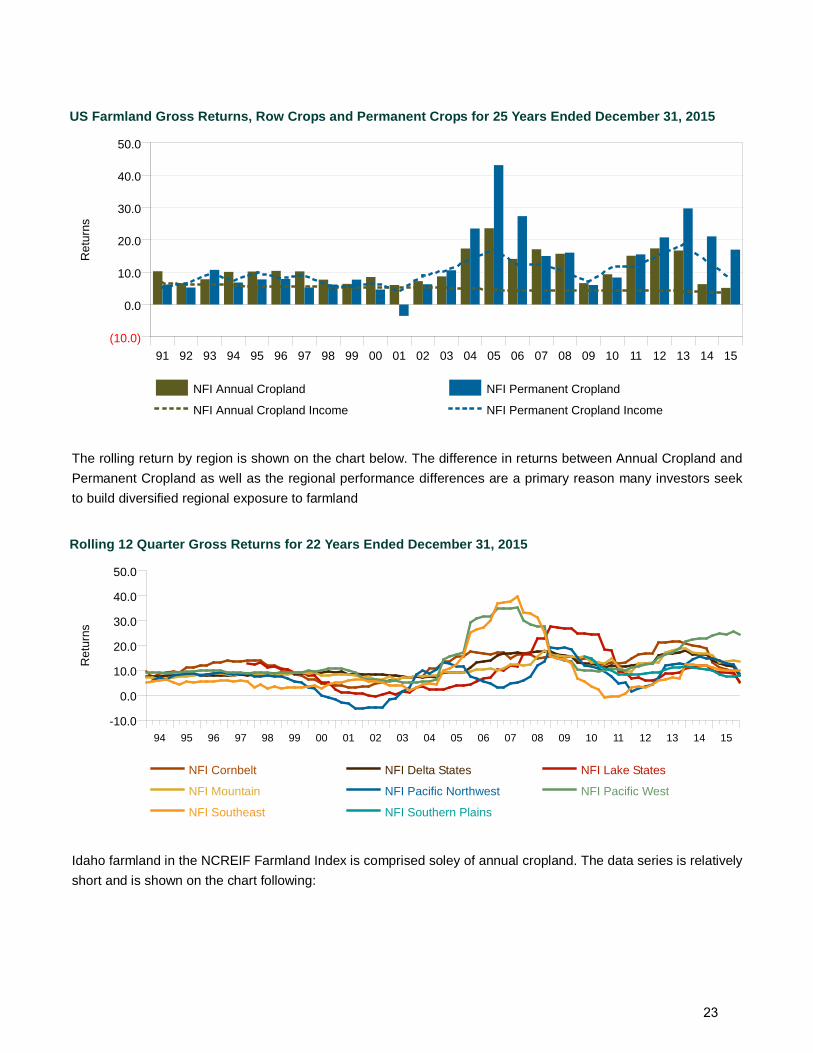
NFI Annual Cropland 5.18 12.02 12.27 12.32 10.91NFI Annual Cropland Appreciation 1.42 7.73 7.87 7.61 5.71NCREIF Farm Index Income 5.69 7.47 7.41 7.61 7.05 The returns of Annual Cropland compared to Permanent Cropland are shown on the chart below. Permanent crops, led by nut crops, have outpaced annual crop investments in recent years both in total return as well as income return. The annualized total return for permanent crops over the past ten years has been 17.50% versus the 12.27% annualized ten year return for row crops.
22
91 92 93 94 95 96 97 98 99 00 01 02 03 04 05 06 07 08 09 10 11 12 13 14 15(10.0)
0.0
10.0
20.0
30.0
40.0
50.0
US Farmland Gross Returns, Row Crops and Permanent Crops for 25 Years Ended December 31, 2015
Ret
urns
NFI Annual Cropland NFI Permanent Cropland
NFI Annual Cropland Income NFI Permanent Cropland Income
The rolling return by region is shown on the chart below. The difference in returns between Annual Cropland and Permanent Cropland as well as the regional performance differences are a primary reason many investors seek to build diversified regional exposure to farmland
94 95 96 97 98 99 00 01 02 03 04 05 06 07 08 09 10 11 12 13 14 15-10.0
0.0
10.0
20.0
30.0
40.0
50.0
Rolling 12 Quarter Gross Returns for 22 Years Ended December 31, 2015
NFI Cornbelt NFI Delta States NFI Lake States
NFI Mountain NFI Pacific Northwest NFI Pacific West
NFI Southeast NFI Southern Plains
Ret
urns
Idaho farmland in the NCREIF Farmland Index is comprised soley of annual cropland. The data series is relatively short and is shown on the chart following:
23
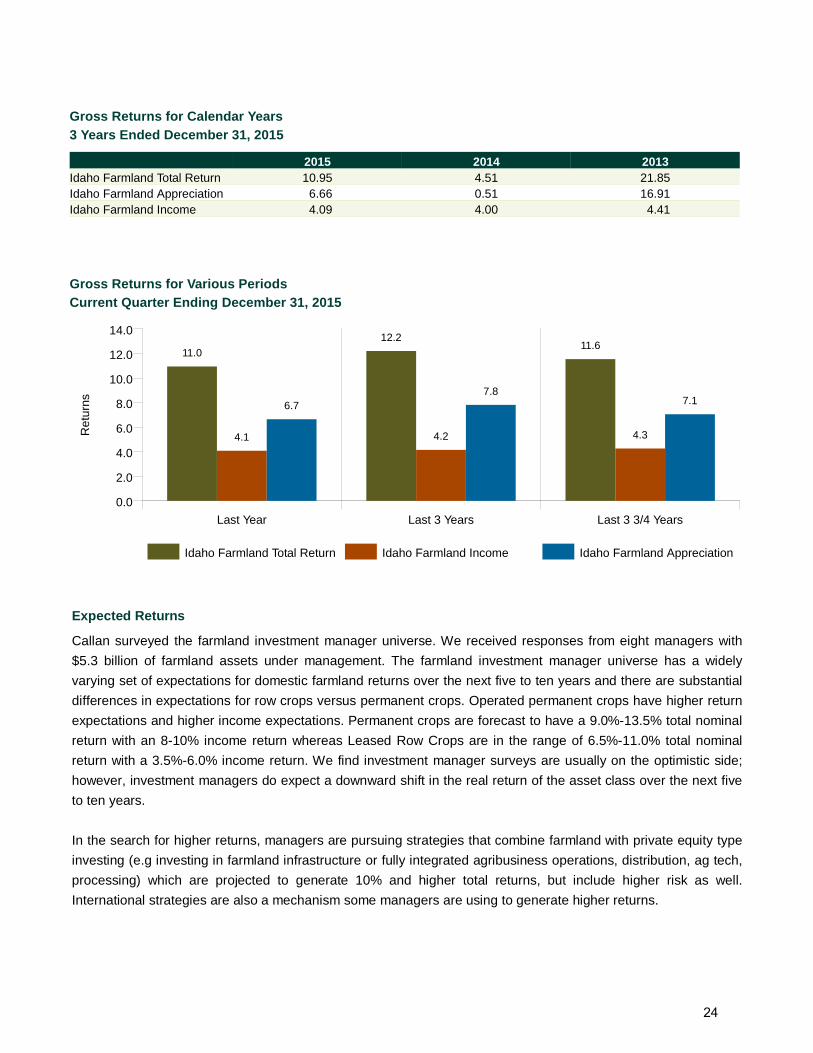
3 Years Ended December 31, 2015Gross Returns for Calendar Years
2015 2014 2013Idaho Farmland Total Return 10.95 4.51 21.85Idaho Farmland Appreciation 6.66 0.51 16.91Idaho Farmland Income 4.09 4.00 4.41
Last Year Last 3 Years Last 3 3/4 Years0.0
2.0
4.0
6.0
8.0
10.0
12.0
14.0
Current Quarter Ending December 31, 2015Gross Returns for Various Periods
Ret
urns
Idaho Farmland Total Return Idaho Farmland Income Idaho Farmland Appreciation
11.012.2
11.6
4.1 4.2 4.3
6.77.8
7.1
Expected Returns
Callan surveyed the farmland investment manager universe. We received responses from eight managers with $5.3 billion of farmland assets under management. The farmland investment manager universe has a widely varying set of expectations for domestic farmland returns over the next five to ten years and there are substantial differences in expectations for row crops versus permanent crops. Operated permanent crops have higher return expectations and higher income expectations. Permanent crops are forecast to have a 9.0%-13.5% total nominal return with an 8-10% income return whereas Leased Row Crops are in the range of 6.5%-11.0% total nominal return with a 3.5%-6.0% income return. We find investment manager surveys are usually on the optimistic side; however, investment managers do expect a downward shift in the real return of the asset class over the next five to ten years. In the search for higher returns, managers are pursuing strategies that combine farmland with private equity type investing (e.g investing in farmland infrastructure or fully integrated agribusiness operations, distribution, ag tech, processing) which are projected to generate 10% and higher total returns, but include higher risk as well. International strategies are also a mechanism some managers are using to generate higher returns.
24
Ways to Invest in Farmland
Institutional investors invest in farmland primarily through the use of a specialist farmland investment managers. Making farmland investments and managing them directly using in house staff, like IDL, is not typical due to the complexity, specialist knowledge of farmland, time required to assemble a diversified portfolio of farmland, and to retain, on staff, the expertise to properly oversee and manage those investments. Investing via a farmland investment manager provides diversification, experience, scale, and confidence that best in class farm management practices are being implemented. Investment programs are implemented through pooled investment vehicles, including open end and closed end funds, or separately managed accounts. There is one institutionally recognized farmland open end fund and a few other open end funds focused on individual investors. The institutional open end fund is broadly diversified across the U.S. farmland sector by permanent and row crops as well as geography and has a long track record. Closed end funds may pursue higher risk strategies that may use leverage and combine farmland with private equity type investing discussed earlier or international strategies. Separate accounts require a larger amount of capital than fund investments, typically at least $50 million. Investment management fees range from 50 to 100 basis points on the net asset value of the account. Separate accounts provide a higher level of control to the investor and are customizable according to investor needs. Typically the farmland investment manager operates within pre-set guidelines established at the inception of the account and approved annually by the investor. Acquisitions and dispositions in an account are approved by the investment committee of the investment manager provided they are within the established guidelines. Some investors require the manager to obtain approval for all transactions from the investor’s investment committee or similar decision-making board; however this process may put the investor at a disadvantage due to the uncertainty it creates and additional time required to close a transaction. In a separate account, an investor has the ability to to terminate the advisor at any time and move the assets to another manager, which fosters greater manager accountability. Investors can also access farmland through public REITs. The universe of farmland REITs is very small and very new. There are three farmland REITs including: Gladstone Land Corp. (LAND), with an inception date of 2013, Farmland Partners Inc. (FPI), with an inception date of 2014, and American Farmland Co. (AFCO), which held its initial public offering in 2015. The lack of track record, size of each company, and amount of leverage represent significant risks making implementation via the public markets unattractive for now. A major consideration in developing a farmland investment strategy is risk tolerance and where an investor wants to be in the value chain. The basic building blocks to any portfolio are permanent plantings and row crops. Because of the significant investment in living improvements, permanent plantings are generally direct operated with the investor bearing all the volatility and risk of crop yield and commodity price. This is contrasted to row crops where the norm is cash leasing to an operator who bears the production and commodity price risk. The chart below provides an overview of different risk scenarios and provides a context for evaluating an investor’s risk tolerance and relative risk in an existing portfolio of farmland.
25
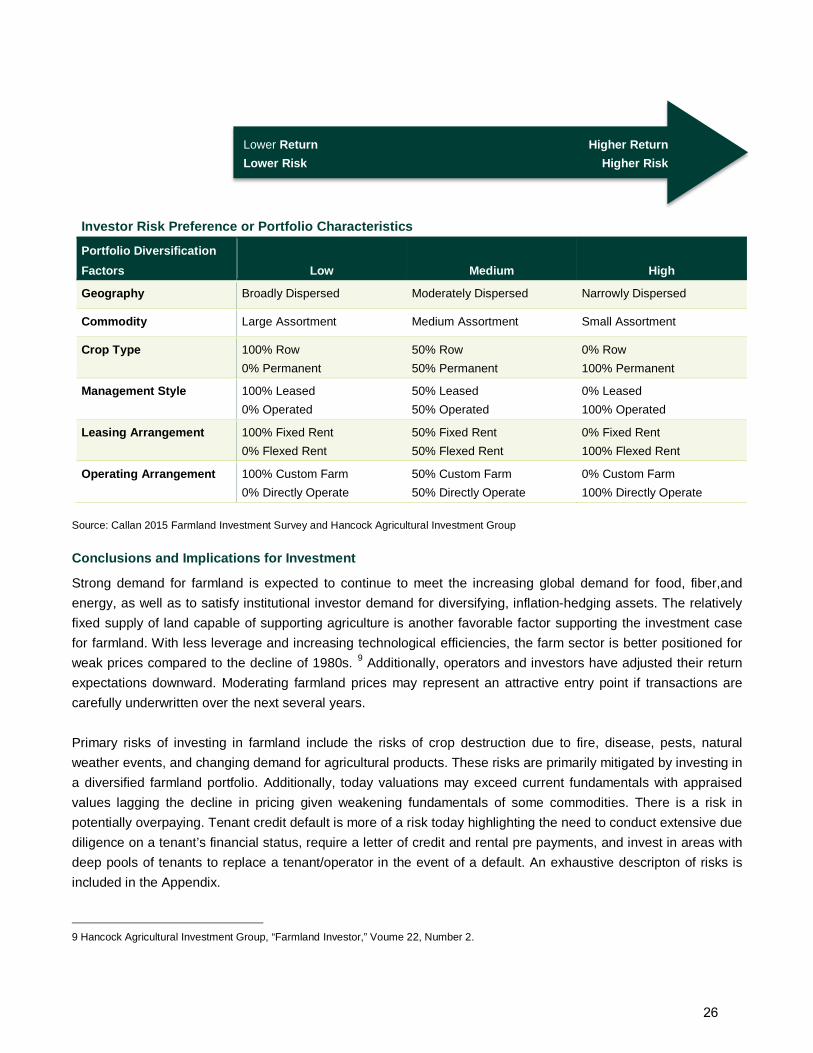
Investor Risk Preference or Portfolio Characteristics
Portfolio Diversification Factors Low Medium High
Geography Broadly Dispersed Moderately Dispersed Narrowly Dispersed
Commodity Large Assortment Medium Assortment Small Assortment
Crop Type 100% Row 0% Permanent
50% Row 50% Permanent
0% Row 100% Permanent
Management Style 100% Leased 0% Operated
50% Leased 50% Operated
0% Leased 100% Operated
Leasing Arrangement 100% Fixed Rent 0% Flexed Rent
50% Fixed Rent 50% Flexed Rent
0% Fixed Rent 100% Flexed Rent
Operating Arrangement 100% Custom Farm 0% Directly Operate
50% Custom Farm 50% Directly Operate
0% Custom Farm 100% Directly Operate
Source: Callan 2015 Farmland Investment Survey and Hancock Agricultural Investment Group
Conclusions and Implications for Investment
Strong demand for farmland is expected to continue to meet the increasing global demand for food, fiber,and energy, as well as to satisfy institutional investor demand for diversifying, inflation-hedging assets. The relatively fixed supply of land capable of supporting agriculture is another favorable factor supporting the investment case for farmland. With less leverage and increasing technological efficiencies, the farm sector is better positioned for weak prices compared to the decline of 1980s. 9 Additionally, operators and investors have adjusted their return expectations downward. Moderating farmland prices may represent an attractive entry point if transactions are carefully underwritten over the next several years. Primary risks of investing in farmland include the risks of crop destruction due to fire, disease, pests, natural weather events, and changing demand for agricultural products. These risks are primarily mitigated by investing in a diversified farmland portfolio. Additionally, today valuations may exceed current fundamentals with appraised values lagging the decline in pricing given weakening fundamentals of some commodities. There is a risk in potentially overpaying. Tenant credit default is more of a risk today highlighting the need to conduct extensive due diligence on a tenant’s financial status, require a letter of credit and rental pre payments, and invest in areas with deep pools of tenants to replace a tenant/operator in the event of a default. An exhaustive descripton of risks is included in the Appendix. 9 Hancock Agricultural Investment Group, “Farmland Investor,” Voume 22, Number 2.
Lower Return Higher Return Lower Risk Higher Risk
26
The pace of investment in farmland is typically slower than timberland or commercial real estate due to the the limited pool of investment transactions every year. There is not a pool of closed end funds that are reaching maturity and selling assets like in timberland. Investors tend to buy and hold, the asset class is popular with significant competition for transactions, and operators/farmers have had strong balance sheets for acquiring farmland, with limited incentive to sell. There is an expectation by farmland managers that current relatively weak fundamentals may be a catalyst for weaker, marginal farmers/owners to sell their land. Some expect that stronger farmers may stay on the sidelines with regard to new acquisitions, again due to the state of the market. Access to transaction deal flow via relationships with institutional and local owner/operators is critical to building a portfolio. Investors must have an appropriately long term time frame to acquire a diversified portfolio of farmland, typically at least five years. The timeframe is similar for direct acquisitions in a separate account as well as investing via the open end fund. Investment horizons for closed end fund investments span from 10 to 15 years.
27
NASS Cropland Per Acre Prices and Percentage Change
Appalachian Y/Y%Corn Belt Y/Y%
Delta States Y/Y%
Lake States Y/Y%
Mountain Y/Y% Northeast Y/Y%
Northern Plains Y/Y% Pacific Y/Y% Southeast Y/Y%
Southern Plains Y/Y% Idaho Y/Y% US Total Y/Y%
2006 $3,290 $3,090 $1,540 $2,480 $1,520 $4,970 $985 $4,690 $3,790 $1,110 $2,450 $2,300
2007 $3,570 8.51% $3,530 14.24% $1,690 9.74% $2,830 14.11% $1,640 7.89% $5,350 7.65% $1,090 10.66% $5,420 15.57% $4,180 10.29% $1,250 12.61% $2,770 13.06% $2,530 10.00%
2008 $3,730 4.48% $4,030 14.16% $1,800 6.51% $3,080 8.83% $1,670 1.83% $5,590 4.49% $1,280 17.43% $5,570 2.77% $4,380 4.78% $1,390 11.20% $2,800 1.08% $2,760 9.09%
2009 $3,550 -4.83% $3,840 -4.71% $1,810 0.56% $2,970 -3.57% $1,600 -4.19% $5,340 -4.47% $1,280 0.00% $5,160 -7.36% $4,010 -8.45% $1,370 -1.44% $2,610 -6.79% $2,640 -4.35%
2010 $3,490 -1.69% $4,090 6.51% $1,890 4.42% $3,010 1.35% $1,520 -5.00% $5,270 -1.31% $1,410 10.16% $4,980 -3.49% $3,800 -5.24% $1,400 2.19% $2,480 -4.98% $2,700 2.27%
2011 $3,440 -1.43% $4,810 17.60% $2,020 6.88% $3,310 9.97% $1,540 1.32% $5,200 -1.33% $1,730 22.70% $5,070 1.81% $3,810 0.26% $1,450 3.57% $2,470 -0.40% $2,980 10.37%
2012 $3,550 3.20% $5,600 16.42% $2,160 6.93% $3,790 14.50% $1,600 3.90% $5,280 1.54% $2,210 27.75% $5,310 4.73% $3,710 -2.62% $1,500 3.45% $2,580 4.45% $3,350 12.42%
2013 $3,690 3.94% $6,470 15.54% $2,380 10.19% $4,240 11.87% $1,780 11.25% $5,260 -0.38% $2,720 23.08% $5,690 7.16% $3,690 -0.54% $1,480 -1.33% $2,850 10.47% $3,810 13.73%
2014 $3,780 2.44% $7,000 8.19% $2,510 5.46% $4,670 10.14% $1,690 -5.06% $5,260 0.00% $3,090 13.60% $5,860 2.99% $3,730 1.08% $1,630 10.14% $3,040 6.67% $4,100 7.61%
2015 $3,830 1.32% $6,840 -2.29% $2,600 3.59% $4,670 0.00% $1,740 2.96% $5,330 1.33% $3,130 1.29% $6,160 5.12% $3,770 1.07% $1,780 9.20% $3,200 5.26% $4,130 0.73%
28
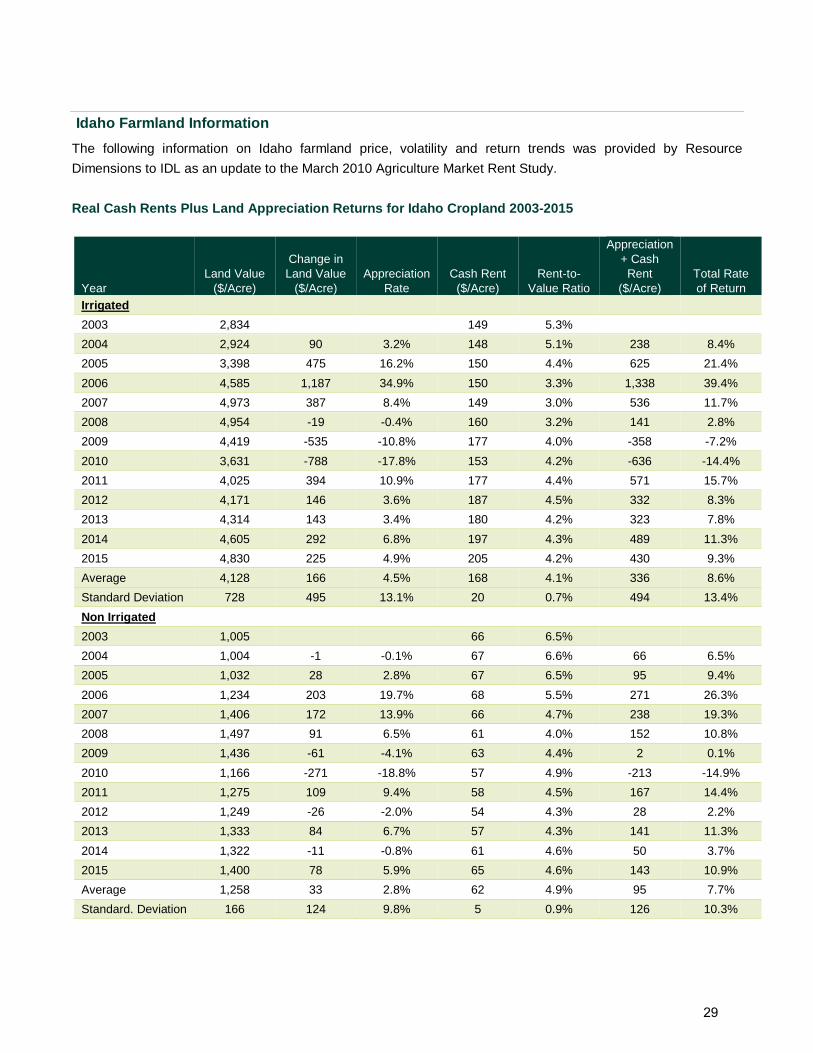
Idaho Farmland Information The following information on Idaho farmland price, volatility and return trends was provided by Resource Dimensions to IDL as an update to the March 2010 Agriculture Market Rent Study. Real Cash Rents Plus Land Appreciation Returns for Idaho Cropland 2003-2015
Year Land Value
($/Acre)
Change in Land Value
($/Acre) Appreciation
Rate Cash Rent
($/Acre) Rent-to-
Value Ratio
Appreciation + Cash Rent
($/Acre) Total Rate of Return
Irrigated 2003 2,834 149 5.3% 2004 2,924 90 3.2% 148 5.1% 238 8.4% 2005 3,398 475 16.2% 150 4.4% 625 21.4% 2006 4,585 1,187 34.9% 150 3.3% 1,338 39.4% 2007 4,973 387 8.4% 149 3.0% 536 11.7% 2008 4,954 -19 -0.4% 160 3.2% 141 2.8% 2009 4,419 -535 -10.8% 177 4.0% -358 -7.2% 2010 3,631 -788 -17.8% 153 4.2% -636 -14.4% 2011 4,025 394 10.9% 177 4.4% 571 15.7% 2012 4,171 146 3.6% 187 4.5% 332 8.3% 2013 4,314 143 3.4% 180 4.2% 323 7.8% 2014 4,605 292 6.8% 197 4.3% 489 11.3% 2015 4,830 225 4.9% 205 4.2% 430 9.3% Average 4,128 166 4.5% 168 4.1% 336 8.6% Standard Deviation 728 495 13.1% 20 0.7% 494 13.4% Non Irrigated 2003 1,005 66 6.5% 2004 1,004 -1 -0.1% 67 6.6% 66 6.5% 2005 1,032 28 2.8% 67 6.5% 95 9.4% 2006 1,234 203 19.7% 68 5.5% 271 26.3% 2007 1,406 172 13.9% 66 4.7% 238 19.3% 2008 1,497 91 6.5% 61 4.0% 152 10.8% 2009 1,436 -61 -4.1% 63 4.4% 2 0.1% 2010 1,166 -271 -18.8% 57 4.9% -213 -14.9% 2011 1,275 109 9.4% 58 4.5% 167 14.4% 2012 1,249 -26 -2.0% 54 4.3% 28 2.2% 2013 1,333 84 6.7% 57 4.3% 141 11.3% 2014 1,322 -11 -0.8% 61 4.6% 50 3.7% 2015 1,400 78 5.9% 65 4.6% 143 10.9% Average 1,258 33 2.8% 62 4.9% 95 7.7% Standard. Deviation 166 124 9.8% 5 0.9% 126 10.3%
29
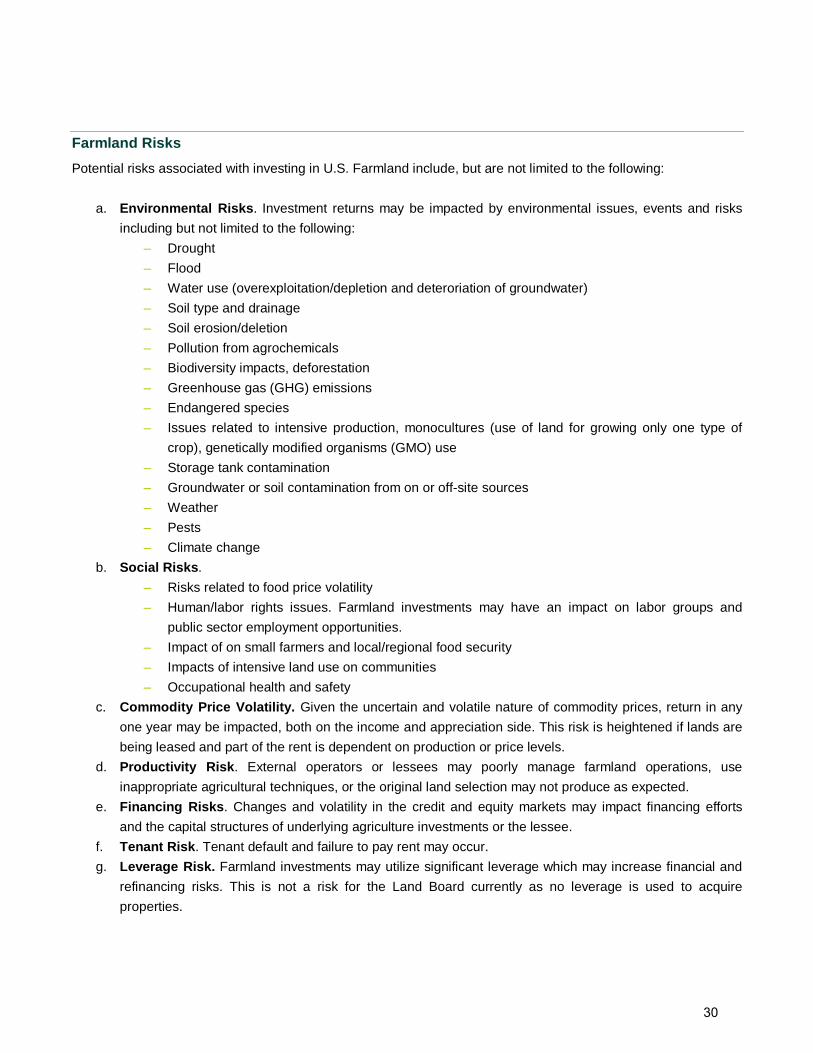
Farmland Risks Potential risks associated with investing in U.S. Farmland include, but are not limited to the following:
a. Environmental Risks. Investment returns may be impacted by environmental issues, events and risks including but not limited to the following:
– Drought – Flood – Water use (overexploitation/depletion and deteroriation of groundwater) – Soil type and drainage – Soil erosion/deletion – Pollution from agrochemicals – Biodiversity impacts, deforestation – Greenhouse gas (GHG) emissions – Endangered species – Issues related to intensive production, monocultures (use of land for growing only one type of
crop), genetically modified organisms (GMO) use – Storage tank contamination – Groundwater or soil contamination from on or off-site sources – Weather – Pests – Climate change
b. Social Risks. – Risks related to food price volatility – Human/labor rights issues. Farmland investments may have an impact on labor groups and
public sector employment opportunities. – Impact of on small farmers and local/regional food security – Impacts of intensive land use on communities – Occupational health and safety
c. Commodity Price Volatility. Given the uncertain and volatile nature of commodity prices, return in any one year may be impacted, both on the income and appreciation side. This risk is heightened if lands are being leased and part of the rent is dependent on production or price levels.
d. Productivity Risk. External operators or lessees may poorly manage farmland operations, use inappropriate agricultural techniques, or the original land selection may not produce as expected.
e. Financing Risks. Changes and volatility in the credit and equity markets may impact financing efforts and the capital structures of underlying agriculture investments or the lessee.
f. Tenant Risk. Tenant default and failure to pay rent may occur. g. Leverage Risk. Farmland investments may utilize significant leverage which may increase financial and
refinancing risks. This is not a risk for the Land Board currently as no leverage is used to acquire properties.
30
h. Liquidity Risk. As farmland investments may have long durations, they often are illiquid. Secondary markets for agriculture or farmland partnership investments may not be fully established or may provide limited opportunities.
i. Market Risk. The farmland market is a developing market globally and investment opportunities may be impacted by market supply and demand.
j. Political and Headline Risks. Agriculture or Farmland investments may involve political activities and may introduce headline risk to investors. Politics may impact the global trade of agriculture commodities. Politics may influence returns through adjustments to subsidies and bio-fuel mandates. Politics and regulations may impact water rights and water usage.
k. Regulatory Risk. Changes in regulatory mandates may impact investment returns and strategies. l. Management. The investment manager universe for farmland investment is limited. Few institutional
options are available which could impact manager diversification and manager substitution, if the need were to arise. The Land Board has chosen to use IDL as the internal manager and is dependent on one entity for management.
There are additional risks associated with investing in non-U.S. farmland that are not included in this document.
31
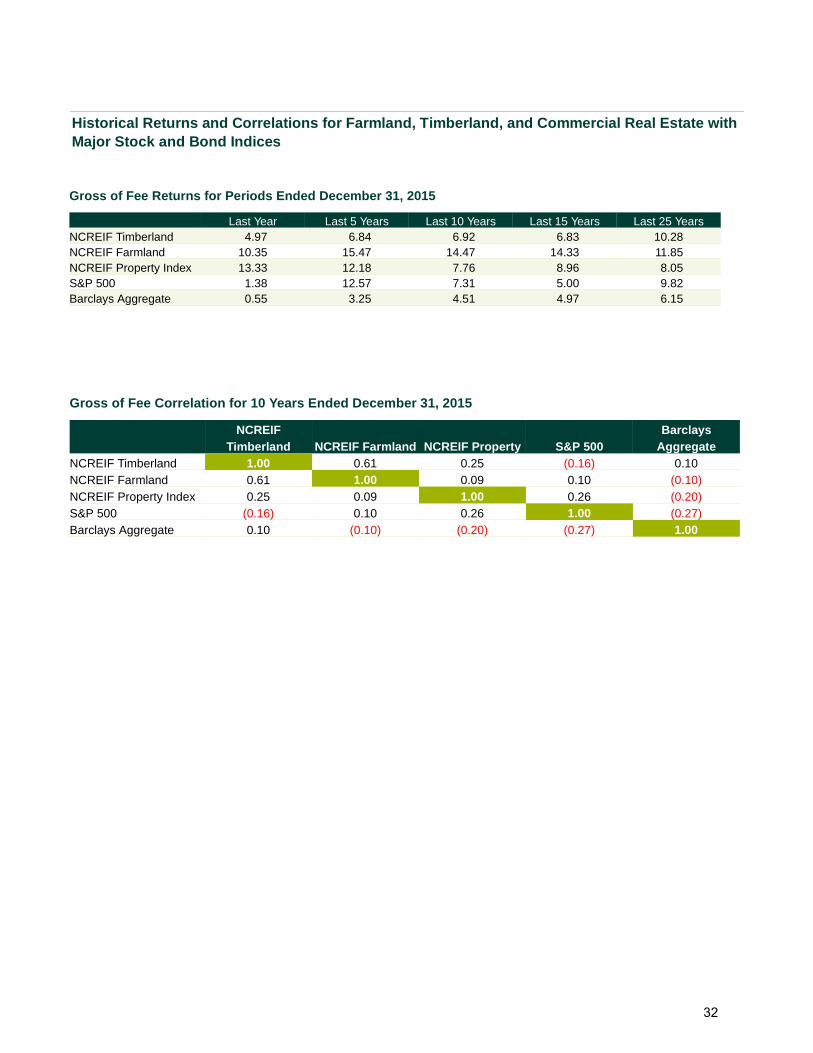
Historical Returns and Correlations for Farmland, Timberland, and Commercial Real Estate with Major Stock and Bond Indices
Gross of Fee Returns for Periods Ended December 31, 2015
Last Year Last 5 Years Last 10 Years Last 15 Years Last 25 YearsNCREIF Timberland 4.97 6.84 6.92 6.83 10.28NCREIF Farmland 10.35 15.47 14.47 14.33 11.85NCREIF Property Index 13.33 12.18 7.76 8.96 8.05S&P 500 1.38 12.57 7.31 5.00 9.82Barclays Aggregate 0.55 3.25 4.51 4.97 6.15
Gross of Fee Correlation for 10 Years Ended December 31, 2015
TimberlandNCREIF
NCREIF Farmland NCREIF Property S&P 500 AggregateBarclays
NCREIF Timberland 1.00 0.61 0.25 (0.16) 0.10NCREIF Farmland 0.61 1.00 0.09 0.10 (0.10)NCREIF Property Index 0.25 0.09 1.00 0.26 (0.20)S&P 500 (0.16) 0.10 0.26 1.00 (0.27)Barclays Aggregate 0.10 (0.10) (0.20) (0.27) 1.00
32
Glossary of Terms Appraisal – An estimate or opinion of market value. Appreciation – The percentage change in the market value of a property or portfolio over the period of analysis. Asset Management – The various disciplines involved with managing real property assets from the time of investment through the time of disposition. Proper asset management plans and policies include: requirements for operating and capital budgets, property management, leasing, physical property analysis, operational and financial reporting, appraisal, audits, accounting policies and asset disposition plans (hold/sell analyses). Benchmark – An index derived from database information that allows for comparative performance evaluation within an asset class. Capital Improvements – Expenditures that cure or arrest deterioration of assets or add new improvements to prolong their lives. Core Investment – Typical Core portfolio investments shall be mature, brownfield/existing assets that produce steady and predictable cash flows. These assets should be difficult to replicate and will be long life assets. The assets shall be located in well established markets. Commingled Fund – A term applied to all open-ended and closed-ended pooled investment vehicles designed for institutional tax-exempt investors. A commingled fund may be organized as a group trust, partnership, corporation, insurance company separate account, private real estate investment trust or other multiple ownership entity. • Open-ended Fund – A commingled fund with no finite life, which allows continuous entry and exit of investors
and typically engages in ongoing investment purchase and sale activities. • Closed-ended Fund – A commingled fund with a stated termination date, with few or no additional investors
after the initial formation of the fund. Closed-ended funds typically purchase a portfolio of properties to hold for the duration of the fund and, as sales occur, typically do not reinvest the sales proceeds.
Compound Return: Compounded Returns are measured over long time periods (10 years) and reflect the reduction in return that comes from variations around the average return (“volatility drag”). Correlation: Correlations measure the amount of diversification between two asset classes. A correlation of 1 indicates no diversification. A correlation of -1 indicates perfect diversification. Very few investments have correlations much less than zero. Dairy – A dairy is a business enterprise established for the harvesting of animal milk. A dairy farm produces milk and a dairy factory processes it into a variety of dairy products.
33
Discretion – The level of authority given to an investment manager over the investment and management of a client’s capital once that capital is allocated to the investment manager. Direct Investment – An investment in which an investor has a direct ownership interest in underlying agriculture projects and/or assets. This is compared to investment in a commingled fund structure where the investor has in interest in the commingled fund and the fund owns the underlying assets. Diversification – Investing in a wide range of assets/projects or asset classes in order to reduce financial risk. Due Diligence – The process of investigating, evaluating and analyzing a potential investment’s characteristics, investment philosophy and terms and conditions. Fair Market Value – The highest price a property would bring if exposed for sale in the open market by a willing seller to a willing buyer with both parties being fully informed of all the uses and purposes to which the property is reasonably adaptable and available. General Partner – Managing partner of a limited partnership responsible for performing the day-to-day administrative operations of the partnership and acting as investment advisor to the partnership. Income – The component of return derived from property or portfolio operations during the period of analysis. Inflation – The general upward price movement of goods and services in an economy over a period of time. Inflation-Link – Investments that allow inflation risk to be mitigated contractually through inflation-adjusted pricing agreements such as water utilities where the user fees are linked to Consumer Price Index (CPI). Internal Rate of Return (IRR) – The discount rate at which the present value of future cash flows of an investment equals the cost of the investment. It is determined when the net present value of the cash outflows (the cost of the investment) and the cash inflows (returns on the investment) equal zero, the rate of discount being used is the IRR. Investment Manager – A company that, by contractual agreement, provides farmland or timberland investment opportunities and/or property asset management services. Joint Venture – A structure wherein an investor and a partner form a partnership to purchase and/or operate an investment or investments. Leverage – The use of borrowed funds to increase purchasing power and, ideally, to increase the profitability of an investment. Limited Partnership – A partnership with both general and limited partners in which the general partner manages the business and assumes full liability for the partnership obligations with the liability of the limited partners generally restricted to their capital contributions.
34
NCREIF Farmland Index – A quarterly time series composite return measure of investment performance of a large pool of individual agricultural properties acquired in the private market for investment purposes only. All properties in the Farmland Index have been acquired, at least in part, on behalf of tax-exempt institutional investors - the great majority being pension funds. As such, all properties are held in a fiduciary environment. The Index tracks U.S. properties exclusively. NCREIF Property Index – A quarterly time series composite return measure of investment performance of a large pool of individual commercial real estate properties acquired in the private market for investment purposes only. All properties in the Property Index have been acquired, at least in part, on behalf of tax-exempt institutional investors - the great majority being pension funds. As such, all properties are held in a fiduciary environment. The Index tracks U.S. properties exclusively. NCREIF Timberland Index – A quarterly time series composite return measure of investment performance of a large pool of individual timberland properties acquired in the private market for investment purposes only. All properties in the Timberland Index have been acquired, at least in part, on behalf of tax-exempt institutional investors - the great majority being pension funds. As such, all properties are held in a fiduciary environment. The Index tracks U.S. properties exclusively. Net Asset Value (Nav) – Represents total assets at fair market value minus liabilities. Net Operating Income (NOI) – Rental and other income of a property, less operating expenses, but before the deduction of capital expenditures and debt service. Nominal Rate of Return: Rate of return before adjusting for inflation Opportunistic – A phrase characterizing an investment in underperforming and/or undermanaged assets/projects typically purchased from distressed sellers, utilizing high levels of leverage at times with the expectation of near-term increases in cash flow and value. Pastoral Farming – is the branch of agriculture concerned with the raising of livestock. It is animal husbandry: the care, tending and use of animals such as cattle and sheep. Permanent Crop – A crop that grows on a tree or vine. Permanent crops are typically categorized as citrus fruits, fruits and nuts. Examples include oranges, wine grapes, apples, almonds, walnuts, etc. Property Management – The various functions that are performed at the property level in order to assure timely collection of rents, payment of expenses and supervision of on-site activities. Real Rate of Return – Rate of return after adjusting for inflation (typically determined by the Consumer Price Index).
35
Row Crop – A crop that requires annual planting. These can be categorized as commodities and vegetables. Examples include corn, cotton, grains, soy, oilseeds, potatoes, etc. Specialty Crop – A non-traditional crop that requires specialized expertise in its growth, harvesting or transportation. Many fresh fruits and produce are considered specialty crops. Examples include lettuce, strawberries, mangos, broccoli, etc. Total Return – The sum of the income and appreciation returns. Value-Added – A phrase commonly used by investment managers to describe a management approach to an asset or project with the connotation that their skills will add value, which otherwise would not be realized. Vintage Year – The year of formation for a fund or investment program and its first takedown of capital. By placing a fund/investment program into a particular vintage year, the investor can compare the performance of a given fund with all other similar type funds formed in that particular vintage year. In addition, that vintage year return can then be compared to an industry benchmark which is provided by a leading publication source.
36