Embed Size (px)
Citation preview
IMPROVING SCHOOL
GOVERNANCE 2
STRATEGIC PLANNING

Published by the Regional Services Group Department of Education and Training Melbourne February 2016
©State of Victoria (Department of Education and Training) 2016
The copyright in this document is owned by the State of Victoria (Department of Education and Training), or in the case of some materials, by third parties (third party materials). No part may be reproduced by any process except in accordance with the provisions of the Copyright Act 1968, the National Education Access Licence for Schools (NEALS) (see below) or with permission.
An educational institution situated in Australia which is not conducted for profit, or a body responsible for administering such an institution may copy and communicate the materials, other than third party materials, for the educational purposes of the institution.
Authorised by the Department of Education and Training 2 Treasury Place, East Melbourne, Victoria, 3002. ISBN 978-0-7594-0792-3
2.0 Introduction
GoalTo provide school councillors with an understanding of:
• working with the school leadership team to participate in strategic planning as part of the school’s improvement cycle
• using data to identify what the school is doing well and what needs to be done to further improve student outcomes
• fulfilling their governance role by ensuring that the school’s planning and practices reflect departmental guidelines and community expectations.
OverviewOne of the key functions of councils is to contribute to the establishment of the broad vision and direction for the school. Strategic planning is the process of reflecting on past performance, establishing future directions and deciding what will constitute success. In other words, it involves the school community considering these questions:
• where have we been?
• where do we want to go?
• how will we get there?
• how will we know if we have been successful?
The Department has developed a Framework for Improving Student Outcomes. The Framework has the following components: an Improvement Model with four state-wide priorities and six high-impact, evidence-based Improvement Initiatives to focus efforts; an Improvement Cycle for continuous improvement, which includes strategic planning; and Improvement Measures to enable us to determine our success.
There are four stages in the Improvement Cycle:
1. Evaluate and diagnose – monitoring and reviewing the school's performance against its current school strategic plan through:
• annual self-evaluation
• conducting a school review once every four years to diagnose areas requiring attention, including assessing the school’s compliance with legislation and registration requirements
• publishing an annual report for the school community (including parents/guardians, students and other interested people) about the school’s successes and challenges in implementing the strategic plan and improving student outcomes.
2. Prioritise and set goals – developing a four- year school strategic plan that outlines goals, key improvement strategies and expected targets in a school-based plan that is sensitive to local needs and based on data.
3. Develop and plan – developing annual implementation plans that describe how the key improvement strategies and other significant projects in the school strategic plan will be implemented, monitored and evaluated and developing performance and development plans for the principal and teachers.
4. Implement and monitor – collaboratively monitoring and reviewing the impact of the school’s improvement strategies and initiatives on student learning.
1
IMPROVING SCHOOL GOVERNANCE STRATEGIC PLANNING

The following table provides an overview of how the principal and staff, school council, and the school community would typically be involved in the strategic planning process. Senior Education
Improvement Leaders, who work within each of the regions, also play an important role in the strategic planning process. These roles and responsibilities are explained in more detail later in the module.
The principal … The school council … The Senior Education Improvement Leader …
Evaluate and diagnose
Annual self-evaluation:
• plans and manages the self-evaluation
• reviews the plan and timeline for the self-evaluation
• provides feedback on plan and timelines as required
• organises consultations, gathers and analyses data
• participates in working groups and involves the community in consultations
• provides support to analyse and interpret data
• drafts the self-evaluation report
• endorses the final self-evaluation report
• provides feedback on and validates the self-evaluation report prior to the school review
• agrees on how best to communicate the findings of the self-evaluation to the school community
School review:
• plans for the school review every four years, briefs the reviewer and provides performance data for the review
• participates in setting the terms of reference and review panel meetings as required
• plays a role in both types of school review (peer and priority), including reviewer selection and development of terms of reference
Annual reporting:
• drafts and signs the annual report
• endorses and signs the annual report
• provides quality assurance of the annual report
• organises a public meeting to present the annual report to the school community
• reports to the community on the school’s performance
2
IMPROVING SCHOOL GOVERNANCE STRATEGIC PLANNING

The principal … The school council … The Senior Education Improvement Leader …
Prioritise and set goals
• plans and manages the strategic planning process
• supports the development of a long term view of the school’s directions
• supports the school and school council to prepare the draft strategic plan
• organises consultations • involves the community in consultations
• supports the school to involve the community
• prepares a draft strategic plan
• endorses the draft strategic plan
• reviews the draft strategic plan and provides advice
• obtains endorsement for the plan by the Regional Director
• communicates the strategic plan
• communicates the strategic plan
Develop and plan
• develops the annual implementation plan
• contributes to developing the annual implementation plan
• supports the school and school council to prepare the draft annual implementation plan
• approves the annual implementation plan
• approves the annual implementation plan
Implement and monitor
• implement the strategic plan
• monitors the strategic plan
• keeps the school community informed about progress in implementing the plan
• monitors progress in implementing the plan
• provides guidance (as required) through implementation and monitoring
Resources and links
Framework for Improving Student Outcomes> http://www.education.vic.gov.au/about/educationstate/Pages/outcomes.aspx
3
IMPROVING SCHOOL GOVERNANCE STRATEGIC PLANNING

2.1 Evaluate and diagnose
Why is this topic important?Self-evaluation supports the ‘evaluate and diagnose’ part of the Improvement Cycle process.
Schools monitor their improvement efforts and student outcomes by using the suite of Improvement Measures to form an integrated overview of their progress and prepare for the next steps in their improvement journey.
Evaluation provides an opportunity to reflect on the extent to which the school achieved its goals from the four-year strategic plan and the annual implementation plan. It describes progress in priority areas known to have an impact on student outcomes. This means that the whole school community, including students, parents/carers and all staff, reflect on the observed outcomes, acknowledge and celebrate achievements; identify effective strategies as well as areas for improvement during the next planning period.
It enables the school community to reflect on what the school has achieved and to influence where it is headed. The community can do this by contributing to discussion about:
• how well the school is meeting the community’s expectations
• where the school could improve its performance
• what the school’s priorities should be going forward.
Prior to the review process, schools conduct a thorough self-evaluation that looks back at the impact of their improvement efforts over the four year period of the school strategic plan. Once completed the school moves into a peer or priority review during which an accredited school reviewer from outside the school, works with the school, the Senior Education Improvement Leader from the region and selected peers (in peer review), to look at the school’s performance and inform strategies for improvement. The self-evaluation report will usually be completed and communicated to the community at least two weeks prior to commencement of the review.
Combined information from the self-evaluation and the school review provide the basis for what will be in the school’s four-year strategic plan and annual implementation plan.
On completing this unit, school councillors should be able to:
• understand the evidence related to school improvement
• identify how the school community could engage with the self-evaluation process
• consider the outcomes of the school self-evaluation for endorsement
• understand the school review process and the way the school community could be involved.
4
IMPROVING SCHOOL GOVERNANCE STRATEGIC PLANNING
The self-evaluationThe principal and leadership team are responsible for evaluating their improvement efforts by drawing together the evidence of the school’s performance and feedback from community consultations. The Framework for Improving Student Outcomes provides advice and support to schools through a process that prompts schools to reflect on their practice and performance.
The principal will provide the outcome of the self-evaluation process to the school council for consideration and endorsement.
To provide feedback, councillors should reflect on the adequacy of the process to ensure that evidence from a wide range of sources has been considered to provide an accurate and agreed picture of the school’s context and improvement. They should be satisfied that the process aligns with the Department’s self-evaluation guidelines and that the views of the community are reflected.
5
IMPROVING SCHOOL GOVERNANCE STRATEGIC PLANNING

The principal will … Councillors will typically …
The Senior Education
Improvement Leader will …
The school community
might …
• plan the self-evaluation and timeline
• review and contribute to the plan and timeline for the self-evaluation
• support the school with planning for self-evaluation
• brief the school and its community about the self-evaluation process
• organise consultations with the council and school community
• participate in working groups
• participate in consultations with the school community
• provide support where necessary
• contribute to surveys
• participate in parent meetings and focus groups
• gather and analyse data • provide support and challenge where necessary
• provide support to analyse and interpret data, and challenge where necessary
• engage with the data and findings
• prepare the outcomes of the self-evaluation process for reporting and endorsement
• keep everyone informed about the outcomes of the self-evaluation
• support the self-evaluation process
• provide input into and feedback on the outcomes of the self-evaluation
• prepare the final outcomes of the self-evaluation for council endorsement
• endorse the outcomes of the self-evaluation
• endorse outcomes of the self-evaluation
• when the school is due for review, forward the outcomes of the self-evaluation to the reviewer, peers and Senior Education Improvement Leader
• engage with the outcomes of the evaluation process via the school newsletter or other communication
The following table shows how the principal and staff, Senior Education Improvement Leader, school councillors, and the school community (including parents, students and other interested people) would typically be involved in the self- evaluation process.
6
IMPROVING SCHOOL GOVERNANCE STRATEGIC PLANNING

Establishing evidence of school performanceInformation (evidence) from a range of sources is important in understanding a school’s improvement and performance. In the school self-evaluation, school improvement and performance is reviewed against the four priority areas - Excellence in teaching and learning, Professional Leadership, Positive climate for learning, Community engagement in learning - as well as the four outcome areas of the Improvement Measures - achievement, engagement, wellbeing and productivity.
Achievement Achievement refers to both the absolute levels of learning attainment and growth in student learning that schools strive to support.
While recognising that literacy and numeracy are essential foundations for students’ success, achievement outcomes encompass a broader view of learning, spanning the full range of curriculum domains, as well as students’ co-curricular achievements.
Student learning outcomes relate to what students know and can do. Schools develop and implement curriculum and report on achievement of student learning outcomes using data relating to:
National Assessment Program – Literacy and Numeracy (NAPLAN)
Every year, all students in Years 3, 5, 7 and 9 are assessed using national tests in reading, writing, language conventions (spelling, grammar and punctuation) and numeracy.
AusVELS
The curriculum for Victorian schools is set by the Victorian Curriculum and Assessment Authority (VCAA). The Victorian Curriculum Foundation–10 (F–10) sets out what every student should learn during their first eleven years of schooling. The curriculum is the common set of knowledge and skills required by students for life-long learning, social development and active and informed citizenship. The Victorian Curriculum F–10 incorporates the Australian Curriculum and reflects Victorian priorities and standards.
The Victorian Curriculum F–10 sets out a single, coherent and comprehensive set of content descriptions and associated achievement standards to enable teachers to plan, monitor, assess and report on the learning achievement of every student.
Student learning outcomes for students supported under the Program for Students with Disabilities (PSD)
Schools with PSD students assess their learning outcomes in relation to student progress in achieving the goals in their individual learning plans.
English and Mathematics online interviews
Along with teachers’ judgements in English, as an Additional Language (EAL) and Mathematics, school achievement in literacy and numeracy outcomes is also measured in the English online interview, the Mathematics online interview and the Fractions and Decimals online interview.
The Victorian Early Years Learning and Development Framework
This builds continuity between the first years of schooling and the learning and development that precede these years. This Framework describes the key learning and development outcomes for children from birth to eight and links to the first stages of the AusVELS.
Senior secondary certificates and programs
Student learning outcomes in the senior secondary years are defined as attainment in the Victorian Certificate of Education (VCE), the Victorian Certificate of Applied Learning (VCAL) and Vocational Education and Training (VET in schools), including school-based new apprenticeships. Information on this area is provided through school performance data available on the Victorian Assessment Software System (VASS) and through the VCE data service.
Other information
At the school level, schools also collect information on student learning using a range of school developed and commercially produced assessment strategies and instruments.
7
IMPROVING SCHOOL GOVERNANCE STRATEGIC PLANNING
EngagementEngagement refers to the extent to which students feel connected to and engaged in their learning and with the broader school community. Engagement spans students’ motivation to learn, as well as their active involvement in learning. Engagement also refers to students’ engagement as they make critical transitions through school and beyond into further education and work.
Measures of student engagement include student attendance, students’ ratings of their connectedness to school and motivation to learn (Student Attitudes to School Survey for students in Years 5 to 12), teachers' assessments of students’ motivation (School Staff Survey) and parents’ perceptions of the school climate (Parent Opinion Survey). Information collected at the school level can also be used.
The Student Engagement and Inclusion Guidance provide advice for schools about improving student engagement, attendance and positive behaviours.
WellbeingStudents’ health, safety and wellbeing are essential to learning and development. An inclusive, safe, orderly and stimulating environment for learning is critical to achieving and sustaining students’ positive learning experiences.
Measures of student wellbeing include student safety, morale and respect (Student Attitudes to School Survey). Information collected at the school level can also be used.
Productivity
Productivity refers to the effective allocation and use of resources. Successful productivity outcomes exist when a school uses its resources – people, time, space, funding, facilities, community expertise, professional learning, class structures, timetables, individual learning plans and facilities – to the best possible effect and in the best possible combination to support improved student outcomes and achieve its goals and targets.
Additional outcomes dataOther outcomes data available for children that may be relevant for primary schools include:
• the Australian Early Development Census (AEDC) – This is a population measure that provides information on how children are faring and the success of early childhood services in supporting children and families prior to a child’s entry to school. The AEDC is a summary indicator of children’s progress and how well children are faring relative to others based on areas of early childhood development.
• the Victorian Child and Adolescent Monitoring System (VCAMS) - This reports on the safety, health, learning, development and wellbeing of children and young people in Victoria. This data is reported against the 150 VCAMS indicators and provides a sound basis to support school strategic planning. This data is published in annual reports as well as community level profiles.
8
IMPROVING SCHOOL GOVERNANCE STRATEGIC PLANNING

Data analysisThe principal and leadership team will use the data to:
• examine trends, to see how performance has changed over time
• consider the achievements of specific groups of students to assess their performance
• analyse outcomes for individuals and groups of students as they move from one year level to the next through the school
• evaluate differences in outcomes between different skill areas within English and Mathematics
• make comparisons with state averages or statewide information about schools with similar student backgrounds.
An annual summary of each school’s performance is provided through the School Performance Summary (included as part of each school’s Annual Report to the School Community) and is available on line on the Victorian Registration and Qualifications Authority State Register.
This information covers a summary of the school’s performance in relation to key Improvement Measures. It also provides information about whether a school, taking into account its students, is performing higher than, lower than, or broadly similar to other Victorian schools with a similar student intake. A more detailed School Summary Report is made available to the school principal.
The self-evaluation process will contribute to council’s understanding of the school’s performance. This process may include:
• engaging in discussions and presentations about data by the principal
• participating in working groups
• collecting information from areas relevant to the school community.
Multiple sources of information will enable a school to make better decisions about how to improve its performance. It is important not to draw conclusions from one set of data, but to try to use a range of sources to understand the various factors that are contributing to an aspect of the school’s performance.
Understandably, many councillors will not have experience in analysing data. The principal will explain to councillors the relevance of each set of data to school performance and will help councillors make sense of some specialised data, such as NAPLAN results.
The key points to remember with data analysis are that:
• absolute scores are useful for specifying targets and measuring increase or decrease in scores
• relative scores are useful for comparing one school’s performance with schools with students from a similar background.
Councillors also need to be aware of the importance of maintaining confidentiality in respect of the data they may examine during the school self-evaluation process.
9
IMPROVING SCHOOL GOVERNANCE STRATEGIC PLANNING
Engaging the school communityWhen considering how best to consult with its community, a school might consider what form of consultation has worked well before, the resources available to the school for consultation, and the geographic spread and diversity of the community.
Opportunities for face-to-face consultations include:
• inviting the community to participate in forums to discuss the school’s performance and its directions, making interpreters available if necessary
• holding small group discussions with parents/guardians, where performance data is presented and responses sought
• forming working groups to undertake a particular evaluation task.
10
IMPROVING SCHOOL GOVERNANCE STRATEGIC PLANNING

Other considerationsSmall group discussions might also be an option if the school community is geographically dispersed, or has significant numbers of people who speak languages other than English. In these cases, the principal working with school councillors could:
• convene small group discussions in places, at times and in languages that suit participants
• talk to community organisations (such as cultural groups or local aboriginal education consultative groups in the case of Koorie families).
Other opportunities for consultation include:
• surveys of parents/guardians, asking for comments and opinions
• providing information about the self-evaluation in the school newsletter with an invitation to readers to comment
• suggestion boxes where people can leave their comments.
11
IMPROVING SCHOOL GOVERNANCE STRATEGIC PLANNING
Endorsing the self-evaluationThe principal will present the outcomes of the self-evaluation to council for endorsement. Councillors should satisfy themselves that:
• the evaluation provides a valid explanation of the school’s practice and performance
• all relevant facts and opinions were assessed in the process of developing the report
• the conclusions flow reasonably and logically from the information and data gathered.
The amount of time that council spends discussing the self-evaluation will depend in part on the degree of councillors’ involvement in the process. For example, the council of a small school might have been very hands-on and councillors would be very familiar with the contents. At a large school, working groups might have been involved in evaluating different aspects or initiatives of the school in preparation for the school-wide process.
Once the self-evaluation is endorsed, the principal briefs staff on the outcomes of the process and school council determines how best to communicate the findings of the self- evaluation to the community.
School reviewSchool reviews provide analysis of current school improvement, performance and practice, and should make a positive contribution to the school’s efforts to improve student outcomes. There are two types of review: peer review and priority review.
Schools undertaking a peer review select at least two peers from across the system and an accredited reviewer to conduct the review, in consultation with their Senior Education Improvement Leader.
Schools undertaking a priority review are supported by an independent reviewer, or team of reviewers, who carry out an intensive analysis of the school’s performance. Following a priority review, a design team led by the Senior Education Improvement Leader tailors support to the school based on its diagnosed needs.
A School Review and Intervention Services Panel has been established through which schools can access accredited reviewers and intervention specialists.
All school reviews include a registration requirements check against relevant regulatory standards.
In advance of a review, terms of reference are co-constructed by the principal, Senior Improvement Education Leader and the reviewer, to identify the purpose and methodology for the review.
12
IMPROVING SCHOOL GOVERNANCE STRATEGIC PLANNING

The school council president (or their representative) attends the review panel meeting and provides feedback to the council. The following table outlines how
councillors, the principal and leadership team, Senior Education Improvement Leader and school reviewer would typically be involved in the review process.
The principal will …
The Senior Education
Improvement Leader will …
School councillors will ...
The reviewer will ...
• plan and develop a timeline for the review and select and engage a reviewer
• co-develop the terms of reference with the reviewer and the Senior Education Improvement Leader
• for peer reviews, engage at least two peers to participate in the review in consultation with the Senior Education Improvement Leader
• endorse the terms of reference
• confer with the principal to select reviewer and peers
• co-develop the terms of reference and methodology with the principal and reviewer
• support the development of plans for the panel day (peer review) and field work days (priority review)
• the school council president endorses the terms of reference
• support the development of the terms of reference by providing advice on the most appropriate methodology
• coordinate the review activities, in consultation with the reviewer and the Senior Education Improvement Leader
• guide and support review activities as necessary
• guide and support review activities as necessary
• provide performance data to the reviewer, peers and the Senior Education Improvement Leader
• engage with the school’s data and self-evaluation
• participate in focus groups, interviews etc. as required
• school council discusses the review report
• analyse the school self-evaluation report and other data
• support the participation of staff, students and community members in reviewer-led focus groups, interviews etc. as required
• participate in focus groups, interviews etc. as required
• collect further information through focus groups/ interviews etc.
13
IMPROVING SCHOOL GOVERNANCE STRATEGIC PLANNING

The principal will …
The Senior Education
Improvement Leader will …
School councillors will ...
The reviewer will ...
• lead the review panel meetings for peer review
• participate in review panel meetings
• participate in review panel meetings
• facilitate the review panel meeting at the school
• brief the principal, school council president and Senior Education Improvement Leader on the progress of the review
• keep staff and council informed of progress
• check the accuracy of the draft review report
• provide feedback on the draft review report
• endorse the final review report.
• discuss the review report at school council
• prepare and submit a review report
• prepare a response to the review report if considered necessary
• contribute to, and endorse the school’s response to the review report
• set-up review meetings with staff and school council where the review findings can be presented
• may co-deliver review findings to meetings of staff and school council
• participate in the presentation of the review findings at a school council meeting
• for priority reviews, present review findings to meetings of staff and school council
• participate in intervention design team to develop improvement strategies for the school
• lead an intervention design team (for priority reviews and where relevant for peer reviews), which will develop improvement strategies based on the review report diagnosis
• may be involved in the first meeting of the intervention design team (for priority review schools) to present diagnosis
• Provide feedback to the Department on the quality of the review process through an online survey
14
IMPROVING SCHOOL GOVERNANCE STRATEGIC PLANNING
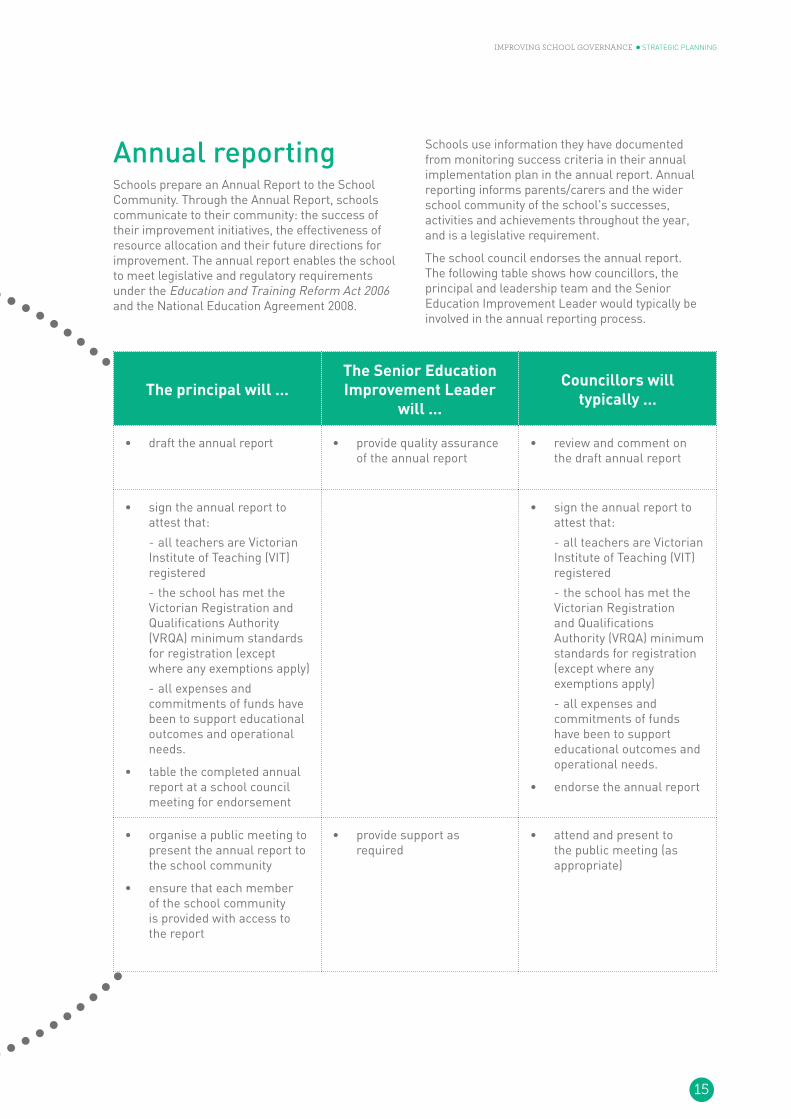
Annual reporting Schools prepare an Annual Report to the School Community. Through the Annual Report, schools communicate to their community: the success of their improvement initiatives, the effectiveness of resource allocation and their future directions for improvement. The annual report enables the school to meet legislative and regulatory requirements under the Education and Training Reform Act 2006 and the National Education Agreement 2008.
Schools use information they have documented from monitoring success criteria in their annual implementation plan in the annual report. Annual reporting informs parents/carers and the wider school community of the school's successes, activities and achievements throughout the year, and is a legislative requirement.
The school council endorses the annual report. The following table shows how councillors, the principal and leadership team and the Senior Education Improvement Leader would typically be involved in the annual reporting process.
The principal will …The Senior Education Improvement Leader
will …
Councillors will typically …
• draft the annual report • provide quality assurance of the annual report
• review and comment on the draft annual report
• sign the annual report to attest that:
- all teachers are Victorian Institute of Teaching (VIT) registered
- the school has met the Victorian Registration and Qualifications Authority (VRQA) minimum standards for registration (except where any exemptions apply)
- all expenses and commitments of funds have been to support educational outcomes and operational needs.
• table the completed annual report at a school council meeting for endorsement
• sign the annual report to attest that:
- all teachers are Victorian Institute of Teaching (VIT) registered
- the school has met the Victorian Registration and Qualifications Authority (VRQA) minimum standards for registration (except where any exemptions apply)
- all expenses and commitments of funds have been to support educational outcomes and operational needs.
• endorse the annual report
• organise a public meeting to present the annual report to the school community
• ensure that each member of the school community is provided with access to the report
• provide support as required
• attend and present to the public meeting (as appropriate)
15
IMPROVING SCHOOL GOVERNANCE STRATEGIC PLANNING

Structure of the annual reportThe annual report contains:
• Cover page
• About Our School statement
• School Performance Summary
• Financial Performance and Position Statement.
Approving the annual reportThe annual report provides the community with information about the school’s performance in implementing their improvement strategies and how the school’s resources have been used.
Councillors need to be aware that:
• an annual report must be produced each year, including the year in which the school is conducting its review and developing its new strategic plan
• the annual report is tabled at a school council meeting for ratification and endorsement and must be forwarded to the Department by 30 April of the next year
• School Council Presidents are required to attest that all teachers are Victorian Institute of Teaching (VIT) registered, the school is compliant with the Victorian Registration and Qualifications Authority registration requirements and all expenses and commitments of funds have been to support educational outcomes and operational needs
Resources and links
Framework for Improving Student Outcomes> http://www.education.vic.gov.au/about/educationstate/Pages/outcomes.aspx
Framework for Improving Student Outcomes – internal eduGate site> https://edugate.eduweb.vic.gov.au/edrms/project/fiso/
School Performance Information> http://www.education.vic.gov.au/school/principals/management/Pages/performreports.aspx
• the council must verify that the financial summary and commentary featured in the report are accurate and satisfy government requirements
• the council’s endorsement of the annual report must be recorded in the school council minutes
• school councils are required by law to hold a public meeting each year to present the report
• the school’s annual report must be published on the Victorian Registration and Qualifications Authority’s State Register of Victorian Schools. This process is managed by the Department.
16
IMPROVING SCHOOL GOVERNANCE STRATEGIC PLANNING

2.2 Prioritise and set goals
Why is this topic important?The school strategic plan is the school’s statement to its community about what it stands for and intends to do over the next four years to improve student outcomes. It defines what the school values most and sets out the school’s goals, targets and key strategies for improvement. It also influences resourcing priorities. It provides an important means for involving the school community in setting the school’s directions.
17
IMPROVING SCHOOL GOVERNANCE STRATEGIC PLANNING

On completing this unit, school councillors should be able to:
The principal … The Senior Education Improvement Leader …
School councillors …
• briefs the school community about the process of developing the strategic plan
• develop a long term view of the school’s directions
• assist in setting the school’s purpose and values
• reviews the findings from the self-evaluation and school review
• identifies key improvement priorities and initiatives
• develops draft goals, targets, key improvement strategies and actions
• provides support on reviewing and interpreting findings
• provides support on identifying key improvement priorities and initiatives
• reflect on the findings from the self-evaluation and school review to identify priorities for the school
• prepares a draft plan • provides support to prepare the draft strategic plan
• reviews the draft strategic plan and provides advice
• obtains endorsement for the plan by the Regional Director
• read and comment on the draft plan
• endorse the plan
• communicates the plan • communicate the plan
• support the development of a long term view of the school’s direction
• help engage the community in the development of the strategic plan
• provide feedback on the draft plan
• consider the plan for endorsement
• help communicate the plan to the community.
The following table shows what councillors, the principal and leadership team, and the Senior Education Improvement Leader are responsible for in the development of the school strategic plan.
18
IMPROVING SCHOOL GOVERNANCE STRATEGIC PLANNING

Strategic PlanningCouncillors make an important contribution to the strategic planning process through their contribution to determining a long-term view of where the school is headed, and why.
They can do this by:
• contributing to the development of the school’s purpose and values
• reflecting on the findings and recommendations of the school’s self-evaluation and school review ensuring that the school’s profile and environmental context is considered
• supporting the identification of environmental factors likely to influence the way the school operates over the next four years such as changing demographics, employment patterns and student and parent expectations
• assisting in the identification of goals, targets and improvement strategies, and advising how success can be measured
• assisting in the identification of key risks and mitigation strategies
• checking there is a clear line of sight between the findings of the school review, and the goals and actions
• testing that effective implementation and monitoring can occur as a result of strategic planning.
Engaging the school communityWhen considering how best to consult with its community, a school might consider what form of consultation has worked well before, the resources available to the school for consultation, and the geographic spread and diversity of the community.
Opportunities for face-to-face consultations include forums, small group discussions, working groups and inviting observers to relevant parts of council meetings. Other opportunities for consultation include surveys of parents/guardians, coverage of the planning process in the school newsletter with an invitation to readers to comment, and suggestion boxes.
19
IMPROVING SCHOOL GOVERNANCE STRATEGIC PLANNING

Endorsing the school strategic planSchool council must endorse the final plan as part of its governance responsibilities. To do so, councillors must assure themselves that the plan:
• reflects the community’s values and views about the school’s purpose and direction and that the goals and targets in the plan are consistent with these views
• draws on the findings of the school self-evaluation and review
• provides a concise and clear picture of what the school wants to achieve over the next four years and the broad steps that will be undertaken to achieve this.
The school’s strategic plan is a living document and should be reviewed and updated based on the annual self-evaluation. Endorsement by the school council and the Senior Education Improvement Leader is required for significant changes.
20
IMPROVING SCHOOL GOVERNANCE STRATEGIC PLANNING

Communicating the planCouncillors support the principal and leadership team in communicating the plan to the school community.
They can do this by:
• drawing on information in the plan when discussing issues with the school community; for example, to answer questions about what the school is doing to improve numeracy levels
• referring to the plan when opportune; for example, in meetings with parents/guardians and at open days
• supporting the principal at formal community reporting meetings; for example, when the annual report is presented to the community
• making reference to the plan when writing reports in school newsletters
• displaying the plan in school reception areas, on notice-boards, in offices, in classrooms and on websites
• encouraging celebration of important achievements, for example, at assemblies, in the newsletter or at a special function.
Resources and links
Framework for Improving Student Outcomes> http://www.education.vic.gov.au/about/educationstate/Pages/outcomes.aspx
Framework for Improving Student Outcomes – internal eduGate site > https://edugate.eduweb.vic.gov.au/edrms/project/fiso/
Risk Management > https://edugate.eduweb.vic.gov.au/Services/Policies/RiskManagement/Pages/Home.aspx
21
IMPROVING SCHOOL GOVERNANCE STRATEGIC PLANNING

Why is this topic important?The strategic plan establishes the broad direction for the school that is operationalised through the Annual Implementation Plan: for Improving Student Outcomes (annual implementation plan). The annual implementation plan enables the school to deliver on the goals and targets identified in the school strategic plan.
On completing this unit, school councillors should be able to:
• understand the role and purpose of the annual implementation plan
• endorse the annual implementation plan
• monitor progress against the key improvement strategies and success criteria
• endorse the annual report.
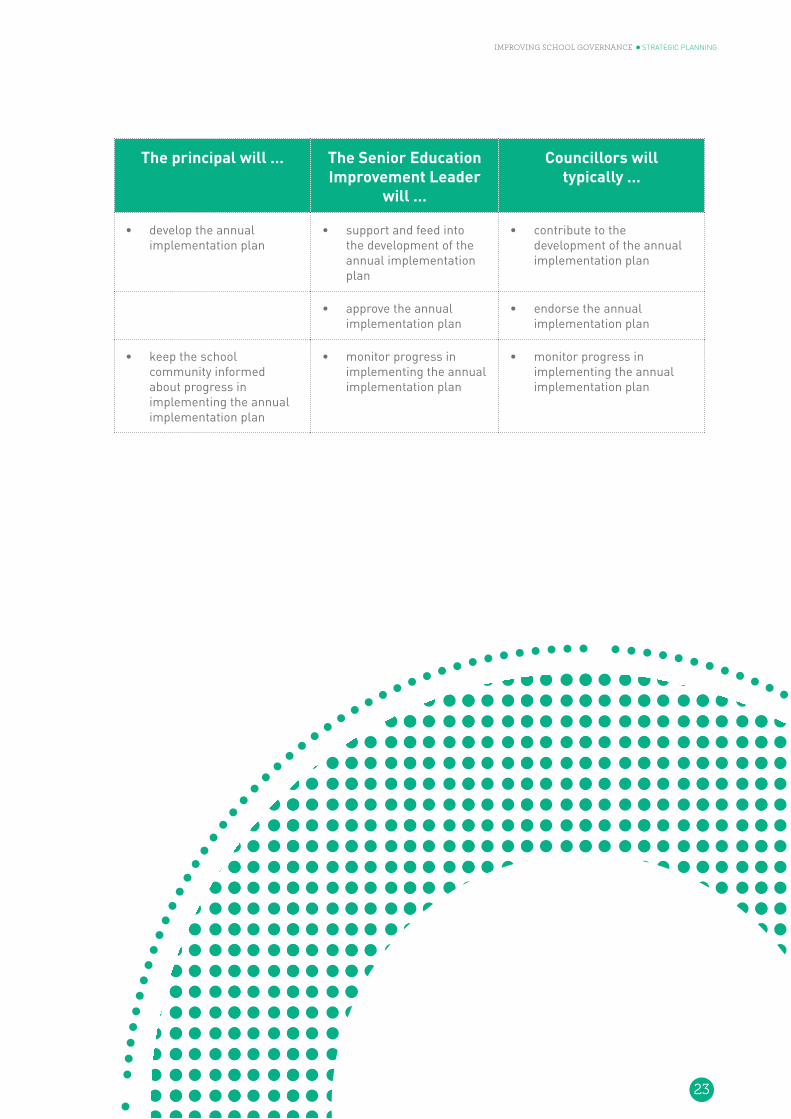
The following table shows how councillors, the Senior Education Improvement Leader and the principal and leadership team would typically be involved in developing, monitoring and reporting on the annual implementation plan. As the table shows, the principal and leadership team are responsible for developing the annual implementation plan and for managing, monitoring and reporting activities.
2.3 Develop and plan
22
IMPROVING SCHOOL GOVERNANCE STRATEGIC PLANNING
The principal will … The Senior Education Improvement Leader
will …
Councillors will typically …
• develop the annual implementation plan
• support and feed into the development of the annual implementation plan
• contribute to the development of the annual implementation plan
• approve the annual implementation plan
• endorse the annual implementation plan
• keep the school community informed about progress in implementing the annual implementation plan
• monitor progress in implementing the annual implementation plan
• monitor progress in implementing the annual implementation plan
23
IMPROVING SCHOOL GOVERNANCE STRATEGIC PLANNING
Developing the annual implementation planThe annual implementation plan identifies which of the six state-wide evidence-based initiatives the school will be addressing, why this has been selected and what key improvement strategies will support this focus.
The plan also contains the goals and targets from the school strategic plan, and breaks these down into 12-month targets, which are smaller steps towards achieving the broader targets.
The plan breaks down each key improvement strategy into specific actions. For each action, it specifies:
• how it will be implemented and resourced
• the person or people who will implement the action and report back on progress
• the timeframe for completing the action
• success criteria or markers of success that will be observable measures of progress.
The school then reports to the community on its progress.
The annual implementation plan is operational. It is important for school councillors to be aware of the plan and how it reflects the goals and targets established in the strategic plan and understand their role in overseeing the annual budget and the resourcing of the identified actions.
Principals' and teachers' Performance and Development Plans draw on the goals and targets identified in the strategic plan and annual implementation plan.
Endorsing the annual implementation planThe principal will present the final version of the annual implementation plan to school council for endorsement. Before endorsing it, councillors should satisfy themselves that:
• one-year targets are consistent with the goals and targets in the strategic plan
• the success criteria are achievable given the likely available resources.
The plan should be endorsed by the school council by 31 March in the year of implementation.
Resources and links
Framework for Improving Student Outcomes> http://www.education.vic.gov.au/about/educationstate/Pages/outcomes.aspx
Framework for Improving Student Outcomes – internal eduGate site > https://edugate.eduweb.vic.gov.au/edrms/project/fiso/
24
IMPROVING SCHOOL GOVERNANCE STRATEGIC PLANNING

Schools monitor, review and evaluate the implementation of their chosen priorities and initiatives – including impact on student learning – to determine progress, any need for adjustment, and overall outcomes.
Monitoring the progress of the school’s improvement strategies is one of the school council’s key roles.
The annual implementation plan is the reference point to monitor the school’s improvement as it relates to its implementation of the goals, targets and strategies outlined in the strategic plan.
The annual implementation plan template includes a monitoring section in which schools record six and 12-month progress against the success criteria and/or targets. The council’s role should focus on monitoring progress against the success criteria and/or achievement of the one-year targets featured in the annual implementation plan. This provides an essential link between the written annual implementation plan and the daily operation of the school.
Through this process it may become apparent that the school’s circumstances have changed which may require the school’s strategic plan to be updated. In this situation any change will require endorsement of the school council.
2.4 Implement and monitor
25
IMPROVING SCHOOL GOVERNANCE STRATEGIC PLANNING

FTE
Act
ual E
nrol
men
ts -
Year
leve
lPr
ojec
ted
Enro
lmen
ts20
1320
1420
1520
1620
1720
18Pr
imar
yPr
ep87
.053
.064
.066
.067
.066
.0Ye
ar 1
66.2
87.4
60.0
68.0
71.0
71.0
Year
283
.063
.686
.058
.067
.070
.0Ye
ar 3
61.0
85.0
64.6
85.0
58.0
67.0
Year
480
.057
.085
.061
.082
.055
.0Ye
ar 5
51.0
76.0
48.0
72.0
54.0
72.0
Year
656
.048
.071
.046
.069
.051
.0Pr
imar
y U
ngra
ded
0.0
0.0
0.0
0.0
0.0
0.0
Gra
nd T
otal
484.
247
0.0
478.
645
6.0
468.
045
2.0
FTE
Enro
lmen
ts &
Pro
ject
ions
Scho
ol N
umbe
r:11
11
Scho
ol N
ame:
H
appy
Val
ley
Prim
ary
Scho
ol
Scho
ol T
ype:
Prim
ary
Ope
n D
ate:
1/1/
1111
Teac
hing
FTE
: (20
15)
26.5
Supp
ort S
taff
FTE:
(201
5)6.
4
Cur
rent
Enr
olm
ents
: (20
15)
(Feb
Cen
sus)
478.
6
Scho
ol D
etai
lsPr
inci
pal:
Phon
e N
umbe
r:W
ebsi
te:
Add
ress
:
Adm
in R
egio
n:LG
A:
2013
2014
2015
Scho
ol0.
2158
0.20
400.
1944
Stat
e M
edia
n0.
5180
0.51
890.
5139
Stud
ent F
amily
Occ
upat
ion
(SFO
)
Scho
ol S
umm
ary
Rep
ort
Prin
ted
on: 2
4/12
/201
5 8:
58:3
7 A
MPa
ge 1
of 3
1
Han
dout
A1
Sam
ple
Scho
ol S
umm
ary
Repo
rt a
nd G
over
nmen
t Sch
ool P
erfo
rman
ce S
umm
ary
26
IMPR
OV
ING
SC
HO
OL
GO
VER
NA
NC
E
STR
ATEG
IC P
LAN
NIN
G

2013
2014
2015
Engl
ish
Onl
ine
Inte
rvie
w -
Perc
enta
ge o
f Stu
dent
s by
Aus
VELS
Lev
el, T
rend
- 20
13 to
201
5
Not
e: E
nglis
h O
nlin
e In
terv
iew
Aus
VE
LS L
evel
dat
a is
ava
ilabl
e fo
r Cal
enda
r Yea
r 201
3 on
war
ds o
nly.
Abo
ve L
evel
4
Tow
ards
Lev
el 4
Tow
ards
Lev
el 3
Tow
ards
Lev
el 2
Tow
ards
Lev
el 1
Tow
ards
Fo
unda
tion
Mea
n E
OI S
cale
Sco
res
for Y
ears
1 a
nd 2
rep
rese
nt d
ata
gath
ered
from
the
perc
enta
ge o
f par
ticip
atin
g st
uden
ts w
hich
var
ies
from
yea
r to
year
.
Prin
ted
on: 2
4/12
/201
5 8:
58:3
7 A
MPa
ge 2
of 3
1
27
IMPR
OV
ING
SC
HO
OL
GO
VER
NA
NC
E
STR
ATEG
IC P
LAN
NIN
G

Not
e: E
nglis
h O
nlin
e In
terv
iew
Aus
VE
LS L
evel
dat
a is
ava
ilabl
e fo
r Cal
enda
r Yea
r 201
3 on
war
ds o
nly.
Mea
n E
OI S
cale
Sco
res
for Y
ears
1 a
nd 2
rep
rese
nt d
ata
gath
ered
from
the
perc
enta
ge o
f par
ticip
atin
g st
uden
ts w
hich
var
ies
from
yea
r to
year
.
Engl
ish
Onl
ine
Inte
rvie
w -
Perc
enta
ge o
f Stu
dent
s by
Aus
VELS
Lev
el, T
rend
- 20
13 to
201
5
Parti
cipa
tion
Rat
e
Tow
ards
Fo
unda
tion
Tow
ards
Le
vel 1
Tow
ards
Le
vel 2
Tow
ards
Le
vel 3
Tow
ards
Le
vel 4
Abov
e Le
vel
4M
ean
EO
I Sc
ale
Scor
eC
ount
Perc
ent
Rea
ding
and
vie
win
g
2013
Prep
45.9
%47
.1%
4.7%
2.4%
0.0%
0.0%
103.
3385
97.7
%
2014
Prep
33.3
%54
.9%
7.8%
3.9%
0.0%
0.0%
104.
4751
96.2
%
2015
Prep
50.0
%45
.2%
4.8%
0.0%
0.0%
0.0%
102.
6062
96.9
%
Spe
akin
g an
d lis
teni
ng
2013
Prep
51.8
%38
.8%
8.2%
1.2%
0.0%
0.0%
93.7
285
97.7
%
2014
Prep
58.8
%35
.3%
5.9%
0.0%
0.0%
0.0%
91.5
751
96.2
%
2015
Prep
69.4
%29
.0%
1.6%
0.0%
0.0%
0.0%
75.4
462
96.9
%
Writ
ing
2013
Prep
92.9
%5.
9%1.
2%0.
0%0.
0%0.
0%30
.18
8597
.7%
2014
Prep
92.2
%5.
9%2.
0%0.
0%0.
0%0.
0%37
.94
5196
.2%
2015
Prep
96.8
%3.
2%0.
0%0.
0%0.
0%0.
0%27
.74
6296
.9%
Prin
ted
on: 2
4/12
/201
5 8:
58:3
7 A
MPa
ge 3
of 3
1
28
IMPR
OV
ING
SC
HO
OL
GO
VER
NA
NC
E
STR
ATEG
IC P
LAN
NIN
G
Not
e: E
nglis
h O
nlin
e In
terv
iew
Aus
VE
LS L
evel
dat
a is
ava
ilabl
e fo
r Cal
enda
r Yea
r 201
3 on
war
ds o
nly.
Mea
n E
OI S
cale
Sco
res
for Y
ears
1 a
nd 2
rep
rese
nt d
ata
gath
ered
from
the
perc
enta
ge o
f par
ticip
atin
g st
uden
ts w
hich
var
ies
from
yea
r to
year
.
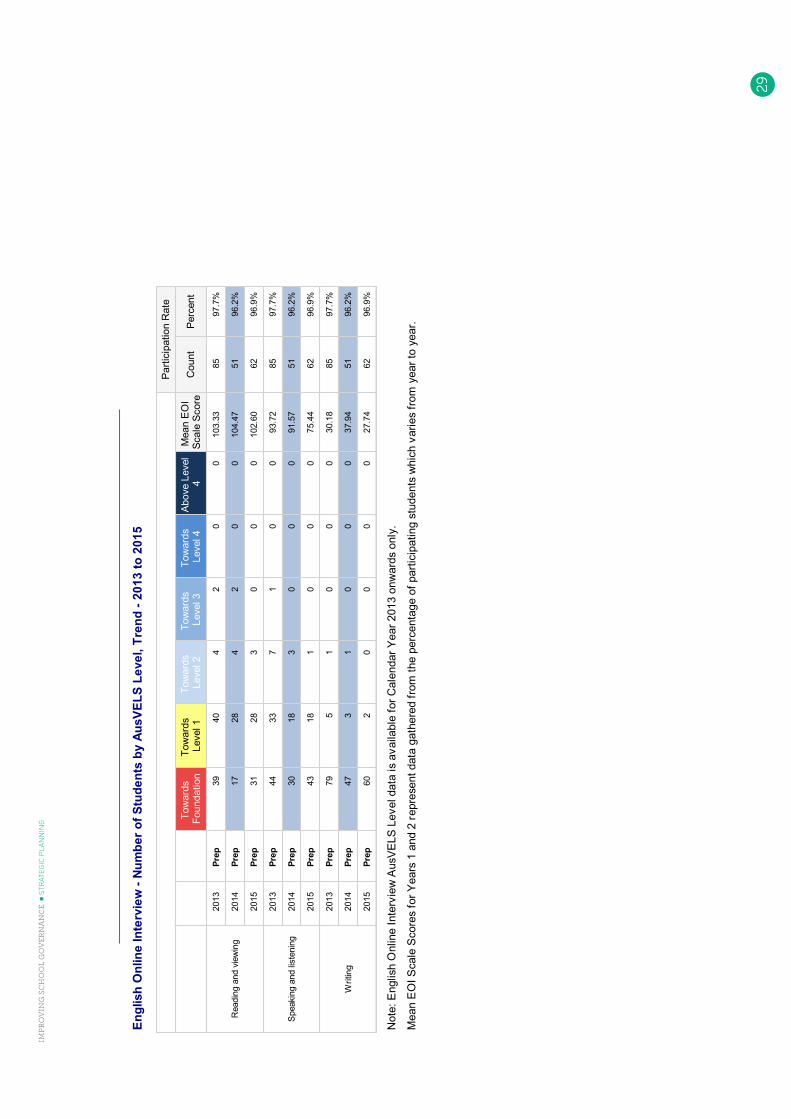
Engl
ish
Onl
ine
Inte
rvie
w -
Num
ber o
f Stu
dent
s by
Aus
VELS
Lev
el, T
rend
- 20
13 to
201
5
Parti
cipa
tion
Rat
e
Tow
ards
Fo
unda
tion
Tow
ards
Le
vel 1
Tow
ards
Le
vel 2
Tow
ards
Le
vel 3
Tow
ards
Le
vel 4
Abov
e Le
vel
4M
ean
EO
I Sc
ale
Scor
eC
ount
Perc
ent
Rea
ding
and
vie
win
g
2013
Prep
3940
42
00
103.
3385
97.7
%
2014
Prep
1728
42
00
104.
4751
96.2
%
2015
Prep
3128
30
00
102.
6062
96.9
%
Spe
akin
g an
d lis
teni
ng
2013
Prep
4433
71
00
93.7
285
97.7
%
2014
Prep
3018
30
00
91.5
751
96.2
%
2015
Prep
4318
10
00
75.4
462
96.9
%
Writ
ing
2013
Prep
795
10
00
30.1
885
97.7
%
2014
Prep
473
10
00
37.9
451
96.2
%
2015
Prep
602
00
00
27.7
462
96.9
%
Prin
ted
on: 2
4/12
/201
5 8:
58:3
7 A
MPa
ge 4
of 3
1
29
IMPR
OV
ING
SC
HO
OL
GO
VER
NA
NC
E
STR
ATEG
IC P
LAN
NIN
G

0 %
20 %
40 %
60 %
80 %
100
%
2013
2014
2015
Stu
dent
Yea
r Lev
el
NA
PLA
N N
umer
acy
0 %
20 %
40 %
60 %
80 %
100
%
2013
2014
2015
Stu
dent
Yea
r Lev
el
NA
PLA
N R
eadi
ng
NAP
LAN
- Pe
rcen
tage
of S
tude
nts
by B
and
by D
omai
n, T
rend
201
3 to
201
5 - Y
ear 3
Stu
dent
s
Yea
r Le
vel
Bel
ow N
MS
At
NM
SA
bove
NM
S
Year
3Ex
empt
Band
1Ba
nd 2
Band
3Ba
nd 4
Band
5Ba
nd 6
Year
5Ex
empt
Band
3Ba
nd 4
Band
5Ba
nd 6
Band
7Ba
nd 8
Year
7Ex
empt
Band
4Ba
nd 5
Band
6Ba
nd 7
Band
8Ba
nd 9
Year
9Ex
empt
Band
5Ba
nd 6
Band
7Ba
nd 8
Band
9Ba
nd 1
0
0 %
20 %
40 %
60 %
80 %
100
%
2013
2014
2015
Stu
dent
Yea
r Lev
el
NA
PLA
N G
ram
mar
& P
unct
uatio
n
Prin
ted
on: 2
4/12
/201
5 8:
58:3
7 A
MPa
ge 5
of 3
1
30
IMPR
OV
ING
SC
HO
OL
GO
VER
NA
NC
E
STR
ATEG
IC P
LAN
NIN
G

Perc
enta
ge o
f Stu
dent
sN
umbe
r of S
tude
nts
Yea
rB
elow
NM
SA
t NM
SA
bove
NM
SB
elow
NM
SA
t NM
SA
bove
NM
SM
ean
Part
icip
atio
n R
ate
Exe
mpt
Ban
d 1
Ban
d 2
Ban
d 3
Ban
d 4
Ban
d 5
Ban
d 6
Exe
mpt
Ban
d 1
Ban
d 2
Ban
d 3
Ban
d 4
Ban
d 5
Ban
d 6
Sch
ool
Stat
eC
ount
%
Gra
mm
ar a
nd
Punc
tuat
ion
2013
0.0%
0.0%
1.6%
9.8%
29.5
%36
.1%
23.0
%0
01
618
2214
443.
142
0.7
6110
0.0%
2014
0.0%
1.3%
2.5%
5.0%
17.5
%28
.8%
45.0
%0
12
414
2336
472.
641
5.3
8093
.0%
2015
0.0%
1.7%
3.4%
6.8%
27.1
%18
.6%
42.4
%0
12
416
1125
476.
942
4.4
5992
.2%
Num
erac
y20
130.
0%1.
6%3.
3%16
.4%
34.4
%31
.1%
13.1
%0
12
1021
198
418.
839
4.7
6110
0.0%
2014
0.0%
1.2%
2.5%
8.6%
24.7
%28
.4%
34.6
%0
12
720
2328
449.
239
7.3
8194
.2%
2015
0.0%
3.3%
3.3%
15.0
%28
.3%
20.0
%30
.0%
02
29
1712
1843
9.4
394.
560
93.8
%
Rea
ding
2013
0.0%
0.0%
3.3%
8.2%
24.6
%31
.1%
32.8
%0
02
515
1920
449.
641
5.6
6110
0.0%
2014
0.0%
0.0%
3.7%
6.2%
16.0
%19
.8%
54.3
%0
03
513
1644
476.
541
2.1
8194
.2%
2015
0.0%
0.0%
1.7%
13.3
%16
.7%
25.0
%43
.3%
00
18
1015
2647
0.9
421.
260
93.8
%
Spel
ling
2013
0.0%
0.0%
6.6%
11.5
%27
.9%
32.8
%21
.3%
00
47
1720
1343
1.7
399.
861
100.
0%
2014
0.0%
0.0%
7.5%
3.8%
25.0
%20
.0%
43.8
%0
06
320
1635
462.
239
9.3
8093
.0%
2015
0.0%
0.0%
3.4%
5.1%
20.3
%32
.2%
39.0
%0
02
312
1923
467.
740
1.1
5992
.2%
Writ
ing
2013
0.0%
0.0%
1.6%
8.2%
23.0
%45
.9%
21.3
%0
01
514
2813
442.
141
0.6
6110
0.0%
2014
0.0%
0.0%
3.8%
5.0%
28.8
%51
.3%
11.3
%0
03
423
419
436.
139
7.0
8093
.0%
2015
0.0%
0.0%
3.3%
10.0
%25
.0%
43.3
%18
.3%
00
26
1526
1143
8.5
412.
860
93.8
%
NAP
LAN
- N
umbe
r and
Per
cent
age
of S
tude
nts
by B
and
by D
omai
n, T
rend
201
3 to
201
5 - Y
ear 3
Stu
dent
s
Prin
ted
on: 2
4/12
/201
5 8:
58:3
7 A
MPa
ge 6
of 3
1
31
IMPR
OV
ING
SC
HO
OL
GO
VER
NA
NC
E
STR
ATEG
IC P
LAN
NIN
G
0 %
20 %
40 %
60 %
80 %
100
%
2013
2014
2015
Stu
dent
Yea
r Lev
el
NA
PLA
N N
umer
acy
0 %
20 %
40 %
60 %
80 %
100
%
2013
2014
2015
Stu
dent
Yea
r Lev
el
NA
PLA
N R
eadi
ng
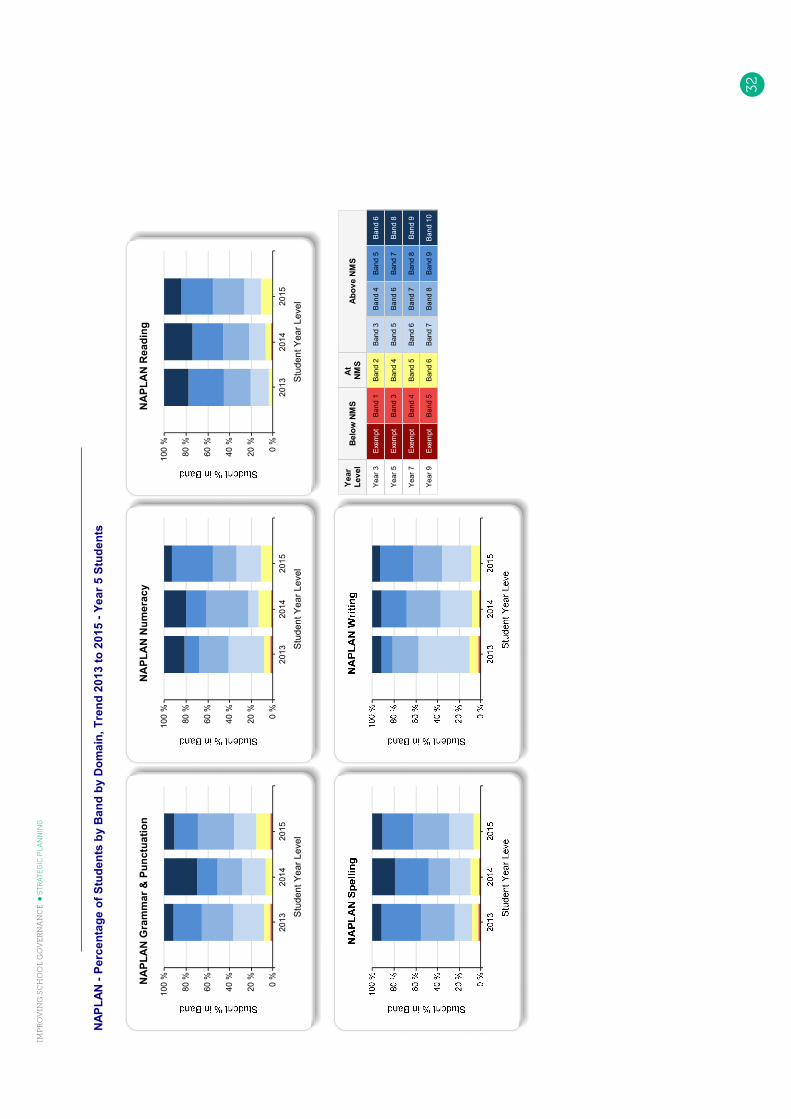
NAP
LAN
- Pe
rcen
tage
of S
tude
nts
by B
and
by D
omai
n, T
rend
201
3 to
201
5 - Y
ear 5
Stu
dent
s
Yea
r Le
vel
Bel
ow N
MS
At
NM
SA
bove
NM
S
Year
3Ex
empt
Band
1Ba
nd 2
Band
3Ba
nd 4
Band
5Ba
nd 6
Year
5Ex
empt
Band
3Ba
nd 4
Band
5Ba
nd 6
Band
7Ba
nd 8
Year
7Ex
empt
Band
4Ba
nd 5
Band
6Ba
nd 7
Band
8Ba
nd 9
Year
9Ex
empt
Band
5Ba
nd 6
Band
7Ba
nd 8
Band
9Ba
nd 1
0
0 %
20 %
40 %
60 %
80 %
100
%
2013
2014
2015
Stu
dent
Yea
r Lev
el
NA
PLA
N G
ram
mar
& P
unct
uatio
n
Prin
ted
on: 2
4/12
/201
5 8:
58:3
8 A
MPa
ge 7
of 3
1
32
IMPR
OV
ING
SC
HO
OL
GO
VER
NA
NC
E
STR
ATEG
IC P
LAN
NIN
G
Perc
enta
ge o
f Stu
dent
sN
umbe
r of S
tude
nts
Yea
rB
elow
NM
SA
t NM
SA
bove
NM
SB
elow
NM
SA
t NM
SA
bove
NM
SM
ean
Part
icip
atio
n R
ate
Exe
mpt
Ban
d 3
Ban
d 4
Ban
d 5
Ban
d 6
Ban
d 7
Ban
d 8
Exe
mpt
Ban
d 3
Ban
d 4
Ban
d 5
Ban
d 6
Ban
d 7
Ban
d 8
Sch
ool
Stat
eC
ount
%
Gra
mm
ar a
nd
Punc
tuat
ion
2013
0.0%
2.0%
6.1%
28.6
%28
.6%
26.5
%8.
2%0
13
1414
134
499.
148
3.1
4996
.1%
2014
0.0%
0.0%
6.8%
21.9
%21
.9%
19.2
%30
.1%
00
516
1614
2253
1.0
482.
273
97.3
%
2015
0.0%
2.2%
13.3
%20
.0%
33.3
%22
.2%
8.9%
01
69
1510
450
3.8
485.
445
95.7
%
Num
erac
y20
130.
0%2.
0%6.
1%32
.7%
26.5
%14
.3%
18.4
%0
13
1613
79
510.
547
3.2
4996
.1%
2014
0.0%
1.4%
12.2
%9.
5%37
.8%
18.9
%20
.3%
01
97
2814
1552
1.4
473.
874
98.7
%
2015
0.0%
0.0%
11.1
%22
.2%
22.2
%37
.8%
6.7%
00
510
1017
351
3.3
481.
745
95.7
%
Rea
ding
2013
0.0%
0.0%
4.1%
16.3
%24
.5%
32.7
%22
.4%
00
28
1216
1153
2.7
487.
049
96.1
%
2014
0.0%
1.4%
5.4%
14.9
%24
.3%
28.4
%25
.7%
01
411
1821
1953
5.7
484.
974
98.7
%
2015
0.0%
0.0%
11.1
%15
.6%
28.9
%28
.9%
15.6
%0
05
713
137
520.
848
4.6
4595
.7%
Spel
ling
2013
0.0%
2.0%
6.1%
16.3
%30
.6%
36.7
%8.
2%0
13
815
184
515.
447
6.0
4996
.1%
2014
0.0%
1.4%
8.2%
19.2
%19
.2%
31.5
%20
.5%
01
614
1423
1552
3.4
475.
673
97.3
%
2015
0.0%
0.0%
6.7%
22.2
%33
.3%
28.9
%8.
9%0
03
1015
134
514.
448
0.7
4595
.7%
Writ
ing
2013
0.0%
2.0%
8.2%
46.9
%24
.5%
10.2
%8.
2%0
14
2312
54
481.
746
6.7
4996
.1%
2014
0.0%
1.4%
6.8%
28.8
%31
.5%
23.3
%8.
2%0
15
2123
176
498.
645
6.2
7397
.3%
2015
0.0%
0.0%
8.9%
26.7
%26
.7%
31.1
%6.
7%0
04
1212
143
504.
646
7.9
4595
.7%
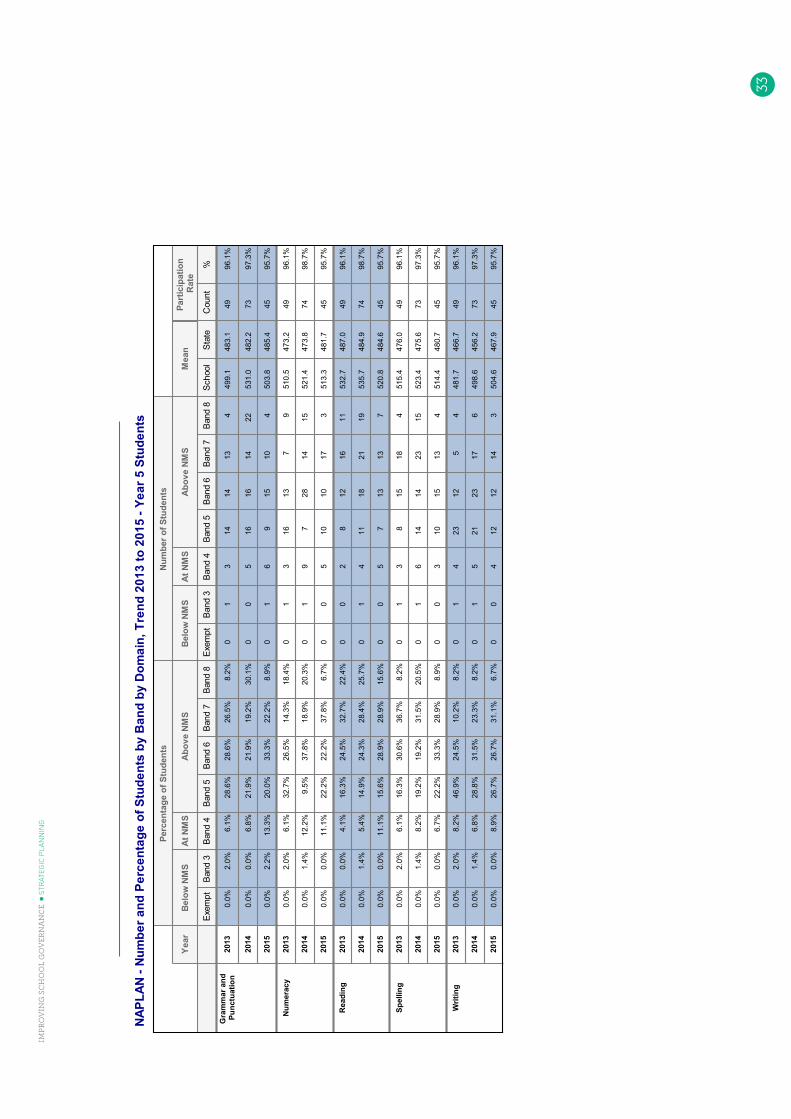
NAP
LAN
- N
umbe
r and
Per
cent
age
of S
tude
nts
by B
and
by D
omai
n, T
rend
201
3 to
201
5 - Y
ear 5
Stu
dent
s
Prin
ted
on: 2
4/12
/201
5 8:
58:3
8 A
MPa
ge 8
of 3
1
33
IMPR
OV
ING
SC
HO
OL
GO
VER
NA
NC
E
STR
ATEG
IC P
LAN
NIN
G
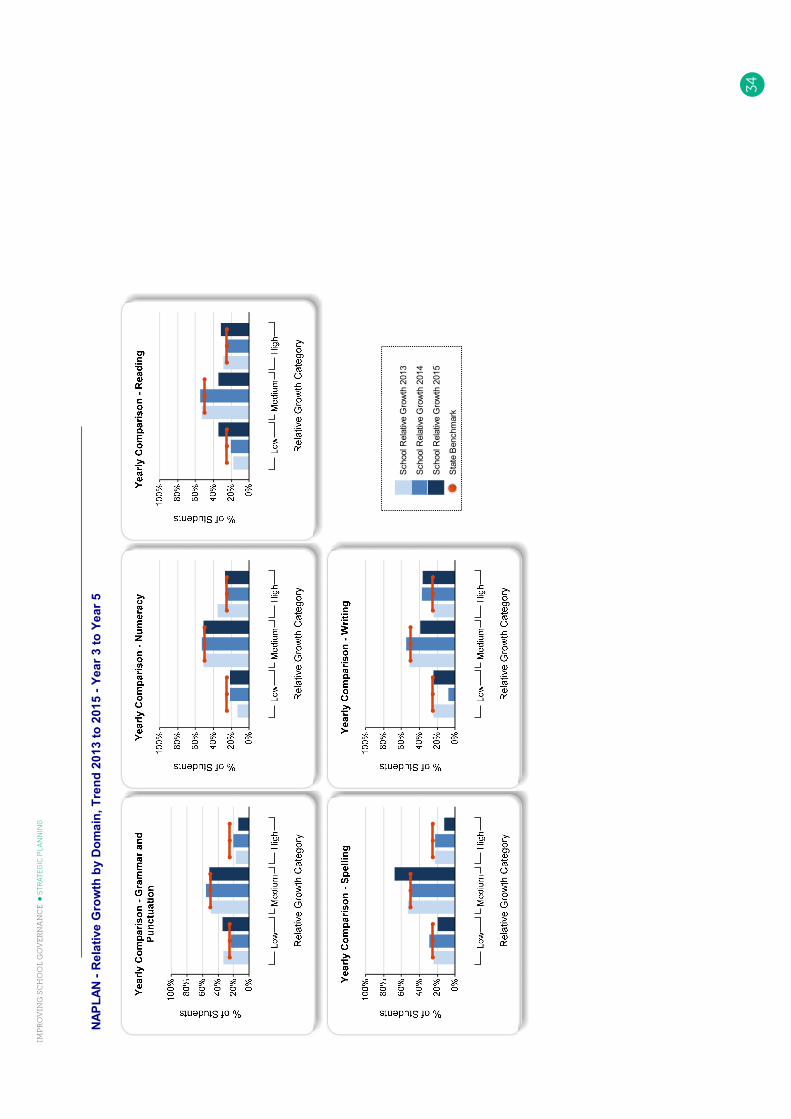
NAP
LAN
- R
elat
ive
Gro
wth
by
Dom
ain,
Tre
nd 2
013
to 2
015
- Yea
r 3 to
Yea
r 5
Sch
ool R
elat
ive
Gro
wth
201
3
Sch
ool R
elat
ive
Gro
wth
201
4
Sch
ool R
elat
ive
Gro
wth
201
5
Sta
te B
ench
mar
k
Prin
ted
on: 2
4/12
/201
5 8:
58:3
8 A
MPa
ge 9
of 3
1
34
IMPR
OV
ING
SC
HO
OL
GO
VER
NA
NC
E
STR
ATEG
IC P
LAN
NIN
G
Perc
enta
ge o
f Stu
dent
sN
umbe
r of S
tude
nts
Year
Low
Med
ium
Hig
hLo
wM
ediu
mH
igh
Mat
ched
C
ohor
t Tot
alG
ram
mar
and
Pun
ctua
tion
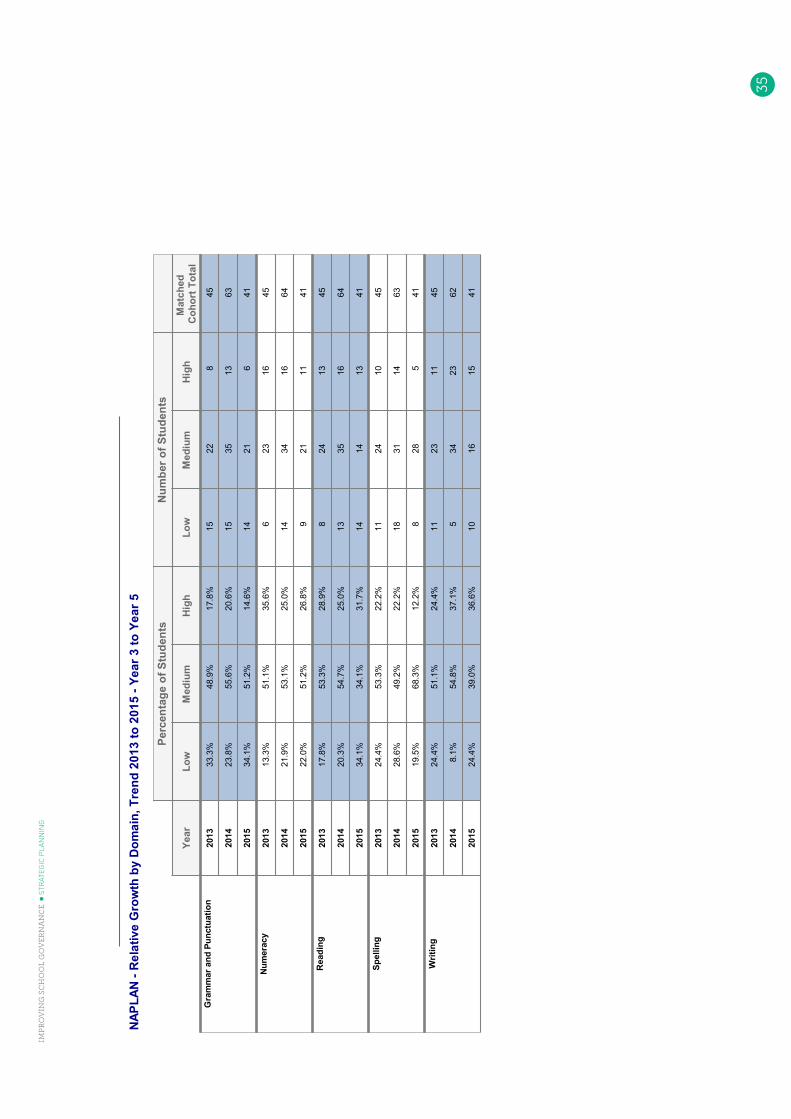
2013
33.3
%48
.9%
17.8
%15
228
45
2014
23.8
%55
.6%
20.6
%15
3513
63
2015
34.1
%51
.2%
14.6
%14
216
41
Num
erac
y20
1313
.3%
51.1
%35
.6%
623
1645
2014
21.9
%53
.1%
25.0
%14
3416
64
2015
22.0
%51
.2%
26.8
%9
2111
41
Rea
ding
2013
17.8
%53
.3%
28.9
%8
2413
45
2014
20.3
%54
.7%
25.0
%13
3516
64
2015
34.1
%34
.1%
31.7
%14
1413
41
Spel
ling
2013
24.4
%53
.3%
22.2
%11
2410
45
2014
28.6
%49
.2%
22.2
%18
3114
63
2015
19.5
%68
.3%
12.2
%8
285
41
Writ
ing
2013
24.4
%51
.1%
24.4
%11
2311
45
2014
8.1%
54.8
%37
.1%
534
2362
2015
24.4
%39
.0%
36.6
%10
1615
41
NAP
LAN
- R
elat
ive
Gro
wth
by
Dom
ain,
Tre
nd 2
013
to 2
015
- Yea
r 3 to
Yea
r 5
Prin
ted
on: 2
4/12
/201
5 8:
58:3
8 A
MPa
ge 1
0 of
31
35
IMPR
OV
ING
SC
HO
OL
GO
VER
NA
NC
E
STR
ATEG
IC P
LAN
NIN
G

AusV
ELS
- Stu
dent
s by
Rat
ing
by Y
ear L
evel
201
5 - S
emes
ter 1
Dom
ain
AusV
ELS
Engl
ish
Prin
ted
on: 2
4/12
/201
5 8:
58:3
8 A
MPa
ge 1
1 of
31
36
IMPR
OV
ING
SC
HO
OL
GO
VER
NA
NC
E
STR
ATEG
IC P
LAN
NIN
G

AusV
ELS
- Stu
dent
s by
Rat
ing
by Y
ear L
evel
201
5 - S
emes
ter 1
Dom
ain
AusV
ELS
Engl
ish
Rat
ing
Mea
n
Perc
enta
ge o
f Stu
dent
sN
umbe
r of S
tude
nts
Scho
olSt
ate
Reg
ion
Dim
ensi
onSt
uden
ts
Ass
esse
dA
BC
DE
AB
CD
E
Rea
ding
and
vie
win
g
Yea
r 147
38.3
%31
.9%
29.8
%0.
0%0.
0%18
1514
00
1.05
F.62
6F.
709
Yea
r 280
38.8
%20
.0%
41.3
%0.
0%0.
0%31
1633
00
2.06
1.65
1.74
Yea
r 360
38.3
%31
.7%
28.3
%1.
7%0.
0%23
1917
10
3.18
2.62
2.72
Yea
r 483
22.9
%33
.7%
43.4
%0.
0%0.
0%19
2836
00
3.92
3.58
3.67
Yea
r 543
41.9
%18
.6%
39.5
%0.
0%0.
0%18
817
00
5.02
4.56
4.67
Yea
r 667
35.8
%31
.3%
31.3
%1.
5%0.
0%24
2121
10
6.07
5.56
5.69
Prep
- 6
380
35.0
%28
.2%
36.3
%0.
5%0.
0%13
310
713
82
03.
562.
532.
67
Spea
king
and
list
enin
g
Yea
r 147
8.5%
25.5
%63
.8%
2.1%
0.0%
412
301
0F.
670
F.50
7F.
570
Yea
r 280
5.0%
33.8
%61
.3%
0.0%
0.0%
427
490
01.
711.
501.
59
Yea
r 360
10.0
%31
.7%
56.7
%1.
7%0.
0%6
1934
10
2.73
2.47
2.57
Yea
r 483
6.0%
34.9
%56
.6%
2.4%
0.0%
529
472
03.
673.
463.
55
Yea
r 543
14.0
%34
.9%
48.8
%2.
3%0.
0%6
1521
10
4.71
4.44
4.56
Yea
r 667
14.9
%28
.4%
53.7
%3.
0%0.
0%10
1936
20
5.74
5.46
5.58
Prep
- 6
380
9.2%
31.8
%57
.1%
1.8%
0.0%
3512
121
77
03.
222.
422.
55
Writ
ing
Yea
r 147
21.3
%29
.8%
48.9
%0.
0%0.
0%10
1423
00
F.81
9F.
484
F.55
7
Yea
r 280
7.5%
25.0
%66
.3%
1.3%
0.0%
620
531
01.
611.
451.
54
Yea
r 360
16.7
%30
.0%
50.0
%1.
7%1.
7%10
1830
11
2.77
2.40
2.51
Yea
r 483
8.4%
33.7
%56
.6%
1.2%
0.0%
728
471
03.
673.
363.
47
Yea
r 543
16.3
%30
.2%
44.2
%9.
3%0.
0%7
1319
40
4.64
4.33
4.47
Yea
r 667
13.4
%26
.9%
49.3
%10
.4%
0.0%
918
337
05.
635.
335.
49
Prep
- 6
380
12.9
%29
.2%
53.9
%3.
7%0.
3%49
111
205
141
3.20
2.35
2.49
Prin
ted
on: 2
4/12
/201
5 8:
58:3
8 A
MPa
ge 1
2 of
31
37
IMPR
OV
ING
SC
HO
OL
GO
VER
NA
NC
E
STR
ATEG
IC P
LAN
NIN
G

AusV
ELS
- Stu
dent
s by
Rat
ing
by Y
ear L
evel
201
5 - S
emes
ter 2
Dom
ain
AusV
ELS
Engl
ish
Prin
ted
on: 2
4/12
/201
5 8:
58:3
8 A
MPa
ge 1
3 of
31
38
IMPR
OV
ING
SC
HO
OL
GO
VER
NA
NC
E
STR
ATEG
IC P
LAN
NIN
G

AusV
ELS
- Stu
dent
s by
Rat
ing
by Y
ear L
evel
201
5 - S
emes
ter 2
Dom
ain
AusV
ELS
Engl
ish
Rat
ing
Mea
n
Perc
enta
ge o
f Stu
dent
sN
umbe
r of S
tude
nts
Scho
olSt
ate
Reg
ion
Dim
ensi
onSt
uden
ts
Ass
esse
dA
BC
DE
AB
CD
E
Rea
ding
and
vie
win
g
Prep
6018
.3%
38.3
%35
.0%
8.3%
0.0%
1123
215
0F.
283
F.16
0F.
259
Yea
r 151
43.1
%31
.4%
25.5
%0.
0%0.
0%22
1613
00
1.63
1.20
1.30
Yea
r 282
41.5
%30
.5%
26.8
%1.
2%0.
0%34
2522
10
2.63
2.19
2.29
Yea
r 360
35.0
%33
.3%
30.0
%1.
7%0.
0%21
2018
10
3.66
3.16
3.26
Yea
r 482
35.4
%30
.5%
32.9
%1.
2%0.
0%29
2527
10
4.59
4.12
4.24
Yea
r 545
42.2
%26
.7%
31.1
%0.
0%0.
0%19
1214
00
5.56
5.09
5.22
Yea
r 671
42.3
%26
.8%
29.6
%1.
4%0.
0%30
1921
10
6.57
6.11
6.26
Prep
- 6
451
36.8
%31
.0%
30.2
%2.
0%0.
0%16
614
013
69
03.
613.
083.
21
Spea
king
and
list
enin
g
Prep
608.
3%18
.3%
65.0
%8.
3%0.
0%5
1139
50
F.08
3F.
034
F.10
4
Yea
r 151
7.8%
37.3
%54
.9%
0.0%
0.0%
419
280
01.
251.
031.
10
Yea
r 282
4.9%
40.2
%53
.7%
1.2%
0.0%
433
441
02.
232.
022.
10
Yea
r 360
21.7
%35
.0%
41.7
%1.
7%0.
0%13
2125
10
3.40
2.99
3.09
Yea
r 482
9.8%
36.6
%50
.0%
3.7%
0.0%
830
413
04.
233.
984.
09
Yea
r 545
20.0
%24
.4%
51.1
%4.
4%0.
0%9
1123
20
5.24
4.97
5.09
Yea
r 671
11.3
%25
.4%
60.6
%2.
8%0.
0%8
1843
20
6.13
5.99
6.13
Prep
- 6
451
11.3
%31
.7%
53.9
%3.
1%0.
0%51
143
243
140
3.27
2.93
3.06
Writ
ing
Prep
606.
7%31
.7%
53.3
%8.
3%0.
0%4
1932
50
F.10
0F.
046
F.11
9
Yea
r 151
11.8
%43
.1%
45.1
%0.
0%0.
0%6
2223
00
1.30
1.01
1.09
Yea
r 282
11.0
%31
.7%
53.7
%3.
7%0.
0%9
2644
30
2.19
1.96
2.06
Yea
r 360
20.0
%38
.3%
40.0
%0.
0%1.
7%12
2324
01
3.44
2.92
3.04
Yea
r 482
18.3
%32
.9%
47.6
%1.
2%0.
0%15
2739
10
4.31
3.88
4.00
Yea
r 545
6.7%
40.0
%48
.9%
4.4%
0.0%
318
222
05.
144.
864.
99
Yea
r 671
11.3
%35
.2%
46.5
%7.
0%0.
0%8
2533
50
6.17
5.87
6.03
Prep
- 6
451
12.6
%35
.5%
48.1
%3.
5%0.
2%57
160
217
161
3.28
2.86
3.00
Prin
ted
on: 2
4/12
/201
5 8:
58:3
8 A
MPa
ge 1
4 of
31
39
IMPR
OV
ING
SC
HO
OL
GO
VER
NA
NC
E
STR
ATEG
IC P
LAN
NIN
G

AusV
ELS
- Stu
dent
s by
Rat
ing
by Y
ear L
evel
201
5 - S
emes
ter 1
Dom
ain
AusV
ELS
Mat
hem
atic
s
Prin
ted
on: 2
4/12
/201
5 8:
58:3
8 A
MPa
ge 1
5 of
31
40
IMPR
OV
ING
SC
HO
OL
GO
VER
NA
NC
E
STR
ATEG
IC P
LAN
NIN
G

AusV
ELS
- Stu
dent
s by
Rat
ing
by Y
ear L
evel
201
5 - S
emes
ter 1
Dom
ain
AusV
ELS
Mat
hem
atic
s
Rat
ing
Mea
n
Perc
enta
ge o
f Stu
dent
sN
umbe
r of S
tude
nts
Scho
olSt
ate
Reg
ion
Dim
ensi
onSt
uden
ts
Ass
esse
dA
BC
DE
AB
CD
E
Mea
sure
men
t and
ge
omet
ry
Yea
r 158
3.4%
29.3
%67
.2%
0.0%
0.0%
217
390
0F.
663
F.52
2F.
598
Yea
r 286
8.1%
22.1
%68
.6%
1.2%
0.0%
719
591
01.
611.
511.
60
Yea
r 364
9.4%
20.3
%67
.2%
3.1%
0.0%
613
432
02.
662.
472.
58
Yea
r 485
5.9%
31.8
%60
.0%
2.4%
0.0%
527
512
03.
643.
453.
55
Yea
r 545
17.8
%35
.6%
37.8
%8.
9%0.
0%8
1617
40
4.74
4.43
4.57
Yea
r 669
24.6
%23
.2%
49.3
%2.
9%0.
0%17
1634
20
5.80
5.40
5.56
Prep
- 6
407
11.1
%26
.5%
59.7
%2.
7%0.
0%45
108
243
110
3.12
2.38
2.54
Num
ber a
nd a
lgeb
ra
Yea
r 158
19.0
%48
.3%
32.8
%0.
0%0.
0%11
2819
00
F.90
5F.
590
F.68
9
Yea
r 286
17.4
%26
.7%
54.7
%1.
2%0.
0%15
2347
10
1.78
1.57
1.69
Yea
r 364
17.2
%28
.1%
51.6
%3.
1%0.
0%11
1833
20
2.85
2.52
2.65
Yea
r 486
14.0
%30
.2%
54.7
%1.
2%0.
0%12
2647
10
3.72
3.47
3.58
Yea
r 545
22.2
%24
.4%
46.7
%6.
7%0.
0%10
1121
30
4.71
4.43
4.57
Yea
r 669
23.2
%24
.6%
42.0
%10
.1%
0.0%
1617
297
05.
755.
415.
57
Prep
- 6
408
18.4
%30
.1%
48.0
%3.
4%0.
0%75
123
196
140
3.23
2.42
2.57
Stat
istic
s an
d pr
obab
ility
Yea
r 158
3.4%
25.9
%70
.7%
0.0%
0.0%
215
410
0F.
646
F.52
9F.
613
Yea
r 286
4.7%
19.8
%74
.4%
1.2%
0.0%
417
641
01.
591.
521.
61
Yea
r 364
6.3%
12.5
%78
.1%
3.1%
0.0%
48
502
02.
562.
472.
58
Yea
r 480
3.8%
12.5
%80
.0%
3.8%
0.0%
310
643
03.
433.
443.
54
Yea
r 545
15.6
%31
.1%
46.7
%6.
7%0.
0%7
1421
30
4.68
4.41
4.55
Yea
r 669
20.3
%24
.6%
50.7
%4.
3%0.
0%14
1735
30
5.75
5.39
5.53
Prep
- 6
402
8.5%
20.1
%68
.4%
3.0%
0.0%
3481
275
120
3.03
2.38
2.51
Prin
ted
on: 2
4/12
/201
5 8:
58:3
8 A
MPa
ge 1
6 of
31
41
IMPR
OV
ING
SC
HO
OL
GO
VER
NA
NC
E
STR
ATEG
IC P
LAN
NIN
G

AusV
ELS
- Stu
dent
s by
Rat
ing
by Y
ear L
evel
201
5 - S
emes
ter 2
Dom
ain
AusV
ELS
Mat
hem
atic
s
Prin
ted
on: 2
4/12
/201
5 8:
58:3
8 A
MPa
ge 1
7 of
31
42
IMPR
OV
ING
SC
HO
OL
GO
VER
NA
NC
E
STR
ATEG
IC P
LAN
NIN
G

AusV
ELS
- Stu
dent
s by
Rat
ing
by Y
ear L
evel
201
5 - S
emes
ter 2
Dom
ain
AusV
ELS
Mat
hem
atic
s
Rat
ing
Mea
n
Perc
enta
ge o
f Stu
dent
sN
umbe
r of S
tude
nts
Scho
olSt
ate
Reg
ion
Dim
ensi
onSt
uden
ts
Ass
esse
dA
BC
DE
AB
CD
E
Mea
sure
men
t and
ge
omet
ry
Prep
661.
5%31
.8%
66.7
%0.
0%0.
0%1
2144
00
F.13
6F.
056
F.13
2
Yea
r 159
16.9
%42
.4%
40.7
%0.
0%0.
0%10
2524
00
1.38
1.06
1.15
Yea
r 284
16.7
%29
.8%
52.4
%1.
2%0.
0%14
2544
10
2.27
2.02
2.14
Yea
r 364
12.5
%35
.9%
50.0
%0.
0%1.
6%8
2332
01
3.32
3.00
3.12
Yea
r 485
21.2
%34
.1%
44.7
%0.
0%0.
0%18
2938
00
4.34
3.97
4.11
Yea
r 548
14.6
%37
.5%
41.7
%6.
3%0.
0%7
1820
30
5.19
4.95
5.11
Yea
r 671
21.1
%26
.8%
47.9
%4.
2%0.
0%15
1934
30
6.23
5.93
6.12
Prep
- 6
477
15.3
%33
.5%
49.5
%1.
5%0.
2%73
160
236
71
3.26
2.89
3.05
Num
ber a
nd a
lgeb
ra
Prep
6610
.6%
57.6
%31
.8%
0.0%
0.0%
738
210
0F.
378
F.12
1F.
213
Yea
r 159
25.4
%42
.4%
32.2
%0.
0%0.
0%15
2519
00
1.51
1.12
1.23
Yea
r 284
25.0
%34
.5%
39.3
%1.
2%0.
0%21
2933
10
2.45
2.08
2.21
Yea
r 364
25.0
%21
.9%
51.6
%0.
0%1.
6%16
1433
01
3.42
3.04
3.16
Yea
r 485
18.8
%35
.3%
44.7
%1.
2%0.
0%16
3038
10
4.31
3.99
4.12
Yea
r 548
22.9
%25
.0%
45.8
%6.
3%0.
0%11
1222
30
5.21
4.95
5.11
Yea
r 671
22.5
%29
.6%
39.4
%7.
0%1.
4%16
2128
51
6.29
5.94
6.12
Prep
- 6
477
21.4
%35
.4%
40.7
%2.
1%0.
4%10
216
919
410
23.
362.
933.
09
Stat
istic
s an
d pr
obab
ility
Prep
661.
5%27
.3%
71.2
%0.
0%0.
0%1
1847
00
F.12
8F.
060
F.13
8
Yea
r 159
15.3
%39
.0%
45.8
%0.
0%0.
0%9
2327
00
1.35
1.07
1.17
Yea
r 284
10.7
%21
.4%
66.7
%1.
2%0.
0%9
1856
10
2.18
2.04
2.14
Yea
r 364
18.8
%21
.9%
57.8
%0.
0%1.
6%12
1437
01
3.26
3.00
3.12
Yea
r 485
9.4%
40.0
%49
.4%
1.2%
0.0%
834
421
04.
263.
974.
10
Yea
r 548
20.8
%25
.0%
47.9
%6.
3%0.
0%10
1223
30
5.21
4.93
5.08
Yea
r 671
14.1
%31
.0%
49.3
%5.
6%0.
0%10
2235
40
6.18
5.91
6.08
Prep
- 6
477
12.4
%29
.6%
56.0
%1.
9%0.
2%59
141
267
91
3.21
2.90
3.06
Prin
ted
on: 2
4/12
/201
5 8:
58:3
8 A
MPa
ge 1
8 of
31
43
IMPR
OV
ING
SC
HO
OL
GO
VER
NA
NC
E
STR
ATEG
IC P
LAN
NIN
G

AusV
ELS
- Stu
dent
s by
Rat
ing
by Y
ear L
evel
201
5 - S
emes
ter 1
Dom
ain
AusV
ELS
Scie
nce
AusV
ELS
- Stu
dent
s by
Rat
ing
by Y
ear L
evel
201
5 - S
emes
ter 1
Dom
ain
AusV
ELS
Scie
nce
No
Dat
a A
vaila
ble
Prin
ted
on: 2
4/12
/201
5 8:
58:3
8 A
MPa
ge 1
9 of
31
44
IMPR
OV
ING
SC
HO
OL
GO
VER
NA
NC
E
STR
ATEG
IC P
LAN
NIN
G
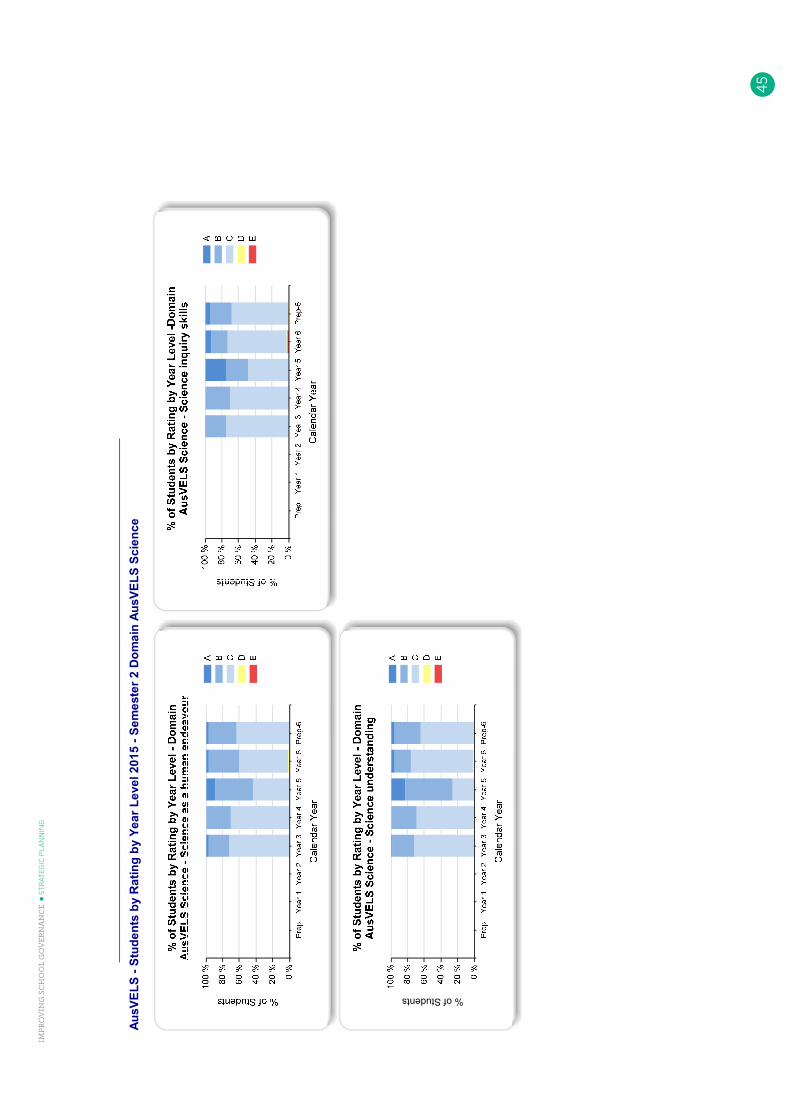
AusV
ELS
- Stu
dent
s by
Rat
ing
by Y
ear L
evel
201
5 - S
emes
ter 2
Dom
ain
AusV
ELS
Scie
nce
% of Students
Prin
ted
on: 2
4/12
/201
5 8:
58:3
8 A
MPa
ge 2
0 of
31
45
IMPR
OV
ING
SC
HO
OL
GO
VER
NA
NC
E
STR
ATEG
IC P
LAN
NIN
G

AusV
ELS
- Stu
dent
s by
Rat
ing
by Y
ear L
evel
201
5 - S
emes
ter 2
Dom
ain
AusV
ELS
Scie
nce
Rat
ing
Mea
n
Perc
enta
ge o
f Stu
dent
sN
umbe
r of S
tude
nts
Scho
olSt
ate
Reg
ion
Dim
ensi
onSt
uden
ts
Ass
esse
dA
BC
DE
AB
CD
E
Scie
nce
as a
hum
an
ende
avou
r
Yea
r 364
3.1%
25.0
%71
.9%
0.0%
0.0%
216
460
03.
142.
973.
04
Yea
r 485
0.0%
29.4
%70
.6%
0.0%
0.0%
025
600
04.
143.
964.
03
Yea
r 546
10.9
%45
.7%
43.5
%0.
0%0.
0%5
2120
00
5.32
4.95
5.03
Yea
r 671
2.8%
36.6
%59
.2%
1.4%
0.0%
226
421
06.
085.
966.
08
Prep
- 6
266
3.4%
33.1
%63
.2%
0.4%
0.0%
988
168
10
4.62
4.13
4.30
Scie
nce
inqu
iry s
kills
Yea
r 364
1.6%
23.4
%75
.0%
0.0%
0.0%
115
480
03.
122.
973.
05
Yea
r 485
0.0%
29.4
%70
.6%
0.0%
0.0%
025
600
04.
133.
974.
06
Yea
r 545
24.4
%26
.7%
48.9
%0.
0%0.
0%11
1222
00
5.32
4.96
5.04
Yea
r 671
7.0%
19.7
%70
.4%
1.4%
1.4%
514
501
16.
065.
976.
08
Prep
- 6
265
6.4%
24.9
%67
.9%
0.4%
0.4%
1766
180
11
4.61
4.11
4.31
Scie
nce
unde
rsta
ndin
g
Yea
r 364
1.6%
26.6
%71
.9%
0.0%
0.0%
117
460
03.
132.
983.
05
Yea
r 485
0.0%
30.6
%69
.4%
0.0%
0.0%
026
590
04.
143.
984.
05
Yea
r 546
17.4
%56
.5%
26.1
%0.
0%0.
0%8
2612
00
5.46
4.97
5.05
Yea
r 671
4.2%
19.7
%74
.6%
1.4%
0.0%
314
531
06.
045.
986.
07
Prep
- 6
266
4.5%
31.2
%63
.9%
0.4%
0.0%
1283
170
10
4.63
4.06
4.24
Prin
ted
on: 2
4/12
/201
5 8:
58:3
8 A
MPa
ge 2
1 of
31
46
IMPR
OV
ING
SC
HO
OL
GO
VER
NA
NC
E
STR
ATEG
IC P
LAN
NIN
G
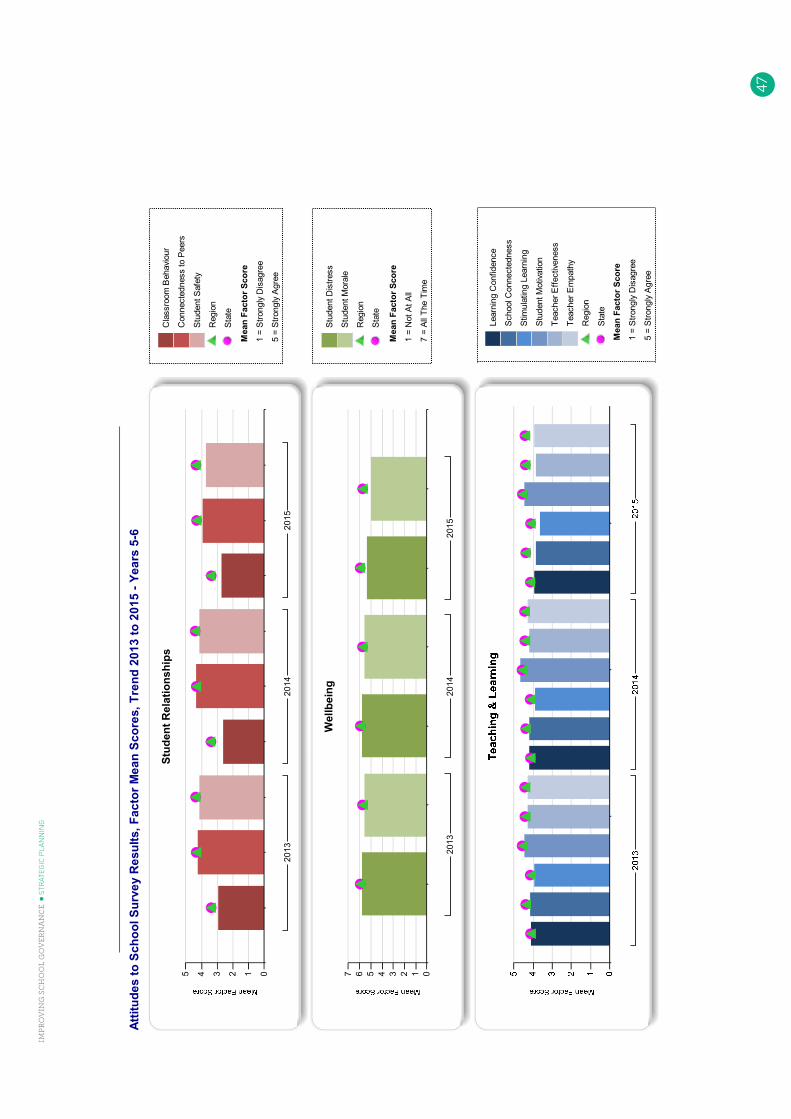
Attit
udes
to S
choo
l Sur
vey
Res
ults
, Fac
tor M
ean
Scor
es, T
rend
201
3 to
201
5 - Y
ears
5-6
012345
2013
2014
2015
Stud
ent R
elat
ions
hips
Cla
ssro
om B
ehav
iour
Con
nect
edne
ss to
Pee
rs
Stu
dent
Saf
ety
Reg
ion
Stat
e
Mea
n Fa
ctor
Sco
re
1 =
Stro
ngly
Dis
agre
e
5 =
Stro
ngly
Agr
ee
01234567
2013
2014
2015
Wel
lbei
ngS
tude
nt D
istre
ss
Stu
dent
Mor
ale
Reg
ion
Stat
e
Mea
n Fa
ctor
Sco
re
1 =
Not
At A
ll
7 =
All T
he T
ime
Mea
n Fa
ctor
Sco
re
1 =
Stro
ngly
Dis
agre
e
5 =
Stro
ngly
Agr
ee
Lear
ning
Con
fiden
ce
Sch
ool C
onne
cted
ness
Stim
ulat
ing
Lear
ning
Stu
dent
Mot
ivat
ion
Teac
her E
ffect
iven
ess
Teac
her E
mpa
thy
Reg
ion
Stat
e
Prin
ted
on: 2
4/12
/201
5 8:
58:3
9 A
MPa
ge 2
2 of
31
47
IMPR
OV
ING
SC
HO
OL
GO
VER
NA
NC
E
STR
ATEG
IC P
LAN
NIN
G
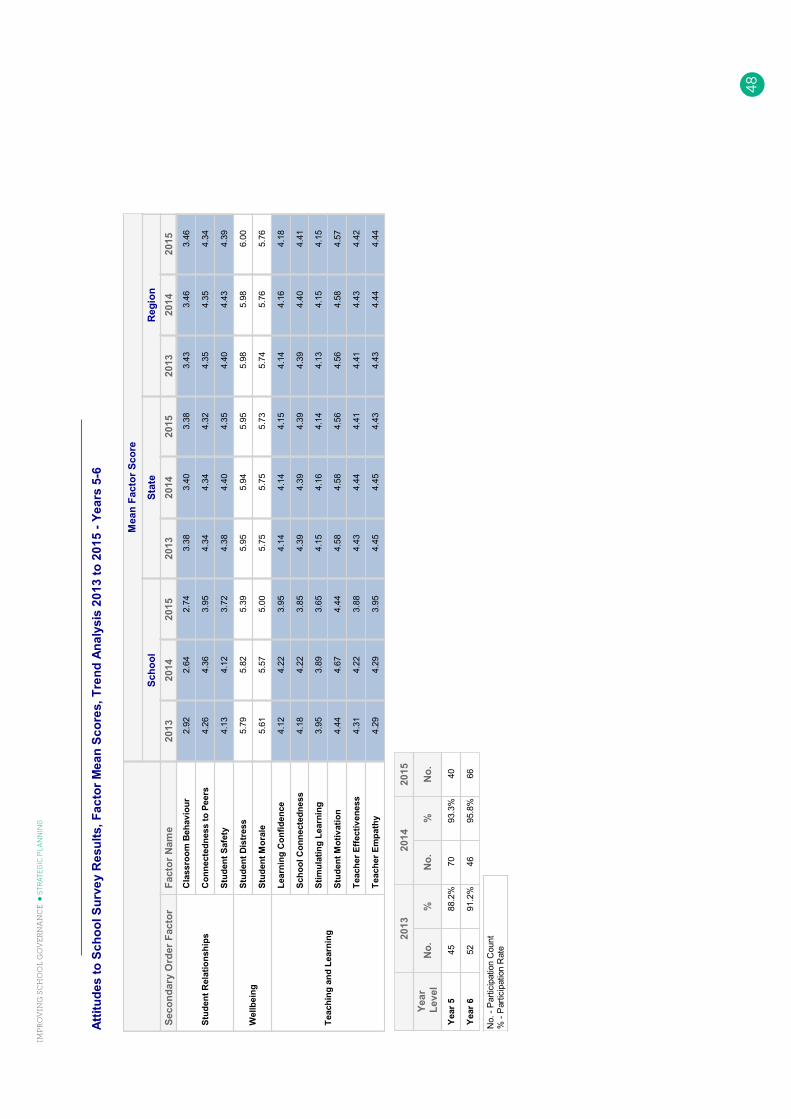
2013
2014
2015
Year
Le
vel
No.
%N
o.%
No.
Yea
r 545
88.2
%70
93.3
%40
Yea
r 652
91.2
%46
95.8
%66
No.
- P
artic
ipat
ion
Cou
nt%
- P
artic
ipat
ion
Rat
e
Mea
n Fa
ctor
Sco
re
Scho
olSt
ate
Reg
ion
Seco
ndar
y O
rder
Fac
tor
Fact
or N
ame
2013
2014
2015
2013
2014
2015
2013
2014
2015
Stud
ent R
elat
ions
hips
Cla
ssro
om B
ehav
iour
2.92
2.64
2.74
3.38
3.40
3.38
3.43
3.46
3.46
Con
nect
edne
ss to
Pee
rs4.
264.
363.
954.
344.
344.
324.
354.
354.
34
Stud
ent S
afet
y4.
134.
123.
724.
384.
404.
354.
404.
434.
39
Wel
lbei
ngSt
uden
t Dis
tres
s5.
795.
825.
395.
955.
945.
955.
985.
986.
00
Stud
ent M
oral
e5.
615.
575.
005.
755.
755.
735.
745.
765.
76
Teac
hing
and
Lea
rnin
g
Lear
ning
Con
fiden
ce4.
124.
223.
954.
144.
144.
154.
144.
164.
18
Scho
ol C
onne
cted
ness
4.18
4.22
3.85
4.39
4.39
4.39
4.39
4.40
4.41
Stim
ulat
ing
Lear
ning
3.95
3.89
3.65
4.15
4.16
4.14
4.13
4.15
4.15
Stud
ent M
otiv
atio
n4.
444.
674.
444.
584.
584.
564.
564.
584.
57
Teac
her E
ffect
iven
ess
4.31
4.22
3.88
4.43
4.44
4.41
4.41
4.43
4.42
Teac
her E
mpa
thy
4.29
4.29
3.95
4.45
4.45
4.43
4.43
4.44
4.44
Attit
udes
to S
choo
l Sur
vey
Res
ults
, Fac
tor M
ean
Scor
es, T
rend
Ana
lysi
s 20
13 to
201
5 - Y
ears
5-6
Prin
ted
on: 2
4/12
/201
5 8:
58:3
9 A
MPa
ge 2
3 of
31
48
IMPR
OV
ING
SC
HO
OL
GO
VER
NA
NC
E
STR
ATEG
IC P
LAN
NIN
G

Attit
udes
to S
choo
l Sur
vey
Res
ults
, Per
cent
ile 2
015
- Yea
rs 5
-6
025
5075
100
Per
cent
ile
Teac
her E
mpa
thy
Teac
her E
ffect
iven
ess
Stu
dent
Mot
ivat
ion
Stim
ulat
ing
Lear
ning
Sch
ool C
onne
cted
ness
Lear
ning
Con
fiden
ce
Stu
dent
Mor
ale
Stu
dent
Dis
tress
Stu
dent
Saf
ety
Con
nect
edne
ss to
Pee
rs
Cla
ssro
om B
ehav
iour
Firs
t Qua
rtile
Firs
t Qua
rtile
Seco
nd Q
uart
ileTh
ird Q
uart
ileFo
urth
Qua
rtile
Prin
ted
on: 2
4/12
/201
5 8:
58:3
9 A
MPa
ge 2
4 of
31
49
IMPR
OV
ING
SC
HO
OL
GO
VER
NA
NC
E
STR
ATEG
IC P
LAN
NIN
G

Perc
entil
e
2013
2014
2015
Pare
nt F
acto
r Nam
eFa
ctor
Nam
e
Stud
ent R
elat
ions
hips
Cla
ssro
om B
ehav
iour
24.1
11.0
15.6
Con
nect
edne
ss to
Pee
rs37
.454
.88.
4
Stud
ent S
afet
y18
.314
.94.
4
Wel
lbei
ngSt
uden
t Dis
tres
s32
.136
.58.
1
Stud
ent M
oral
e35
.434
.05.
6
Teac
hing
and
Lea
rnin
g
Lear
ning
Con
fiden
ce50
.666
.526
.1
Scho
ol C
onne
cted
ness
21.3
25.3
5.5
Stim
ulat
ing
Lear
ning
26.4
21.8
9.1
Stud
ent M
otiv
atio
n24
.569
.326
.7
Teac
her E
ffect
iven
ess
28.1
18.1
2.8
Teac
her E
mpa
thy
24.4
23.7
4.1
Attit
udes
to S
choo
l Sur
vey
Res
ults
, Per
cent
ile, T
rend
201
3 to
201
5 - Y
ears
5-6
Prin
ted
on: 2
4/12
/201
5 8:
58:3
9 A
MPa
ge 2
5 of
31
50
IMPR
OV
ING
SC
HO
OL
GO
VER
NA
NC
E
STR
ATEG
IC P
LAN
NIN
G

Pre
p
Year
1
Year
2
Year
3
Year
4
Year
5
Year
6
Stud
ent A
bsen
ces,
Tre
nd 2
013
to 2
015
- Day
s pe
r Ful
l Tim
e Eq
uiva
lent
by
Year
Lev
el
Scho
olSt
ate
2013
2014
2013
2014
Prep
12.7
110
.79
15.3
114
.70
Yea
r 112
.87
12.6
014
.79
14.5
2
Yea
r 213
.70
12.8
214
.46
13.9
8
Yea
r 313
.27
11.2
613
.98
13.9
1
Yea
r 412
.71
12.1
314
.18
13.8
6
Yea
r 514
.33
13.1
814
.31
14.1
7
Yea
r 614
.26
14.1
814
.80
14.6
9
Prep
- Y
ear 6
13.3
212
.36
14.5
614
.27
Stud
ent A
bsen
ces
- Day
s pe
r Ful
l Tim
e Eq
uiva
lent
by
Year
Le
vel
Prin
ted
on: 2
4/12
/201
5 8:
58:3
9 A
MPa
ge 2
6 of
31
51
IMPR
OV
ING
SC
HO
OL
GO
VER
NA
NC
E
STR
ATEG
IC P
LAN
NIN
G

Prep
Yea
r 1Y
ear 2
Yea
r 3Y
ear 4
Yea
r 5Y
ear 6
Scho
ol
Mea
n
2013
Acc
iden
t0.
010.
010.
010.
030.
01
Ber
eave
men
t0.
090.
020.
010.
020.
040.
080.
04
Cou
nsel
ling
0.01
0.00
Den
tist
0.03
0.07
0.09
0.03
0.01
0.02
0.01
0.04
Exte
nded
Fam
ily
Hol
iday
s4.
593.
545.
434.
693.
203.
563.
904.
18
Hos
pita
lised
0.01
0.03
0.01
Illne
ss4.
785.
304.
103.
515.
986.
483.
474.
79
Med
ical
0.20
0.35
0.22
0.24
0.06
0.89
0.56
0.32
Med
ical
App
oint
men
t0.
010.
080.
250.
030.
090.
050.
100.
09
Med
ical
/Wel
fare
0.01
0.04
0.02
0.08
0.02
Pare
nt C
hoic
e Sc
hool
App
rove
d0.
400.
530.
391.
120.
671.
050.
370.
62
Pare
nt C
hoic
e U
naut
horis
ed0.
200.
360.
280.
120.
360.
050.
030.
22
Ref
usal
0.01
0.00
Rel
igio
us/C
ultu
ral
Obs
erva
nce
0.02
0.08
0.02
0.02
Scho
ol C
hoic
e1.
952.
021.
961.
901.
901.
911.
991.
95
Une
xpla
ined
0.44
0.61
0.92
1.52
0.40
0.19
3.69
1.03
Yea
r Lev
el M
ean
12.7
112
.87
13.7
013
.27
12.7
114
.33
14.2
613
.32
2014
Acc
iden
t0.
010.
010.
010.
00
Ber
eave
men
t0.
050.
020.
020.
030.
030.
040.
030.
03
Cou
nsel
ling
0.01
0.01
0.00
Den
tist
0.09
0.10
0.08
0.04
0.02
0.01
0.13
0.06
Exte
nded
Fam
ily
Hol
iday
s4.
984.
874.
723.
994.
604.
103.
764.
44
Hos
pita
lised
0.02
0.01
0.01
0.00
Illne
ss3.
345.
034.
764.
334.
193.
493.
124.
13
Med
ical
0.24
0.34
0.28
0.17
0.20
0.21
0.43
0.26
Med
ical
App
oint
men
t0.
100.
160.
330.
060.
090.
110.
220.
15
Med
ical
/Wel
fare
0.01
0.01
0.01
0.01
Pare
nt C
hoic
e Sc
hool
App
rove
d0.
670.
830.
691.
311.
390.
920.
480.
93
Stud
ent A
bsen
ces
- Day
s pe
r Ful
l Tim
e Eq
uiva
lent
by
Year
Lev
el a
nd A
bsen
ce T
ype
Prin
ted
on: 2
4/12
/201
5 8:
58:3
9 A
MPa
ge 2
7 of
31
52
IMPR
OV
ING
SC
HO
OL
GO
VER
NA
NC
E
STR
ATEG
IC P
LAN
NIN
G

Prep
Yea
r 1Y
ear 2
Yea
r 3Y
ear 4
Yea
r 5Y
ear 6
Scho
ol
Mea
n
2014
Pare
nt C
hoic
e U
naut
horis
ed0.
030.
140.
090.
020.
250.
050.
170.
10
Rel
igio
us/C
ultu
ral
Obs
erva
nce
0.01
0.02
0.00
Scho
ol C
hoic
e0.
020.
00
Susp
ensi
on -
Exte
rnal
0.33
0.03
Une
xpla
ined
1.23
1.07
1.83
1.31
1.35
4.24
5.50
2.21
Yea
r Lev
el M
ean
10.7
912
.60
12.8
211
.26
12.1
313
.18
14.1
812
.36
Prin
ted
on: 2
4/12
/201
5 8:
58:3
9 A
MPa
ge 2
8 of
31
53
IMPR
OV
ING
SC
HO
OL
GO
VER
NA
NC
E
STR
ATEG
IC P
LAN
NIN
G

SEH
Q -
Gen
eral
dev
elop
men
tal s
tatu
s of
chi
ldre
n en
terin
g yo
ur s
choo
l at P
rep
Year
- 20
15
No
Dat
a A
vaila
ble
Prep
chi
ldre
n in
you
r sch
ool a
t hig
h ris
k of
gen
eral
dev
elop
men
t pro
blem
s
No
Dat
a A
vaila
ble
Wha
t are
the
maj
or a
spec
ts o
f con
cern
abo
ut th
ese
child
ren
iden
tifie
d by
the
pare
nts?
Surv
ey Y
ear
2010
2011
2012
2013
2014
Res
pond
ents
4961
5582
49
SEH
Q -
Num
ber o
f res
pond
ents
to th
e Q
uest
ionn
aire
Prin
ted
on: 2
4/12
/201
5 8:
58:3
9 A
MPa
ge 2
9 of
31
54
IMPR
OV
ING
SC
HO
OL
GO
VER
NA
NC
E
STR
ATEG
IC P
LAN
NIN
G

SEH
Q -
Soci
al, E
mot
iona
l and
beh
avio
ural
dev
elop
men
t sta
tus
of c
hild
ren
ente
ring
your
sch
ool a
t Pre
p - 2
015
No
Dat
a A
vaila
ble
Prep
chi
ldre
n in
you
r sch
ool a
t hig
h ris
k of
soc
ial,
emot
iona
l and
beh
avio
ural
pr
oble
ms
No
Dat
a A
vaila
ble
Wha
t are
the
maj
or a
spec
ts o
f beh
avio
ural
pro
blem
s am
ong
thes
e ch
ildre
n?
Surv
ey Y
ear
2010
2011
2012
2013
2014
Res
pond
ents
4961
5582
49
SEH
Q -
Num
ber o
f res
pond
ents
to th
e Q
uest
ionn
aire
Prin
ted
on: 2
4/12
/201
5 8:
58:3
9 A
MPa
ge 3
0 of
31
55
IMPR
OV
ING
SC
HO
OL
GO
VER
NA
NC
E
STR
ATEG
IC P
LAN
NIN
G
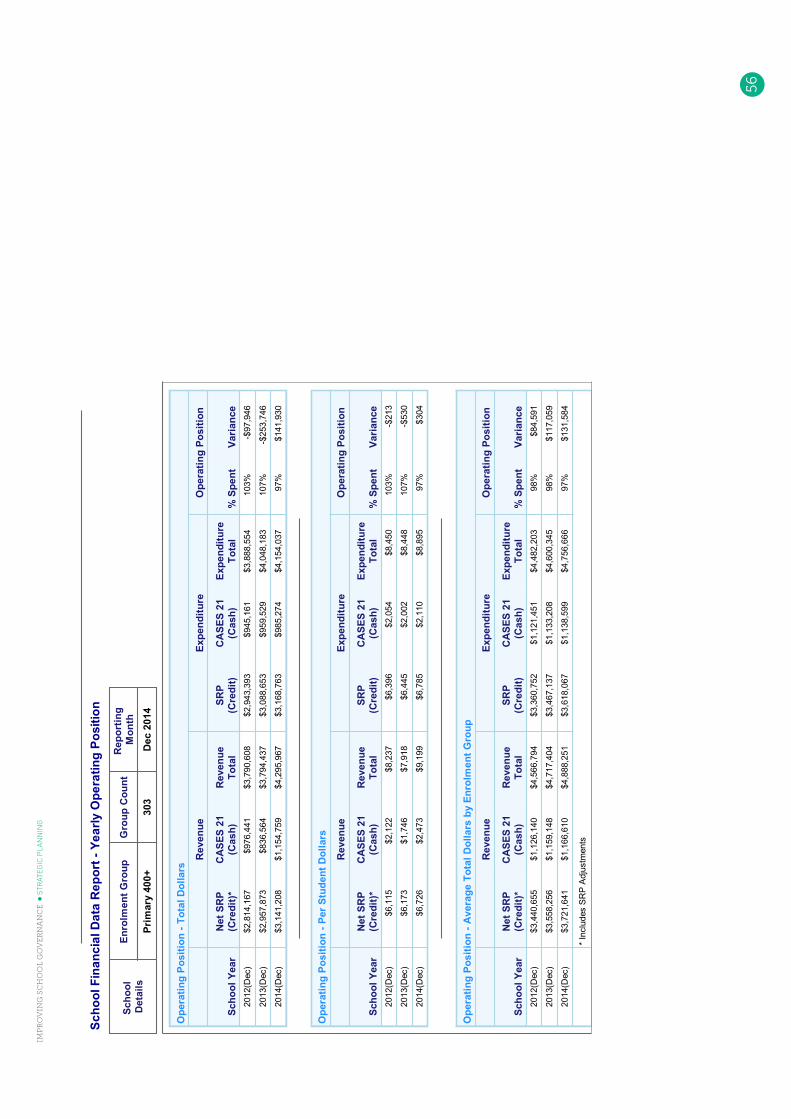
Scho
ol F
inan
cial
Dat
a R
epor
t - Y
early
Ope
ratin
g Po
sitio
n
Ope
ratin
g Po
sitio
n - T
otal
Dol
lars
Rev
enue
Expe
nditu
reO
pera
ting
Posi
tion
Scho
ol Y
ear
Net
SR
P(C
redi
t)*C
ASE
S 21
(Cas
h)R
even
ueTo
tal
SRP
(Cre
dit)
CA
SES
21(C
ash)
Expe
nditu
reTo
tal
% S
pent
Varia
nce
2012
(Dec
)$2
,814
,167
$976
,441
$3,7
90,6
08$2
,943
,393
$945
,161
$3,8
88,5
5410
3%-$
97,9
46
2013
(Dec
)$2
,957
,873
$836
,564
$3,7
94,4
37$3
,088
,653
$959
,529
$4,0
48,1
8310
7%-$
253,
746
2014
(Dec
)$3
,141
,208
$1,1
54,7
59$4
,295
,967
$3,1
68,7
63$9
85,2
74$4
,154
,037
97%
$141
,930
Ope
ratin
g Po
sitio
n - P
er S
tude
nt D
olla
rs
Rev
enue
Expe
nditu
reO
pera
ting
Posi
tion
Scho
ol Y
ear
Net
SR
P(C
redi
t)*C
ASE
S 21
(Cas
h)R
even
ueTo
tal
SRP
(Cre
dit)
CA
SES
21(C
ash)
Expe
nditu
reTo
tal
% S
pent
Varia
nce
2012
(Dec
)$6
,115
$2,1
22$8
,237
$6,3
96$2
,054
$8,4
5010
3%-$
213
2013
(Dec
)$6
,173
$1,7
46$7
,918
$6,4
45$2
,002
$8,4
4810
7%-$
530
2014
(Dec
)$6
,726
$2,4
73$9
,199
$6,7
85$2
,110
$8,8
9597
%$3
04
Ope
ratin
g Po
sitio
n - A
vera
ge T
otal
Dol
lars
by
Enro
lmen
t Gro
up
Rev
enue
Expe
nditu
reO
pera
ting
Posi
tion
Scho
ol Y
ear
Net
SR
P(C
redi
t)*C
ASE
S 21
(Cas
h)R
even
ueTo
tal
SRP
(Cre
dit)
CA
SES
21(C
ash)
Expe
nditu
reTo
tal
% S
pent
Varia
nce
2012
(Dec
)$3
,440
,655
$1,1
26,1
40$4
,566
,794
$3,3
60,7
52$1
,121
,451
$4,4
82,2
0398
%$8
4,59
1
2013
(Dec
)$3
,558
,256
$1,1
59,1
48$4
,717
,404
$3,4
67,1
37$1
,133
,208
$4,6
00,3
4598
%$1
17,0
59
2014
(Dec
)$3
,721
,641
$1,1
66,6
10$4
,888
,251
$3,6
18,0
67$1
,138
,599
$4,7
56,6
6697
%$1
31,5
84
* In
clud
es S
RP
Adj
ustm
ents
Scho
ol
Det
ails
Enro
lmen
t Gro
upG
roup
Cou
ntR
epor
ting
Mon
th
Prim
ary
400+
303
Dec
201
4
Prin
ted
on: 2
4/12
/201
5 8:
58:3
9 A
MPa
ge 3
1 of
31
56
IMPR
OV
ING
SC
HO
OL
GO
VER
NA
NC
E
STR
ATEG
IC P
LAN
NIN
G

Happy Valley Secondary College
Performance Summary
The Government School Performance Summary provides an overview of how this school is performing and how it compares to all other Victorian government schools. All schools work in partnership with their school community to improve outcomes for children and young people. Sharing this information with parents and the wider school community will foster engagement and collaboration to support further gains and positive learning experiences for all students.
School Profile
School Enrolments A total of 1028 students were enrolled at this school in 2014, 399 female and 629 male.
Overall socio-economic profile Based on the school's Student Family Occupation index which takes into account parents' occupations.
Proportion of students with English as a second language.
Parent Satisfaction Summary Average level of parent satisfaction with the school, as derived from the annual Parent Opinion survey. The score is reported on a scale of 1 to 7, where 7 is the highest possible score.
School Staff Survey Measures the percent endorsement by staff on school climate derived from the annual School Staff survey. The percent endorsement indicates the percent of positive responses (agree or strongly agree) on school climate from staff at the school. Data are suppressed for schools with fewer than three respondents to the survey for confidentiality reasons.
Key: Range of results for the middle 60% of Victorian government schools: Result for this school: Median of all Victorian government schools:
57
IMPROVING SCHOOL GOVERNANCE STRATEGIC PLANNING

Happy Valley Secondary College
Performance Summary
Achievement
Student Outcomes
School Comparison
Teacher assessments from the Australian Curriculum/Victorian Essential Learning Standards (AusVELS) Percentage of students in Years 7 to 10 with a grade of C or above in: • English • Mathematics The grades are the same as those used in your child's end of year report. A 'C' rating means that a student is at the standard expected at the time of reporting.
NAPLAN Year 7 Average score achieved on the NAPLAN Reading and Numeracy tests conducted in May each year. Year 7 assessments are reported on a scale from Bands 4-9. Bands represent different levels of achievement. For Year 7, the National Minimum Standard is at Band 5.
Being the first year of secondary school, Year 7 NAPLAN is not used for the School Comparison.
NAPLAN Year 9 Average score achieved on the NAPLAN Reading and Numeracy tests conducted in May each year. Year 9 assessments are reported on a scale from Bands 5-10. Bands represent different levels of achievement. For Year 9, the National Minimum Standard is at Band 6.
Key: Range of results for the middle 60% of Victorian government schools: Result for this school: Median of all Victorian government schools:
58
IMPROVING SCHOOL GOVERNANCE STRATEGIC PLANNING

Happy Valley Secondary College
Performance Summary
Achievement
Student Outcomes
School Comparison
NAPLAN Learning Gain does not require a School Comparison.
NAPLAN Learning Gain Year 5 - Year 7 Learning gain of students from Year 5 to Year 7 in the following domains; Reading, Numeracy, Writing, Spelling & Grammar and Punctuation. NAPLAN learning gain is determined by comparing a student's current year result to the results of all ‘similar’ Victorian students (i.e. students in all sectors in the same year level who had the same score two years prior). If the current year result is in the top 25%, their gain level is categorised as ‘High’, middle 50%, is ‘Medium’ and bottom 25%, is ‘Low’.
NAPLAN Learning Gain Year 7 - Year 9 Learning gain of students from Year 7 to Year 9 in the following domains; Reading, Numeracy, Writing, Spelling & Grammar and Punctuation. NAPLAN learning gain is determined by comparing a student's current year result to the results of all ‘similar’ Victorian students (i.e. students in all sectors in the same year level who had the same score two years prior). If the current year result is in the top 25%, their gain level is categorised as ‘High’, middle 50%, is ‘Medium’ and bottom 25%, is ‘Low’.
NAPLAN Learning Gain does not require a School Comparison.
Victorian Certificate of Education (VCE) Mean study score from all VCE subjects undertaken by students at this school. This includes all Unit 3 and 4 studies (including those completed in Year 11) and any VCE VET studies awarded a study score. The maximum student study score is 50 and the state-wide mean (including government and non-government schools) is set at 30.
Students in 2014 who satisfactorily completed their VCE: 99% Year 12 students in 2014 undertaking at least one Vocational Education and Training (VET) unit of competence: 6% VET units of competence satisfactorily completed in 2014: 98% Victorian Certificate of Applied Learning (VCAL) credits satisfactorily completed in 2014: N/A
Key: Range of results for the middle 60% of Victorian government schools: Result for this school: Median of all Victorian government schools:
59
IMPROVING SCHOOL GOVERNANCE STRATEGIC PLANNING

Happy Valley Secondary College
Performance Summary
Engagement
Student Outcomes
School Comparison
Student Attendance Average days absent per full time equivalent (FTE) student per year. Common reasons for non-attendance include illness and extended family holidays. Absence from school can impact on students’ learning. A school comparison rating of ‘lower’ indicates that the absence rate in this school is greater than what we would estimate, given the background characteristics of their students. Average 2014 attendance rate by year level:
Yr7
Yr8
Yr9
Yr10
Yr11
Yr12
94 %
94 %
92 %
94 %
97 %
96 %
Student Retention Percentage of Year 7 students who remain at the school through to Year 10.
Students exiting to further studies and full-time employment Percentage of students from Years 10 to 12 going on to further studies or full-time employment. Note: This measure uses data from the previous year.
Key: Range of results for the middle 60% of Victorian government schools: Result for this school: Median of all Victorian government schools:
60
IMPROVING SCHOOL GOVERNANCE STRATEGIC PLANNING
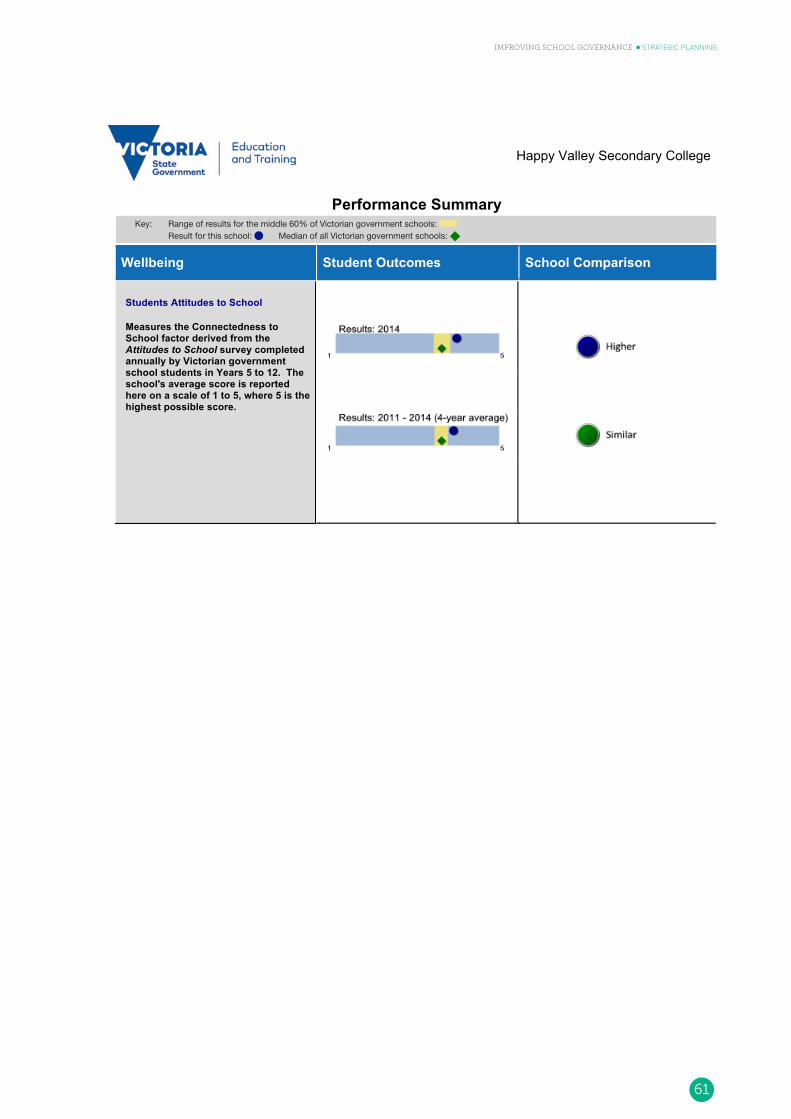
Happy Valley Secondary College
Performance Summary
Wellbeing
Student Outcomes
School Comparison
Students Attitudes to School Measures the Connectedness to School factor derived from the Attitudes to School survey completed annually by Victorian government school students in Years 5 to 12. The school's average score is reported here on a scale of 1 to 5, where 5 is the highest possible score.
Key: Range of results for the middle 60% of Victorian government schools: Result for this school: Median of all Victorian government schools:
61
IMPROVING SCHOOL GOVERNANCE STRATEGIC PLANNING
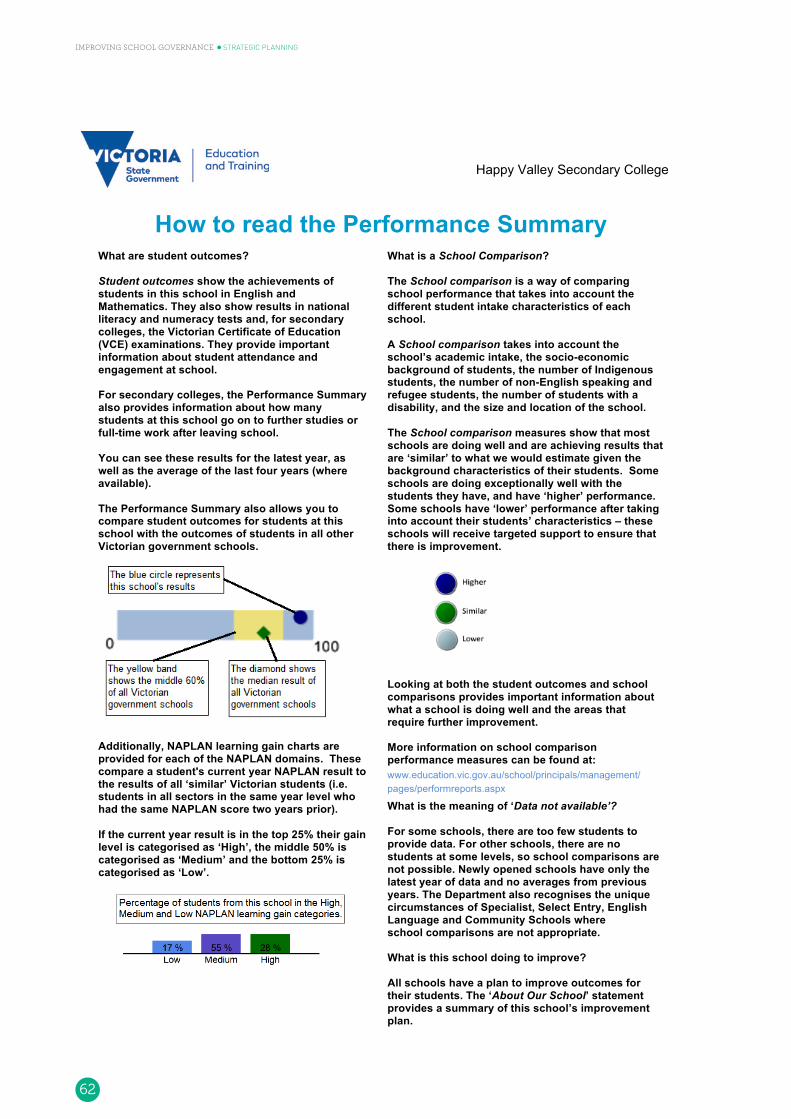
Happy Valley Secondary College
How to read the Performance Summary
What are student outcomes? Student outcomes show the achievements of students in this school in English and Mathematics. They also show results in national literacy and numeracy tests and, for secondary colleges, the Victorian Certificate of Education (VCE) examinations. They provide important information about student attendance and engagement at school. For secondary colleges, the Performance Summary also provides information about how many students at this school go on to further studies or full-time work after leaving school. You can see these results for the latest year, as well as the average of the last four years (where available). The Performance Summary also allows you to compare student outcomes for students at this school with the outcomes of students in all other Victorian government schools.
What is a School Comparison? The School comparison is a way of comparing school performance that takes into account the different student intake characteristics of each school. A School comparison takes into account the school’s academic intake, the socio-economic background of students, the number of Indigenous students, the number of non-English speaking and refugee students, the number of students with a disability, and the size and location of the school. The School comparison measures show that most schools are doing well and are achieving results that are ‘similar’ to what we would estimate given the background characteristics of their students. Some schools are doing exceptionally well with the students they have, and have ‘higher’ performance. Some schools have ‘lower’ performance after taking into account their students’ characteristics – these schools will receive targeted support to ensure that there is improvement.
Looking at both the student outcomes and school comparisons provides important information about what a school is doing well and the areas that require further improvement. More information on school comparison performance measures can be found at:
What is the meaning of ‘Data not available’? For some schools, there are too few students to provide data. For other schools, there are no students at some levels, so school comparisons are not possible. Newly opened schools have only the latest year of data and no averages from previous years. The Department also recognises the unique circumstances of Specialist, Select Entry, English Language and Community Schools where school comparisons are not appropriate. What is this school doing to improve? All schools have a plan to improve outcomes for their students. The ‘About Our School’ statement provides a summary of this school’s improvement plan.
Additionally, NAPLAN learning gain charts are provided for each of the NAPLAN domains. These compare a student's current year NAPLAN result to the results of all ‘similar’ Victorian students (i.e. students in all sectors in the same year level who had the same NAPLAN score two years prior). If the current year result is in the top 25% their gain level is categorised as ‘High’, the middle 50% is categorised as ‘Medium’ and the bottom 25% is categorised as ‘Low’.
62
IMPROVING SCHOOL GOVERNANCE STRATEGIC PLANNING

Happy Valley Secondary College
Financial Performance and Position
Financial Performance - Operating Statement Summary for the year ending 31 December, 2014
Financial Position as at 31 December, 2014
Revenue
Actual
Funds Available Actual High Yield Investment Account $528,549
Official Account $7,063
Other Accounts $702,873
Total Funds Available $1,238,486
Student Resource Package
$7,410,541
Government Provided DE&T Grants $1,319,415
Government Grants Commonwealth $12,120
Government Grants State $20,751
Revenue Other $85,796
Locally Raised Funds $1,743,276
Total Operating Revenue
$10,591,898
Expenditure
Financial Commitments
Operating Reserve $512,880
Beneficiary/Memorial Accounts $3,500
Cooperative Bank Account $23,500
Revenue Receipted in Advance $623,092
Repayable to DEECD $52,369
Other recurrent expenditure $23,145
Total Financial Commitments $1,238,486
Student Resource Package
$8,534,007
Books & Publications $17,040
Communication Costs $49,299
Consumables $270,245
Miscellaneous Expense $1,553,090
Professional Development $72,167
Property and Equipment Services $865,122
Salaries & Allowances $189,876
Trading & Fundraising $52,368
Travel & Subsistence $7,709
Utilities $87,112
Total Operating Expenditure
$11,698,036
Net Operating Surplus/-Deficit
($1,106,138)
Asset Acquisitions
$36,970
Misc Expenses may include Bank charges, Health and Personal Development, Administration charges, Camp/Excursion costs and Taxation charges.
Salaries and Allowances refers to school-level payroll.
Financial performance and position commentary
Deficit is managed through the funds received from Overseas Students.
63
IMPROVING SCHOOL GOVERNANCE STRATEGIC PLANNING

Handout B1School strategic planning: quiz
No. Question Answer
1. Which of the following are councillors responsible for in the school self-evaluation process?
i. planning the self-evaluation
ii. keeping everyone informed about the contents of the report
iii. endorsement of the final report
iv. forwarding the report to the Department
v. participating in consultations with the community
vi. reviewing the plan and timeline for the self-evaluation.
Clue: only 3 are correct
2. Which key Improvement Cycle documents does the school council endorse?
3. What is the most effective way that councillors can become aware of the values and aspirations of their community?
4. How many different types of review are there?
5. What can you do if you want to comment on the review process?
6. You may think a particular building or resource needs to be improved. On what grounds would you have the best chance of gaining funding for such an initiative?
7. How might information from the attitudes to school survey impact on setting goals and targets?
8. How is the School Strategic Plan implemented?
9. How often should the School Strategic Plan be reviewed and updated?
10. When does the school annual report need to be completed and submitted to the Department?
11. What do you see as the most important part of your role as a school councillor?
64
IMPROVING SCHOOL GOVERNANCE STRATEGIC PLANNING