Embed Size (px)
DESCRIPTION
Research on child development
Citation preview
NBER WORKING PAPER SERIES
STRATEGIC PARENTING, BIRTH ORDER AND SCHOOL PERFORMANCE
V. Joseph HotzJuan Pantano
Working Paper 19542http://www.nber.org/papers/w19542
NATIONAL BUREAU OF ECONOMIC RESEARCH1050 Massachusetts Avenue
Cambridge, MA 02138October 2013
We thank helpful comments from Dan Ackerberg, Sandy Black, Leah Boustan, Moshe Buchinsky,Dora Costa, Harold Demsetz, Paul Devereux, Donna Ginther, Bart Hamilton, Guillermo Ordonez,Bob Pollak, John Riley, Joe Rodgers, Kjell Salvanes, Judith Seltzer, Bruce Weinberg and participantsat the UCLA Proseminar in I.O., the UCLA Proseminar in Applied Microeconomics, the CaliforniaCenter for Population Research, the 2008 PAA meetings in New Orleans, the 2008 SOLE meetingsin New York City, and at seminars at Washington University in St. Louis and Duke University, andfrom respondents to the Colin Clark Lecture delivered by one of us (Hotz) at the 2011 EconometricSociety Australasian Meeting. All errors remain ours. The views expressed herein are those of theauthors and do not necessarily reflect the views of the National Bureau of Economic Research.
NBER working papers are circulated for discussion and comment purposes. They have not been peer-reviewed or been subject to the review by the NBER Board of Directors that accompanies officialNBER publications.
© 2013 by V. Joseph Hotz and Juan Pantano. All rights reserved. Short sections of text, not to exceedtwo paragraphs, may be quoted without explicit permission provided that full credit, including © notice,is given to the source.
Strategic Parenting, Birth Order and School PerformanceV. Joseph Hotz and Juan PantanoNBER Working Paper No. 19542October 2013JEL No. I2,J1,J13
ABSTRACT
Fueled by new evidence, there has been renewed interest about the effects of birth order on humancapital accumulation. The underlying causal mechanisms for such effects remain unsettled. We considera model in which parents impose more stringent disciplinary environments in response to their earlier-bornchildren’s poor performance in school in order to deter such outcomes for their later-born offspring.We provide robust empirical evidence that school performance of children in the NLSY-C declineswith birth order as does the stringency of their parents' disciplinary restrictions. And, when asked howthey will respond if a child brought home bad grades, parents state that they would be less likely topunish their later-born children. Taken together, these patterns are consistent with a reputation modelof strategic parenting.
V. Joseph HotzDepartment of EconomicsBox 90097Duke UniversityDurham, NC 27708-0097and [email protected]
Juan PantanoWashington University in Saint LouisCampus Box 1208St. Louis MO [email protected]
1 Introduction
Interest on the effects of birth order on human capital accumulation has been re-invigoratedby several recent studies (Black, Devereux & Salvanes, 2005; Conley & Glauber, 2006; Gary-Bobo, Prieto & Picard, 2006) which present new empirical evidence of birth order effects.For example, Black, Devereux & Salvanes (2005) (BDS, hereafter) find large and robusteffects of birth order on educational attainment with Scandinavian data. However, despitethe convincing results, the underlying causal mechanisms generating such findings remainunsettled. As BDS acknowledge:
“One important issue remains unresolved: what is causing the birth order effectswe observe in the data? Our findings are consistent with optimal stopping beinga small part of the explanation. Also, the large birth order effects found forhighly educated mothers, allied with the weak evidence for family size effects,suggest that financial constraints may not be that important. Although a numberof other theories (including time constraints, endowment effects, and parentalpreferences) have been proposed in the literature, we are quite limited in ourability to distinguish between these models” p. 698.
In thinking about children’s behavior, it is important to remember that parents can resortto a variety of mechanisms to influence it. In particular, they can limit or grant access toimportant sources of utility for children. This paper advances an hypothesis that has notbeen previously considered in the generating process for birth order effects in educationaloutcomes: we consider differential parental disciplining schemes arising from the dynamicsof a parental reputation mechanism. One channel that can generate birth order effects ischaracterized in Hao, Hotz & Jin (2008) (HHJ, hereafter). A key insight of their paper isthat birth order effects arise endogenously as the result of viewing parent-child interactionsas a reputation game in which parents “play tough” when their older children engage in badbehavior – tougher than caring, or altruistic, parents would prefer – in an attempt to establisha reputation of toughness to deter bad behavior amongst their younger children. Thus, wehypothesize that one mechanism that gives rise to birth order effects is this form of strategicparenting and responses by their children implied by game-theoretic models of reputation inrepeated games. In the context of this paper, parents invest in developing a reputation ofsevere parenting with those born earlier in the hope of inducing their (paternalistic) preferredschool effort levels on those born later.
The paper is organized as follows. Section 2 reviews the relevant literature and alternativetheories of the effects of birth order on various behaviors, including educational outcomes.Section 3 describes the data we use in our analysis, namely that on the children of femalerespondents in the National Longitudinal Survey of Youth, 1979. In section 4, we presentestimates of the effects of birth order on measures of children’s performance in school and ex-amine several potential threats to the validity of our estimates. We find very robust evidenceof birth order effects in some measures of school performance that is entirely consistent with
2
children responding to the strategic use of parental monitoring and discipline. In Section 5,we explicitly examine differences in parental monitoring and discipline of their children bybirth order. While our ability to link these parenting practices to the specific instances ofschool performance is limited in our data, we can do so for a measure of parents’ intentions,namely, what parents say they would do in response to their children getting bad grades inschool. Based on this measure, we find parents engaging in strategic parenting practices bybirth order. In Section 6, we offer some concluding observations of the findings in this paper.
2 Review of the Birth Order Literature
In this section we briefly review the literature on birth order effects and on the linksbetween the effort of students in school and their academic performance and achievement.
There is a substantial literature on birth order effects in education. Zajonc (1976), Olneck& Bills (1979), Blake (1981), Hauser & Sewell (1985), Behrman & Taubman (1986), Kessler(1991), among others, found mixed results that provide support for a variety of birth ordertheories ranging from the “no-one-to-teach” hypothesis to the theory of differential geneticendowments. However, with the strong birth order effects found in Behrman & Taubman(1986) and, more recently, in Black, Devereux & Salvanes (2005) and Booth & Kee (2009),the literature seems to be settling in favor of the existence of such effects and moving towardsconsideration and sophisticated testing of alternative mechanisms to account for such effects.For example, Price (2008) provides empirical support in time use data for a modern versionof the “dilution hypothesis,” namely, that, for at least a limited time, the first born does nothave to share the available stock of parental quality time input with other siblings, whereasthose born later usually enjoy more limited parental input as parents are not able to matchthe increased demand for their “quality time.”1
In another strand of research, mostly in Psychology, the issue of birth order effects inIQ has been examined. In particular, Rodgers et al. (2000, 2001) have consistently sidedagainst the existence of such a relationship and they have criticized studies for confounding“within-family” and “between-family” processes and by attributing to the former, patternsthat are actually shaped by the latter. More recently, Black, Devereux & Salvanes (2007) andBjerkedal, et al. (2007) find strong and significant effects of birth order on IQ within familiesin a large dataset from Norway but Whichman, Rodgers & McCallum (2006) insist, using amultilevel approach, that the effects only arise between families and they disappear withinthe family. The debate remains open as Zajonc & Sulloway (2007) criticize Whichman,Rodgers & McCallum (2006) on several grounds and reach the opposite conclusion. Finally,Whichman, Rodgers & McCallum (2007) address the issues raised by Zajonc & Sulloway(2007) and confirm their previous findings.
There is also a sizeable literature on the links between students’ effort in school and their
1See Lindert (1977) for a related approach exploiting time use data.
3

academic performance (see, for example, Natriello and McDill (1986); Wolters (1999);Cov-ington (2000); Stinebrickner & Stinebrickner (2006)). There appears to be a fairly clearconsensus in this literature that greater student effort improves academic performance. Forexample, Stinebrickner & Stinebrickner (2006) show the importance of actual school effort onschool performance. But our understanding of the factors that lead to greater student effortand how such effort interacts with other features of a student’s home and school environ-ments is less clear. Relevant to this paper, there is a literature on the relationship betweenparenting and parental involvement and student effort and, ultimately, performance (seeTrautwein & Koller, 2003; Fan & Chen, 2001; Hoover-Dempsey, et al., 2001). Most of thisliterature does not model or account for the endogenous nature of how the amount of schooleffort exerted by children is affected by parental incentives and policy instruments.
An exception to this shortcoming of the literature is a recent paper by De Fraja, D’Oliveira& Zanchi (2005). These authors develop an equilibrium model in which parents, schools andstudents interact to influence the effort of students and their performance and test this modelusing data from the British National Child Development Study. At the same time, De Fraja,D’Oliveira & Zanchi (2005) do not characterize the potential informational problems thatparents have in monitoring their children’s input and the potential role of strategic behavioron the part of parents in attempting to influence the children’s effort. Our paper attemptsto fill this deficit in the literature.
2.1 Alternative Theories of Birth Order Effects
There are several alternative causal hypotheses in the literature trying to explain therelationship between birth order and schooling. First, there could be parental time dilution,noted above. Under this hypothesis, the earlier born siblings enjoy more parental time thanlater-born siblings. This may explain why earlier-borns do better in school. Second, therecould be differences in the genetic endowment of children by birth order. Indeed, later-born siblings are born to older mothers so they are more likely to receive a lower qualitygenetic endowment. Third, first-borns and parents’ experience with them, may have undueinfluence on parents’ subsequent fertility decisions. According to this theory, a “bad draw,”e.g., a difficult-to-raise, problematic child, may cause parents to curtail their subsequentfertility whereas an easy-to-rear first-born would not. More generally, this phenomenonimplies selection in the quality of parents’ last-born child, with it being of lower qualitythan the average. Fourth, closely related to the “confluence model” of Zajonc, the “no oneto teach” hypothesis postulates that the last born will not benefit from teaching a youngersibling. Without this pedagogic experience, the last born will not develop strong learningskills. Fifth, it may well be possible that the later-born siblings are more affected by changesin family structure, e.g., divorce, since later born children are more likely to spend more oftheir lives exposed to such family disruptions.2 Last, but not least, first-borns may enjoy
2See Ginther & Pollak (2004) for an analysis of the relation between family structure and educationoutcomes. To examine this hypothesis, BDS (2005) re-estimate their model in a sample of families thatexperience no family disruptions. They still find sizeable and statistically significant birth order effects.
4

higher parental investment for insurance purposes or simply because parents are more likelyto enjoy utility from observing their eventual success in life.
While all the above theories predict that earlier born siblings will do better, it is worthnoting that it is possible that the effect can go in the other direction. For example, parentsmight learn to teach better. In this case, parents commit mistakes with those born earlierbut they are more proficient, experienced parents when the later born siblings need to beraised. It also can be the case that, if there are financial constraints, the later-born siblingsmight be raised at time in which parental resources are more abundant.
Without taking away the merits of the previous literature, below we advance a novel,complementary mechanism that can induce birth order effects in school performance. Ithighlights the role of incentives faced by children to perform well in school as well as thereputation concerns of lenient parents.
2.2 Parental Reputation and Child School Performance
As noted in Section 1, we draw on the game-theoretic literature on reputation models.Such models were initially developed in the industrial organization literature in responseto the chain store paradox of Selten (1978). In particular, Kreps & Wilson (1982) andMilgrom & Roberts (1982) developed models in which the introduction of a small amountof incomplete information gives rise to a different, more intuitive type of equilibrium. HHJpioneered the use of this type of models in a family context to analyze teenage risk-takingbehavior.
Consider a finite-horizon game between parents and children being played in families withmore than one child. In particular, the typical family has a total of N children. Considera long-lived player (the parent or parents) facing a new short-lived player (the child) ateach round of the game. In any round t, t = 1, ..., N , the parents and the child of thatround observe the entire history of play between the parent and the older children. Inparticular, the younger siblings observe the choices made by their N − t older siblings andthe punishment decisions of their parents when older siblings performed poorly in school.Parents can be of one of two types. They may be “tough parents,” i.e., the commitment typethat will always punish a child’s poor performance in school, or parents are “lenient,” i.e.,is the type of parents that dislike punishing their children and would never do so, regardlessof their performances in school. In the first round of the game, played with the oldest child,the parents’ type is not known by that child or her younger siblings. Let µ̂1 denote thechildren’s belief, or probability, that their parents are the tough type and 1 − µ̂1 that theyare lenient. At each round of the game, t, t > 1, the younger siblings will update their beliefsin a Bayesian fashion based on the accumulated information of the school performance ofolder children and how their parents responded to these performances. Denote this updatedbelief, or probability, that the parent is a tough type as µ̂t. Note that if older siblings alwaysdo well in school, then the younger siblings will not have had the occasion to observe whethertheir parents punish or accommodate poor performance in school and, as a result, will have
5
no basis for updating their prior beliefs, i.e., µ̂t = µ̂1.
It can be shown that a sequential equilibrium for this finitely repeated game exists (seeKreps & Wilson, 1982, or Milgrom & Roberts, 1982). The critical event in this reputationgame is observing parental leniency in response to poor school performance at some roundt, i.e., at some birth order t. If parents reveal themselves to be of the lenient type by notpunishing the poor school performance of one of their children, µ̂t drops to zero and remainsthere until the end of the game. From then on, the parents’ children will fear no punishmentfrom their revealed-to-be-lenient parent whose threats are no longer credible.
The equilibrium of this reputation game between parents and their children is charac-terized by two phases. In the first phase, played in the early rounds of the game betweenparents and their earlier born children, uncertainty about parental type and threat of pun-ishment induces these children to exert high levels of effort in school to deliver good schoolperformance and prevent the triggering of potential punishments coded in the parentingrule. In this phase, bad grades will translate into loss of privileges anyway. If a parent istough, he will punish by principle. If the parent is a lenient type, she will still punish poorpreference in order to establish and/or maintain a reputation for toughness so as to preventlater born children from taking advantage of her leniency. As a result, we expect earlier bornchildren playing mostly through this initial phase of the equilibrium to do better in school.3
As the rounds of the game proceed, the number of remaining children at risk to play thegame declines. At some point, the reputation benefits of punishment for a lenient parentis less than the disutility of witnessing their child’s suffering, i.e., not doing well in school.Depending on how small µ̂1 is and how few rounds in the game remain, i.e., many remainingchildren a parent has, it will be likely for some of these children to “test the waters” byexerting low school effort and exploring what happens in response. After the first parentalaccommodating-behavior is observed for a lenient parent, the second phase of the game istriggered in which later born siblings do not put effort in school and go unpunished. (Notethat a tough parent type will choose to punish poor performance for each of their childrenand never accommodate such behavior.)
The model delivers some predictions that can be taken directly to the data. In particular,earlier-born siblings are predicted to put more effort in school and should end up performingbetter. Moreover, parents are more likely to establish rules of behavior with the earlier-born,engage in a more systematic monitoring of earlier-born’s schoolwork and increase supervisionin the event of low school performance. Below, we provide evidence on the validity of thesepredictions for children’s performance in school and parental responses to it by birth order.
3Here we rely on results from Stinebrickner & Stinebricker (2006) that emphasize the importance of studyeffort in determining school performance.
6
3 The Data
We exploit data from the children of female respondents of the National LongitudinalSurvey of Youth, 1979 (NLSY79). These data (NLSY-C) contain information on all of thechildren born to women in the NLSY79 so we potentially observe all of their children as theytransition between the ages of 10 and 14, the focus of our analysis.4 Crucially, many of thesewomen have two or more children so we are able to directly explore birth order effects thatarise in these families.
TV watching and, more recently, video gaming and social networking are time intensiveactivities that usually crowd-out, at least partially, the time that could be used for homeworkor study. Indeed, there exists a vast literature in psychology documenting the detrimentaleffects of TV watching on school performance. Therefore these activities are natural placesto look for parental discipline schemes. Children value these activities highly and parentsmay be able to enforce and monitor restrictions on their access.
Useful for our purposes, the NLSY-C includes some detailed information on parenting.Some questions ask the mother and/or the children about different features about the parent-child relationship. We also exploit other parenting rules as reported by the children and/orthe mother. Crucially, we are able to observe multiple self-reports from the same motherabout all of her kids, and we observe those at two and sometimes three points in time. Werestrict the analysis to children between the ages of 10 and 14. However, having repeatedobservations of parenting rules applied to each child over time allows us to identify changingparenting strategies across birth order, by comparing siblings of different birth order oncethey transition across a given common age.
On the other hand, the NLSY-C does not have systematic information on grades exceptfor a specific supplemental school survey fielded in 1995-96 about school years 1994-95.However, the NLSY-C includes a self-report about how the mother thinks each of her childrenis doing in school. The specific question is: “Is your child one of the best students inclass, above the middle, in the middle, below the middle, or near the bottom of the class?”Useful for our purposes the same questions are asked of the mother separately for each childand in several waves. Note that even when these self-reports could be validated againstschool transcripts, it can be argued that it is the parental subjective belief about the child’sperformance what really matters at the end. We do, however, validate mother’s perceptionsbelow, exploiting limited transcript data from the 1995-96 School Supplement.
4We restrict attention to those ages because some of our key variables are only available for that agerange.
7
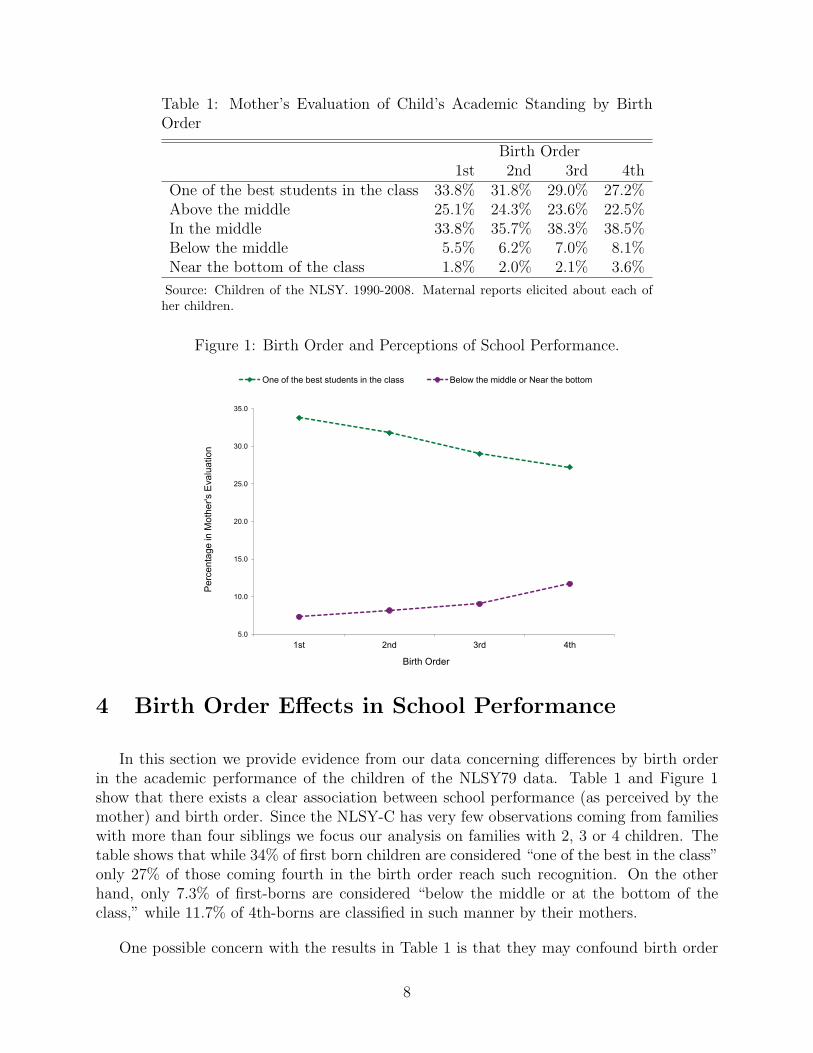
Table 1: Mother’s Evaluation of Child’s Academic Standing by BirthOrder
Birth Order1st 2nd 3rd 4th
One of the best students in the class 33.8% 31.8% 29.0% 27.2%Above the middle 25.1% 24.3% 23.6% 22.5%In the middle 33.8% 35.7% 38.3% 38.5%Below the middle 5.5% 6.2% 7.0% 8.1%Near the bottom of the class 1.8% 2.0% 2.1% 3.6%
Source: Children of the NLSY. 1990-2008. Maternal reports elicited about each ofher children.
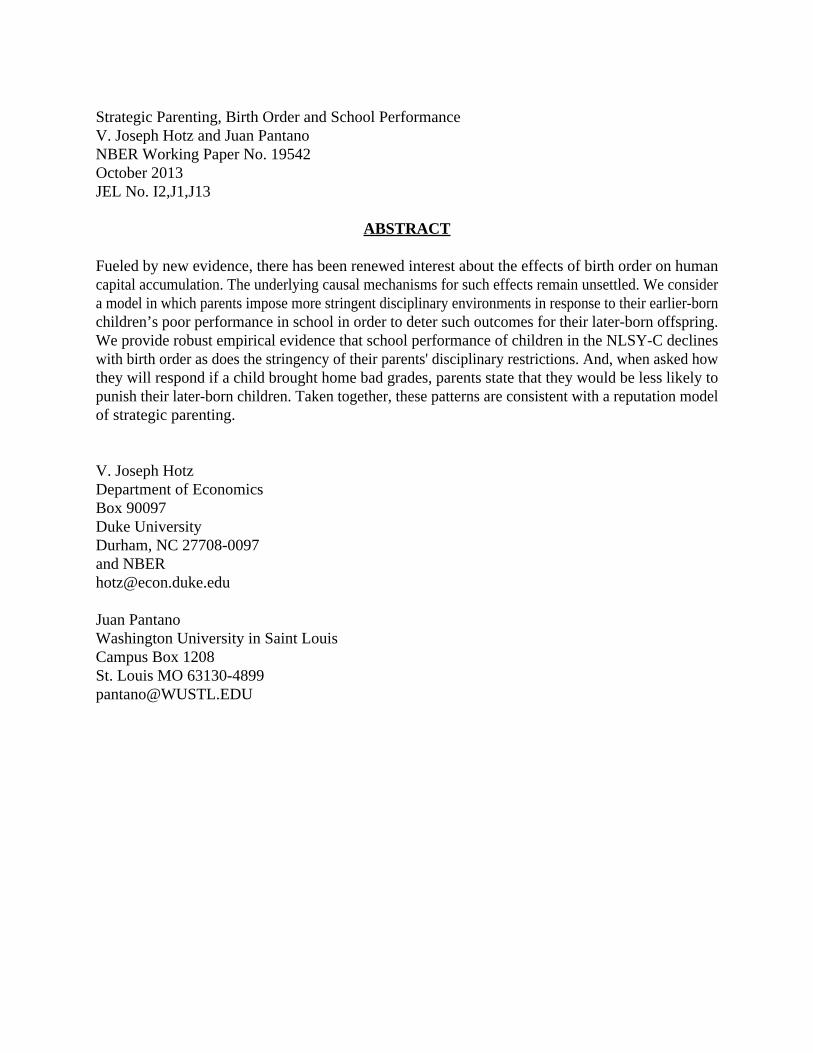
Figure 1: Birth Order and Perceptions of School Performance.
5.0
10.0
15.0
20.0
25.0
30.0
35.0
1st 2nd 3rd 4th
Per
cent
age
in M
othe
r's E
valu
atio
n
Birth Order
Figure 1 Birth Order and Perceptions of School Performance
One of the best students in the class Below the middle or Near the bottom
4 Birth Order Effects in School Performance
In this section we provide evidence from our data concerning differences by birth orderin the academic performance of the children of the NLSY79 data. Table 1 and Figure 1show that there exists a clear association between school performance (as perceived by themother) and birth order. Since the NLSY-C has very few observations coming from familieswith more than four siblings we focus our analysis on families with 2, 3 or 4 children. Thetable shows that while 34% of first born children are considered “one of the best in the class”only 27% of those coming fourth in the birth order reach such recognition. On the otherhand, only 7.3% of first-borns are considered “below the middle or at the bottom of theclass,” while 11.7% of 4th-borns are classified in such manner by their mothers.
One possible concern with the results in Table 1 is that they may confound birth order
8

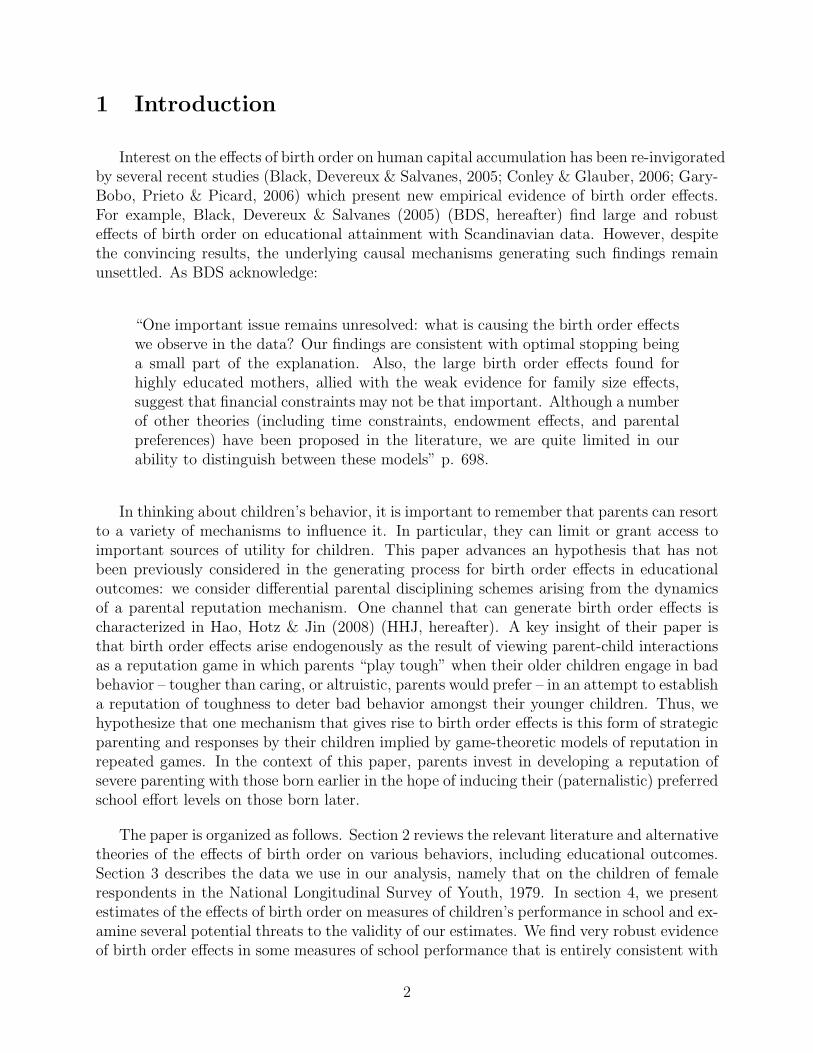
Figure 2: Birth Order, Family Size & Percent of Children Perceived to be at Top of theirClass.
26%
28%
30%
32%
34%
36%
1st 2nd 3rd 4th
Birth Order
Figure 2 Birth Order, Family Size and % Perceived at the Top of the Class
2-Child Family 3-Child Family 4-Child Family
and family size effects, an issue that has been recognized very early in the development ofthe birth order literature. Figure 2 explores birth order effects within families of specificsizes. Higher birth orders, by construction, belong in families of bigger size. As pointed outby Berhman & Taubman (1986), such families locate themselves at a different locus of thequantity-quality trade-off. Therefore we risk attributing to birth order what really comesfrom family size. As can be seen in the figure, birth order effects appear to persist in allthese families, regardless of size.
A second concern with the results in Table 1 is that they show clear evidence of inflation inperceived school performance (i.e. her assessments appear to show a mother’s Lake Wobegoneffect about their own children) However, this need not be a problem, per se, as long as thesign and magnitude of these misperceptions do not vary with birth order. In Table 2, wevalidate maternal perceptions. Higher GPAs of children obtained in the School Supplementare associated with significantly lower chances of being perceived to be at the bottom of theclass and significantly higher chances to be classified as one of the best students in the class.Re-estimating the same models including birth order measures show that misperceptions(the differences between perceived and actual performance) are not correlated with birthorder. Therefore, to the extent that mothers are too optimistic about their own childrenperformance but they are so for all of their own children, we account for this mother specificbias when we include family fixed effects in our models of perceived school performance.
More formally, we follow BDS (2005) and explore birth order effects in academic perfor-mance by estimating the following two linear models for the probability that the child i infamily h is being considered by his/her mother to be one of the best students in the class in
9

Table 2: Validating Mother’s Perception of Child’s School Performance
Ordered Probit Probit LPMNon- Non- Non-
Linear Parametric Linear Parametric Linear ParametricGPA -0.499∗∗∗ 0.188∗∗∗ 0.168∗∗∗
GPA=2 -0.902∗∗∗ 0.357∗∗ 0.191∗∗
GPA=3 -0.976∗∗∗ 0.423∗∗∗ 0.266∗∗∗
GPA=4 -1.870∗∗∗ 0.678∗∗∗ 0.557∗∗∗
Birth Order 0.063 0.074 -0.062 -0.065 -0.043 -0.051Observations 180 180 180 180 180 180
* significant at 10%; ** significant at 5%; *** significant at 1%. Significance levels determined basedon robust standard errors.Ordered Probit uses 1=Top, 2=Above Middle, 3=Middle, 4=Below Middle, 5=Bottom. The Probit andlinear probability models (LPM) use 1=Best, 0=otherwise. (The LPM is estimated using ordinary leastsquares.) Controls include Age and Gender. In non-parametric specifications GPA=1 is the omittedcategory.
year t. The first specification we consider imposes linearity across birth orders
BestStudentiht = NY Siht + X ′ihtβ + λh + λt + εiht (1)
where BestStudentiht is equal to 1 if child i in family h who in year t was rated by theirparents as one of the best students in their class, Xiht includes controls for child’s age andgender (and family size when pooling all families). NY Si is the number of younger siblings,a measure of birth order that imposes linearity. The λts denote survey year effects and theλhs denote family fixed effects.
Our second specification is more non-parametric in the sense that it allows different effectsfor different birth orders.
BestStudentiht =4∑
k=2
αkBirthOrderkih + X ′ihtβ + λh + λt + εiht (2)
where BirthOrderkih is a dummy variable which equals one when child i is the kth childborn in family h, and equals zero otherwise.
Table 3 presents estimates of specifications (1) and (2) for all families and for familieswith 2, 3 or 4 children, respectively. The results in Panel A are based on specifications thatdo not include a family fixed effect, while those in Panel B do. In column 1, the specificationimposes linearity of birth order and uses the number of younger siblings as a measure ofbirth order. In columns 2 to 5, all birth order coefficients are relative to the first born, whichis the omitted category. As can be seen in Panel A of Table 3, there exist strong birth ordereffects in all families. The OLS estimates imply that in families of four children, the lastchild to be born is 15 percentage points less likely to be among the best students in his class.Moreover, when we estimate (1) and (2) controlling for family fixed effects, the birth order
10
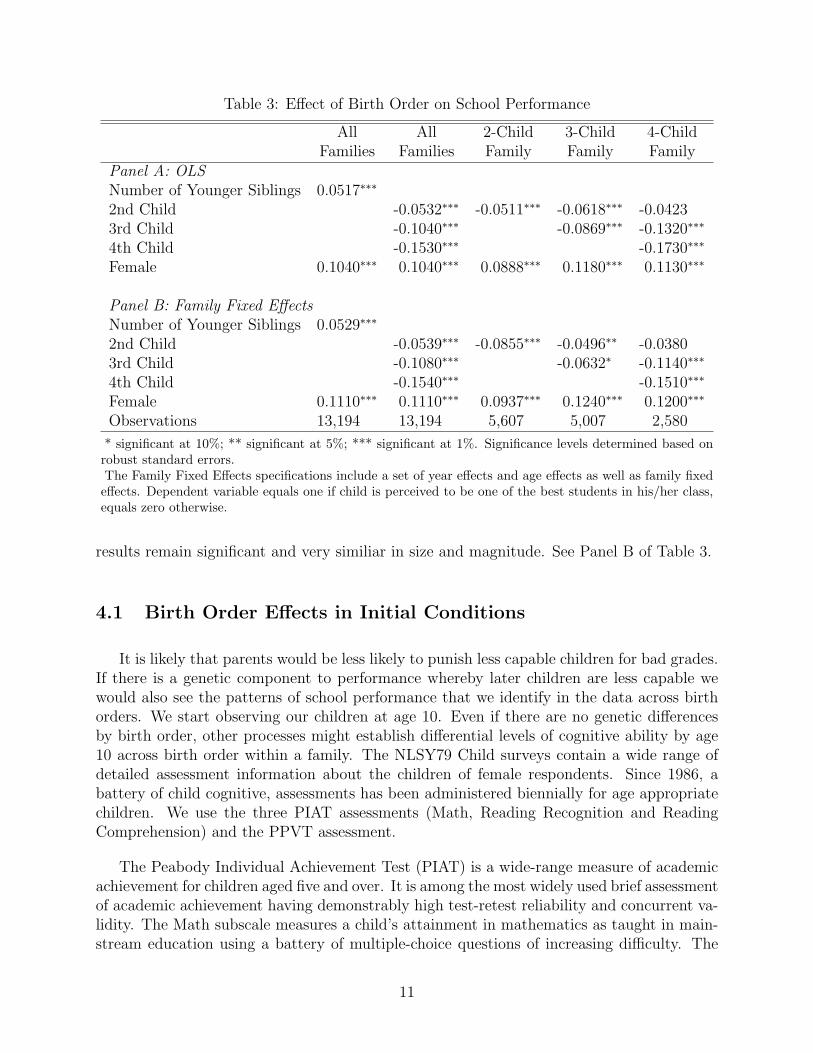
Table 3: Effect of Birth Order on School Performance
All All 2-Child 3-Child 4-ChildFamilies Families Family Family Family
Panel A: OLSNumber of Younger Siblings 0.0517∗∗∗
2nd Child -0.0532∗∗∗ -0.0511∗∗∗ -0.0618∗∗∗ -0.04233rd Child -0.1040∗∗∗ -0.0869∗∗∗ -0.1320∗∗∗
4th Child -0.1530∗∗∗ -0.1730∗∗∗
Female 0.1040∗∗∗ 0.1040∗∗∗ 0.0888∗∗∗ 0.1180∗∗∗ 0.1130∗∗∗
Panel B: Family Fixed EffectsNumber of Younger Siblings 0.0529∗∗∗
2nd Child -0.0539∗∗∗ -0.0855∗∗∗ -0.0496∗∗ -0.03803rd Child -0.1080∗∗∗ -0.0632∗ -0.1140∗∗∗
4th Child -0.1540∗∗∗ -0.1510∗∗∗
Female 0.1110∗∗∗ 0.1110∗∗∗ 0.0937∗∗∗ 0.1240∗∗∗ 0.1200∗∗∗
Observations 13,194 13,194 5,607 5,007 2,580
* significant at 10%; ** significant at 5%; *** significant at 1%. Significance levels determined based onrobust standard errors.The Family Fixed Effects specifications include a set of year effects and age effects as well as family fixedeffects. Dependent variable equals one if child is perceived to be one of the best students in his/her class,equals zero otherwise.
results remain significant and very similiar in size and magnitude. See Panel B of Table 3.
4.1 Birth Order Effects in Initial Conditions
It is likely that parents would be less likely to punish less capable children for bad grades.If there is a genetic component to performance whereby later children are less capable wewould also see the patterns of school performance that we identify in the data across birthorders. We start observing our children at age 10. Even if there are no genetic differencesby birth order, other processes might establish differential levels of cognitive ability by age10 across birth order within a family. The NLSY79 Child surveys contain a wide range ofdetailed assessment information about the children of female respondents. Since 1986, abattery of child cognitive, assessments has been administered biennially for age appropriatechildren. We use the three PIAT assessments (Math, Reading Recognition and ReadingComprehension) and the PPVT assessment.
The Peabody Individual Achievement Test (PIAT) is a wide-range measure of academicachievement for children aged five and over. It is among the most widely used brief assessmentof academic achievement having demonstrably high test-retest reliability and concurrent va-lidity. The Math subscale measures a child’s attainment in mathematics as taught in main-stream education using a battery of multiple-choice questions of increasing difficulty. The
11

Table 4: Effect of Birth Order on Children’s Initial Ability
PIAT PIAT Reading PIAT ReadingMath Recognition Comprehension PPVT
Family Family Family FamilyOLS FE OLS FE OLS FE OLS FE
No. of Younger Siblings 2.351∗∗∗ 0.402 2.857∗∗∗ 2.159∗∗∗ 2.794∗∗∗ 2.465∗∗∗ 4.061∗∗∗ 1.603∗∗
3-Children Family -2.910∗∗∗ -3.212∗∗∗ -2.913∗∗∗ -5.265∗∗∗
4-Children Family -6.478∗∗∗ -6.650∗∗∗ -6.167∗∗∗ -11.79∗∗∗
Female -0.216 -0.910 2.299∗∗∗ 2.248∗∗∗ 2.054∗∗∗ 1.950∗∗∗ -0.276 0.494Constant 96.66∗∗∗ 102.2∗∗∗ 90.60∗∗∗ 99.39∗∗∗ 69.04∗∗∗ 85.71∗∗∗ 82.25∗∗∗ 96.83∗∗∗
Observations 3,558 3,558 3,597 3,597 3,700 3,700 4,022 4,022
* significant at 10%; ** significant at 5%; *** significant at 1%. Significance levels determined based on robust standard errors.Specifications include a set of year effects and age effects as well as controls for family size or family fixed effects. Dependentvariables are the standardized scores for each of the assessment. We use the 2nd assessment. Most children were assessed for a 2ndtime around age 10. This is the age at which we begin our analysis of school performance so we refer to this as the “initial ability.”
Reading Recognition subtest measures word recognition and pronunciation ability whereasthe Reading Comprehension subtest measures a child’s ability to derive meaning from sen-tences that are read silently. Finally the Peabody Picture Vocabulary Test (PPVT) measuresan individual’s receptive (hearing) vocabulary for Standard American English and provides,at the same time, an estimate of verbal ability or scholastic aptitude.
In Table 4 we present estimates for the same model used to produce the results in theprevious tables but use the four assessments (3 PIATs and a PPVT) as dependent variables.As can be seen in this Table, an early birth order is significantly associated with higherPPVT and two of the PIAT scores. These scores are from the 2nd assessment for thesechildren taken around age 10 and therefore reflect some sort of initial condition in abilityfor our subsequent analysis. This pattern of birth order effects in ability by age 10 couldreflect the early operation of reputation dynamics or some of the other mechanisms discussedabove.
Having documented the existence of birth order effects in cognitive ability at the begin-ning of our observation window, we now show that our birth order effects in school perfor-mance results between the ages of 10 and 14 hold when we control for individual differencesin the initial ability of children of different birth order within families. Table 5 presentsthe results. As expected, the assessment scores that proxy for initial ability are all positiveand almost always highly significant. Still, birth order has a significant and sizable effect onperformance that goes beyond what can be explained through (within-family) birth ordereffects in ability established by age 10 potentially due to some of the theoretical mechanismsdiscussed earlier.
4.2 Family Structure
While family fixed effects account for time invariant characteristics of the family, theydo not account for those characteristics that change over time within families, are correlated
12

Table 5: Effect of Birth Order on School Performance, Controlling for Child Ability
All All 2-Child 3-Child 4-ChildFamilies Families Family Family Family
No. of Younger Siblings 0.0356∗∗∗
2nd Child -0.0341∗∗ -0.0774∗∗∗ -0.0152 -0.02603rd Child -0.0713∗∗∗ -0.0157 -0.0912∗
4th Child -0.1080∗∗∗ -0.1000PIAT Math 0.0046∗∗∗ 0.0046∗∗∗ 0.0054∗∗∗ 0.0053∗∗∗ 0.0027∗∗
PIAT Reading Recognition 0.0028∗∗∗ 0.0028∗∗∗ 0.0038∗∗ 0.0014 0.0039∗∗∗
PIAT Reading Comprehension 0.0028∗∗∗ 0.0028∗∗∗ 0.0023 0.0035∗∗ 0.0021PPVT 0.0024∗∗∗ 0.0024∗∗∗ 0.0032∗∗∗ 0.0023∗∗∗ 0.0014Female 0.0997∗∗∗ 0.0997∗∗∗ 0.0972∗∗∗ 0.1070∗∗∗ 0.0975∗∗∗
Observations 11,355 11,355 4,833 4,338 2,184
* significant at 10%; ** significant at 5%; *** significant at 1%. Significance levels determined based onrobust standard errors.Specifications include a set of year effects and age effects as well as family fixed effects. Dependent variableequals one if child is perceived to be one of the best students in his/her class, equals zero otherwise.
with birth order and that may directly affect children’s school performance. For example,later born siblings are more likely to be affected by changes in family structure, such asdivorce, which can affect the economic and social status of families and the upbringing ofchildren in these households. There is a sizable literature in both sociology and economicsthat examines the effects of family structure on child outcomes.5 The NLSY sample providesample opportunities to control for family structure as a potential determinant of birth ordereffects. We construct a subsample of “intact” families in which children have not beenexposed to any kind of family disruption. This subsample is substantially smaller. We re-estimate our family fixed effects models for this subsample controlling for child ability. Table6 presents the results. Despite the substantially loss of power with this sample, birth orderstill has a significant effect on school performance among intact families. To be clear, weare not claiming that differences in family structure do not affect child outcomes, includinga child’s performance in school. Rather, our evidence indicates that the birth order effectsthat we found in school performance cannot be solely explained by differential exposure tochanges in family structure across birth orders.
5 Birth Order Effects in Parental Rules
In this section, we explore whether birth order effects in performance may arise becauseof differential parental treatment. We ask whether the data shows any sign of differentialparenting by birth order. We provide additional evidence consistent with some of the pre-dictions delivered by the reputation hypothesis and discussed in Section 2. In Table 7 we
5See, for example, McLanahan & Sandefur (1994); Ermisch & Francesconi (2001), Ginther & Pollak(2004); Tartari (2008) and Finlay & Neumark (2010).
13
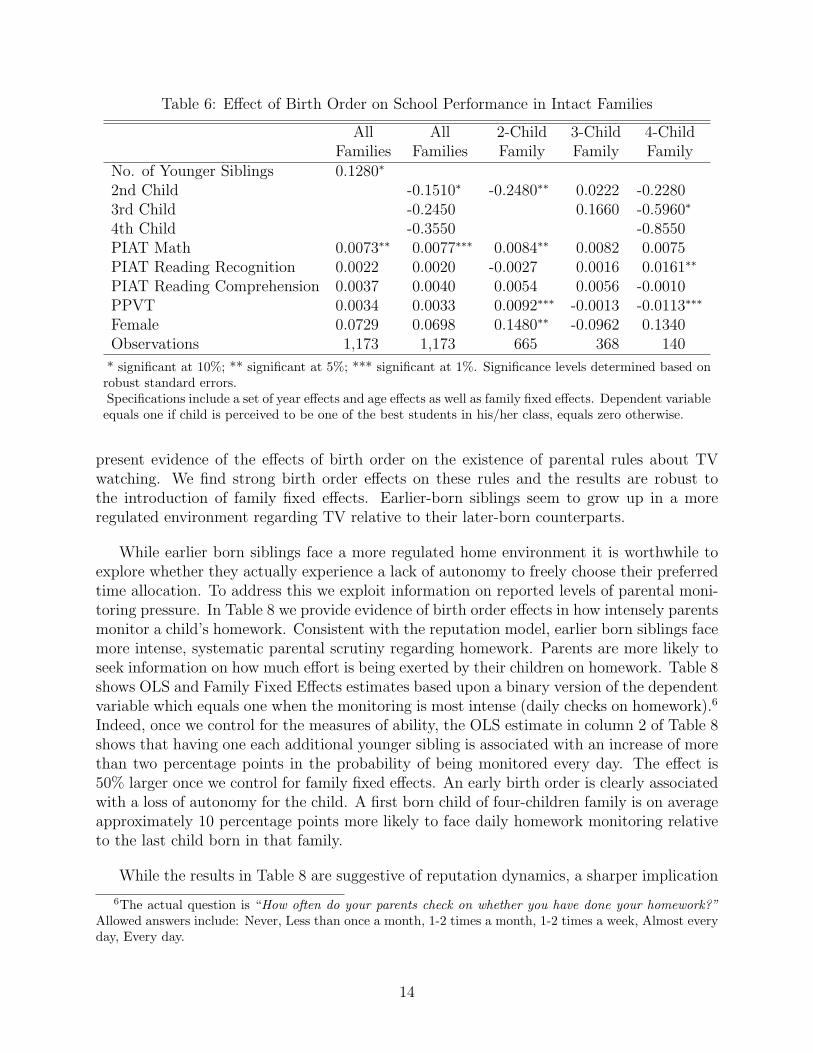
Table 6: Effect of Birth Order on School Performance in Intact Families
All All 2-Child 3-Child 4-ChildFamilies Families Family Family Family
No. of Younger Siblings 0.1280∗
2nd Child -0.1510∗ -0.2480∗∗ 0.0222 -0.22803rd Child -0.2450 0.1660 -0.5960∗
4th Child -0.3550 -0.8550PIAT Math 0.0073∗∗ 0.0077∗∗∗ 0.0084∗∗ 0.0082 0.0075PIAT Reading Recognition 0.0022 0.0020 -0.0027 0.0016 0.0161∗∗
PIAT Reading Comprehension 0.0037 0.0040 0.0054 0.0056 -0.0010PPVT 0.0034 0.0033 0.0092∗∗∗ -0.0013 -0.0113∗∗∗
Female 0.0729 0.0698 0.1480∗∗ -0.0962 0.1340Observations 1,173 1,173 665 368 140
* significant at 10%; ** significant at 5%; *** significant at 1%. Significance levels determined based onrobust standard errors.Specifications include a set of year effects and age effects as well as family fixed effects. Dependent variableequals one if child is perceived to be one of the best students in his/her class, equals zero otherwise.
present evidence of the effects of birth order on the existence of parental rules about TVwatching. We find strong birth order effects on these rules and the results are robust tothe introduction of family fixed effects. Earlier-born siblings seem to grow up in a moreregulated environment regarding TV relative to their later-born counterparts.
While earlier born siblings face a more regulated home environment it is worthwhile toexplore whether they actually experience a lack of autonomy to freely choose their preferredtime allocation. To address this we exploit information on reported levels of parental moni-toring pressure. In Table 8 we provide evidence of birth order effects in how intensely parentsmonitor a child’s homework. Consistent with the reputation model, earlier born siblings facemore intense, systematic parental scrutiny regarding homework. Parents are more likely toseek information on how much effort is being exerted by their children on homework. Table 8shows OLS and Family Fixed Effects estimates based upon a binary version of the dependentvariable which equals one when the monitoring is most intense (daily checks on homework).6
Indeed, once we control for the measures of ability, the OLS estimate in column 2 of Table 8shows that having one each additional younger sibling is associated with an increase of morethan two percentage points in the probability of being monitored every day. The effect is50% larger once we control for family fixed effects. An early birth order is clearly associatedwith a loss of autonomy for the child. A first born child of four-children family is on averageapproximately 10 percentage points more likely to face daily homework monitoring relativeto the last child born in that family.
While the results in Table 8 are suggestive of reputation dynamics, a sharper implication
6The actual question is “How often do your parents check on whether you have done your homework?”Allowed answers include: Never, Less than once a month, 1-2 times a month, 1-2 times a week, Almost everyday, Every day.
14
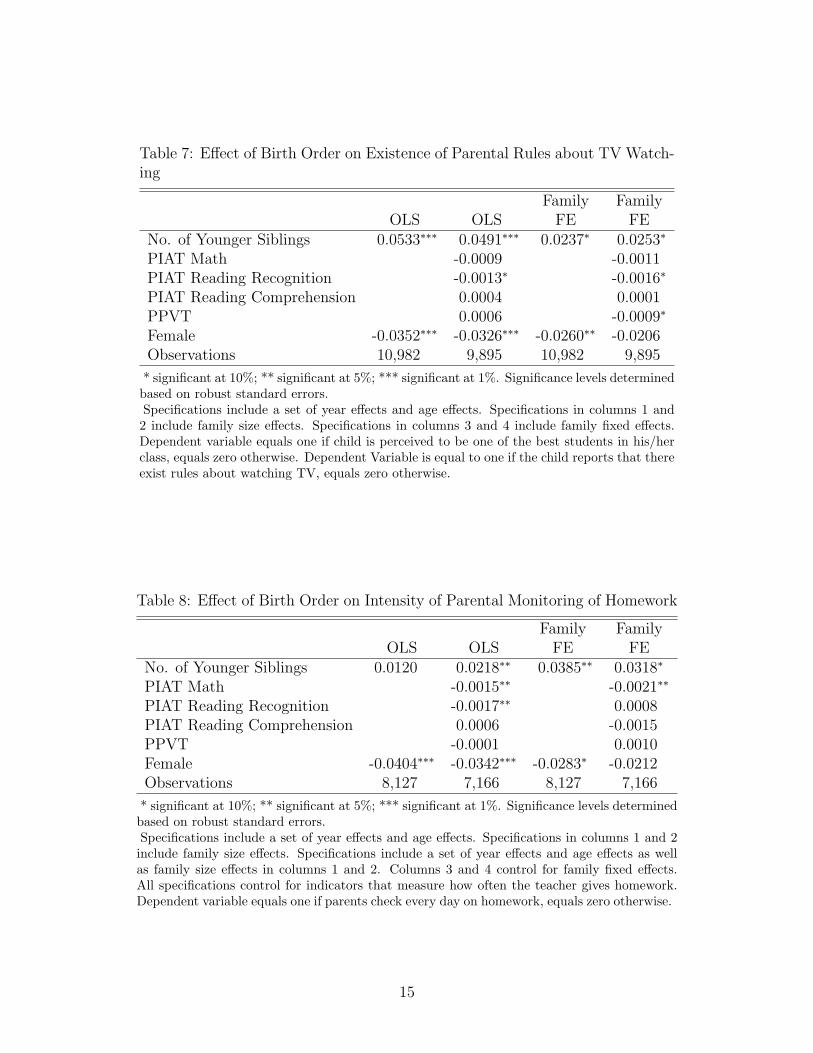
Table 7: Effect of Birth Order on Existence of Parental Rules about TV Watch-ing
Family FamilyOLS OLS FE FE
No. of Younger Siblings 0.0533∗∗∗ 0.0491∗∗∗ 0.0237∗ 0.0253∗
PIAT Math -0.0009 -0.0011PIAT Reading Recognition -0.0013∗ -0.0016∗
PIAT Reading Comprehension 0.0004 0.0001PPVT 0.0006 -0.0009∗
Female -0.0352∗∗∗ -0.0326∗∗∗ -0.0260∗∗ -0.0206Observations 10,982 9,895 10,982 9,895
* significant at 10%; ** significant at 5%; *** significant at 1%. Significance levels determinedbased on robust standard errors.Specifications include a set of year effects and age effects. Specifications in columns 1 and2 include family size effects. Specifications in columns 3 and 4 include family fixed effects.Dependent variable equals one if child is perceived to be one of the best students in his/herclass, equals zero otherwise. Dependent Variable is equal to one if the child reports that thereexist rules about watching TV, equals zero otherwise.
Table 8: Effect of Birth Order on Intensity of Parental Monitoring of Homework
Family FamilyOLS OLS FE FE
No. of Younger Siblings 0.0120 0.0218∗∗ 0.0385∗∗ 0.0318∗
PIAT Math -0.0015∗∗ -0.0021∗∗
PIAT Reading Recognition -0.0017∗∗ 0.0008PIAT Reading Comprehension 0.0006 -0.0015PPVT -0.0001 0.0010Female -0.0404∗∗∗ -0.0342∗∗∗ -0.0283∗ -0.0212Observations 8,127 7,166 8,127 7,166
* significant at 10%; ** significant at 5%; *** significant at 1%. Significance levels determinedbased on robust standard errors.Specifications include a set of year effects and age effects. Specifications in columns 1 and 2include family size effects. Specifications include a set of year effects and age effects as wellas family size effects in columns 1 and 2. Columns 3 and 4 control for family fixed effects.All specifications control for indicators that measure how often the teacher gives homework.Dependent variable equals one if parents check every day on homework, equals zero otherwise.
15

Table 9: Differential Effect of Birth Order on Monitoring Intensity Among Chil-dren with Bad and Good Shool Performance
Family FamilyOLS OLS FE FE
B 0.0051 -0.0136 0.0176 0.0050B × No. of Younger Siblings 0.0107 0.0068 -0.0037 0.0046No. of Younger Siblings 0.0088 0.0190∗ 0.0402∗∗ 0.0307PIAT Math -0.0015∗∗ -0.0021∗∗
PIAT Reading Recognition -0.0017∗∗ 0.0008PIAT Reading Comprehension 0.0006 -0.0015PPVT -0.0001 0.0011Female -0.0389∗∗∗ -0.0350∗∗∗ -0.0265∗ -0.0204Observations 8,127 7,166 8,127 7,166
* significant at 10%; ** significant at 5%; *** significant at 1%. Significance levels determinedbased on robust standard errors.Specifications include a set of year effects and age effects as well as family size effects incolumns 1 and 2. Columns 3 and 4 control for family fixed effects. All specifications controlfor indicators that measure how often the teacher gives homework. Dependent variable equalsone if child is perceived to be one of the best students in his/her class, equals zero otherwise.Dependent variable equals one if parents check every day on homework, equals zero otherwise.
from parental reputation is that we should expect this loss of autonomy among earlier bornsiblings to occur only among those who underperform in school. In a sense, we shouldexpect to see a significant and positive interaction between our measure of birth order and ameasure of under-performance in school. We then consider the following augmented modelthat features such an interaction:
Monitoringiht = α0 + α1Biht + α2NY Sih ×Biht + X ′ihtβ + λh + λt + εiht, (3)
where Bih = 1 if the child is perceived to be underperforming in school.7 Still, the reputa-tion model predicts that this loss of autonomy would be more likely when the child is notperforming well in school. That is, reputation implies α2 > 0. The results of estimatingthe augmented model are shown in Table 9. As can be seen in this Table, the preferredspecification that controls for family fixed effects and child ability, the estimated interactioneffect α2 is positive, but not significant. While this seems to provide evidence against thereputation model, it is important to notice that our inclusion of Biht and its interaction withour birth order measure, NY Sih × Biht brings with it endogeneity issues to our modelingof birth order effects in incentives. Indeed, considering in more detail the behavior of thechild helps us to understand why these two variables will be likely endogenous, even aftercontrolling for family fixed effects.
The probability that the child under-performs essentially depends on its ability Ai andeffort Ei. But how much effort the child allocates to achieve good school performance also
7Biht = 1 if the child i of household h is thought to be either below the middle of the class or at thebottom of the class at time t.
16

depends on the probability of autonomy loss in the event of under-performance. Considerthen a linear probability model for under-performance
Biht = θ0 + θ1Aiht + θ2Eiht + λh + λt + ηiht (4)
where θ1 < 0 and θ2 < 0. Now, let effort Eiht depend on ability Ai and the probability ofautonomy loss upon bad school performance
Eiht = φ0 + φ1Ai + θ2 Pr (Liht = 1|Biht = 1) + λh + λt + νiht (5)
where Liht = 1 if the child suffers autonomy loss due to intense parental supervision andmonitoring. If we add the parenting equation to this system we note that NY Sih ×Biht andBiht are likely to be endogenous.
Liht = α0 + α1Biht + α2NY Sih ×Biht + X ′ihtβ + λh + λt + εiht (6)
For example, suppose that children observe more than us, the econometricians, about εih,the child i-specific family h unobservables affecting the parental propensity to monitor andsupervise at time t. Say εiht = ε1
iht + ε2iht and children can observe ε1
iht. We can interpret thisas an observable signal (to the child) of parental supervision propensity for that period. Thechild of course will use this information when forming his beliefs about the probability oflosing autonomy in the event of low school performance. Then, we update the effort functionto reflect this.
Eiht = φ0 + φ1Ai + θ2 Pr(Liht = 1|Biht = 1, ε1
iht
)+ λh + λt + νiht (7)
It is clear then that high ε1iht’s will lead to high effort Eiht by increasing the perceived
odds of autonomy loss upon bad grades, Pr (Liht = 1|Biht = 1, ε1iht) . Higher effort will, in
turn, translate into higher grades (i.e., a lower probability of observing Biht = 1), givenθ2 < 0. From our perspective then εiht and Biht will be correlated and will induce bias in ourparameter of interest, α2. Moreover, the estimate will be biased downwards and therefore itwill prevent us from drawing valid inference regarding the hypothesis that α2 > 0. As thisexample shows, parent-child strategic interactions create substantial endogeneity problems inestimating equations that intend to capture important aspects of child and parental behavior.
As is customary in the literature, one could attempt to solve this type of endogeneityproblem by relying in some sort of instrumental variable or quasi-experiment Ziht that shouldideally induce exogenous variation in school performance for child i in household h at timet. While finding convincing instruments is usually a difficult task, this is especially difficultin our context, as many potential instruments that do indeed generate random variation inschool performance would nevertheless be invalid, as long as they are known by the parent.This is so because those factors, when known by the parents, will be taken into accountwhen executing the parenting strategy. In summary, good instruments are very difficult tofind because not only they have to be somewhat random, but also need to be unknown bythe parents. Parental unawareness of those random factors is especially unlikely because, ifthey can be verified, children would have incentives to reveal their existence, in the hopes of
17

providing attenuating circumstances for bad school performance.
Lacking a good instrument we pursue an alternative novel approach to test the impli-cations of the reputation model. Consider the probability of intense monitoring given badgrades.
Pr (Liht = 1|Biht = 1) = α0 + α1 + α2NY Sih + X ′ihtβ + λh + λt + uiht (8)
where uiht = E [εiht|Biht = 1] . Note that this specification removes or conditions out theendogenous under-performance measure but still allow us to test for reputation. In a sense,this is a probabilistic model of the parental strategy that integrates out εiht . Therefore, if wehad access to self-reported probabilities (or likelihood ranges) of monitoring upon bad schoolperformance we could test for reputation by exploring whether those subjective probabilitiesvary with birth order. In particular, we would expect a parent’s reported probabilities ofincreased supervision to be higher for earlier-born siblings.
Fortunately, our data includes such self-reports. The mother was asked about the likeli-hood that she would take an action (increase the supervision of her child) in response to ahypothetical situation (her child came home with bad grades). That is we have a measureof the mother’s self-reported likelihood of punishing in a hypothetical situation, rather thanher report of what she actually did in response to her child’s actual behavior, where the lateris subject to the above-noted endogeneity. The specific question we exploit in this contextis the following:
“If (Child) brought home a report card with grades lower than expected, how likelywould you (the mother) be to keep a closer eye on [his/her] activities?”
The following were the allowed responses: Not At All Likely, Somewhat Unlikely, Not SureHow Likely, Somewhat Likely, Very Likely.
We work with a dichotomous version of the dependent variable which equals one if themother would be very likely to keep a closer eye on the child in the event of low schoolperformance and zero, otherwise. This allows us to easily control for family fixed effects.This new form of data provides an interesting complement to more standard data on observedbehavior because it essentially recovers the parental strategy directly, even in cases in whichthe child does well in school and never triggers the eventual punishment.
Estimates of the specification in (8) are displayed in Table 10. We find that the moreyounger siblings a child has, i.e., the lower the birth order, the more likely are parents tomore closely supervise the child in the event of that child would bring home an unexpectedlylow performance on a report card. In particular, after controlling for the child’s baselineability and family fixed effects we find that having an additional younger sibling increasethe chances that parents report being very likely to increase supervision upon bad schoolperformance by 2.2 percentage points. This implies that within a family with four children,
18

Table 10: Effect of Birth Order on Probability that Parent would be VeryLikely to Increase Supervision if Child brought on Poor Report Card
Family FamilyOLS OLS FE FE
No. of Younger Siblings 0.0144∗∗ 0.0088 0.0241∗∗∗ 0.0221∗∗
PIAT Math -0.0005 0.0007PIAT Reading Recognition 0.0001 -0.0002PIAT Reading Comprehension 0.0011∗∗ -0.0001PPVT 0.0001 -0.0001Female 0.0070 0.0050 -0.0008 0.0019Observations 11,982 10,380 11,982 10,380
* significant at 10%; ** significant at 5%; *** significant at 1%. Significance levels deter-mined based on robust standard errors.All specifications include a set of year and age variables. Columns 1 and 2 include familysize variables, while columns 3 and 4 include family fixed effects. Dependent variable equalsone if parents report being very likely to supervise the child more closely in the event of lowgrades, equals zero otherwise.
a first born sibling is 6.6 percentage points more likely to have the parent being very likelyto punish upon bad grades relative to the last born, i.e., the fourth child in the family.
6 Conclusions
We contribute to the literature on birth order effects in human capital accumulation byshowing that those born earlier perform better in school. While most of our analysis usesperceptions of school performance, as opposed to true measures of school performance, avalidation of perceptions using actual transcript data shows that these findings do no reflectLake Wobegon effects or, more importantly, any differential performance misperception bybirth order. Our results are robust to controls for family size and, more generally, to theinclusion of family fixed effects. We also show that the same reputation dynamic or othermechanisms may have established birth order effects in ability at the time children reachage 10 and become part of our analyses of incentives. Still, we find that after controlling formeasures of a child’s ability taken at earlier ages, birth order effects in school performancepersist. Moreover, these findings also hold in a subsample of intact families, thus minimizingthe chance that birth order effects mask differential exposure to family structure disruptionthat could hinder school performance.
We then provide evidence consistent with parental reputation incentives generating birthorder effects in school performance. In particular, earlier born siblings are more likely to besubject to rules about TV watching and to face more intense parental monitoring regardinghomework. We then propose a new reputation test based on parental self-reported likelihoodof increased supervision upon bad grades. We present evidence that mothers are more likelyto report that they would increase the supervision of one of their children in the event that
19

child brought home a worse than expected report card when the child in question was oneof her earlier-born children. While further research is needed to rule out alternative expla-nations associated with changing cost and technologies of alternative parenting strategiesas sibships grow, we believe that results indicate that parental reputation dynamics mayexplain part of the observed birth order effects in school performance.
20

References
[1] Behrman, J. & P. Taubman (1986) “Birth Order, Schooling and Earnings.” Journal ofLabor Economics, 4(3): S121-S145.
[2] Bjerkedal, T., P. Kristensen, G. Skejeret & J.I. Brevik (2007) “Intelligence test scoresand birth order among young Norwegian men (conscripts) analyzed within and betweenfamilies.” Intelligence. 35(6): 503514.
[3] Black, S., P. Devereux & K. Salvanes (2005) “The More The Merrier? The Effect ofFamily Size and Birth Order on Children’s Education.” Quarterly Journal of Economics,120(2): 669-700.
[4] Black, S. P. Devereux & K. Salvanes (2007) “Older and Wiser?: Birth Order and IQ ofYoung Men.” NBER working paper 13237
[5] Blake, J. (1981) “Family Size and the Quality of Children,” Demography, 18(4): 421-442.
[6] Bonesrønning, H. (1998). “The importance of student effort in education production.empirical evidence from Norway.” Department of Economics. Norwegian University ofScience and Technology.
[7] Booth, A. & H. J. Kee (2009). “Birth Order Matters: The Effect of Family Size and BirthOrder on Educational Attainment,” Journal of Population Economics. 22(2): 367-397.
[8] Conley, D. & R. Glauber (2006). “Parental Education Investment and Children’s Aca-demic Risk: Estimates of the Impact of Sibship Size and Birth Order from ExogenousVariation in Fertility.” Journal of Human Resources. 41(4): 722-37.
[9] Covington, M. (2000). “Goal Theory, Motivation and School Achievement: An Integra-tive Review.” Annual Review of Psychology. 51: 171-200.
[10] De Fraja, G., T. D’Oliveira & L. Zanchi (2005). “Must Try Harder. Evaluating the Roleof Effort on Examination Results,” CEPR Discussion Paper 5048, May 2005.
[11] Ermisch, J.F. & M. Francesconi (2001). “Family Structure and Children’s Achieve-ments.” Journal of Population Economics. 14: 249-270.
[12] Fan, X. & M. Chen (2001). “Parental involvement and students’ academic achievement:A meta-analysis.” Educational Psychology Review, 13: 1-22.
[13] Finlay, K. & D. Neumark (2010). “Is Marriage Always Good for Children? Evidencefrom Families Affected by Incarceration,” Journal of Human Resources. 45(4): 1046-1088.
[14] Gary-Bobo, R., A. Prieto & N. Picard (2006) “Birth-Order and Sibship Sex CompositionEffects in the Study of Education and Earnings,” Centre for Economic Policy ResearchDiscussion Paper No. 5514.
21
[15] Ginther, D. & R. Pollak (2004). “Family Structure and Children’s Educational Out-comes: Blended Families, Stylized Facts and Descriptive Regressions.” Demography,41(4): 671-696.
[16] Hao, L., V.J. Hotz & G.Z. Jin (2008) “Games that Parents and Adolescents Play: RiskyBehavior, Parental Reputation and Strategic Transfers,” Economic Journal, 118(528):515-555.
[17] Hauser, R. M. & W. H. Sewell (1985) “Birth Order and Educational Attainment in FullSibships.” American Educational Research Journal, 22(1): 1-23.
[18] Hoover-Dempsey, K. V., A. C. Battiato, J. M. T. Walker, R. P. Reed, J. M. De-Jong,& K. P. Jones (2001). “Parental involvement in homework,” Educational Psychologist,36: 195-209.
[19] Kessler, D. (1991). “Birth Order, Family Size and Achievement: Family Structure andWage Determination.” Journal of Labor Economics. 9(4): 413-426.
[20] Kreps, D. & R. Wilson (1982). “Reputation and Imperfect Information,” Journal ofEconomic Theory, 27: 253-279.
[21] Lindert, P. (1977). “Sibling Position and Achievement” Journal of Human Resources,12(2): 220-241.
[22] McLanahan, S. & G. Sandefur (1994). Growing Up With a Single Parent: What Hurts,What Helps. Cambridge, MA: Harvard University Press.
[23] Milgrom, P. & J. Roberts (1982), “Predation, Reputation and Entry Deterrence.” Jour-nal of Economic Theory. 27: 280-312.
[24] Natriello, G. & E. McDill (1986). “Performance Standards, Student Effort on Home-work, and Academic Achievement,” Sociology of Education, 59(1): 18-31.
[25] Olneck M. R. & D. B. Bills (1979). “Family Configuration and Achievement: Effects ofBirth Order and Family Size in a sample of Brothers.” Social Psychology Review, 42(2):135-148.
[26] Price, J. (2008) “Parent-Child Quality Time: Does Birth Order Matter?” Journal ofHuman Resources, 43(1): 240-265.
[27] Rodgers, J. L. , H. H. Cleveland, E. van den Oord & D. C. Rowe (2000). “Resolving theDebate Over Birth Order, Family Size and Intelligence,” American Psychologist. 55(6):599-510
[28] Rodgers, J. L. , H. H. Cleveland, E. van den Oord & D. C. Rowe (2001), “Birth Orderand Intelligence: Together Again for the Last Time?” American Psychologist, 56(6-7):523-524.
[29] Selten, R., 1978, “The Chain Store Paradox.” Theory and Decision, 9: 127-159.
22
[30] Tartari, M. (2008). “Divorce and the Cognitive Achievement of Children.” Unpublishedmanuscript, Yale University.
[31] Thomson, E., T.L. Hanson, & S. McLanahan (1994), “Family Structure and ChildWell-being: Economic Resources vs. Parental Behaviors.” Social Forces. 73(1): 221-242.
[32] Trautwein, U. & O. Koller (2003). “The relationship between homework and achieve-ment: Still much of a mystery,” Educational Psychology Review. 15: 115-45.
[33] Whichman, A. L., J. L. Rodgers & R. C. McCallum (2006), “A Multi-Level Approachto the relationship between Birth Order and Intelligence,” Personality and Social Psy-chology Bulletin, 32(1): 117-127.
[34] Whichman, A. L., J. L. Rodgers & R. C. McCallum (2007), “Birth Order has no effecton Intelligence: A Reply and Extension of Previous Findings.” Personality and SocialPsychology Bulletin, 33(9): 1195-1200
[35] Wolters, C. (1999), “The relation between high school students’ motivational regulationand their use of learning strategies, effort, and classroom performance,” Learning andIndividual Differences. 11(3): 281-99.
[36] Zajonc R. B. & F.J. Sulloway, (2007), “The Confluence Model: Birth Order as a BetweenFamily or Within Family Dynamic?” Personality and Social Psychology Bulletin, 33:1187-1194.
[37] Zajonc, R. B. (1976), “Family Configuration and Intelligence.” Science, 192: 227-236.
23