Embed Size (px)
Citation preview
Strategic Management for the
Capstone Business Simulation® and
Comp-XM®:
Analysis and Assessment
Michael L. Pettus, Ph.D.
ALL RIGHTS RESERVED. No part of this work covered by the copyright hereon may be reproduced or
used in any form or by any means- graphic, electronic, or mechanical, including photocopying, recording,
taping, Web distribution, or information storage and retrieval systems without the written permission of the
author, Michael L. Pettus. [email protected]
Copyright 2012
® is a registered trademark of Management Simulations, Inc.
6th Edition
2
“I like this new 6th
edition”
Professor Renee English
Webster University
“This text is excellent as a strategic management text which uses the Capstone
simulation and cases to explain the linkages of strategic management concepts to
real world business problems.”
Joseph Mahoney, Ph.D.
Caterpillar Chair in Strategic Management
University of Illinois
Associate Editor, Strategic Management Journal
“If you use the Capstone simulation this strategic management text must be used.
No other strategic management text can drive the concepts of strategic management
into a real world based simulation.”
Peter Wright, Ph.D.
Free Enterprise Chair in Strategic Management
University of Memphis

3
Acknowledgments
I would like to thank many people for their hard work and dedication to the
construction of this book. First, I would like to thank Dan Smith, founder of the
Capstone Business Simulation, for giving me the opportunity to prepare the book.
Second, I would like to thank all the students who spent hundreds of hours
word processing this book: Karen Knight and Tim Wiggenbach deserve special
recognition. Amanda Walker was especially helpful in the construction of this
second edition. Denisa Smaldone was very helpful in the development of the third
edition. Victoria Dudleston was instrumental in the constructing of the fourth
edition. Kelsey Lee was very important, and made significant contributions, in the
construction of the 5th
edition. Audra Davis was crucial in terms of assistance of the
updated 5th
edition. Maddison Harner was outstanding in terms of assistance in
creating the 6th edition. Someday all of you will walk with industry giants.
Third, there are two people who were vital to the construction of this book:
May Zelner of Capstone Business Simulation and Hans Royal-Hedinger of Millikin
University. Without the hard work of these individuals, this book would never have
been accomplished. If I were to pick a number of individuals to start a business,
May and Hans would be among my ten top picks in the world! Someday both of
you will walk with captains of industry.
Fourth, I would like to thank Eddie Schwertz of Webster University for his
review of the 6th edition
4
Michael L. Pettus earned a PhD in strategic management from the University of
Illinois in 1997 and has more than 30 years of global experience in airline, airfreight
and trucking industries. He is published in the Academy of Management Journal, the
Strategic Management Journal, and many leading practitioner journals. He is the
author of Growth from Chaos (2003: Praeger) which explores corporate growth in
deregulated transportation industries. This book, Strategic Management for the
Capstone Business Simulation and Comp - XM, which is now in its 6th edition,
explains how the content of strategic management is integrated into business
simulations.

5
This book is dedicated to CAT.
6
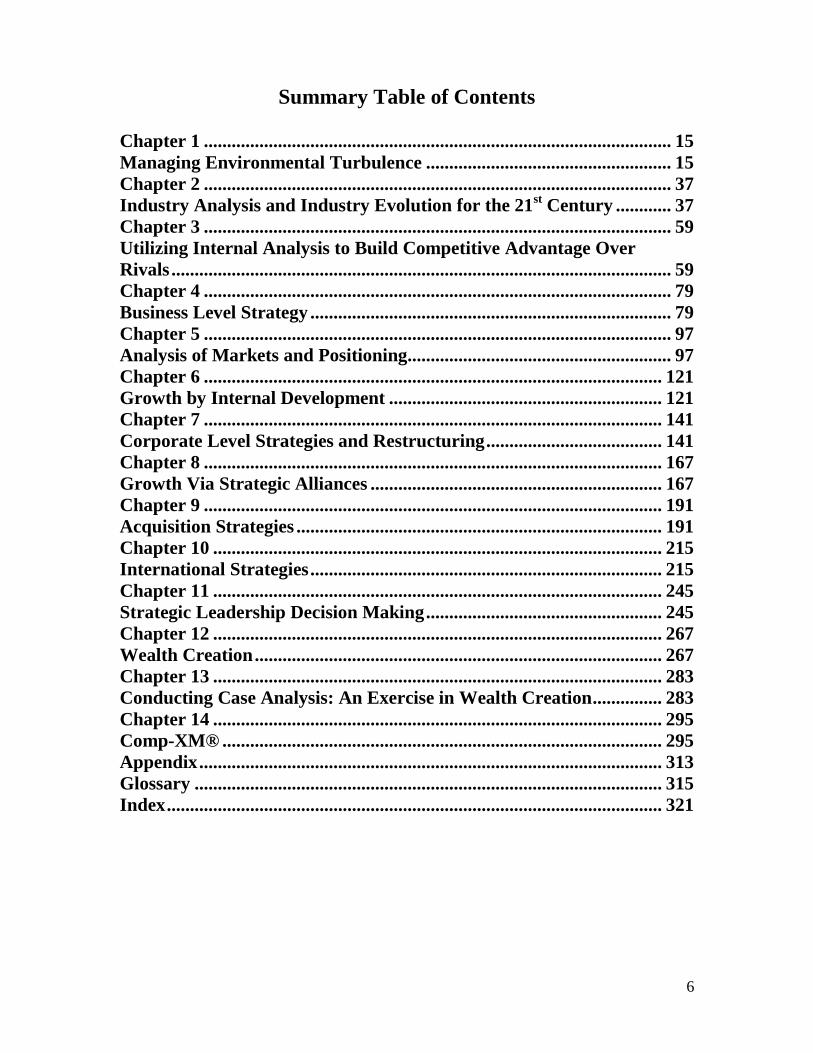
Summary Table of Contents
Chapter 1 ..................................................................................................... 15
Managing Environmental Turbulence ..................................................... 15
Chapter 2 ..................................................................................................... 37
Industry Analysis and Industry Evolution for the 21st Century ............ 37
Chapter 3 ..................................................................................................... 59
Utilizing Internal Analysis to Build Competitive Advantage Over
Rivals ............................................................................................................ 59
Chapter 4 ..................................................................................................... 79
Business Level Strategy .............................................................................. 79
Chapter 5 ..................................................................................................... 97
Analysis of Markets and Positioning......................................................... 97
Chapter 6 ................................................................................................... 121
Growth by Internal Development ........................................................... 121
Chapter 7 ................................................................................................... 141
Corporate Level Strategies and Restructuring ...................................... 141
Chapter 8 ................................................................................................... 167
Growth Via Strategic Alliances ............................................................... 167
Chapter 9 ................................................................................................... 191
Acquisition Strategies ............................................................................... 191
Chapter 10 ................................................................................................. 215
International Strategies ............................................................................ 215
Chapter 11 ................................................................................................. 245
Strategic Leadership Decision Making ................................................... 245
Chapter 12 ................................................................................................. 267
Wealth Creation ........................................................................................ 267
Chapter 13 ................................................................................................. 283
Conducting Case Analysis: An Exercise in Wealth Creation ............... 283
Chapter 14 ................................................................................................. 295
Comp-XM® ............................................................................................... 295
Appendix .................................................................................................... 313
Glossary ..................................................................................................... 315
Index ........................................................................................................... 321
7
Detailed Table of Contents
Chapter 1 ..................................................................................................... 15
Managing Environmental Turbulence ...................................................... 15 Learning and Assessment Goals .....................................................................................16 U.S. Economic Collapse ...................................................................................................18 U.S. Government Stimulus Plan .....................................................................................20 U.S. Auto Industry ...........................................................................................................20 International Recession ...................................................................................................21 The "Secret" Global Bailout ...........................................................................................23
Economic Status as of 3rd
Quarter 2011 ........................................................................25
Economic Conditions During 1st Quarter 2012 .............................................................26
Discussion Questions .......................................................................................................31
References .........................................................................................................................32
Harvard Business Cases for Chapter 1 ..........................................................................36 Professor Case for Chapter 1 ..........................................................................................36
Chapter 2 ..................................................................................................... 37
Industry Analysis and Industry Evolution for the 21st Century ............ 37
Learning and Assessment Goals .....................................................................................38 The Competitive Environment in the 21
st Century ......................................................39
Industry Structure ...........................................................................................................40
Industry Classification ....................................................................................................40 Porter’s Five Forces .........................................................................................................42
Potential Entrants (Threat of New Entrants) ............................................................. 42 Bargaining Power of Suppliers ................................................................................. 43 Bargaining Power of Buyers ..................................................................................... 43 Threat of Substitutes ................................................................................................. 43 Degree of Rivalry ...................................................................................................... 44
Industry Analysis Using Porter’s Five Forces Model ...................................................45 Industry Evolution ...........................................................................................................46
Introduction Stage ..................................................................................................... 47 Growth Stage ............................................................................................................ 47 Maturity Stage ........................................................................................................... 47 Decline Stage ............................................................................................................ 48 Industry Forces During Introduction Stage............................................................... 50 Industry Forces During Growth Stage ...................................................................... 50 Industry Forces During Maturity Stage .................................................................... 51 Industry Forces During Decline Stage ...................................................................... 51 The Upside of Declining Industries .......................................................................... 52
Discussion Questions .......................................................................................................53 References .........................................................................................................................54 Intel Mini Case .................................................................................................................55 Harvard Business Cases for Chapter 2 ..........................................................................57
8
Professor Case for Chapter 2 ..........................................................................................57
Chapter 3 ..................................................................................................... 59
Utilizing Internal Analysis to Build Competitive
Advantage Over Rivals ............................................................................... 59 Learning and Assessment Goals .....................................................................................60 The Resource-Based View ...............................................................................................61
Criteria for Competitive Advantage .......................................................................... 61 Value Chain Analysis and Capstone Simulation ..........................................................68
Technology Development ......................................................................................... 68 Human Resource Management ................................................................................. 69 Firm Infrastructure .................................................................................................... 69 Procurement .............................................................................................................. 69 Inbound and Outbound Logistics .............................................................................. 70 Operations ................................................................................................................. 70 Marketing and Sales .................................................................................................. 70 Service....................................................................................................................... 71
Global Outsourcing .........................................................................................................71 Discussion Questions .......................................................................................................74 References .........................................................................................................................75 Ryder Mini Case ..............................................................................................................77 Harvard Business Cases for Chapter 3 ..........................................................................78 Professor Case for Chapter 3 ..........................................................................................78
Chapter 4 ..................................................................................................... 79
Business Level Strategy .............................................................................. 79 Learning and Assessment Goals .....................................................................................80 Key Success Factors .........................................................................................................81
Determining Key Success Factors ............................................................................ 81 Utilizing Key Success Factors over Time ................................................................. 82
Generic Business Level Strategies ..................................................................................82 Cost leadership .......................................................................................................... 83 Focused low cost ....................................................................................................... 83 Differentiation ........................................................................................................... 83 Focused differentiation ............................................................................................. 84
Walmart Expansion ................................................................................................... 85
Competitive Dynamics .....................................................................................................87 SWOT Analysis ........................................................................................................ 87 Strengths ................................................................................................................... 87 Weaknesses ............................................................................................................... 88 Opportunities............................................................................................................. 88 Threats....................................................................................................................... 88
SWOT Analysis of American and Southwest Airlines ............................................. 89
Competitive dynamics over time .............................................................................. 90
Discussion Questions .......................................................................................................93 References .........................................................................................................................94 Dell Mini Case ..................................................................................................................95 Harvard Business Cases for Chapter 4 ..........................................................................96
9
Professor Case for Chapter 4 ..........................................................................................96
Chapter 5 ..................................................................................................... 97
Analysis of Markets and Positioning......................................................... 97 Learning and Assessment Goals .....................................................................................98 Market Segmentation ......................................................................................................99
Market Segmentation of the Airline Industry…………………….………………99
Product Positioning…………………………………………………………………101
Sales Forecasting ............................................................................................................103 Sales Forecasting Methods ..................................................................................... 103
Sales Forecasting and Capstone Simulation ................................................................104 Marketing Mix Variables ..............................................................................................110
Product Variable ..................................................................................................... 110 Price Variable.......................................................................................................... 111 Promotion Variable ................................................................................................. 111 Distribution Variable .............................................................................................. 113
Discussion Questions .....................................................................................................115 References .......................................................................................................................116 Proctor and Gamble (P&G) Mini Case .......................................................................117 Harvard Business Cases for Chapter 5 ........................................................................119 Professor Case for Chapter 5 ........................................................................................119
Chapter 6 ................................................................................................... 121
Growth by Internal Development ........................................................... 121 Learning and Assessment Goals ...................................................................................122 Internal Development Strategies ..................................................................................123
Market Penetration .................................................................................................. 123 Market Development .............................................................................................. 125 Product Development.............................................................................................. 127 Diversification......................................................................................................... 129
Competition ....................................................................................................................129 Internal Development and Capstone Simulation ........................................................130
Growth by Market Penetration................................................................................ 130 Growth by Market Development ............................................................................ 131 Growth by Product Development ........................................................................... 133 Growth by Diversification ...................................................................................... 135
Discussion Questions .....................................................................................................136 References .......................................................................................................................137 Starbucks Mini Case ......................................................................................................139 Harvard Business Cases for Chapter 6 ........................................................................140 Professor Case for Chapter 6 ........................................................................................140
10
Chapter 7 ................................................................................................... 141
Corporate Level Strategies and Restructuring ...................................... 141 Learning and Assessment Goals ...................................................................................142 Diversification ................................................................................................................143
Diversification and Performance ............................................................................ 143 Diversification and Value Chain Analysis .............................................................. 145
Same Industry Diversification ......................................................................................146 Related Industry Diversification ..................................................................................147 Unrelated Industry Diversification ..............................................................................148
Diversification and Risk ......................................................................................... 148 Business Strengths and Industry Attractiveness ........................................................149
Industry Attractiveness ........................................................................................... 150 Business Strength .................................................................................................... 151
Restructuring .................................................................................................................152 Downsizing ............................................................................................................. 152 Downscoping .......................................................................................................... 153 Realignment ............................................................................................................ 154
Restructuring and the Capstone Simulation ...............................................................154 Discussion Questions .....................................................................................................160 References .......................................................................................................................161 General Electric (G.E.) Mini Case ...............................................................................165 Harvard Business Cases for Chapter 7 ........................................................................166 Professor Case for Chapter 7 ........................................................................................166
Chapter 8 ................................................................................................... 167
Growth Via Strategic Alliances ............................................................... 167 Learning and Assessment Goals ...................................................................................168 Trust ................................................................................................................................170 Scale of Coverage ...........................................................................................................171 Relationship-Specific Assets .........................................................................................171 Complementary Capabilities ........................................................................................171 Interfirm Knowledge Sharing ......................................................................................171 Scale Alliances ................................................................................................................172 Link Alliances .................................................................................................................174 Joint Ventures ................................................................................................................176 The Downside of Strategic Alliances and Joint Ventures ..........................................177
Strategic Alliances and the Recession ..........................................................................177 The Future of Strategic Alliances .................................................................................178 Strategic Alliances and Capstone Simulation .............................................................179 Discussion Questions .....................................................................................................183 References .......................................................................................................................184 Oneworld Airline Strategic Alliance Mini Case .........................................................188 Harvard Business Cases for Chapter 8 ........................................................................189
11
Professor Case for Chapter 8 ........................................................................................189
Chapter 9 ................................................................................................... 191
Acquisition Strategies ............................................................................... 191 Learning and Assessment Goals ...................................................................................192
Impact of the Global Recession on Mergers and Acquisitions .................................193
Attributes of Successful Acquisitions ...........................................................................197 Access to International Markets.............................................................................. 197 Synergies Resulting from Economies of Scale ....................................................... 198 Synergies Resulting from Economies of Scope ...................................................... 198 Reduce Costs of New Product Development .......................................................... 198 Entry into More Attractive Industries ..................................................................... 199
Problems with Acquisitions ..........................................................................................199 Paying Too Much .................................................................................................... 199 Inability to Achieve Synergies ................................................................................ 199 Failure to Retain Key Personnel ............................................................................. 200 Too Much Debt ....................................................................................................... 200 Invest in Mature Industries ..................................................................................... 201
Process for Achieving Successful Acquisitions ............................................................202 Due Diligence ......................................................................................................... 202 Engage in Friendly Acquisitions ............................................................................. 202 Maximize Resource Utilization .............................................................................. 202 Diversify Into Firms That Have Strong Brand Names ........................................... 203 Acquire High Growth Firms ................................................................................... 204
Hostile Acquisitions .......................................................................................................204 Are Acquisitions Beneficial? .........................................................................................205 Acquisitions as a Source of Innovation ........................................................................206 Discussion Questions .....................................................................................................208 References .......................................................................................................................209 Pfizer Mini Case .............................................................................................................212 Harvard Business Cases for Chapter 9 ........................................................................213 Professor Case for Chapter 9 ........................................................................................213
Chapter 10 ................................................................................................. 215
International Strategies ............................................................................ 215 Learning and Assessment Goals ...................................................................................216 Factors Encouraging International Expansion ...........................................................217 Innovation in Domestic Market ....................................................................................220 Determining International Country Attractiveness ...................................................220 Role of Government .......................................................................................................221 Determination of International Industry Attractiveness ...........................................223 Determination of Firms’ Business Strengths ..............................................................226 Adaptation Versus Standardization .............................................................................228 Determination of International Modes of Entry .........................................................228
12
Exporting................................................................................................................. 228 Licensing/Franchising ............................................................................................. 230 Strategic Alliances .................................................................................................. 231 Acquisitions ............................................................................................................ 231 Foreign Direct Investment ...................................................................................... 232
Competition within International Markets Intensifies ..............................................233 Relocate to Low Cost Markets ......................................................................................233 New Innovation in Home Markets ...............................................................................233 Discussion Questions .....................................................................................................235 References .......................................................................................................................236 IKEA Mini Case .............................................................................................................239 L’Oreal Mini Case .........................................................................................................241 Harvard Business Cases for Chapter 10 ......................................................................243 Professor Case for Chapter 10 ......................................................................................243
Chapter 11 ................................................................................................. 245
Strategic Leadership Decision Making ................................................... 245 Learning and Assessment Goals ...................................................................................246 Strategic Leadership ......................................................................................................247 Customers .......................................................................................................................249 Employees .......................................................................................................................250 Collective Bargaining Organizations ...........................................................................251 Shareholders ...................................................................................................................252 Board of Directors .........................................................................................................252 Investment Community .................................................................................................253 Senior Managers and Ethical Decision Making ..........................................................253
Strategic Leadership and Growth ………………………………………………......255
Scandals and Strategic Leadership ..............................................................................257 Industry Evolution and Strategic Leadership .............................................................258
Introduction ............................................................................................................. 258 Growth .................................................................................................................... 259 Maturity................................................................................................................... 259 Decline .................................................................................................................... 260
Discussion Questions .....................................................................................................261 References .......................................................................................................................262 Hershey Mini Case .........................................................................................................264 Harvard Business Cases for Chapter 11 ......................................................................265 Professor Case for Chapter 11 ......................................................................................265
13
Chapter 12 ................................................................................................. 267
Wealth Creation ........................................................................................ 267 Learning and Assessment Goals ...................................................................................268 Balanced Scorecard and Wealth Creation ..................................................................269 Customer Wealth ...........................................................................................................271
Consumer Costs ...................................................................................................... 272 Firm Costs ............................................................................................................... 272
Shareholder Wealth .......................................................................................................273 Liquidity Ratios ...................................................................................................... 274 Asset Management Ratios....................................................................................... 274 Debt Management Ratios ........................................................................................ 275 Profitability Ratios .................................................................................................. 275 Economic Value Added (EVA) and Market Value Added (MVA) ........................ 275
Employee Wealth ...........................................................................................................276 Positioning for Future Wealth ......................................................................................277 Capstone Simulation Measures of Wealth Creation ..................................................280 Discussion Questions .....................................................................................................281
References …………………………………………………………………………..282
Chapter 13 ................................................................................................. 283
Conducting Case Analysis: An Exercise in Wealth Creation ............... 283 Industry Structure .........................................................................................................286 Competitive Dynamics for the Capstone Simulation .................................................289 Wealth Creation Measures ...........................................................................................290 Conclusion ......................................................................................................................291 Recommendations ..........................................................................................................293
Chapter 14 ................................................................................................. 295
Comp-XM® ............................................................................................... 296 Balanced Scorecard .......................................................................................................301 Board Query Questions .................................................................................................308
Appendix .................................................................................................... 313 U.S. Domestic Data Sources ..........................................................................................313 International Data Sources ...........................................................................................314
Glossary ..................................................................................................... 315
Index ........................................................................................................... 321

14

15
Chapter 1
Managing Environmental Turbulence
16
Learning and Assessment Goals
1. Understand why we are in a recession within the U.S.
2. Understand why a global recession has occurred.
3. Understand the role the U.S. Government is playing to improve economic
conditions with its economic stimulus plan.
4. Understand the economic state of affairs as of 2011.
5. Understand, at the firm level, what has to happen to be able to grow in turbulent
economic environments.
6. Understand how firms can maintain competitive positions in times of economic
turbulence.
17
We live in a chaotic, changing world. The economic ramifications of 2007-2010
have had a negative economic impact on most emerging and fully developed countries
throughout the world. The United States has been very significantly impacted by this
economic downturn. Some economists believe that the 2007-2010 time period
represented a depression rather than a recession.
Are the 1930’s depression conditions upon us during 2007-2010? The Great
Depression of the 1930’s may have a more modern version. However, the solutions to
this current economic crisis need 2011 solutions. This chapter will address ways of
dealing with current economic conditions. If firms are to be successful in current
economic times, a number of decisions will need to be made which address conditions
specific to modern times. The first question that needs to be raised is, “Are we in a
depression or a recession?” In the United States, the Business Cycle Dating Committee
of the National Bureau of Economic Research (NBER) is generally seen as the authority
for dating U.S. recessions. The NBER defines an economic recession as: “a significant
decline in [the] economic activity spread across the country, lasting more than a few
months, normally visible in a reduction in real GDP growth, real personal income,
employment (non-farm payrolls), industrial production, and wholesale-retail sales1.”
Academics, economists, policy makers, and businesses defer to the determination
measurement by the NBER for the precise dating of a recession’s onset and end2. A
depression is a severe economic downturn that results in a decline in real GDP exceeding
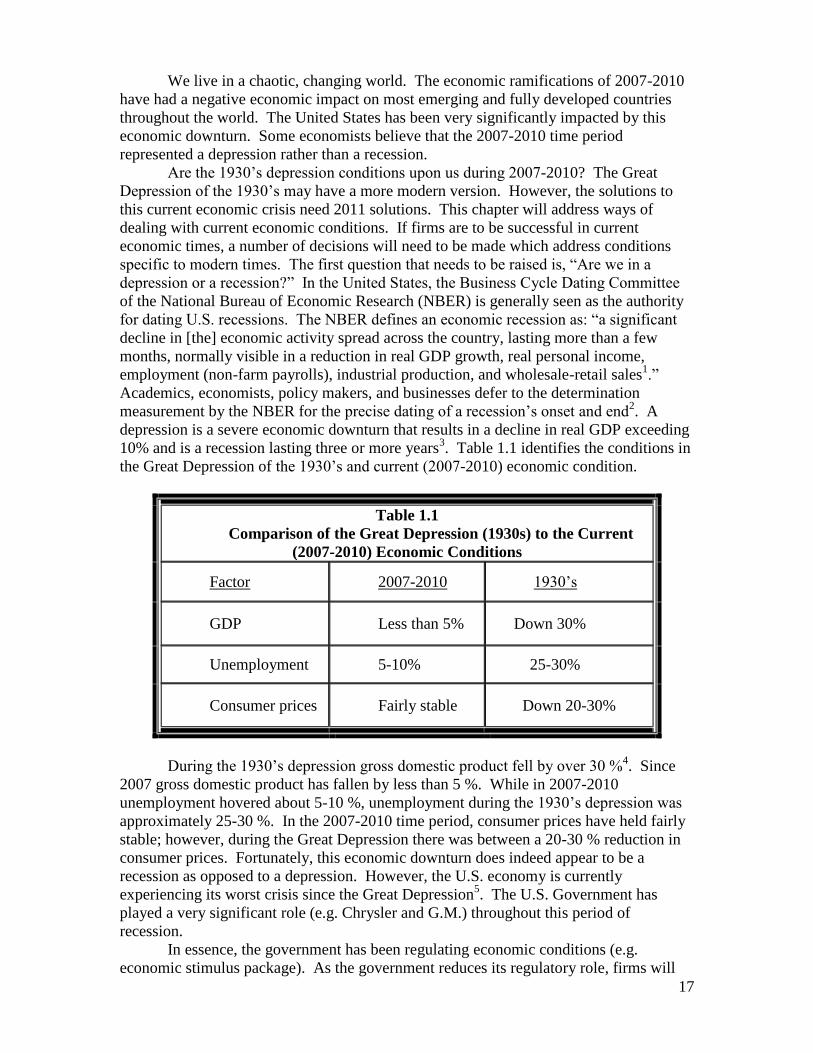
10% and is a recession lasting three or more years3. Table 1.1 identifies the conditions in
the Great Depression of the 1930’s and current (2007-2010) economic condition.
Table 1.1
Comparison of the Great Depression (1930s) to the Current
(2007-2010) Economic Conditions
Factor 2007-2010 1930’s
GDP Less than 5% Down 30%
Unemployment 5-10% 25-30%
Consumer prices Fairly stable Down 20-30%
During the 1930’s depression gross domestic product fell by over 30 %4. Since
2007 gross domestic product has fallen by less than 5 %. While in 2007-2010
unemployment hovered about 5-10 %, unemployment during the 1930’s depression was
approximately 25-30 %. In the 2007-2010 time period, consumer prices have held fairly
stable; however, during the Great Depression there was between a 20-30 % reduction in
consumer prices. Fortunately, this economic downturn does indeed appear to be a
recession as opposed to a depression. However, the U.S. economy is currently
experiencing its worst crisis since the Great Depression5. The U.S. Government has
played a very significant role (e.g. Chrysler and G.M.) throughout this period of
recession.
In essence, the government has been regulating economic conditions (e.g.
economic stimulus package). As the government reduces its regulatory role, firms will
18
need to learn how to adjust to the new economic environment. These new economic
conditions (2007-2010) have had a significant impact upon industries and firms. Let us
begin with what caused the current (2007-2009) economic crisis.
U.S. Economic Collapse What happened was caused by a combination of two factors. The first factor was
people losing their jobs causing them not to be able to pay their mortgages. In the U.S.,
significant job losses have been going on since December 2007 and have accelerated in
September 2008. In 2008, 2.6 million jobs were lost. From January through April of
2009, 2.6 million jobs were also lost.
The rise of advanced economies in Russia, Brazil, India, and China increased the
total global labor pool dramatically. Recent improvements in communication and
education in these countries has allowed workers to compete more effectively with
workers in traditionally strong economies, such as the United States. This surge in labor
supply has provided downward pressure on wages and contributed to unemployment.
The second factor that has contributed to the challenging economic conditions is
falling housing prices in the U.S. Historically, the U.S. housing market has been very
strong. From the mid-1990 to 2005, housing prices grew. During the same period of
time, the U.S. gross domestic product (GDP) per capita was rising.
Housing prices stopped increasing in 2006, started to decrease in 2007, decreased
in 2008 and have fallen about 25% from the peak in 20056. During 2007-2010, the
decline in prices meant that homeowners had more difficulty refinancing their mortgage
rates. This action caused delinquencies and defaults of mortgages to increase sharply,
especially among subprime borrowers. Sub-prime loans were made to customers who
had spotty credit histories. In 2006, it was estimated that over half of the loans were sub-
prime. Banks who had financed these mortgages tried to sell the loans to other banking
institutions. In order to sell the loans, these institutions had to lower the price. These
actions made the initial bank and the bank who acquired the loans worse off. In general,
this is what led to the demise of Bear Stearns and Lehman Brothers. Many other firms
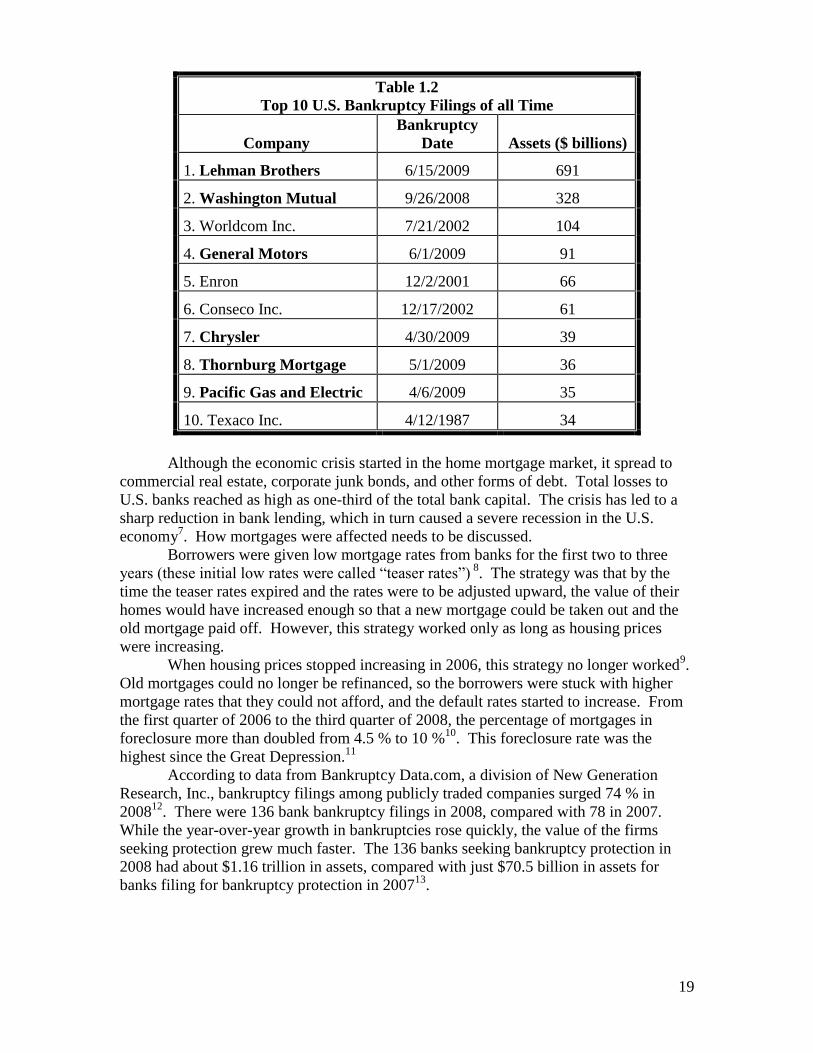
were also dramatically affected. From Table 1.2, the top U.S. bankruptcy filings of all
times included six firms in 2008 and 2009.
19
Table 1.2
Top 10 U.S. Bankruptcy Filings of all Time
Company
Bankruptcy
Date Assets ($ billions)
1. Lehman Brothers 6/15/2009 691
2. Washington Mutual 9/26/2008 328
3. Worldcom Inc. 7/21/2002 104
4. General Motors 6/1/2009 91
5. Enron 12/2/2001 66
6. Conseco Inc. 12/17/2002 61
7. Chrysler 4/30/2009 39
8. Thornburg Mortgage 5/1/2009 36
9. Pacific Gas and Electric 4/6/2009 35
10. Texaco Inc. 4/12/1987 34
Although the economic crisis started in the home mortgage market, it spread to
commercial real estate, corporate junk bonds, and other forms of debt. Total losses to
U.S. banks reached as high as one-third of the total bank capital. The crisis has led to a
sharp reduction in bank lending, which in turn caused a severe recession in the U.S.
economy7. How mortgages were affected needs to be discussed.
Borrowers were given low mortgage rates from banks for the first two to three
years (these initial low rates were called “teaser rates”) 8
. The strategy was that by the
time the teaser rates expired and the rates were to be adjusted upward, the value of their
homes would have increased enough so that a new mortgage could be taken out and the
old mortgage paid off. However, this strategy worked only as long as housing prices
were increasing.
When housing prices stopped increasing in 2006, this strategy no longer worked9.
Old mortgages could no longer be refinanced, so the borrowers were stuck with higher
mortgage rates that they could not afford, and the default rates started to increase. From
the first quarter of 2006 to the third quarter of 2008, the percentage of mortgages in
foreclosure more than doubled from 4.5 % to 10 %10
. This foreclosure rate was the
highest since the Great Depression.11
According to data from Bankruptcy Data.com, a division of New Generation
Research, Inc., bankruptcy filings among publicly traded companies surged 74 % in
200812
. There were 136 bank bankruptcy filings in 2008, compared with 78 in 2007.
While the year-over-year growth in bankruptcies rose quickly, the value of the firms
seeking protection grew much faster. The 136 banks seeking bankruptcy protection in
2008 had about $1.16 trillion in assets, compared with just $70.5 billion in assets for
banks filing for bankruptcy protection in 200713
.
20
U.S. Government Stimulus Plan The U. S. government has tried to stabilize this economic crisis. President
Obama’s economic stimulus package, $787 billion, has been an attempt to get the
economy back on track. On February 10, 2009, the Senate voted 61-37 to approve
President Obama’s economic stimulus bill. The first piece of the plan would create one
or more banks that would rely on taxpayer and private money to purchase and hold the
banks’ bad assets14
. In the credit markets, the administration and the Fed are proposing
to expand a lending program that would spend as much as $1 trillion to make up for the
$1.2 trillion decline created between 2006 and 2009 by issuing securities backed
primarily by consumer loans15
.
The second major component of the plan would give banks capital with which to
lend. Banks that receive new government assistance will have to cut the salaries and
perks of their executives and sharply limit dividends and some corporate acquisitions16
.
The third piece of the plan would use the last $350 billion that the Treasury has
allocated for the bailout to rely on the Federal Reserve’s ability to create money. The
Fed’s money will enable the government to become involved in the management of
markets and banks17
.
By comparing the first six months of 2006 with the first six months of 2009,
results have not been promising. Retail sales have decreased from $360 billion in 2006 to
$340 billion in 200918
. Construction of new homes has declined from approximately 2
million in 2006 to less than 500,000 in 200919
. The purchasing managers’ index shows
the manufacturing sector activity has declined significantly since 200620
. Orders for
nondefense capital goods have decreased from over $60 billion in 2006 to less than $50
billion in 200921
. Jobless claims have increased from 300,000 to over 600,00022
. In
2009, the number of people who are receiving jobless benefits rose to 670,000 million
individuals. This is the highest total since 196723
. The impact of the recession upon the
U.S. auto industry has been especially severe.
U.S. Auto Industry G.M. and Chrysler have received billions of dollars in government funds to try to
return to profitability. As of mid 2009, nothing positive has happened. Chrysler has
emerged from Chapter 11 bankruptcy (7th
largest filing of all time: Table 1) and G.M. has
had to receive several billion dollars in additional government aid. G.M. is in a
particularly difficult position. On March 30, 2009, Rick Wagoner, the CEO of G.M. was
forced to resign. This was one of the first times that a U.S. government has forced out a
CEO of a publically held company24
. This would appear to have been a necessary move.
G.M. has not turned a profit since 2004. Between 2004-2008, G.M. has lost 82
billion dollars25
. G.M.’s stock was trading at $70/share in June 2000. On March 30,
2009 the stock was trading at $3.62. In May 2009, the stock was trading at $0.7526
.
Because of these conditions, G.M. has had to borrow money from the
government. As part of President Obama’s bailout plan, G.M. borrowed $15.4 billion27
.
In addition, G.M. was forced to borrow an additional $4 billion during the first quarter of
2009 to stay in business28
. In addition, G.M. eliminated its Pontiac division and cut
21,000 employees29
. On May 16, 2009, G.M. began to close 1100 of its dealerships30
.
On June 1, 2009, GM went into Chapter 11 bankruptcy protection (4th
largest filing of all
time: Table 1.2).
Several other businesses of G.M. were affected. The Saturn brand was
discontinued in 2009. In 2010, the Hummer brand was discontinued. G.M. has exited
21
Chapter 11 Bankruptcy Protection and has been increasing revenues, earnings and
earnings per share in 2010 and 2011.
Chrysler has taken a somewhat different approach. Chrysler has obtained $9
billion in bailout funds and exited Chapter 11 bankruptcy protection after 45 days on June
12, 2009. Chrysler has looked to Fiat for assistance. The U.S. Government has put in
place goals for Fiat if it desires to increase its ownership of Chrysler. Fiat will be
allowed to expand its ownership of Chrysler up to a majority stake if the Italian auto
maker meets certain goals31
.
Fiat will get an initial 20% stake in Chrysler and can increase its holdings in
increments of five percentage points, up to 35%, if it achieves three milestones by
January 1, 2013. Fiat will get the first increase once it starts producing Fiat engines in
the U.S. To receive the second increase, Fiat must develop a vehicle in the U.S. that can
go 40 miles on a gallon of gasoline.32
Fiat can get a third increase if Chrysler is able to generate more than $1.5 billion
in sales outside of North America, according to a “Master Transaction Agreement” that
was filed on May 9, 2009 in the U.S. Bankruptcy Court in Manhattan.33
The agreement
also gives Fiat the option to purchase an additional 16% of Chrysler. If Fiat meets all
three goals and exercises its options, it could eventually end up with a 51% stake in
Chrysler.34
Fiat won’t be able to take full control of Chrysler until it pays off the loans
Chrysler has received from the U.S. government. Prior to that point, Fiat’s ownership
will be capped at 49.9%. Until the loans are repaid, any Fiat stake above 35% will be
held in a trust controlled by the U.S. treasury.35
As of May 2011, Chrysler has some success with repayment of its loans. Chrysler
used a $1.3 billion investment from Fiat to repay its loans. Fiat, which has had
management control over Chrysler since it emerged from bankruptcy protection in 2009,
paid that amount to increase its stake in Chrysler to 46 percent. The refinancing will
allow it to retire a $5.9 billion balance on the U.S. loans and $1.6 billion to the
governments of Canada and Ontario36
. As of 2011, Fiat has an agreement to buy the U.S.
Treasury’s remaining 6% stake in Chrysler Group LLC, a move that would bring an end
to the U.S. government’s involvement in Chrysler37
. The Canadian and U.S.
governments had taken stakes in Chrysler after providing the automaker $7.6 billion in
bankruptcy loans. Chrysler formally repaid those loans in 201138
. This agreement could
allow Fiat to skip a Chrysler IPO and move forward with its ambitions to combine
Chrysler and Fiat into a single automaker with global footprints.
In 2011, the combination sold 1.4 million vehicles, a 26% increase from the prior
year. For 2011, Fiat/Chrysler generated sales of 59.55 billion Euros and profit of 1.07
billion Euros.
Chrysler is optimistic about its future. Sergio Marchionne, who is CEO of Fiat
and Chrysler, said profit for 2012 should increase to $1.5 billion and revenue rise 18%
over 2011 to $65 billion. As of 2012, the two largest stake holders are Fiat and UAW. As
of 2012, Chrysler is owned by Fiat and the UAW. Fiat has a 53.5 percent share and the
UAW has a 14.5 percent share.
International Recession This recession (2007-2010) has not been experienced solely in the U.S.; it is
having negative impacts in several international markets. During 2006 and 2007 global
investors with significant amounts of cash were looking for ways to invest their funds.
As discussed earlier, Wall Street investment firms began to consolidate investments with
22
both prime and sub-prime loans. As housing prices declined many large and well
established investment and commercial banks in Europe suffered huge losses. This was
the beginning of the global recession. This recession has resulted in a sharp drop in
international trade, rising unemployment and a reduction in commodity prices. This
impacted not only the U.S. investors but international investors as well.
Wall Street hedge funds held by large institutional investors and foreign banks
who had bought some of the consolidated loans had difficulty selling the loans39
. Banks
stopped lending in an effort to conserve cash. The worldwide recession became worse
because investors who had funds were not investing. This action caused stock markets
worldwide to plummet. As stock prices fell, firms cut expenses to try to keep up with the
declining stock prices. This caused a significant increase in unemployment and
individuals stopped making purchases except for necessities.
The collapse of the housing market in the U.S. had a direct impact not only on the
nation’s mortgage banks but also upon U.S. and international home builders, real estate,
and home supply retail outlets. The continuing development of this crisis led to a global
economic collapse40
. Beginning with failures caused by misapplication of risk controls
for bad debts, collateralization of debt insurance and fraud, large financial institutions in
the United States and Europe faced a credit crisis and a slowdown in economic activity.
The crisis rapidly developed and spread into a global economic shock, resulting in a
number of European bank failures, declines in various stock indexes, and large reductions
in the market value of equities and commodities.
Other impacts were felt in international markets. In 2009, currency values, oil
prices and other commodity prices increased significantly while housing prices in the
European Union continued to decline. Steep declines in the economies of three of the
U.S.’s biggest trading partners – Mexico, Japan and Germany – underscored the severity
of the global recession and put pressure on major industrialized nations to revive global
trade talks41
. Mexico has been affected significantly.
Mexico’s gross domestic product fell at an annualized rate of 21.5% in the first
quarter of 2009. This was the worst performance since the 1995 peso crisis which led to
an International Monetary Fund and U.S. Treasury financial rescue. Mexico, during the
past 15 years, has depended on demand for goods from the U.S. to stabilize its economy.
About a fifth of Mexico’s economy depends on manufacturing exports to the U.S., and
this dramatic drop in demand has hit Mexico hard42
. During the first quarter of 2009,
Mexican auto production slid 41% compared to the same period the year before.
Mexico’s decline was followed by Japan’s as its economy contracted in the first quarter
of 2009 by 15.2%, its worst performance since 195543
. Germany’s first quarter of 2009
showed a decline in GDP by 14.5%, which was the worst since 1970. All of these
countries depend heavily on exports to the U.S. This is no longer happening because
U.S. consumers have cut back purchases from these countries.
Many industrialized countries went into recession in 2008. The following
countries went into recession in the third quarter of 2008: Japan, Sweden, Hong Kong,
Singapore, Italy, Turkey and Germany44
. In addition, the fifteen nations in the European
Union that use the euro went into recession in the third quarter of 2008. The following
countries went into recession in the fourth quarter of 2008: United Kingdom, Spain,
Taiwan, Estonia, Latvia, Ireland, New Zealand, Russia, Netherlands, and Iceland45
. It is
possible that some of these countries may have obtained funds from the U.S. Federal
Reserve.
23
I would like to thank one of our professors, David Baker, for bringing the following
recent events to my attention.
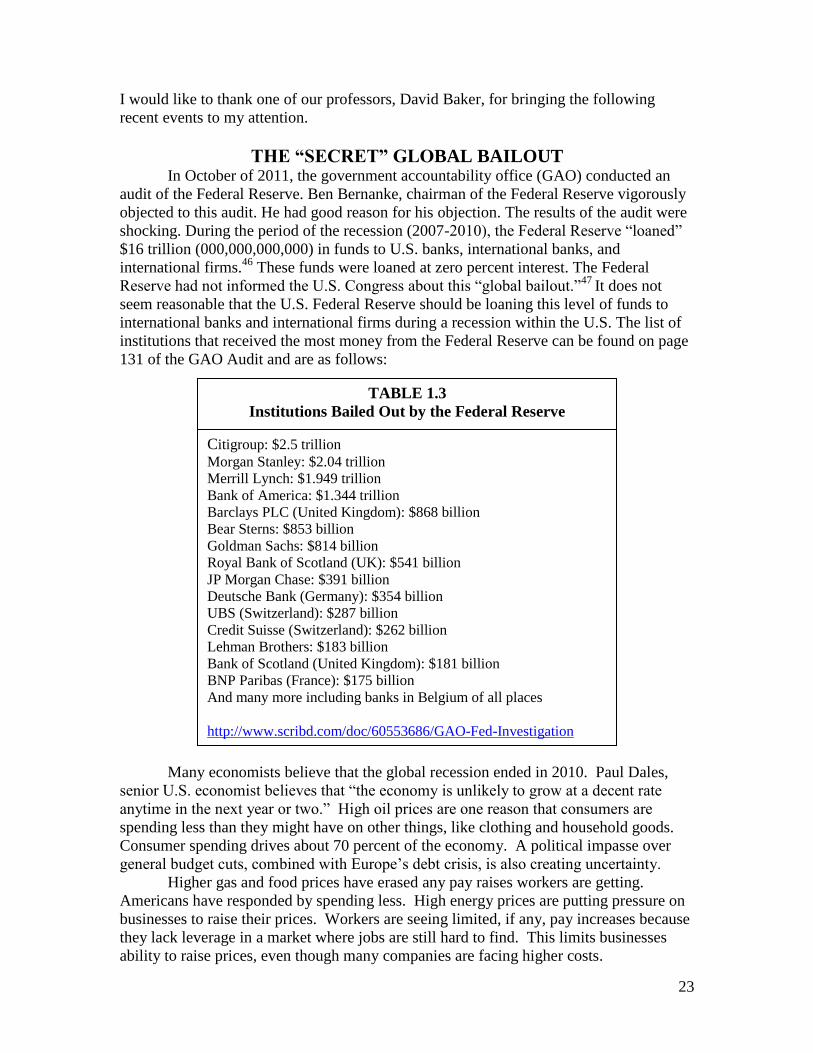
THE “SECRET” GLOBAL BAILOUT In October of 2011, the government accountability office (GAO) conducted an
audit of the Federal Reserve. Ben Bernanke, chairman of the Federal Reserve vigorously
objected to this audit. He had good reason for his objection. The results of the audit were
shocking. During the period of the recession (2007-2010), the Federal Reserve “loaned”
$16 trillion (000,000,000,000) in funds to U.S. banks, international banks, and
international firms.46
These funds were loaned at zero percent interest. The Federal
Reserve had not informed the U.S. Congress about this “global bailout.”47
It does not
seem reasonable that the U.S. Federal Reserve should be loaning this level of funds to
international banks and international firms during a recession within the U.S. The list of
institutions that received the most money from the Federal Reserve can be found on page
131 of the GAO Audit and are as follows:
Economic Status as of Mid-2011
Many economists believe that the global recession ended in 2010. Paul Dales,
senior U.S. economist believes that “the economy is unlikely to grow at a decent rate
anytime in the next year or two.” High oil prices are one reason that consumers are
spending less than they might have on other things, like clothing and household goods.
Consumer spending drives about 70 percent of the economy. A political impasse over
general budget cuts, combined with Europe’s debt crisis, is also creating uncertainty.
Higher gas and food prices have erased any pay raises workers are getting.
Americans have responded by spending less. High energy prices are putting pressure on
businesses to raise their prices. Workers are seeing limited, if any, pay increases because
they lack leverage in a market where jobs are still hard to find. This limits businesses
ability to raise prices, even though many companies are facing higher costs.
Citigroup: $2.5 trillion
Morgan Stanley: $2.04 trillion
Merrill Lynch: $1.949 trillion
Bank of America: $1.344 trillion
Barclays PLC (United Kingdom): $868 billion
Bear Sterns: $853 billion
Goldman Sachs: $814 billion
Royal Bank of Scotland (UK): $541 billion
JP Morgan Chase: $391 billion
Deutsche Bank (Germany): $354 billion
UBS (Switzerland): $287 billion
Credit Suisse (Switzerland): $262 billion
Lehman Brothers: $183 billion
Bank of Scotland (United Kingdom): $181 billion
BNP Paribas (France): $175 billion
And many more including banks in Belgium of all places
http://www.scribd.com/doc/60553686/GAO-Fed-Investigation
TABLE 1.3
Institutions Bailed Out by the Federal Reserve
24
U.S. increases in hiring have not manifested themselves in the first half of 2011.
Disappointing U.S. economic data followed poor manufacturing reports around the globe.
The numbers, together with evidence of a continuing downdraft in housing and signs that
companies and consumers remain apprehensive about spending, suggest the economy
recovery will be slow. With unemployment high, the housing market not expanding and
ongoing financial turmoil in Europe, the slowdown could turn into something more
ominous. Despite cautious outlook for 2011, 36 of the 38 economists surveyed oppose
any further efforts by the Fed to invigorate growth. The Fed has already cut short-term
interest rates to near zero. And it’s ending a program to buy $600 billion in Treasury
bonds to keep longer-term rates low to help increase spending and hiring.
Economists say another round of bond-buying wouldn’t provide much benefit, if
any. Some fear it could make things worse by unleashing high inflation and disrupting
financial markets. When it buys bonds, the Fed, in effect, prints massive amounts of
money. All that extra money in the system raises the nominal value of the things we buy,
weakening the dollar, and it can create bubbles in the prices of stocks and commodities.
Some economists believe that the second half of 2011 will show improvement in
economic conditions. The reason is that the main causes of the slowdown – high oil
prices and manufacturing delays because of the disaster in Japan – have started to fade.
Oil prices have been falling since Memorial Day (2011). Economists surveyed by the
Association Press (AP) predicted unemployment would fall to 8.7 percent at year’s end.
However, the economy is still carrying too much baggage from the financial crisis –
damaged banks, depressed home prices, and debt-burdened consumers – to achieve much
liftoff.
The global economy is expected to grow as reported by the Organization for
Economic Co-operation and Development (OECD). This organization’s mission is to
improve the economic and social wellbeing of people around the world. The member
nations of OECD are Australia, Austria, Belgium, Canada, Chile, Czech Republic,
Denmark, Estonia, Finland, France, Germany, Greece, Hungary, Iceland, Ireland, Israel,
Italy, Japan, Korea, Luxembourg, Mexico, Netherlands, New Zealand, Norway, Poland,
Portugal, Slovak Republic, Slovenia, Spain, Sweden, Switzerland, Turkey, United
Kingdom, and the U.S.
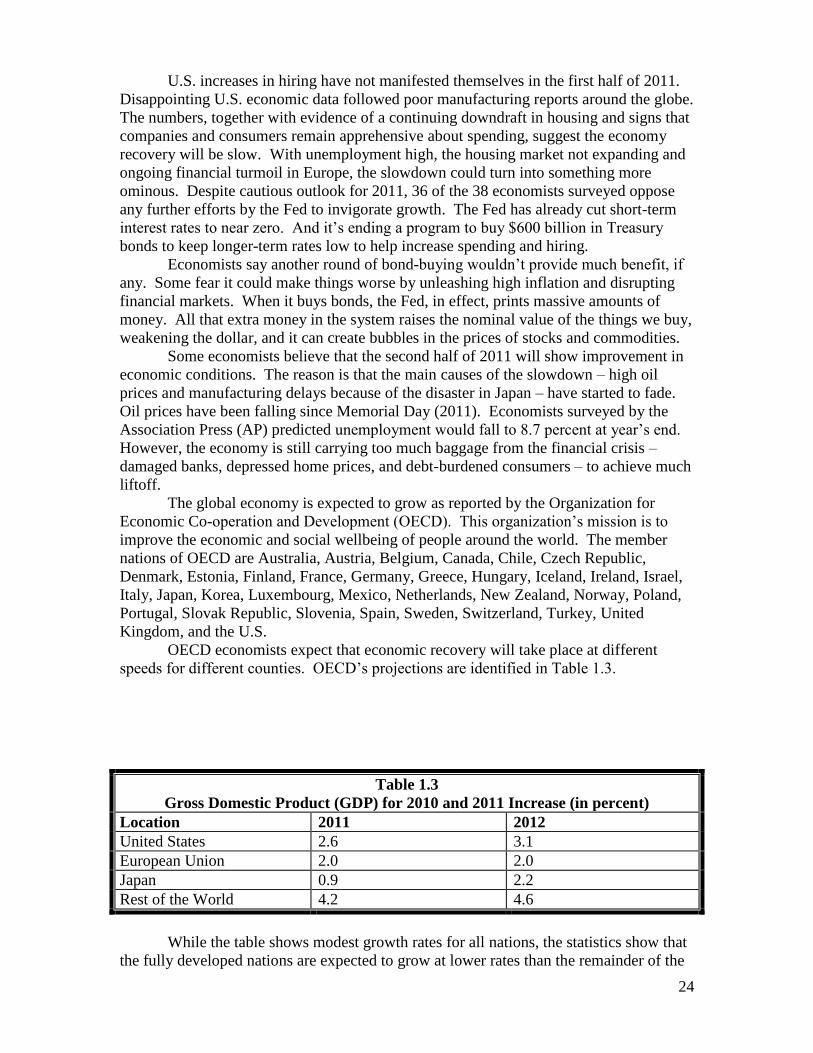
OECD economists expect that economic recovery will take place at different
speeds for different counties. OECD’s projections are identified in Table 1.3.
Table 1.3
Gross Domestic Product (GDP) for 2010 and 2011 Increase (in percent)
Location 2011 2012
United States 2.6 3.1
European Union 2.0 2.0
Japan 0.9 2.2
Rest of the World 4.2 4.6
While the table shows modest growth rates for all nations, the statistics show that
the fully developed nations are expected to grow at lower rates than the remainder of the
25
world. However, there are significant events which could significantly lower all of these
projections. Risks include possibility of further increases in oil and commodity prices,
which could feed into cause inflation; a stronger-than-projected slowdown in China; the
unsettled fiscal situation in the United States and Japan; and renewed weakness in
housing markets in many OECD countries.
The top challenge facing countries is widespread unemployment, which affects
more than 50 million people of OECD nations. Governments must ensure that
employment services match the unemployed to jobs. They should also rebalance
employment protection towards temporary workers; consider reducing taxes on labor via
targeted subsidies for low paid jobs; and promote work-sharing arrangements that can
minimize employment losses during downturns.
Economic Status as of 3rd
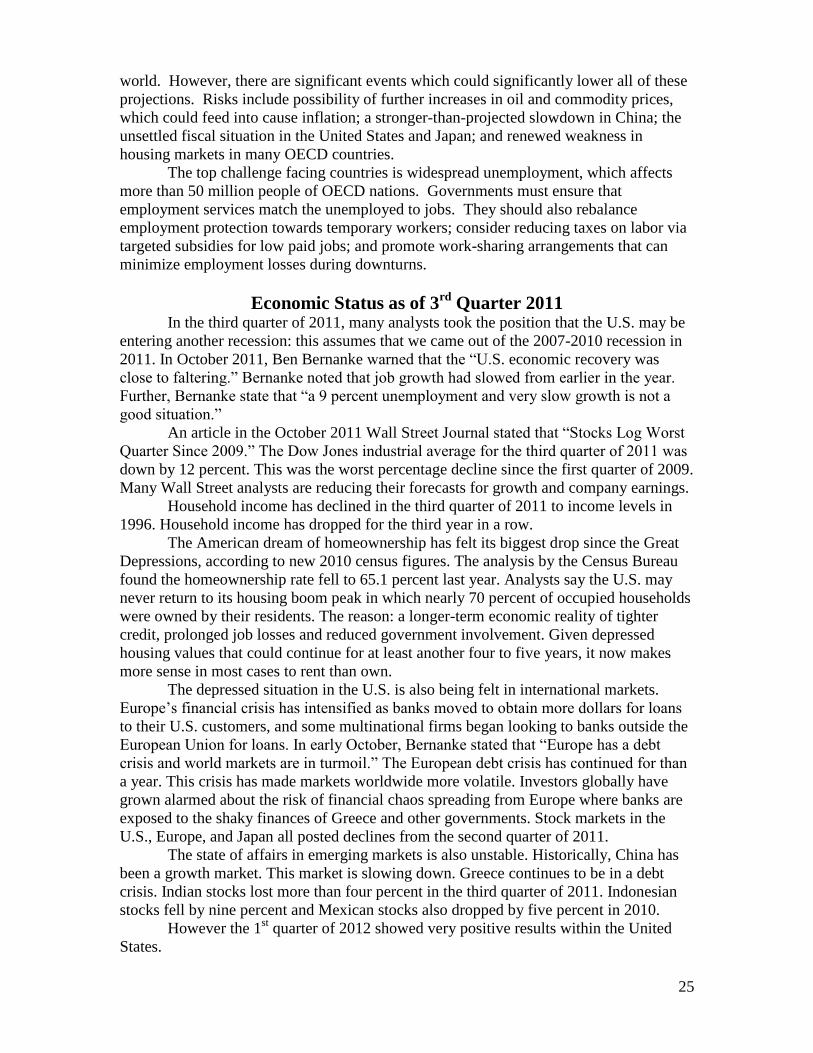
Quarter 2011 In the third quarter of 2011, many analysts took the position that the U.S. may be
entering another recession: this assumes that we came out of the 2007-2010 recession in
2011. In October 2011, Ben Bernanke warned that the “U.S. economic recovery was
close to faltering.” Bernanke noted that job growth had slowed from earlier in the year.
Further, Bernanke state that “a 9 percent unemployment and very slow growth is not a
good situation.”
An article in the October 2011 Wall Street Journal stated that “Stocks Log Worst
Quarter Since 2009.” The Dow Jones industrial average for the third quarter of 2011 was
down by 12 percent. This was the worst percentage decline since the first quarter of 2009.
Many Wall Street analysts are reducing their forecasts for growth and company earnings.
Household income has declined in the third quarter of 2011 to income levels in
1996. Household income has dropped for the third year in a row.
The American dream of homeownership has felt its biggest drop since the Great
Depressions, according to new 2010 census figures. The analysis by the Census Bureau
found the homeownership rate fell to 65.1 percent last year. Analysts say the U.S. may
never return to its housing boom peak in which nearly 70 percent of occupied households
were owned by their residents. The reason: a longer-term economic reality of tighter
credit, prolonged job losses and reduced government involvement. Given depressed
housing values that could continue for at least another four to five years, it now makes
more sense in most cases to rent than own.
The depressed situation in the U.S. is also being felt in international markets.
Europe’s financial crisis has intensified as banks moved to obtain more dollars for loans
to their U.S. customers, and some multinational firms began looking to banks outside the
European Union for loans. In early October, Bernanke stated that “Europe has a debt
crisis and world markets are in turmoil.” The European debt crisis has continued for than
a year. This crisis has made markets worldwide more volatile. Investors globally have
grown alarmed about the risk of financial chaos spreading from Europe where banks are
exposed to the shaky finances of Greece and other governments. Stock markets in the
U.S., Europe, and Japan all posted declines from the second quarter of 2011.
The state of affairs in emerging markets is also unstable. Historically, China has
been a growth market. This market is slowing down. Greece continues to be in a debt
crisis. Indian stocks lost more than four percent in the third quarter of 2011. Indonesian
stocks fell by nine percent and Mexican stocks also dropped by five percent in 2010.
However the 1st quarter of 2012 showed very positive results within the United
States.
26
U.S. Economic Conditions During First Quarter of 2012 As of the first quarter of 2012, the U.S. economy was moving from a period of
recession to a period of growth.
During these first few months of 2012, financial conditions in the United States
have improved. As of March 1, 2012, the Dow Jones Industrials closed above the 13,000
points for the first time since April 25, 2007. The other industrial averages have also
fared well as of this point in time. The Standard & Poor’s 500 is up 9 percent, the
Russell 2000 index of smaller stocks is up 11 percent , and the Nasdaq composite index,
dominated by technology stocks, is up 14%.48
The Nasdaq has not traded so high since December 2000, during the bursting of
the bubble in technology stocks.49
Likewise, the Nasdaq composite index briefly broke
through 3,000 on Wednesday, Feb. 29, 2012. This was the first time since the collapse in
dot-com stocks more than a decade ago. February 2012, was the best month on Wall
Street in 14 years.50
Apple, Nasdaq’s biggest component, topped $500 billion in market value, the
only company above the half-trillion mark and only the sixth in U.S. corporate history to
grow so big.
There is good news from an unemployment perspective also. The economy has
been creating more jobs since last fall, producing an average of 223,000 new jobs in the
months of December and January. 51
U.S. companies have emerged from the recession more productive, more
profitable, flush with cash and less burdened by debt.52
An analysis by the Wall Street
Journal of corporate financial reports finds that cumulative sales, profits and employment
last year among members of the Standard & Poor’s 500-stock index, exceeded the totals
of 2007. This was before the recession and financial crisis.53
27
Table 1.4
U.S. Recovery 2011
Measure Increase from 2007 to 2011
Revenues 17.1
Net Income 22.7
Employees 5.1
Cash 49.9
Capital Spending 16.3 Source: Standard &Poors 2012
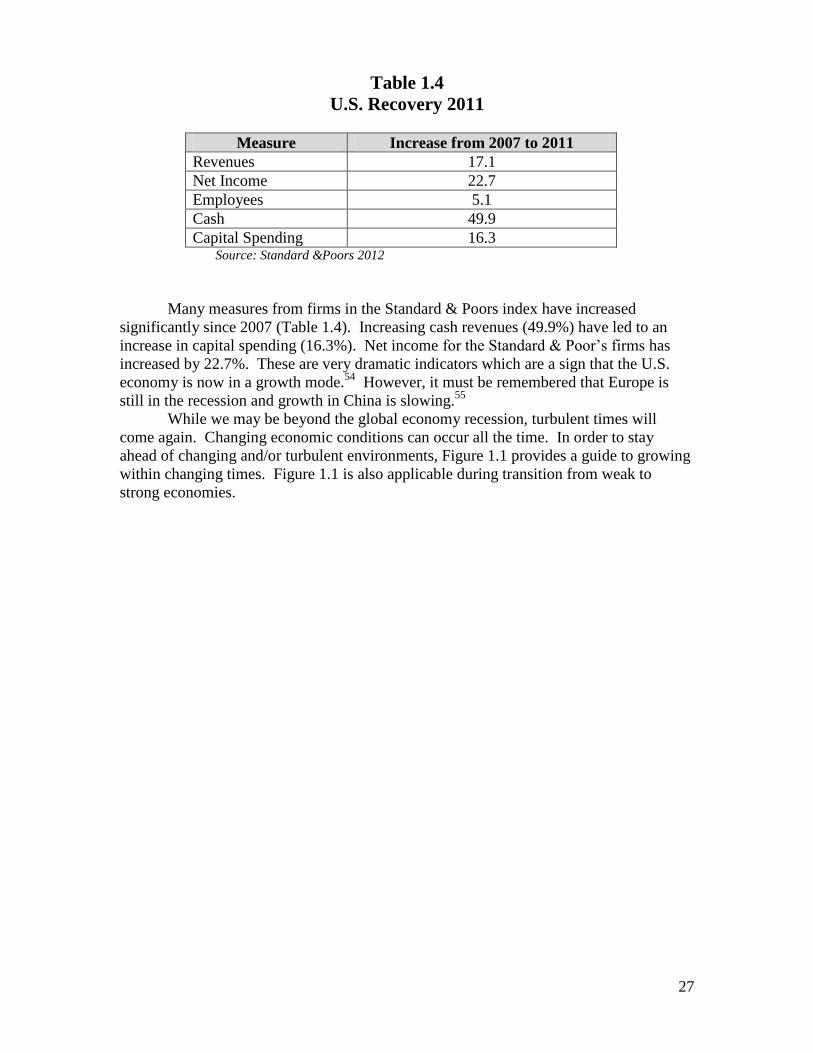
Many measures from firms in the Standard & Poors index have increased
significantly since 2007 (Table 1.4). Increasing cash revenues (49.9%) have led to an
increase in capital spending (16.3%). Net income for the Standard & Poor’s firms has
increased by 22.7%. These are very dramatic indicators which are a sign that the U.S.
economy is now in a growth mode.54
However, it must be remembered that Europe is
still in the recession and growth in China is slowing.55
While we may be beyond the global economy recession, turbulent times will
come again. Changing economic conditions can occur all the time. In order to stay
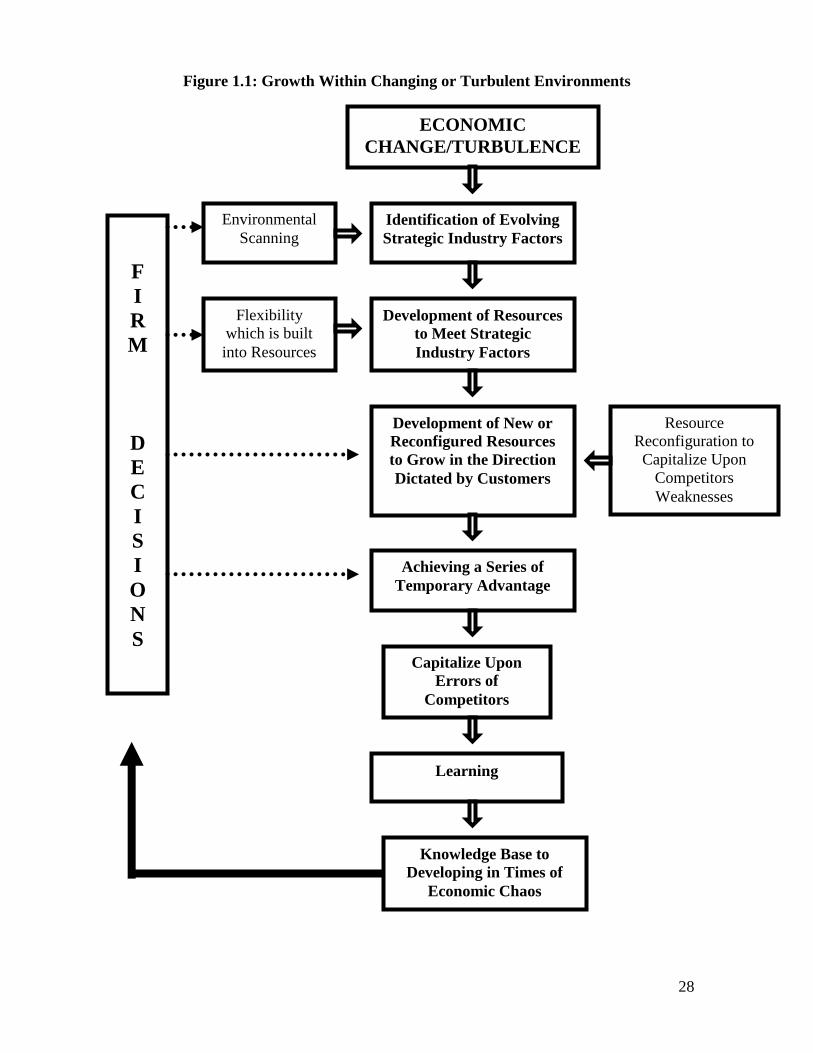
ahead of changing and/or turbulent environments, Figure 1.1 provides a guide to growing
within changing times. Figure 1.1 is also applicable during transition from weak to
strong economies.
28
Figure 1.1: Growth Within Changing or Turbulent Environments
ECONOMIC
CHANGE/TURBULENCE
Identification of Evolving
Strategic Industry Factors
Development of Resources
to Meet Strategic
Industry Factors
Development of New or
Reconfigured Resources
to Grow in the Direction
Dictated by Customers
Capitalize Upon
Errors of
Competitors
Achieving a Series of
Temporary Advantage
Environmental
Scanning
Flexibility
which is built
into Resources
Resource
Reconfiguration to
Capitalize Upon
Competitors
Weaknesses
Learning
Knowledge Base to
Developing in Times of
Economic Chaos
F
I
R
M
D
E
C
I
S
I
O
N
S
29
First, firms must develop the capability to scan the changing environment to
identify how a specific industry is changing and why it is changing in this direction. For
several years, Caterpillar has been experiencing record profits and record growth.
However, its most profitable division, mining equipment, cannot achieve profitability
under current economic conditions (2009-2010). Its mining trucks are used to extract oil
from sand. If the price of oil is greater than $40/barrel, these mining processes are
profitable. If the price is below $40/barrel, the processes are not profitable. Knowing
this fact, Caterpillar is developing mining equipment which could be profitably used at
prices less than $40/barrel. During 2010, the global mining industry became very
profitable throughout the world. Caterpillar now (2011) has an 18 month back log on its
mining trucks. In 2010 and 2011, Caterpillar generated records in terms of revenues and
profits.
Second, during times of economic turbulence, firms must be able to analyze
industries to determine strategic industry factors56
. Strategic industry factors are factors
which dictate consumer buying decisions. What the firm needs to do is to identify the
current customer needs while developing the capacity to identify emerging customer
needs57
. Cell phone manufacturers have sequentially added features as the industry has
evolved to require additional technology capabilities.
Third, in an economic crisis, firms need to develop resources which have
flexibility. Resource flexibility is crucial for growth58
. In many cases, the direction a
firm will grow is not known before the fact. For example, Toyota has been successful
because its production processes are designed to support different models of cars with
minimal modification.
Fourth, a firm needs resources that can be developed to address current strategic
industry factors. In an effort to reduce costs, many universities have developed distance
learning or online courses. This approach is also beneficial to students because they do
not need to incur additional expenses, such as gas or time commuting to a centralized
location.
Fifth, during times of turbulence a firm’s resources need to be combined and
reconfigured to meet the needs of significant environmental change59
. As this happens
firms develop new resources which have the capability to create new and/or improved
products. As the price of oil continues to climb, global auto manufacturers have
responded by developing alternative forms of fuel which are not dependent upon oil. The
significant point with respect to the creation of new resources is that they make existing
and/or related resources better from a differentiation perspective. The new resources
should be put to their most productive use by developing capabilities which add value
(e.g. process and product R & D). The firms that experience the highest growth rates are
able to develop a sequence of temporary advantages that are linked over time to provide
long-term growth. The pharmaceutical industry is an example of an industry which
requires firms to continuously develop new products to replace existing products which
are coming off patent protection (e.g. Lipitor).
Fundamentally a firm must grow with its customer base over time. It is of critical
importance that the firm stays close to the customer to ascertain how strategic industry
factors change over time. This is becoming increasingly difficult as email and fax
become routine modes of communication. To fully understand the evolutionary needs of
its customer base, the firm must keep in close, personal contact with them. If they do not,
its competitors may develop goods and services which meet customers’ needs and take
significant revenues from the initial firm. This is what happened to the U.S. auto industry
as European and Asian auto manufacturers entered and established strong positions
30
within the U.S. These international firms maintained these positions over time by
continuously developing new automobiles which addressed current consumer needs.
Sixth, take advantage of the strategic errors of competitors. The crux of strategy
is to gain a position of advantage and then sustain that position over time60
. Established
business models may not work.
The deregulation of the trucking industry was one case. During the initial phase
of the deregulation of the U.S. trucking industry, trucking firms attempted to move into
related industries before they had fully developed their operational infrastructure; all
these firms went out of business. From a trucking prospective, if a firm’s infrastructure is
not fully developed, it is difficult to meet the needs of a customer base which is
expanding geographically. In this industry a fully developed infrastructure is a
prerequisite for growth. In the trucking industry, those firms which established this
complete infrastructure grew after the industry was deregulated. Those firms which did
not went out of business.
The fast food industry provides another example of firms taking share from
competitors. Some customers now prefer fast food restaurants to provide meals which
are low in calories and fat. McDonalds has recognized this need and has developed
several options for its customers seeking healthy options. Hardees’ is a fast food
restaurant which has not.
As these firms continue to grow learning becomes important. Learning from
other firms can be an important factor. The airfreight firms learned from the telephone
companies the benefits of a hub and spoke network. They learned that they could
significantly reduce transit time and overall costs by developing an integrated air-ground,
hub-and-spoke operating system. By developing global hub-and-spoke operating
systems, carriers provide shippers with total global coverage. This learning provides a
knowledge base for firms to make better strategic decisions during periods of significant
economic change.
The role of alliances is becoming increasingly important in the twenty-first
century. Many firms that have grown in volatile environments have developed strategic
alliance networks that provide for global coverage. The Star, One World, and SkyTeam
alliances have provided airlines throughout the world with global coverage. These
alliances permit access to market positions without significant incremental costs being
incurred. Airlines who are members of these international alliances obtain a global
coverage advantage over carriers that have not engaged in international airline alliances.
As firms begin to grow within domestic environments, alliances provide firms with the
capability to grow over time in changing environments. As they move into international
markets, as a result of these alliances, firms continue to learn how to grow in different
types of international environments. This new knowledge base allows firms to grow
based upon what has been learned. The lessons learned in the 2007-2010 recession
provide valuable insights for future recessions.
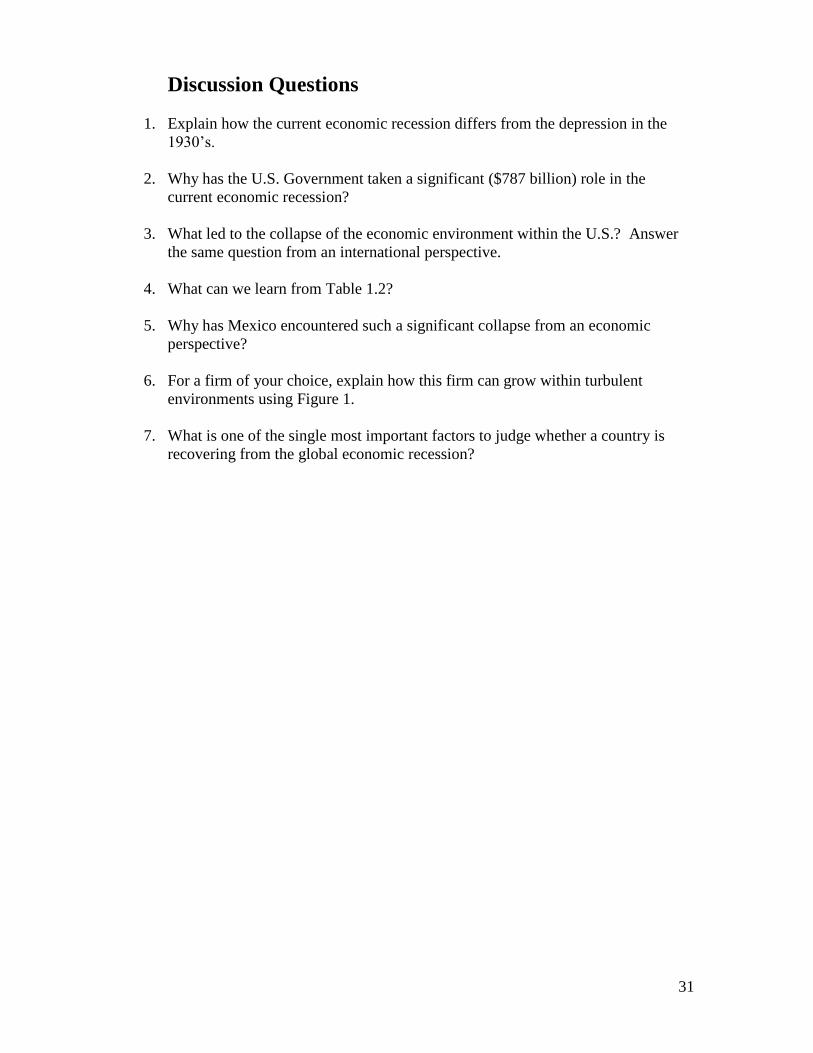
31
Discussion Questions
1. Explain how the current economic recession differs from the depression in the
1930’s.
2. Why has the U.S. Government taken a significant ($787 billion) role in the
current economic recession?
3. What led to the collapse of the economic environment within the U.S.? Answer
the same question from an international perspective.
4. What can we learn from Table 1.2?
5. Why has Mexico encountered such a significant collapse from an economic
perspective?
6. For a firm of your choice, explain how this firm can grow within turbulent
environments using Figure 1.
7. What is one of the single most important factors to judge whether a country is
recovering from the global economic recession?
32
References
1. _______ “Business Cycle Expansion and Contractions.”National Bureau of Economic
Research 2010.
2.
Ibid
3.
Ibid
4.
J. Lahart, “How a Modern Depression Might Look if the U.S. Gets There,” Wall Street
Journal, March 30, 2009.
5.
Ibid
6.
F. Moseley, “The U.S. Economic Crisis; Causes and Solutions,” International
Economic Review, March-April 2009.
7.
____________ “Strategic Planning in a Crisis,” McKinsey Quarterly, 2009.
8.
Moseley, 2009
9.
Ibid
10.
Ibid
11.
Ibid
12.
H. Stern, “Bankruptcies have Banner Year in 2008,” Wall Street Journal, February 26,
2009.
13.
Ibid
14.
E. Andrews and S. Labarion, “Bailout Plan: $2.5 trillion and a strong U.S. Hand,”
Wall Street Journal, February 10, 2009.
15.
Ibid
16.
Ibid
17.
Ibid
18.
J. Hahart, “Gauging the Economy’s Engine as it Sputters Again,” Wall Street Journal,
May 19, 2009.
19.
Ibid
20.
Ibid
33
21.
Ibid
22.
Ibid
23.
__________ “6.7 Million Americans Unemployed: Highest Since 1967,” New York
Times, May 19, 2009.
24.
N. King and J. Stoll, “Government Forces Out Wagner at G.M.,” Wall Street Journal,
March 30, 2009.
25.
Ibid
26.
N. King and S. Terlep, “G.M. Collapses into Government Arms,” Wall Street Journal,
June 2, 2009.
27.
____ “U.S. Treasury Lends $15.4 billion to G.M.,” Wall Street Journal, April 25,
2009.
28.
S. Tercep and N. Shirouzu, “G.M. Gets $4 billion in New U.S. Funds,” Wall Street
Journal, May 23, 2009
29.
____ “Pontiac, 21,000 Workers to be cut in G.M. Plan,” New York Times, April 28,
2009
30.
S. Tercep, “G.M. to Close 1,100 Dealerships,” Wall Street Journal, May 16, 2009.
31.
J. Bennett and A. Kellogg, “New Day for Chrylser as Fiat Arrives,” Wall Street
Journal, June 12, 2009.
32.
Ibid
33.
Ibid
34.
Ibid
35.
N. Bunkley, “Fiat Acquires 35% Stake in Chrysler,” New York Times, January 20,
2009.
36.
Ibid.
37.
V. Bajaj, “Stocks are Hurt by Latest Fear: Declining Prices,” New York Times,
November 20, 2008.
38.
B. Davis, “World Economies Plummet,” Wall Street Journal, May 21, 2009.
39.
Ibid
34
40. L. Bryan and D. Farrell, “Leading through Uncertainty,” McKinsey Quarterly,
December 2008.
41.
D. Luhnow and A. Harrup, “Mexico’s Economy Slumps, Dragged Down by the U.S.”
Wall Street Journal, May 21, 2009.
42.
Ibid
43.
Tanneau, 2009.
44.
___ “Financial Crisis of 2007-2009,” www.en.wikipedia.org/wiki/financialcrisis
45.
Ibid
46.
R. Paul. “Audit of the Federal Reserve Reveal 16 Trillion in Secret Bailouts,” 2012.
47. Ibid
48.
Wagner, Daniel, “Dow closes above 13,000, first time since crises”, The Boston
Globe, February 29, 2012
49.
The Herald-Dispatch, “Nasdaq Cracks 3000, but stocks fall”, 03/01/2012,
http://www.herald-dispatch.com/business/x1744743793/Nasdaq-cracks-3-000-but-stocks-
fall
50.
Ibid
51.
Mullaney, Tim, “Jobless Rate Falling Faster than Many Predicted”, The USA Today,
03/06/2012, http://www.usatoday.com/money/economy/story/2012-01-30/cutting-
the-jobless-rate/53390626/1
52.
Thurm,S, “U.S. Firms Emerge Stronger,” Wall Street Journal, April 9, 2012
53.
Ibid
54.
Thurm,S, “For Big Companies, Life is Good,” Wall Street Journal, April 9, 2012
55.
Ibid
56.
R. Amit and P. Schumacher, “Strategic Assets and Organizational Rent,” Strategic
Management Journal, 1993, 14: 33-46.
57.
B. Wernerfelt, “A Resource-Based View of the Firm,” Strategic Management Journal,
1984, 5: 171-180.
58.
R. Sanchez, “Strategic Flexibility in Product Competition,” Strategic Management
Journal, 16: 135-159.

35
59. P. Moran and S. Ghosphal, “Markets, Firms, and the Process of Economic
Development,” Academy of Management Review, 1999, 24: 390-412.
60.
R. Rumelt, D. Schendel, and D. Teece, “Strategic Management and Economics,”
Strategic Management Journal, 1991, 12: 5-29.
36
Harvard Business Cases for Chapter 1
Toyota: The Accelerator Crisis
Product Number TB0243
Google’s Andriod: Will it shake up the wireless industry in 2009 and beyond?
Product Number SM176
Professor Case for Chapter 1
General Motors (G.M.)
Discussion Question:
Explain G.M.’s strategy as it exited Chapter 11 bankruptcy protection. Has this been a
viable strategy? Explain why or why not.

37
Chapter 2
Industry Analysis and Industry Evolution for the
21st Century

38
Learning and Assessment Goals
1. Understand the challenges of the 21st century.
2. Obtain the ability to conduct an industry analysis.
3. Determine at what stage firms are in from an industry evolution perspective.
4. Understand the relationship between industry analysis and industry evolution.
5. Understand how Porter’s (1980) 5 forces model changes as a firm moves from
one stage of industry evolution to the next.
39
Firms need to have a very clear objective. This objective is referred to as the
mission statement. All stakeholders of the organization should understand the mission
statement. For example, Southwest Airlines mission statement is “dedicated to the
highest quality of customer service delivered with a sense of warmth, friendliness,
individual pride, and company spirit.” In an era of cost-oriented airlines, Southwest
wishes to become the airline that provides its customers the highest quality of airline
transportation service. This mission may be one reason Southwest Airlines is the only
airline that has been profitable every year since the airline industry was deregulated in
1978.
While the mission statement is what the firm wishes to become, the statement of
strategic intent is how a firm is to accomplish its mission. Strategic intent identifies how
the firm uses its resources to achieve advantage within a competitive environment. The
competitive environment of the 21st century differs significantly from the competitive
environment of the 1990’s.
The Competitive Environment in the 21st Century
Some believe that the 21st century will bring significant change. Gary Hamel (co-
author of The Future of Management) believes that strategic leaders will need to greatly
change how they manage. The 20th
century model of designing and managing
companies, which emphasized hierarchy and the importance of labor and capital inputs, is
no longer applicable1. Forward-looking executives will respond to this challenge by
developing new ways to bring innovative products and services to the marketplace2. New
approaches to managing employees and organizing talent to maximize wealth creation
may provide companies with a competitive advantage. As companies change the
direction of the firm, they will have to balance revolutionary thinking with practical
experience3.
Scholars believe that the management of technology will be crucial for success
within the first few decades of this century. There are three reasons why technology will
be important in the current and future environment4. As Lowell (author of Mobilizing
Minds) says, first is the impact of new technology. Technology provides the availability
of powerful new tools for coordinating human effort. Second, increasing global demand
for goods and services will require companies to be adaptable and innovative5. Third,
technology can be used to identify unmet consumer needs much more quickly than in the
past (e.g., iPhone)6.
Lowell believes that strategic leadership must include innovation. The scarce
resources in any company today are discretionary spending, talent, and knowledge. The
issue isn’t just innovation, but being able to implement the innovation throughout the
company. Bryan believes that the ideas on how to run firms in the 21st century have now
reached a stage of maturity which will require managers to consciously innovate.
Bryan believes that we may be entering an area of new technology innovation
which will cause managers to adapt to new environments. This will lead to a continued
importance of developing innovative as a result of increases in intellectual capital. If
innovation can be realized, firms will participate in the new products environment.
Otherwise, these other firms will not. A firm’s competitive environment will consist of firms within its industry and
may consist of firms in other industries. As such, it is important to identify industry
boundaries.
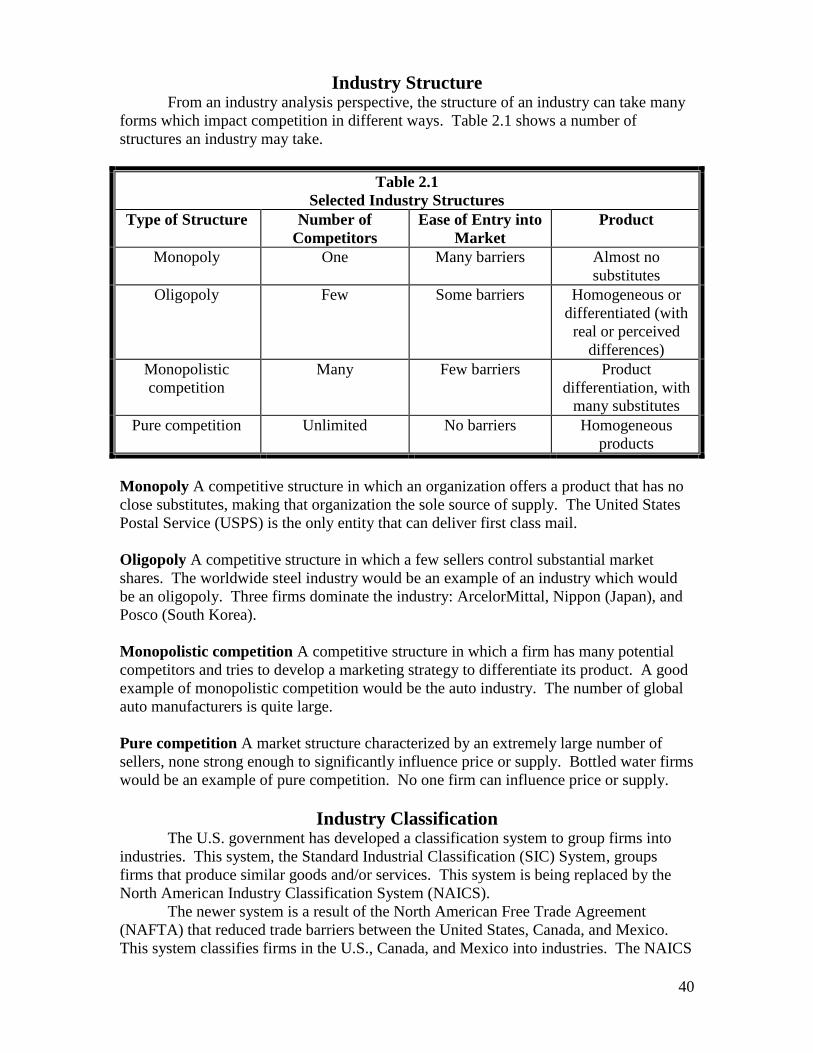
40
Industry Structure From an industry analysis perspective, the structure of an industry can take many
forms which impact competition in different ways. Table 2.1 shows a number of
structures an industry may take.
Table 2.1
Selected Industry Structures
Type of Structure Number of
Competitors
Ease of Entry into
Market
Product
Monopoly One Many barriers Almost no
substitutes
Oligopoly Few Some barriers Homogeneous or
differentiated (with
real or perceived
differences)
Monopolistic
competition
Many Few barriers Product
differentiation, with
many substitutes
Pure competition Unlimited No barriers Homogeneous
products
Monopoly A competitive structure in which an organization offers a product that has no
close substitutes, making that organization the sole source of supply. The United States
Postal Service (USPS) is the only entity that can deliver first class mail.
Oligopoly A competitive structure in which a few sellers control substantial market
shares. The worldwide steel industry would be an example of an industry which would
be an oligopoly. Three firms dominate the industry: ArcelorMittal, Nippon (Japan), and
Posco (South Korea).
Monopolistic competition A competitive structure in which a firm has many potential
competitors and tries to develop a marketing strategy to differentiate its product. A good
example of monopolistic competition would be the auto industry. The number of global
auto manufacturers is quite large.
Pure competition A market structure characterized by an extremely large number of
sellers, none strong enough to significantly influence price or supply. Bottled water firms
would be an example of pure competition. No one firm can influence price or supply.
Industry Classification The U.S. government has developed a classification system to group firms into
industries. This system, the Standard Industrial Classification (SIC) System, groups
firms that produce similar goods and/or services. This system is being replaced by the
North American Industry Classification System (NAICS).
The newer system is a result of the North American Free Trade Agreement
(NAFTA) that reduced trade barriers between the United States, Canada, and Mexico.
This system classifies firms in the U.S., Canada, and Mexico into industries. The NAICS
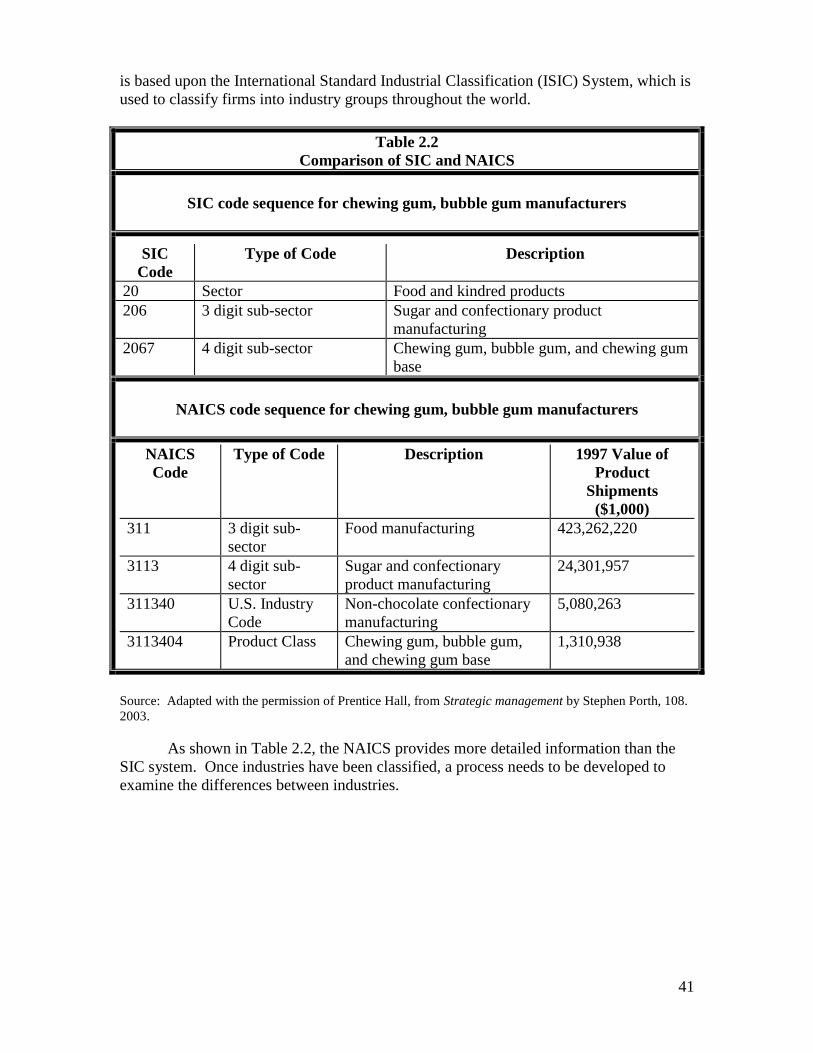
41
is based upon the International Standard Industrial Classification (ISIC) System, which is
used to classify firms into industry groups throughout the world.
Table 2.2
Comparison of SIC and NAICS
SIC code sequence for chewing gum, bubble gum manufacturers
SIC
Code
Type of Code Description
20 Sector Food and kindred products
206 3 digit sub-sector Sugar and confectionary product
manufacturing
2067 4 digit sub-sector Chewing gum, bubble gum, and chewing gum
base
NAICS code sequence for chewing gum, bubble gum manufacturers
NAICS
Code
Type of Code Description 1997 Value of
Product
Shipments
($1,000)
311 3 digit sub-
sector
Food manufacturing 423,262,220
3113 4 digit sub-
sector
Sugar and confectionary
product manufacturing
24,301,957
311340 U.S. Industry
Code
Non-chocolate confectionary
manufacturing
5,080,263
3113404 Product Class Chewing gum, bubble gum,
and chewing gum base
1,310,938
Source: Adapted with the permission of Prentice Hall, from Strategic management by Stephen Porth, 108.
2003.
As shown in Table 2.2, the NAICS provides more detailed information than the
SIC system. Once industries have been classified, a process needs to be developed to
examine the differences between industries.
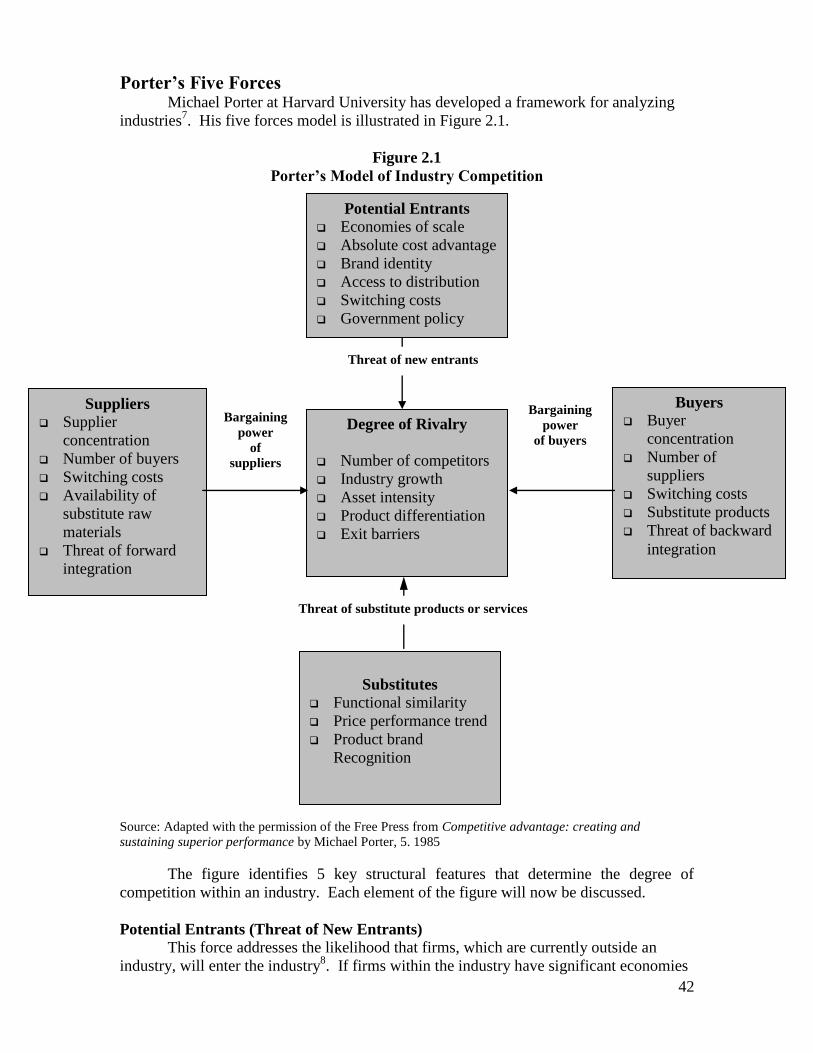
42
Porter’s Five Forces Michael Porter at Harvard University has developed a framework for analyzing
industries7. His five forces model is illustrated in Figure 2.1.
Figure 2.1
Porter’s Model of Industry Competition
Source: Adapted with the permission of the Free Press from Competitive advantage: creating and
sustaining superior performance by Michael Porter, 5. 1985
The figure identifies 5 key structural features that determine the degree of
competition within an industry. Each element of the figure will now be discussed.
Potential Entrants (Threat of New Entrants)
This force addresses the likelihood that firms, which are currently outside an
industry, will enter the industry8. If firms within the industry have significant economies
Potential Entrants
Economies of scale
Absolute cost advantage
Brand identity
Access to distribution
Switching costs
Government policy
Degree of Rivalry
Number of competitors
Industry growth
Asset intensity
Product differentiation
Exit barriers
Substitutes
Functional similarity
Price performance trend
Product brand
Recognition
Suppliers
Supplier
concentration
Number of buyers
Switching costs
Availability of
substitute raw
materials
Threat of forward
integration
Buyers
Buyer
concentration
Number of
suppliers
Switching costs
Substitute products
Threat of backward
integration
Threat of new entrants
Bargaining
power
of buyers
Bargaining
power
of
suppliers
Threat of substitute products or services
43
of scale, these scale economies act as a deterrent to entry. For example, firms are not
likely to enter the ground transportation shipping industry in the U.S. because United
Parcel Service (UPS), FedEx, and DHL deliver millions of shipments each day.
Brand name can also deter firms from entering an industry. Coke and Pepsi have
such strong brands in the soft drink industry that it would be difficult for new entrants to
compete in the beverage industry. Even if entrants attempted to enter a segment (such as
bottled water) firms of the industry, they would be likely to face significant competition.
For example, Coke has acquired Dasani and Pepsi has acquired Aquafina.
Making sure certain goods and services are available to customers requires
establishing an inbound and outbound transportation system. A fully developed
distribution infrastructure provides customers easy access to a firm’s products/services.
Building infrastructure is expensive and time consuming. In addition, new entrants
would need to offer a product and/or service that induces the consumer to switch brands.
For example, a firm would be unlikely to enter the P.C. industry in the U.S. due to the
extensive infrastructure and brand name that Dell has created. The P.C. industry is
comprised of large-scale players who primarily compete on price. These industry
conditions make it difficult for new entrants to establish a viable position within this
industry.
Government policy may also impact a firm’s entry into an industry. For example,
the United States Postal Service (USPS) is a monopoly with respect to delivery of
government mail. As such, competitors are not permitted to enter this segment of the
industry.
Bargaining Power of Suppliers This force addresses the degree to which inputs into the industry affect the
relationship between sellers and buyers9. If pilots decided not to fly, the airline industry
would not function. By having large capital resources (e.g. aircraft) not being utilized,
the airlines would be losing even more money than they are currently.
The greater the degree of concentrations of suppliers, the greater the power these
suppliers can impact an industry. The OPEC cartel is one reason that gasoline prices are
high in 2011. Because final consumers have very few options with respect to travel by
car (e.g. train), the suppliers have a significant impact upon the industry. While auto
manufacturers are introducing alternative types of cars (e.g. electric), the vast majority of
vehicles are still dependent upon oil for fuel.
Bargaining Power of Buyers
This force addresses how much influence customers have within the industry10
.
Where switching costs are low, consumers exert significant power. Switching costs
determine how easy it is for consumers to change products/services. Within the auto and
brewing industries, consumers have many options; thus, consumers have significant
power as to what products/services are manufactured. On the other hand, the
pharmaceutical industry has significant control over buyers because drugs are protected
by 17 years of patent protection.
Threat of Substitutes
This force addresses how products/services are perceived from the customer’s
perspective11
. The more options that the final consumer has, the greater the threat of
substitute products. With respect to cell phone manufacturers, consumers have a broad
selection. As such, price becomes an elastic variable. Because the functionality is
44
primarily the same, the only option for manufacturers is to compete on price. For
industries which do not have brand equity and which have products with similar
functionality, price becomes a key variable. Commodity industries such as mining and
steel manufacturing tend to be price sensitive markets.
On the other hand, the fashion industry is relatively inelastic with respect to price
due to branding (e.g. Gucci). The same brand perception applies to service industries: the
Mayo Clinic has one of the best brand reputations for healthcare in the world. To a lesser
degree, some management-consulting firms have excellent brand reputations (e.g.
McKinsey).
Degree of Rivalry
This issue addresses how much rivalry exists within an industry12
. The degree of
rivalry within an industry is determined by several factors. The first factor is the number
of competitors. In general, the greater the number of competitors within an industry, the
greater is the rivalry.
When little product differentiation exists, firms compete intensely on price. The
U.S. airline and trucking industries are two examples. For industries where significant
product differentiation exists (e.g. the apparel industry), competition is less intense and
focuses on value (or brand) as opposed to price. For example, brand loyalty in the
cosmetics industry is approximately 70 percent13
.
If an industry requires high expenses to acquire and maintain its assets, the rivalry
among firms tends to be less. Because of the capital needed to fund R&D, the
pharmaceutical industry has only a few large competitors. While these competitors
engage in rivalry, the rivalry is focused more on value added products as opposed to pure
price.
Figure 2.2 represents a five focus analysis of the LTL (Less Than Truckload)
Trucking Industry. This industry involves the movement of shipments above 50 pounds
and under 10,000 pounds. The Interstate Commerce Commission (ICC) defines LTL
carriers as those motor carriers who transport freight by placing in their trailers multiple
shipments from multiple shippers destined for multiple customers. While each individual
shipment represents less than a full truckload of freight, the accumulation of multiple
shipments results in fully loaded trailers.
This industry is quite homogeneous in its operating structure and market
environment, but it is different from the operating structure faced by other segments of
the trucking industry. Within this segment, the majority of the carriers utilize a hub-and-
spoke operating system that is distinct from the rail, pipeline, and, to a certain extent, the
TL (truckload) industry. The threat of new entrants will be discussed first.
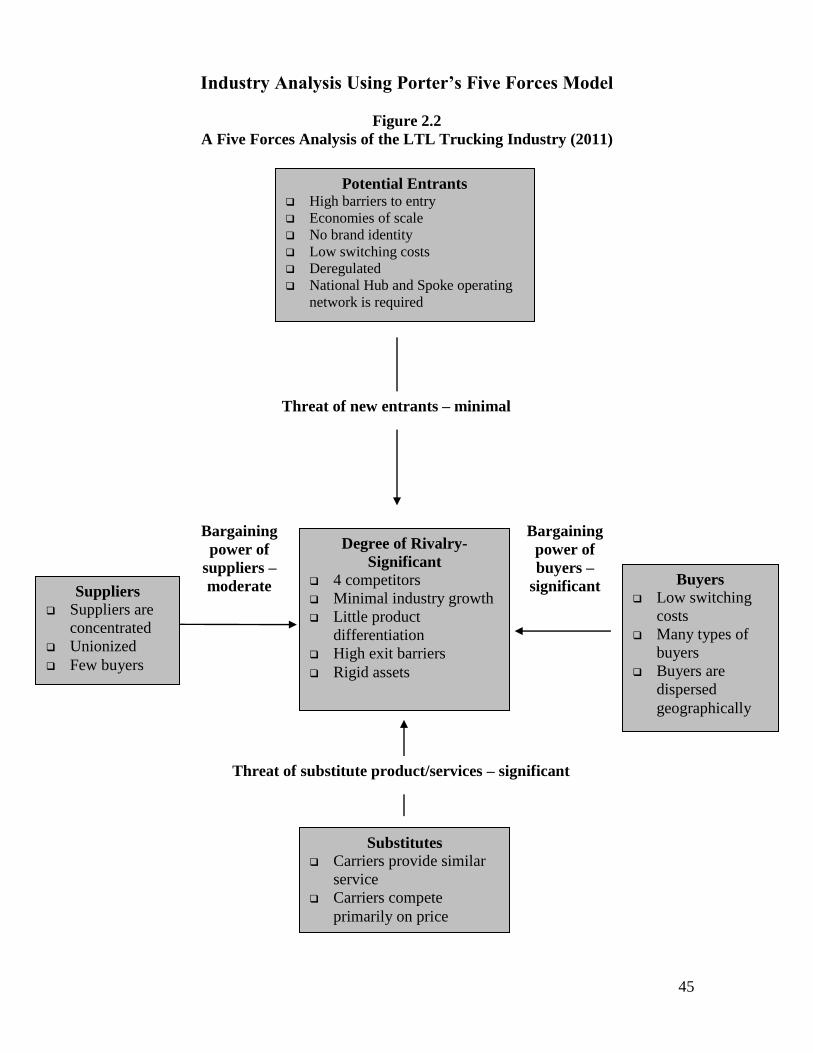
45
Bargaining
power of
buyers –
significant
Industry Analysis Using Porter’s Five Forces Model
Figure 2.2
A Five Forces Analysis of the LTL Trucking Industry (2011)
Potential Entrants High barriers to entry
Economies of scale
No brand identity
Low switching costs
Deregulated
National Hub and Spoke operating
network is required
Degree of Rivalry-
Significant
4 competitors
Minimal industry growth
Little product
differentiation
High exit barriers
Rigid assets
Buyers
Low switching
costs
Many types of
buyers
Buyers are
dispersed
geographically
Suppliers
Suppliers are
concentrated
Unionized
Few buyers
Substitutes
Carriers provide similar
service
Carriers compete
primarily on price
Threat of new entrants – minimal
Bargaining
power of
suppliers –
moderate
Threat of substitute product/services – significant
46
Before the industry was deregulated in 1980, there were over 100 LTL carriers.
As of 2011, 4 major carriers exist. The LTL industry is very capital intensive. As such,
this industry has high barriers to entry. Because there is little brand equity, the trucking
firms must generate profits as a result of economies of scale. The trucking firm’s primary
customers are multi-national corporations. These firms do not view one trucking firm as
providing a better service than the others. As such, the firms compete on price.
Therefore, the threat of new entrants, from firms entering from outside the industry is
minimal. The bargaining power of suppliers will be discussed next.
The workforce of this industry is all unionized. While there is a very large pool
of available workers, unionization puts constraints on trucking operations. While there
are many suppliers of parts, the manufacturer of trucks and trailers are provided by a
small number of firms. As such, these firms exert substantial influence upon the
industry. Because of the power of the labor unions and small number of providers of
trucks and trailers, the bargaining power of suppliers is moderate. The bargaining
power of buyers will be discussed next.
Because customers have very low switching costs (firms are substitutable)
between firms, the existence of substitutes is significant. Carriers have the accessibility
to service all points within the U.S. because they have extension hub and spoke operating
networks. Because customers are dispersed throughout the U.S., the trucking firms have
an advantage compared to rail and air freight modes of transportation. Still, buyers have
significant bargaining power. The threat of substitute products will be discussed next.
Because trucking firms provide similar service, these firms must compete
aggressively on price for business. This is one reason why costs must be minimized.
Therefore, the threat of substitute products or services is significant. The degree of
rivalry will be discussed next.
The LTL industry is comprised of a small number of large-scale players who
compete in an industry with little product differentiation. Because the assets are rigid
(trucks, trailers), alternative uses of assets are minimal. The way that many trucking
firms have been competing is to form strategic alliances with ocean shipping firms and
rail firms. Because all major firms have alliances with railroads and ocean shipping
firms, the trucking firms cannot differentiate their services. With substitutes available,
trucking firms cannot achieve significant product differentiation. Without product
differentiation, cost becomes important. However, the bargaining power of suppliers,
especially labor unions, tends to prevent significant cost reductions. With assets that
cannot be re-deployed to generate alternative revenue streams, the degree of rivalry
within the industry is significant.
The 5 forces industry analysis of the LTL trucking industry would lead to the
conclusion that this is a difficult industry in which to remain profitable. This is a very
mature industry. In 1980, there were over 100 firms. As of 2011, there are 4 major
firms. As of 2011 the largest firm in the industry, YRC, is close to entering Chapter 11
bankruptcy protection. This firm has lost over $2.5 billion in the past 5 years. The other
three firms in the industry are experiencing minimal (if any) profitability.
Industry Evolution Porter’s 5 forces model provides a perspective for industry analysis at a specific
point in time. However, industries evolve over time. Generally, industries move through
a life cycle that consists of introduction (embryonic), growth, maturity, and decline
stages14
. Each of these life cycle stages will be discussed.

47
Introduction Stage
Innovating and creativity dominate the introduction stage. Creativity may be in
the form of technology that changes the way we do business. Broad new technologies
tend initially to be brought into practice in crude form, representing a bundle of potential
resources. The automobile, the airplane, the transistor, the computer, and the laser – were
introduced as new technologies that could be utilized in many industries15
. However,
these innovations required considerable refining before they became useful. It took
significant investment before these new technologies became major contributors to
economic growth16
.
During the introduction stage, products are developed and commercialized for the
first time.17
Advertising plays a key role because potential consumers must be made
aware of new products/services created as a result of these innovations. Distribution
channels need to be developed to provide infrastructure for the transportation of raw
materials into manufacturing facilities and to provide a network to move finished goods
to final consumers. Operational processes need to be developed to manufacture products.
Financial investments are needed to support high initial investments and initial losses.
Because one firm may be supplying the entire market, building a credible image is
important.
Growth Stage
As products begin to be accepted within the industry, demand begins to increase
significantly. With the increase in demand comes competition. Firms begin to design,
manufacture, and distribute similar types of products/services to compete against the
initial firm. Channels of distribution are expanded because of the increase in demand.
As firms begin to design and manufacture substitutes, the firm that developed the original
innovation may develop value added products to remain ahead of competitors. Firms
begin to establish long-term relationships with customers to generate repeat purchases. If
the incumbent firm has developed a significant market share, prices may be slightly
reduced to act as a barrier to entry for competition. New competitors must not only
manufacture and distribute the new product/service; they must spend significant R&D to
create the new products/services. If potential entrants become aware of the innovating
firm adding additional value to its new products, they may choose to enter other
industries. During this stage, firms may begin to expand via exporting to international
markets.
Maturity Stage
While the introduction phase is dominated by innovation, firms attempt to achieve
efficiencies in the maturity stage. With significantly more firms in the industry, firms
with the largest market share can obtain efficiencies through higher levels of production
or through automation. As scale becomes important, firms may engage in process R&D.
Process R&D attempts to achieve efficiencies through Total Quality Management (TQM)
initiatives. Investments in capital to achieve large-scale production are important.
Products may be viewed as more commodity based: as such, advertising, which attempts
to create perceived or real customer benefits, may be more heavily utilized. During the
maturity stage, firms may engage in mergers and acquisitions to build larger scale. As a
result of mergers and acquisitions, a small number of large-scale players may dominate
the industry. International markets are more fully developed through acquisitions,
strategic alliances, or foreign direct entry (FDI).
48
Decline Stage
During the decline stage, demand tends to be significantly reduced as
products/services become obsolete. Very little is invested in product or process R&D
because firms allocate investments toward more attractive industries. Production is
reduced as facilities are utilized to produce products/services for more attractive
industries. Customers begin to reduce purchases and buy products/services that address
new unmet needs. Investments in marketing and sales are reallocated to
products/services that generate higher returns. As price continues to decline, firms that
do not have alternative revenue streams begin to have difficulty with profitability. Some
firms may enter Chapter 11 bankruptcy or go out of business (e.g. U.S. airline industry).
Firms with positions in multiple industries may attempt to sell off their position in the
declining industry. Firms will utilize the funds to support investments in more attractive
industries. Because of a lack of demand, the profit potential within the industry declines.
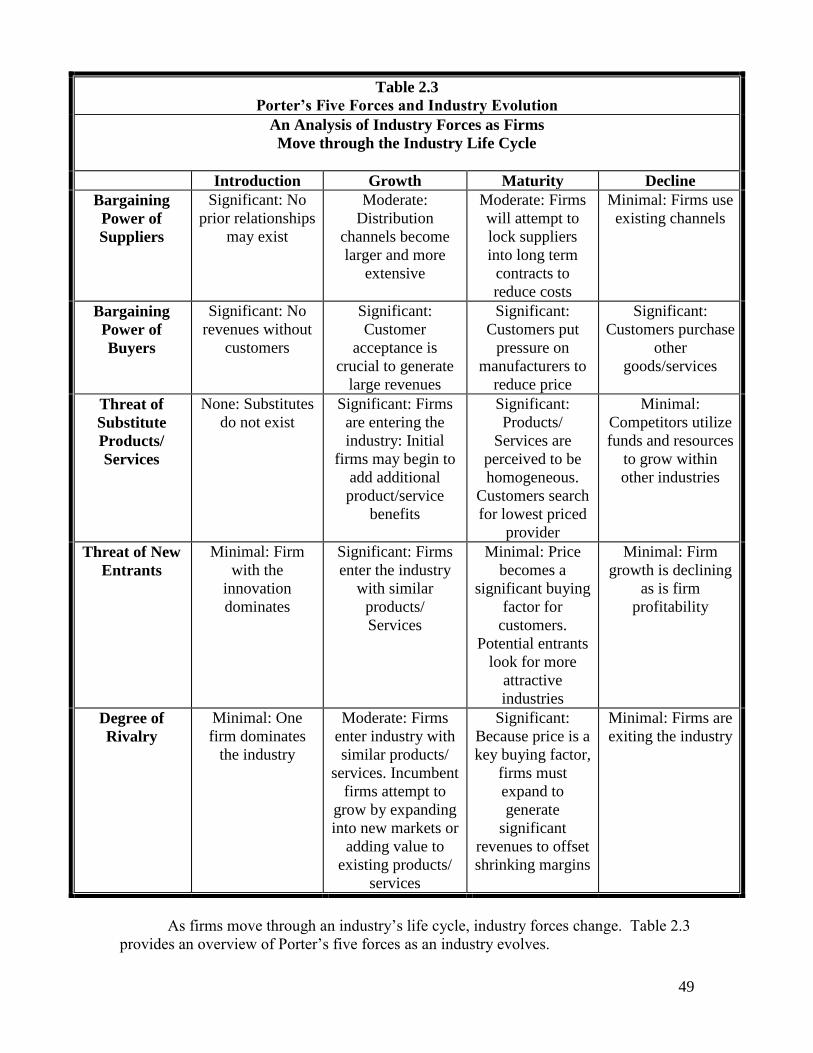
49
Table 2.3
Porter’s Five Forces and Industry Evolution
An Analysis of Industry Forces as Firms
Move through the Industry Life Cycle
Introduction Growth Maturity Decline
Bargaining
Power of
Suppliers
Significant: No
prior relationships
may exist
Moderate:
Distribution
channels become
larger and more
extensive
Moderate: Firms
will attempt to
lock suppliers
into long term
contracts to
reduce costs
Minimal: Firms use
existing channels
Bargaining
Power of
Buyers
Significant: No
revenues without
customers
Significant:
Customer
acceptance is
crucial to generate
large revenues
Significant:
Customers put
pressure on
manufacturers to
reduce price
Significant:
Customers purchase
other
goods/services
Threat of
Substitute
Products/
Services
None: Substitutes
do not exist
Significant: Firms
are entering the
industry: Initial
firms may begin to
add additional
product/service
benefits
Significant:
Products/
Services are
perceived to be
homogeneous.
Customers search
for lowest priced
provider
Minimal:
Competitors utilize
funds and resources
to grow within
other industries
Threat of New
Entrants
Minimal: Firm
with the
innovation
dominates
Significant: Firms
enter the industry
with similar
products/
Services
Minimal: Price
becomes a
significant buying
factor for
customers.
Potential entrants
look for more
attractive
industries
Minimal: Firm
growth is declining
as is firm
profitability
Degree of
Rivalry
Minimal: One
firm dominates
the industry
Moderate: Firms
enter industry with
similar products/
services. Incumbent
firms attempt to
grow by expanding
into new markets or
adding value to
existing products/
services
Significant:
Because price is a
key buying factor,
firms must
expand to
generate
significant
revenues to offset
shrinking margins
Minimal: Firms are
exiting the industry
As firms move through an industry’s life cycle, industry forces change. Table 2.3
provides an overview of Porter’s five forces as an industry evolves.
50
Industry Forces During Introduction Stage
One of the most significant industry forces during the introduction stage of the
industry cycle is the bargaining power of suppliers. Because the industry is new, these
relationships may not exist. The firm must develop ways of obtaining raw materials and
transporting them to an operating/manufacturing facility. Without suppliers, the firm has
nothing to manufacture. Once manufacturing has been completed, the firm needs to
establish distribution channels so that finished goods can reach customers. Customers are
extremely important. They generate revenue that is needed to pay variable costs and
make some contribution to fixed costs (e.g. plant and equipment). Without buyers, the
industry cannot evolve. In addition, customers provide revenue to help fund expansion.
The firm must also hire and train all employees. Advertising agencies become important
because the benefits of products/services must be communicated to potential customers.
Threat of substitutes does not exist during the introduction stage because
competitors do not exist. As such, the threat of new entrants is minimal. For a majority
of the introduction stage, potential competitors are waiting to ascertain customer
acceptance. In addition, because the industry is in its beginning, other firms may not
have the knowledge and/or resources to compete in the new industry. Firms are more
likely to continue to build positions within their existing industries rather than venturing
into a new industry that may or may not be profitable. Firms considering entry may have
difficulty utilizing their existing assets within the new industry. As a result, the degree of
rivalry is minimal.
Industry Forces During Growth Stage
The industry moves into the growth stage once competition begins to enter. As
competitors enter the industry, they may pose significant threats to the incumbent firm by
developing products/services that are close substitutes. Because customers have choices,
the threat of substitute products is significant. The incumbent firm may both expand
scale of operations and add value to existing products/services. By adding value, the
incumbent firm can attempt to create differentiation. By increasing scale of operations,
the initial firm may develop a scale advantage over new entrants.
Degree of rivalry tends to be moderate because industry demand is growing. If
demand grows in excess of supply, competition is less severe. Firms may attempt to use
excess production capacity to expand into new markets or export into international
markets.
Bargaining power of suppliers tends to become less significant as the incumbent
firm obtains greater utilization of its existing infrastructure. Distribution channels are
more fully developed and effort is expended into building long-term relationships with
suppliers.
Because buyers have choices, they play a significant role in terms of which firms
grow in the industry and which firms do not. The incumbent firm will attempt to obtain
brand loyalty by focusing upon benefits (perceived or real) via advertising or other forms
of promotion. If customers require differentiated products/services, they can exert
influence on firms to provide additional value. New firms will need to recover costs of
R&D and implementation. Therefore, they may be more rigid from a price perspective
than the incumbent firm.
51
Industry Forces During Maturity Stage
When firms begin to compete on price, rather than value added, they have entered
the maturity stage of the industry. During this stage, firms compete vigorously against
one another. Because there is a downward pressure on price, firms must achieve a much
larger scale to generate acceptable profit margins. Firms may add significant production
capacity to reduce costs. However, firms must be careful with plant expansion because
industry growth rates will tend to be lower than in the growth stage.
Degree of rivalry during this stage is significant because industry growth rates
have declined and there are a number of competitors within the industry. Firms that
invest quickly in plant expansion or TQM (Total Quality Management) may have a cost
advantage. Also, firms may either outsource elements of production or relocate to
markets where labor rates are more attractive (e.g. Mexico, Southeast Asia).
Buyers have substantial power because they desire products with value added
features in addition to lower priced products/services. In general, buyers have significant
choices with respect which firm’s products/services they purchase. Because repeat
business is crucial, customers have significant input into which firms remain profitable
within the industry.
Customer’s needs may change. If firms have developed relationships with
customers, they may be able to develop goods and services that offer differentiation from
competitors. In this case, these firms may enjoy the benefits discussed in the growth
stage.
During the maturity stage, firms will attempt to lock suppliers into long-term
contracts so the distribution infrastructure remains intact. In addition, the bargaining
power of suppliers may impact the degree to which manufacturing and assembly can be
outsourced to low cost markets. Further, automation may be necessary to remain
competitive. If the workforce is unionized, firms within the industry must have good
relationships with labor unions.
Because the threat of substitute products/services is significant, customers tend to
treat products and services as commodities. Because this threat is very significant, firms
within the industry, have no choice but to expand scale to achieve economies. It is much
more difficult to differentiate products/services in this stage of the life cycle because
firms have the capability to quickly match competitor’s offerings. In addition, because
efficiency is important, firms may not invest in product R&D to the extent that was
incurred during the introduction and growth stage of the industry. The R&D that is
employed during this stage is focused upon process R&D. In general, process R&D
attempts to create greater efficiencies.
During the maturity stage of the life cycle, new entrants are minimal. Many of
the existing firms have developed large-scale operations. This should provide a cost
advantage over new entrants. Firms that are not in the industry will look to other more
attractive industries to invest in.
Industry Forces During Decline Stage
Firms have entered the decline stage when some firms go out of business. The
level of firm expenditures is reduced significantly as firms transfer their resources to
more attractive industries. The degree of rivalry between firms is low because firms are
exiting the industry. The decision is not “how should the firm compete” but “should the
firm be in this industry?”
52
The threat of new entrants is very low because new firms do not perceive the
industry as attractive. In addition, firms that had resources to effectively compete in this
industry would have entered in one of the earlier stages.
Bargaining power of buyers is significant because they will need incentives to
remain brand loyal. Since products are viewed as commodities, the firms’ only option is
to further reduce price. This action may lead to very low or negative profit margins
because prices have already been significantly reduced during the maturity stage.
Bargaining power of suppliers is low because the firm has no financial incentive
to further develop the industry. Firms utilize their existing infrastructure with minimal, if
any, modifications. Bargaining power of suppliers is further reduced because firms are
exiting the industry. Firms may reduce the number of suppliers in an attempt to reduce
costs.
Because product R&D and process R&D are minimal, if they exist at all, threat of
substitute products is low. The firms’ resources have been shifted to other industries that
have more attractive profit potential.
The Upside of Declining Industries
In general, most firms will not, and should not, compete in industries that are in
the decline stage. However, a specific industry may be at a different stage of industry
evolution in international markets. For example, the Smartphone industry is at an earlier
stage in developing countries than it is in the United States and Japan. As such, Apple
may be able to sell existing products (iPhone) in developing markets. Because
GDP/capita is lower than in fully industrialized countries, manufacturing facilities may
need to be constructed in these markets to reduce costs.
Another possibility exists within declining markets: that technological change
will occur. For years, the airline industry has suffered from the classical traits of a
declining industry. Some firms are, or have been, in Chapter 11 bankruptcy protection,
and many other large airlines are close to entering bankruptcy. Some airlines have gone
out of business (Pan Am, Eastern, Western). With the exception of Southwest and
JetBlue, most airlines have not been profitable for many years. This industry may be in
for a shock.
Richard Branson and Paul Allen have developed an aircraft that can reach an
altitude of 62 miles above the earth. Customers are initially willing to pay $200,000 per
seat. The current plans call for commercialization in 2012. By taking advantage of the
curvature of the earth and no atmosphere, transit times to Asia and Europe could be
dramatically reduced. While this technology may not be commercially feasible at this
point, it could revolutionize air transportation in the future. If successful, the airline
industry may move from a mature stage industry to an introduction or growth stage
industry.

53
Discussion Questions
1. Explain how industries are classified within the United States.
2. Identify Porter’s 5 forces. What is the primary purpose of these forces?
3. Identify the stages of industry evolution.
4. Why is it important to understand what stage an industry is in?
5. How do firms compete within the different industry life cycle stages?
6. Explain how industry analysis and industry evolution impact firm level strategy.
7. Which force of industry analysis is most important for the Capstone Simulation
industry?
8. Why will innovation be crucial as we move further into the 21st century?
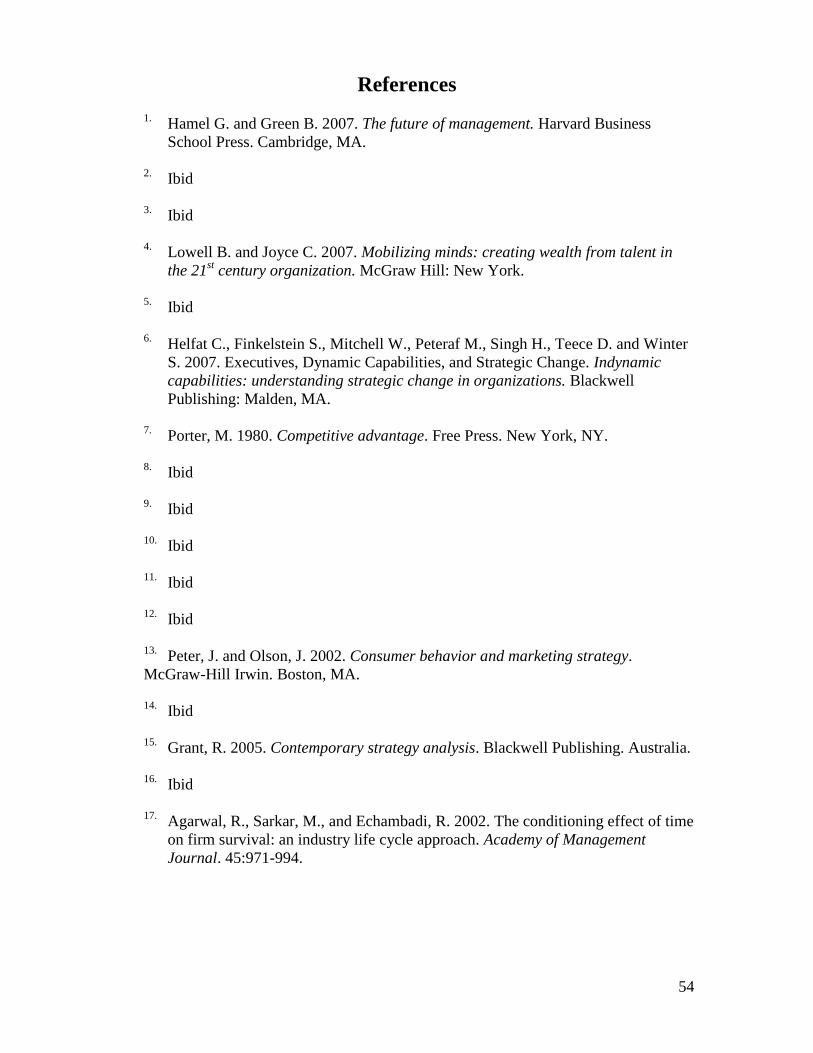
54
References
1. Hamel G. and Green B. 2007. The future of management. Harvard Business
School Press. Cambridge, MA.
2. Ibid
3. Ibid
4. Lowell B. and Joyce C. 2007. Mobilizing minds: creating wealth from talent in
the 21st century organization. McGraw Hill: New York.
5. Ibid
6. Helfat C., Finkelstein S., Mitchell W., Peteraf M., Singh H., Teece D. and Winter
S. 2007. Executives, Dynamic Capabilities, and Strategic Change. Indynamic
capabilities: understanding strategic change in organizations. Blackwell
Publishing: Malden, MA.
7. Porter, M. 1980. Competitive advantage. Free Press. New York, NY.
8. Ibid
9. Ibid
10. Ibid
11. Ibid
12. Ibid
13. Peter, J. and Olson, J. 2002. Consumer behavior and marketing strategy.
McGraw-Hill Irwin. Boston, MA.
14. Ibid
15. Grant, R. 2005. Contemporary strategy analysis. Blackwell Publishing. Australia.
16. Ibid
17. Agarwal, R., Sarkar, M., and Echambadi, R. 2002. The conditioning effect of time
on firm survival: an industry life cycle approach. Academy of Management
Journal. 45:971-994.
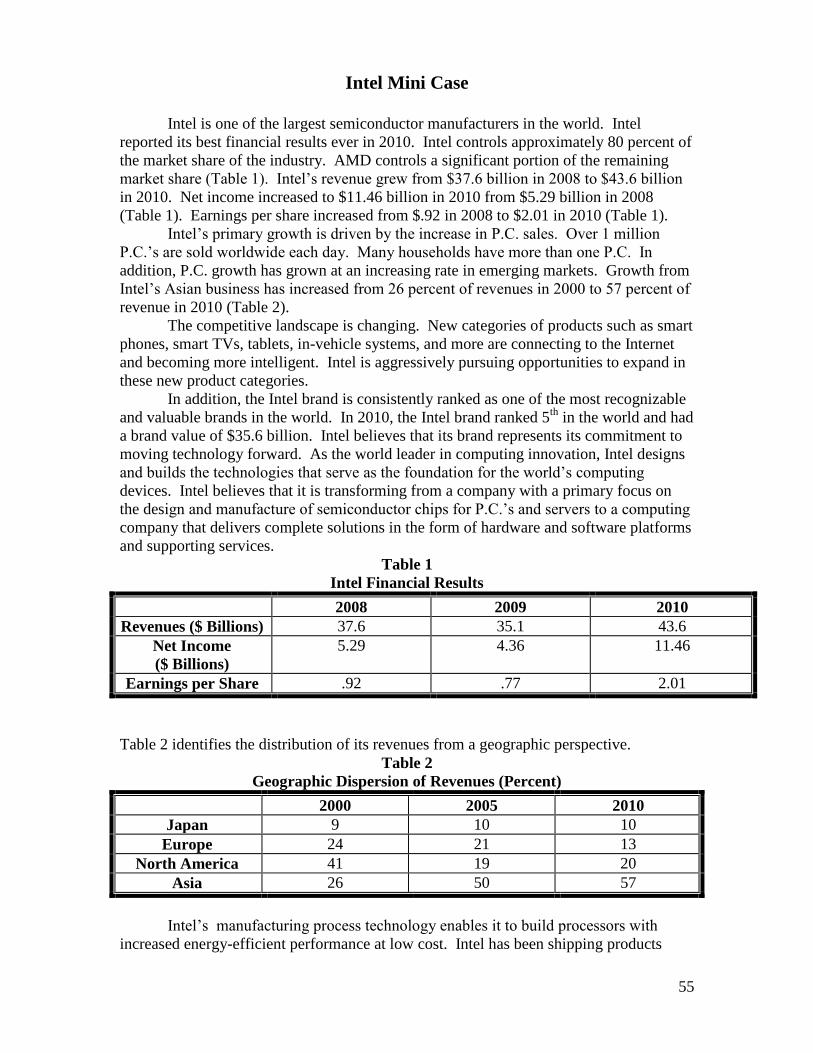
55
Intel Mini Case
Intel is one of the largest semiconductor manufacturers in the world. Intel
reported its best financial results ever in 2010. Intel controls approximately 80 percent of
the market share of the industry. AMD controls a significant portion of the remaining
market share (Table 1). Intel’s revenue grew from $37.6 billion in 2008 to $43.6 billion
in 2010. Net income increased to $11.46 billion in 2010 from $5.29 billion in 2008
(Table 1). Earnings per share increased from $.92 in 2008 to $2.01 in 2010 (Table 1).
Intel’s primary growth is driven by the increase in P.C. sales. Over 1 million
P.C.’s are sold worldwide each day. Many households have more than one P.C. In
addition, P.C. growth has grown at an increasing rate in emerging markets. Growth from
Intel’s Asian business has increased from 26 percent of revenues in 2000 to 57 percent of
revenue in 2010 (Table 2).
The competitive landscape is changing. New categories of products such as smart
phones, smart TVs, tablets, in-vehicle systems, and more are connecting to the Internet
and becoming more intelligent. Intel is aggressively pursuing opportunities to expand in
these new product categories.
In addition, the Intel brand is consistently ranked as one of the most recognizable
and valuable brands in the world. In 2010, the Intel brand ranked 5th
in the world and had
a brand value of $35.6 billion. Intel believes that its brand represents its commitment to
moving technology forward. As the world leader in computing innovation, Intel designs
and builds the technologies that serve as the foundation for the world’s computing
devices. Intel believes that it is transforming from a company with a primary focus on
the design and manufacture of semiconductor chips for P.C.’s and servers to a computing
company that delivers complete solutions in the form of hardware and software platforms
and supporting services.
Table 1
Intel Financial Results
2008 2009 2010
Revenues ($ Billions) 37.6 35.1 43.6
Net Income
($ Billions)
5.29 4.36 11.46
Earnings per Share .92 .77 2.01
Table 2 identifies the distribution of its revenues from a geographic perspective.
Table 2
Geographic Dispersion of Revenues (Percent)
2000 2005 2010
Japan 9 10 10
Europe 24 21 13
North America 41 19 20
Asia 26 50 57
Intel’s manufacturing process technology enables it to build processors with
increased energy-efficient performance at low cost. Intel has been shipping products
56
built using 32 nanometer (nm) process technology since 2009. By the end of 2010,
Intel’s competition had not shipped any.
PC shipments grew by double-digit percentages in 2010, but computing is no
longer confined to computers. Thousands of other devices powered by Intel technology –
cars, cell phones, homes, hospitals, offices, and factories – are other examples. These
additional uses may increase Intel’s revenue significantly.
Intel believes it has the financial position to grow into these additional businesses.
Discussion Question:
1. How well is Intel positioned for future growth?
57
Harvard Business Cases for Chapter 2
The Canadian Telecommunications Industry and Regulation
Product Number W11013
The Global oil and Gas Industry: 2010
Product Number TB0223
Professor Case for Chapter 2
Global Steel

58
59
Chapter 3
Utilizing Internal Analysis to Build Competitive
Advantage Over Rivals

60
Learning and Assessment Goals
1. Understand what value chain activities should not be outsourced.
2. Understand how firms can utilize value analysis to obtain competitive advantage.
3. Understand how firms can utilize value analysis to maintain competitive
advantage.
4. Understand the key role that technology plays in positioning firms for advantage.
5. Understand how value chain analysis can be used in the Capstone Simulation.
61
As discussed in Chapter 1, understanding a firm’s external environment is critical
if the firm is to capitalize upon opportunities or neutralize threats. However, the firm
must also conduct an internal analysis to build strengths to exploit competitors’
weaknesses. This building of strengths is based upon how a firm develops its resources
to achieve positions that are superior to rivals.
The Resource-Based View Edith Penrose originally developed this perspective in her seminal book, A Theory
of the Growth of the Firm. To Penrose, resources represented “unused productive
services1.” Resources are stocks of assets that are controlled by the firm
2. These assets
can be either tangible or intangible. Examples of tangible assets would be plant,
equipment, trucks, airplanes, and cars. Intangible resources cannot be seen, felt, or
otherwise observed. They are deeply rooted in a firm’s history. Intangible assets would
include brand name, reputation, company culture, and intellectual capital. Intellectual
capital represents the collective knowledge of the management team. This resource is
extremely important to firm growth and competitive advantage. As such, Chapter 11 is
totally devoted to this issue.
For resources to be productive, they must be utilized. Capabilities represent the
processes by which resources are utilized3. These processes are very important because
they can help a firm differentiate itself from rivals. Examples of capabilities would be
the ability to transform technology into new products, the development of low cost
logistic networks, effective promotion of products, and miniaturization of components
and products.
Core competencies are combinations of resources that are linked by capabilities
that serve as a source of competitive advantage over rivals. Coke’s global branding,
Intel’s chip technology, and Gillette’s technology in men and women’s razors are
examples of core competencies.
It is not the resources or capabilities that provide competitive advantage; it is how
the firm uses these resources and capabilities to generate core competencies4. Core
competencies emerge over time as firms continually add value to their stock of resources
and develop innovative ways of using their resources. Dell Direct is a core competence.
This capability allows Dell to charge lower prices because the intermediary network of
wholesalers and retailers is eliminated. Caterpillar’s dealer network represents a core
competence because it allows for worldwide distribution.
Criteria for Competitive Advantage
For capabilities to be judged as core competencies, they must meet four criteria.
They must be (1) valuable (2) rare (3) costly to imitate and (4) nonsubstitutable5.
Valuable capabilities allow the firm to exploit opportunities or neutralize threats
in its external environment. By effectively using capabilities to exploit opportunities, a
firm creates value for customers. The continuous technological evolution of Intel chips
and Microsoft’s operating systems are capabilities that customers view as valuable. Lean
manufacturing and Just In Time (JIT) inventory are examples of capabilities that have
fueled growth for automakers and manufacturing firms.
Rare capabilities are capabilities that few, if any, competitors possess. A key
question to be answered when evaluating this criterion is, “How many rival firms possess
these capabilities?” Rare capabilities would include the development of new drugs by
pharmaceutical firms. These drugs have 17 years of patent protection in the United
62
States. The managerial capability to accurately forecast conditions in any emerging
industry (e.g. nanotechnology) would be another example of a rare capability.
Costly to imitate capabilities are capabilities that other firms cannot easily
develop. For example, the ground/air hub and spoke-operating network that has been
developed by Fed Ex and UPS over several decades, is very costly for competitors to
imitate. The distribution network that Wal-Mart has developed is costly for competitors
to imitate. Highly competent management teams are developed over time. As such, they
also represent a capability that is costly to imitate.
Non-substitutable capabilities are capabilities that do not have strategic
equivalents. Trust between strategic alliance partners or manages industry knowledge are
capabilities that do not have strategic equivalents by competitors. Brand loyalty is
another capability that is non-substitutable.
As firms develop more of these capabilities, they increase the probability of
generating competitive advantage6. Disney’s theme parks are an example that may meet
all of the above criteria. The theme parks are valuable because they are important to
children and parents who have children. Mickey Mouse, Donald Duck, and the Magic
Kingdom are part of the Disney culture. The Disney culture is rare because it is unique.
Although competitors have attempted to duplicate, (e.g. Six Flags), the Disney
experience has been built over decades. As such, it is very costly to imitate. The
construction of Disneyland, Disney World, Epcot, and the other specialized parks provide
for an experience that competitors have difficulty developing substitutes for. To help
identify how internal firm activities can be transformed into core competencies, value
chain analysis is conducted.
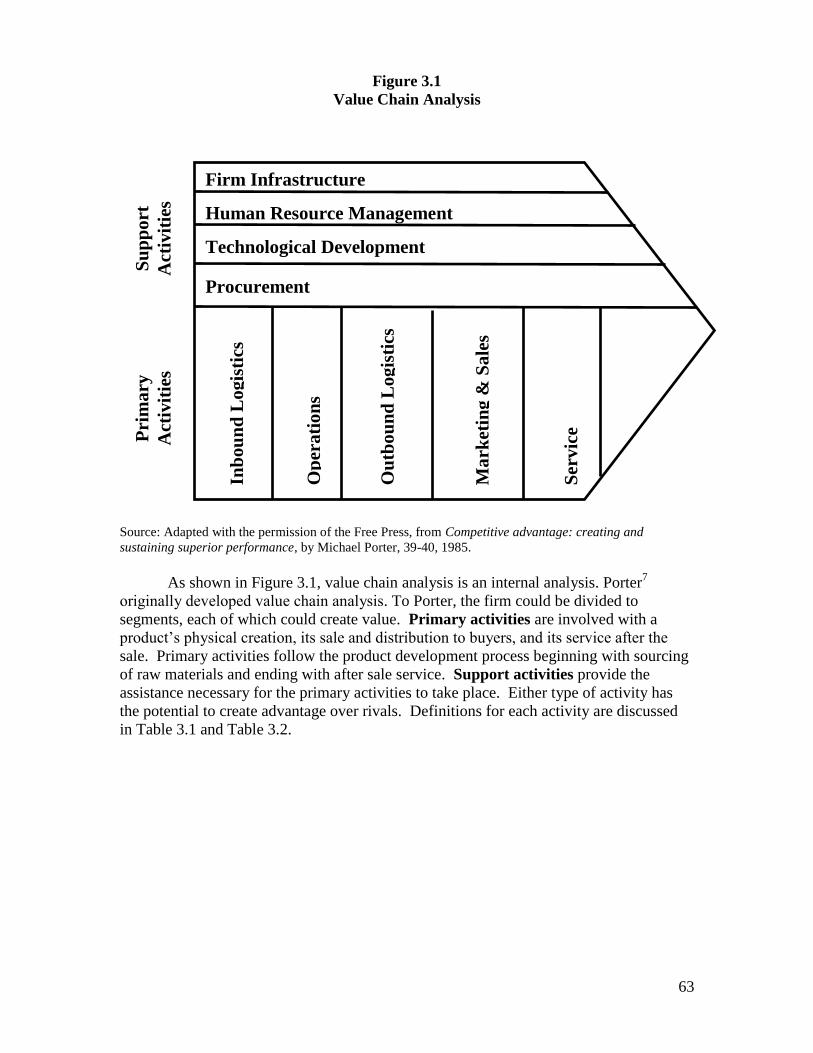
63
Figure 3.1
Value Chain Analysis
Source: Adapted with the permission of the Free Press, from Competitive advantage: creating and
sustaining superior performance, by Michael Porter, 39-40, 1985.
As shown in Figure 3.1, value chain analysis is an internal analysis. Porter7
originally developed value chain analysis. To Porter, the firm could be divided to
segments, each of which could create value. Primary activities are involved with a
product’s physical creation, its sale and distribution to buyers, and its service after the
sale. Primary activities follow the product development process beginning with sourcing
of raw materials and ending with after sale service. Support activities provide the
assistance necessary for the primary activities to take place. Either type of activity has
the potential to create advantage over rivals. Definitions for each activity are discussed
in Table 3.1 and Table 3.2.
Firm Infrastructure
Human Resource Management
Technological Development
Procurement
Inb
ou
nd
Logis
tics
Op
erati
on
s
Ou
tbo
un
d L
ogis
tics
Ma
rket
ing
& S
ale
s
Ser
vic
e Pri
ma
ry
Act
ivit
ies
Su
pp
ort
Act
ivit
ies
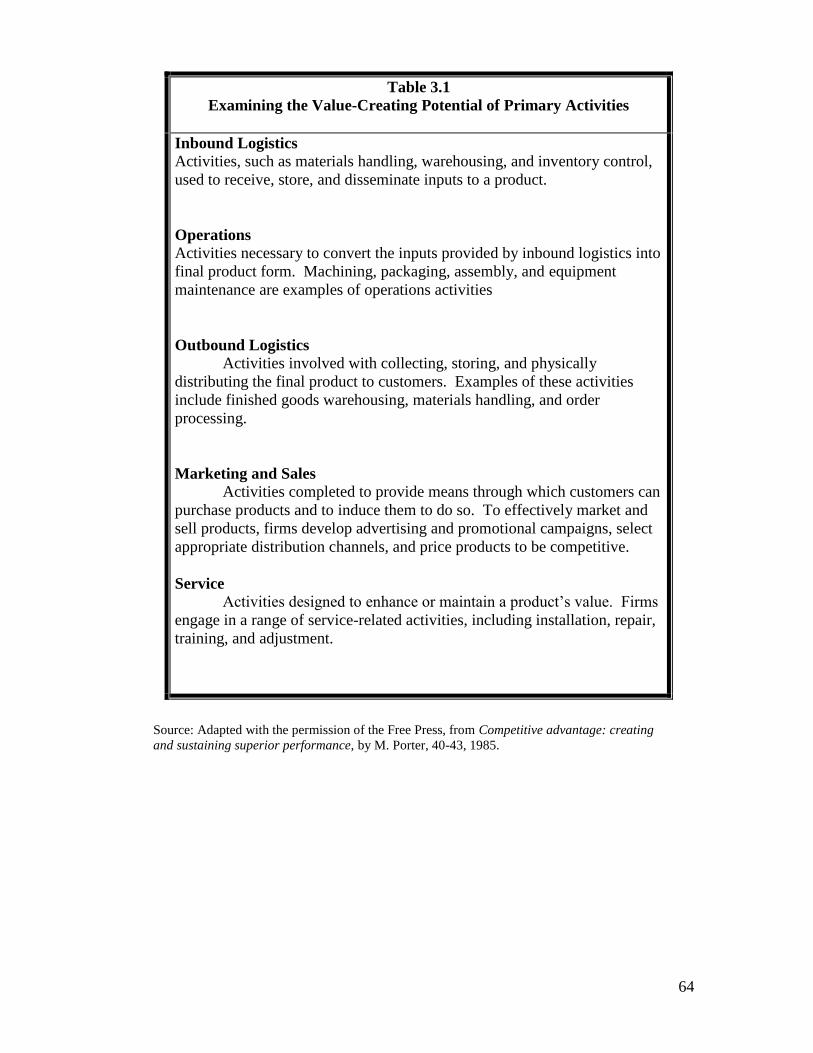
64
Table 3.1
Examining the Value-Creating Potential of Primary Activities
Inbound Logistics
Activities, such as materials handling, warehousing, and inventory control,
used to receive, store, and disseminate inputs to a product.
Operations
Activities necessary to convert the inputs provided by inbound logistics into
final product form. Machining, packaging, assembly, and equipment
maintenance are examples of operations activities
Outbound Logistics
Activities involved with collecting, storing, and physically
distributing the final product to customers. Examples of these activities
include finished goods warehousing, materials handling, and order
processing.
Marketing and Sales
Activities completed to provide means through which customers can
purchase products and to induce them to do so. To effectively market and
sell products, firms develop advertising and promotional campaigns, select
appropriate distribution channels, and price products to be competitive.
Service
Activities designed to enhance or maintain a product’s value. Firms
engage in a range of service-related activities, including installation, repair,
training, and adjustment.
Source: Adapted with the permission of the Free Press, from Competitive advantage: creating
and sustaining superior performance, by M. Porter, 40-43, 1985.
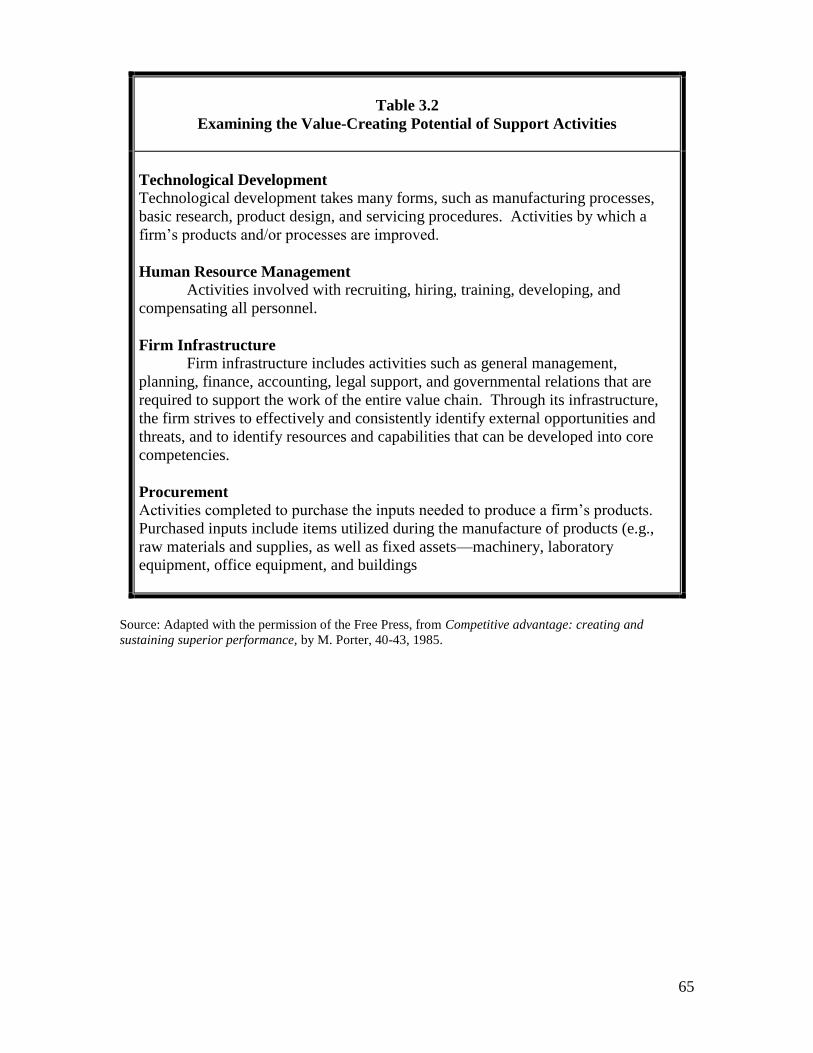
65
Table 3.2
Examining the Value-Creating Potential of Support Activities
Technological Development
Technological development takes many forms, such as manufacturing processes,
basic research, product design, and servicing procedures. Activities by which a
firm’s products and/or processes are improved.
Human Resource Management
Activities involved with recruiting, hiring, training, developing, and
compensating all personnel.
Firm Infrastructure
Firm infrastructure includes activities such as general management,
planning, finance, accounting, legal support, and governmental relations that are
required to support the work of the entire value chain. Through its infrastructure,
the firm strives to effectively and consistently identify external opportunities and
threats, and to identify resources and capabilities that can be developed into core
competencies.
Procurement
Activities completed to purchase the inputs needed to produce a firm’s products.
Purchased inputs include items utilized during the manufacture of products (e.g.,
raw materials and supplies, as well as fixed assets—machinery, laboratory
equipment, office equipment, and buildings
Source: Adapted with the permission of the Free Press, from Competitive advantage: creating and
sustaining superior performance, by M. Porter, 40-43, 1985.
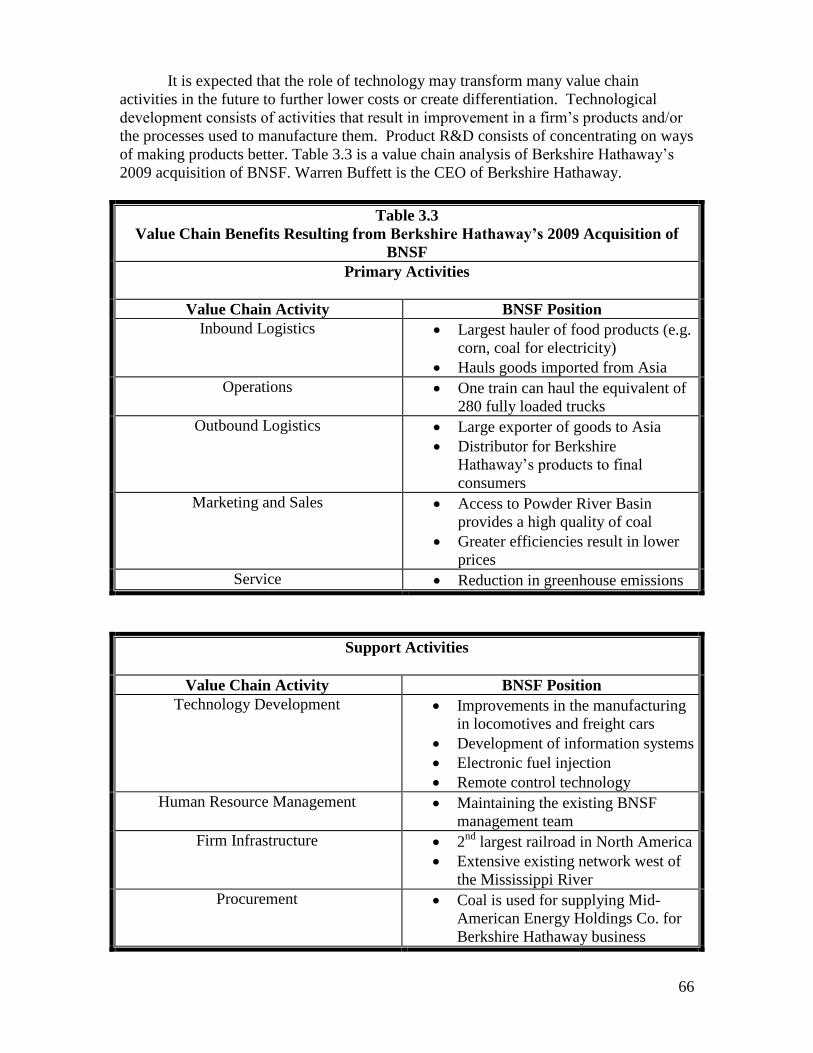
66
It is expected that the role of technology may transform many value chain
activities in the future to further lower costs or create differentiation. Technological
development consists of activities that result in improvement in a firm’s products and/or
the processes used to manufacture them. Product R&D consists of concentrating on ways
of making products better. Table 3.3 is a value chain analysis of Berkshire Hathaway’s
2009 acquisition of BNSF. Warren Buffett is the CEO of Berkshire Hathaway.
Table 3.3
Value Chain Benefits Resulting from Berkshire Hathaway’s 2009 Acquisition of
BNSF
Primary Activities
Value Chain Activity BNSF Position
Inbound Logistics Largest hauler of food products (e.g.
corn, coal for electricity)
Hauls goods imported from Asia
Operations One train can haul the equivalent of
280 fully loaded trucks
Outbound Logistics Large exporter of goods to Asia
Distributor for Berkshire
Hathaway’s products to final
consumers
Marketing and Sales Access to Powder River Basin
provides a high quality of coal
Greater efficiencies result in lower
prices
Service Reduction in greenhouse emissions
Support Activities
Value Chain Activity BNSF Position
Technology Development Improvements in the manufacturing
in locomotives and freight cars
Development of information systems
Electronic fuel injection
Remote control technology
Human Resource Management Maintaining the existing BNSF
management team
Firm Infrastructure 2nd
largest railroad in North America
Extensive existing network west of
the Mississippi River
Procurement Coal is used for supplying Mid-
American Energy Holdings Co. for
Berkshire Hathaway business
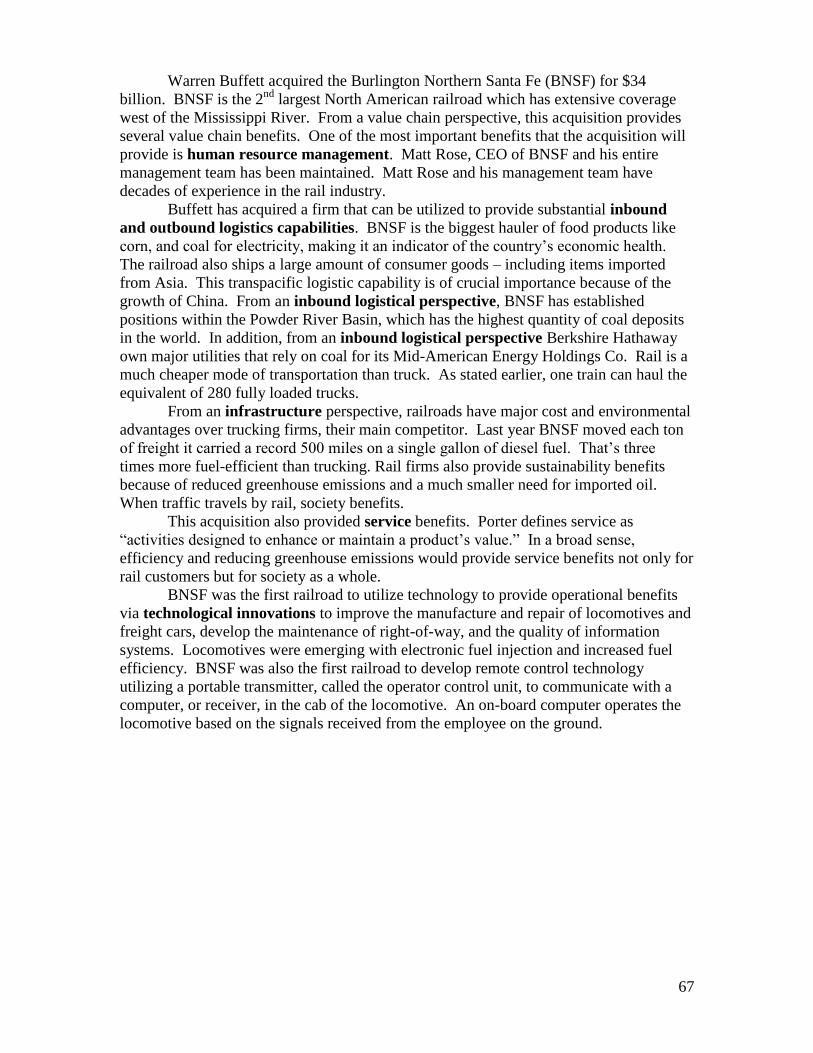
67
Warren Buffett acquired the Burlington Northern Santa Fe (BNSF) for $34
billion. BNSF is the 2nd
largest North American railroad which has extensive coverage
west of the Mississippi River. From a value chain perspective, this acquisition provides
several value chain benefits. One of the most important benefits that the acquisition will
provide is human resource management. Matt Rose, CEO of BNSF and his entire
management team has been maintained. Matt Rose and his management team have
decades of experience in the rail industry.
Buffett has acquired a firm that can be utilized to provide substantial inbound
and outbound logistics capabilities. BNSF is the biggest hauler of food products like
corn, and coal for electricity, making it an indicator of the country’s economic health.
The railroad also ships a large amount of consumer goods – including items imported
from Asia. This transpacific logistic capability is of crucial importance because of the
growth of China. From an inbound logistical perspective, BNSF has established
positions within the Powder River Basin, which has the highest quantity of coal deposits
in the world. In addition, from an inbound logistical perspective Berkshire Hathaway
own major utilities that rely on coal for its Mid-American Energy Holdings Co. Rail is a
much cheaper mode of transportation than truck. As stated earlier, one train can haul the
equivalent of 280 fully loaded trucks.
From an infrastructure perspective, railroads have major cost and environmental
advantages over trucking firms, their main competitor. Last year BNSF moved each ton
of freight it carried a record 500 miles on a single gallon of diesel fuel. That’s three
times more fuel-efficient than trucking. Rail firms also provide sustainability benefits
because of reduced greenhouse emissions and a much smaller need for imported oil.
When traffic travels by rail, society benefits.
This acquisition also provided service benefits. Porter defines service as
“activities designed to enhance or maintain a product’s value.” In a broad sense,
efficiency and reducing greenhouse emissions would provide service benefits not only for
rail customers but for society as a whole.
BNSF was the first railroad to utilize technology to provide operational benefits
via technological innovations to improve the manufacture and repair of locomotives and
freight cars, develop the maintenance of right-of-way, and the quality of information
systems. Locomotives were emerging with electronic fuel injection and increased fuel
efficiency. BNSF was also the first railroad to develop remote control technology
utilizing a portable transmitter, called the operator control unit, to communicate with a
computer, or receiver, in the cab of the locomotive. An on-board computer operates the
locomotive based on the signals received from the employee on the ground.
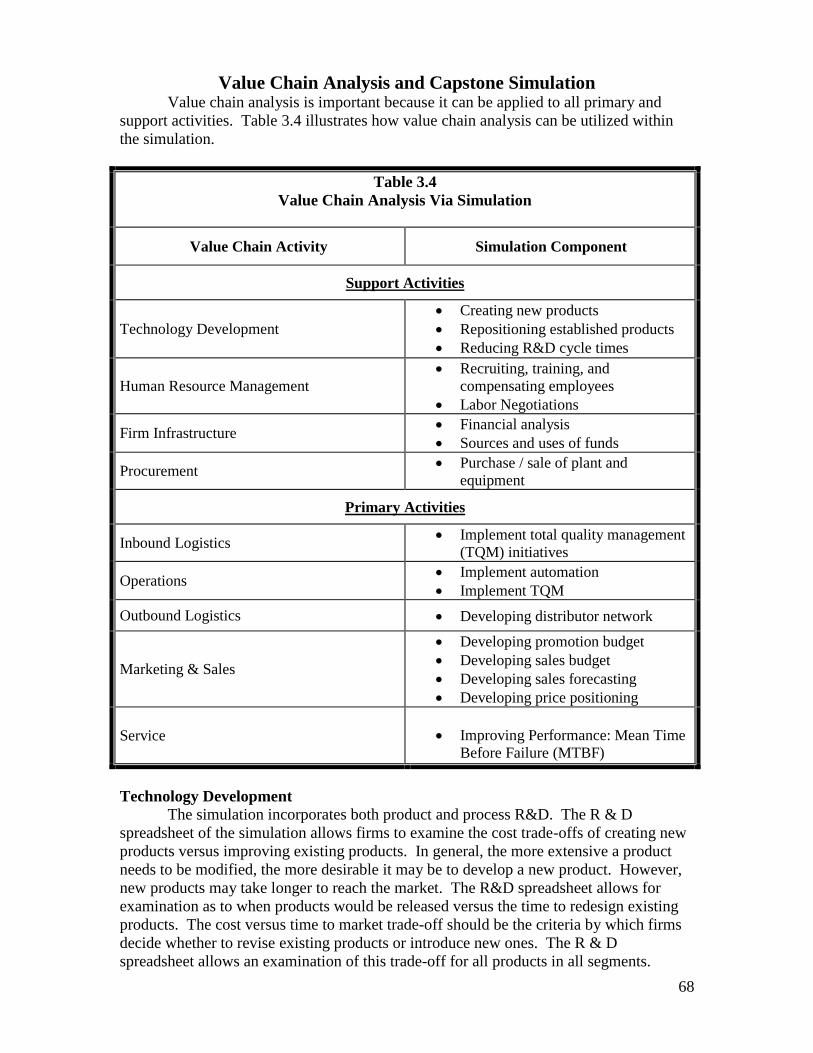
68
Value Chain Analysis and Capstone Simulation Value chain analysis is important because it can be applied to all primary and
support activities. Table 3.4 illustrates how value chain analysis can be utilized within
the simulation.
Table 3.4
Value Chain Analysis Via Simulation
Value Chain Activity Simulation Component
Support Activities
Technology Development
Creating new products
Repositioning established products
Reducing R&D cycle times
Human Resource Management
Recruiting, training, and
compensating employees
Labor Negotiations
Firm Infrastructure Financial analysis
Sources and uses of funds
Procurement Purchase / sale of plant and
equipment
Primary Activities
Inbound Logistics Implement total quality management
(TQM) initiatives
Operations Implement automation
Implement TQM
Outbound Logistics Developing distributor network
Marketing & Sales
Developing promotion budget
Developing sales budget
Developing sales forecasting
Developing price positioning
Service
Improving Performance: Mean Time
Before Failure (MTBF)
Technology Development
The simulation incorporates both product and process R&D. The R & D
spreadsheet of the simulation allows firms to examine the cost trade-offs of creating new
products versus improving existing products. In general, the more extensive a product
needs to be modified, the more desirable it may be to develop a new product. However,
new products may take longer to reach the market. The R&D spreadsheet allows for
examination as to when products would be released versus the time to redesign existing
products. The cost versus time to market trade-off should be the criteria by which firms
decide whether to revise existing products or introduce new ones. The R & D
spreadsheet allows an examination of this trade-off for all products in all segments.
69
Some of the Total Quality Management (TQM) initiatives result in a reduction in
R&D cycle time. TQM is an optional module of the Capstone Simulation.
Human Resource Management
As discussed by Porter, human resource management is activities involved with
recruiting, training, developing and compensating personnel9. The simulation addresses
human resource management as a separate module of the production spreadsheet.
The human resource module of the simulation allows for recruiting, training, and
compensating employees. Human resources that are better trained will result in more
effective decision-making. This is because human resources “learn by doing10
.” As
human resources “learn by doing,” they become better and/or more efficient with the
performances of their duties. As employees become better at performing their
responsibilities, they develop the capability to teach others. Part of Chapter 11, Strategic
Leadership Decision Making, is devoted to this topic.
Human resource management also encompasses labor relations and negotiations.
Labor negotiations are a separate module of the simulation.
Firm Infrastructure
To Porter, firm infrastructure includes activities such as general management,
planning, finance, accounting, legal support, and governmental relations that are required
to support the work of the entire value chain11
. Through its infrastructure, the firm strives
to effectively and consistently identify external opportunities and threats, and develop
resources and capabilities to capitalize on these opportunities and neutralize threats. A
firm’s ability to capitalize on opportunities and minimize threats is dependent upon the
firm having the financial resources to fund growth. An understanding of a firm’s growth
options is achieved by analyzing a firm’s income statement, balance sheet, and statement
of cash flows. A complete analysis of financial statements will be addressed in Chapter
12, Wealth Creation.
Investments in plant and equipment and sale of plant and equipment are addressed
as part of the finance spreadsheet of the simulation. Thus, the finance spreadsheet allows
for different capital budgeting alternatives to be evaluated. Capital budgeting is the
analyzing and ranking of possible investments in fixed assets such as land, buildings, and
equipment in terms of the additional outlays that will result from each investment. Firms
prepare capital budgets and rank them on the basis of some accepted criteria or hurdle
rate (for example, years to pay back investment, rate of return, or time to break-even
point) for the purpose of strategic decision making12
. The finance spreadsheet allows for
different types of vehicles to finance investments. Firms may issue common stock and/or
acquire long or short term debt financing to fund expansion activities.
Procurement
To Porter, procurement consists of activities completed to purchase the inputs
needed to produce a firm’s products13
. Purchased inputs include items fully consumed
during the manufacture of products (e.g. raw materials and supplies), as well as the
purchase of fixed assets—machinery, laboratory equipment, office equipment, and
buildings. The purchasing and selling of plant and equipment is performed within the
production spreadsheet of the simulation. Purchasing plant and equipment is important
for generating economies of scale. Economies of scale are efficiency gains that result
from larger firm size.
70
Inbound and Outbound Logistics
To Porter, logistics involves both the transportation of raw materials to
manufacturing facilities and the transportation of finished goods to final consumers14
.
The logistics component of Porter’s value chain is addressed within the Total Quality
Management (TQM) initiatives of the simulation. Inbound logistics is addressed by the
Just-In-Time (JIT) initiative. JIT is an integrated set of activities designed to achieve
high volume production using minimal inventories of raw materials, work-in-process, and
finished goods. JIT helps to reduce material costs by having only the needed materials
available for manufacturing processes.
CCE (Concurrent Engineering) and CPI (Continuous Process Improvement)
represent two of the TQM initiatives the simulation uses to reduce material costs. CCE
could be utilized to ascertain which vendors are either more efficient or better qualified to
source raw materials. CPI can be utilized to ascertain whether a firm should continue to
outsource its inbound transportation network versus the firm developing its own
transportation network for obtaining raw materials.
Outbound logistics is a critical element of a firm’s distribution network15
.
Distribution is addressed within the advanced marketing module of the simulation. This
module allows for increasing or decreasing the number of distributors. Increasing the
number of distributors improves infrastructure. An advanced distribution system allows
products to reach final consumers earlier and to increase the service area offered by the
firm.
Operations
To Porter, operations are activities needed to convert the inputs provided by
inbound logistics into final product form16
. The objective is to create an efficient
operations system. The operations aspect of Porter’s value chain is addressed in the
production spreadsheet. The simulation allows for production to be scheduled by product
line. For some lines, efficiency is important. These product lines normally are for
products that are more price sensitive than others. For price sensitive products,
production can be set at high levels of automation to increase efficiency. However, as
automation is implemented, production processes tend to become more rigid. As they
become more rigid, firms are less able to respond to changing customer needs.
Several of the Total Quality Management (TQM) initiatives allow for the creation
of efficiency. The key is to obtain lower costs than competitors. Production efficiencies
lower variable costs that allow firms to reduce price and still maintain profit margins on
these products.
Marketing and Sales
To Porter marketing and sales are activities to induce consumers to purchase the
firm’s products/services17
. The ability to forecast sales is a critical aspect of marketing
and sales. Correct sales forecasts (Chapter 5: Analysis of Markets and Positioning) are
crucial because they allow senior management to allocate resources to meet demand and
minimize inventory-carrying costs.
To effectively market and sell products, firms develop advertising and
promotional campaigns, select appropriate distribution channels, and change the
composition of their sales force. Within the simulation, advertising and promotion are
addressed as an advanced marketing module that is linked to the marketing spreadsheet.
The optional marketing module allows for the selection of different types of promotion
(print media, direct mail, web media, email, and trade show) that is applied to different
71
types of products. The objective is to increase customer awareness. This module also
allows for the allocation of outside and inside sales employees to specific product lines.
Firms that have new products may want to increase the number of outside sales
employees to build customer awareness. Increasing the number of inside sales
employees tends to assist in establishing longer-term relationships with existing
customers. Maintaining these relationships is important because the firm can identify
changing consumer preferences more quickly than competitors who have not invested in
these relationships.
The marketing spreadsheet allows for price changes on a product-by-product
basis. For products that are price sensitive, price needs to be set at levels that are
acceptable to customers but which permit the firm to make a profit. As discussed above,
for price sensitive products, automation needs to be considered because automation
improves efficiency and reduces per unit variable costs.
Service
To Porter, service consists of activities designed to enhance or maintain a
product’s value18
. Many automotive and tire manufacturers provide warranties which
guarantee certain levels of service performance. Service is critical because it has a direct
impact upon a firm’s reputation. Bridgestone / Firestone is an example of reputation
having a significant negative impact upon firm sales and profitability. Light bulbs that
last two years or more are an example of a positive service attribute. Some firms attempt
to differentiate from a service perspective (e.g. Maytag, Otis Elevator).
Service is addressed in the R & D spreadsheet. The simulation views service as
Mean Time Before Failure (MTBF). MTBF measures how long a product is expected to
last before it fails. As more funds are allocated to MTBF, the life of the product
increases. The R & D spreadsheet permits MTBF to be adjusted on a product-by-product
basis. Costs for changing MTBF are calculated on the R & D spreadsheet. As MTBF is
increased, the product will last longer. This aspect of durability is a critical factor for
products in the performance segment of the simulation.
As discussed above, the simulation addresses all aspects of Porter’s value chain.
The key to value chain analysis is to create value and/or efficiencies from each activity in
the chain. The creation of value may generate differentiation from competitors. The
creation of efficiencies allows firms to compete favorably in price sensitive segments. In
this way, firms can generate advantage by performing value chain activities superior to
competitors.
Global Outsourcing At times it may not be advisable to perform all primary and support value chain
activities within the firm. In some cases, outsourcing may be a viable alternative.
Outsourcing is based upon the principle that a third party may be better at a specific value
chain activity than the firm. For example, most of the major rail (e.g. CSX) and airfreight
(e.g. Fed Ex) firms have extensive logistics services that provide distribution to
customers worldwide. Firms such as Komatsu outsource sub assembly manufacturing to
Southeast Asian markets due to the difference in labor rates and insurance coverage
between Japan and these markets. The key to outsourcing is to select only value chain
activities that are not core competencies of the firm. Outsourcing activities that are not
core competencies may allow the firm to fully concentrate on those activities that are core
competencies. Outsourcing core competencies could provide competition with the
knowledge to build similar competencies.
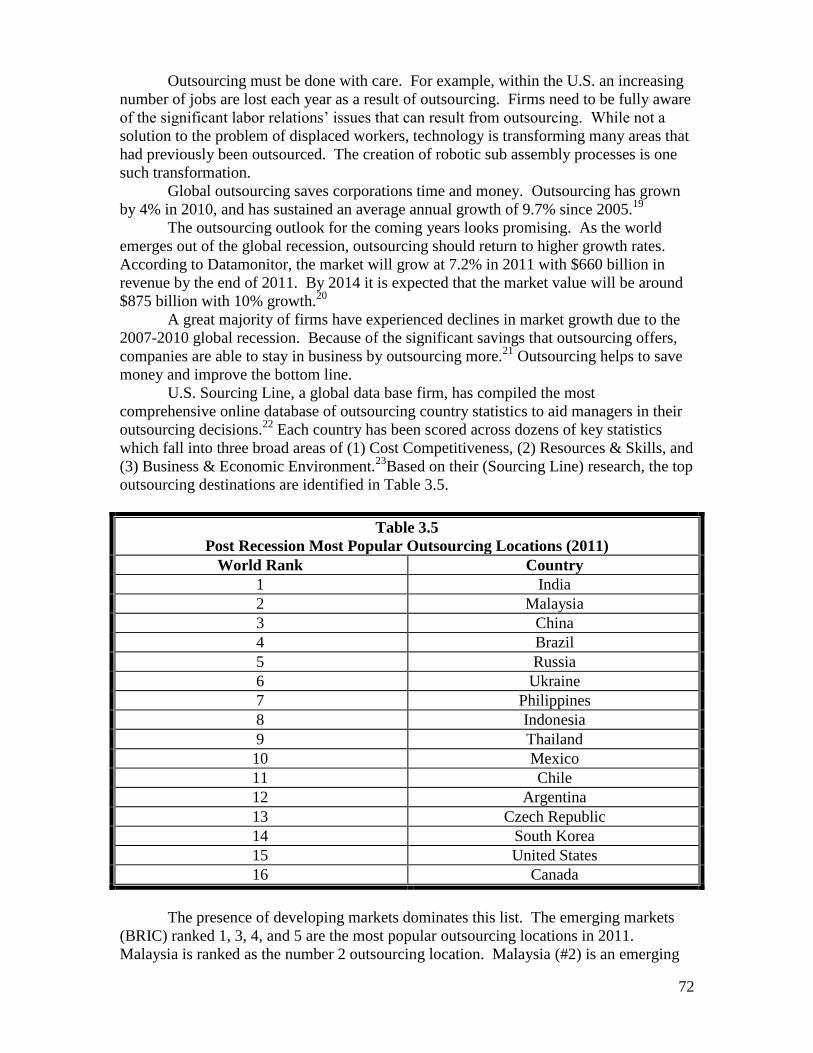
72
Outsourcing must be done with care. For example, within the U.S. an increasing
number of jobs are lost each year as a result of outsourcing. Firms need to be fully aware
of the significant labor relations’ issues that can result from outsourcing. While not a
solution to the problem of displaced workers, technology is transforming many areas that
had previously been outsourced. The creation of robotic sub assembly processes is one
such transformation.
Global outsourcing saves corporations time and money. Outsourcing has grown
by 4% in 2010, and has sustained an average annual growth of 9.7% since 2005.19
The outsourcing outlook for the coming years looks promising. As the world
emerges out of the global recession, outsourcing should return to higher growth rates.
According to Datamonitor, the market will grow at 7.2% in 2011 with $660 billion in
revenue by the end of 2011. By 2014 it is expected that the market value will be around
$875 billion with 10% growth.20
A great majority of firms have experienced declines in market growth due to the
2007-2010 global recession. Because of the significant savings that outsourcing offers,
companies are able to stay in business by outsourcing more.21
Outsourcing helps to save
money and improve the bottom line.
U.S. Sourcing Line, a global data base firm, has compiled the most
comprehensive online database of outsourcing country statistics to aid managers in their
outsourcing decisions.22
Each country has been scored across dozens of key statistics
which fall into three broad areas of (1) Cost Competitiveness, (2) Resources & Skills, and
(3) Business & Economic Environment.23
Based on their (Sourcing Line) research, the top
outsourcing destinations are identified in Table 3.5.
Table 3.5
Post Recession Most Popular Outsourcing Locations (2011)
World Rank Country
1 India
2 Malaysia
3 China
4 Brazil
5 Russia
6 Ukraine
7 Philippines
8 Indonesia
9 Thailand
10 Mexico
11 Chile
12 Argentina
13 Czech Republic
14 South Korea
15 United States
16 Canada
The presence of developing markets dominates this list. The emerging markets
(BRIC) ranked 1, 3, 4, and 5 are the most popular outsourcing locations in 2011.
Malaysia is ranked as the number 2 outsourcing location. Malaysia (#2) is an emerging

73
market where English is a second language. Fully developed markets such as the U.S.
and Canada are ranked 15 and 16. Western European markets are not listed in the top 16
countries.
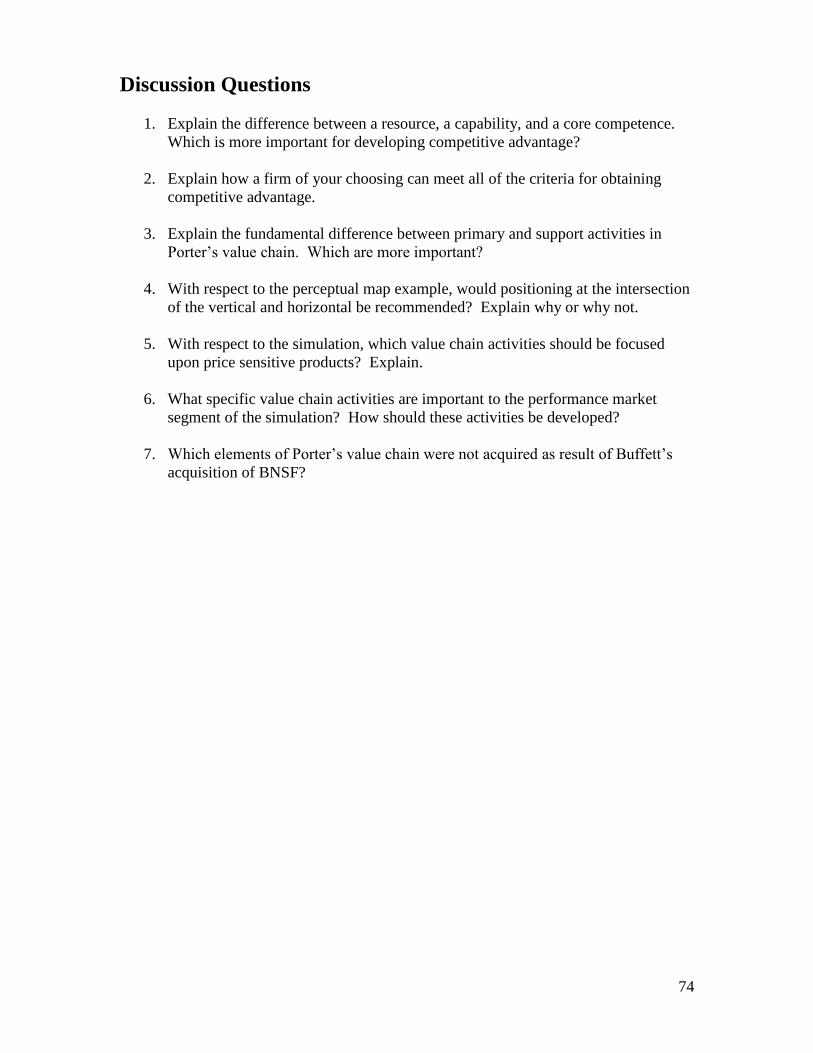
74
Discussion Questions
1. Explain the difference between a resource, a capability, and a core competence.
Which is more important for developing competitive advantage?
2. Explain how a firm of your choosing can meet all of the criteria for obtaining
competitive advantage.
3. Explain the fundamental difference between primary and support activities in
Porter’s value chain. Which are more important?
4. With respect to the perceptual map example, would positioning at the intersection
of the vertical and horizontal be recommended? Explain why or why not.
5. With respect to the simulation, which value chain activities should be focused
upon price sensitive products? Explain.
6. What specific value chain activities are important to the performance market
segment of the simulation? How should these activities be developed?
7. Which elements of Porter’s value chain were not acquired as result of Buffett’s
acquisition of BNSF?
75
References
1.
Penrose, E. 1959. A theory of the growth of the firm. John Wiley & Sons. New
York, NY.
2.
Amit, R. and Shoemaker, P. 1993. Strategic assets and organizational rent. Strategic
Management Journal. 14:33-46.
3.
Nelson, R. and Winter, S. 1982. An evolutionary theory of economic change.
Belknap Press of Harvard University Press. Cambridge, MA.
4.
Barney J., 1991. Firm resources and sustained competitive advantage. Journal of
Management. 17:99-120.
5.
Ibid
6.
Ibid
7.
Porter M. 1985, Competitive advantage. Free Press, New York, NY.
8.
Ibid
9.
Ibid
10.
Nelson and Winter. An evolutionary theory of economic change.
11.
Porter. Competitive advantage.
12.
Brealey R., Myers S., and Marcus A. 2004. Corporate finance. McGraw-Hill Irwin:
Boston, MA.
13.
Porter. Competitive advantage
14.
Porter. Competitive advantage
15.
Pride W. and Ferrell O. 2003. Marketing. Houghin Mifflin: Boston, MA.
16.
Porter. Competitive advantage.
17.
Ibid
18.
Ibid
19.
A. Kaushik, “Offshore Outsourcing and Economic Recessions: Impact on Global,
Indian, and European Outsourcers,” U.S. News Digital Weekly, November 1, 2010.
20.
Ibid
21.
Ibid

76
22. Ibid
23.
Ibid
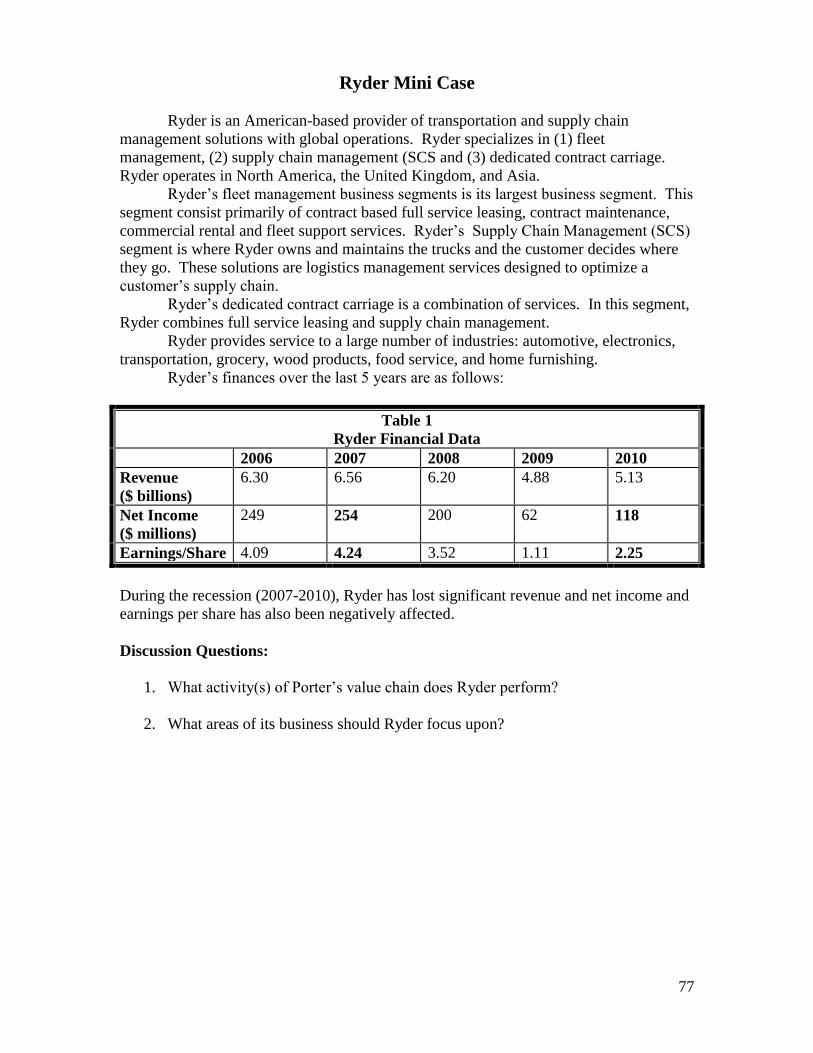
77
Ryder Mini Case
Ryder is an American-based provider of transportation and supply chain
management solutions with global operations. Ryder specializes in (1) fleet
management, (2) supply chain management (SCS and (3) dedicated contract carriage.
Ryder operates in North America, the United Kingdom, and Asia.
Ryder’s fleet management business segments is its largest business segment. This
segment consist primarily of contract based full service leasing, contract maintenance,
commercial rental and fleet support services. Ryder’s Supply Chain Management (SCS)
segment is where Ryder owns and maintains the trucks and the customer decides where
they go. These solutions are logistics management services designed to optimize a
customer’s supply chain.
Ryder’s dedicated contract carriage is a combination of services. In this segment,
Ryder combines full service leasing and supply chain management.
Ryder provides service to a large number of industries: automotive, electronics,
transportation, grocery, wood products, food service, and home furnishing.
Ryder’s finances over the last 5 years are as follows:
Table 1
Ryder Financial Data
2006 2007 2008 2009 2010
Revenue
($ billions)
6.30 6.56 6.20 4.88 5.13
Net Income
($ millions)
249 254 200 62 118
Earnings/Share 4.09 4.24 3.52 1.11 2.25
During the recession (2007-2010), Ryder has lost significant revenue and net income and
earnings per share has also been negatively affected.
Discussion Questions:
1. What activity(s) of Porter’s value chain does Ryder perform?
2. What areas of its business should Ryder focus upon?

78
Harvard Business Cases for Chapter 3
United Cereal: Lora Brill’s Eurobrand Challenge
Product Number 4269
The Dutch Flower Cluster
Product Number 711507
Professor Case for Chapter 3
Airbus A380 vs. Boeing 787
79
Chapter 4
Business Level Strategy

80
Learning and Assessment Goals
1. Understand the concept of business level strategy.
2. Understand how to make decisions to achieve competitive advantage. Understand
what decisions need to be made to maintain competitive advantage.
3. Understand how competitive dynamics can be utilized to maintain competitive
advantage.
4. Understand how SWOT analysis can be utilized to capitalize upon competitors’
weaknesses. In addition, understand how SWOT analysis can be utilized to
convert opportunities into strengths.
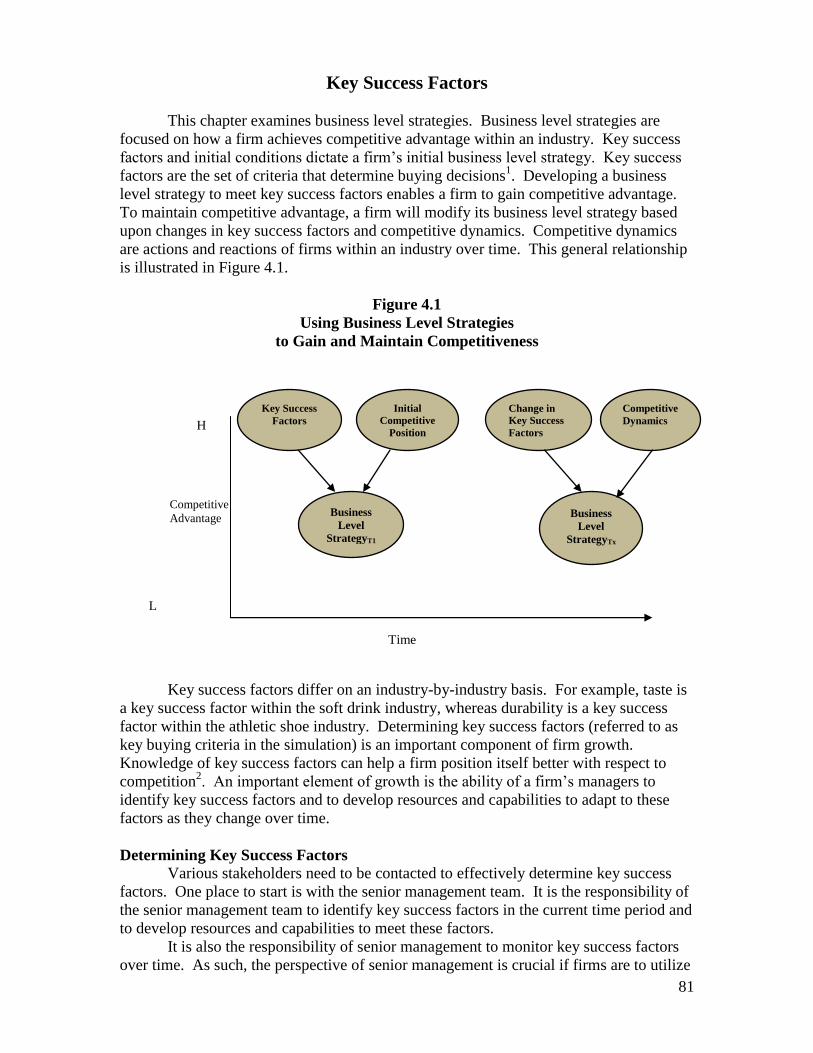
81
Key Success Factors
This chapter examines business level strategies. Business level strategies are
focused on how a firm achieves competitive advantage within an industry. Key success
factors and initial conditions dictate a firm’s initial business level strategy. Key success
factors are the set of criteria that determine buying decisions1. Developing a business
level strategy to meet key success factors enables a firm to gain competitive advantage.
To maintain competitive advantage, a firm will modify its business level strategy based
upon changes in key success factors and competitive dynamics. Competitive dynamics
are actions and reactions of firms within an industry over time. This general relationship
is illustrated in Figure 4.1.
Figure 4.1
Using Business Level Strategies
to Gain and Maintain Competitiveness
Key success factors differ on an industry-by-industry basis. For example, taste is
a key success factor within the soft drink industry, whereas durability is a key success
factor within the athletic shoe industry. Determining key success factors (referred to as
key buying criteria in the simulation) is an important component of firm growth.
Knowledge of key success factors can help a firm position itself better with respect to
competition2. An important element of growth is the ability of a firm’s managers to
identify key success factors and to develop resources and capabilities to adapt to these
factors as they change over time.
Determining Key Success Factors
Various stakeholders need to be contacted to effectively determine key success
factors. One place to start is with the senior management team. It is the responsibility of
the senior management team to identify key success factors in the current time period and
to develop resources and capabilities to meet these factors.
It is also the responsibility of senior management to monitor key success factors
over time. As such, the perspective of senior management is crucial if firms are to utilize
H
L
Time
Competitive
Advantage
Key Success
Factors
Initial
Competitive
Position
Business
Level
StrategyT1
Change in
Key Success
Factors
Business
Level
StrategyTx
Competitive
Dynamics
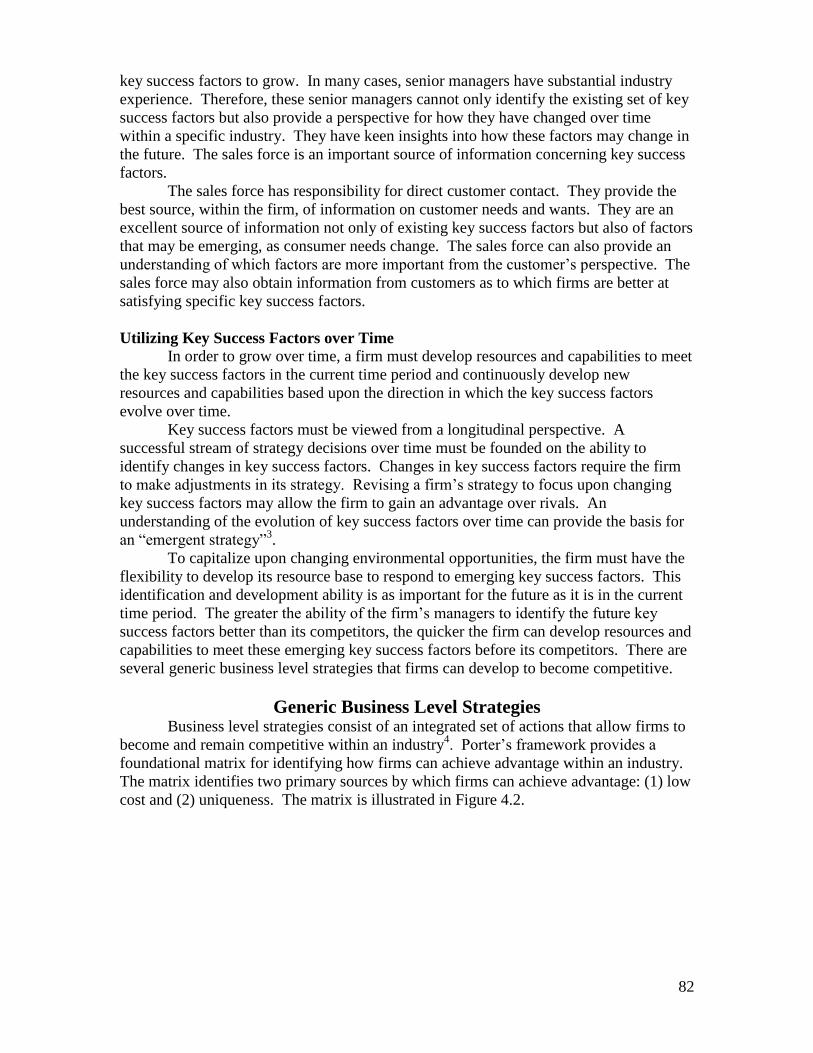
82
key success factors to grow. In many cases, senior managers have substantial industry
experience. Therefore, these senior managers cannot only identify the existing set of key
success factors but also provide a perspective for how they have changed over time
within a specific industry. They have keen insights into how these factors may change in
the future. The sales force is an important source of information concerning key success
factors.
The sales force has responsibility for direct customer contact. They provide the
best source, within the firm, of information on customer needs and wants. They are an
excellent source of information not only of existing key success factors but also of factors
that may be emerging, as consumer needs change. The sales force can also provide an
understanding of which factors are more important from the customer’s perspective. The
sales force may also obtain information from customers as to which firms are better at
satisfying specific key success factors.
Utilizing Key Success Factors over Time
In order to grow over time, a firm must develop resources and capabilities to meet
the key success factors in the current time period and continuously develop new
resources and capabilities based upon the direction in which the key success factors
evolve over time.
Key success factors must be viewed from a longitudinal perspective. A
successful stream of strategy decisions over time must be founded on the ability to
identify changes in key success factors. Changes in key success factors require the firm
to make adjustments in its strategy. Revising a firm’s strategy to focus upon changing
key success factors may allow the firm to gain an advantage over rivals. An
understanding of the evolution of key success factors over time can provide the basis for
an “emergent strategy”3.
To capitalize upon changing environmental opportunities, the firm must have the
flexibility to develop its resource base to respond to emerging key success factors. This
identification and development ability is as important for the future as it is in the current
time period. The greater the ability of the firm’s managers to identify the future key
success factors better than its competitors, the quicker the firm can develop resources and
capabilities to meet these emerging key success factors before its competitors. There are
several generic business level strategies that firms can develop to become competitive.
Generic Business Level Strategies Business level strategies consist of an integrated set of actions that allow firms to
become and remain competitive within an industry4. Porter’s framework provides a
foundational matrix for identifying how firms can achieve advantage within an industry.
The matrix identifies two primary sources by which firms can achieve advantage: (1) low
cost and (2) uniqueness. The matrix is illustrated in Figure 4.2.
83
Figure 4.2:
Generic Business Strategies
Competitive
Advantage
Cost Uniqueness
Broad Target Cost
Leadership Differentiation
Competitive
Scope
Narrow Target
Focused
Low Cost
Focused
Differentiation
Source: Adapted with the permission of The Free Press, an imprint of Simon & Schuster Adult Publishing
Group, from Competitive advantage: creating and sustaining superior performance by Michael Porter, 12.
1985.
Cost leadership
Cost leadership is based on high-volume sales of low-margin items. High volume
products are usually no-frills items. However, they must be of acceptable quality and
have features that meet consumers’ needs. Superior advantage in a cost leadership
position comes from creating a significant and sustainable cost gap, relative to
competitors, by managing costs to achieve economies of scale. This cost gap translates
into superior margins when the firm maintains prices at or near industry averages. UPS
(United Parcel Service) and Wal-Mart are two firms that are the lowest cost producers
within their respective industries. These firms would fall into the cost leadership position
because their target markets (customers served) are international in scope.
Focused low cost
Firms that service a narrow target market achieve a focused low cost position.
Examples of focused low cost would be Boone’s Farm, Dollar General, and online
brokerage firms. Boone’s Farm’s target market consists primarily of those individuals
who have little disposable income and enjoy drinking wine. Dollar General focuses upon
target markets in selected cities that prefer to shop at small discount stores. Online
brokerage firms focus on investors that are heavy users of the Internet. These firms meet
the needs of specific target markets.
Differentiation
A position of uniqueness is based on sales of high-margin items. Customers are
willing to pay a premium price for a differentiated product or service because the item
satisfies some specialized need. Uniqueness can be achieved through design or brand
image, technological features, customer service, specialized dealer networks, product
innovations, and a high level of quality, and/or better relations with suppliers than
competitors. The key to a successful differentiation strategy is to offer a broad range of
customers something for which they are willing to pay substantially more than the cost
incurred by the firm creating it. Microsoft and Intel are examples of firms that utilize
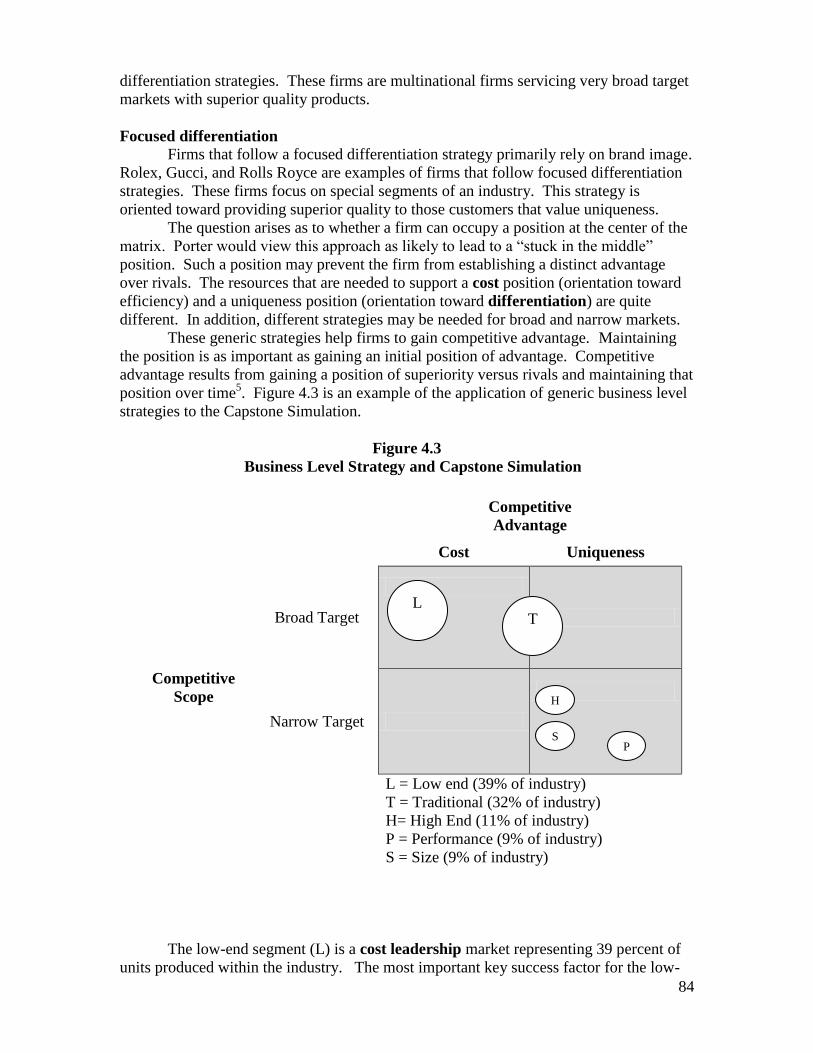
84
differentiation strategies. These firms are multinational firms servicing very broad target
markets with superior quality products.
Focused differentiation
Firms that follow a focused differentiation strategy primarily rely on brand image.
Rolex, Gucci, and Rolls Royce are examples of firms that follow focused differentiation
strategies. These firms focus on special segments of an industry. This strategy is
oriented toward providing superior quality to those customers that value uniqueness.
The question arises as to whether a firm can occupy a position at the center of the
matrix. Porter would view this approach as likely to lead to a “stuck in the middle”
position. Such a position may prevent the firm from establishing a distinct advantage
over rivals. The resources that are needed to support a cost position (orientation toward
efficiency) and a uniqueness position (orientation toward differentiation) are quite
different. In addition, different strategies may be needed for broad and narrow markets.
These generic strategies help firms to gain competitive advantage. Maintaining
the position is as important as gaining an initial position of advantage. Competitive
advantage results from gaining a position of superiority versus rivals and maintaining that
position over time5. Figure 4.3 is an example of the application of generic business level
strategies to the Capstone Simulation.
Figure 4.3
Business Level Strategy and Capstone Simulation
Competitive
Advantage
Cost Uniqueness
Broad Target
Competitive
Scope
Narrow Target
L = Low end (39% of industry)
T = Traditional (32% of industry)
H= High End (11% of industry)
P = Performance (9% of industry)
S = Size (9% of industry)
The low-end segment (L) is a cost leadership market representing 39 percent of
units produced within the industry. The most important key success factor for the low-
L T
H
S P
P
H
85
end market is price. To maintain a position of advantage over time, the firm must
implement activities that are efficiency-based. The implementation of Total Quality
Management (TQM) is one such activity. The implementation of several TQM
initiatives will help drive down costs. This action is crucial for success in the low-end
market.
The traditional segment of the industry is another broad segment of the industry
because it represents 32 percent of the industry demand. The key success factors for this
segment include both cost and uniqueness criteria oriented to a broad target market. The
business level strategy for this segment must include a low cost position coupled with a
uniqueness component. One approach to obtaining this position is through the
implementation of flexible manufacturing systems. A flexible manufacturing system is a
computer-controlled process used to produce a variety of products in moderate, flexible
quantities with a minimum of manual intervention.
The high end, performance, and size segments are positioned to follow a focused
differentiation strategy. Each segment will not be developed with the same focused
differentiation strategy. Each segment places different importance on key success
factors to maintain advantage. An important key success factor of the high-end segment
is new product development. Durability is important to the performance market. Market
positioning is a key success factor for the size market. As such, a distinct business level
strategy must be developed for each segment.
Porter’s generic business strategy model has been challenged because it provides
a static perspective6. The incorporation of key success factors introduces a dynamic
component into Porter’s generic business strategies. An understanding of the evolution
of key success factors over time will allow the firm to be able to continuously meet key
success factors as they change. As such, the firm can develop a dynamic strategy to
maintain advantage over time. By incorporating the time dimension, firms can alter their
positions in response to changing market conditions (e.g. key success factors). By
understanding how each market evolves over time, the firm can maintain competitive
advantage over rivals. A firm’s business level strategy must take into consideration the
action and reaction of competitors. As such, an understanding of competitive dynamics
is important for sustaining a firm’s strategy over time. How firms grow over time is
important.
Walmart’s Expansion Walmart is a firm which has primarily grown by internal development. In the
1960’s Walmart grew by more fully developing its U.S. customer base. The U.S.
customer base included all 50 states by 1993.
However, this was not Walmart’s primary focus during the mid 1970’s to late
1980’s. This time period was utilized primarily for product development. As shown in
Table 4.1, Walmart engaged in a period of new product development. In 1975, Walmart
introduced Walmart pharmacy, auto service, and jewelry divisions within its store. These
divisions provide Walmart with new products to Walmart customers which generated
higher return than Walmart’s traditional business. These businesses also led Walmart to
its primary focus of one-stop shopping.
From 1991 to 2010, Walmart expanded into international markets. As can be
shown from Table 4.1, Walmart has established a significant international presence.
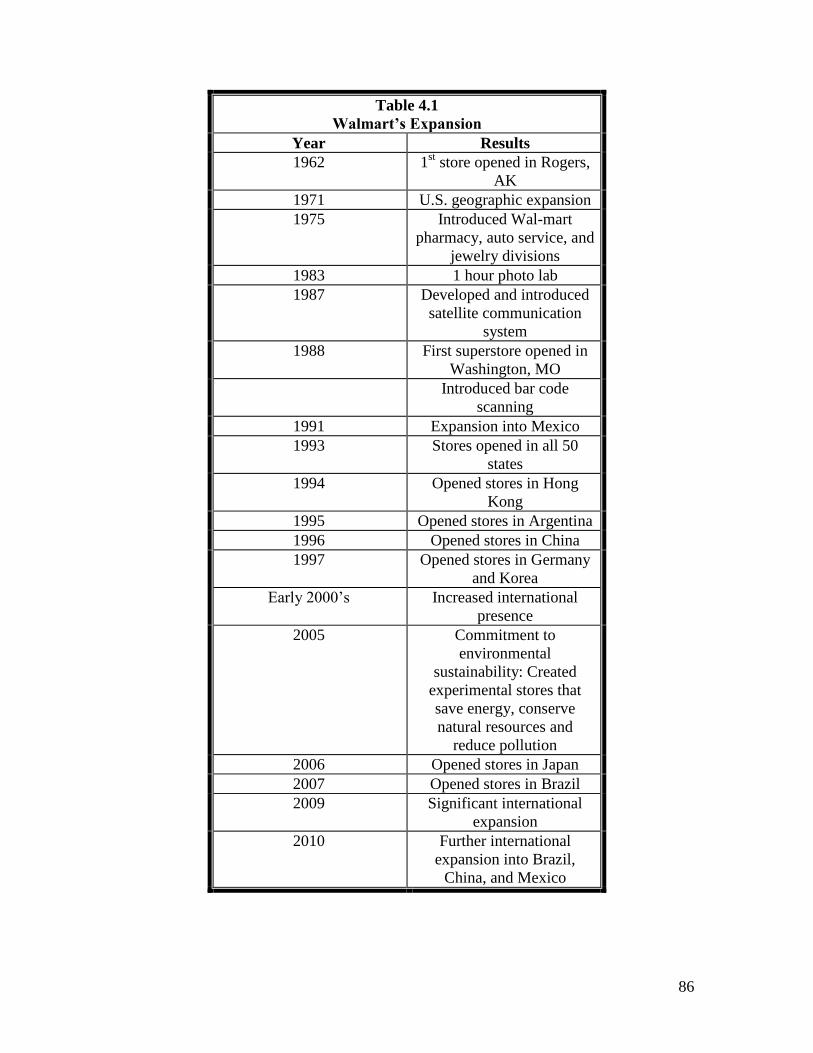
86
Table 4.1
Walmart’s Expansion
Year Results
1962 1st store opened in Rogers,
AK
1971 U.S. geographic expansion
1975 Introduced Wal-mart
pharmacy, auto service, and
jewelry divisions
1983 1 hour photo lab
1987 Developed and introduced
satellite communication
system
1988 First superstore opened in
Washington, MO
Introduced bar code
scanning
1991 Expansion into Mexico
1993 Stores opened in all 50
states
1994 Opened stores in Hong
Kong
1995 Opened stores in Argentina
1996 Opened stores in China
1997 Opened stores in Germany
and Korea
Early 2000’s Increased international
presence
2005 Commitment to
environmental
sustainability: Created
experimental stores that
save energy, conserve
natural resources and
reduce pollution
2006 Opened stores in Japan
2007 Opened stores in Brazil
2009 Significant international
expansion
2010 Further international
expansion into Brazil,
China, and Mexico
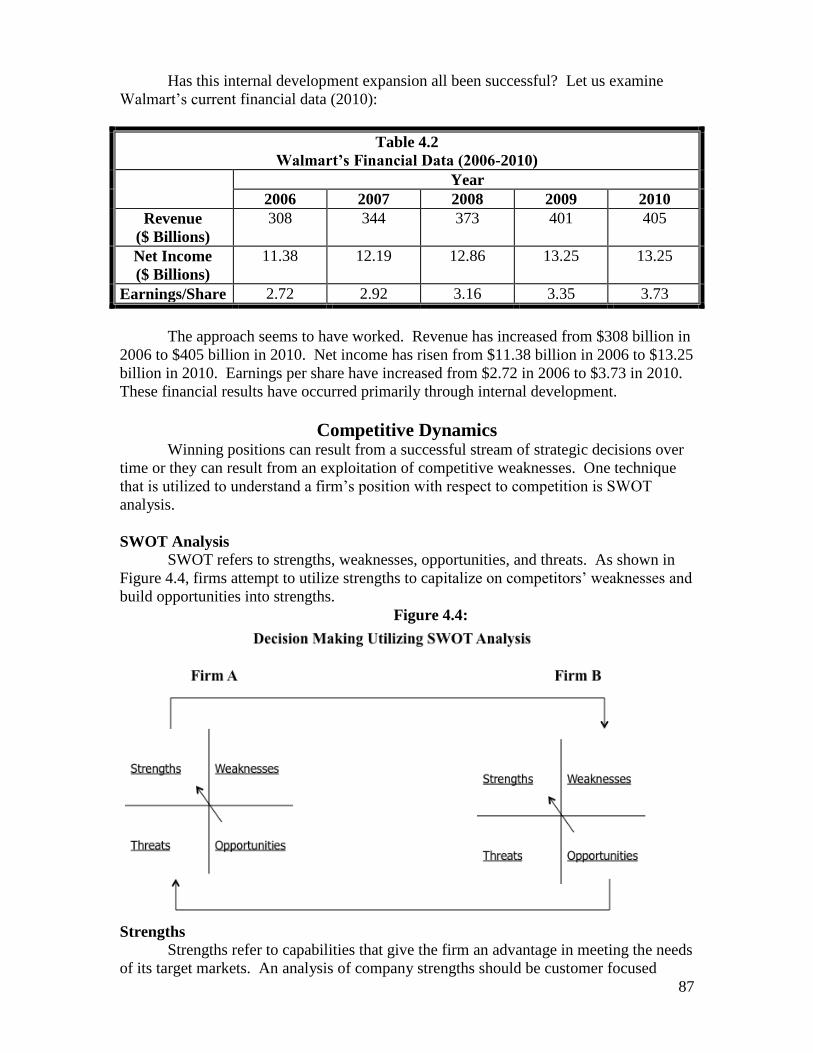
87
Has this internal development expansion all been successful? Let us examine
Walmart’s current financial data (2010):
Table 4.2
Walmart’s Financial Data (2006-2010)
Year
2006 2007 2008 2009 2010
Revenue
($ Billions)
308 344 373 401 405
Net Income
($ Billions)
11.38 12.19 12.86 13.25 13.25
Earnings/Share 2.72 2.92 3.16 3.35 3.73
The approach seems to have worked. Revenue has increased from $308 billion in
2006 to $405 billion in 2010. Net income has risen from $11.38 billion in 2006 to $13.25
billion in 2010. Earnings per share have increased from $2.72 in 2006 to $3.73 in 2010.
These financial results have occurred primarily through internal development.
Competitive Dynamics Winning positions can result from a successful stream of strategic decisions over
time or they can result from an exploitation of competitive weaknesses. One technique
that is utilized to understand a firm’s position with respect to competition is SWOT
analysis.
SWOT Analysis
SWOT refers to strengths, weaknesses, opportunities, and threats. As shown in
Figure 4.4, firms attempt to utilize strengths to capitalize on competitors’ weaknesses and
build opportunities into strengths.
Figure 4.4:
Strengths
Strengths refer to capabilities that give the firm an advantage in meeting the needs
of its target markets. An analysis of company strengths should be customer focused
88
because strengths are meaningful only when they assist the firm in meeting customer
needs. Pfizer’s strength in research and development resulted in the creation and release
of Lipitor. Lipitor is a cholesterol-reducing drug that has become the largest selling
pharmaceutical drug in history7. Toyota’s strength in lean manufacturing helps to
maintain its leadership position in the automotive industry.
Weaknesses
Weaknesses refer to any limitations that a company faces in developing or
implementing a strategy. Weaknesses should also be examined from a customer
perspective because customers often perceive weaknesses that a company cannot see.
Apple’s operating system became a weakness when the computer industry went to a
Windows standard. Until recently, McDonald’s faced a weakness in that the majority of
its menu items contain high levels of fat. Today’s society is focusing on more healthy
eating alternatives.
Opportunities
Opportunities refer to favorable conditions in the environment that could produce
rewards for the organization if acted on properly. Caterpillar’s capabilities in heavy
moving equipment lead to it establishing a leadership position in the reconstruction of
Iraq. Dell’s strategy of selling direct to consumers shortened its distribution cycle and
reduced costs.
Threats
Threats refer to conditions or barriers that may prevent the firm from reaching its
objectives. For instance, Barnes & Noble’s launching of a website to sell books
represented a threat to Amazon.com. New regulations may be threats. Many emerging
markets (e.g. India, Brazil) are privatizing many industries. This action can lead to new
entrants establishing significant positions within these markets. In many cases, the firms
that are entering a deregulated market may have had more experience being successful in
deregulated industries. As such, these firms pose significant threats to incumbent firms.
A firm’s strategy should determine how threats could be minimized or eliminated. The
threat of Johnson and Johnson losing market share as a result of the cyanide poisoning of
Tylenol capsules in the 1980’s posed a significant threat. Johnson and Johnson
responded to the threat by introducing safety seals; these seals are now industry
standards. A SWOT analysis of two U.S. airlines will now be discussed.
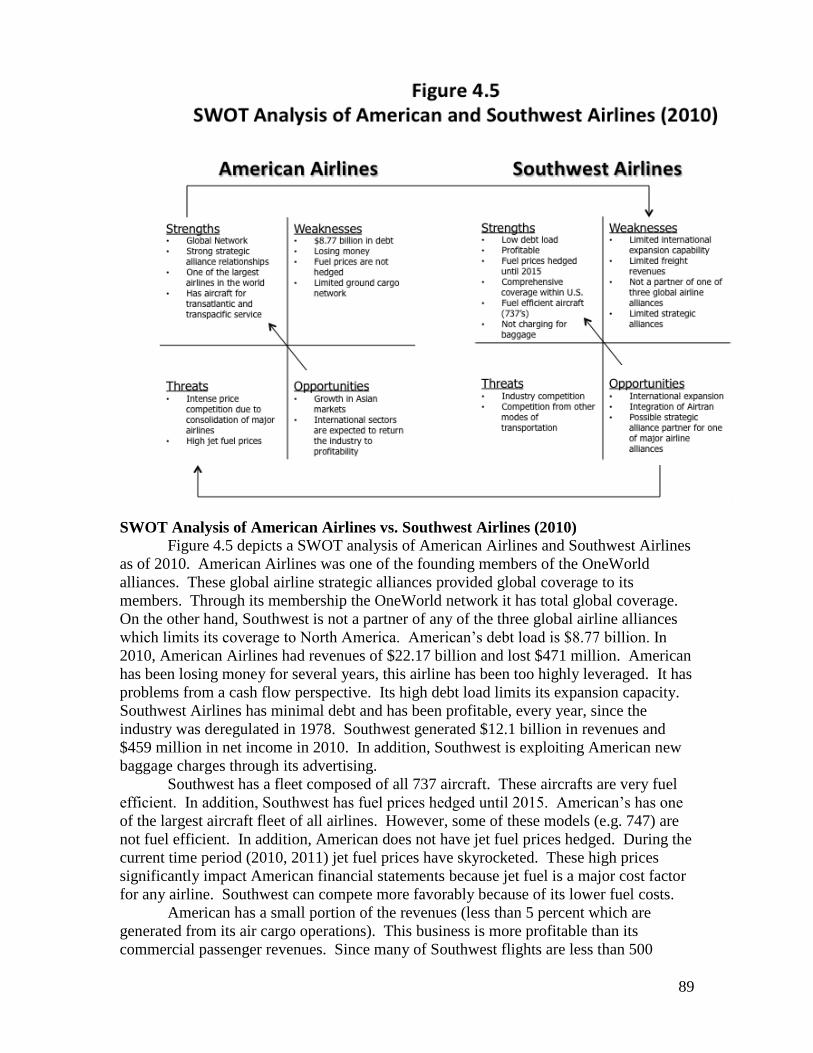
89
SWOT Analysis of American Airlines vs. Southwest Airlines (2010)
Figure 4.5 depicts a SWOT analysis of American Airlines and Southwest Airlines
as of 2010. American Airlines was one of the founding members of the OneWorld
alliances. These global airline strategic alliances provided global coverage to its
members. Through its membership the OneWorld network it has total global coverage.
On the other hand, Southwest is not a partner of any of the three global airline alliances
which limits its coverage to North America. American’s debt load is $8.77 billion. In
2010, American Airlines had revenues of $22.17 billion and lost $471 million. American
has been losing money for several years, this airline has been too highly leveraged. It has
problems from a cash flow perspective. Its high debt load limits its expansion capacity.
Southwest Airlines has minimal debt and has been profitable, every year, since the
industry was deregulated in 1978. Southwest generated $12.1 billion in revenues and
$459 million in net income in 2010. In addition, Southwest is exploiting American new
baggage charges through its advertising.
Southwest has a fleet composed of all 737 aircraft. These aircrafts are very fuel
efficient. In addition, Southwest has fuel prices hedged until 2015. American’s has one
of the largest aircraft fleet of all airlines. However, some of these models (e.g. 747) are
not fuel efficient. In addition, American does not have jet fuel prices hedged. During the
current time period (2010, 2011) jet fuel prices have skyrocketed. These high prices
significantly impact American financial statements because jet fuel is a major cost factor
for any airline. Southwest can compete more favorably because of its lower fuel costs.
American has a small portion of the revenues (less than 5 percent which are
generated from its air cargo operations). This business is more profitable than its
commercial passenger revenues. Since many of Southwest flights are less than 500
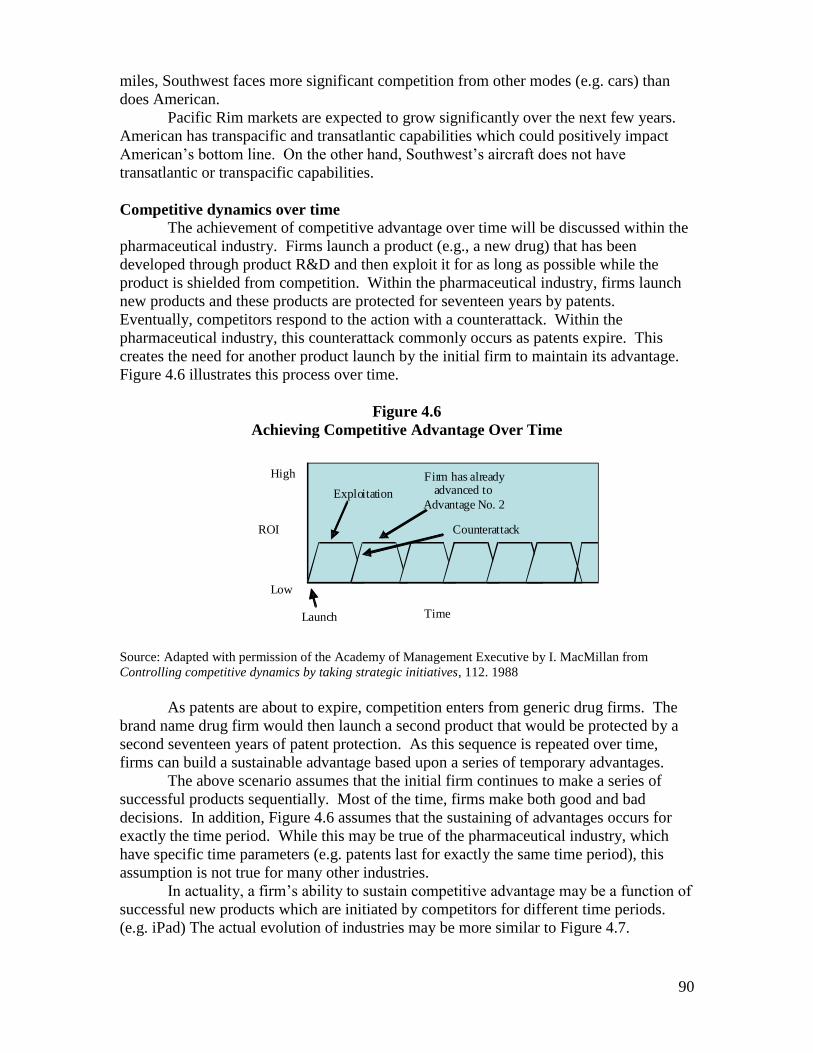
90
miles, Southwest faces more significant competition from other modes (e.g. cars) than
does American.
Pacific Rim markets are expected to grow significantly over the next few years.
American has transpacific and transatlantic capabilities which could positively impact
American’s bottom line. On the other hand, Southwest’s aircraft does not have
transatlantic or transpacific capabilities.
Competitive dynamics over time
The achievement of competitive advantage over time will be discussed within the
pharmaceutical industry. Firms launch a product (e.g., a new drug) that has been
developed through product R&D and then exploit it for as long as possible while the
product is shielded from competition. Within the pharmaceutical industry, firms launch
new products and these products are protected for seventeen years by patents.
Eventually, competitors respond to the action with a counterattack. Within the
pharmaceutical industry, this counterattack commonly occurs as patents expire. This
creates the need for another product launch by the initial firm to maintain its advantage.
Figure 4.6 illustrates this process over time.
Figure 4.6
Achieving Competitive Advantage Over Time
Source: Adapted with permission of the Academy of Management Executive by I. MacMillan from
Controlling competitive dynamics by taking strategic initiatives, 112. 1988
As patents are about to expire, competition enters from generic drug firms. The
brand name drug firm would then launch a second product that would be protected by a
second seventeen years of patent protection. As this sequence is repeated over time,
firms can build a sustainable advantage based upon a series of temporary advantages.
The above scenario assumes that the initial firm continues to make a series of
successful products sequentially. Most of the time, firms make both good and bad
decisions. In addition, Figure 4.6 assumes that the sustaining of advantages occurs for
exactly the time period. While this may be true of the pharmaceutical industry, which
have specific time parameters (e.g. patents last for exactly the same time period), this
assumption is not true for many other industries.
In actuality, a firm’s ability to sustain competitive advantage may be a function of
successful new products which are initiated by competitors for different time periods.
(e.g. iPad) The actual evolution of industries may be more similar to Figure 4.7.
ROI
Launch
Exploitation
Firm has alreadyadvanced to
Advantage No. 2
Time
Counterattack
Low
High
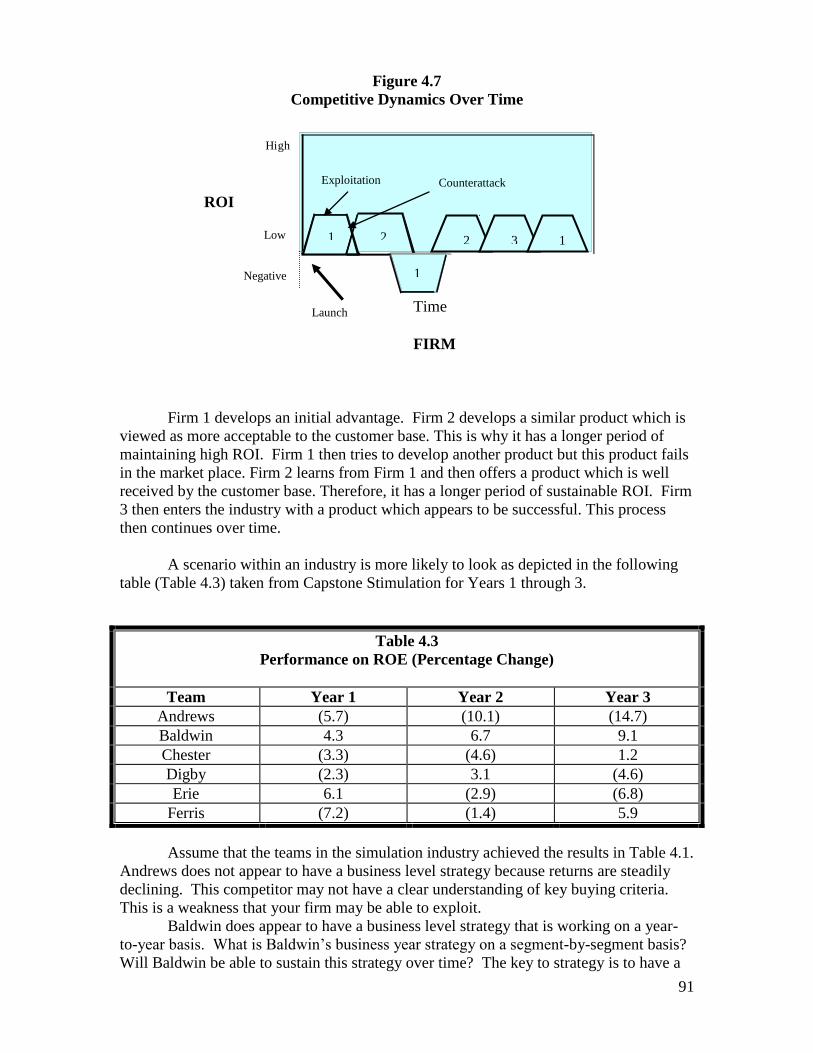
91
Figure 4.7
Competitive Dynamics Over Time
Firm 1 develops an initial advantage. Firm 2 develops a similar product which is
viewed as more acceptable to the customer base. This is why it has a longer period of
maintaining high ROI. Firm 1 then tries to develop another product but this product fails
in the market place. Firm 2 learns from Firm 1 and then offers a product which is well
received by the customer base. Therefore, it has a longer period of sustainable ROI. Firm
3 then enters the industry with a product which appears to be successful. This process
then continues over time.
A scenario within an industry is more likely to look as depicted in the following
table (Table 4.3) taken from Capstone Stimulation for Years 1 through 3.
Table 4.3
Performance on ROE (Percentage Change)
Team Year 1 Year 2 Year 3
Andrews (5.7) (10.1) (14.7)
Baldwin 4.3 6.7 9.1
Chester (3.3) (4.6) 1.2
Digby (2.3) 3.1 (4.6)
Erie 6.1 (2.9) (6.8)
Ferris (7.2) (1.4) 5.9
Assume that the teams in the simulation industry achieved the results in Table 4.1.
Andrews does not appear to have a business level strategy because returns are steadily
declining. This competitor may not have a clear understanding of key buying criteria.
This is a weakness that your firm may be able to exploit.
Baldwin does appear to have a business level strategy that is working on a year-
to-year basis. What is Baldwin’s business year strategy on a segment-by-segment basis?
Will Baldwin be able to sustain this strategy over time? The key to strategy is to have a
ROI
Launch
Time
FIRM
Low
H i g h
1 2
1 Negative
2 3 1
Exploitation Counterattack
92
long-term strategy and properly execute the strategy over time. Does Baldwin appear to
have a viable long-term strategy? How can your firm successfully position against
Baldwin for long-term success? Examine the statement of cash flows to ascertain if
Baldwin is investing in plant improvements. If not, what does this tell your firm? How
should your firm position itself in the short and long term with respect to Team Baldwin?
Team Chester may not be in as unfavorable a position as it appears for the long
term. This team may have heavily invested in plant improvements, automation, or TQM
initiatives. These benefits may be realized in subsequent years. Refer to the cash flows
statement of the simulation for changes in plant improvements, the production analysis
for changes in automation, and the TQM summary for investments in quality
improvements. It is quite possible that Team Chester will accrue higher benefits in
subsequent years.
It would appear as if Team Digby does not have a short-term business level
strategy. This team may have accumulated inventory-carrying costs during Year 1 and
Year 3. How are this team’s products positioned on a segment-by-segment basis on key
buying criteria? This may be a team that your team can take market share from. Develop
a short-term strategy to capitalize upon this competitor’s weaknesses.
Team Erie appeared to have a solid year 1 and has since had difficulty. What
changed for Team Erie? Why were they successful in year 1 and not subsequent years?
Did other firms develop strategic changes to capitalize upon Team Erie? If so, what team
and what was the action? Erie’s strategy may not have enough flexibility to respond to
changing market conditions or to changes in other firm’s strategy that are aimed at
exploiting their weaknesses.
Similar to team Chester, Ferris may be a team that invested heavily in year 1
(check the cash flow statement, production analysis, and TQM summary). It also appears
as if these investments are beginning to pay rewards. How is this competitor positioned
on key buying criteria on a segment-by-segment basis? What can your firm do to
neutralize Ferris? What is Ferris’ generic business strategy on a segment-by-segment
basis? Where are their weaknesses? How can these weaknesses be exploited?
While each team should develop a long-term business level strategy for each
segment, that strategy must be flexible enough to capitalize upon competitor’s weakness
over time. Competitive dynamics requires that firms have enough flexibility to respond
to competitors’ threats. The key to competitor analysis is to evaluate each competitor on
a segment-by-segment basis. How well is each competitor meeting the key buying
criteria? What is each firm’s business level strategy on a segment-by-segment basis?
With this information your firm should be able to develop a strategy to gain and sustain
competitiveness.
93
Discussion Questions
1. Explain what business level strategy your firm should pursue in the Capstone
Simulation on a segment-by-segment basis. Explain why.
2. Which firm would have a more sustainable advantage in the Capstone Simulation:
one that concentrates on cost leadership or focused differentiation? Explain why.
3. Why do key success factors need to be viewed over time? What happens if they are
not? Provide an example of a firm that has viewed these factors over time and one
that has not.
4. Explain why and when SWOT analysis needs to be performed.
5. Explain sustainable competitive advantage. How is this advantage achieved in the
Capstone Simulation?
6. Explain the difference between competitive dynamics and business level strategy.
Explain why each is important.
7. Explain how one of the teams in your industry has been successful from a competitive
dynamics perspective. Explain why teams have not been successful. What would
you recommend for this unsuccessful team? Explain.
8. Why has Wal-Mart been successful both before the global economic recession and
during the global economic recession (2007-2010)?
94
References
1. Ohmae, K. 1982. The mind of the strategist. McGraw Hill. New York, NY.
2. Vasconcellos, J. and Hambrick D. 1989. Key success factors: Test of a general
framework in the mature industrial – product sector. Strategic Management Journal,
10: 367-382.
3. Mintzberg, H. 1978. Patterns in strategy formation. Management Science, 24: 934-
948.
4. Porter, M. 1985. Competitive advantage: creating and sustaining superior
performance. Free Press. New York, NY.
5. Rumelt, R. and Schendel, D. and Teece, D. 1991. Strategic management and
economics. Strategic Management Journal. 12 (winter): 5-29.
6. D’Aveni, R. Hypercompetition. 1994. New York, NY.
7. Jain S. 2004. Marketing Planning and Strategy. Thomson. Mason, OH.
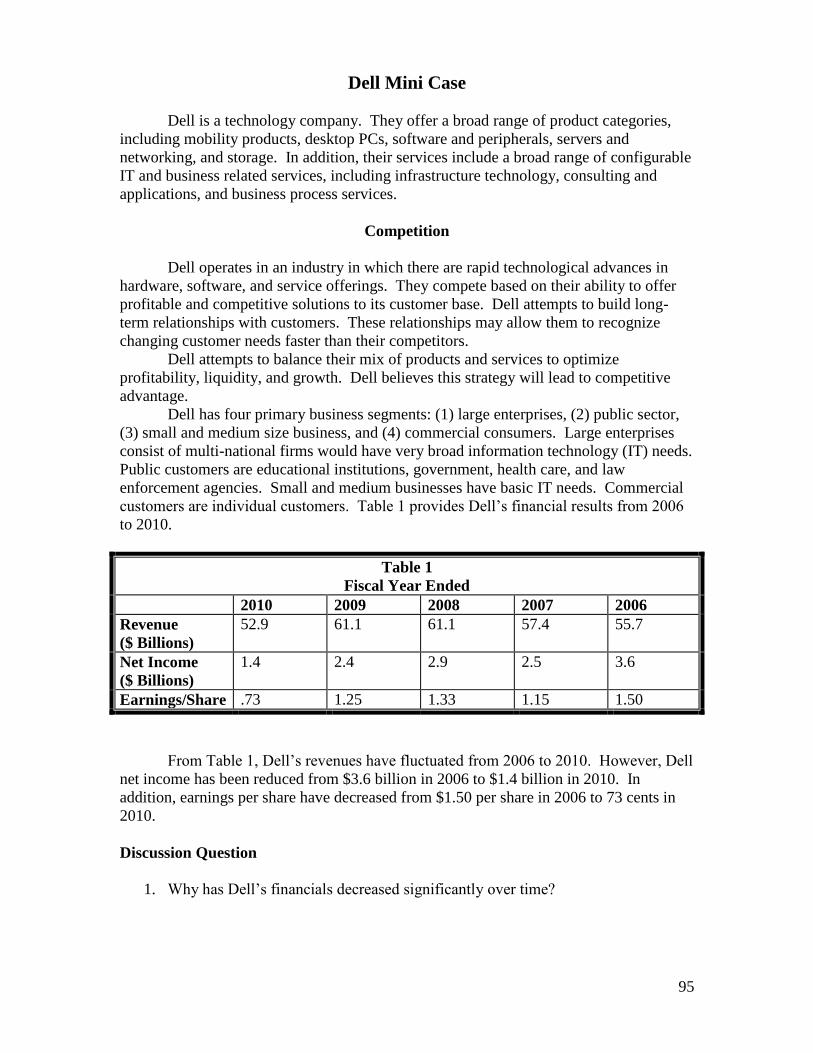
95
Dell Mini Case
Dell is a technology company. They offer a broad range of product categories,
including mobility products, desktop PCs, software and peripherals, servers and
networking, and storage. In addition, their services include a broad range of configurable
IT and business related services, including infrastructure technology, consulting and
applications, and business process services.
Competition
Dell operates in an industry in which there are rapid technological advances in
hardware, software, and service offerings. They compete based on their ability to offer
profitable and competitive solutions to its customer base. Dell attempts to build long-
term relationships with customers. These relationships may allow them to recognize
changing customer needs faster than their competitors.
Dell attempts to balance their mix of products and services to optimize
profitability, liquidity, and growth. Dell believes this strategy will lead to competitive
advantage.
Dell has four primary business segments: (1) large enterprises, (2) public sector,
(3) small and medium size business, and (4) commercial consumers. Large enterprises
consist of multi-national firms would have very broad information technology (IT) needs.
Public customers are educational institutions, government, health care, and law
enforcement agencies. Small and medium businesses have basic IT needs. Commercial
customers are individual customers. Table 1 provides Dell’s financial results from 2006
to 2010.
Table 1
Fiscal Year Ended
2010 2009 2008 2007 2006
Revenue
($ Billions)
52.9 61.1 61.1 57.4 55.7
Net Income
($ Billions)
1.4 2.4 2.9 2.5 3.6
Earnings/Share .73 1.25 1.33 1.15 1.50
From Table 1, Dell’s revenues have fluctuated from 2006 to 2010. However, Dell
net income has been reduced from $3.6 billion in 2006 to $1.4 billion in 2010. In
addition, earnings per share have decreased from $1.50 per share in 2006 to 73 cents in
2010.
Discussion Question
1. Why has Dell’s financials decreased significantly over time?
96
Harvard Business Cases for Chapter 4
Cola Wars Continue: Coke and Pepsi in 2010
Product Number 711462
Philips Versus Matsushita: The Competitive Battle Continues
Product Number 910410
Professor Case for Chapter 4
Disney

97
Chapter 5
Analysis of Markets and Positioning
98
Learning and Assessment Goals
1. Understand the various sales forecasting techniques and when to employ each.
2. Understand how markets can be segmented.
3. Understand the relationship between market segmentation, key buying criteria,
and sales forecasting.
4. Understand the trade-offs (e.g. inventory carrying costs) that are made as a result
of inaccurate sales forecasting. Understand how to improve sales forecasting.
5. Develop the ability to achieve successful competitive advantage in multiple
market segments.
99
Marketing is based upon the fundamental concept of exchange. A seller engages
in a relationship with a customer by providing a good or service in exchange for payment,
which is usually money. The primary focus of marketing is outside the firm. A seller
must provide a good or service to a customer that meets the customer’s needs at the right
place, at the right price, in the right form, in the right quantity, and at the right time. If
one or more of these conditions is not met, the exchange will not occur.
Market Segmentation In order for firms to meet all of the above criteria, they develop a marketing mix,
which consists of an integration of product, price, promotion, and distribution that is
targeted toward identifiable market segments. Market segments consist of consumers
who have very similar needs.
A market segment is a group of people who, as individuals or as organizations,
have needs for products in a product class and have the ability, willingness, and authority
to purchase such products1. In general use, the term market sometimes refers to the total
population, or mass market, that buys products. However, our definition is more specific;
it refers to persons seeking products in a specific product category. A market segment is
defined by key success factors. Remember from Chapter 4, these are factors that are
important to customers and upon which customers make buying decisions.
Within an industry, key success factors can be used to define segments. For
example, the key success factors within the automotive industry are significantly different
than those within the telecommunications industry. Key success factors, referred to as
customer buying criteria in the Capstone Simulation, form distinct market segments. The
simulation has five market segments: low end, traditional, high end, performance, and
size. While the factors are the same for each segment, their importance varies on a
segment-by-segment basis. For example, price is the most important key buying criteria
in the low end, while positioning is the most important in the high end.
Because customers place different importance on key buying criteria or have
different key buying criteria, the firm must develop a separate marketing mix for each
segment. A firm generates value by providing a better marketing mix than its
competitors. 2
An example is illustrated in Figure 5.1.
Market Segmentation and the Airline Industry
The airline industry can be segmented into commercial and airfreight
segments.3The commercial segment can be further segmented into business and leisure
travelers. The airfreight segment can be further segmented into next day freight and
deferred freight. Deferred freight has a service requirement beyond next day. Each of
these segments has different customer buying criteria, or each segment places different
importance on the same buying criteria.
For example, the most important criterion to the business traveler is on-time
reliability. To the leisure traveler the most important criterion is price. For the next day
air freight segment, the most important criterion is an integrated air/ground hub and
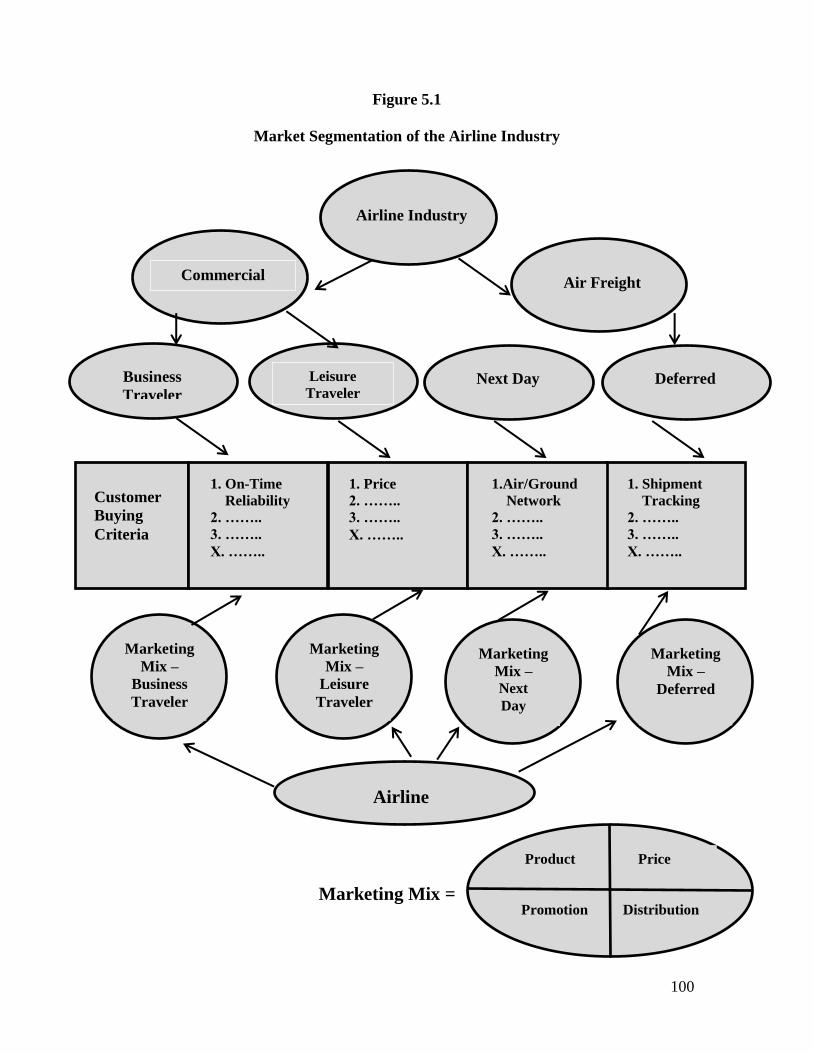
100
Figure 5.1
Market Segmentation of the Airline Industry
Marketing Mix =
Airline Industry
Air Freight
Commercial
Business
Traveler
Leisure
Traveler
Next Day
Deferred
Customer
Buying
Criteria
1. On-Time
Reliability
2. ……..
3. ……..
X. ……..
1. Price
2. ……..
3. ……..
X. ……..
1. Shipment
Tracking
2. ……..
3. ……..
X. ……..
1.Air/Ground
Network
2. ……..
3. ……..
X. ……..
Marketing
Mix –
Business
Traveler
Marketing
Mix –
Leisure
Traveler
Marketing
Mix – Next
Day
Marketing
Mix –
Deferred
Airline
Product Price
Promotion Distribution
101
spoke operating network. For the deferred airfreight market, the most important criterion
is shipment tracking. While some criteria, such as price, are common to all segments,
each segment needs to be treated as a separate market. To properly service a segment,
the firm must know the specific buying criteria in order of importance. Members of each
segment view the same buying criteria in the same order of importance. The goal of the
firm is to develop a series of separate marketing mixes to meet the needs of distinct
customer segments superior to competitors.
Customer buying criteria change over time. The telecommunications industry has
undergone significant change since it was deregulated in 1984. The focus of the
telephone industry in 1984 was to provide point-to-point communication. This focus was
greatly expanded during the 1990’s with heavy influence from Internet variables such as;
packet switching, Internet Protocol (IP), and the World Wide Web.4 These newly created
influences served as a launch pad for the industry’s metamorphosis from “the Telecoms
Industry to the Infocommunications Industry”.5 In 2012, with the explosion of
smartphones, mobile operating systems (such as Apple’s iOS) and voice command
personal assistant applications such as Apple’s Siri6, the infocommunication industry is
rapidly creating the way we communicate.
As such, it is important for the firm to know the new set of key buying criteria at a
point in time and have enough flexibility to change the capabilities of the firm to meet
new key buying criteria as they evolve over time. Thus, developing relationships with
customers over time is of critical importance.
Since the sales staff has direct customer contact, the firm needs to develop a
communication infrastructure for moving information on customer needs and
expectations from sales employees to senior management. With this information the firm
can determine the trade-offs its customers are willing to make.
Not only must the firm be knowledgeable of the changing key success factors on a
segment-by-segment basis, the firm must be able to forecast demand on a segment-by-
segment basis. Several methods exist for forecasting.
Product Positioning The key to marketing is to develop products that are better than competitors on
dimensions that are important to customers. Figure 5.2 provides a depiction of the global
automobile industry. We call this depiction a perceptual map.
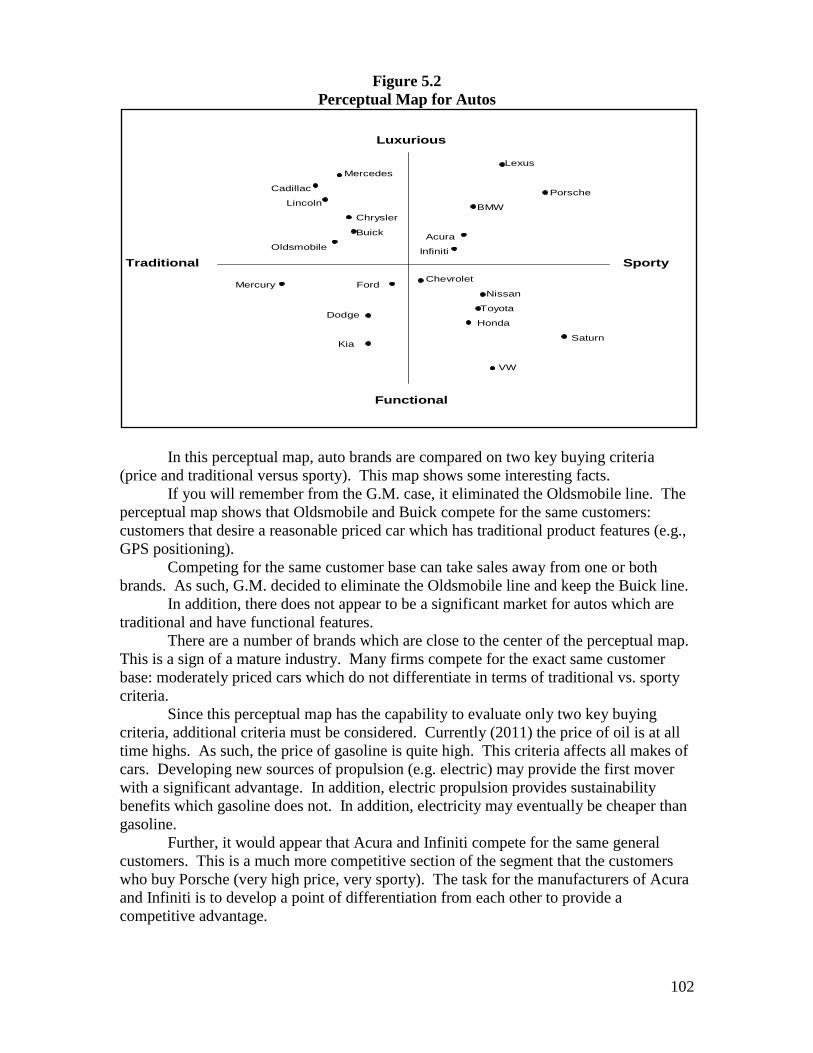
102
Figure 5.2
Perceptual Map for Autos
In this perceptual map, auto brands are compared on two key buying criteria
(price and traditional versus sporty). This map shows some interesting facts.
If you will remember from the G.M. case, it eliminated the Oldsmobile line. The
perceptual map shows that Oldsmobile and Buick compete for the same customers:
customers that desire a reasonable priced car which has traditional product features (e.g.,
GPS positioning).
Competing for the same customer base can take sales away from one or both
brands. As such, G.M. decided to eliminate the Oldsmobile line and keep the Buick line.
In addition, there does not appear to be a significant market for autos which are
traditional and have functional features.
There are a number of brands which are close to the center of the perceptual map.
This is a sign of a mature industry. Many firms compete for the exact same customer
base: moderately priced cars which do not differentiate in terms of traditional vs. sporty
criteria.
Since this perceptual map has the capability to evaluate only two key buying
criteria, additional criteria must be considered. Currently (2011) the price of oil is at all
time highs. As such, the price of gasoline is quite high. This criteria affects all makes of
cars. Developing new sources of propulsion (e.g. electric) may provide the first mover
with a significant advantage. In addition, electric propulsion provides sustainability
benefits which gasoline does not. In addition, electricity may eventually be cheaper than
gasoline.
Further, it would appear that Acura and Infiniti compete for the same general
customers. This is a much more competitive section of the segment that the customers
who buy Porsche (very high price, very sporty). The task for the manufacturers of Acura
and Infiniti is to develop a point of differentiation from each other to provide a
competitive advantage.
Luxurious
Functional
SportyTraditional
Mercedes
Cadillac
Lincoln
Chrysler
Buick
Oldsmobile
Lexus
Porsche
BMW
Acura
Infiniti
Mercury Ford
Dodge
Kia
Chevrolet
Nissan
Toyota
Honda
Saturn
VW
103
Sales Forecasting
Sales Forecasting Methods
At times, a company may forecast sales chiefly on the basis of executive
judgment. Executive judgment may work reasonably well when product demand is
relatively stable and the management team has many years of industry experience. A
disadvantage of executive judgment is that the views of customers are not obtained. As
key success factors in the industry change, executives must be aware of these changes. It
is important for executives to continuously communicate with the sales force. The sales
force has direct customer contact and may be more knowledgeable than senior
management with respect to changing conditions.
Naïve methods are another type of forecasting method. Forecasts are developed
based on last year’s sales and growth rate. Naïve methods are best utilized when
industries are in their maturity stage. During the maturity stage of an industry’s life
cycle, entry of firms outside the industry is minimal because all market segments have
been addressed. The tobacco industry would fall into these general parameters. Growth
rates in these industries tend to be relatively stable and do not change significantly from
year to year. In addition, market share within these industries tends not to change much
over time because of the stage (maturity) of industry evolution.
The utilization of multiple years of sales data can be very helpful when attempting
to forecast future sales. One technique that uses multiple years of sales data is
exponential smoothing. Exponential smoothing consists of projecting the next period’s
sales by combining an average of past sales and most recent sales giving more weight to
the latter. A simple exponential smoothing method requires less data than more advanced
techniques but does not adjust for seasonality. More sophisticated methods (e.g.,
Winter’s smoothing) are needed if seasonality is present.
The Delphi technique is a method of making forecasts based on expert opinion.7
The Delphi technique is gradually becoming more important for predicting sales.8 Many
large corporations use this technique for long-range forecasting. This technique is based
upon the judgment of “experts.”
The Delphi approach was developed to deal with situations where experts are in
remote locations. The basic approach involves asking each individual to provide
forecasts. In round one, the experts are surveyed via questionnaire, and the results are
then summarized. In the second round, the respondents are given the same questionnaire,
along with a summary of the results from the first round. Results are once again
compiled and third round is conducted. This process of repeating rounds can be
continued until there is agreement between the experts.
With time series analysis, the forecaster uses the firm’s historical sales data to
attempt to discover a pattern or patterns in the firm’s sales over time. If a pattern is
found, it can be used to forecast sales. This forecasting method assumes that past sales
patterns will continue in the future. In an industry where entry barriers are low, firms
may enter more easily, as opposed to industries where entry barriers are high. With the
entry and exit of firms, the pattern of historical sales may not be an accurate predictor of
future sales.
In a time series analysis, a forecaster usually performs several types of analyses:
trend, seasonal, and random factor. Trend analysis focuses on annual sales data spanning
many years to determine if a general sales pattern can be observed. Seasonal analysis is
performed to ascertain if sales follow a pattern within a given year. For example, around
Christmas consumer goods have significantly higher sales than other times throughout
104
the year. With random factor analysis, the forecaster attempts to determine the impact of
environmental conditions on sales that are beyond the firm’s control. Hurricane Katrina
would be an example of an environmental factor that had a significant impact on the price
of gas. After performing each of these analyses, the forecaster combines the results to
develop the sales forecast.
Like time series analysis, regression analysis requires the use of historical sales
data. In regression analysis, the forecaster seeks to find a relationship between past sales
(the dependent variable) and one or more independent variables, such as population, per
capita income, or gross domestic product. Simple regression analysis uses one
independent variable, whereas multiple regression analysis includes two or more
independent variables. An accurate forecast depends on a specific relationship between
the dependent and independent variables. Regression analysis is not recommended when
faced with changing environmental conditions. An increase in unemployment, recession,
inflation, and advances in technology may change the relationship between the dependent
and independent variables over time. Changing industry conditions, such as the entry of
a large competitor (e.g. Microsoft entering the gaming industry) may also change the
relationship between dependent and independent variables. Because of changing
conditions, it is important to remember that forecasting sales should not be a specific
value. By developing a range, the firm can build in flexibility to accommodate broad sets
of conditions (e.g. firms exiting a specific segment).
Scenario analysis is a tool used to generate strategic alternatives based on
varying assumptions about the future. A scenario is a possible set of environmental
circumstances concerning what the environment may look like in the future. It depicts
potential actions and events in a likely order of occurrence, beginning with a set of
conditions that describe the current situation. Scenario analysis can factor in predicted
competitive actions.
Sales Forecasting and Capstone Simulation Table 5.1 summarizes the size market segment information. Section a of Table
5.1 identifies size and growth of the segment and the customer buying criteria. Within
the segment, positioning and age dominate the buying criteria. Re-positioning of existing
products is quite important because positioning is 43 percent of the customer buying
criteria. An additional benefit of repositioning is age is cut in half. Section a also
identifies the segment demand (4596 units) and the growth rate (18.3 percent) for the
current year. The actual units sold met the segment demand for this year. If the
competitors had not met the demand, actual units sold would be less than the total
industry demand (4596 units).
Section b of Table 5.1 summarizes the activity that has taken place within the
segment for the year. No products with significant market share sold out. Several
products were not positioned well (Egg, Buddy) and incurred significant inventory
carrying costs. This section of the table is very helpful because it provides a competitive
analysis on a product-by-product basis. This data is useful in decision-making for the
next round.
Section c is the production schedule. This portion of the table identifies the
production capacity on a product-by-product basis. A product’s production capacity
needs to be adjusted based upon inventory that was not sold from this year.
The three sections of this table allow for an analysis of decisions that need to be
made for the next year within the size segment from an R&D, marketing, and production
perspective. Let us begin with an estimation of sales.
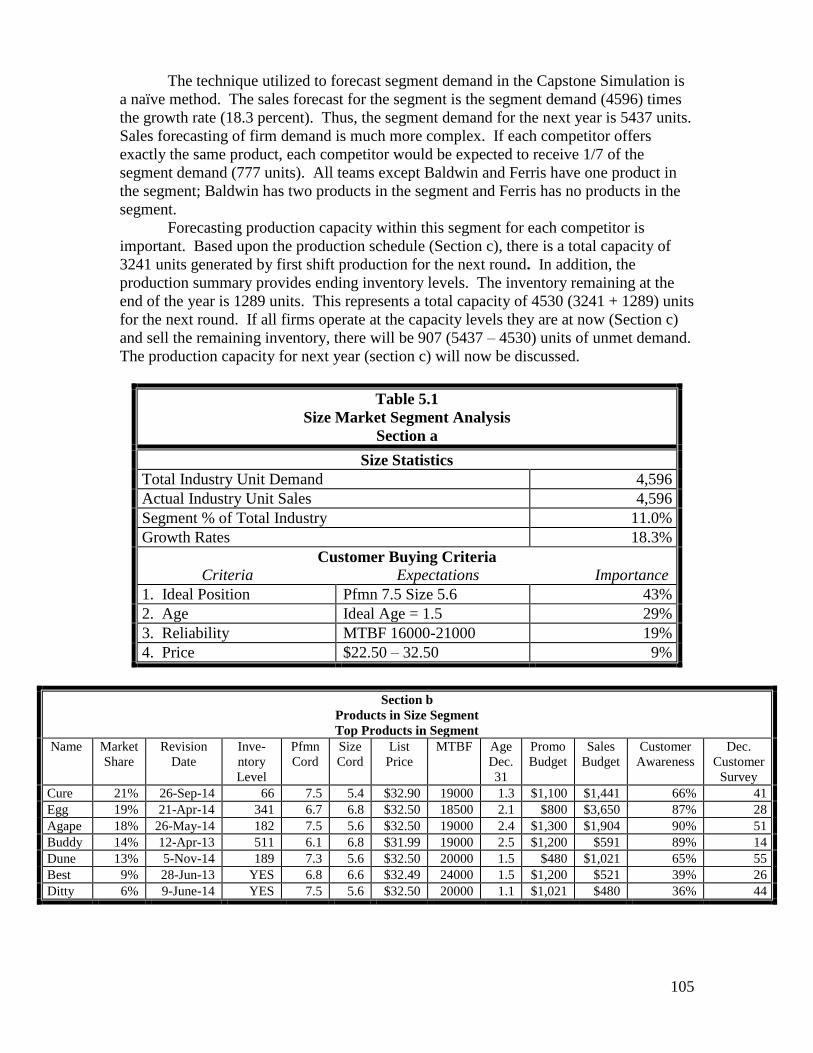
105
The technique utilized to forecast segment demand in the Capstone Simulation is
a naïve method. The sales forecast for the segment is the segment demand (4596) times
the growth rate (18.3 percent). Thus, the segment demand for the next year is 5437 units.
Sales forecasting of firm demand is much more complex. If each competitor offers
exactly the same product, each competitor would be expected to receive 1/7 of the
segment demand (777 units). All teams except Baldwin and Ferris have one product in
the segment; Baldwin has two products in the segment and Ferris has no products in the
segment.
Forecasting production capacity within this segment for each competitor is
important. Based upon the production schedule (Section c), there is a total capacity of
3241 units generated by first shift production for the next round. In addition, the
production summary provides ending inventory levels. The inventory remaining at the
end of the year is 1289 units. This represents a total capacity of 4530 (3241 + 1289) units
for the next round. If all firms operate at the capacity levels they are at now (Section c)
and sell the remaining inventory, there will be 907 (5437 – 4530) units of unmet demand.
The production capacity for next year (section c) will now be discussed.
Table 5.1
Size Market Segment Analysis
Section a
Size Statistics
Total Industry Unit Demand 4,596
Actual Industry Unit Sales 4,596
Segment % of Total Industry 11.0%
Growth Rates 18.3%
Customer Buying Criteria
Criteria Expectations Importance
1. Ideal Position Pfmn 7.5 Size 5.6 43%
2. Age Ideal Age = 1.5 29%
3. Reliability MTBF 16000-21000 19%
4. Price $22.50 – 32.50 9%
Section b
Products in Size Segment
Top Products in Segment
Name Market
Share
Revision
Date
Inve-
ntory
Level
Pfmn
Cord
Size
Cord
List
Price
MTBF Age
Dec.
31
Promo
Budget
Sales
Budget
Customer
Awareness
Dec.
Customer
Survey
Cure 21% 26-Sep-14 66 7.5 5.4 $32.90 19000 1.3 $1,100 $1,441 66% 41
Egg 19% 21-Apr-14 341 6.7 6.8 $32.50 18500 2.1 $800 $3,650 87% 28
Agape 18% 26-May-14 182 7.5 5.6 $32.50 19000 2.4 $1,300 $1,904 90% 51
Buddy 14% 12-Apr-13 511 6.1 6.8 $31.99 19000 2.5 $1,200 $591 89% 14
Dune 13% 5-Nov-14 189 7.3 5.6 $32.50 20000 1.5 $480 $1,021 65% 55
Best 9% 28-Jun-13 YES 6.8 6.6 $32.49 24000 1.5 $1,200 $521 39% 26
Ditty 6% 9-June-14 YES 7.5 5.6 $32.50 20000 1.1 $1,021 $480 36% 44
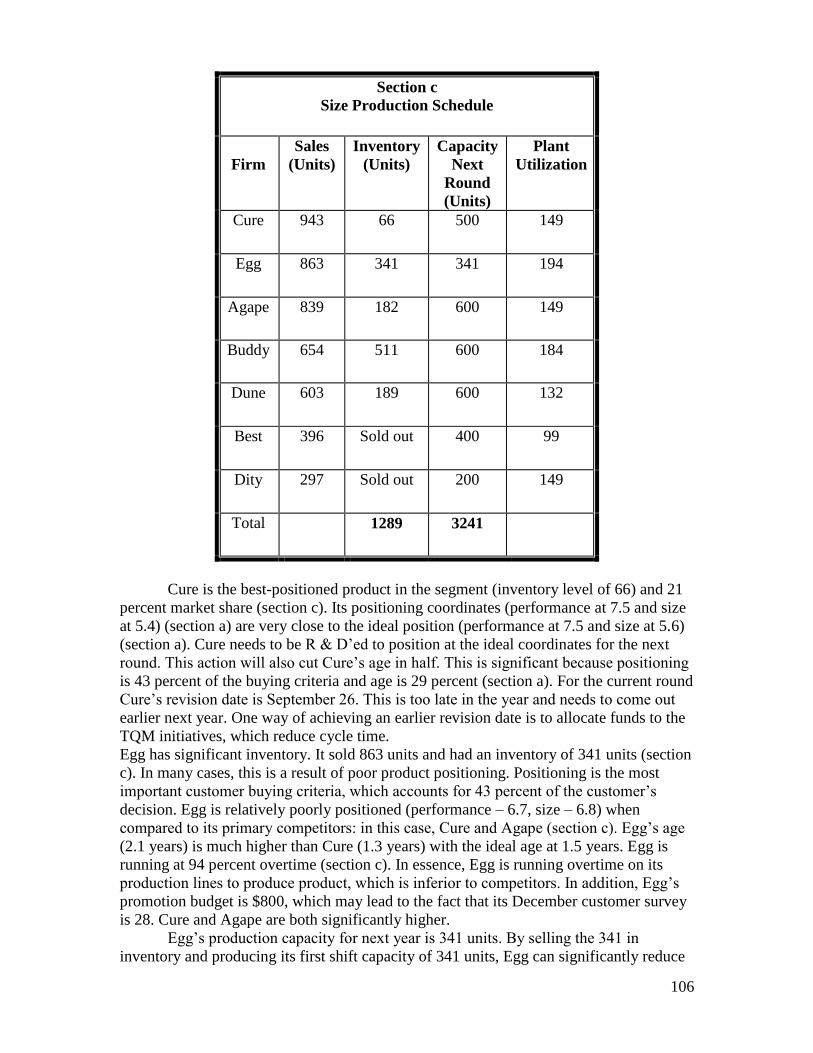
106
Section c
Size Production Schedule
Firm
Sales
(Units)
Inventory
(Units)
Capacity
Next
Round
(Units)
Plant
Utilization
Cure 943 66 500 149
Egg 863 341 341 194
Agape 839 182 600 149
Buddy 654 511 600 184
Dune 603 189 600 132
Best 396 Sold out 400 99
Dity 297 Sold out 200 149
Total 1289 3241
Cure is the best-positioned product in the segment (inventory level of 66) and 21
percent market share (section c). Its positioning coordinates (performance at 7.5 and size
at 5.4) (section a) are very close to the ideal position (performance at 7.5 and size at 5.6)
(section a). Cure needs to be R & D’ed to position at the ideal coordinates for the next
round. This action will also cut Cure’s age in half. This is significant because positioning
is 43 percent of the buying criteria and age is 29 percent (section a). For the current round
Cure’s revision date is September 26. This is too late in the year and needs to come out
earlier next year. One way of achieving an earlier revision date is to allocate funds to the
TQM initiatives, which reduce cycle time.
Egg has significant inventory. It sold 863 units and had an inventory of 341 units (section
c). In many cases, this is a result of poor product positioning. Positioning is the most
important customer buying criteria, which accounts for 43 percent of the customer’s
decision. Egg is relatively poorly positioned (performance – 6.7, size – 6.8) when
compared to its primary competitors: in this case, Cure and Agape (section c). Egg’s age
(2.1 years) is much higher than Cure (1.3 years) with the ideal age at 1.5 years. Egg is
running at 94 percent overtime (section c). In essence, Egg is running overtime on its
production lines to produce product, which is inferior to competitors. In addition, Egg’s
promotion budget is $800, which may lead to the fact that its December customer survey
is 28. Cure and Agape are both significantly higher.
Egg’s production capacity for next year is 341 units. By selling the 341 in
inventory and producing its first shift capacity of 341 units, Egg can significantly reduce
107
its inventory. Also, Egg needs to spend R&D to get closer to the ideal position for next
year.
Agape has made a commitment to be a major player in the industry. It sold 839
units and inventoried 182 units with production capacity of 600 units for next year.
Agape plans to stay as a major product in this segment. No firm has greater production
capacity planned for this segment. Buddy and Dune also have 600 units of capacity next
round. From a positioning perspective, Agape is right on the ideal point (Table 5.1
section a & b). It must R&D this product to remain on the ideal point for the next round
and cut its age in half. Its age (2.4 years) was a little high for this segment this year.
Buddy is in a difficult situation because it has made a significant commitment to
this segment (600 units of capacity for next round, section c) but has 511 units in
inventory (section c). This is the highest level of inventory experienced by any product in
the segment. Buddy has very poor product positioning. Its performance coordinate is 6.1
and its size coordinate is 6.8 (section b). The ideal position is performance at 7.5 and size
at 5.6.
Buddy is going to have to spend a significant amount of R&D to reposition the
product closer to the ideal position. Due to the extensive amount of R&D needed, Buddy
may have a late revision date. Buddy will have trouble selling product until this revision
date is reached. As such, investments in TQM to reduce R&D cycle time would be
required. In addition, Buddy is running at 84 percent overtime. In essence, it is paying
overtime to inventory product. Buddy may be better served to exit the segment and use
the funds for more profitable opportunities.
Dune is in a situation that is not optimal either. For the year, Dune sold 603 units
and inventoried 189 units. Dune is very near the optimal position coordinates (7.3 for
performance and 5.6 for size). However, this positioning was not obtained until
November 5 (section b). Virtually Dune’s entire inventory was accumulated prior to
November 4 (section b). Dune also is at the optimal age of 1.5. Dune and Cure have the
strongest products in the segment.
Dune has 600 units of capacity next year. It should sell as many products (1200
units) as it can by running a second shift at 100 percent. Dune should be able to sell all
1200 units at the top of the price range ($32.00 next round) and its entire inventory. Dune
should consider adding a second shift based upon segment growth rate of 18.3 percent. It
also needs to be pointed out that it has the highest December customer survey (55)
(section b).
Best needs to be discussed. Best only has a 9 percent market share. However, it is
not positioned well (performance 6.8, size 6.6) (section b). In addition, Best has an age of
1.5, which is the ideal age for the segment (section a). Its production capacity for next
year is 400 units. If Best is to grow its market share, it will need to invest in R&D to
reposition closer to the ideal position. In addition, its customer awareness is 39 percent
and its December customer survey is 26 (section b). Its investment in sales budget ($521
– section b) needs to be increased significantly.
Best’s plant utilization is 99 percent: as such, it is not incurring overtime. All
other products are incurring overtime in this segment. Best should maximize the
utilization of overtime. This action may give it a cost advantage within the segment. Best
is at the age of 1.5 years, Best has an advantage over all other products except Dune
(Dune is also at the ideal age (1.5 years) (section b).
Ditty is a very strong product in this segment. It is positioned at the ideal position
(performance 7.5, size 5.6) and its age is at 1.1. Ditty needs to run its production line at
100 percent overtime. Its December customer survey is 44: this is second highest within

108
the segment. Significant increases in the sales budget are needed. It is currently allocating
only $480 to its promotion budget. Table 5.2 provides an assessment of each product in
this segment and also provides recommendations on a product-by-product basis.
One issue that needs to be discussed is the relationship between increasing plant
capacity and overtime. The trade-off is as follows: overtime costs a 50 percent wage
premium. However, running a second shift may be more profitable. If the teams only
run first shift, it already has paid all of the period costs – things like depreciation, R&D,
promotion and sales budgets. But if period costs are already paid for, second shift only
has to pay for the 50% premium on the labor. In high growth markets, firms may need to
run at 200 percent capacity and add plant.
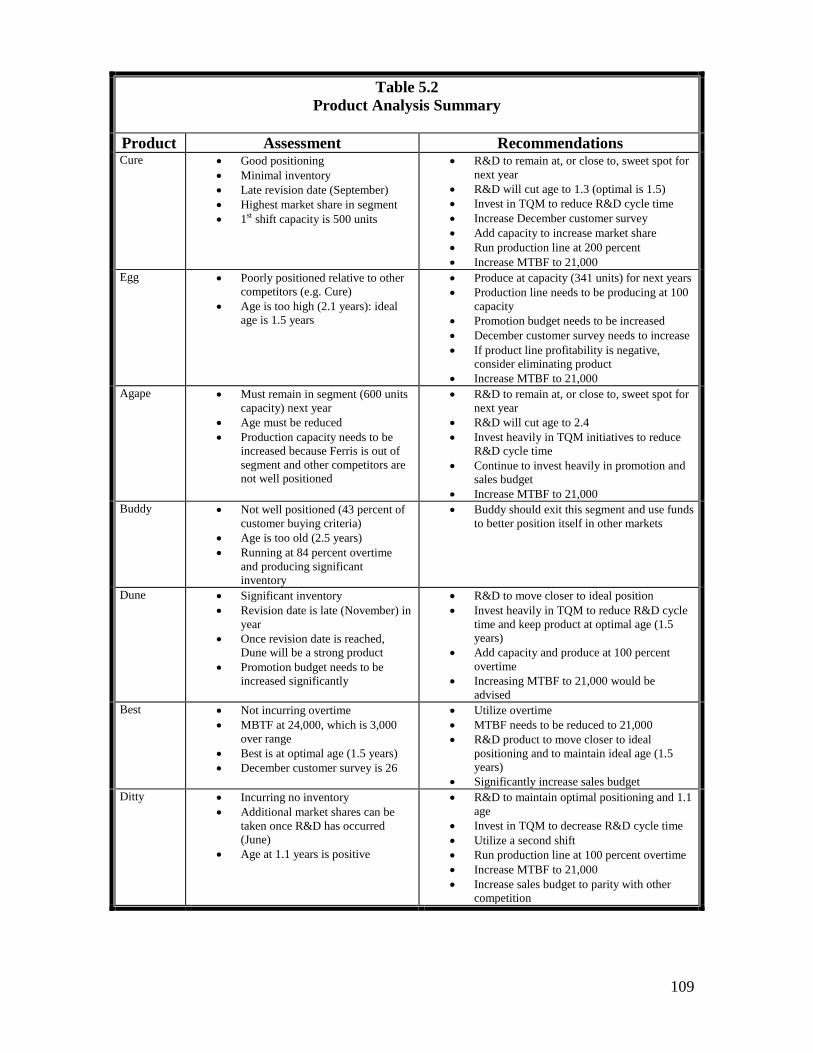
109
Table 5.2
Product Analysis Summary
Product Assessment Recommendations Cure Good positioning
Minimal inventory
Late revision date (September)
Highest market share in segment
1st shift capacity is 500 units
R&D to remain at, or close to, sweet spot for
next year
R&D will cut age to 1.3 (optimal is 1.5)
Invest in TQM to reduce R&D cycle time
Increase December customer survey
Add capacity to increase market share
Run production line at 200 percent
Increase MTBF to 21,000
Egg
Poorly positioned relative to other
competitors (e.g. Cure)
Age is too high (2.1 years): ideal
age is 1.5 years
Produce at capacity (341 units) for next years
Production line needs to be producing at 100
capacity
Promotion budget needs to be increased
December customer survey needs to increase
If product line profitability is negative,
consider eliminating product
Increase MTBF to 21,000
Agape Must remain in segment (600 units
capacity) next year
Age must be reduced
Production capacity needs to be
increased because Ferris is out of
segment and other competitors are
not well positioned
R&D to remain at, or close to, sweet spot for
next year
R&D will cut age to 2.4
Invest heavily in TQM initiatives to reduce
R&D cycle time
Continue to invest heavily in promotion and
sales budget
Increase MTBF to 21,000
Buddy Not well positioned (43 percent of
customer buying criteria)
Age is too old (2.5 years)
Running at 84 percent overtime
and producing significant
inventory
Buddy should exit this segment and use funds
to better position itself in other markets
Dune Significant inventory
Revision date is late (November) in
year
Once revision date is reached,
Dune will be a strong product
Promotion budget needs to be
increased significantly
R&D to move closer to ideal position
Invest heavily in TQM to reduce R&D cycle
time and keep product at optimal age (1.5
years)
Add capacity and produce at 100 percent
overtime
Increasing MTBF to 21,000 would be
advised
Best Not incurring overtime
MBTF at 24,000, which is 3,000
over range
Best is at optimal age (1.5 years)
December customer survey is 26
Utilize overtime
MTBF needs to be reduced to 21,000
R&D product to move closer to ideal
positioning and to maintain ideal age (1.5
years)
Significantly increase sales budget
Ditty Incurring no inventory
Additional market shares can be
taken once R&D has occurred
(June)
Age at 1.1 years is positive
R&D to maintain optimal positioning and 1.1
age
Invest in TQM to decrease R&D cycle time
Utilize a second shift
Run production line at 100 percent overtime
Increase MTBF to 21,000
Increase sales budget to parity with other
competition
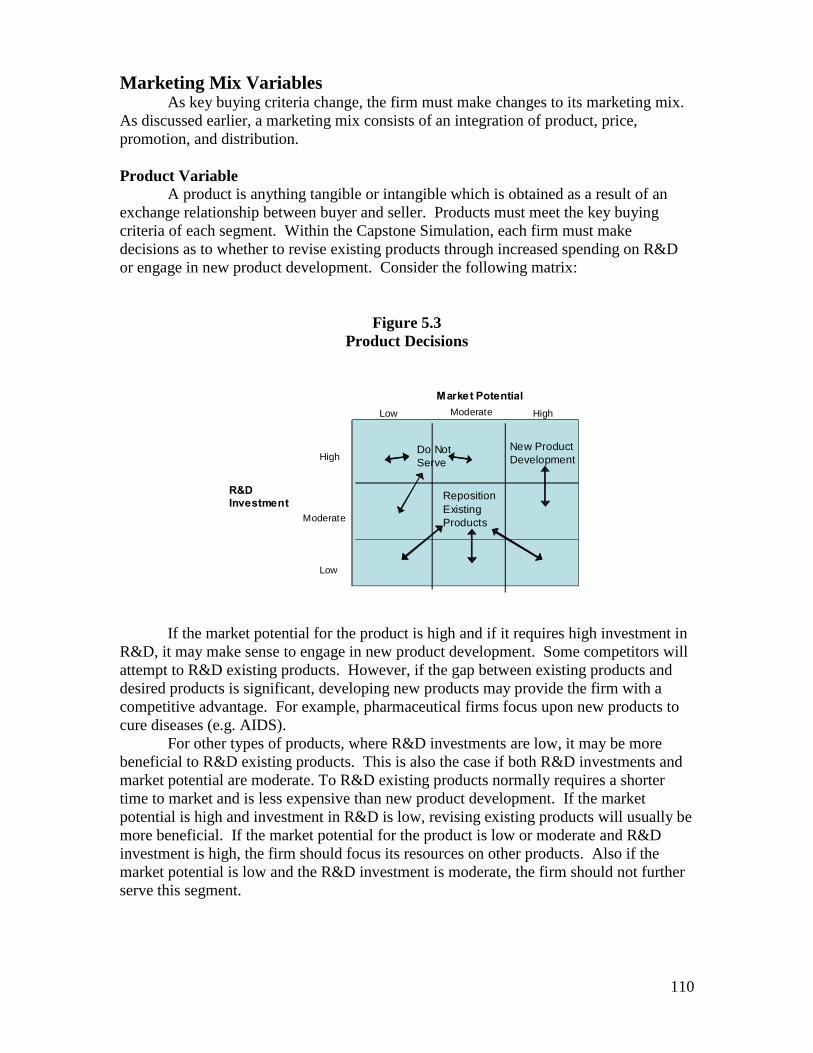
110
Marketing Mix Variables
As key buying criteria change, the firm must make changes to its marketing mix.
As discussed earlier, a marketing mix consists of an integration of product, price,
promotion, and distribution.
Product Variable
A product is anything tangible or intangible which is obtained as a result of an
exchange relationship between buyer and seller. Products must meet the key buying
criteria of each segment. Within the Capstone Simulation, each firm must make
decisions as to whether to revise existing products through increased spending on R&D
or engage in new product development. Consider the following matrix:
Figure 5.3
Product Decisions
If the market potential for the product is high and if it requires high investment in
R&D, it may make sense to engage in new product development. Some competitors will
attempt to R&D existing products. However, if the gap between existing products and
desired products is significant, developing new products may provide the firm with a
competitive advantage. For example, pharmaceutical firms focus upon new products to
cure diseases (e.g. AIDS).
For other types of products, where R&D investments are low, it may be more
beneficial to R&D existing products. This is also the case if both R&D investments and
market potential are moderate. To R&D existing products normally requires a shorter
time to market and is less expensive than new product development. If the market
potential is high and investment in R&D is low, revising existing products will usually be
more beneficial. If the market potential for the product is low or moderate and R&D
investment is high, the firm should focus its resources on other products. Also if the
market potential is low and the R&D investment is moderate, the firm should not further
serve this segment.
R&D
Investment
High
Moderate
Low
Low Moderate High
Do Not
Serve
Reposition
Existing
Products
New Product
Development
Market Potential
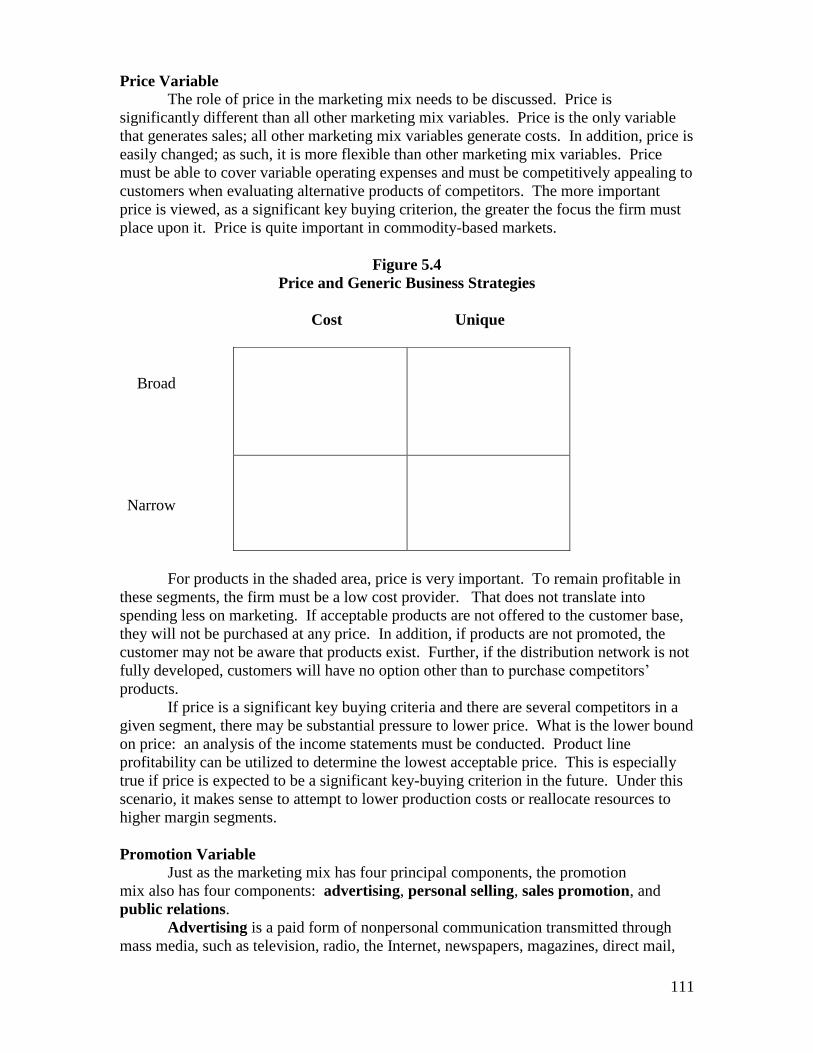
111
Price Variable
The role of price in the marketing mix needs to be discussed. Price is
significantly different than all other marketing mix variables. Price is the only variable
that generates sales; all other marketing mix variables generate costs. In addition, price is
easily changed; as such, it is more flexible than other marketing mix variables. Price
must be able to cover variable operating expenses and must be competitively appealing to
customers when evaluating alternative products of competitors. The more important
price is viewed, as a significant key buying criterion, the greater the focus the firm must
place upon it. Price is quite important in commodity-based markets.
Figure 5.4
Price and Generic Business Strategies
Cost Unique
For products in the shaded area, price is very important. To remain profitable in
these segments, the firm must be a low cost provider. That does not translate into
spending less on marketing. If acceptable products are not offered to the customer base,
they will not be purchased at any price. In addition, if products are not promoted, the
customer may not be aware that products exist. Further, if the distribution network is not
fully developed, customers will have no option other than to purchase competitors’
products.
If price is a significant key buying criteria and there are several competitors in a
given segment, there may be substantial pressure to lower price. What is the lower bound
on price: an analysis of the income statements must be conducted. Product line
profitability can be utilized to determine the lowest acceptable price. This is especially
true if price is expected to be a significant key-buying criterion in the future. Under this
scenario, it makes sense to attempt to lower production costs or reallocate resources to
higher margin segments.
Promotion Variable
Just as the marketing mix has four principal components, the promotion
mix also has four components: advertising, personal selling, sales promotion, and
public relations.
Advertising is a paid form of nonpersonal communication transmitted through
mass media, such as television, radio, the Internet, newspapers, magazines, direct mail,
Broad
Narrow
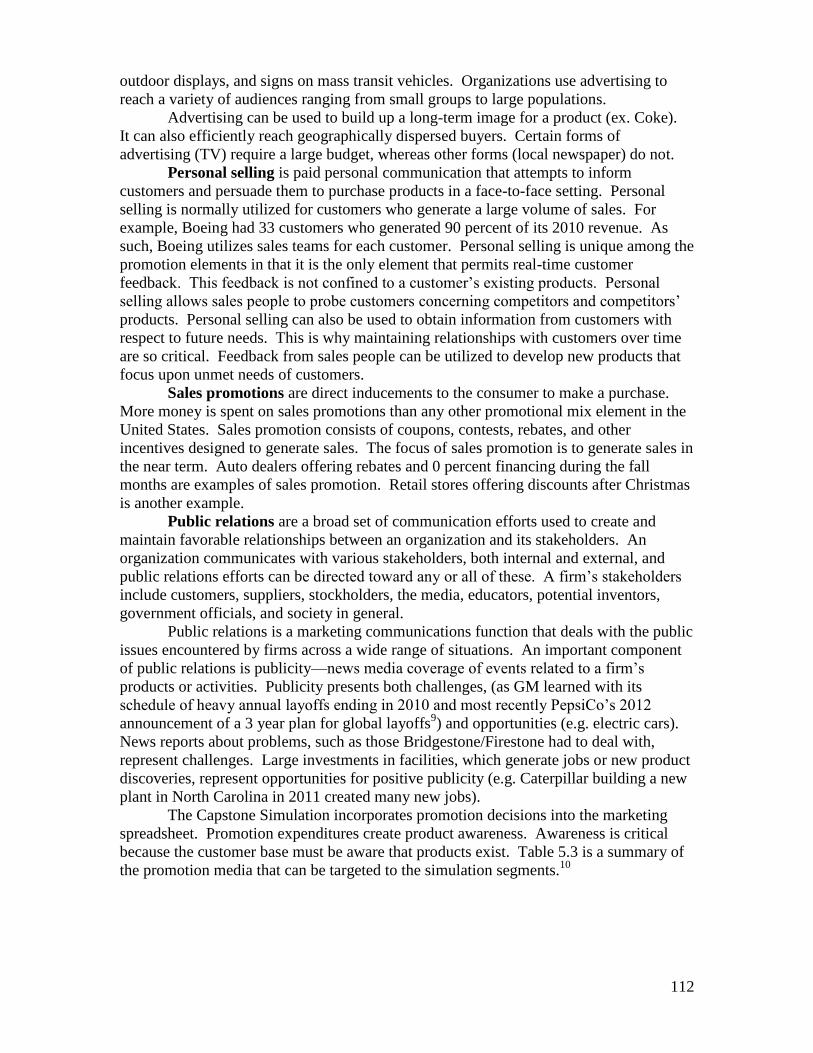
112
outdoor displays, and signs on mass transit vehicles. Organizations use advertising to
reach a variety of audiences ranging from small groups to large populations.
Advertising can be used to build up a long-term image for a product (ex. Coke).
It can also efficiently reach geographically dispersed buyers. Certain forms of
advertising (TV) require a large budget, whereas other forms (local newspaper) do not.
Personal selling is paid personal communication that attempts to inform
customers and persuade them to purchase products in a face-to-face setting. Personal
selling is normally utilized for customers who generate a large volume of sales. For
example, Boeing had 33 customers who generated 90 percent of its 2010 revenue. As
such, Boeing utilizes sales teams for each customer. Personal selling is unique among the
promotion elements in that it is the only element that permits real-time customer
feedback. This feedback is not confined to a customer’s existing products. Personal
selling allows sales people to probe customers concerning competitors and competitors’
products. Personal selling can also be used to obtain information from customers with
respect to future needs. This is why maintaining relationships with customers over time
are so critical. Feedback from sales people can be utilized to develop new products that
focus upon unmet needs of customers.
Sales promotions are direct inducements to the consumer to make a purchase.
More money is spent on sales promotions than any other promotional mix element in the
United States. Sales promotion consists of coupons, contests, rebates, and other
incentives designed to generate sales. The focus of sales promotion is to generate sales in
the near term. Auto dealers offering rebates and 0 percent financing during the fall
months are examples of sales promotion. Retail stores offering discounts after Christmas
is another example.
Public relations are a broad set of communication efforts used to create and
maintain favorable relationships between an organization and its stakeholders. An
organization communicates with various stakeholders, both internal and external, and
public relations efforts can be directed toward any or all of these. A firm’s stakeholders
include customers, suppliers, stockholders, the media, educators, potential inventors,
government officials, and society in general.
Public relations is a marketing communications function that deals with the public
issues encountered by firms across a wide range of situations. An important component
of public relations is publicity—news media coverage of events related to a firm’s
products or activities. Publicity presents both challenges, (as GM learned with its
schedule of heavy annual layoffs ending in 2010 and most recently PepsiCo’s 2012
announcement of a 3 year plan for global layoffs9) and opportunities (e.g. electric cars).
News reports about problems, such as those Bridgestone/Firestone had to deal with,
represent challenges. Large investments in facilities, which generate jobs or new product
discoveries, represent opportunities for positive publicity (e.g. Caterpillar building a new
plant in North Carolina in 2011 created many new jobs).
The Capstone Simulation incorporates promotion decisions into the marketing
spreadsheet. Promotion expenditures create product awareness. Awareness is critical
because the customer base must be aware that products exist. Table 5.3 is a summary of
the promotion media that can be targeted to the simulation segments.10
113
Table 5.3
Summary – Promotion Budget
SEGMENT PRINT
MEDIA
DIRECT
WEBMEDIA EMAIL TRADE
SHOWS
Traditional Good Good Poor Poor Fair
Low End Good Good Poor Poor Fair
High End Poor Fair Fair Fair Good
Performance Poor Poor Good Good Fair
Size Fair Poor Good Good Poor
Diminishing
Returns
Beyond
$700,000/
Product
$800,000
Product
$500,000/
Product
$600,000/
Product
$300,000/
Product
The key to successful promotion is to obtain maximum return on resources
expended. Table 5.3 clarifies the point at which diminishing returns will occur for the
various forms of sales promotions.
Benefits may also accrue by deploying sales force resources properly. A firm’s
inside sales force may economically maintain existing products. Firms, which pursue a
cost leadership strategy in price-sensitive segments, may not want to allocate additional
resources to the outside sales force. On the other hand, for segments that are based upon
differentiation, it may be beneficial to increase the outside sales force to communicate the
unique advantages of a firm’s new or repositioned products to the customer base.
Distribution Variable
Distribution refers to the channels by which goods are moved to customers.
Types of activities include order processing, inventory management, materials
handling, warehousing, and transportation. Planning an efficient physical distribution
system is crucial to developing an effective marketing strategy because it can decrease
costs and increase customer satisfaction. Speed of delivery, service, and dependability
are often as important to customers as price11
. An integrated distribution channel can
reduce cycle time: the time period from completion of manufacturing to delivery to
customers.
Order processing is the receipt and transmission of sales order information.
Computerized order processing provides a database for all supply chain members to
increase their productivity. When carried out quickly and accurately, order processing
contributes to customer satisfaction, decreases costs and cycle time, and increases profits.
Many companies use electronic data interchange (EDI) to integrate order processing with
production, inventory, accounting, and transportation. Within the supply chain, EDI
functions as an information system that links marketing channel members and
outsourcing firms together.
Inventory management involves having the right goods in stock to satisfy
customer demand without creating excessive inventory levels. Many firms utilize a Just
in Time (JIT) approach to inventory management. When using JIT, companies maintain
low inventory levels and purchase products and materials in small quantities whenever
they need them. Just In Time inventory management requires a high level of
coordination between producers and suppliers, but it eliminates waste and reduces
inventory costs significantly.12
114
Materials handling involves the physical handling of products. Efficient
procedures and techniques for materials handling minimizes inventory costs, reduces the
number of times a good is handled, improves customer service, and increases customer
satisfaction. Systems for packaging, labeling, loading, and movement must be
coordinated to maximize cost reduction and customer satisfaction. Organizations gain
considerable efficiencies in materials handling through the use of technologically
advanced electronic equipment.
Warehousing represents the storage of goods before shipment to consumers.
Over the past 20 years, warehousing has been radically transformed. The warehouses of
today are single story facilities that are operated by computer systems. These systems are
based upon heavy utilization of robotics. The use of robotics tends to reduce costs and
create greater efficiencies.
Transportation represents the physical movement of goods. This is the most
expensive aspect of distribution. The various modes of transportation include truck, rail,
barge, air, ocean shipping, and pipelines. The choice of mode is dependent upon the
service requirements of the customer and type of shipment that is being transported.
Recently, transportation firms have become multi-modal carriers. Multi-modal carriers
utilize more than one mode (e.g. rail, trucking) for transportation of products. Union
Pacific, a major U.S. railroad, has strategic alliances with trucking firms, airfreight
forwarders, ocean shipping firms, and international railroads.13
The success of a firm’s distribution function depends upon the degree to which all
aspects are integrated. An integrated network provides for an efficient system that meets
customer needs better than competitors.
Within the Capstone Simulation, increasing the number of distributors increases
the firm’s network to provide for an efficient network to meet consumer demand. Each
distributor costs $100,000 with diminishing returns beyond 50. The TQM (total quality
management) module of the simulation also captures distribution elements. Channel
Support Systems increase demand by adding valuable tools for the sales force. Just in
Time (JIT) and Continuous Process Improvement (CPI) tend to reduce costs associated
with distribution.
115
Discussion Questions
1. Explain why it is necessary to segment markets. What happens to firms if they do
not?
2. Why is it important to sustain relationships with customers over time?
3. What are the ramifications of sales forecasts that are too high? Too low? Explain
using the Capstone Simulation.
4. Explain the fundamental relationship between key buying criteria, competition,
and your Capstone firm.
5. Using the Capstone Simulation, explain when new product development is
recommended versus R&D of existing products.
6. From the perspective of the simulation, what determines customer awareness?
Infrastructure?
7. Identify market segments within an industry of your choice. Identify the key
buying criteria of each segment.
8. What method of forecasting does the simulation utilize? Explain.
9. Assume your firm is entering a new market segment. What approach is
recommended for forecasting sales?
10. What are the primary weaknesses of using perceptual mapping?
116
References
1. Kotler P. 2003. Marketing management. Prentice-Hall: Upper Saddle River,
N.J.
2. Jain S. 2004. Marketing planning and strategy. Thomson: Mason, Ohio.
3. Pettus M. 2003. Growth from chaos. Praeger: Westport, Ct.
4. Fransman, Martin, Evolution of the Telecommunications Industry Into the
Internet Age, 03/25/12,
http://www.telecomvisions.com/articles/pdf/FransmanTelecomsHistory.pdf
5. Ibid
6. Apple.com, 2012
7. Sudharshan D. 1998. Marketing strategy. Prentice-Hall. Upper Sale River, NJ
8. Ibid
9. Rueters, 02/09/2012, The New York Times, 03/25/2012
http://www.nytimes.com/2012/02/10/business/pepsico-to-cut-8700-jobs-in-a-
revamping.html?_r=1&ref=indraknooyi
10. Ibid
11. _____ 2010. Marketing Module. Capstone simulation.
12. Lambert, D. and Stock, J. 1994. Strategic logistic management. McGraw-Hill
Irwin. Boston, MA.
13. Pettus, 2003
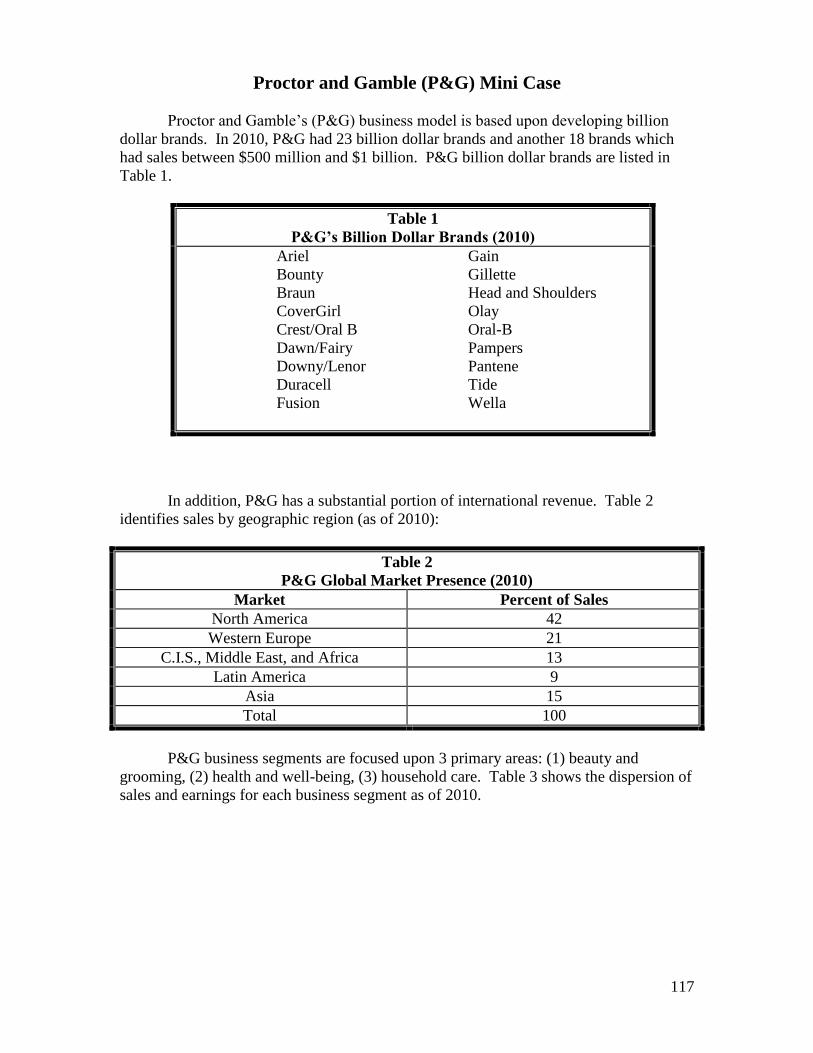
117
Proctor and Gamble (P&G) Mini Case
Proctor and Gamble’s (P&G) business model is based upon developing billion
dollar brands. In 2010, P&G had 23 billion dollar brands and another 18 brands which
had sales between $500 million and $1 billion. P&G billion dollar brands are listed in
Table 1.
Table 1
P&G’s Billion Dollar Brands (2010)
Ariel Gain
Bounty Gillette
Braun Head and Shoulders
CoverGirl Olay
Crest/Oral B Oral-B
Dawn/Fairy Pampers
Downy/Lenor Pantene
Duracell Tide
Fusion Wella
In addition, P&G has a substantial portion of international revenue. Table 2
identifies sales by geographic region (as of 2010):
Table 2
P&G Global Market Presence (2010)
Market Percent of Sales
North America 42
Western Europe 21
C.I.S., Middle East, and Africa 13
Latin America 9
Asia 15
Total 100
P&G business segments are focused upon 3 primary areas: (1) beauty and
grooming, (2) health and well-being, (3) household care. Table 3 shows the dispersion of
sales and earnings for each business segment as of 2010.
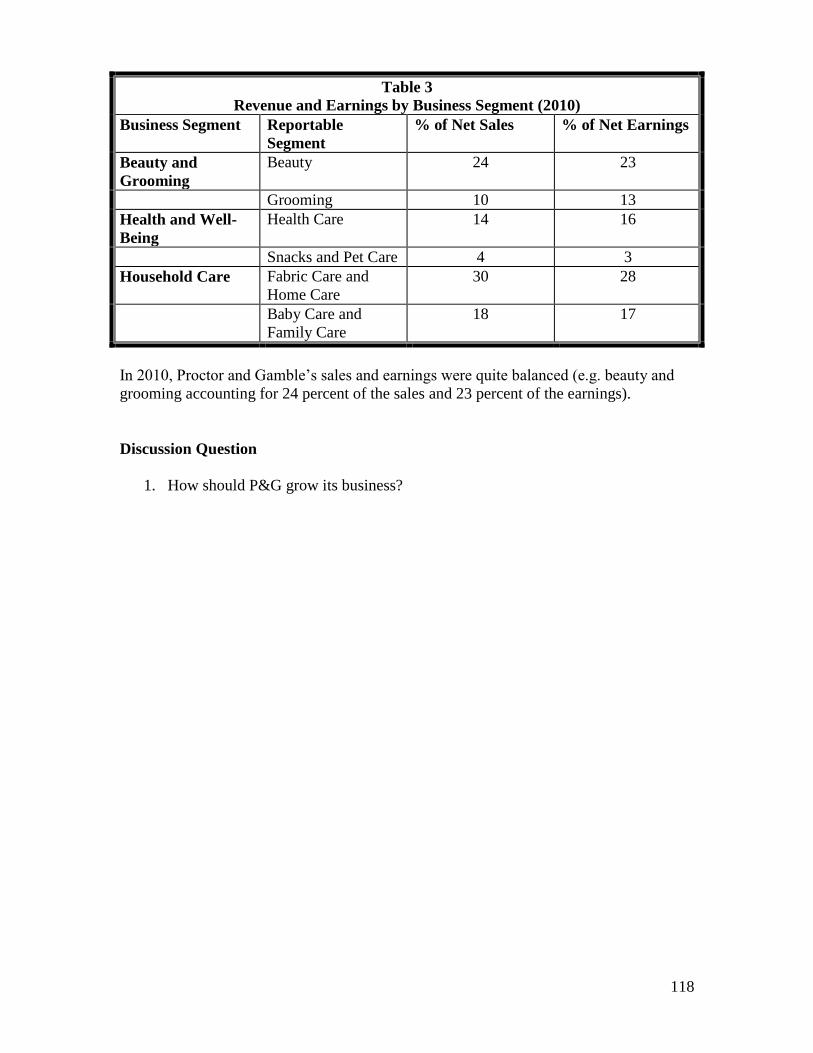
118
Table 3
Revenue and Earnings by Business Segment (2010)
Business Segment Reportable
Segment
% of Net Sales % of Net Earnings
Beauty and
Grooming
Beauty 24 23
Grooming 10 13
Health and Well-
Being
Health Care 14 16
Snacks and Pet Care 4 3
Household Care Fabric Care and
Home Care
30 28
Baby Care and
Family Care
18 17
In 2010, Proctor and Gamble’s sales and earnings were quite balanced (e.g. beauty and
grooming accounting for 24 percent of the sales and 23 percent of the earnings).
Discussion Question
1. How should P&G grow its business?
119
Harvard Business Cases for Chapter 5
The NFL’s Digital Media Strategy
Product Number 511055
Yum! China
Product Number 511040
Professor Case for Chapter 5
JetBlue

120

121
Chapter 6
Growth by Internal Development

122
Learning and Assessment Goals
1. Understand how a firm can grow using internal development.
2. Understand when a firm should grow by internal development as opposed to
acquisitions or strategic alliances.
3. Understand how a firm can identify new markets and develop products/services to
meet these new markets.
4. Understand the role of competition as it impacts a firm’s internal development
decisions.
5. Determine how to allocate resources to maximize opportunities for internal
development.
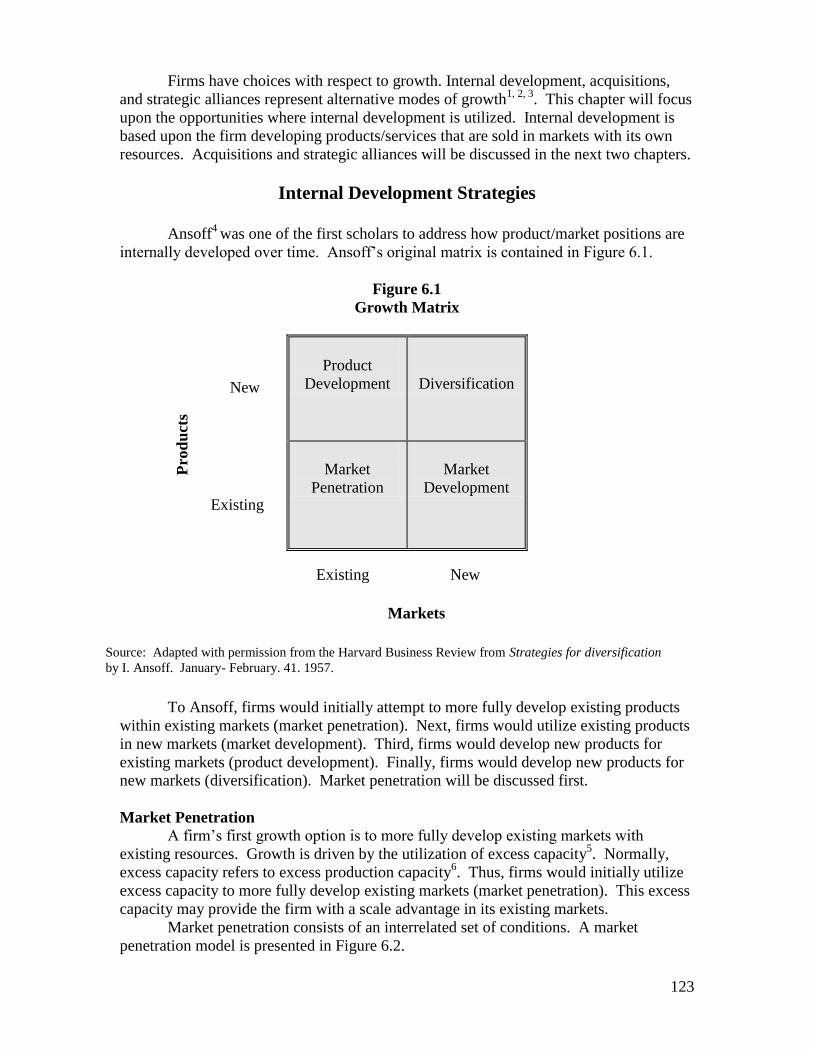
123
Firms have choices with respect to growth. Internal development, acquisitions,
and strategic alliances represent alternative modes of growth1, 2, 3
. This chapter will focus
upon the opportunities where internal development is utilized. Internal development is
based upon the firm developing products/services that are sold in markets with its own
resources. Acquisitions and strategic alliances will be discussed in the next two chapters.
Internal Development Strategies
Ansoff
4 was one of the first scholars to address how product/market positions are
internally developed over time. Ansoff’s original matrix is contained in Figure 6.1.
Figure 6.1
Growth Matrix
Product
Development
Diversification
Market
Penetration
Market
Development
To Ansoff, firms would initially attempt to more fully develop existing products
within existing markets (market penetration). Next, firms would utilize existing products
in new markets (market development). Third, firms would develop new products for
existing markets (product development). Finally, firms would develop new products for
new markets (diversification). Market penetration will be discussed first.
Market Penetration
A firm’s first growth option is to more fully develop existing markets with
existing resources. Growth is driven by the utilization of excess capacity5. Normally,
excess capacity refers to excess production capacity6. Thus, firms would initially utilize
excess capacity to more fully develop existing markets (market penetration). This excess
capacity may provide the firm with a scale advantage in its existing markets.
Market penetration consists of an interrelated set of conditions. A market
penetration model is presented in Figure 6.2.
New
Existing
Pro
du
cts
Existing New
Markets
Source: Adapted with permission from the Harvard Business Review from Strategies for diversification
by I. Ansoff. January- February. 41. 1957.
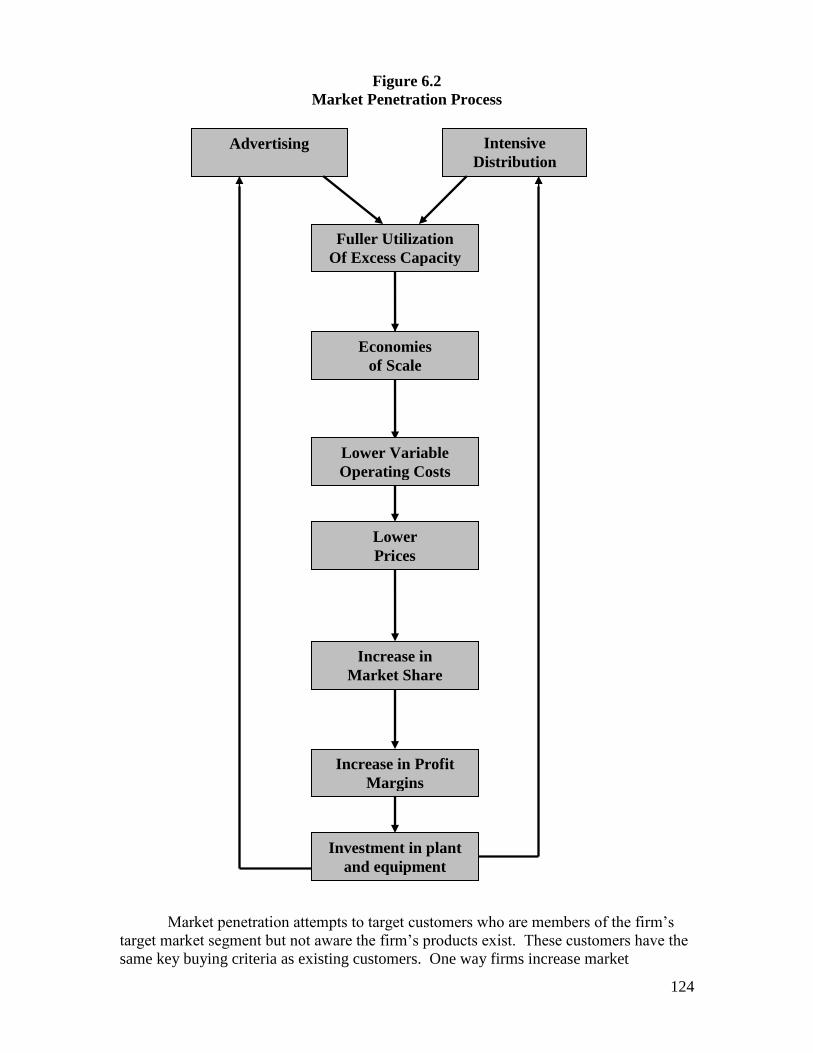
124
Figure 6.2
Market Penetration Process
Market penetration attempts to target customers who are members of the firm’s
target market segment but not aware the firm’s products exist. These customers have the
same key buying criteria as existing customers. One way firms increase market
Advertising Intensive
Distribution
Fuller Utilization
Of Excess Capacity
Economies
of Scale
Lower
Prices
Increase in
Market Share
Lower Variable
Operating Costs
Investment in plant
and equipment
Increase in Profit
Margins
125
penetration is to advertise. Advertising communicates the potential advantages of a good
or service to customers who may be unaware that these products/services exist. This is
one reason why billions of dollars are spent on advertising existing products. Another
way of developing greater market penetration for a firm’s existing products is through
more intensive distribution. Intensive distribution is used when firms utilize multiple
channels to provide easily accessible products to consumers. Coke is an example of a
firm that utilizes intensive distribution.
The primary focus of market penetration is increasing the size of a firm’s existing
market segment. Firms will more fully utilize production facilities to achieve economies
of scale. One reason economies of scale are generated is because of experience curve
effects. Experience curve effects allow firms to “learn by doing”7. As firms gain
experience, processes can be more finely tuned to generate substantial variable cost
savings. As cost savings are generated, firms may pass these savings along to consumers
in the form of lower prices. For price sensitive markets, decreases in price may result in
an increase in market share. As firms obtain additional market share, variable costs may
be reduced and profit margins increased. Higher margins may result in additional funds
to increase production facilities via investment in plant capacity.
The cycle then repeats: the additional production capacity that is purchased may
not be totally utilized. As such, the firm will engage in advertising to further increase
market share. As the firm more fully develops its distribution infrastructure, the products
become more accessible and excess capacity is more fully utilized. This process results
in greater economies of scale. The firm then lowers price to achieve greater market share
and lower variable costs. As profit margins increase, the funds are utilized to purchase
more plant and equipment. The cycle then repeats indefinitely. As shown in Figure 6.2,
this process will provide the firm with a continuous scale advantage within existing
markets.
Market Development
After the firm has fully developed its products in one market, firms can enter new
markets from a position of strength8. As domestic markets become more mature, firms
expand into international markets to generate growth. As firms expand into additional
markets, they can begin to generate global economies of scale. After Gillette fully
developed the United States market, it developed positions in many international markets
for razors and blades. Initially, Coors was a beer that was distributed in the Rocky
Mountain States. Coors now has substantial international market presence.
In general, the more related the new market is to the firm’s core market, the
greater the firm can reduce entry costs by internal development. After United Parcel
Service (UPS) had fully developed its ground infrastructure within the United States, it
expanded into Europe. Initially, UPS expanded into Europe via direct investment rather
than by acquisition. This decision looked to be based on the understanding that
acquisitions may not be wise because they are likely to entail the purchase of redundant
assets9. Walmart would be an example of a firm which has grown internationally via
market development. In addition, the Harry Potter books and movies have been
translated into over 70 languages. Additionally, over 135 million individuals have seen
“The Phantom of the Opera”.10
The key is to grow into those markets that demand a
firm’s existing products.
As firms establish positions in international markets, they may begin production
in these markets. In this way, firms eliminate the additional costs associated with
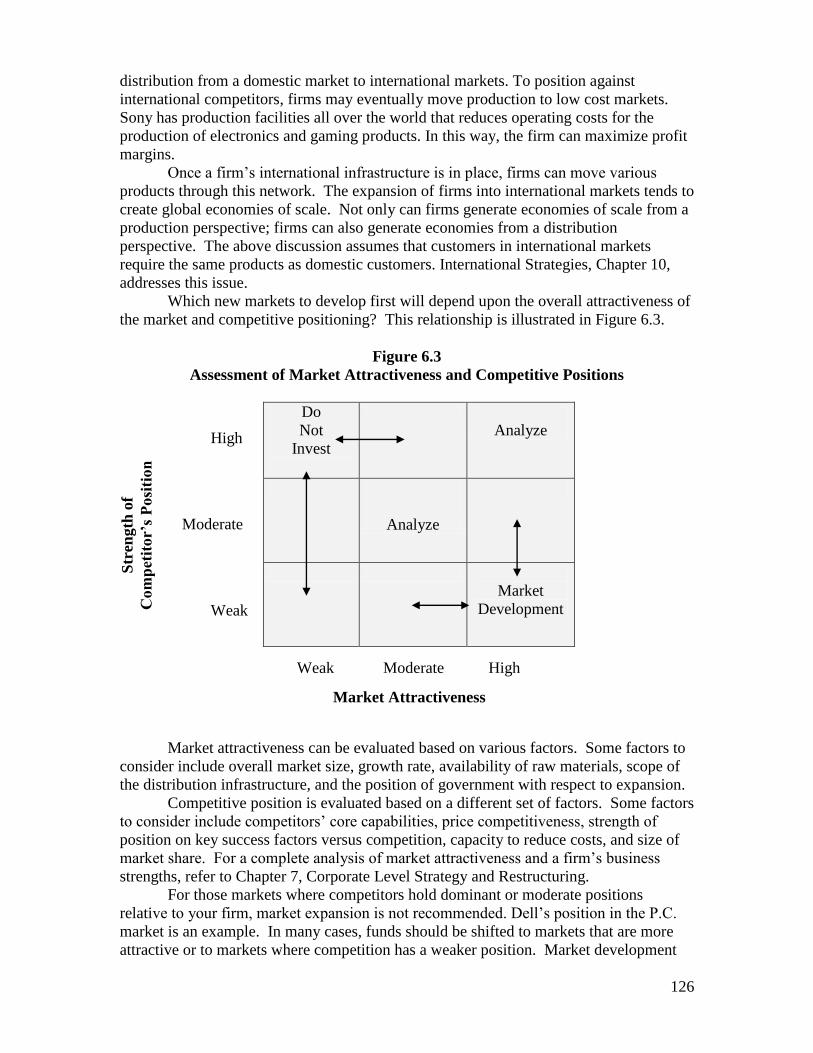
126
distribution from a domestic market to international markets. To position against
international competitors, firms may eventually move production to low cost markets.
Sony has production facilities all over the world that reduces operating costs for the
production of electronics and gaming products. In this way, the firm can maximize profit
margins.
Once a firm’s international infrastructure is in place, firms can move various
products through this network. The expansion of firms into international markets tends to
create global economies of scale. Not only can firms generate economies of scale from a
production perspective; firms can also generate economies from a distribution
perspective. The above discussion assumes that customers in international markets
require the same products as domestic customers. International Strategies, Chapter 10,
addresses this issue.
Which new markets to develop first will depend upon the overall attractiveness of
the market and competitive positioning? This relationship is illustrated in Figure 6.3.
Figure 6.3
Assessment of Market Attractiveness and Competitive Positions
Do
Not
Invest
Analyze
Analyze
Market
Development
Market attractiveness can be evaluated based on various factors. Some factors to
consider include overall market size, growth rate, availability of raw materials, scope of
the distribution infrastructure, and the position of government with respect to expansion.
Competitive position is evaluated based on a different set of factors. Some factors
to consider include competitors’ core capabilities, price competitiveness, strength of
position on key success factors versus competition, capacity to reduce costs, and size of
market share. For a complete analysis of market attractiveness and a firm’s business
strengths, refer to Chapter 7, Corporate Level Strategy and Restructuring.
For those markets where competitors hold dominant or moderate positions
relative to your firm, market expansion is not recommended. Dell’s position in the P.C.
market is an example. In many cases, funds should be shifted to markets that are more
attractive or to markets where competition has a weaker position. Market development
High
Weak
Weak Moderate High
Market Attractiveness
Str
ength
of
Com
pet
itor’s
Posi
tion
Moderate
127
should be analyzed in highly attractive markets where competition is strong. Microsoft’s
entry into the gaming industry would be an example.
For unattractive markets, the firm should expand elsewhere. For example, the
low-end retail market in the U.S. is dominated by Wal-Mart. For markets that are
moderately attractive and have a moderate degree of competition, the firm should
analyze. Entry into the health conscious fast food market is an example.
Market development should be undertaken if the markets are highly attractive and
competitors do not have a strong position. Gillette’s expansion into Japan would be an
example. Levi’s expansion into markets such as India, which has an emerging middle
class, would be another example. With Apple’s iPhone and iPad series of products, the
company’s overall industry dominance is common knowledge. This current market
presence provides the best example of having the ability to focus on market development
within the emerging markets as the competition in these areas would be considered weak
to moderate at best. For markets which are moderately attractive and in which
competitors have a weaker position relative to your firm, market development should
occur. FedEx’s expansion of its air network is an example.
Product Development
After a firm has fully developed its markets, the firm will develop new products
for existing customers11
. New products are necessary for achieving longer-term
competitive advantage. These products may add value to existing products. Intel’s
improvements in chip technology increase the capabilities of PC’s and cell phones.
Multi-player social gaming using such software as PlayPhone, with devices including the
Android and iOS12
, appears to be the next generation of gaming
As new product features are integrated into existing products, the firm creates
new sources of value. The cell phone can now be utilized to store data, take pictures,
provide access to the Internet, and transmit video. As such, these cell phones incorporate
new products that add value to the existing cell phones. These new products provide
new, value added benefits to customers. The development of ethanol as an alternative
fuel source is another example. New processes can also be developed to manufacture
new products.
One type of process is flexible manufacturing facilities. Because consumers have
different needs, flexible manufacturing helps to reduce the time and expense of
assembling new products. Automotive and motorcycle manufacturers utilize a great deal
of flexible manufacturing. Because these processes are specific to a firm, these assets are
developed via internal development. By internally developing new processes, the firm
can begin to build a barrier to entry for competitors.
Product development can also be utilized to meet emerging consumer needs.
After the trucking industry was deregulated in 1980, firms began to develop information
systems to track shipments in transit. These systems improved the capability of the firm
to meet emerging customer needs. The utilization of robots in assembly lines is a process
that reduces costs and improves product consistency. By the firm internally developing
products and processes, the firm does not need to engage in costly acquisitions or risk
technology transfer that may occur with strategic alliances.
The degree to which products need to be changed will determine whether a
product is improved or a new product should be developed. This decision is based upon
R&D expenditures and the profitability of the product line. Figure 6.4 illustrates this
relationship.
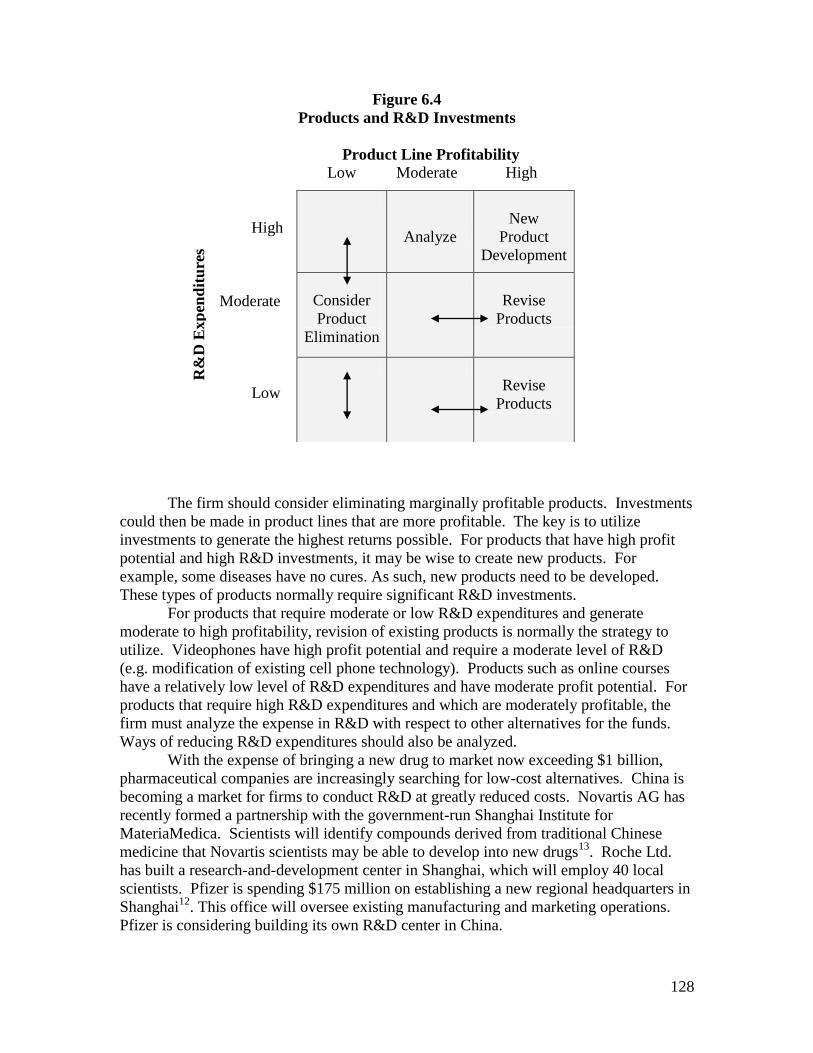
128
Figure 6.4
Products and R&D Investments
Product Line Profitability
Low Moderate High
High
Moderate
Low
The firm should consider eliminating marginally profitable products. Investments
could then be made in product lines that are more profitable. The key is to utilize
investments to generate the highest returns possible. For products that have high profit
potential and high R&D investments, it may be wise to create new products. For
example, some diseases have no cures. As such, new products need to be developed.
These types of products normally require significant R&D investments.
For products that require moderate or low R&D expenditures and generate
moderate to high profitability, revision of existing products is normally the strategy to
utilize. Videophones have high profit potential and require a moderate level of R&D
(e.g. modification of existing cell phone technology). Products such as online courses
have a relatively low level of R&D expenditures and have moderate profit potential. For
products that require high R&D expenditures and which are moderately profitable, the
firm must analyze the expense in R&D with respect to other alternatives for the funds.
Ways of reducing R&D expenditures should also be analyzed.
With the expense of bringing a new drug to market now exceeding $1 billion,
pharmaceutical companies are increasingly searching for low-cost alternatives. China is
becoming a market for firms to conduct R&D at greatly reduced costs. Novartis AG has
recently formed a partnership with the government-run Shanghai Institute for
MateriaMedica. Scientists will identify compounds derived from traditional Chinese
medicine that Novartis scientists may be able to develop into new drugs13
. Roche Ltd.
has built a research-and-development center in Shanghai, which will employ 40 local
scientists. Pfizer is spending $175 million on establishing a new regional headquarters in
Shanghai12
. This office will oversee existing manufacturing and marketing operations.
Pfizer is considering building its own R&D center in China.
Analyze
New
Product
Development
Consider
Product
Elimination
Revise
Products
Revise
Products
R&
D E
xp
end
itu
res
129
Firms can hire lower cost Chinese scientists because about 80% of pharmaceutical
R&D costs go toward scientists’ salaries14
. The key point is to utilize R&D investments
to maximize the returns on revised or new products.
New product development means that the firm must innovate. Innovation is
crucial for firm growth. Innovation may be the only true source of differentiation that
can distinguish one firm from another. The rapid change and diffusion of new
technology, along with substantial competition in domestic and international markets, has
placed increasing importance on firms’ ability to innovate and to introduce new
innovations into the marketplace. In fact, innovation may be required to maintain or
achieve competitive parity in many global markets15
. Innovation (whether developed
internally or acquired) is a source of value creation and competitive advantage for
individual firms16
. However, learning how to manage the research and development
activities that permit innovation on a global scale is challenging17
.
Thus, in both domestic and international economies, innovation increasingly is
recognized as a key link to the firm’s strategic competitiveness18
. Moreover, because it
challenges the firm to be continuously devoted to strong product lines and taking actions
that will cause the goods in those lines to be improved constantly, innovation is a factor
that differentiates companies from competitors19
. Although difficult and challenging,
effective innovation is a critical part of the skill set that firms need to participate
successfully in markets. Evidence of a relationship between high innovative propensity
and sustained superior profitability for U.S. pharmaceutical companies can be interpreted
as fairly strong support of the decision to allocate resources to innovation20
.
If pharmaceutical firms do not innovate, they do not stay in business. Eli Lilly &
Co. is ready to launch Prasugres, an anti-clotting drug designed to prevent recurring heart
attack and strokes21
. Novartis and other pharmaceutical firms are looking to
genemapping to develop new drugs and vaccines because bestsellers like Dicvan (the
market leader) and Zometa are coming off patent protection soon22
.
Diversification
To Ansoff, diversification resulted from the development of new products utilized
in new markets. This definition differs from the classical use of the term diversification.
Diversification is a corporate level strategy concept. Corporate level strategy is discussed
in Chapter 7. Ansoff uses the term from a business level strategy perspective. A simple
way to understand this concept is to view it as combining market development with
product development. By utilizing new products in new markets, the firm can increase its
growth. An assumption is applied using this logic: it assumes that new products can be
sold in new markets. In other words, products are standardized across markets. In many
countries, product adaptation is required. This issue is more fully developed in Chapter
10, International Strategies. Whether firms use market penetration, market development,
product development, and/or diversification, competition must be evaluated.
Competition For the most part, the growth decisions that have been discussed have not factored
in competition. Decisions that respond to competitor’s actions (e.g. new products) are
required. Products must meet the customer’s key buying criteria superior to competition.
As customers’ needs change, firms need to develop new products or re-position existing
products to maintain competitive superiority. If they don’t, they may lose market share.
Firms can be successful as second movers but they need to respond before the
first mover has an established customer base. If your firm can anticipate competitors’
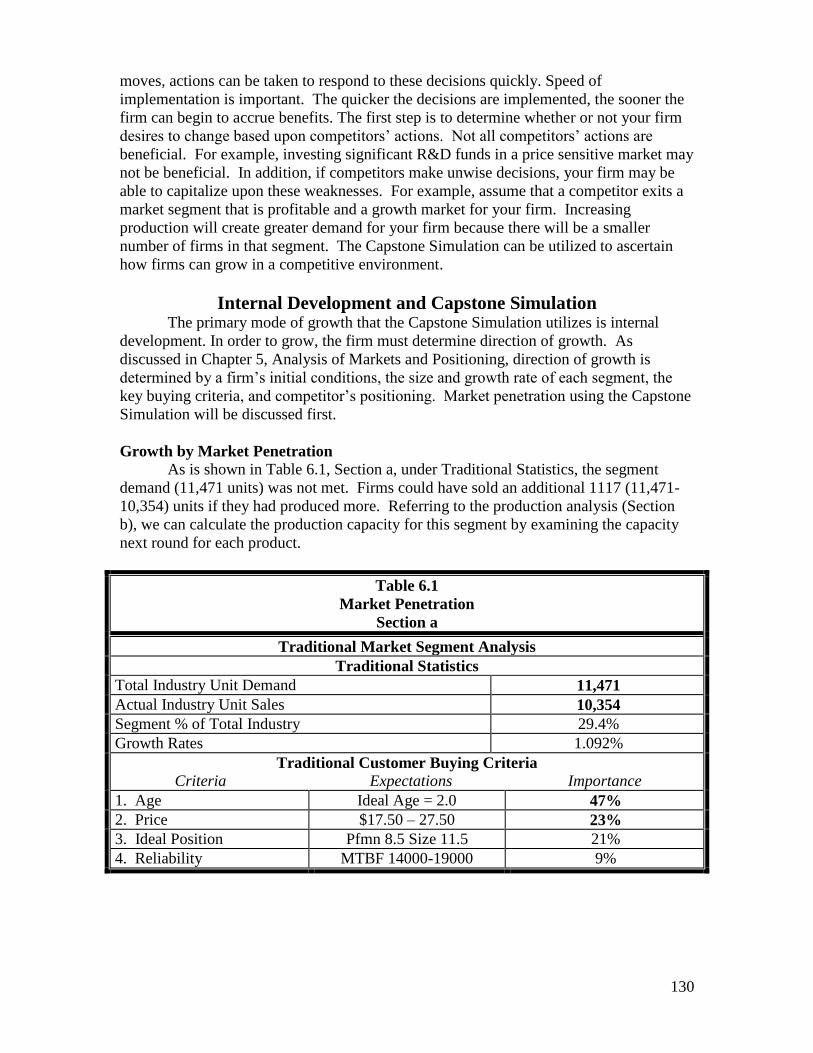
130
moves, actions can be taken to respond to these decisions quickly. Speed of
implementation is important. The quicker the decisions are implemented, the sooner the
firm can begin to accrue benefits. The first step is to determine whether or not your firm
desires to change based upon competitors’ actions. Not all competitors’ actions are
beneficial. For example, investing significant R&D funds in a price sensitive market may
not be beneficial. In addition, if competitors make unwise decisions, your firm may be
able to capitalize upon these weaknesses. For example, assume that a competitor exits a
market segment that is profitable and a growth market for your firm. Increasing
production will create greater demand for your firm because there will be a smaller
number of firms in that segment. The Capstone Simulation can be utilized to ascertain
how firms can grow in a competitive environment.
Internal Development and Capstone Simulation The primary mode of growth that the Capstone Simulation utilizes is internal
development. In order to grow, the firm must determine direction of growth. As
discussed in Chapter 5, Analysis of Markets and Positioning, direction of growth is
determined by a firm’s initial conditions, the size and growth rate of each segment, the
key buying criteria, and competitor’s positioning. Market penetration using the Capstone
Simulation will be discussed first.
Growth by Market Penetration
As is shown in Table 6.1, Section a, under Traditional Statistics, the segment
demand (11,471 units) was not met. Firms could have sold an additional 1117 (11,471-
10,354) units if they had produced more. Referring to the production analysis (Section
b), we can calculate the production capacity for this segment by examining the capacity
next round for each product.
Table 6.1
Market Penetration
Section a
Traditional Market Segment Analysis
Traditional Statistics
Total Industry Unit Demand 11,471
Actual Industry Unit Sales 10,354
Segment % of Total Industry 29.4%
Growth Rates 1.092%
Traditional Customer Buying Criteria
Criteria Expectations Importance
1. Age Ideal Age = 2.0 47%
2. Price $17.50 – 27.50 23%
3. Ideal Position Pfmn 8.5 Size 11.5 21%
4. Reliability MTBF 14000-19000 9%
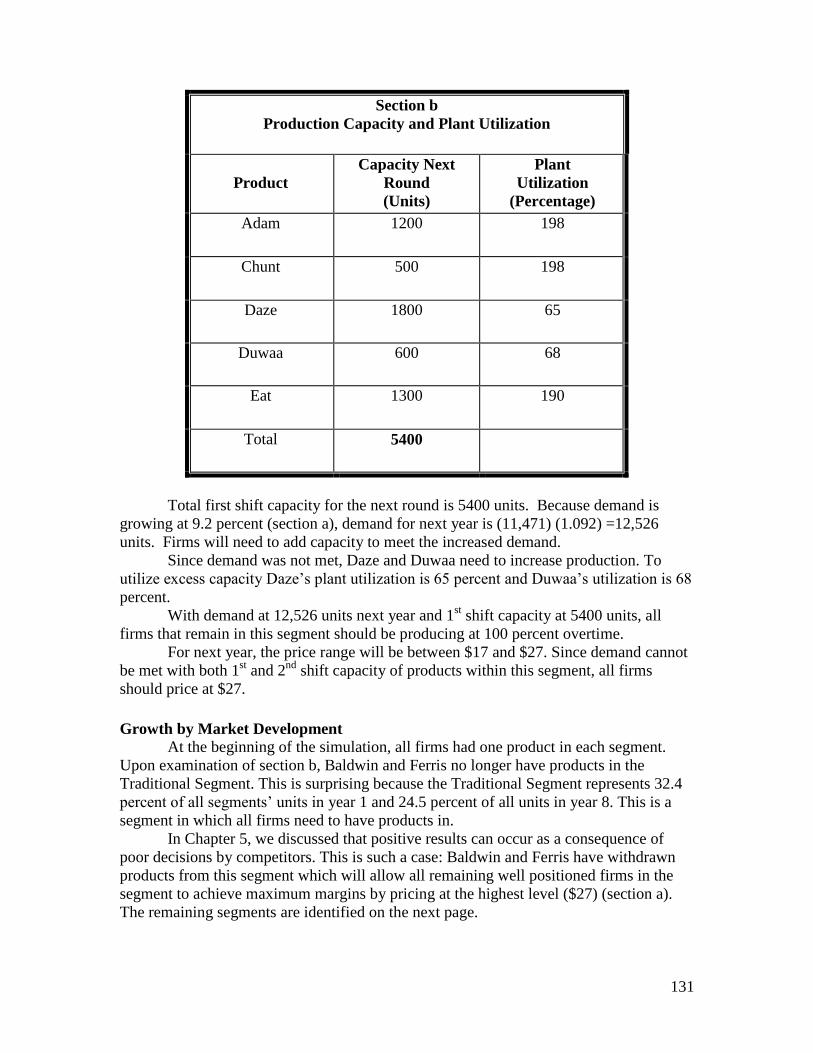
131
Section b
Production Capacity and Plant Utilization
Product
Capacity Next
Round
(Units)
Plant
Utilization
(Percentage)
Adam 1200 198
Chunt 500 198
Daze 1800 65
Duwaa 600 68
Eat 1300 190
Total 5400
Total first shift capacity for the next round is 5400 units. Because demand is
growing at 9.2 percent (section a), demand for next year is (11,471) (1.092) =12,526
units. Firms will need to add capacity to meet the increased demand.
Since demand was not met, Daze and Duwaa need to increase production. To
utilize excess capacity Daze’s plant utilization is 65 percent and Duwaa’s utilization is 68
percent.
With demand at 12,526 units next year and 1st shift capacity at 5400 units, all
firms that remain in this segment should be producing at 100 percent overtime.
For next year, the price range will be between $17 and $27. Since demand cannot
be met with both 1st and 2
nd shift capacity of products within this segment, all firms
should price at $27.
Growth by Market Development
At the beginning of the simulation, all firms had one product in each segment.
Upon examination of section b, Baldwin and Ferris no longer have products in the
Traditional Segment. This is surprising because the Traditional Segment represents 32.4
percent of all segments’ units in year 1 and 24.5 percent of all units in year 8. This is a
segment in which all firms need to have products in.
In Chapter 5, we discussed that positive results can occur as a consequence of
poor decisions by competitors. This is such a case: Baldwin and Ferris have withdrawn
products from this segment which will allow all remaining well positioned firms in the
segment to achieve maximum margins by pricing at the highest level ($27) (section a).
The remaining segments are identified on the next page.
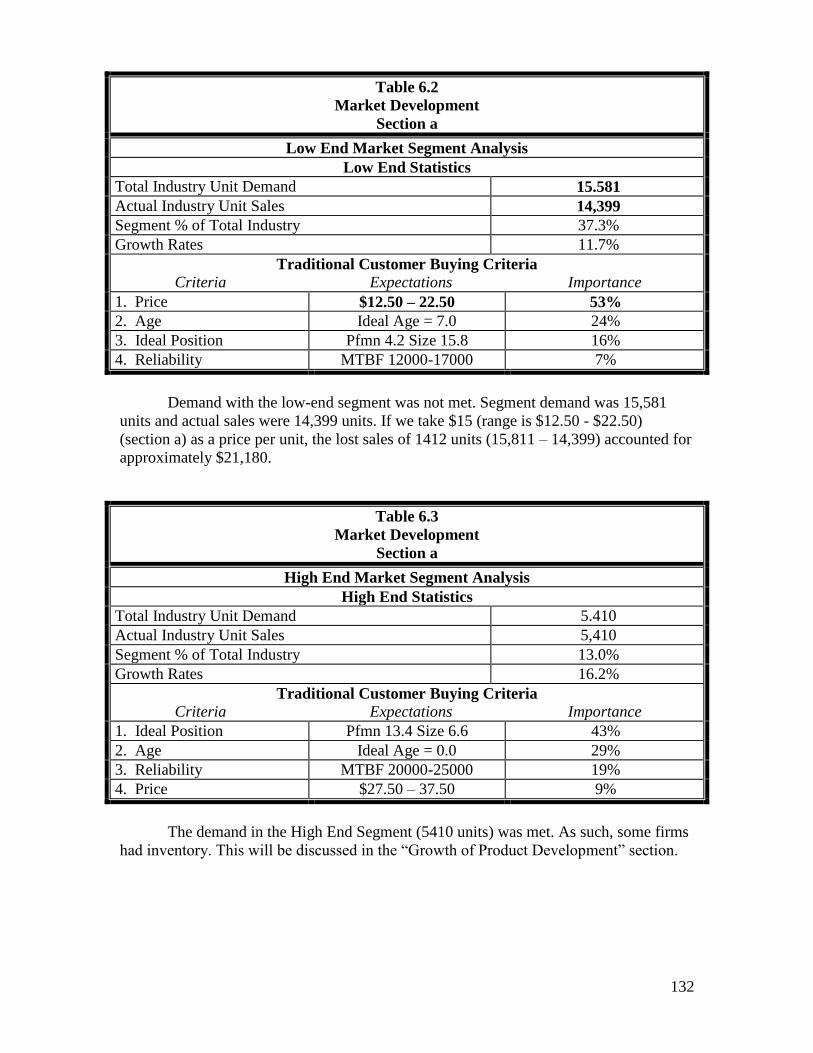
132
Table 6.2
Market Development
Section a
Low End Market Segment Analysis
Low End Statistics
Total Industry Unit Demand 15.581
Actual Industry Unit Sales 14,399
Segment % of Total Industry 37.3%
Growth Rates 11.7%
Traditional Customer Buying Criteria
Criteria Expectations Importance
1. Price $12.50 – 22.50 53%
2. Age Ideal Age = 7.0 24%
3. Ideal Position Pfmn 4.2 Size 15.8 16%
4. Reliability MTBF 12000-17000 7%
Demand with the low-end segment was not met. Segment demand was 15,581
units and actual sales were 14,399 units. If we take $15 (range is $12.50 - $22.50)
(section a) as a price per unit, the lost sales of 1412 units (15,811 – 14,399) accounted for
approximately $21,180.
Table 6.3
Market Development
Section a
High End Market Segment Analysis
High End Statistics
Total Industry Unit Demand 5.410
Actual Industry Unit Sales 5,410
Segment % of Total Industry 13.0%
Growth Rates 16.2%
Traditional Customer Buying Criteria
Criteria Expectations Importance
1. Ideal Position Pfmn 13.4 Size 6.6 43%
2. Age Ideal Age = 0.0 29%
3. Reliability MTBF 20000-25000 19%
4. Price $27.50 – 37.50 9%
The demand in the High End Segment (5410 units) was met. As such, some firms
had inventory. This will be discussed in the “Growth of Product Development” section.
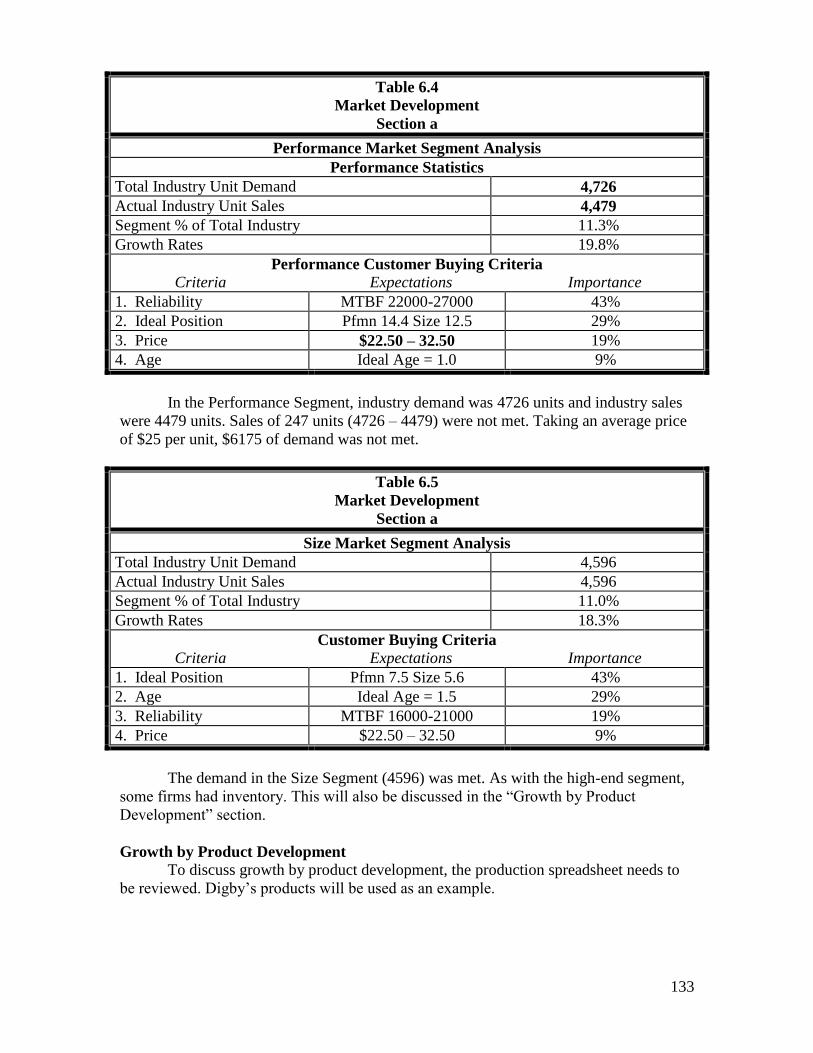
133
Table 6.4
Market Development
Section a
Performance Market Segment Analysis
Performance Statistics
Total Industry Unit Demand 4,726
Actual Industry Unit Sales 4,479
Segment % of Total Industry 11.3%
Growth Rates 19.8%
Performance Customer Buying Criteria
Criteria Expectations Importance
1. Reliability MTBF 22000-27000 43%
2. Ideal Position Pfmn 14.4 Size 12.5 29%
3. Price $22.50 – 32.50 19%
4. Age Ideal Age = 1.0 9%
In the Performance Segment, industry demand was 4726 units and industry sales
were 4479 units. Sales of 247 units (4726 – 4479) were not met. Taking an average price
of $25 per unit, $6175 of demand was not met.
Table 6.5
Market Development
Section a
Size Market Segment Analysis
Total Industry Unit Demand 4,596
Actual Industry Unit Sales 4,596
Segment % of Total Industry 11.0%
Growth Rates 18.3%
Customer Buying Criteria
Criteria Expectations Importance
1. Ideal Position Pfmn 7.5 Size 5.6 43%
2. Age Ideal Age = 1.5 29%
3. Reliability MTBF 16000-21000 19%
4. Price $22.50 – 32.50 9%
The demand in the Size Segment (4596) was met. As with the high-end segment,
some firms had inventory. This will also be discussed in the “Growth by Product
Development” section.
Growth by Product Development
To discuss growth by product development, the production spreadsheet needs to
be reviewed. Digby’s products will be used as an example.
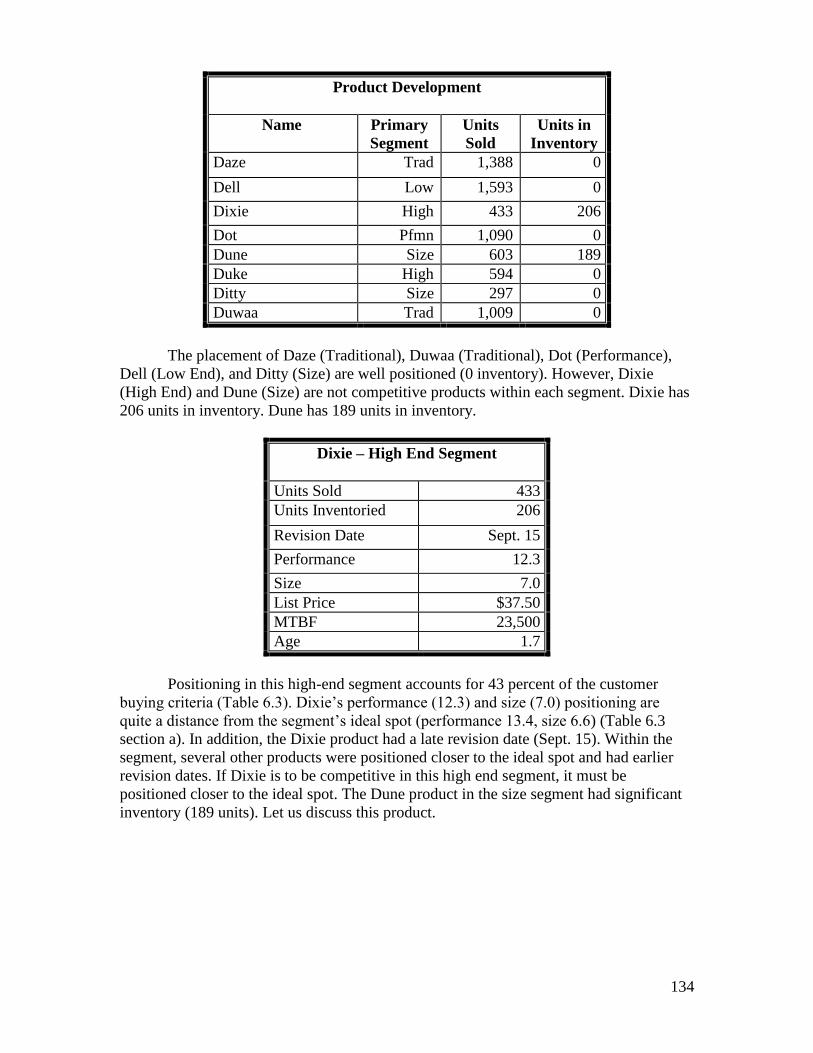
134
Product Development
Name Primary
Segment
Units
Sold
Units in
Inventory
Daze Trad 1,388 0
Dell Low 1,593 0
Dixie High 433 206
Dot Pfmn 1,090 0
Dune Size 603 189
Duke High 594 0
Ditty Size 297 0
Duwaa Trad 1,009 0
The placement of Daze (Traditional), Duwaa (Traditional), Dot (Performance),
Dell (Low End), and Ditty (Size) are well positioned (0 inventory). However, Dixie
(High End) and Dune (Size) are not competitive products within each segment. Dixie has
206 units in inventory. Dune has 189 units in inventory.
Dixie – High End Segment
Units Sold 433
Units Inventoried 206
Revision Date Sept. 15
Performance 12.3
Size 7.0
List Price $37.50
MTBF 23,500
Age 1.7
Positioning in this high-end segment accounts for 43 percent of the customer
buying criteria (Table 6.3). Dixie’s performance (12.3) and size (7.0) positioning are
quite a distance from the segment’s ideal spot (performance 13.4, size 6.6) (Table 6.3
section a). In addition, the Dixie product had a late revision date (Sept. 15). Within the
segment, several other products were positioned closer to the ideal spot and had earlier
revision dates. If Dixie is to be competitive in this high end segment, it must be
positioned closer to the ideal spot. The Dune product in the size segment had significant
inventory (189 units). Let us discuss this product.
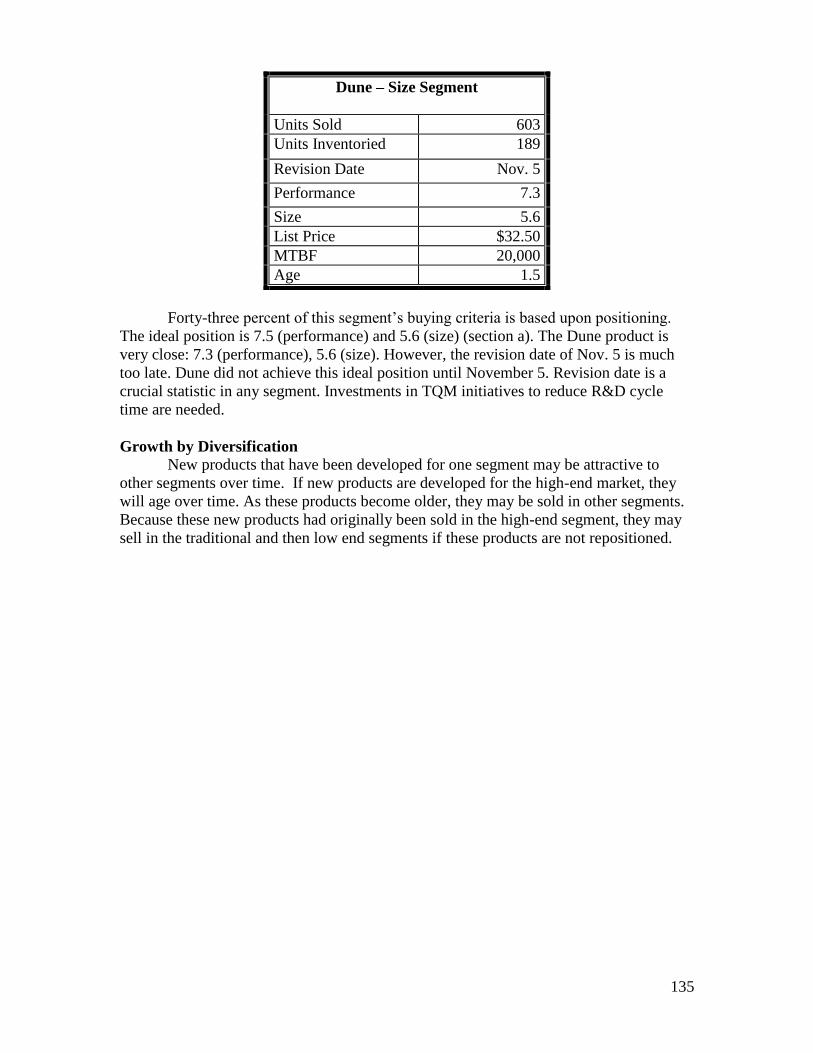
135
Dune – Size Segment
Units Sold 603
Units Inventoried 189
Revision Date Nov. 5
Performance 7.3
Size 5.6
List Price $32.50
MTBF 20,000
Age 1.5
Forty-three percent of this segment’s buying criteria is based upon positioning.
The ideal position is 7.5 (performance) and 5.6 (size) (section a). The Dune product is
very close: 7.3 (performance), 5.6 (size). However, the revision date of Nov. 5 is much
too late. Dune did not achieve this ideal position until November 5. Revision date is a
crucial statistic in any segment. Investments in TQM initiatives to reduce R&D cycle
time are needed.
Growth by Diversification
New products that have been developed for one segment may be attractive to
other segments over time. If new products are developed for the high-end market, they
will age over time. As these products become older, they may be sold in other segments.
Because these new products had originally been sold in the high-end segment, they may
sell in the traditional and then low end segments if these products are not repositioned.
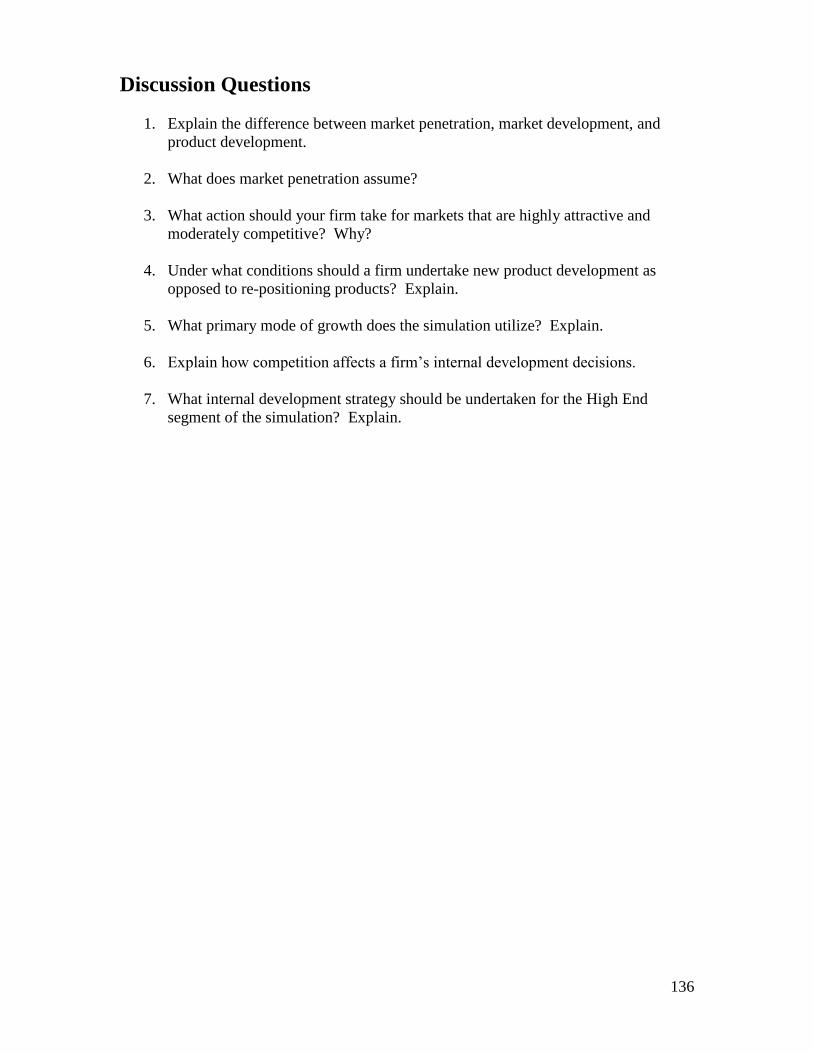
136
Discussion Questions
1. Explain the difference between market penetration, market development, and
product development.
2. What does market penetration assume?
3. What action should your firm take for markets that are highly attractive and
moderately competitive? Why?
4. Under what conditions should a firm undertake new product development as
opposed to re-positioning products? Explain.
5. What primary mode of growth does the simulation utilize? Explain.
6. Explain how competition affects a firm’s internal development decisions.
7. What internal development strategy should be undertaken for the High End
segment of the simulation? Explain.
137
References
1. Yip, G. 1982. Diversification entry: internal development versus acquisition.
Strategic Management Journal. 3(4), 331-345.
2. Chatterjee, S. 1990. Excess resources, utilization costs, and mode of entry.
Academy of Management Journal. 33: 780-800.
3. Chang, S. and Singh, H. 1999. The impact of modes of entry and resource fit on
modes of exit by multi-business firms. Strategic Management Journal. 20: 1019-
1035.
4. Ansoff, I. 1957. Strategies for diversification. Harvard Business Review.
September-October: 113-119.
5. Penrose, E. 1959. A theory of the growth of the firm. John Wiley & Sons. New
York, NY.
6. Ibid
7. Nelson, R. and Winter, S. 1982. An evolutionary theory of economic change.
Harvard University Press. Cambridge, MA.
8. Wernerfelt, B. 1984. A resource based view of the firm. Strategic Management
Journal. 5: 171-180.
9. Chatterjee. Excess resources, utilization costs, and mode of entry.
10. ____________________, Wall Street Journal. April 19, 2012
11. Ansoff. I. 1957. Strategies for diversification. Wall Street Journal.
12. Takahashi, Dean, PlayPhone enables instant multiplayer across android and iOs
devices, 03/19/2012, http://www.ajc.com/business/ups-pushes-logistics-to-
1397277.html
13. Santini, L. 2004. Drug companies look at China for cheap R&D. Wall Street
Journal. November 24.
14. Ibid
15. Buckler, S. 1997. The spiritual nature of innovation. Research-Technology
Management, March-April: 43-47.
16. Nobel, R. and Birkinshaw, J. 1998. Innovation in multinational corporations:
Control and communication patterns in international R&D operations. Strategic
Management Journal, 19: 479-496.
138
17. James, A.; Georghiou, L.; and Metcalfe, J. 1998. Integrating technology into
merger and acquisition decision making. Technovation, 18 (8/9): 563-573.
18. Meyer, J. 1997. Revitalize your product lines through continuous platform
renewal. Research-Technology Management, March-April: 17-28.
19. Roberts, P. 1999. Product innovation, product-market competition and persistent
profitability in the U.S. Pharmaceutical industry. Strategic Management Journal,
20: 655-670.
20. Winslow, R. and Johnson, A. 2007. New blood thinner drugs on line. Wall
Street Journal. December 10.
21. Ibid
22. Ibid
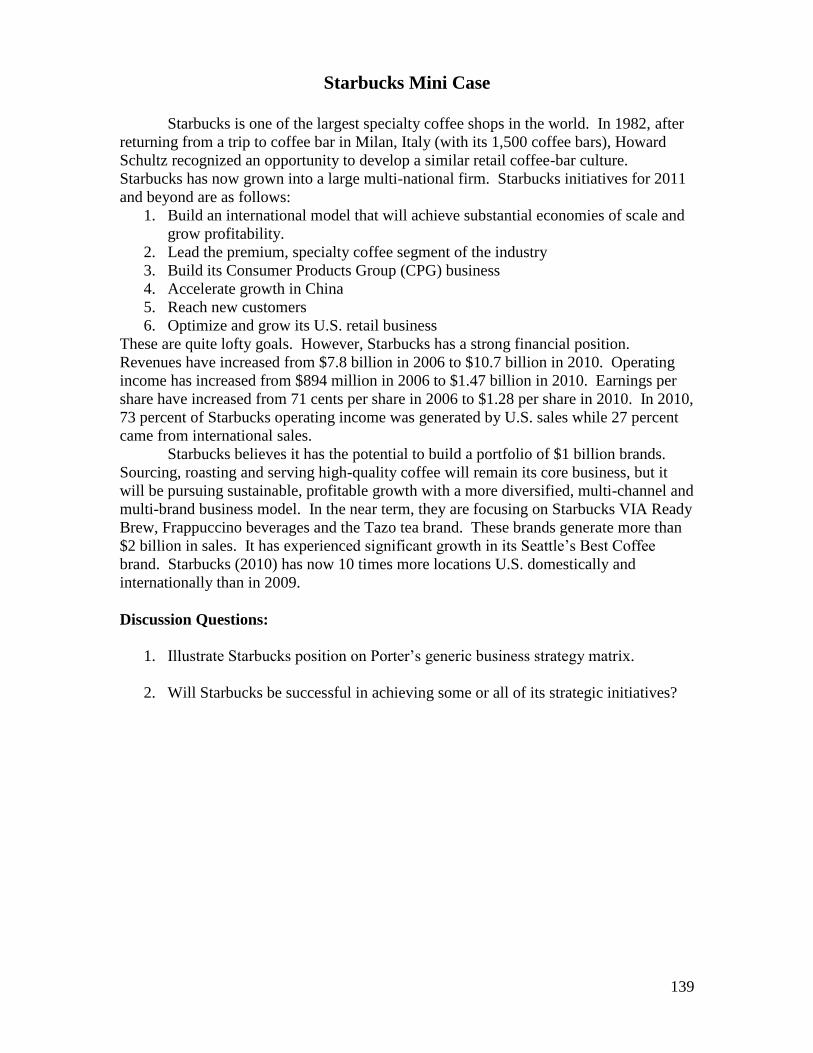
139
Starbucks Mini Case
Starbucks is one of the largest specialty coffee shops in the world. In 1982, after
returning from a trip to coffee bar in Milan, Italy (with its 1,500 coffee bars), Howard
Schultz recognized an opportunity to develop a similar retail coffee-bar culture.
Starbucks has now grown into a large multi-national firm. Starbucks initiatives for 2011
and beyond are as follows:
1. Build an international model that will achieve substantial economies of scale and
grow profitability.
2. Lead the premium, specialty coffee segment of the industry
3. Build its Consumer Products Group (CPG) business
4. Accelerate growth in China
5. Reach new customers
6. Optimize and grow its U.S. retail business
These are quite lofty goals. However, Starbucks has a strong financial position.
Revenues have increased from $7.8 billion in 2006 to $10.7 billion in 2010. Operating
income has increased from $894 million in 2006 to $1.47 billion in 2010. Earnings per
share have increased from 71 cents per share in 2006 to $1.28 per share in 2010. In 2010,
73 percent of Starbucks operating income was generated by U.S. sales while 27 percent
came from international sales.
Starbucks believes it has the potential to build a portfolio of $1 billion brands.
Sourcing, roasting and serving high-quality coffee will remain its core business, but it
will be pursuing sustainable, profitable growth with a more diversified, multi-channel and
multi-brand business model. In the near term, they are focusing on Starbucks VIA Ready
Brew, Frappuccino beverages and the Tazo tea brand. These brands generate more than
$2 billion in sales. It has experienced significant growth in its Seattle’s Best Coffee
brand. Starbucks (2010) has now 10 times more locations U.S. domestically and
internationally than in 2009.
Discussion Questions:
1. Illustrate Starbucks position on Porter’s generic business strategy matrix.
2. Will Starbucks be successful in achieving some or all of its strategic initiatives?
140
Harvard Business Cases for Chapter 6
Corporate Strategy at Berkshire Partners
Product Number 710414
Havells India: The Sylvania Acquisition
Product Number 909M89
Professor Case for Chapter 6
Louis Vuitton Moet Hennessy

141
Chapter 7
Corporate Level Strategies and Restructuring

142
Learning and Assessment Goals
1. Understand the general relationship between types of diversification and
performance.
2. Understand why senior managers and shareholders have different risk profiles
from a diversification perspective.
3. Utilize industry analysis and firm business strengths assessment to determine a
firm’s competitive position.
4. Develop an understanding of where and how resources are allocated based upon
different diversification scenarios.
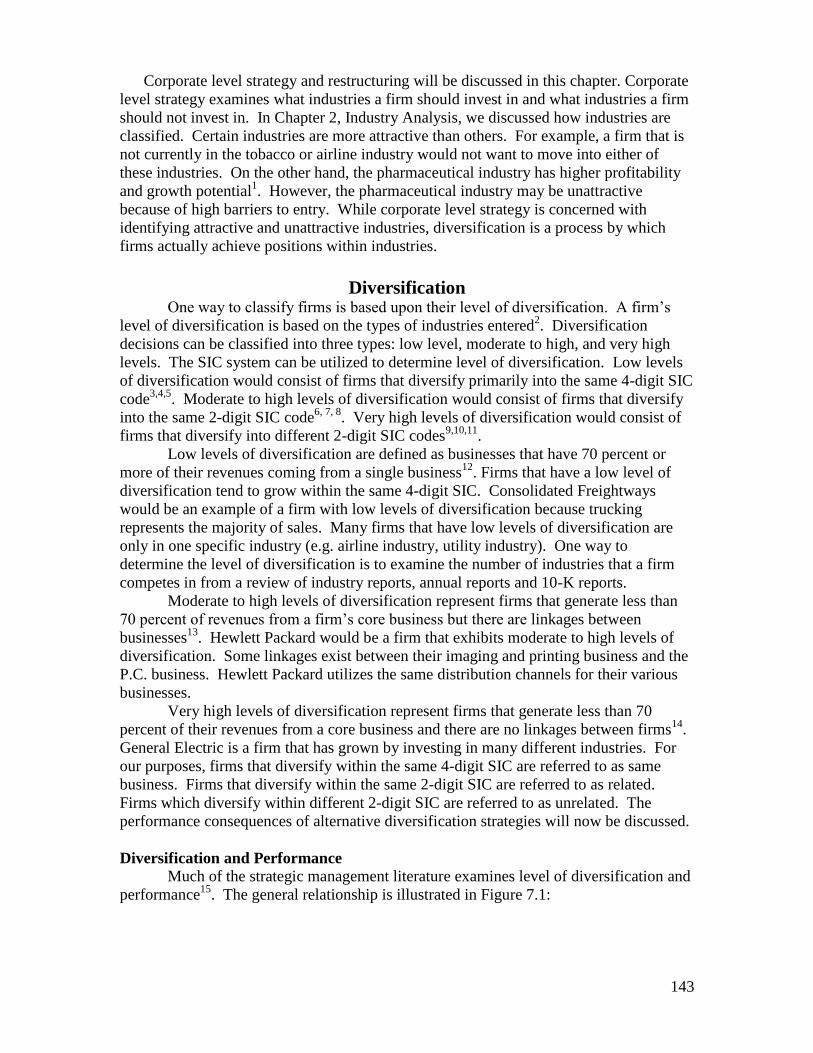
143
Corporate level strategy and restructuring will be discussed in this chapter. Corporate
level strategy examines what industries a firm should invest in and what industries a firm
should not invest in. In Chapter 2, Industry Analysis, we discussed how industries are
classified. Certain industries are more attractive than others. For example, a firm that is
not currently in the tobacco or airline industry would not want to move into either of
these industries. On the other hand, the pharmaceutical industry has higher profitability
and growth potential1. However, the pharmaceutical industry may be unattractive
because of high barriers to entry. While corporate level strategy is concerned with
identifying attractive and unattractive industries, diversification is a process by which
firms actually achieve positions within industries.
Diversification One way to classify firms is based upon their level of diversification. A firm’s
level of diversification is based on the types of industries entered2. Diversification
decisions can be classified into three types: low level, moderate to high, and very high
levels. The SIC system can be utilized to determine level of diversification. Low levels
of diversification would consist of firms that diversify primarily into the same 4-digit SIC
code3,4,5
. Moderate to high levels of diversification would consist of firms that diversify
into the same 2-digit SIC code6, 7, 8
. Very high levels of diversification would consist of
firms that diversify into different 2-digit SIC codes9,10,11
.
Low levels of diversification are defined as businesses that have 70 percent or
more of their revenues coming from a single business12
. Firms that have a low level of
diversification tend to grow within the same 4-digit SIC. Consolidated Freightways
would be an example of a firm with low levels of diversification because trucking
represents the majority of sales. Many firms that have low levels of diversification are
only in one specific industry (e.g. airline industry, utility industry). One way to
determine the level of diversification is to examine the number of industries that a firm
competes in from a review of industry reports, annual reports and 10-K reports.
Moderate to high levels of diversification represent firms that generate less than
70 percent of revenues from a firm’s core business but there are linkages between
businesses13
. Hewlett Packard would be a firm that exhibits moderate to high levels of
diversification. Some linkages exist between their imaging and printing business and the
P.C. business. Hewlett Packard utilizes the same distribution channels for their various
businesses.
Very high levels of diversification represent firms that generate less than 70
percent of their revenues from a core business and there are no linkages between firms14
.
General Electric is a firm that has grown by investing in many different industries. For
our purposes, firms that diversify within the same 4-digit SIC are referred to as same
business. Firms that diversify within the same 2-digit SIC are referred to as related.
Firms which diversify within different 2-digit SIC are referred to as unrelated. The
performance consequences of alternative diversification strategies will now be discussed.
Diversification and Performance
Much of the strategic management literature examines level of diversification and
performance15
. The general relationship is illustrated in Figure 7.1:
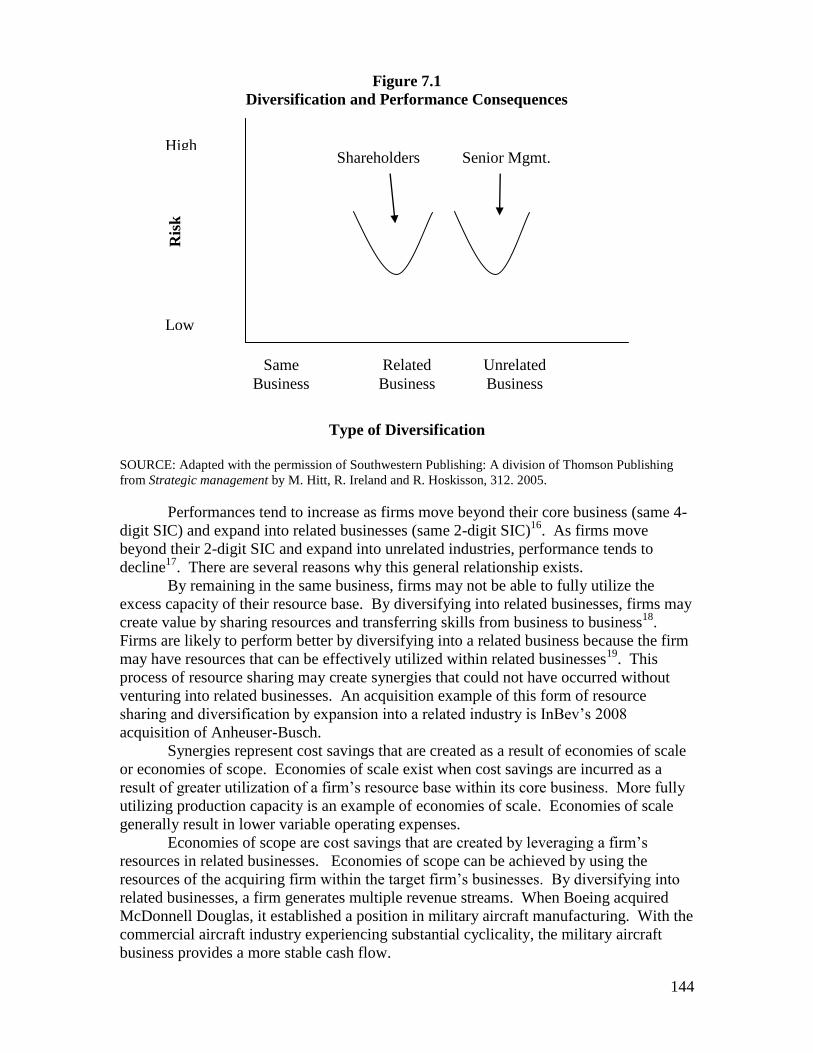
144
Figure 7.1
Diversification and Performance Consequences
Type of Diversification
SOURCE: Adapted with the permission of Southwestern Publishing: A division of Thomson Publishing
from Strategic management by M. Hitt, R. Ireland and R. Hoskisson, 312. 2005.
Performances tend to increase as firms move beyond their core business (same 4-
digit SIC) and expand into related businesses (same 2-digit SIC)16
. As firms move
beyond their 2-digit SIC and expand into unrelated industries, performance tends to
decline17
. There are several reasons why this general relationship exists.
By remaining in the same business, firms may not be able to fully utilize the
excess capacity of their resource base. By diversifying into related businesses, firms may
create value by sharing resources and transferring skills from business to business18
.
Firms are likely to perform better by diversifying into a related business because the firm
may have resources that can be effectively utilized within related businesses19
. This
process of resource sharing may create synergies that could not have occurred without
venturing into related businesses. An acquisition example of this form of resource
sharing and diversification by expansion into a related industry is InBev’s 2008
acquisition of Anheuser-Busch.
Synergies represent cost savings that are created as a result of economies of scale
or economies of scope. Economies of scale exist when cost savings are incurred as a
result of greater utilization of a firm’s resource base within its core business. More fully
utilizing production capacity is an example of economies of scale. Economies of scale
generally result in lower variable operating expenses.
Economies of scope are cost savings that are created by leveraging a firm’s
resources in related businesses. Economies of scope can be achieved by using the
resources of the acquiring firm within the target firm’s businesses. By diversifying into
related businesses, a firm generates multiple revenue streams. When Boeing acquired
McDonnell Douglas, it established a position in military aircraft manufacturing. With the
commercial aircraft industry experiencing substantial cyclicality, the military aircraft
business provides a more stable cash flow.
Ris
k
Same
Business
Related
Business
Unrelated
Business
H
igh
L
ow
High
Low
Shareholders Senior Mgmt.
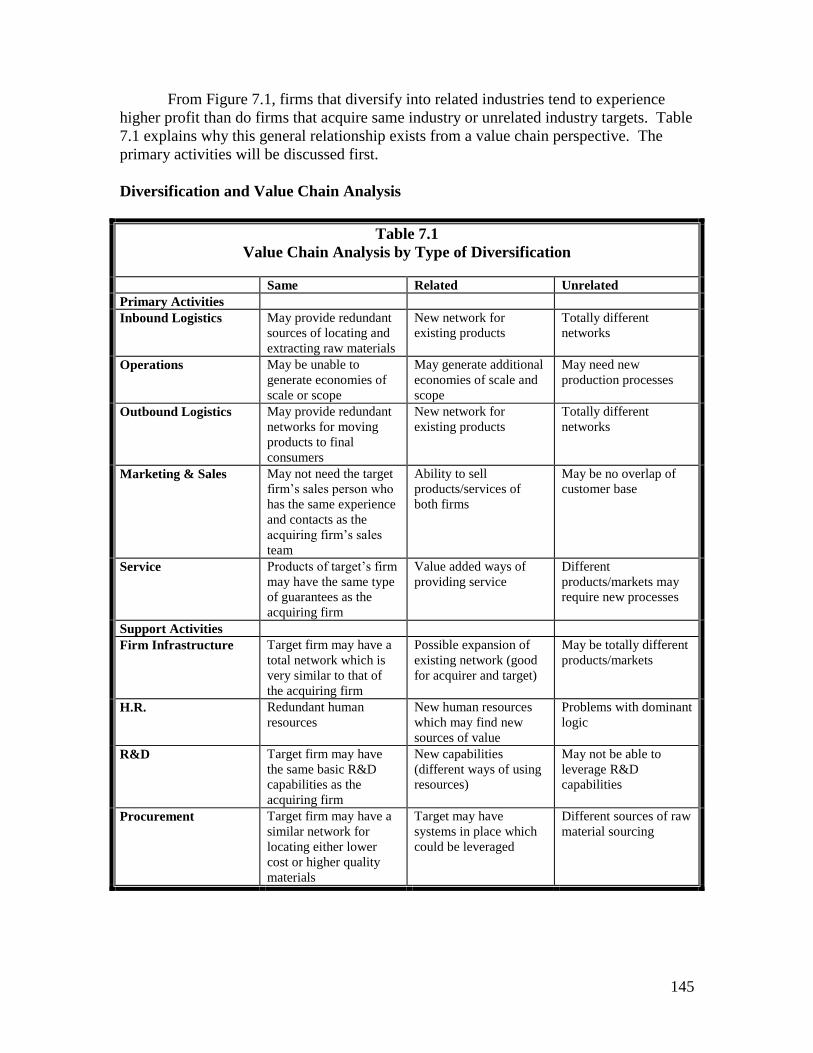
145
From Figure 7.1, firms that diversify into related industries tend to experience
higher profit than do firms that acquire same industry or unrelated industry targets. Table
7.1 explains why this general relationship exists from a value chain perspective. The
primary activities will be discussed first.
Diversification and Value Chain Analysis
Table 7.1
Value Chain Analysis by Type of Diversification
Same Related Unrelated
Primary Activities
Inbound Logistics May provide redundant
sources of locating and
extracting raw materials
New network for
existing products
Totally different
networks
Operations May be unable to
generate economies of
scale or scope
May generate additional
economies of scale and
scope
May need new
production processes
Outbound Logistics May provide redundant
networks for moving
products to final
consumers
New network for
existing products
Totally different
networks
Marketing & Sales May not need the target
firm’s sales person who
has the same experience
and contacts as the
acquiring firm’s sales
team
Ability to sell
products/services of
both firms
May be no overlap of
customer base
Service Products of target’s firm
may have the same type
of guarantees as the
acquiring firm
Value added ways of
providing service
Different
products/markets may
require new processes
Support Activities
Firm Infrastructure Target firm may have a
total network which is
very similar to that of
the acquiring firm
Possible expansion of
existing network (good
for acquirer and target)
May be totally different
products/markets
H.R. Redundant human
resources
New human resources
which may find new
sources of value
Problems with dominant
logic
R&D Target firm may have
the same basic R&D
capabilities as the
acquiring firm
New capabilities
(different ways of using
resources)
May not be able to
leverage R&D
capabilities
Procurement Target firm may have a
similar network for
locating either lower
cost or higher quality
materials
Target may have
systems in place which
could be leveraged
Different sources of raw
material sourcing
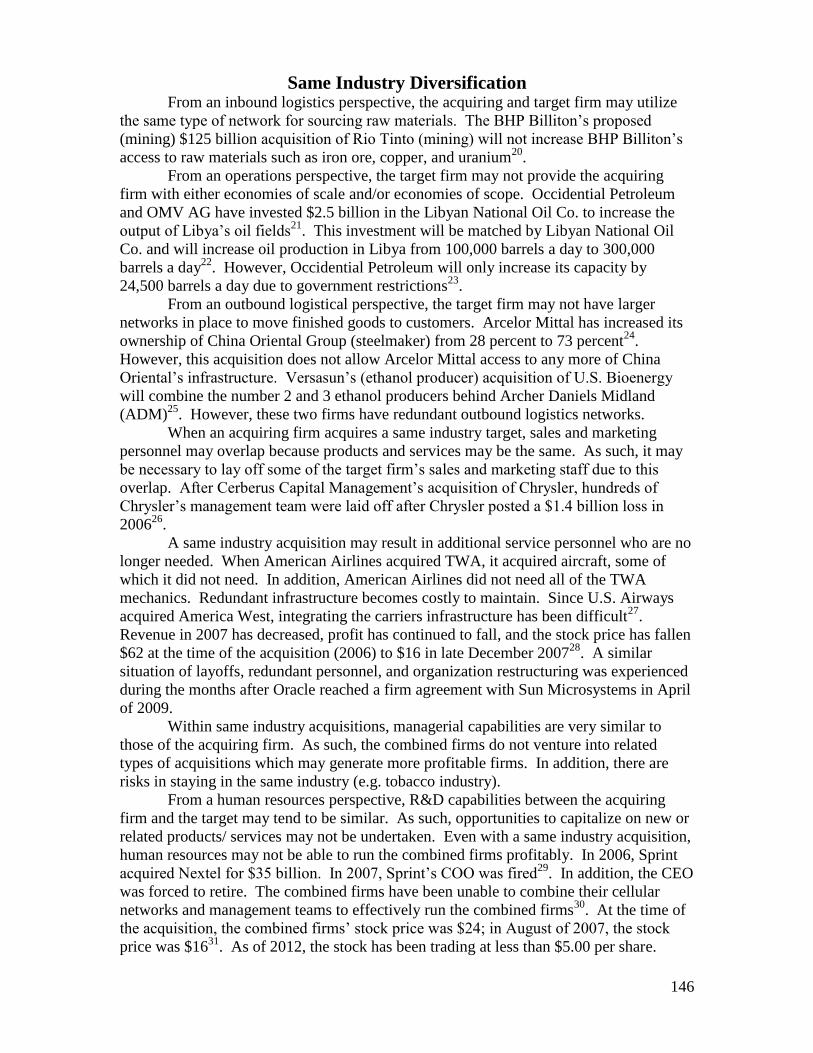
146
Same Industry Diversification From an inbound logistics perspective, the acquiring and target firm may utilize
the same type of network for sourcing raw materials. The BHP Billiton’s proposed
(mining) $125 billion acquisition of Rio Tinto (mining) will not increase BHP Billiton’s
access to raw materials such as iron ore, copper, and uranium20
.
From an operations perspective, the target firm may not provide the acquiring
firm with either economies of scale and/or economies of scope. Occidential Petroleum
and OMV AG have invested $2.5 billion in the Libyan National Oil Co. to increase the
output of Libya’s oil fields21
. This investment will be matched by Libyan National Oil
Co. and will increase oil production in Libya from 100,000 barrels a day to 300,000
barrels a day22
. However, Occidential Petroleum will only increase its capacity by
24,500 barrels a day due to government restrictions23
.
From an outbound logistical perspective, the target firm may not have larger
networks in place to move finished goods to customers. Arcelor Mittal has increased its
ownership of China Oriental Group (steelmaker) from 28 percent to 73 percent24
.
However, this acquisition does not allow Arcelor Mittal access to any more of China
Oriental’s infrastructure. Versasun’s (ethanol producer) acquisition of U.S. Bioenergy
will combine the number 2 and 3 ethanol producers behind Archer Daniels Midland
(ADM)25
. However, these two firms have redundant outbound logistics networks.
When an acquiring firm acquires a same industry target, sales and marketing
personnel may overlap because products and services may be the same. As such, it may
be necessary to lay off some of the target firm’s sales and marketing staff due to this
overlap. After Cerberus Capital Management’s acquisition of Chrysler, hundreds of
Chrysler’s management team were laid off after Chrysler posted a $1.4 billion loss in
200626
.
A same industry acquisition may result in additional service personnel who are no
longer needed. When American Airlines acquired TWA, it acquired aircraft, some of
which it did not need. In addition, American Airlines did not need all of the TWA
mechanics. Redundant infrastructure becomes costly to maintain. Since U.S. Airways
acquired America West, integrating the carriers infrastructure has been difficult27
.
Revenue in 2007 has decreased, profit has continued to fall, and the stock price has fallen
$62 at the time of the acquisition (2006) to $16 in late December 200728
. A similar
situation of layoffs, redundant personnel, and organization restructuring was experienced
during the months after Oracle reached a firm agreement with Sun Microsystems in April
of 2009.
Within same industry acquisitions, managerial capabilities are very similar to
those of the acquiring firm. As such, the combined firms do not venture into related
types of acquisitions which may generate more profitable firms. In addition, there are
risks in staying in the same industry (e.g. tobacco industry).
From a human resources perspective, R&D capabilities between the acquiring
firm and the target may tend to be similar. As such, opportunities to capitalize on new or
related products/ services may not be undertaken. Even with a same industry acquisition,
human resources may not be able to run the combined firms profitably. In 2006, Sprint
acquired Nextel for $35 billion. In 2007, Sprint’s COO was fired29
. In addition, the CEO
was forced to retire. The combined firms have been unable to combine their cellular
networks and management teams to effectively run the combined firms30
. At the time of
the acquisition, the combined firms’ stock price was $24; in August of 2007, the stock
price was $1631
. As of 2012, the stock has been trading at less than $5.00 per share.
147
Firms may acquire targets which have the same network for procuring either
lower cost or higher quality materials. Transocean Inc.’s 2007 acquisition of Global
SantaFe Corp. for $18 billion did not provide Transocean any more offshore oil sites32
.
Related Industry Diversification From an inbound logistics perspective, related acquisitions allow firms closer
access to raw materials. Port and railway networks in China can be merged to allow
firms access to raw materials which they previously did not have. BHP’s acquisition of
Rio Tinto integrates port and railway infrastructures to create an inbound logistics
network to give both firms greater access to copper, coal, and iron ore reserves.
From an operations perspective, related acquisitions allow firms to utilize assets
to achieve economies of scale or scope. The $10.1 billion related acquisition of Trane by
Ingersoll Rand allows for the more economical production of refrigerated trucks and
transportation cooling systems for several modes of transportation33
.
From an outbound logistics perspective, related acquisitions provide new access
for existing products and new products. Proctor and Gamble’s acquisition of Gillette
provided Proctor and Gamble access to international networks (e.g. Europe, South
America) where it previously had a minimally developed network compared to its
primary competitor, Unilever.
From a marketing and sales perspective, related acquisitions allow firms to
differentiate their products from competitors. Microsoft’s entry into the software
mapping industry through the acquisition of Multimap allows Microsoft to effectively
utilize its capabilities in related industries where it previously did not have a position34
.
From an infrastructure perspective, related acquisitions allow firms greater access
to similar industries. Many of these acquisitions have been made by Chinese firms.
Aluminum Corp. of China acquisition of Canada’s Peru Copper and China Metallorgical
Construction Group’s acquisition of Australia’s Balmoral Iron Holdings are two
examples which allow the acquiring firms access to related businesses.
From a human resource perspective, the acquisition of intellectual capital from
related industries provides new perspectives on how to achieve greater competitive
advantage for both the acquiring and target firm. Cisco’s John Chambers ability to
integrate the various related acquisitions of Cisco has allowed Cisco to maintain its
domestic position within core and related industries. Ping An (China) acquisition of
Fortis NV (Dutch) has allowed Ping An to enter the life insurance industry35
. This
acquisition will help Ping An to develop its own insurance based banking network in
China36
.
From a research and development (R&D) perspective, the ability to combine the
capabilities of both firms to develop new products to service related industries allows
firms to maintain competitive advantage. Johnson & Johnson, Merck, Pfizer, Bristol
Meyers, Lilly and Astrazeneca are all examples of pharmaceutical firms which have
made recent related acquisitions of bio tech firms because several brands of these firms
are losing patent protection in the upcoming years (e.g. Lipitor (2011) – Pfizer, Fosamax
(2008) – Merck)37
.
From a procurement perspective, related acquisitions have systems and
procedures in place to find lower cost or higher quality products. Naspers (South Africa)
acquired Tradus (London) to gain access to Eastern European markets for pay-television,
internet, and print media assets38
. This acquisition provides the capability to obtain these
related assets at lower costs.
148
Unrelated Industry Diversification From an inbound logistics perspective, unrelated firms usually have totally
different logistics networks because they are designed for different products/services.
The acquiring firm may not be able to utilize the target’s infrastructure and vice versa.
The same is true from an outbound logistics perspective because the acquiring and target
firms may have different customer bases. Campbell Soup Co.’s acquisition of Godiva
Chocolatier for $850 million required Campbell’s to maintain two different inbound and
outbound logistical networks39
.
Unrelated acquisition targets may have different types of operational facilities.
As such, it may be difficult to achieve either economies of scope or economies of scale
from an operations perspective. This situation makes it very difficult to achieve cost
savings because synergies may be difficult to achieve. For example, Olympus, a camera
maker, has acquired Gyrus Group, a United Kingdom Medical-instruments firm for $1.89
billion. Since these firms have totally different operational processes, it may be difficult
to achieve any type of synergies or cost savings. Japan Tobacco’s acquisition of
Katokichi, a frozen foods maker, did not provide any operational synergies40
.
One aspect of unrelated acquisitions is that the sales, marketing, and service
resources of the target firm may need to be maintained because they serve two totally
different industries and customer bases. Different customer bases have different needs;
training will need to be focused upon two discreet sales and marketing plans. Recently,
Beer Brewer Kirin has acquired Australian Dairy and Soft Drink National Foods
Company for $2.6 billion. These two firms maintain two distinct customer bases.
The human resource functions of both the acquiring and target firm will need to
be maintained and any differences in terms of salaries and benefits need to be resolved
before the acquisition is completed. If there is a significant difference between acquiring
and target firm’s compensation, this could cause problems with the workforce of the
combined firms. In addition, if one workforce is unionized and the other is not, these
major human resource issues will need to be resolved. The Warren Buffett Berkshire
Hathaway 2009 acquisition of the BNSF Railroad is an elaborate example of various
human resource and management related challenges that needed to be addressed. As is
common in an unrelated industry acquisition, Buffett maintained the management team of
the BNSF. In addition, the $1.91 billion acquisition of Tradus PLC, an internet auction
firm, by media conglomerate Naspers Inc., required totally different managerial
capabilities. As such, both management teams needed to be maintained.
Due to the unrelated nature of the acquisition, the acquiring firm may need to
obtain two distinct R&D functions. These functions are likely to have minimal to no
overlap. As such, two different budgets will need to be maintained. In addition, the two
R&D functions will compete for resources. Unless the management team of the target
firm is maintained, maximizing the return on R&D expenditures may be difficult. CIE
FinanciereRioyemont’s acquisition of British American Tobacco required R&D
capabilities in luxury goods and tobacco41
. As such, R&D capabilities of the acquiring
firm could not be leveraged.
Diversification and Risk
As firms move from related to unrelated businesses, returns tend to decline. One
explanation for this is because of managerial risk motives. This risk relationship between
managers and shareholders is different for different levels of diversification.
Shareholders’ risk is minimized by the firm engaging in related diversification.
As discussed above, related diversification is likely to result in economies of scale and/or
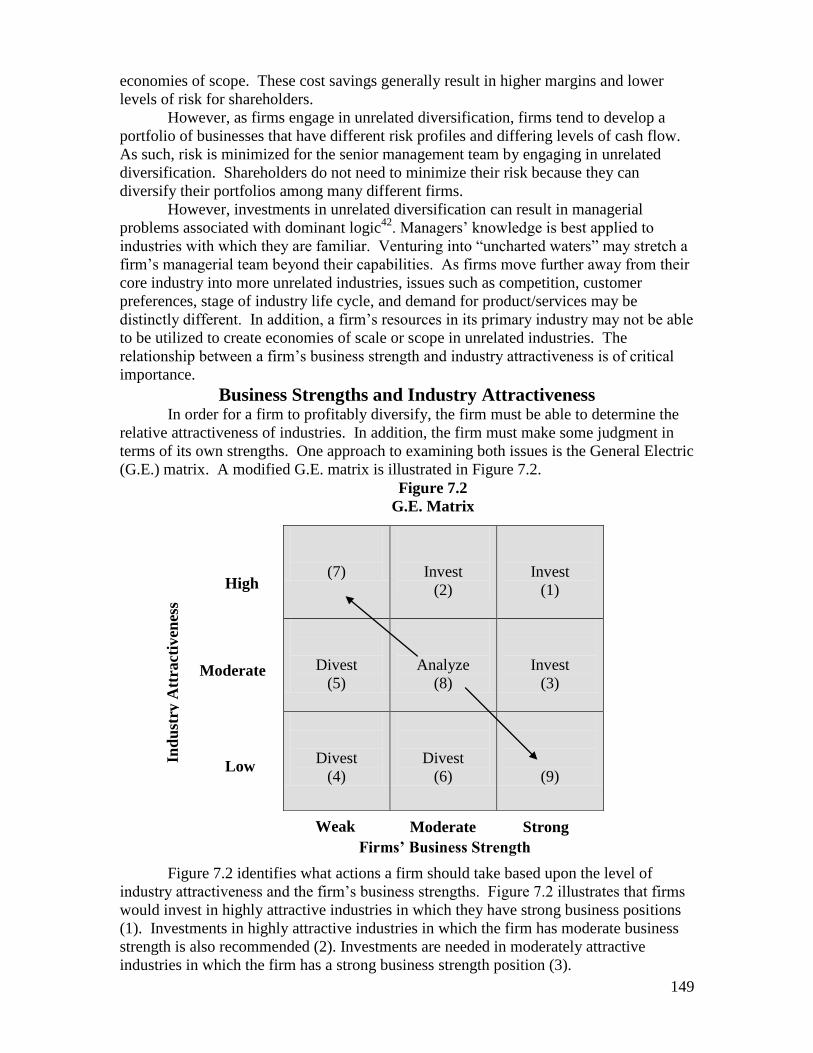
149
economies of scope. These cost savings generally result in higher margins and lower
levels of risk for shareholders.
However, as firms engage in unrelated diversification, firms tend to develop a
portfolio of businesses that have different risk profiles and differing levels of cash flow.
As such, risk is minimized for the senior management team by engaging in unrelated
diversification. Shareholders do not need to minimize their risk because they can
diversify their portfolios among many different firms.
However, investments in unrelated diversification can result in managerial
problems associated with dominant logic42
. Managers’ knowledge is best applied to
industries with which they are familiar. Venturing into “uncharted waters” may stretch a
firm’s managerial team beyond their capabilities. As firms move further away from their
core industry into more unrelated industries, issues such as competition, customer
preferences, stage of industry life cycle, and demand for product/services may be
distinctly different. In addition, a firm’s resources in its primary industry may not be able
to be utilized to create economies of scale or scope in unrelated industries. The
relationship between a firm’s business strength and industry attractiveness is of critical
importance.
Business Strengths and Industry Attractiveness In order for a firm to profitably diversify, the firm must be able to determine the
relative attractiveness of industries. In addition, the firm must make some judgment in
terms of its own strengths. One approach to examining both issues is the General Electric
(G.E.) matrix. A modified G.E. matrix is illustrated in Figure 7.2.
Figure 7.2
G.E. Matrix
Figure 7.2 identifies what actions a firm should take based upon the level of
industry attractiveness and the firm’s business strengths. Figure 7.2 illustrates that firms
would invest in highly attractive industries in which they have strong business positions
(1). Investments in highly attractive industries in which the firm has moderate business
strength is also recommended (2). Investments are needed in moderately attractive
industries in which the firm has a strong business strength position (3).
(7)
Invest
(2)
Invest
(1)
Divest
(5)
Analyze
(8)
Invest
(3)
Divest
(4)
Divest
(6)
(9)
Moderate
Ind
ust
ry A
ttra
ctiv
enes
s
High
Moderate
Weak Strong
Low
Firms’ Business Strength
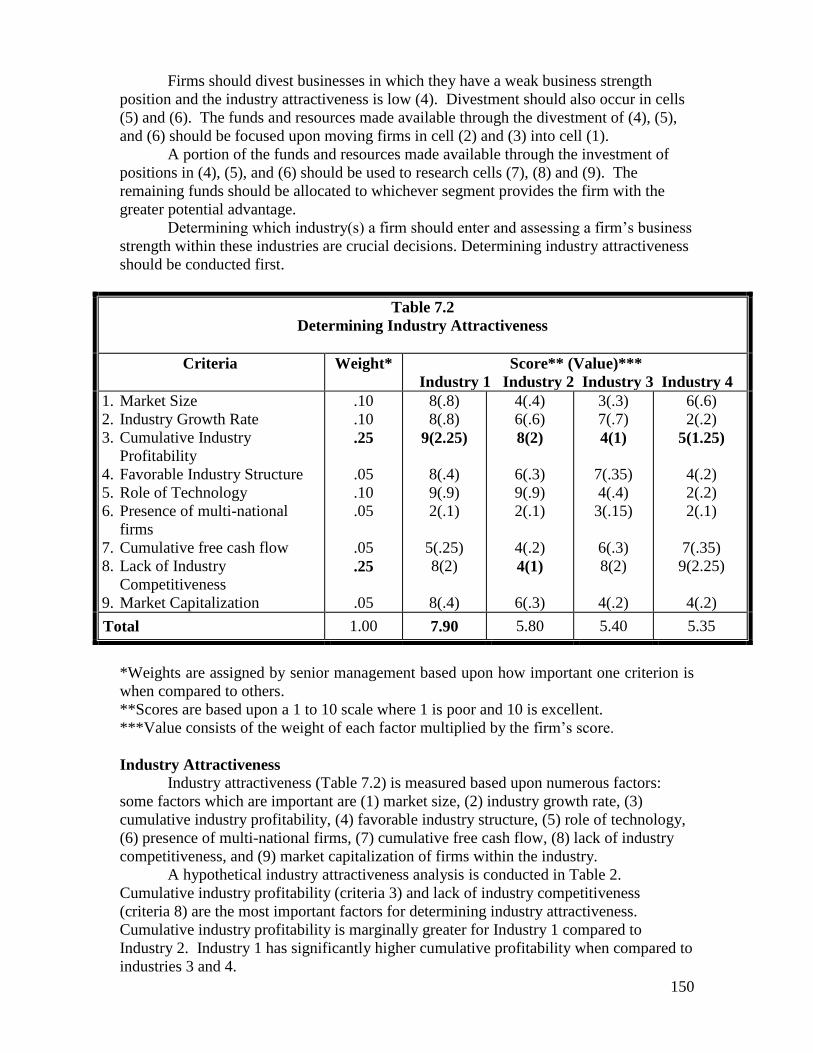
150
Firms should divest businesses in which they have a weak business strength
position and the industry attractiveness is low (4). Divestment should also occur in cells
(5) and (6). The funds and resources made available through the divestment of (4), (5),
and (6) should be focused upon moving firms in cell (2) and (3) into cell (1).
A portion of the funds and resources made available through the investment of
positions in (4), (5), and (6) should be used to research cells (7), (8) and (9). The
remaining funds should be allocated to whichever segment provides the firm with the
greater potential advantage.
Determining which industry(s) a firm should enter and assessing a firm’s business
strength within these industries are crucial decisions. Determining industry attractiveness
should be conducted first.
Table 7.2
Determining Industry Attractiveness
Criteria Weight* Score** (Value)***
Industry 1 Industry 2 Industry 3 Industry 4
1. Market Size
2. Industry Growth Rate
3. Cumulative Industry
Profitability
4. Favorable Industry Structure
5. Role of Technology
6. Presence of multi-national
firms
7. Cumulative free cash flow
8. Lack of Industry
Competitiveness
9. Market Capitalization
.10
.10
.25
.05
.10
.05
.05
.25
.05
8(.8)
8(.8)
9(2.25)
8(.4)
9(.9)
2(.1)
5(.25)
8(2)
8(.4)
4(.4)
6(.6)
8(2)
6(.3)
9(.9)
2(.1)
4(.2)
4(1)
6(.3)
3(.3)
7(.7)
4(1)
7(.35)
4(.4)
3(.15)
6(.3)
8(2)
4(.2)
6(.6)
2(.2)
5(1.25)
4(.2)
2(.2)
2(.1)
7(.35)
9(2.25)
4(.2)
Total 1.00 7.90 5.80 5.40 5.35
*Weights are assigned by senior management based upon how important one criterion is
when compared to others.
**Scores are based upon a 1 to 10 scale where 1 is poor and 10 is excellent.
***Value consists of the weight of each factor multiplied by the firm’s score.
Industry Attractiveness
Industry attractiveness (Table 7.2) is measured based upon numerous factors:
some factors which are important are (1) market size, (2) industry growth rate, (3)
cumulative industry profitability, (4) favorable industry structure, (5) role of technology,
(6) presence of multi-national firms, (7) cumulative free cash flow, (8) lack of industry
competitiveness, and (9) market capitalization of firms within the industry.
A hypothetical industry attractiveness analysis is conducted in Table 2.
Cumulative industry profitability (criteria 3) and lack of industry competitiveness
(criteria 8) are the most important factors for determining industry attractiveness.
Cumulative industry profitability is marginally greater for Industry 1 compared to
Industry 2. Industry 1 has significantly higher cumulative profitability when compared to
industries 3 and 4.
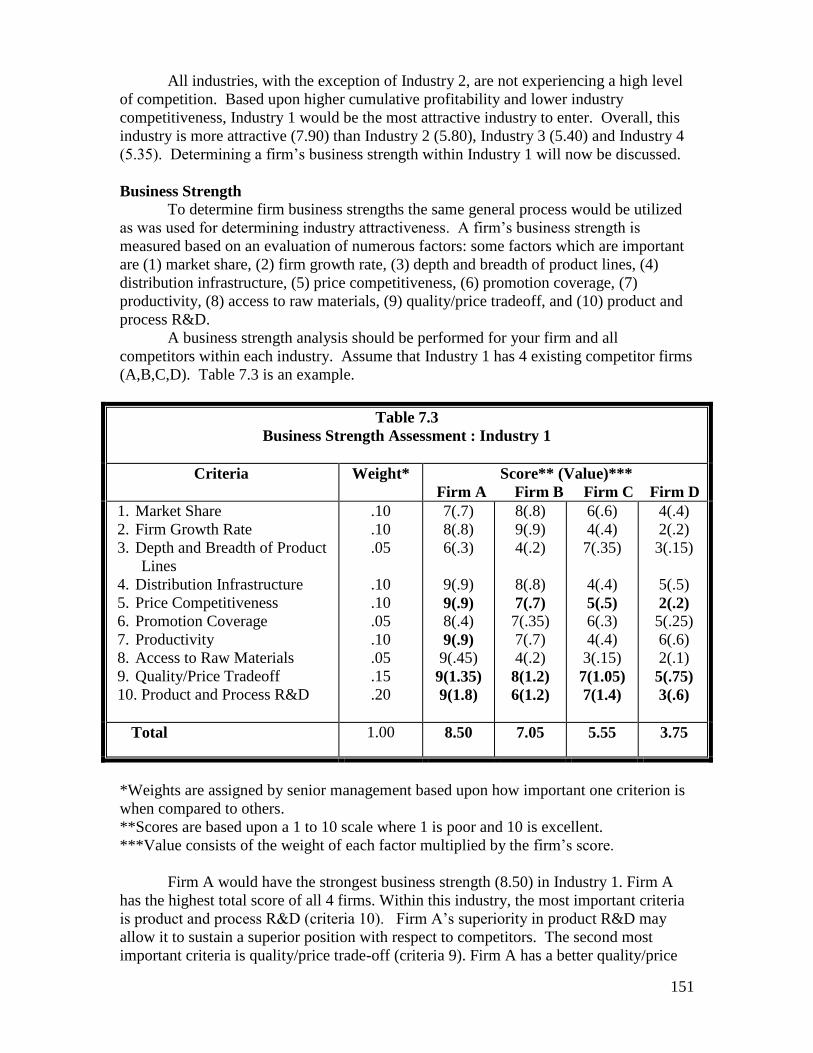
151
All industries, with the exception of Industry 2, are not experiencing a high level
of competition. Based upon higher cumulative profitability and lower industry
competitiveness, Industry 1 would be the most attractive industry to enter. Overall, this
industry is more attractive (7.90) than Industry 2 (5.80), Industry 3 (5.40) and Industry 4
(5.35). Determining a firm’s business strength within Industry 1 will now be discussed.
Business Strength
To determine firm business strengths the same general process would be utilized
as was used for determining industry attractiveness. A firm’s business strength is
measured based on an evaluation of numerous factors: some factors which are important
are (1) market share, (2) firm growth rate, (3) depth and breadth of product lines, (4)
distribution infrastructure, (5) price competitiveness, (6) promotion coverage, (7)
productivity, (8) access to raw materials, (9) quality/price tradeoff, and (10) product and
process R&D.
A business strength analysis should be performed for your firm and all
competitors within each industry. Assume that Industry 1 has 4 existing competitor firms
(A,B,C,D). Table 7.3 is an example.
Table 7.3
Business Strength Assessment : Industry 1
Criteria Weight* Score** (Value)***
Firm A Firm B Firm C Firm D
1. Market Share
2. Firm Growth Rate
3. Depth and Breadth of Product
Lines
4. Distribution Infrastructure
5. Price Competitiveness
6. Promotion Coverage
7. Productivity
8. Access to Raw Materials
9. Quality/Price Tradeoff
10. Product and Process R&D
.10
.10
.05
.10
.10
.05
.10
.05
.15
.20
7(.7)
8(.8)
6(.3)
9(.9)
9(.9)
8(.4)
9(.9)
9(.45)
9(1.35)
9(1.8)
8(.8)
9(.9)
4(.2)
8(.8)
7(.7)
7(.35)
7(.7)
4(.2)
8(1.2)
6(1.2)
6(.6)
4(.4)
7(.35)
4(.4)
5(.5)
6(.3)
4(.4)
3(.15)
7(1.05)
7(1.4)
4(.4)
2(.2)
3(.15)
5(.5)
2(.2)
5(.25)
6(.6)
2(.1)
5(.75)
3(.6)
Total 1.00 8.50 7.05 5.55 3.75
*Weights are assigned by senior management based upon how important one criterion is
when compared to others.
**Scores are based upon a 1 to 10 scale where 1 is poor and 10 is excellent.
***Value consists of the weight of each factor multiplied by the firm’s score.
Firm A would have the strongest business strength (8.50) in Industry 1. Firm A
has the highest total score of all 4 firms. Within this industry, the most important criteria
is product and process R&D (criteria 10). Firm A’s superiority in product R&D may
allow it to sustain a superior position with respect to competitors. The second most
important criteria is quality/price trade-off (criteria 9). Firm A has a better quality/price
152
tradeoff than other competitors. Future investments in product R&D may create new
products to provide differentiation for other competitors. Investments in process R&D
may improve efficiency and productivity. These investments may allow Firm A to
charge lower prices. Currently, Firm A is very competitively priced (Criteria 5) with
respect to other firms. These lower prices may increase market share and generate
economies of scale.
Firms C and D should exit Industry 1 because Firms A and B (Table 7.3) have
stronger overall business strength positions. Firms C and D should determine their
relative business strengths in industries 2, 3, and 4. Following an analysis similar to that
in Table 2, firms C and D may have much stronger business strength positions in
industries 2, 3, and/or 4.
Firm B’s approach is less clear. Industry 1 has the highest industry attractiveness
(Table 6.2). If Firm C or D exits, Firm B may be able to increase its market size within
Industry 1. Firm 2 should conduct the business strength assessment to determine its
relative business strength in Industry 2, 3, and 4. Firm 2 should allocate more funds to
whichever industry it has the strongest position in.
Because this approach evaluates competitors within industries based upon their
business strengths, it is an excellent planning tool. However, some assumptions have
been made: (1) all industries are privatized (2) industry competitiveness is assumed for a
specific point in time and (3) each industry is assumed to have high barriers to entry.
If firms decide to invest in new industries, they may need to restructure industries
they are currently in to obtain the necessary funds.
Restructuring Restructuring is changing the set of businesses that a firm focuses upon. Three
primary vehicles accomplish restructuring: downsizing, downscoping and realignment.
Downsizing will be addressed first.
Downsizing
Downsizing is a planned reduction in the number of employees. The primary
objective of downsizing is to reduce costs. If a firm is unprofitable, the first decision a
firm may make is to implement a reduction in payroll across all businesses. This
reduction is normally accomplished by laying off employees.
By engaging in across the board cuts, firms are not identifying which businesses
are more profitable than others. Payroll reductions are an internal firm process. Very
little is analyzed concerning the impact upon suppliers, customers, and competition. Care
must be taken to engage in reductions while still meeting the needs of all the firm’s
stakeholders. Extensive cost cutting can result in low employee morale. Employees may
be concerned that additional layoffs may eliminate them. Therefore, the remaining
employees may decrease productivity because their primary focus may be upon finding
another job.
The U.S. airline industry is a good example of downsizing. The more extensive
the cuts, the more unprofitable the airlines become. Virtually all of the U.S. based
airlines, with the exception of Southwest and Jet Blue, have had very significant
manpower reductions. With rising fuel prices continuing into 2012, these reductions
have continued. Downsizing occurs in many industries.
On May 5, 2005 IBM reduced its workforce by between 10,000 and 13,000
employees43
. With slow sales in Europe, IBM plans to realign its operating structure in
Europe to reduce overhead.
153
The automotive industry continued to be hit hard by downsizing throughout the
late 90’s and in to the next decade. General Motors steadily reduced its workforce by
eliminating thousands of jobs since 1995. Chrysler did not fare much better after the
company’s announcement to downsize beginning in 2007. The company announced an
immediate plan to cut 13,000 jobs impacting multiple U.S. plants in an attempt to return
to profitability in 2008.44
A number of company downsizing initiatives have occurred throughout the last
several years both within the United States as well as globally. These include: Lowe’s
2011 report to close multiple stores within the U.S. impacting 1,950 jobs and 20 stores
across the country,45
Verso Paper’s 2011 report to downsize, reduce production, and cut
300 jobs citing the cost of rising raw materials and low industry demand,46
and most
recently, Blockbuster and PepsiCo. Blockbuster continues to flirt with financial issues
into 2012 and made About.coms list of worst retail news in 2009 after cutting more than
10,000 retail jobs and closing 960 stores.47
PepsiCo issued news in February 2012 that it
would be cutting 8,700 jobs, indicating higher raw materials as one of the determining
factors in the company’s move toward a cost cutting strategy.48
Additional downsizing
events include STMicro, a Swiss chipmaker, laid off 9 percent of its employees in 200449
.
This reduction is a result of a declining demand for its products. Unilever, the primary
competitor of Proctor & Gamble, plans to downsize its workforce by 20,000 workers by
200950
. Unilever’s revenue is $50 billion compared to $77 billion for Proctor & Gamble.
In addition, Unilever employs 179,000 workers which Proctor & Gamble employs
138,000 workers51
. In addition, Pfizer is closing its R&D operations in the U.S. and
cutting 2100 workers52
. It will continue to outsource its R&D to Pacific Rim countries.
Downscoping is another form of restructuring.
Downscoping
Downscoping refers to the elimination of business units that are either
unprofitable or not related to a firm’s core competencies. Phillip Morris’ divestment of
Miller Brewing is an example. Phillip Morris’ core business is tobacco. For some time,
South African Brewers had desired to establish a position within North America. Their
acquisition of Miller achieved this objective and allowed Phillip Morris to concentrate
upon its core business of tobacco.
At times, a firm will attempt to downscope because a specific product line may
not be generating acceptable returns. For example, Proctor & Gamble may sell off the
Oral B division of Gillette because the division represents 15 percent of sales and 3
percent of net income. In addition, tooth care is not an area of strength for Gillette: its
expertise is in blades and razors. Blades and razors account for 41 percent of the sales of
Gillette and 68 percent of the profit.
Royal Dutch Shell is selling its Intergen NV power plant business to American
International Group and Ontario Teachers’ Pension Plan for $1.75 billion53
. Shell is
refocusing its business upon developing oil reserves. Adidas-Salomon is selling its
sporting goods division to Amer Sports (Finland) for $624 million54
. Adidas is re-
focusing its attention to concentrate on sport shoes and apparel segments of the industry.
Emmis Communications is selling its 16 television stations, which are valued at
approximately $1 billion55
. Emmis plans to use the funds to reduce debt and buy back
stock. General Electric is selling its self-storage business to Prudential Financial and
Extra Space Storage for $2.5 billion56
. General Electric will use the funds from this sale
to focus on its higher margin business segments.
154
The U.S. airlines have also engaged in downscoping. American Airlines has
recently spun off its regional carrier, American Eagle57
. This follows similar actions at
Delta, Continental, Northwest and United of selling off regional carriers. The airlines
logic is that they can contract the same flights and services at lower cost58
.
Fujitsu has spun off its manufacturing of LSI chips as it exits the semiconductor
business59
. While Fujitsu makes hardware products including PC’s, network equipment
and components, the majority of its profits come from its software and consulting
services60
.
Realignment
Realignment refers to a substantial change in a firms’ organizational structure.
After reaching an agreement to acquire Compaq in September 2001, Hewlett Packard
continued to experience organizational changes into 2005 when HP separated its PC
business from other parts of the firm. Also in June 2005, Viacom decided to split into
two firms. The split separated the company’s cable channels and film studio from its
broadcast television and radio operations. Viacom Inc. includes cable networks and
entertainment (e.g. movies). CBS Corp. includes television, radio, outdoor advertising
and one cable network (Showtime). Ford Motors Inc. has agreed to restructure its former
partner, the auto parts maker Visteon, by spending between $1.6 and $1.8 billion to
appeal to a more diverse customer base.
Aon Corp., the world’s largest insurance broker has sold off two of its businesses.
Its Combine Insurance Co. of America has been sold to Ace Limited for $2.4 billion61
.
Also, its Munich Re AG was sold for $352 million to Sterling Life Insurance. Aon
believes these moves will allow it to re-focus on its brokerage and consulting business62
.
In 2008, Philip Morris created PMI as a standalone business from Philip Morris63
.
This move would free Philip Morris from litigation within the U.S. which has hindered
growth. PMI would operate as an independent firm. It would be able to focus upon the
growth markets within the tobacco industry: Brazil, Russia, India, and China64
.
Restructuring and the Capstone Simulation Andrews has one product in each segment. All products with the exception of the
high end product have positive net margins (Table 7.4: section b). Andrews’ high end
product has a negative net margin (46). Adam is only using 33 percent of its production
capacity on its high end product (Table 7.6). This product is generating 97 units of
inventory. Andrews may want to sell 900 units of first shift capacity of Adam’s
production capacity and use the funds to increase the capacity of its new product (Ate).
Ate could be a successful new product in the high end segment. Andrews’ size product
(Agape) is only producing 62 percent of its capacity (Table 7.6). This product is well
positioned within the size segment (inventory of 8 units) (Table 7.6). Andrews’
traditional product (Able) and its low end product (Acre) are Andrews’ most profitable
products (Table 7.4: section b). These products are generating minimal inventory (Table
7.6). As such, capacity should be bought and automation should be increased.
Baldwin has one product in the traditional, low end, and size segments. It has two
products in the high end segment and no products in the performance segment. Its
traditional, low end, and one of its high end products are profitable. Baldwin is incurring
minimal losses on its second high end product and its size product (Table 7.4: section b).
Baldwin’s low end product, Bead, has a strong position in the low end segment: minimal
(150 units) of inventory. Since this is a price sensitive segment, Baldwin needs to
increase its automation and add capacity after plant capacity exceeds 150 percent. The
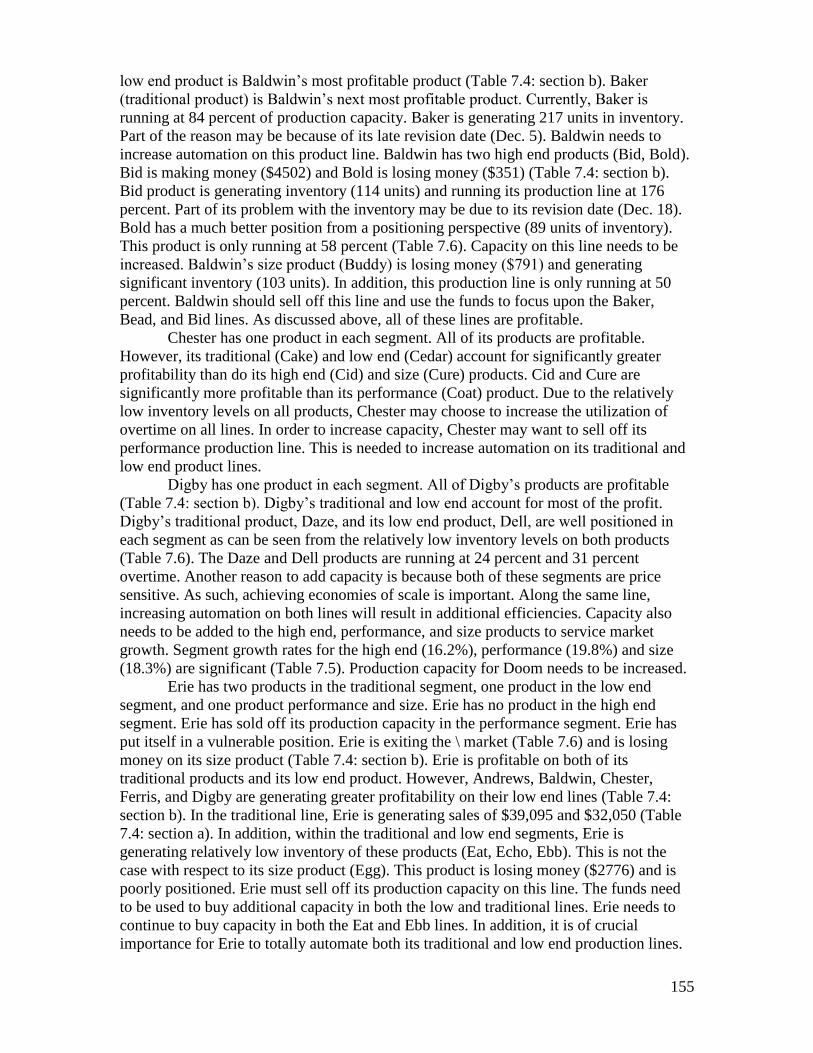
155
low end product is Baldwin’s most profitable product (Table 7.4: section b). Baker
(traditional product) is Baldwin’s next most profitable product. Currently, Baker is
running at 84 percent of production capacity. Baker is generating 217 units in inventory.
Part of the reason may be because of its late revision date (Dec. 5). Baldwin needs to
increase automation on this product line. Baldwin has two high end products (Bid, Bold).
Bid is making money ($4502) and Bold is losing money ($351) (Table 7.4: section b).
Bid product is generating inventory (114 units) and running its production line at 176
percent. Part of its problem with the inventory may be due to its revision date (Dec. 18).
Bold has a much better position from a positioning perspective (89 units of inventory).
This product is only running at 58 percent (Table 7.6). Capacity on this line needs to be
increased. Baldwin’s size product (Buddy) is losing money ($791) and generating
significant inventory (103 units). In addition, this production line is only running at 50
percent. Baldwin should sell off this line and use the funds to focus upon the Baker,
Bead, and Bid lines. As discussed above, all of these lines are profitable.
Chester has one product in each segment. All of its products are profitable.
However, its traditional (Cake) and low end (Cedar) account for significantly greater
profitability than do its high end (Cid) and size (Cure) products. Cid and Cure are
significantly more profitable than its performance (Coat) product. Due to the relatively
low inventory levels on all products, Chester may choose to increase the utilization of
overtime on all lines. In order to increase capacity, Chester may want to sell off its
performance production line. This is needed to increase automation on its traditional and
low end product lines.
Digby has one product in each segment. All of Digby’s products are profitable
(Table 7.4: section b). Digby’s traditional and low end account for most of the profit.
Digby’s traditional product, Daze, and its low end product, Dell, are well positioned in
each segment as can be seen from the relatively low inventory levels on both products
(Table 7.6). The Daze and Dell products are running at 24 percent and 31 percent
overtime. Another reason to add capacity is because both of these segments are price
sensitive. As such, achieving economies of scale is important. Along the same line,
increasing automation on both lines will result in additional efficiencies. Capacity also
needs to be added to the high end, performance, and size products to service market
growth. Segment growth rates for the high end (16.2%), performance (19.8%) and size
(18.3%) are significant (Table 7.5). Production capacity for Doom needs to be increased.
Erie has two products in the traditional segment, one product in the low end
segment, and one product performance and size. Erie has no product in the high end
segment. Erie has sold off its production capacity in the performance segment. Erie has
put itself in a vulnerable position. Erie is exiting the \ market (Table 7.6) and is losing
money on its size product (Table 7.4: section b). Erie is profitable on both of its
traditional products and its low end product. However, Andrews, Baldwin, Chester,
Ferris, and Digby are generating greater profitability on their low end lines (Table 7.4:
section b). In the traditional line, Erie is generating sales of $39,095 and $32,050 (Table
7.4: section a). In addition, within the traditional and low end segments, Erie is
generating relatively low inventory of these products (Eat, Echo, Ebb). This is not the
case with respect to its size product (Egg). This product is losing money ($2776) and is
poorly positioned. Erie must sell off its production capacity on this line. The funds need
to be used to buy additional capacity in both the low and traditional lines. Erie needs to
continue to buy capacity in both the Eat and Ebb lines. In addition, it is of crucial
importance for Erie to totally automate both its traditional and low end production lines.
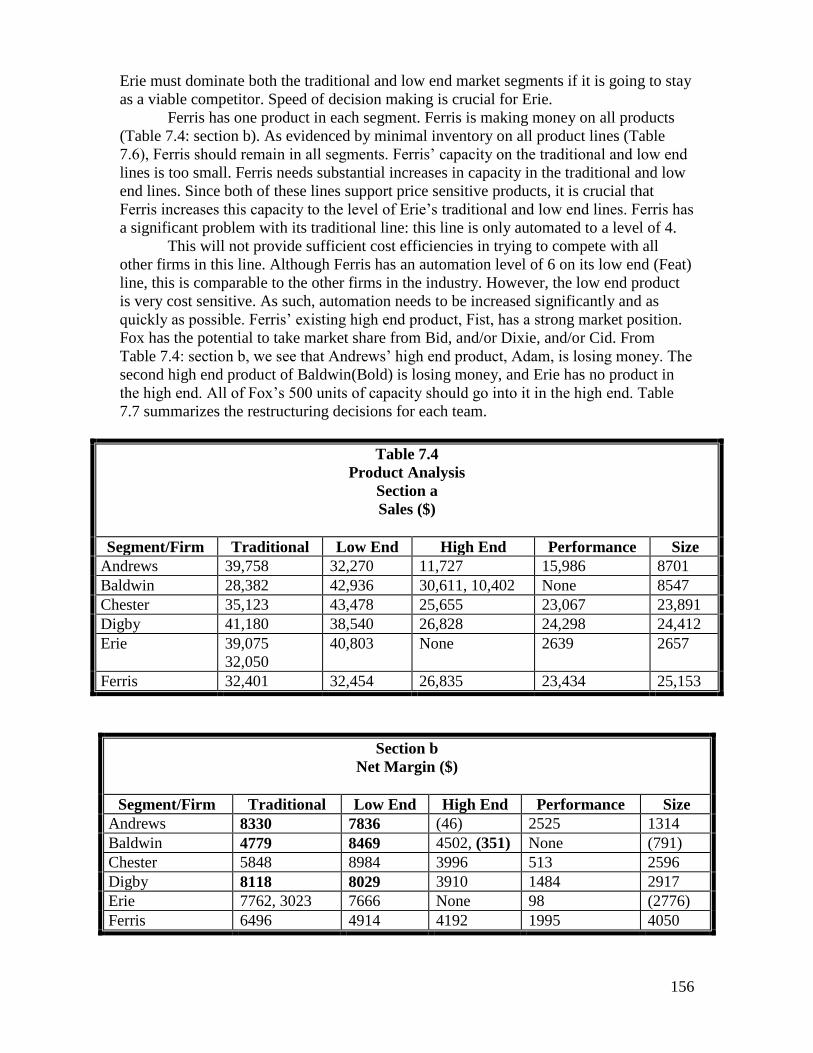
156
Erie must dominate both the traditional and low end market segments if it is going to stay
as a viable competitor. Speed of decision making is crucial for Erie.
Ferris has one product in each segment. Ferris is making money on all products
(Table 7.4: section b). As evidenced by minimal inventory on all product lines (Table
7.6), Ferris should remain in all segments. Ferris’ capacity on the traditional and low end
lines is too small. Ferris needs substantial increases in capacity in the traditional and low
end lines. Since both of these lines support price sensitive products, it is crucial that
Ferris increases this capacity to the level of Erie’s traditional and low end lines. Ferris has
a significant problem with its traditional line: this line is only automated to a level of 4.
This will not provide sufficient cost efficiencies in trying to compete with all
other firms in this line. Although Ferris has an automation level of 6 on its low end (Feat)
line, this is comparable to the other firms in the industry. However, the low end product
is very cost sensitive. As such, automation needs to be increased significantly and as
quickly as possible. Ferris’ existing high end product, Fist, has a strong market position.
Fox has the potential to take market share from Bid, and/or Dixie, and/or Cid. From
Table 7.4: section b, we see that Andrews’ high end product, Adam, is losing money. The
second high end product of Baldwin(Bold) is losing money, and Erie has no product in
the high end. All of Fox’s 500 units of capacity should go into it in the high end. Table
7.7 summarizes the restructuring decisions for each team.
Table 7.4
Product Analysis
Section a
Sales ($)
Segment/Firm Traditional Low End High End Performance Size
Andrews 39,758 32,270 11,727 15,986 8701
Baldwin 28,382 42,936 30,611, 10,402 None 8547
Chester 35,123 43,478 25,655 23,067 23,891
Digby 41,180 38,540 26,828 24,298 24,412
Erie 39,075
32,050
40,803 None 2639 2657
Ferris 32,401 32,454 26,835 23,434 25,153
Section b
Net Margin ($)
Segment/Firm Traditional Low End High End Performance Size
Andrews 8330 7836 (46) 2525 1314
Baldwin 4779 8469 4502, (351) None (791)
Chester 5848 8984 3996 513 2596
Digby 8118 8029 3910 1484 2917
Erie 7762, 3023 7666 None 98 (2776)
Ferris 6496 4914 4192 1995 4050
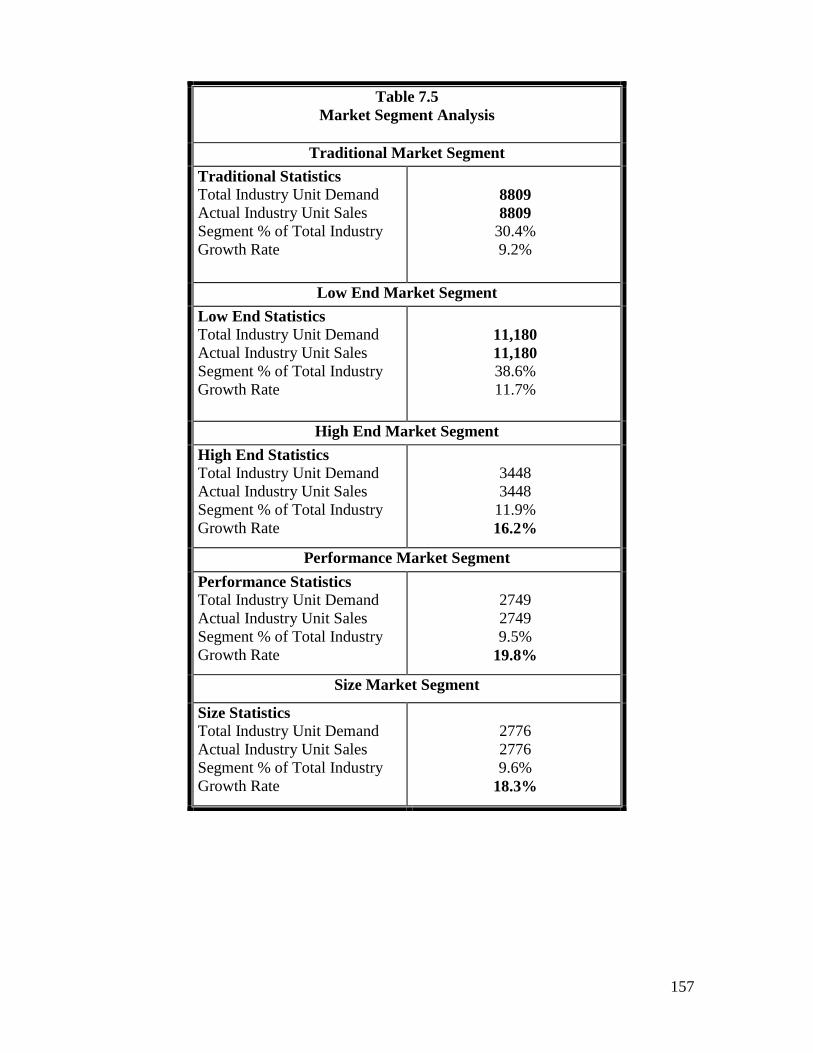
157
Table 7.5
Market Segment Analysis
Traditional Market Segment
Traditional Statistics
Total Industry Unit Demand
Actual Industry Unit Sales
Segment % of Total Industry
Growth Rate
8809
8809
30.4%
9.2%
Low End Market Segment
Low End Statistics
Total Industry Unit Demand
Actual Industry Unit Sales
Segment % of Total Industry
Growth Rate
11,180
11,180
38.6%
11.7%
High End Market Segment
High End Statistics
Total Industry Unit Demand
Actual Industry Unit Sales
Segment % of Total Industry
Growth Rate
3448
3448
11.9%
16.2%
Performance Market Segment
Performance Statistics
Total Industry Unit Demand
Actual Industry Unit Sales
Segment % of Total Industry
Growth Rate
2749
2749
9.5%
19.8%
Size Market Segment
Size Statistics
Total Industry Unit Demand
Actual Industry Unit Sales
Segment % of Total Industry
Growth Rate
2776
2776
9.6%
18.3%
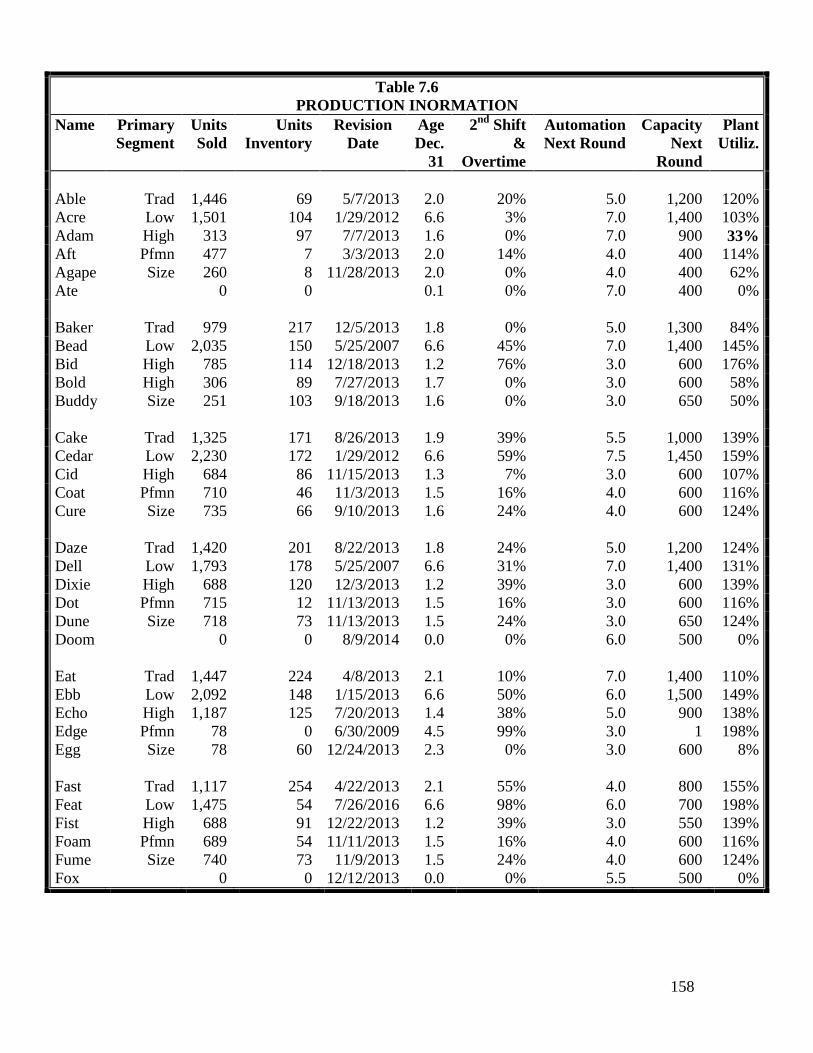
158
Table 7.6
PRODUCTION INORMATION
Name Primary
Segment
Units
Sold
Units
Inventory
Revision
Date
Age
Dec.
31
2nd
Shift
&
Overtime
Automation
Next Round
Capacity
Next
Round
Plant
Utiliz.
Able Trad 1,446 69 5/7/2013 2.0 20% 5.0 1,200 120%
Acre Low 1,501 104 1/29/2012 6.6 3% 7.0 1,400 103%
Adam High 313 97 7/7/2013 1.6 0% 7.0 900 33%
Aft Pfmn 477 7 3/3/2013 2.0 14% 4.0 400 114%
Agape
Ate
Size 260
0
8
0
11/28/2013 2.0
0.1
0%
0%
4.0
7.0
400
400
62%
0%
Baker Trad 979 217 12/5/2013 1.8 0% 5.0 1,300 84%
Bead Low 2,035 150 5/25/2007 6.6 45% 7.0 1,400 145%
Bid High 785 114 12/18/2013 1.2 76% 3.0 600 176%
Bold
Buddy
High
Size
306
251
89
103
7/27/2013
9/18/2013
1.7
1.6
0%
0%
3.0
3.0
600
650
58%
50%
Cake Trad 1,325 171 8/26/2013 1.9 39% 5.5 1,000 139%
Cedar Low 2,230 172 1/29/2012 6.6 59% 7.5 1,450 159%
Cid High 684 86 11/15/2013 1.3 7% 3.0 600 107%
Coat
Cure
Pfmn
Size
710
735
46
66
11/3/2013
9/10/2013
1.5
1.6
16%
24%
4.0
4.0
600
600
116%
124%
Daze Trad 1,420 201 8/22/2013 1.8 24% 5.0 1,200 124%
Dell Low 1,793 178 5/25/2007 6.6 31% 7.0 1,400 131%
Dixie High 688 120 12/3/2013 1.2 39% 3.0 600 139%
Dot Pfmn 715 12 11/13/2013 1.5 16% 3.0 600 116%
Dune Size 718 73 11/13/2013 1.5 24% 3.0 650 124%
Doom
Eat
Ebb
Echo
Edge
Egg
Fast
Feat
Fist
Foam
Fume
Fox
Trad
Low
High
Pfmn
Size
Trad
Low
High
Pfmn
Size
0
1,447
2,092
1,187
78
78
1,117
1,475
688
689
740
0
0
224
148
125
0
60
254
54
91
54
73
0
8/9/2014
4/8/2013
1/15/2013
7/20/2013
6/30/2009
12/24/2013
4/22/2013
7/26/2016
12/22/2013
11/11/2013
11/9/2013
12/12/2013
0.0
2.1
6.6
1.4
4.5
2.3
2.1
6.6
1.2
1.5
1.5
0.0
0%
10%
50%
38%
99%
0%
55%
98%
39%
16%
24%
0%
6.0
7.0
6.0
5.0
3.0
3.0
4.0
6.0
3.0
4.0
4.0
5.5
500
1,400
1,500
900
1
600
800
700
550
600
600
500
0%
110%
149%
138%
198%
8%
155%
198%
139%
116%
124%
0%
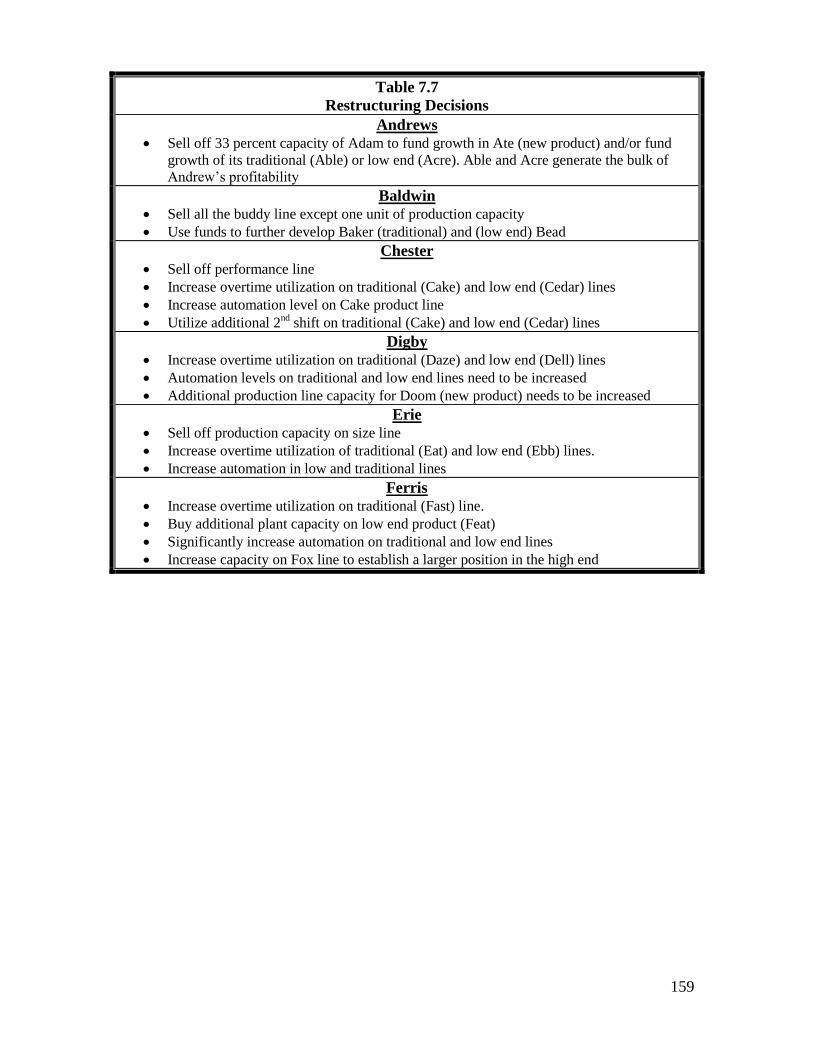
159
Table 7.7
Restructuring Decisions
Andrews
Sell off 33 percent capacity of Adam to fund growth in Ate (new product) and/or fund
growth of its traditional (Able) or low end (Acre). Able and Acre generate the bulk of
Andrew’s profitability
Baldwin
Sell all the buddy line except one unit of production capacity
Use funds to further develop Baker (traditional) and (low end) Bead
Chester
Sell off performance line
Increase overtime utilization on traditional (Cake) and low end (Cedar) lines
Increase automation level on Cake product line
Utilize additional 2nd
shift on traditional (Cake) and low end (Cedar) lines
Digby
Increase overtime utilization on traditional (Daze) and low end (Dell) lines
Automation levels on traditional and low end lines need to be increased
Additional production line capacity for Doom (new product) needs to be increased
Erie
Sell off production capacity on size line
Increase overtime utilization of traditional (Eat) and low end (Ebb) lines.
Increase automation in low and traditional lines
Ferris
Increase overtime utilization on traditional (Fast) line.
Buy additional plant capacity on low end product (Feat)
Significantly increase automation on traditional and low end lines
Increase capacity on Fox line to establish a larger position in the high end
160
Discussion Questions
1. Explain why performance varies for different types of acquisitions.
2. Do managers and shareholders view the relationship between diversification and risk
similarly? Explain.
3. Which financial statement(s) should be examined when engaging in restructuring
decisions? Explain.
4. Explain the G.E. matrix: which segments should the firm invest in? Which segments
should the firm divest? Why?
5. Which restructuring process is recommended? Why?
6. How is a business strength assessment conducted?
7. Why is year ending cash flow important?
161
References
1. Grant, R. 2005. Contemporary strategy analysis, Blackwell: Oxford, England.
2. Rumelt, R. 1974. Strategy, structure, and economic performance. Harvard Business
School Press. Boston, MA.
3. Ibid
4. Ibid
5. Ibid
6. Ibid
7. Ibid
8. Ibid
9. Ibid
10. Ibid
11. Ibid
12. Ibid
13. Ibid
14. Ibid
15. Chatterjee, S. and Wernerfelt, B. 1991. The link between resources and type of
diversification: theory and evidence, Strategic Management Journal. 12(1), 33-48.
16. Palich, L., Cardinal, L., and Miller, C. 2000. Curvilinearity in the diversification
performance linkage: an examination of over three decades of research, Strategic
Management Journal. 12, 155-174.
17. Ibid
18. Porter, M. 1987. From competitive advantage to corporate strategy. Harvard
Business Review. 65(3), 43-59.
19. Chang, S. and Singh, H. 1999. The impact of modes of entry and resource fit on
modes of exit by multi-business firms. Strategic Management Journal. 20: 1019-
1035
20. Barta, P. 2007. Mine deals to unclog bottlenecks. Wall Street Journal.
162
21. Gold, R. and Chazan, G. 2007. Occidental, OMV cut deal with Libya. Wall Street
Journal. November 27.
22. Ibid
23. Ibid
24. Lee Y. 2007. Arcelor seeks control of Chinese steelmaker. Wall Street Journal.
December 20.
25. Etter, L. 2007. Verasun-US Bioenergy deal to form ethanol titan. Wall Street
Journal. November 11.
26. Chrysler CEO expects $1.6 Billion loss this year. Wall Street Journal.
27. Trottman M. 2007. Can US Airways pass test of time? Wall Street Journal.
December 26.
28. Ibid
29. Sharma, A. 2008. After Sprint and Nextel merge, customers and executives leave.
Wall Street Journal. December 23.
30. Ibid
31. Ibid
32. ______________, Global Santa Fe Acquires Transocean but not any additional oil
sites. Wall Street Journal. December 7.
33. ___________ 2007. One cool acquisition. Wall Street Journal. December 7.
34. ___________ 2007. Acquisition to expand Microsoft’s map services. Wall Street
Journal. December 6.
35. Santini, L. 2007. Ping An’s Fortis stake brings insurer expertise. Wall Street
Journal. December 28.
36. Ibid
37. Martinez, B. and Goldstein, J. 2007. Big pharma faces grim prognosis. Wall Street
Journal. December 27.
38. Stewart, R. 2007. South Africa’s Naspers to buy Tradus PLC. Wall Street Journal.
December 4.
39. ____________ 2007. Campbell soup, chocolate Godiva. Wall Street Journal.
December 4
163
40. Kachi, H. 2007. Japan tobacco, Nissin buy frozen-foods maker. Wall Street Journal.
41. Gelnar, M. 2007. Richemont raises profile with Tobacco-sping Plan. Wall Street
Journal. ______
42. Prahalad, C. &Bettis, R. 1986. The dominant logic: a new linkage between diversity
and performance. Strategic Management Journal. 6: 485-502.
43. Associated Press/MSNBC, 02/16/2007,
http://www.msnbc.msn.com/id/17183711/ns/business-autos/t/chrysler-downsizing-
affect-midwest-plants/#.T29gvtnNkUo
44. Companies Downsizing for October 2011, The Los Angeles Post, 03/25/2012,
http://www.thelosangelespost.org/companies-downsizing-october-2011/
45. Farfar, Barbara, Blockbuster – Worst Downsizing News and Results in 2009,
About.com Retail Industry, 03/25/12,
http://retailindustry.about.com/od/americanretailhistory/ig/2009-Retail-Best-and-
Worst/Worst-of-2009---Blockbuster.htm
46. Anderson, Mae, PepsiCo Layoffs: World’s Second Largest Food Company Cutting
8,700 Jobs Despite Higher Revenue, Huffington Post,
http://www.thelosangelespost.org/companies-downsizing-october-2011/
47. Forelle, C. 2005. IBM plans restructuring and job cuts. Wall Street Journal. May 5.
48. Logrotteria, B. 2005. STMicro to cut staff outside Asia. Wall Street Journal. May 17.
49. Ball, D. and Patrick, A. 2007. How a Unilever executive is thinning the ranks. Wall
Street Journal. November 27.
50. Ibid
51. Johnson, A. 2007. As drug industry struggles, chemists face layoff wave. Wall
Street Journal. December 11.
52. Berman, D. and Singer, J. 2005. Shell is selling Intergen unit to investor duo for
$1.75 billion. Wall Street Journal. April 20.
53. Frey, G. 2005. Dow Jones Newswires. Wall Street Journal. May 3.
54. McBride, S. 2005. Emmis plans to sell 16 TV stations. Wall Street Journal. May
10.
55. Kranhold, K. and Berman, D. 2005. G.E. weighs sale of storage unit for $2.5 billion.
Wall Street Journal. April 25.
164
56. Trottman, M. 2007. AMR will shed American Eagle. Wall Street Journal.
November 27.
57. Ibid
58. Alabaster, J. 2008. Fujitsu moves to split off chip business. Wall Street Journal.
January 22.
59. Ibid
60. Kuykendall, L. 2007. AON exits underwriting business in deals with ACE, Munich
Re. Wall Street Journal. November 27.
61. Ibid
62. O’Connell, V. 2008. Philip Morris readies aggressive global push. Wall Street
Journal. January 29.
63. Ibid
64. Ibid
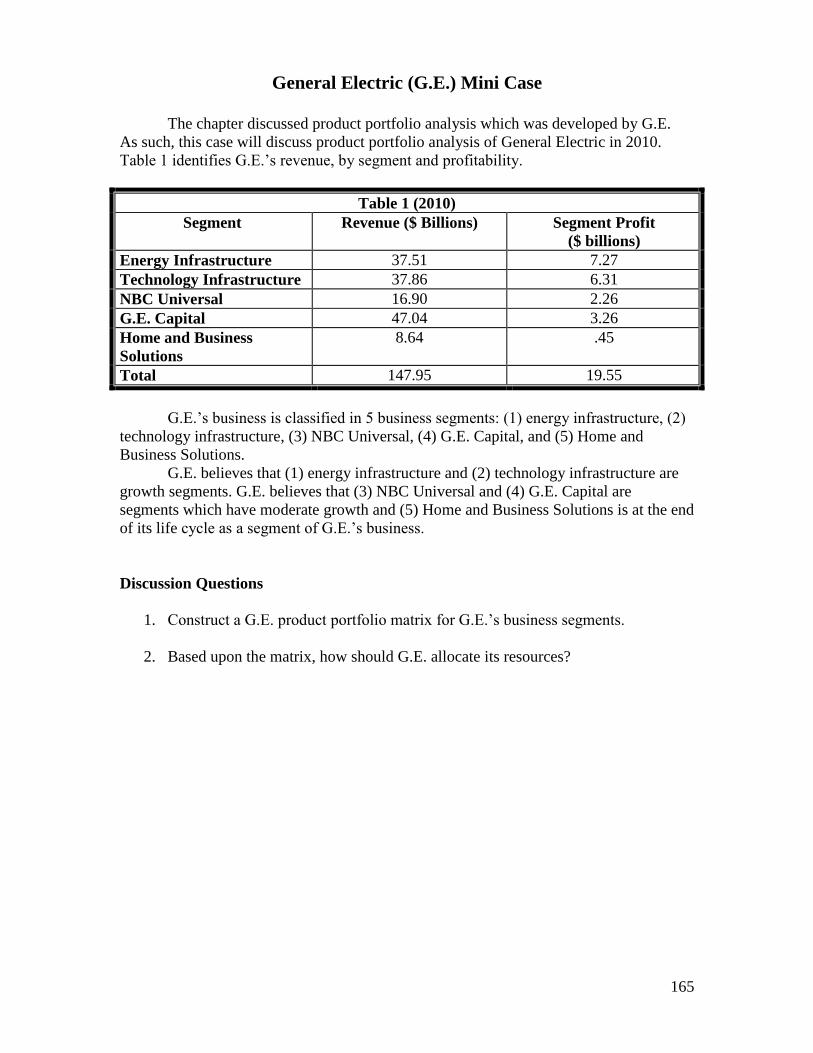
165
General Electric (G.E.) Mini Case
The chapter discussed product portfolio analysis which was developed by G.E.
As such, this case will discuss product portfolio analysis of General Electric in 2010.
Table 1 identifies G.E.’s revenue, by segment and profitability.
Table 1 (2010)
Segment Revenue ($ Billions) Segment Profit
($ billions)
Energy Infrastructure 37.51 7.27
Technology Infrastructure 37.86 6.31
NBC Universal 16.90 2.26
G.E. Capital 47.04 3.26
Home and Business
Solutions
8.64 .45
Total 147.95 19.55
G.E.’s business is classified in 5 business segments: (1) energy infrastructure, (2)
technology infrastructure, (3) NBC Universal, (4) G.E. Capital, and (5) Home and
Business Solutions.
G.E. believes that (1) energy infrastructure and (2) technology infrastructure are
growth segments. G.E. believes that (3) NBC Universal and (4) G.E. Capital are
segments which have moderate growth and (5) Home and Business Solutions is at the end
of its life cycle as a segment of G.E.’s business.
Discussion Questions
1. Construct a G.E. product portfolio matrix for G.E.’s business segments.
2. Based upon the matrix, how should G.E. allocate its resources?

166
Harvard Business Cases for Chapter 7
NTT DOMO – Joint Venture with Tata in Indian Mobile Telecom
Product Number W10004
UTV and Disney: A Strategic Alliance
Product Number 910M43
Professor Case for Chapter 7
Oracle

167
Chapter 8
Growth Via Strategic Alliances

168
Learning and Assessment Goals
1. Understand key factors to consider in strategic alliance formation.
2. Understand how strategic alliances can be modes of domestic and international
growth.
3. Understand the different types of strategic alliances and the benefits each type can
generate.
4. Understand the role that joint ventures play in firm growth.
5. Develop an understanding of the downside of strategic alliances.
169
Strategic alliances are agreements among firms in which each commits resources
to achieve a common set of objectives. Strategic alliances result when firms agree to
share resources for R&D, manufacturing, and/or distribution. Companies may form
strategic alliances with a wide variety of players: customers, suppliers, universities or
divisions of government. Through strategic alliances, companies can improve
competitive positioning, gain entry to new markets, supplement critical skills and share
the risk or cost of major development projects.
To form a strategic alliance, companies should: (1) define their business vision
and strategy in order to understand how an alliance fits their objectives, (2) evaluate and
select potential partners based on the level of synergy and the ability of the firms to work
together, (3) develop a working relationship and mutual recognition of opportunities with
the prospective partner, (4) negotiate and implement a formal agreement that includes
systems to monitor performance4.
Strategic alliances are formed for many reasons. Some rationales are to: (1)
reduce costs through economies of scale or increase knowledge, (2) increase access to
new technology, (3) inhibit competitors, (4) enter new markets, (5) reduce cycle time.
One benefit of strategic alliances is that the firm does not need to invest
significant capital to engage in them. A second benefit is that strategic alliances may
result in quicker growth than internal development. A third benefit is that it is easier to
withdraw from alliances as opposed to acquisitions or internal development. With
acquisitions the firm must divest businesses, which can be time-consuming. With
internal development, this type of growth may have become an integral part of the firm
and may not be divestible. Figure 8.1, on the next page, discusses strategic alliance
formations.
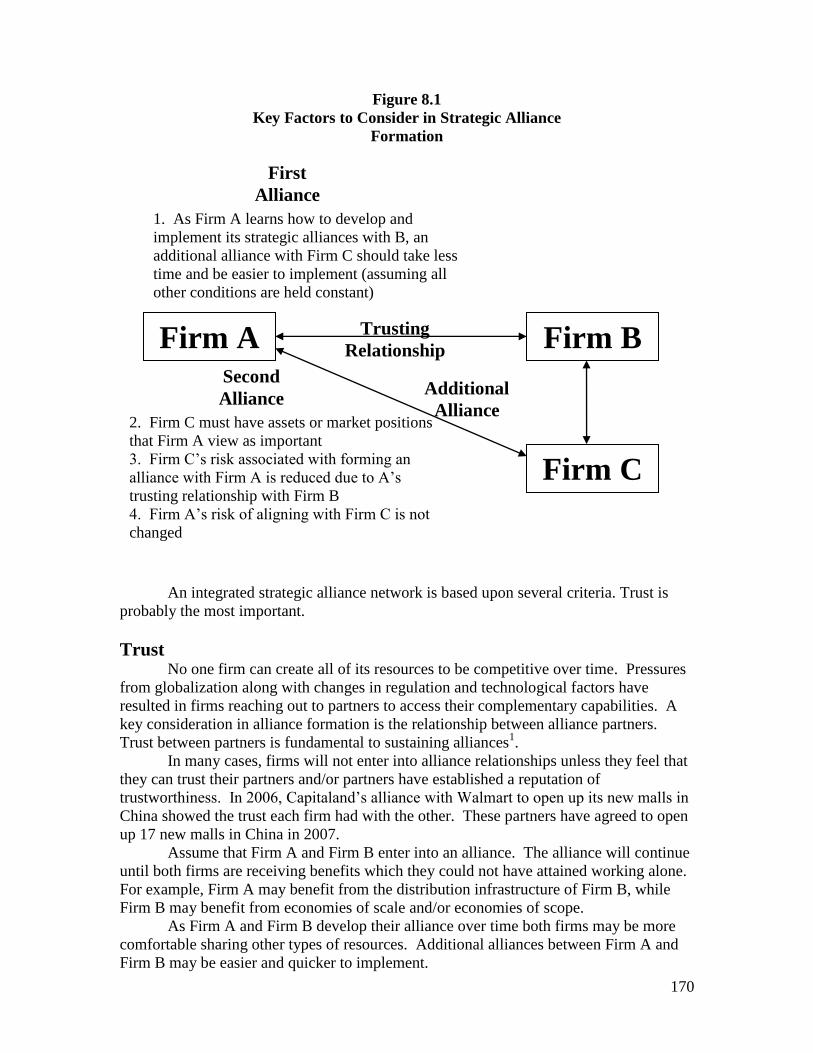
170
Figure 8.1
Key Factors to Consider in Strategic Alliance
Formation
An integrated strategic alliance network is based upon several criteria. Trust is
probably the most important.
Trust No one firm can create all of its resources to be competitive over time. Pressures
from globalization along with changes in regulation and technological factors have
resulted in firms reaching out to partners to access their complementary capabilities. A
key consideration in alliance formation is the relationship between alliance partners.
Trust between partners is fundamental to sustaining alliances1.
In many cases, firms will not enter into alliance relationships unless they feel that
they can trust their partners and/or partners have established a reputation of
trustworthiness. In 2006, Capitaland’s alliance with Walmart to open up its new malls in
China showed the trust each firm had with the other. These partners have agreed to open
up 17 new malls in China in 2007.
Assume that Firm A and Firm B enter into an alliance. The alliance will continue
until both firms are receiving benefits which they could not have attained working alone.
For example, Firm A may benefit from the distribution infrastructure of Firm B, while
Firm B may benefit from economies of scale and/or economies of scope.
As Firm A and Firm B develop their alliance over time both firms may be more
comfortable sharing other types of resources. Additional alliances between Firm A and
Firm B may be easier and quicker to implement.
Firm A Firm B
Firm C
1. As Firm A learns how to develop and
implement its strategic alliances with B, an
additional alliance with Firm C should take less
time and be easier to implement (assuming all
other conditions are held constant)
Trusting
Relationship
Additional
Alliance
Second
Alliance
2. Firm C must have assets or market positions
that Firm A view as important
3. Firm C’s risk associated with forming an
alliance with Firm A is reduced due to A’s
trusting relationship with Firm B
4. Firm A’s risk of aligning with Firm C is not
changed
First
Alliance
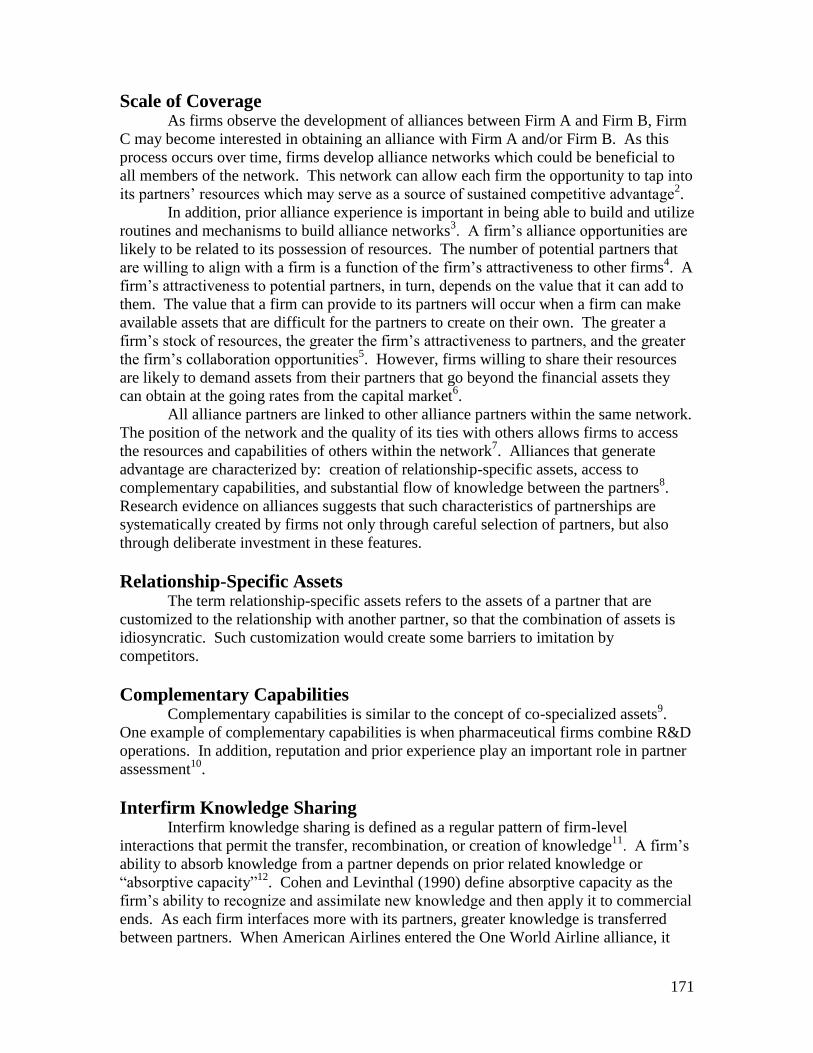
171
Scale of Coverage As firms observe the development of alliances between Firm A and Firm B, Firm
C may become interested in obtaining an alliance with Firm A and/or Firm B. As this
process occurs over time, firms develop alliance networks which could be beneficial to
all members of the network. This network can allow each firm the opportunity to tap into
its partners’ resources which may serve as a source of sustained competitive advantage2.
In addition, prior alliance experience is important in being able to build and utilize
routines and mechanisms to build alliance networks3. A firm’s alliance opportunities are
likely to be related to its possession of resources. The number of potential partners that
are willing to align with a firm is a function of the firm’s attractiveness to other firms4. A
firm’s attractiveness to potential partners, in turn, depends on the value that it can add to
them. The value that a firm can provide to its partners will occur when a firm can make
available assets that are difficult for the partners to create on their own. The greater a
firm’s stock of resources, the greater the firm’s attractiveness to partners, and the greater
the firm’s collaboration opportunities5. However, firms willing to share their resources
are likely to demand assets from their partners that go beyond the financial assets they
can obtain at the going rates from the capital market6.
All alliance partners are linked to other alliance partners within the same network.
The position of the network and the quality of its ties with others allows firms to access
the resources and capabilities of others within the network7. Alliances that generate
advantage are characterized by: creation of relationship-specific assets, access to
complementary capabilities, and substantial flow of knowledge between the partners8.
Research evidence on alliances suggests that such characteristics of partnerships are
systematically created by firms not only through careful selection of partners, but also
through deliberate investment in these features.
Relationship-Specific Assets The term relationship-specific assets refers to the assets of a partner that are
customized to the relationship with another partner, so that the combination of assets is
idiosyncratic. Such customization would create some barriers to imitation by
competitors.
Complementary Capabilities Complementary capabilities is similar to the concept of co-specialized assets
9.
One example of complementary capabilities is when pharmaceutical firms combine R&D
operations. In addition, reputation and prior experience play an important role in partner
assessment10
.
Interfirm Knowledge Sharing Interfirm knowledge sharing is defined as a regular pattern of firm-level
interactions that permit the transfer, recombination, or creation of knowledge11
. A firm’s
ability to absorb knowledge from a partner depends on prior related knowledge or
“absorptive capacity”12
. Cohen and Levinthal (1990) define absorptive capacity as the
firm’s ability to recognize and assimilate new knowledge and then apply it to commercial
ends. As each firm interfaces more with its partners, greater knowledge is transferred
between partners. When American Airlines entered the One World Airline alliance, it
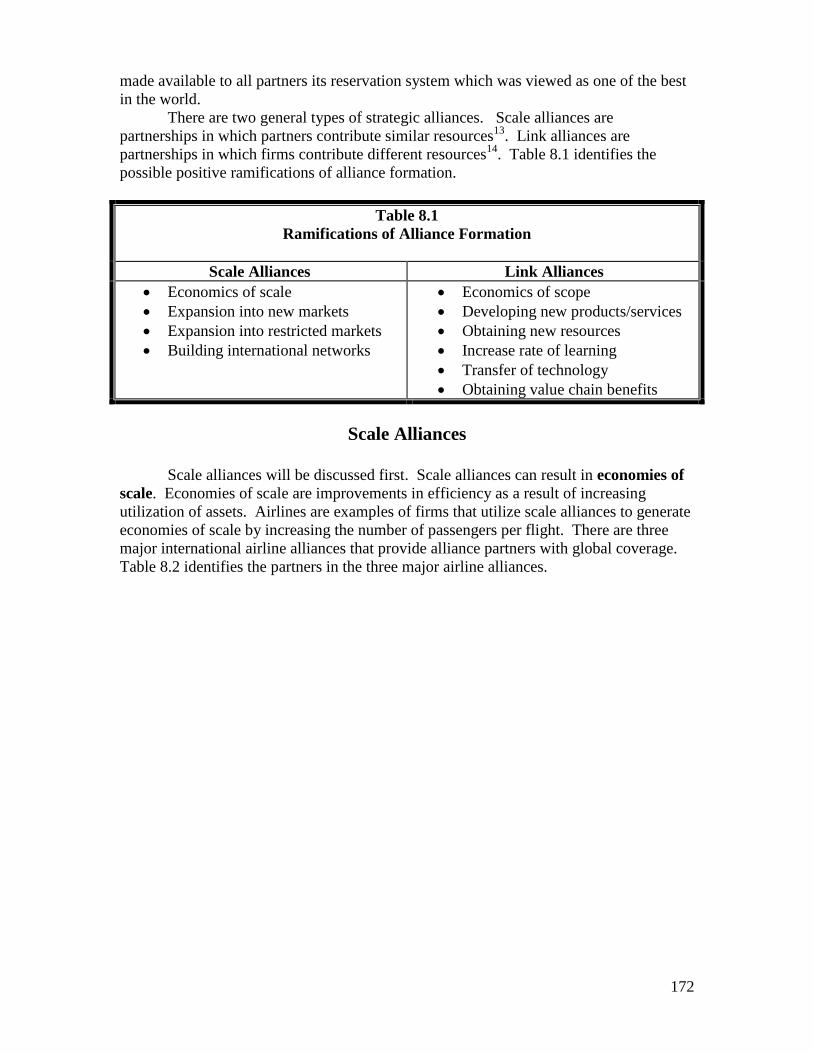
172
made available to all partners its reservation system which was viewed as one of the best
in the world.
There are two general types of strategic alliances. Scale alliances are
partnerships in which partners contribute similar resources13
. Link alliances are
partnerships in which firms contribute different resources14
. Table 8.1 identifies the
possible positive ramifications of alliance formation.
Table 8.1
Ramifications of Alliance Formation
Scale Alliances Link Alliances
Economics of scale
Expansion into new markets
Expansion into restricted markets
Building international networks
Economics of scope
Developing new products/services
Obtaining new resources
Increase rate of learning
Transfer of technology
Obtaining value chain benefits
Scale Alliances
Scale alliances will be discussed first. Scale alliances can result in economies of
scale. Economies of scale are improvements in efficiency as a result of increasing
utilization of assets. Airlines are examples of firms that utilize scale alliances to generate
economies of scale by increasing the number of passengers per flight. There are three
major international airline alliances that provide alliance partners with global coverage.
Table 8.2 identifies the partners in the three major airline alliances.
173
Table 8.2
Global Airline Alliances (2012)
Star
OneWorld
Skyteam
Adria American Airlines Aeroflot
Aegean British Airways Aeromexico
Air Canada Cathay Pacific Air Europa
Air China Finnair Air France
Air New Zealand Iberia Alitalia
ANA Japan Airlines (JAL) China Eastern
Asiana Airlines LAN China Southern
Austrian Malev Czech Airlines
Blue1 Mexicana Delta Airlines
British Midland
International
Qantas Kenya Airways
Brussels Airlines Royal Jordanian Tarom
Croatia Airlines S7 Airlines Vietnam Airlines
Egyptair Airbelin Airlines Korean Airlines
LOT Polish Airlines
Lufthansa
Scandinavian Airlines
Singapore Airlines
South African Airways
Spanair
Swiss
TAM
Tap Portugal
Thai
Turkish Airlines
United/Continental
U.S. Airways
Ethiopian Airlines
These alliances permit partners to expand into new markets. One benefit of
alliances of this type is they provide for expansion at minimal costs. Scale alliances can
also be utilized to expand into new markets without incurring acquisition costs or the
risks associated with foreign direct investment. Anheuser Busch has recently formed an
alliance with Tsingtao, China’s leading brewer. This alliance provides Anheuser Busch
with access to the second largest (following the United States) beer market in the world.
Kansas City Southern Railway has entered into a strategic alliance with Mi-Jack
to obtain access to the Panama Canal. This alliance has created an ocean-to-ocean
transshipment service between the Atlantic and Pacific oceans on a railway that runs
parallel to the Panama Canal15
. This railway serves as an important link between
European, North American, and Asian markets.
Scale alliances allow firms to enter restricted markets that may not otherwise be
accessible. In some markets, acquisitions and direct investment are not permitted. Thus,
strategic alliances allow firms to grow into international markets from which they had
174
been previously restricted. Often international acquisitions are restricted because of
government policy. Russia’s oil and natural gas industry is state owned. BP PLC (Great
Britain) has an alliance with TNK (Russia), which has permitted BP to develop the oil
and gas industry within Russia16
.
Another benefit of scale alliances is that international networks can be
developed. Caterpillar has formed an alliance with Mitsubishi to manufacture heavy
equipment machinery for Pacific Rim markets. The alliance is important because it gives
Caterpillar a position in its primary competitor’s (Komatsu) home market. As shown in
Table 8.2, airlines can build international networks quickly. General Motors has
strategic alliances with many other global auto manufacturers (Saab, Suzuki, Isuzu,
Toyota) to help build its international network17
.
Link Alliances Link alliances have many benefits. One benefit is economies of scope.
Economies of scope are cost savings that the firm creates by successfully transferring
some of its capabilities and competencies that were developed in one of its businesses to
its other businesses. Burlington Northern Santa Fe Railroad has an alliance with Swift
Transportation (trucking) to offer intermodal services for domestic and international
shipments18
. Intermodal services utilize more than one mode of transportation. By
utilizing railroads, trucking firms can reduce costs. Rail carriers benefit by having
greater access to markets. DHL Worldwide and Lufthansa AG (Germany) entered into a
strategic alliance to achieve economies of scope. Lufthansa utilized DHL ground
infrastructure (e.g. trucks) to provide for pickup and delivery of freight19
. DHL utilized
Lufthansa for the air transportation of its shipments20
.
At times, firms will enter into alliances to obtain access to new products or
services. Roche AG and GlaxoSmithKline PLC have an alliance for the development,
marketing, and distribution of a once-a-month osteoporosis pill, Boniva. The global
market for this pill is estimated at $5.7 billion21
. Roche developed the drug and entered
into the alliance with GlaxoSmithKline to market and distribute the drug. Glaxo’s sales
force is much larger and more dispersed worldwide than Roche’s22
. In addition, Glaxo’s
sales force has established relationships with doctors who treat osteoporosis.
Monsanto Co. has teamed up with Genaissance Pharmaceutical and the U.S.
Government to map the genetic code of soybeans. The hope is to supply farmers with
technology that makes the crops more resistant to disease and drought23
. General Motors
and DaimlerChrysler have alliances with the Department of Energy to develop hydrogen
fuel cells for cars24
. Novartis AG and Schering have created a strategic alliance to
develop a new drug, PTK/XK, which treats colorectal cancer25
. Many cancer drugs kill
both cancerous and healthy cells26
. This is one of the few cancer medicines that focus on
cancer cells only.
Siemens has an alliance with Ejoala AG, a German fashion retailer, to design and
market cell phones that are fashionable. This venture is an attempt to differentiate cell
phones from a customization perspective27
. Samsung Electronics has also introduced a
fashion cell phone as a result of an alliance with designer Ann Sui28
.
Link alliances allow partners access to new resources. Hewlett-Packard has
alliances that provide the firm with new resources in software (Microsoft), chip
technology (Intel), and systems integration resources (Accenture, BearingPoint)29
.
Emerson’s alliance with Shell Philippines has provided Shell with technology capabilities
for extracting natural gas deposits and gives Emerson a market presence along the Pacific
Rim30
.
175
By combining different resources, firms can increase their rate of learning.
Corning has an alliance with Cisco where it shares its expertise in optics and photonics
with Cisco to build Internet-scale optical networks. This learning enables cable and DSL
providers to install optical infrastructures faster and cheaper31
.
Boeing and Airbus have increased their rate of learning with respect to aircraft
manufacturing processes. United Technologies is manufacturing cabin air conditioning
and temperature control systems for the new Airbus A380 and Boeing 78732
. Jamco
Corp. of Japan is providing Airbus access to ways of producing key structure elements
obtained from advanced composite materials33
. DaimlerChrysler AG has partnered with
European Aeronautic Defense and Space Program (an owner of Airbus) to learn new
production processes34
.
It is possible that unwanted technology transfer could occur from link alliances.
The key to preventing technology transfer is to develop long-term relationships with
respect to alliance partners. This process is similar to the development of long-term
relationships with customers that firms attempt to build.
Technology transfer is common in Japan because of the strong partnership
relationships that exist among firms within and across industries35
. For example,
Japanese aircraft technology has been applied to numerous industries. The process called
“spin-off” includes (1) production control technologies for electronic products, (2) design
technologies for ships and automotive vehicles, and (3) manufacturing technologies for
industrial products, hydraulic equipment, and electronics36
.
The transfer of technology in link alliances implies that one firm may receive
greater benefits than its partner(s). In some cases both firms may benefit. The NUMMI
alliance between General Motors and Toyota is an example of technology transfer
benefiting both partners. General Motors obtained access to Toyota’s manufacturing
processes. Toyota learned how to utilize technology to run a manufacturing operation in
the United States37
.
Royal Dutch Shell has an alliance with Kuwait Petroleum to explore opportunities
within the downstream value chain38
. Shell provides its technology experience and
Kuwait Petroleum supplies oil for refining39
.
China is requiring the three bidders for its four nuclear reactors (valued at $2
billion each) to agree to technology transfer before it awards the contract40
. The three
bidders--British Nuclear Fuels PLC, Areva SA (France), and Siemens (Germany)--must
agree to assist making China self-sufficient from an energy perspective by transferring
technology and teaching China how to make phase 3 plants41
. Phase 3 plants generate
more than 1000 megawatts of power.
Sometimes alliances are formed to obtain value chain benefits that each firm is
lacking. The DHL alliance with the United States Postal Service (USPS) allows DHL to
expand its U.S. infrastructure network. This alliance is especially valuable since DHL
acquired Airborne in 2003. By expanding its infrastructure, DHL is able to compete
more effectively on costs with United Parcel Service (UPS) and FedEx. This alliance
gives USPS access to DHL’s extensive global infrastructure.
Several rental car firms are using large retailers to focus upon distribution of
rental cars. Wal-Mart has alliances with Budget, Thrifty, and Enterprise42
. Sears has an
alliance with Avis43
. These alliances increase Wal-Mart and Sears’ offering in non-
traditional segments. The rental car firms increase coverage to locations other than
airports.
176
Joint Ventures A joint venture is a form of strategic alliance in which two or more firms create a
legally independent company to share resources to develop a competitive advantage.
Joint ventures provide a way to temporarily combine the different strengths of partners to
achieve an outcome of value to both.
Petrochina Co., an oil and natural gas producer, has a joint venture with China
National Petroleum Corp. to expand operations outside of China44
. China National
Petroleum Corp. has over 30 oil and gas investments outside of China. Las Vegas Sands
and Hong Kong’s Regal Hotels International have a joint venture to develop hotel/casinos
in the Hong Kong area. Las Vegas Sands will lease and manage the casinos while Regal
Hotels will build the complex45
. In 2004, the Virgin Group, headed by Richard Branson,
and Mojave Aerospace Ventures, led by Paul Allen, entered into a joint venture to
develop and test a reusable space vehicle. During 2004, the vehicle was successfully
launched to an altitude of 62 miles46
. The venture, Virgin Galactic, is scheduled to begin
business in 2007 to transport tourists into space. Seats on the vehicle are expected to cost
between $100,000 and $200,000 each47
.
Joint ventures can result in new products. Paris-based retailer GroupeDanone is
introducing new products for the Chinese market. Its joint venture with Hangzhou
Wanaha Group, China’s largest beverage company, focuses upon introducing healthy
beverages targeting urban consumers48
. The new product, Nutri-Express, represents an
attempt to change Wahana’s position from a mass producer of beverages for children to
target beverages for adults.
Sony has formed a joint venture with Toyota Industries Corp., a Japanese
machinery maker, to produce liquid crystals for digital cameras and camcorders49
. This
venture, St. Morice Display, is an attempt by Sony to improve its electronics position in
Japan50
.
Ryder has a joint venture with Toyota Tsusho America, a Toyota group company
that provides iron, steel, and textiles to automobile manufacturers. The venture, TTR
Logistics, has Toyota Tsusho providing the materials and Ryder managing the flow and
warehousing of raw materials.
Samsung Corning Precise is a joint venture that develops and manufactures high
quality glass substrates. This joint venture has created several new manufacturing
processes51
.
In 2000, Transplace.com (TPC) was created. TPC is an Internet-based global
transportation logistics company. TPC includes substantially all of the logistics business
of the following transportation carriers: Covenant Transport, Swift Transportation Co,
U.S. Xpress Enterprises, and Werner Enterprises52
.
In 2002, Sony and Ericsson created a joint venture by merging their mobile phone
businesses53
. The new venture, Sony Ericsson Mobile Communications, is equally
owned (50 percent) by both partners. Both partners believe that this joint venture will
increase their share of the international mobile phone market. In 2005, this joint venture
established a partnership with the Women’s Tennis Association (WTA) that made Sony
Ericsson Mobile Communications the worldwide title sponsor of the Women’s Tennis
Tour. Under the terms of the deal, the WTA Tour will be renamed the Sony Ericsson
WTA Tour, and both firms will enjoy a significant on-course presence in the hundreds of
televised matches around the world.
In 2004, Comcast and Microsoft established a joint venture that used Microsoft’s
“Foundation” software for digital cable54
. This venture is one of Microsoft’s attempts to
enter home entertainment. The Foundation software works like an operating system for
177
set-top boxes in the same way Windows is an operating system for personal computers.
Once it is installed, new features can be added to the cable box similar to the way
software can be added to PCs55
.
On March 4, 2005, Hon Hai Precision Industry Co, one of the world’s biggest
contract manufacturers of electronics, entered into a joint venture with Hewlett-Packard
for new product development56
. Hon Hai is competing against Flextronics International
Ltd. to be the world’s biggest producer of electronics goods from a supplier perspective.
Hon Hai surpassed Flextronics International Ltd. in 2004 as the world’s biggest contract
manufacturer of electronics goods. Hon Hai makes computers, mobile phones and other
products for companies including Apple Computer Inc. and Sony Corp57
.
In 2005, Yahoo and Verizon Communication announced plans to offer an Internet
portal service to Verizon customers. The Verizon agreement helps further Yahoo’s
efforts to generate additional revenue and could attract new users to Yahoo from other
rival Internet services58
. The benefit to Verizon is offering value-added services to its
customers.
With the significant benefits offered by strategic alliances and joint ventures, one
would wonder why all firms do not engage in developing alliances. The reason is that
some alliances have negative ramifications.
The Downside of Strategic Alliances and Joint Ventures One negative aspect of strategic alliances is that some partners have more to lose
than others. Novartis AG has provided $375 million to Vectura Group PLC and Arakis
Ltd. to develop a drug for smoker’s lung disease59
. Novartis is willing to pay substantial
costs to attempt to develop a new product by combining the technology capabilities of
these two firms. Vectura and Arakis will receive royalties if the product is
commercialized. If the new drug fails, the firms have no financial commitment to
Novartis AG60
. The funds represent a sunk cost for Novartis AG.
At other times, strategic alliances may lead to an unwanted acquisition. In 2004,
TCL Communications Technology Holdings and Alcatel SA formed a joint venture to
achieve a stronger position within the cell phone industry. Subsequently, TCL
Communications hostilely acquired Alcatel61
.
Unwanted technology transfer is another downside of alliances. Broadcom
Corporation is suing Qualcomm Inc., Texas Instruments, and Maxim Integration
Products, Inc. for patent infringements. Broadcom specializes in the manufacturing of
chips for various segments of the communication industry.
Strategic alliances can also result in costs to end an alliance. On February 14,
2005, General Motors agreed to pay Fiat $1.99 billion to end their alliance62
. The
agreement preserves GM’s access to Fiat technology that GM believes it can use in
improving its unprofitable European operations63
. For Fiat, the agreement provides much
needed funds.
Strategic Alliances and the Recession During the economic recession (2007-2010) the overall formation of strategic
alliances decreased by approximately 40 percent.64
The focus of many firms during the
global recession was survival. The formation of strategic alliances is more oriented
toward long term growth opportunities rather than attempting to stay in business.
Higher risk may be another factor as to why firms decided not to aggressively
pursue strategic alliances.65
178
As stated by Harbir Singh, Wharton strategy professor, “You would say that
alliance and network capability is secondary to the core focus of the firm. …Really, what
it comes down to is the tension between creating shared resources versus protecting one’s
own resources.”
Only a third of the respondents to a recent study conducted by Ernest and Young
felt that the recent recession was a good time to attempt to engage in strategic alliances.66
If firms are to prosper after the global recession, strategic alliances will be part of
a firm’s growth strategy. Organizations grapple with how to build external networks –
what Singh calls “the extended enterprise”-without shifting too much focus away from
the core needs of the firm. “In order to be successful in the extended enterprise world,
you have to invest in alliances and network capabilities,” Singh said. Singh suggest that
what firms need are “innovation networks.” An “innovation network” is a web of people,
institutions, or companies outside of a firm that helps it solve problems or come up with
new ideas. While organizations have formed alliances and strategic partnerships for
years, experts say this web of connections is becoming increasingly important today.
In terms of looking post-recession, executives were pretty evenly split between
expanding into new geographies, increased use of strategic alliances, acquisitions, speed
to market and divesting non-core business.67
“Companies that maintain a sustainable
business model through the current downturn will not only survive the downturn, but will
emerge stronger and in the best position to take advantage of new growth opportunities as
the economy improves,” stated a senior consultant of Ernst & Young LLP.
From a strategic alliance perspective, opportunities in the areas of energy,
agriculture, mining, pharmaceuticals, infrastructure and construction were highlighted as
the ones where strategic alliances may be either developed or expanded.
At a summit that took place in Brazil in 2010, government representatives from
the BRIC (Brazil, Russia, India, China) countries concluded that they needed a more
closely linked network as the global economic recession was ending (2010). Strategic
alliances representative between the BRIC markets, Argentina, Paraguay, and Uruguay
were invited to participate in alliance formation with the BRIC markets. The BRIC
position indicated that the four countries will coordinate their standpoints, strengthen
unity and face financial crisis together to take the lead in economic recovery. As the
global recession was ending in 2010, China and India both displayed good momentum in
economic growth. Russia and Brazil also were recovering fast.68
These countries are now better positioned to increase the scope and size of
strategic alliances as the global recessions ends. Strategic alliances formation may be a
crucial link in moving these emerging markets into fully developed markets.
The Future of Strategic Alliances Alliances are beginning to account for a significant percent of a firm’s revenue
69.
Many senior level executives view strategic alliances as a primary means of growth70
.
Alliances provide for a quick way to grow and have the potential to provide firms both
cost and differentiation advantages. While scale alliances primarily increase scale of
operations, link alliances can provide firms access to new resources and capabilities. As
firms learn from alliances, they make better decisions with respect to future alliance
partners. Firms will continue to engage in strategic alliances as a primary mode of
growth as long as trust exists between partners. Firms that are viewed as trustworthy can
obtain an advantage from the perspective of entering into future strategic alliances71
. As
firms build an alliance network and engage in trusting behavior, potential alliance
partners will perceive these firms as good alliance partners. As such, firms that have a
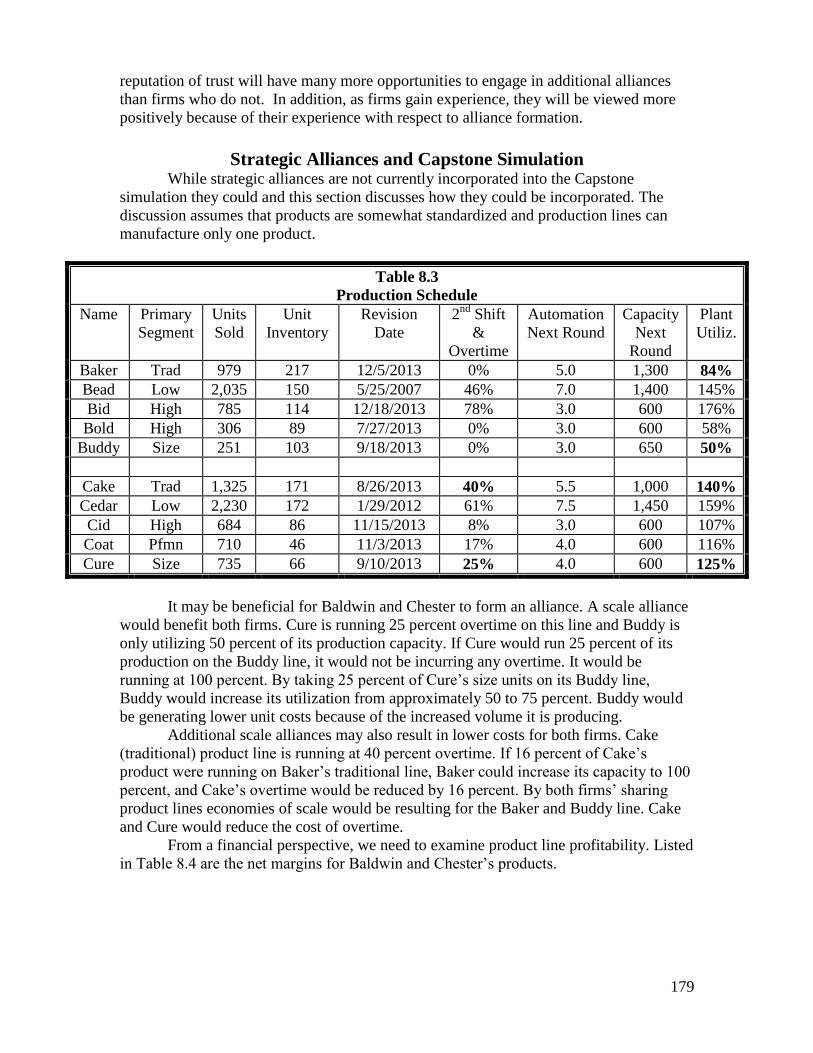
179
reputation of trust will have many more opportunities to engage in additional alliances
than firms who do not. In addition, as firms gain experience, they will be viewed more
positively because of their experience with respect to alliance formation.
Strategic Alliances and Capstone Simulation While strategic alliances are not currently incorporated into the Capstone
simulation they could and this section discusses how they could be incorporated. The
discussion assumes that products are somewhat standardized and production lines can
manufacture only one product.
Table 8.3
Production Schedule
Name Primary
Segment
Units
Sold
Unit
Inventory
Revision
Date
2nd
Shift
&
Overtime
Automation
Next Round
Capacity
Next
Round
Plant
Utiliz.
Baker Trad 979 217 12/5/2013 0% 5.0 1,300 84%
Bead Low 2,035 150 5/25/2007 46% 7.0 1,400 145%
Bid High 785 114 12/18/2013 78% 3.0 600 176%
Bold High 306 89 7/27/2013 0% 3.0 600 58%
Buddy Size 251 103 9/18/2013 0% 3.0 650 50%
Cake Trad 1,325 171 8/26/2013 40% 5.5 1,000 140%
Cedar Low 2,230 172 1/29/2012 61% 7.5 1,450 159%
Cid High 684 86 11/15/2013 8% 3.0 600 107%
Coat Pfmn 710 46 11/3/2013 17% 4.0 600 116%
Cure Size 735 66 9/10/2013 25% 4.0 600 125%
It may be beneficial for Baldwin and Chester to form an alliance. A scale alliance
would benefit both firms. Cure is running 25 percent overtime on this line and Buddy is
only utilizing 50 percent of its production capacity. If Cure would run 25 percent of its
production on the Buddy line, it would not be incurring any overtime. It would be
running at 100 percent. By taking 25 percent of Cure’s size units on its Buddy line,
Buddy would increase its utilization from approximately 50 to 75 percent. Buddy would
be generating lower unit costs because of the increased volume it is producing.
Additional scale alliances may also result in lower costs for both firms. Cake
(traditional) product line is running at 40 percent overtime. If 16 percent of Cake’s
product were running on Baker’s traditional line, Baker could increase its capacity to 100
percent, and Cake’s overtime would be reduced by 16 percent. By both firms’ sharing
product lines economies of scale would be resulting for the Baker and Buddy line. Cake
and Cure would reduce the cost of overtime.
From a financial perspective, we need to examine product line profitability. Listed
in Table 8.4 are the net margins for Baldwin and Chester’s products.
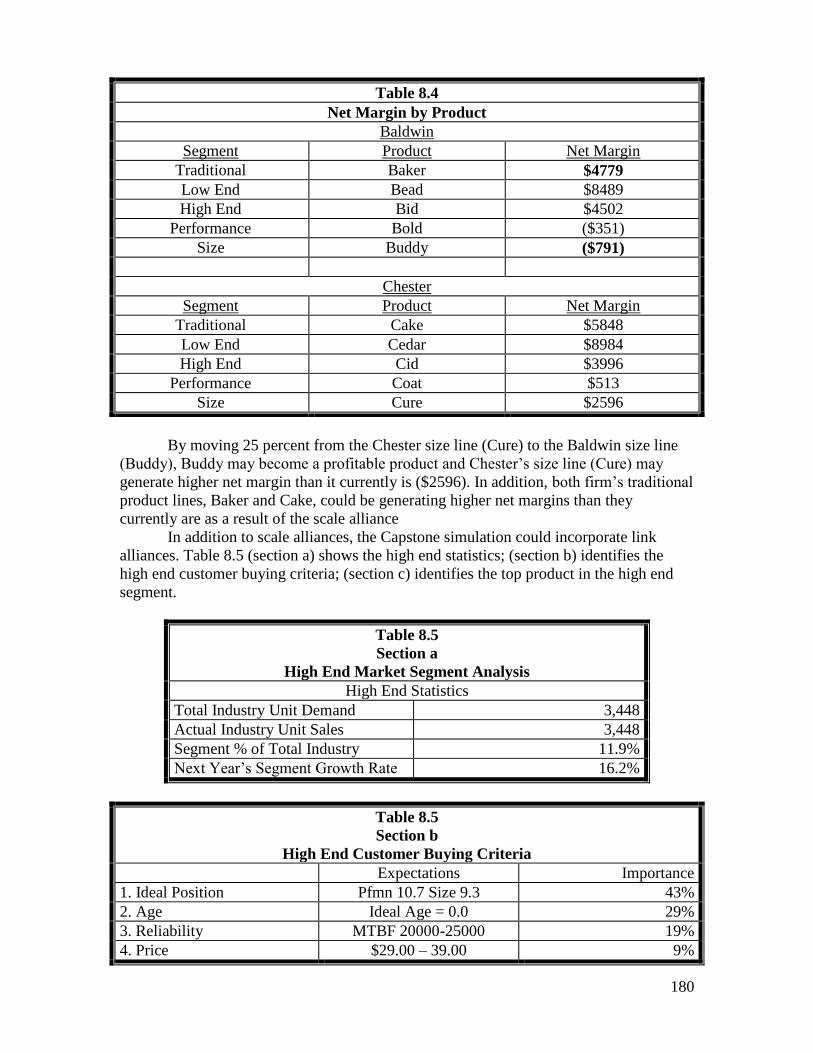
180
By moving 25 percent from the Chester size line (Cure) to the Baldwin size line
(Buddy), Buddy may become a profitable product and Chester’s size line (Cure) may
generate higher net margin than it currently is ($2596). In addition, both firm’s traditional
product lines, Baker and Cake, could be generating higher net margins than they
currently are as a result of the scale alliance
In addition to scale alliances, the Capstone simulation could incorporate link
alliances. Table 8.5 (section a) shows the high end statistics; (section b) identifies the
high end customer buying criteria; (section c) identifies the top product in the high end
segment.
Table 8.5
Section a
High End Market Segment Analysis
High End Statistics
Total Industry Unit Demand 3,448
Actual Industry Unit Sales 3,448
Segment % of Total Industry 11.9%
Next Year’s Segment Growth Rate 16.2%
Table 8.5
Section b
High End Customer Buying Criteria
Expectations Importance
1. Ideal Position Pfmn 10.7 Size 9.3 43%
2. Age Ideal Age = 0.0 29%
3. Reliability MTBF 20000-25000 19%
4. Price $29.00 – 39.00 9%
Table 8.4
Net Margin by Product
Baldwin
Segment Product Net Margin
Traditional Baker $4779
Low End Bead $8489
High End Bid $4502
Performance Bold ($351)
Size Buddy ($791)
Chester
Segment Product Net Margin
Traditional Cake $5848
Low End Cedar $8984
High End Cid $3996
Performance Coat $513
Size Cure $2596
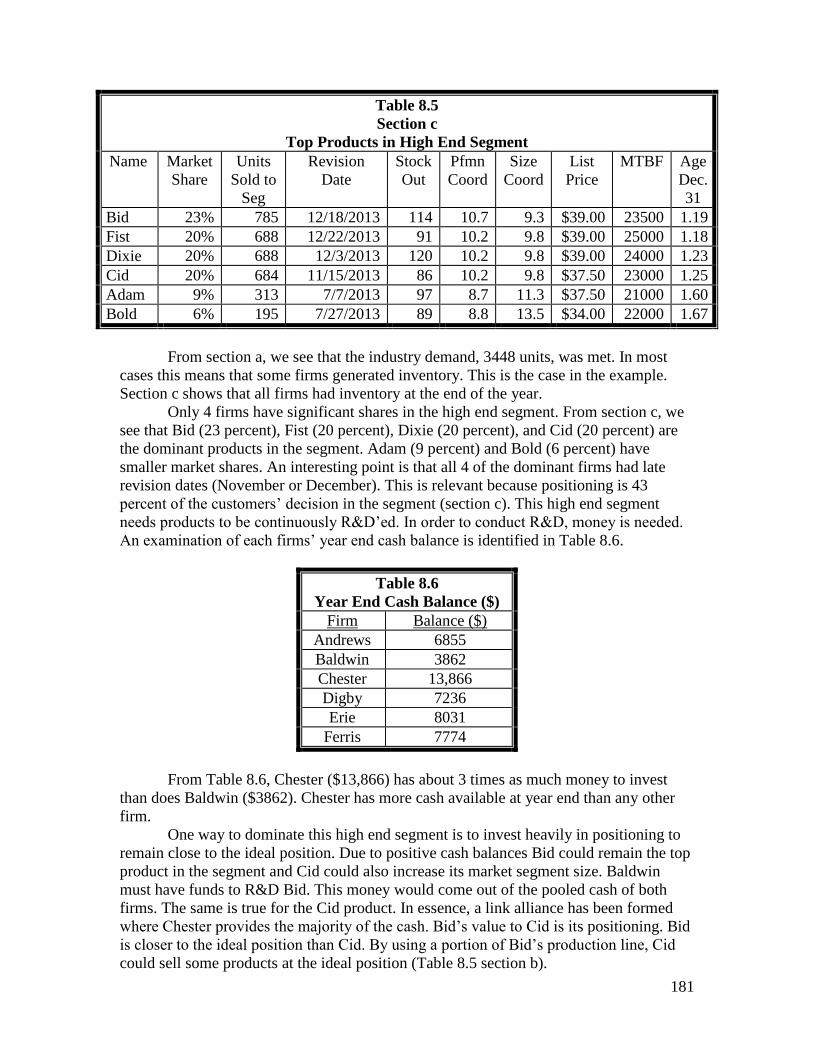
181
Table 8.5
Section c
Top Products in High End Segment
Name Market
Share
Units
Sold to
Seg
Revision
Date
Stock
Out
Pfmn
Coord
Size
Coord
List
Price
MTBF Age
Dec.
31
Bid 23% 785 12/18/2013 114 10.7 9.3 $39.00 23500 1.19
Fist 20% 688 12/22/2013 91 10.2 9.8 $39.00 25000 1.18
Dixie 20% 688 12/3/2013 120 10.2 9.8 $39.00 24000 1.23
Cid 20% 684 11/15/2013 86 10.2 9.8 $37.50 23000 1.25
Adam 9% 313 7/7/2013 97 8.7 11.3 $37.50 21000 1.60
Bold 6% 195 7/27/2013 89 8.8 13.5 $34.00 22000 1.67
From section a, we see that the industry demand, 3448 units, was met. In most
cases this means that some firms generated inventory. This is the case in the example.
Section c shows that all firms had inventory at the end of the year.
Only 4 firms have significant shares in the high end segment. From section c, we
see that Bid (23 percent), Fist (20 percent), Dixie (20 percent), and Cid (20 percent) are
the dominant products in the segment. Adam (9 percent) and Bold (6 percent) have
smaller market shares. An interesting point is that all 4 of the dominant firms had late
revision dates (November or December). This is relevant because positioning is 43
percent of the customers’ decision in the segment (section c). This high end segment
needs products to be continuously R&D’ed. In order to conduct R&D, money is needed.
An examination of each firms’ year end cash balance is identified in Table 8.6.
Table 8.6
Year End Cash Balance ($)
Firm Balance ($)
Andrews 6855
Baldwin 3862
Chester 13,866
Digby 7236
Erie 8031
Ferris 7774
From Table 8.6, Chester ($13,866) has about 3 times as much money to invest
than does Baldwin ($3862). Chester has more cash available at year end than any other
firm.
One way to dominate this high end segment is to invest heavily in positioning to
remain close to the ideal position. Due to positive cash balances Bid could remain the top
product in the segment and Cid could also increase its market segment size. Baldwin
must have funds to R&D Bid. This money would come out of the pooled cash of both
firms. The same is true for the Cid product. In essence, a link alliance has been formed
where Chester provides the majority of the cash. Bid’s value to Cid is its positioning. Bid
is closer to the ideal position than Cid. By using a portion of Bid’s production line, Cid
could sell some products at the ideal position (Table 8.5 section b).

182
From the discussion above, the Capstone simulation could incorporate both scale
and link alliances.
183
Discussion Questions
1. Explain the difference between an alliance and a joint venture.
2. Is the Oneworld airline alliance a scale or link alliance? Why?
3. Is expanding into new markets a benefit of scale or link alliances? Explain.
4. Explain economies of scope.
5. How can technology transfer be minimized?
6. How does the Capstone Simulation incorporate alliances?
7. Will alliances be more or less important in the future? Explain.
8. What is the “extended enterprise”? How is it related to the concept of an
“innovation venture”? Briefly explain.
9. At the BRIC summit in 2010, what was concluded?
184
References
1. Zaheer, A., McEvily, W., Perrone, V. 1998. Does trust matter? Exploring the
effects of interorganizational and interpersonal trust on performance.
Organization Science 9(2), 141-159.
2. Gulati, R., Nohria, N., and Zaheer, A. 2000. Guest editor’s introduction to the
special issue: Strategic networks. Strategic Management Journal 21: 199-201.
3. Kale, P., Singh, H., and Perlmutter, H. 2000. Learning and protection of
proprietary assets in strategic alliances: Building relational capital. Strategic
Management Journal 21: 217-237.
4. Ibid
5. Ibid
6. Ahuja, G. 2000. The Duality of collaboration: Inducements and opportunities in
the formation of interfirm linkages. Strategic Management Journal 21: 317-343.
7. Dyer, D. and Kale, P. 2007. Relational capabilities: drivers and implications in
dynamic capabilities. Blackwell Publishing. Malden, MA.
8. Ibid
9. Teece, D.J. 1988. The competitive challenge: strategies for industrial
innovation and renewal. Ballinger. Cambridge, MA.
10. Dyer, D. and Kale, P. Relational capabilities: drivers and implications in
dynamic capabilities.
11. Grant, R.M. 1996. Toward a knowledge-based theory of the firm. Strategic
Management Journal 17 (Winter Special Issue): 109-122.
12. Cohen, W. and Levinthal, D. 1990. Absorptive capacity: A new perspective on
learning and innovation. Administrative Science Quarterly 35: 128-152.
13. Dussauge P, Garrette B, and Mitchell W. 2004. Asymmetric performance: the
market share impact of scale and link alliances in the global auto industry.
Strategic Management Journal 25: 701-711.
14. Dussauge P, Garrette B, and Mitchell W. 2000. Learning from competing
partners: outcomes and duration of scale and link alliances in Europe, North
America, and Asia. Strategic Management Journal. 21: 99-126.
15. Pettus M. 2003. Growth from chaos. Praeger: Westport, Ct.
185
16. Cummins, C. 2005. BP’s chief says growth streak is sustainable. Wall Street
Journal. March 8.
17. Dussauge, Garrette, and Mitchell. Asymmetric performance: the market share
impact of scale and link alliances in the global auto industry.
18. Pettus. Growth from chaos.
19. Ibid.
20. Ibid.
21. Whalen J. 2005. FDA approves osteoporosis drug for monthly use. Wall Street
Journal. March 28.
22. Ibid.
23. _____. 2005. Unlocking the genetic code of soybeans. Wall Street Journal.
April 1.
24. _____. 2005. GM and Daimler plan fuel cell cars. Wall Street Journal. March
31.
25. Greil A. 2005. Novartis, Schering to delay cancer drug filing. Wall Street
Journal. March 22.
26. Ibid.
27. Rhoads C. 2005. Cell phone makers will heed fashion world’s call. Wall Street
Journal. March 18.
28. Ibid.
29. Hewlett-Packard 2004 Annual Report.
30. Emerson 2004 Annual Report.
31. Cisco 2004 Annual Report.
32. Michaels D. and Lunsford J. 2005. Stream-lined plane making. Wall Street
Journal. April 1.
33. Ibid.
34. Ibid.
186
35. Friedman D. and Samuels R. 1992. How to succeed without really flying. The
Japanese aircraft industry and Japan’s technology ideology. Cornell University
Press: Ithaca, N.Y.
36. Ibid.
37. Kale P, Singh H, and Perlmutter H. 2000. Learning and protection of propriety
assets in strategic alliances: Building relational capital. Strategic Management
Journal. 21(3): 217-237.
38. ____. 2005. Royal Dutch/Shell Group. Wall Street Journal. March 23.
39. Ibid.
40. Ortolani A. 2005. Technology transfer is critical to winning China reactor job.
Wall Street Journal. May 12.
41. Ibid.
42. Johnson A. 2005. Renting a car at Wal-Mart. Wall Street Journal. March 22.
43. Ibid.
44. _____. 2005. Petrochina Co. Wall Street Journal. March 24.
45. _____. 2005. Hotel-Casino project in Macau planned with Las Vegas Sands.
Wall Street Journal. March 15.
46. _____. 2004. Virgin Group signs deal with Paul Allen’s Mojave Aerospace.
New York Times. September 27.
47. Ibid.
48. ______. 2004. Joint venture will launch healthy beverage in China. Wall Street
Journal. November 1.
49. Sony 2010 Annual Report
50. Ibid
51. Corning 2010 Annual Report
52. Pettus. Growth from Chaos
53. Sony 2010 Annual Report
54. Grant P. and Guth R. 2005. Microsoft moves into cable set top boxes. Wall
187
Street Journal. November 11.
55. Ibid
56. ______ 2005. Hon Hai. Wall Street Journal. March 4.
57. Ibid
58. Latour A. and Delaney K. 2005. Yahoo and Verizon plan to offer co-branded
web portal service. Wall Street Journal. January 18.
59. _____. British companies license drug to fight smoker’s lung.
60. Ibid
61. Meyer J. 2005. TCL will unwind handset venture with Alcatel SA. Wall Street
Journal. May 18.
62. ______. 2005. GM agrees to pay Fiat $1.99 billion to settle dispute. Wall Street
Journal. Feb 14.
63. Ibid
64. ____ “Strategic Alliances,” Bain & Publications, December 2010.
65. Ibid
66. Ibid
67. Ibid
68. ___ “Brazil and India Renew Commitments to Strategic Alliances,” Asia Pacific
Journal, April 16, 2010.
69. ___ “Can we Innovate Our Way Out of a Recession,” Forbes, July 1, 2009.
70. ___ “The Depth of the Global Recession Impact has permanently Changed the
Rules of the Game,” Ernst & Young Publications, June 15, 2009.
71. Ibid
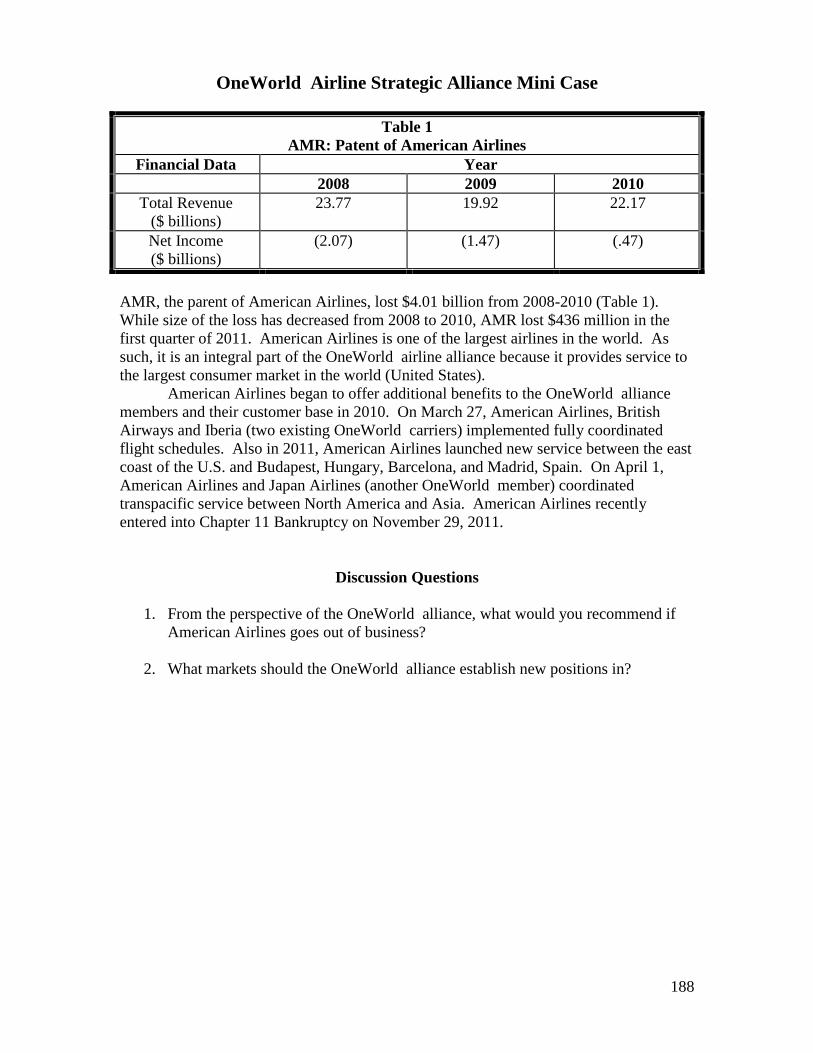
188
OneWorld Airline Strategic Alliance Mini Case
Table 1
AMR: Patent of American Airlines
Financial Data Year
2008 2009 2010
Total Revenue
($ billions)
23.77 19.92 22.17
Net Income
($ billions)
(2.07) (1.47) (.47)
AMR, the parent of American Airlines, lost $4.01 billion from 2008-2010 (Table 1).
While size of the loss has decreased from 2008 to 2010, AMR lost $436 million in the
first quarter of 2011. American Airlines is one of the largest airlines in the world. As
such, it is an integral part of the OneWorld airline alliance because it provides service to
the largest consumer market in the world (United States).
American Airlines began to offer additional benefits to the OneWorld alliance
members and their customer base in 2010. On March 27, American Airlines, British
Airways and Iberia (two existing OneWorld carriers) implemented fully coordinated
flight schedules. Also in 2011, American Airlines launched new service between the east
coast of the U.S. and Budapest, Hungary, Barcelona, and Madrid, Spain. On April 1,
American Airlines and Japan Airlines (another OneWorld member) coordinated
transpacific service between North America and Asia. American Airlines recently
entered into Chapter 11 Bankruptcy on November 29, 2011.
Discussion Questions
1. From the perspective of the OneWorld alliance, what would you recommend if
American Airlines goes out of business?
2. What markets should the OneWorld alliance establish new positions in?
189
Harvard Business Cases for Chapter 8
Adcock Ingram: Decisions and Motives that Steer Acquisitions
Product Number 910C08
Roche’s Acquisition of Genetech
Product Number 210040
Professor Case for Chapter 8
Chevron

190

191
Chapter 9
Acquisition Strategies

192
Learning and Assessment Goals
1. Understand the positive and negative ramifications of acquisitions.
2. Understand the process for achieving successful acquisitions.
3. Understand why due diligence is important.
4. Understand why the pace and size of acquisitions has increased recently.
5. Develop an understanding of which type of firm (acquiring or target) results in
earnings of above average returns over time. Understand why this relationship
exists.
193
Impact of the Global Recession on Mergers and Acquisitions
The Mergers and Acquisitions Journal reported, “Global M&A totals $2.3 trillion
(2010), up from $1.9 trillion (2009). The U.S. accounted for 34% of the world’s
acquisitions. The energy and power industries within the U.S. sector was the most active
segment in 2010.1 M&A activity in energy and power reached $482 billion in 2010, up
from 38% in 2009.2
From a geographic perspective some of the M&A activity seen in
2010 came from the emerging markets. For developing markets, M&A’s increased more
than 84% over the same period in 2009. That is the largest percentage of growth these
markets have ever experienced.3
Emerging markets tend to be recovering from the global
economic crisis faster than fully developing markets.4
The pharmaceutical industry was especially active during the recession (2007-
2010). The largest acquisition in 2009 was Pfizer’s purchase of Wyeth for $68 billion.5
Swiss-based Roche acquired U.S. based Genentech for nearly $46.43 billion.6 Merck &
Co. (U.S. based) purchased Schering-Plough (U.S. based) for $45.70 billion.7 These
mergers and acquisitions were substantial considering we were in a global recession from
2007-2010.
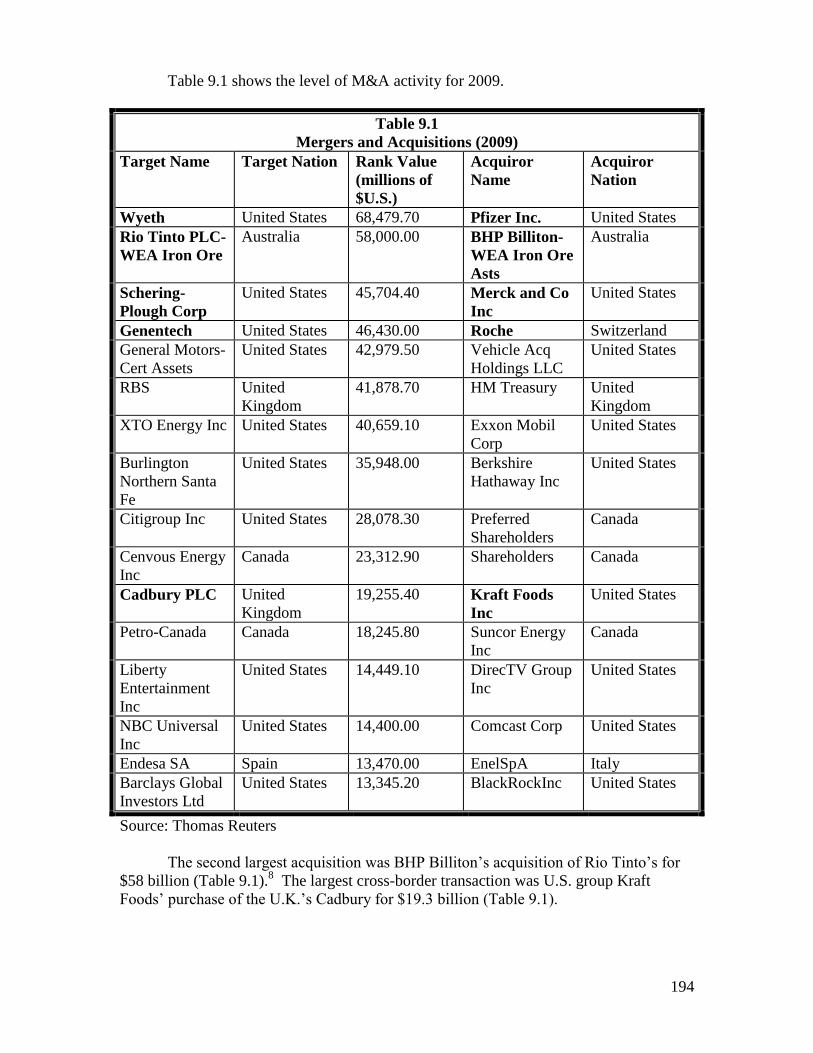
194
Table 9.1 shows the level of M&A activity for 2009.
Table 9.1
Mergers and Acquisitions (2009)
Target Name Target Nation Rank Value
(millions of
$U.S.)
Acquiror
Name
Acquiror
Nation
Wyeth United States 68,479.70 Pfizer Inc. United States
Rio Tinto PLC-
WEA Iron Ore
Australia 58,000.00 BHP Billiton-
WEA Iron Ore
Asts
Australia
Schering-
Plough Corp
United States 45,704.40 Merck and Co
Inc
United States
Genentech United States 46,430.00 Roche Switzerland
General Motors-
Cert Assets
United States 42,979.50 Vehicle Acq
Holdings LLC
United States
RBS United
Kingdom
41,878.70 HM Treasury United
Kingdom
XTO Energy Inc United States 40,659.10 Exxon Mobil
Corp
United States
Burlington
Northern Santa
Fe
United States 35,948.00 Berkshire
Hathaway Inc
United States
Citigroup Inc United States 28,078.30 Preferred
Shareholders
Canada
Cenvous Energy
Inc
Canada 23,312.90 Shareholders Canada
Cadbury PLC United
Kingdom
19,255.40 Kraft Foods
Inc
United States
Petro-Canada Canada 18,245.80 Suncor Energy
Inc
Canada
Liberty
Entertainment
Inc
United States 14,449.10 DirecTV Group
Inc
United States
NBC Universal
Inc
United States 14,400.00 Comcast Corp United States
Endesa SA Spain 13,470.00 EnelSpA Italy
Barclays Global
Investors Ltd
United States 13,345.20 BlackRockInc United States
Source: Thomas Reuters
The second largest acquisition was BHP Billiton’s acquisition of Rio Tinto’s for
$58 billion (Table 9.1).8 The largest cross-border transaction was U.S. group Kraft
Foods’ purchase of the U.K.’s Cadbury for $19.3 billion (Table 9.1).
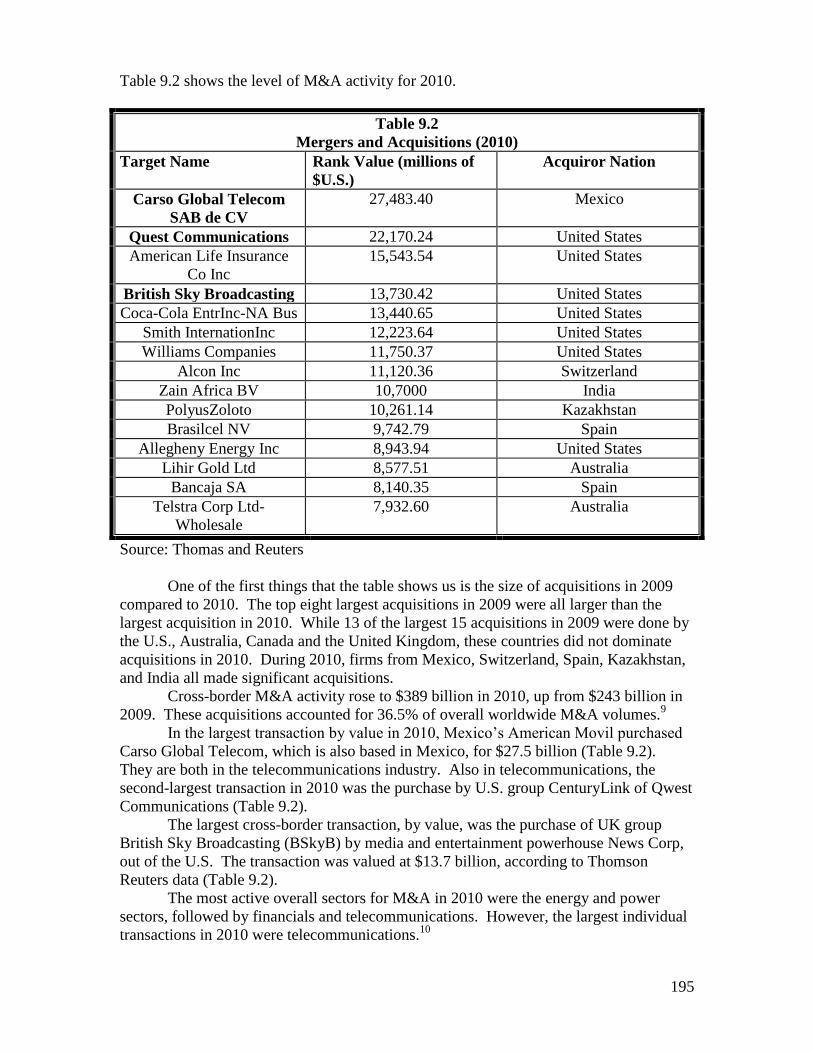
195
Table 9.2 shows the level of M&A activity for 2010.
Table 9.2
Mergers and Acquisitions (2010)
Target Name Rank Value (millions of
$U.S.)
Acquiror Nation
Carso Global Telecom
SAB de CV
27,483.40 Mexico
Quest Communications 22,170.24 United States
American Life Insurance
Co Inc
15,543.54 United States
British Sky Broadcasting 13,730.42 United States
Coca-Cola EntrInc-NA Bus 13,440.65 United States
Smith InternationInc 12,223.64 United States
Williams Companies 11,750.37 United States
Alcon Inc 11,120.36 Switzerland
Zain Africa BV 10,7000 India
PolyusZoloto 10,261.14 Kazakhstan
Brasilcel NV 9,742.79 Spain
Allegheny Energy Inc 8,943.94 United States
Lihir Gold Ltd 8,577.51 Australia
Bancaja SA 8,140.35 Spain
Telstra Corp Ltd-
Wholesale
7,932.60 Australia
Source: Thomas and Reuters
One of the first things that the table shows us is the size of acquisitions in 2009
compared to 2010. The top eight largest acquisitions in 2009 were all larger than the
largest acquisition in 2010. While 13 of the largest 15 acquisitions in 2009 were done by
the U.S., Australia, Canada and the United Kingdom, these countries did not dominate
acquisitions in 2010. During 2010, firms from Mexico, Switzerland, Spain, Kazakhstan,
and India all made significant acquisitions.
Cross-border M&A activity rose to $389 billion in 2010, up from $243 billion in
2009. These acquisitions accounted for 36.5% of overall worldwide M&A volumes.9
In the largest transaction by value in 2010, Mexico’s American Movil purchased
Carso Global Telecom, which is also based in Mexico, for $27.5 billion (Table 9.2).
They are both in the telecommunications industry. Also in telecommunications, the
second-largest transaction in 2010 was the purchase by U.S. group CenturyLink of Qwest
Communications (Table 9.2).
The largest cross-border transaction, by value, was the purchase of UK group
British Sky Broadcasting (BSkyB) by media and entertainment powerhouse News Corp,
out of the U.S. The transaction was valued at $13.7 billion, according to Thomson
Reuters data (Table 9.2).
The most active overall sectors for M&A in 2010 were the energy and power
sectors, followed by financials and telecommunications. However, the largest individual
transactions in 2010 were telecommunications.10
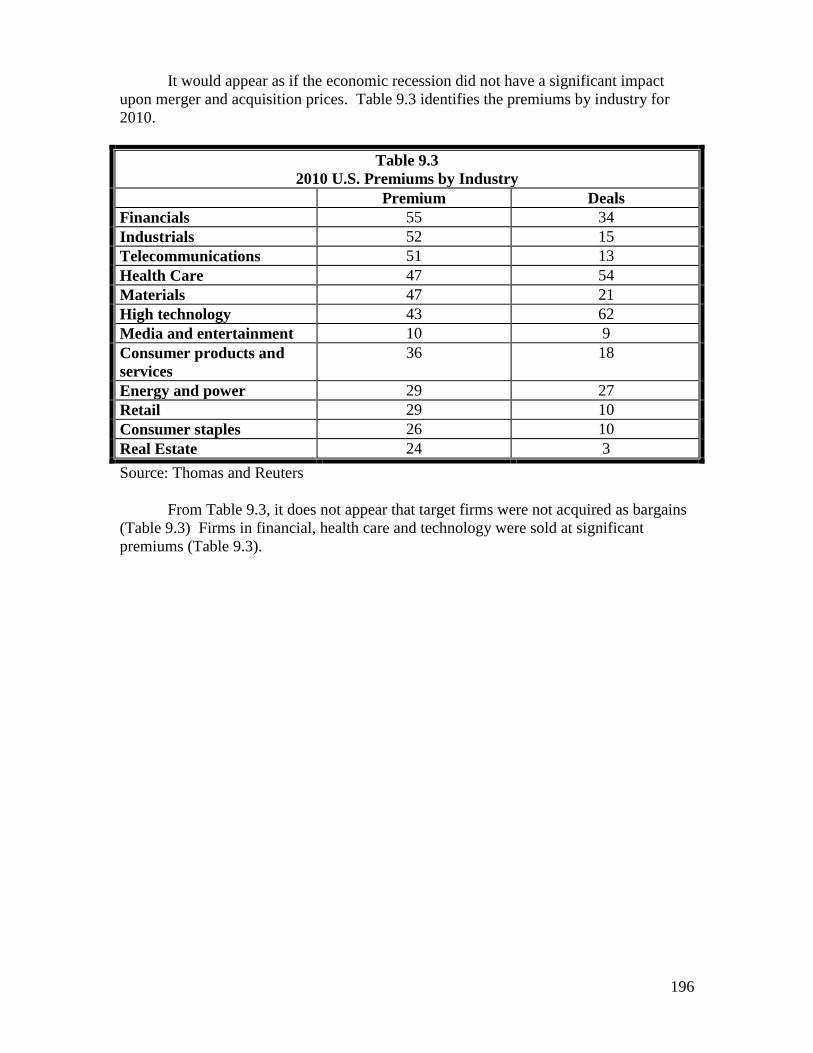
196
It would appear as if the economic recession did not have a significant impact
upon merger and acquisition prices. Table 9.3 identifies the premiums by industry for
2010.
Table 9.3
2010 U.S. Premiums by Industry
Premium Deals
Financials 55 34
Industrials 52 15
Telecommunications 51 13
Health Care 47 54
Materials 47 21
High technology 43 62
Media and entertainment 10 9
Consumer products and
services
36 18
Energy and power 29 27
Retail 29 10
Consumer staples 26 10
Real Estate 24 3
Source: Thomas and Reuters
From Table 9.3, it does not appear that target firms were not acquired as bargains
(Table 9.3) Firms in financial, health care and technology were sold at significant
premiums (Table 9.3).
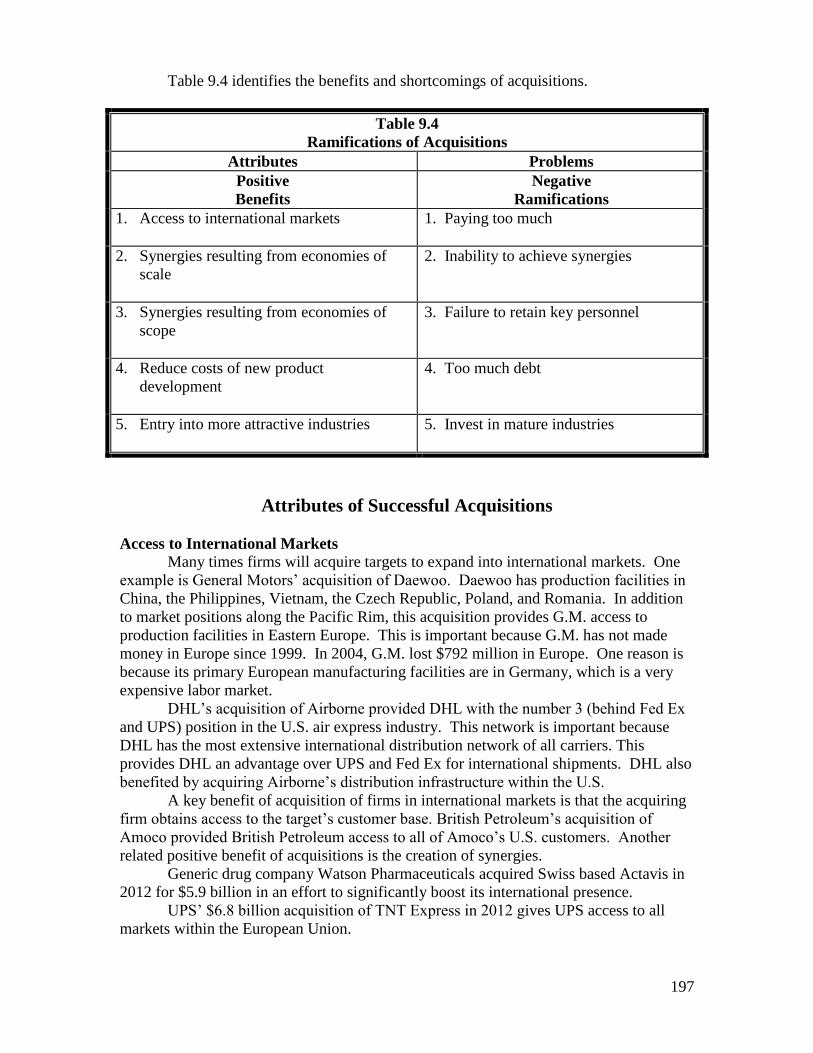
197
Table 9.4 identifies the benefits and shortcomings of acquisitions.
Table 9.4
Ramifications of Acquisitions
Attributes Problems
Positive
Benefits
Negative
Ramifications
1. Access to international markets
1. Paying too much
2. Synergies resulting from economies of
scale
2. Inability to achieve synergies
3. Synergies resulting from economies of
scope
3. Failure to retain key personnel
4. Reduce costs of new product
development
4. Too much debt
5. Entry into more attractive industries
5. Invest in mature industries
Attributes of Successful Acquisitions
Access to International Markets
Many times firms will acquire targets to expand into international markets. One
example is General Motors’ acquisition of Daewoo. Daewoo has production facilities in
China, the Philippines, Vietnam, the Czech Republic, Poland, and Romania. In addition
to market positions along the Pacific Rim, this acquisition provides G.M. access to
production facilities in Eastern Europe. This is important because G.M. has not made
money in Europe since 1999. In 2004, G.M. lost $792 million in Europe. One reason is
because its primary European manufacturing facilities are in Germany, which is a very
expensive labor market.
DHL’s acquisition of Airborne provided DHL with the number 3 (behind Fed Ex
and UPS) position in the U.S. air express industry. This network is important because
DHL has the most extensive international distribution network of all carriers. This
provides DHL an advantage over UPS and Fed Ex for international shipments. DHL also
benefited by acquiring Airborne’s distribution infrastructure within the U.S.
A key benefit of acquisition of firms in international markets is that the acquiring
firm obtains access to the target’s customer base. British Petroleum’s acquisition of
Amoco provided British Petroleum access to all of Amoco’s U.S. customers. Another
related positive benefit of acquisitions is the creation of synergies.
Generic drug company Watson Pharmaceuticals acquired Swiss based Actavis in
2012 for $5.9 billion in an effort to significantly boost its international presence.
UPS’ $6.8 billion acquisition of TNT Express in 2012 gives UPS access to all
markets within the European Union.
198
Synergies Resulting from Economies of Scale Synergy exists when the value created by units working together exceeds the
value those units could create working independently. Synergy can be created by the
efficiencies derived from economies of scale. Firms generate economies of scale by
more fully utilizing excess capacity.
Acquisitions result, in part, because firms have excess capacity. This excess
capacity can be productively utilized to generate economies of scale. Economies of scale
can result from a firm acquiring a target within the same 4-digit industry. Exxon’s
acquisition of Mobil created substantial economies of scale as did Yellow’s acquisition of
Roadway. The latter acquisition combined the second and third largest firms within the
LTL (less than truckload) segment of the trucking industry. Economies of scale are
important in the trucking industry because the industry is quite mature and the customer
base views price as a key buying criteria. The primary benefit that Yellow obtained as a
result of the USF acquisition was economies of scale.
Another industry in which economies of scale are important is the
telecommunications industry. In February 2004, Cingular Wireless acquired AT&T
Wireless. In December 2004, Sprint acquired Nextel. In January 2005, SBC acquired
AT&T business and customer divisions. In 2007, AT&T Corp. acquired Bell South11
.
The international airline industry is another example of acquisitions creating
economies of scale. In 2003, Air France acquired KLM. Lufthansa is in the process of
acquiring Swiss Airlines. For Swiss Air, the acquisition may provide for survival within
a consolidating industry. Swiss Air has been unprofitable with a cumulative net loss of
nearly two billion francs from 2001 to 2004. They have undertaken a series of
restructuring programs and management changes, but losses have continued as fuel prices
have increased. The benefit to Lufthansa is that a European competitor is eliminated.
The merger of Xstrata and Glencore in 2012 will create an $80 billion dollar
mining firm which should lead to significant economies of scale.
Synergies Resulting from Economies of Scope
Economies of scope are cost savings that a firm creates by successfully
transferring some of its resources and capabilities that were developed in one of its
businesses to another of its businesses. Fed Ex’s acquisition of Roadway Package
Services (RPS) provided Fed Ex with a ground infrastructure that could be more fully
utilized for both air express and ground shipments. Cendant’s (the holding company for
Gulliver’s Travel and Octopus Travel Group) acquisition of Donvand Ltd. will provide
economies of scope as Cendant begins to focus upon the travel and real estate industry.
CSX (railroad) has been involved in a number of acquisitions that have provided
economies of scope. With the acquisition of Sea-Land Corporation, CSX established a
position in the global ocean shipping industry. Boeing’s acquisition of McDonnell
Douglas created economies of scope by establishing positions within the military aircraft
industry.
Tata Motors’ (India) acquisition of Jaguar (2010) and Land Rover in 2011 allows
Tata to more fully utilize its flexible manufacturing operations.
Reduce Costs of New Product Development
New product development can be costly. As a result, some firms acquire targets
that are within months of introducing new products. Part of Cisco’s success with
acquisitions is because it will only acquire firms that are within 6 months of a new
product introduction. Since products are ready to be introduced into the marketplace, the
199
acquiring firm does not have to invest in R&D. Equally as important, products can be
introduced into the market more quickly because the acquiring firm does not need to
engage in a new product development process.
Sun Microsystems acquired SevenSpace in late 2004. This acquisition allowed
Sun access to management services for computers for the first time. SevenSpace has a
wide range of hardware and software that assists Sun in developing its service business.
In late 2004, Johnson & Johnson acquired Guidant Corp. Guidant makes devices
that stabilize heart rhythms. Johnson & Johnson already has a 43 percent share of the
coated coronary stint products; the acquisition will allow Johnson & Johnson to acquire
Guidant’s 38 percent share of heart rhythm devices12
.
In early 2005, Medco Health Solutions acquired Accredo Heath. This transaction
marks the entry of a pharmacy benefit manager (Medco) into the specialty pharmacy
industry13
. Accredo provides patients with specialty drugs for diseases like multiple
sclerosis and hemophilia. Medco views the specialty drug market as having a much
higher growth rate than other segments of the pharmaceutical industry14
.
Amazon’s $775 million acquisition of Kiva Systems in 2012 gives Amazon an
avenue for introducing robotics into its customer fulfillment centers.
Entry into More Attractive Industries
PenaultPrintempsRedout’s (PPR) acquisition of Gucci provides entry for PPR into
the luxury goods industry. PPR’s rationale for the acquisition was to enter an industry
that has higher margins. For Gucci, the acquisition may provide financing to more
successfully position itself against the industry leader Louis Vuitton.
General Motors’ acquisition of Electronic Data Systems (EDS) and Hughes
Aerospace is an attempt to enter more attractive industries. Proctor & Gamble’s
acquisition of Gillette provides them with a dominant position in the wet shaving
industry. Gillette has a 74 percent worldwide market share in the wet shaving industry.
In addition, Gillette had previously acquired Duracell in the battery industry and Oral-B
in the dental care industry. The industries that Gillette has entered have been more
profitable than the industries Proctor & Gamble has entered. For 2003, Proctor &
Gamble’s return on sales was 12.6 percent; for the same period, Gillette’s return of sales
was 23.3 percent.
In an attempt to make its way into an area which has grown significantly in recent
years, cloud computing; Oracle Corp. came to an agreement in 2012 to acquire online
software maker Taleo Corp. for $1.9 billion.
Problems with Acquisitions
Paying Too Much
Many firms simply pay too much for targets15
. Due to the bidding war between
Verizon and Quest for MCI, Verizon’s accepted bid represented a 25 percent premium.
Omnicare acquired NeighborCare for $1.45 billion16
. This represented a $150
million premium. In addition, Omnicare assumed approximately $250 million of
NeighborCare’s debt17
. As shown in Table 9.3, many firms in many industries paid
significant premiums to acquire target firms.
Inability to Achieve Synergies
Many acquisitions are sold based upon cost savings the acquiring firm hopes to
achieve as a result of synergies. Establishing synergies between Compaq’s P.C. business
200
and Hewlett Packard’s imaging and printing business were a primary reason for the
Compaq acquisition. As a result, Hewlett Packard felt that significant synergies would
exist and it could achieve a larger market share in the enterprise computing and P.C.
industry. However, in 2004, only Hewlett Packard’s imaging and printing segment
remained profitable. Since the merger, H-P has lost market share18
. The Compaq merger
hasn’t helped in other areas either. In the 12 months ended in September 2005, IBM and
Dell gained share in network servers while H-P declined. H-P’s operating margins in
business services have fallen for two consecutive years19
. While Hewlett Packard
attempted to cut costs, the cost savings were never realized. In fact, profit margins have
continued to decline, especially in the P.C. business.
American Airlines acquisition of TWA created too much excess capacity and the
combined airlines were unable to achieve cost savings. This acquisition, coupled with
the aftermath of 9/11, has American Airlines in financial difficulty.
U.S Airways’ 2012 attempt to acquire American Airlines would have created a
firm which would not be able to obtain synergies from combining two major airlines.
Many U.S. airlines have acquired other U.S. airlines in the past (e.g. Northwest, Delta).
None of these acquisitions have led to significant synergies. It needs to be noted that
U.S. Airways has been to Chapter 11 bankruptcy protection while American Airlines is
currently in Chapter 11 bankruptcy.
Failure to Retain Key Personnel
Entry into industries other than a firm’s core or related industry can cause
significant problems. Firms may have difficulty achieving advantages in industries that
are unrelated to their primary industry because the acquiring firm’s management team has
no experience in the unrelated industry. Phillip Morris’ acquisition of Miller Brewing is
an example.
After the acquisition of Compaq by Hewlett Packard, Michael Capellas, the CEO
of Compaq left to become CEO of MCI. The other members of Compaq’s senior
management team also left. Thus, Hewlett Packard was trying to compete against
industry leader Dell without managerial resources with substantial industry experience in
the P.C. industry. The management team of the target firm has specific knowledge of
industry structure, the customer base, the evolution of competition within the industry
and knowledge of the target firms’ domestic and international infrastructure network.
These issues are of critical importance if the target is in an industry not related to the
acquiring firm.
When PepsiCo acquired Taco Bell, Pizza Hut, and KFC, the logic was that these
fast food chains would provide distribution outlets for Pepsi’s many beverages. PepsiCo
eliminated critical managerial resources in the target firms. Afterwards, PepsiCo realized
that the soft drink and fast food industries are quite different. Thus, PepsiCo spun these
firms off as Tri-Con. With the addition of Long John Silver and A&W Root beer, the
combined companies are now Wow Brands and totally independent of PepsiCo.
Hewlett Packard entered the Smartphone and tablet markets with its $1.2 billion
acquisition of Palm in 2010. Hewlett Packard did not retain the Palm management team.
HP left this market less than a year later.
Too Much Debt
Too much debt restricts the funds that are available for other expansion options.
Dynegy’s acquisition of Illinois Power significantly restricted Dynegy’s ability to further
201
expand in the newly deregulated utility industry. Dynegy finally sold Illinois Power to
Ameren in 2004.
Quest Communication’s $56 billion acquisition of U.S. West created a firm
whose stock has since lost 87 percent of its value. The combined firm now has $17
billion in debt.
The antivirus software firm, Symantec, has lost 35 percent of its stock value after
its $13.5 billion acquisition of Veritas21
. Symantec has not been able to pay down its
debt as a result of the acquisition. The $181 billion acquisition of Time Warner by AOL
has created substantial long-term debt. Since 2001, the market capitalization of
AOL/Time Warner has declined in value by $233 billion20
. In addition, the combined
firm is struggling to pay down debt as a result of the merger.
The $11.5 billion acquisition of Sears by Kmart has created substantial debt. This
increase in debt will make it difficult for the combined firms to compete against Wal-
Mart. Besides, they are still much smaller than Wal-Mart. Wal-Mart had sales of $256
million in 2004 compared to $55 billion as a result of the Kmart acquisition of Sears.
Caterpillar acquired Bucyrus Mining for $8.6 Billion in 2011. Caterpillar paid a
32% premium and obtained all of Bucyrus’ debt.
Invest in Mature Industries
As discussed in Chapter 1, Industry Analysis, firms that are in mature industries
must focus upon costs to be successful. During the maturity stage, firms attempt to
reduce costs because there is very little product differentiation. The American Airlines
acquisition of TWA in 2000 is an example. Even before 9/11, U.S. airlines were only
marginally profitable. As such, American acquired TWA to achieve economies of scale.
The acquisition resulted in American Airlines becoming the largest airline in the world.
Because American Airlines and TWA both had excess capacity, the combined airline had
even more excess capacity.
Within the U.S. airline industry, Southwest Airlines is the only carrier that has
been profitable every year since the U.S. airline industry was deregulated in 1978.
Southwest generates profit because its business model is applicable to a mature industry.
Southwest does not utilize a hub and spoke network. Each lane (pair city) combination
must be profitable. If a lane segment is not profitable, it is eliminated. As such, each part
of Southwest network is profitable. Because other airlines utilize a hub and spoke
business model, lane segment analysis is not performed. In a mature industry, each unit
of your firm needs to generate profit.
After the railroad industry was deregulated in 1980, rail carriers began to acquire
trucking firms to increase their scope of coverage. These trucking subsidiaries were
unprofitable because the trucking industry was a mature industry. One reason was
because of excess capacity. The railroads believed that some of their time sensitive
freight could travel by truck as opposed to by rail. The railroads were unsuccessful at
increasing the utilization of trucks because trucking firms began to lose freight to
independent owner operations. These non-union owner operations could carry freight at
much lower rates.
As has been discussed in the text, the trucking industry is a very mature industry.
When Yellow Freight acquired Roadway ($1.05 billion) (Trucking) in 2003 and USF
Corp ($1.37 billion) (Trucking) in 2005, it established a larger market share in its own
industry (Trucking). As a result of acquiring firms in the mature trucking industry,
Yellow has lost over $2 billion since these acquisitions occurred.
202
Process for Achieving Successful Acquisitions While firms have experienced mixed results with respect to acquisitions, the
process by which acquisition candidates are selected and implemented may make future
acquisitions beneficial. Due diligence is a critical part of the process.
Due Diligence
Due diligence is a comprehensive, complete analysis of an acquisition
opportunity. It is a third party’s independent objective view of the value of an acquisition
target. The due diligence process should be performed for every acquisition opportunity.
Consulting firms and investment bankers conduct due diligence because they have
substantial industry experience. These firms perform many tasks. Some important due
diligence functions are (1) determining whether the acquisition will be friendly or hostile
(2) what is the maximum bid that the acquiring firm should offer to make the acquisition
opportunity profitable (3) will the acquiring firm have to divest unwanted business
sectors of the target firm (4) what realistic cost savings will be realized as a result of the
acquisition (5) what is the likely reaction of Wall Street (6) what has been the financial
performance of the target over time (7) what level of funds will be needed to make
implementation successful (8) should the management team of the target be retained (9)
what type of R&D capability does the target firm have that can be utilized by the
acquiring firm and (10) determine the integration process. If effective due diligence is
not completed, acquiring firms may pay too much for acquisition targets or inappropriate
targets may be selected. For example, Hewlett Packard may have been wise to conduct
due diligence before it spent $19 billion to acquire Compaq. A due diligence fee of $1
million may well have been worth it.
In December 2004, Oracle acquired PeopleSoft. The acquisition process started
in June 2003. The final offer, $10.3 billion, represents a 25 percent premium over market
price23
. The combined firms will still trail SAP in terms of global enterprise resource
planning software24
. This was a hostile takeover. This means the target firm had no
desire to be acquired. Hostile takeovers create significant implementation problems.
This leads to our second criteria for successful acquisitions: engage in friendly
acquisitions.
Engage in Friendly Acquisitions
Hostile acquisitions can cause problems between acquiring and target firms.
With hostile takeovers, acquiring firms may end up paying a premium. In many cases,
the senior management of the target is removed. If the target is in an unrelated business,
the acquiring firm may not have the managerial resources to integrate the combined
firms’ resources successfully. Target firms have many anti-takeover amendments that
can be passed to further increase the price of the acquisition. Cisco, which has made
hundreds of successful acquisitions, will not engage in hostile takeovers. Cisco values
the target firm’s human resources. Cisco’s policy is to concentrate on people first and
business integration second. Berkshire Hathaway’s 2009 acquisition of BNSF Railroad
was a friendly acquisition which has generated position results in terms of net income and
EPS.
Maximize Resource Utilization
At times, firms make acquisitions to obtain greater resource utilization. At all
times, firms have excess capacity21
. This excess capacity can be utilized to obtain
203
economies of scale or economies of scope. Economies of scale may result from same
industry acquisitions. Anheuser Busch’s acquisition of Hardin, a Chinese brewer,
allowed Anheuser Busch to achieve economies of scale in China. South African Brewers
(SAB) acquisition of Miller created economies of scale and resulted in SAB obtaining a
significant position within the U.S. market. UPS’ acquisition of Overnite Trucking may
result in economies of scope by using the same trucks for small package and large freight
transportation. Proctor & Gamble’s acquisition of Gillette provides for increased
economies of scope by more fully utilizing Proctor & Gamble and Gillette’s extensive
international infrastructure. The Air France acquisition of KLM permits Air France to
maximize its own utilization of resources due to the increase in international passengers
and airfreight traffic. Interbrew’s (Belgium) acquisition of Ambev (Brazil) provides both
firms with access to each other’s distribution infrastructure. Sometimes, firms will also
acquire targets for brand names.
Diversify Into Firms That Have Strong Brand Names
Proctor & Gamble plans to commit significant resources to grow its own and
Gillette’s major brands. Currently, Proctor & Gamble has about $52 billion in sales and
21 billion dollar brands22
. P&G’s largest competitor is Unilever. Unilever has $52 billion
in sales and 12 billion dollar brands23
. With the acquisition of Gillette, Proctor & Gamble
adds 10 more billion-dollar brands24
. Gillette is the market leader in the wet shaving
industry with a 75 percent market share. The acquisition may provide funds for Gillette
to further develop these brands domestically and globally. Proctor & Gamble’s
acquisition of Gillette gave it strong brands in the wet shaving industry (Mach 3, MP3,
Venus Divine), and the health care industry (Oral B). Gillette has one of two strong
brands – Duracell – (the other being Energizer) in the global alkaline battery industry25
.
In 2003, Gillette purchased the leading battery firm in China. Also in 2003, Gillette had
record $1.35 earnings per share26
. Forty one percent of Gillette’s sales have come from
products introduced in the past 5 years27
. Proctor & Gamble already has an established
infrastructure in China. Its Rejoice brand has a 25 to 30 percent share of the Chinese
market. Gillette has a stronger position in toothpaste and deodorant in developing
markets such as Brazil and India. Gillette’s products more effectively compete against
Unilever in these markets.
P&G should be able to grow Gillette in developing markets quicker and more
efficiently. P&G’s sales into emerging markets like Russia, Mexico, and China grew by
20% in 200334
. Gillette had declining sales in Russia and Germany, while P&G has
increased its position by acquiring Germany’s Wella AG hair care line. This acquisition
may help increase Gillette’s position against Unilever in Germany.
P&G has strength in the women’s personal care market with products such as
Clairol, Olay, and Tide. P&G can provide Gillette with expertise to help improve the
marketing of their products to women. Gillette, on the other hand, will provide benefits
to P&G in the form of its knowledge of marketing to men because of their success with
Gillette and Braun products. This acquisition puts the combined firm in an advantageous
position for sustainable growth.
South African Brewers’ (SAB) acquisition of Miller beer is another example of a
firm acquiring a strong brand. Before the acquisition, South African Brewers had a small
position in the North American beer industry. The Miller acquisition significantly
increased SAB’s position within North America. InBev’s 2008 acquisition of Anheuser
Busch allowed InBev to acquire a dominant position within North America. Anheuser
Busch has the strongest brand name of any beer firm in the U.S. and a growing presence
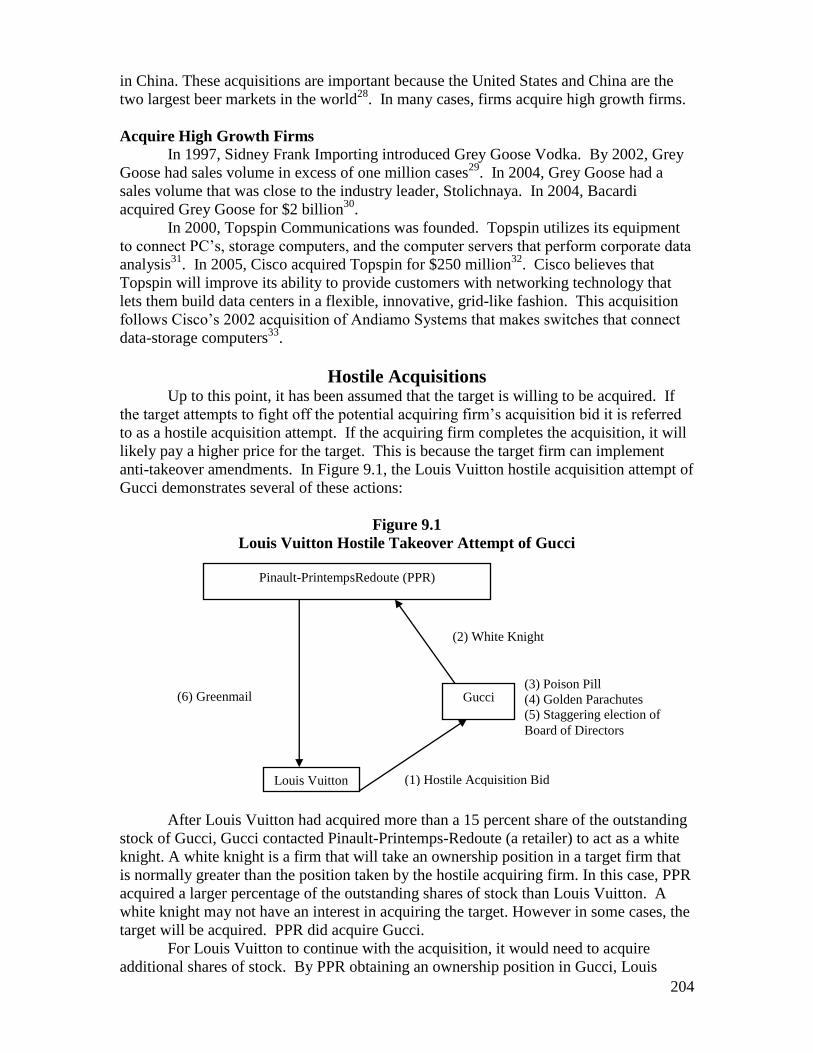
204
in China. These acquisitions are important because the United States and China are the
two largest beer markets in the world28
. In many cases, firms acquire high growth firms.
Acquire High Growth Firms
In 1997, Sidney Frank Importing introduced Grey Goose Vodka. By 2002, Grey
Goose had sales volume in excess of one million cases29
. In 2004, Grey Goose had a
sales volume that was close to the industry leader, Stolichnaya. In 2004, Bacardi
acquired Grey Goose for $2 billion30
.
In 2000, Topspin Communications was founded. Topspin utilizes its equipment
to connect PC’s, storage computers, and the computer servers that perform corporate data
analysis31
. In 2005, Cisco acquired Topspin for $250 million32
. Cisco believes that
Topspin will improve its ability to provide customers with networking technology that
lets them build data centers in a flexible, innovative, grid-like fashion. This acquisition
follows Cisco’s 2002 acquisition of Andiamo Systems that makes switches that connect
data-storage computers33
.
Hostile Acquisitions Up to this point, it has been assumed that the target is willing to be acquired. If
the target attempts to fight off the potential acquiring firm’s acquisition bid it is referred
to as a hostile acquisition attempt. If the acquiring firm completes the acquisition, it will
likely pay a higher price for the target. This is because the target firm can implement
anti-takeover amendments. In Figure 9.1, the Louis Vuitton hostile acquisition attempt of
Gucci demonstrates several of these actions:
Figure 9.1
Louis Vuitton Hostile Takeover Attempt of Gucci
After Louis Vuitton had acquired more than a 15 percent share of the outstanding
stock of Gucci, Gucci contacted Pinault-Printemps-Redoute (a retailer) to act as a white
knight. A white knight is a firm that will take an ownership position in a target firm that
is normally greater than the position taken by the hostile acquiring firm. In this case, PPR
acquired a larger percentage of the outstanding shares of stock than Louis Vuitton. A
white knight may not have an interest in acquiring the target. However in some cases, the
target will be acquired. PPR did acquire Gucci.
For Louis Vuitton to continue with the acquisition, it would need to acquire
additional shares of stock. By PPR obtaining an ownership position in Gucci, Louis
Pinault-PrintempsRedoute (PPR)
Gucci
Louis Vuitton
(2) White Knight
(3) Poison Pill
(4) Golden Parachutes
(5) Staggering election of
Board of Directors
(1) Hostile Acquisition Bid
(6) Greenmail
205
Vuitton would need to acquire over 50 percent of Gucci outstanding stock. If PPR was to
acquire Gucci, Louis Vuitton would then need to acquire both PPR and Gucci. It may be
too costly for Louis Vuitton to continue with the acquisition attempt of both firms.
Because PPR is a retailer while Louis Vuitton is a luxury goods conglomerate, most of
PPR’s product lines are unrelated to Louis Vuitton’s. Acquiring an unrelated firm by the
target firm is a good way to drive the acquiring firm away.
Another anti-takeover strategy is referred to as a poison pill. Gucci also took this
action. Gucci created an employee stock ownership plan (ESOP) to create a class of
stock which was offered for employee purchase. As this stock was acquired, it diluted
Louis Vuitton’s initial position because of the creation of additional, new stock.
Another anti-takeover strategy is called greenmail. As PPR was in the process of
acquiring Gucci, it could have purchased Louis Vuitton’s stock in Gucci for greater than
their market value. In return for obtaining a premium on the stock it had purchased,
Louis Vuitton would agree not to purchase any additional Gucci shares of stock.
A fifth type of anti-takeover amendment is called golden parachutes. Golden
parachutes require that the acquiring firm (Louis Vuitton) pay large lumps of payments to
the senior management team of the target firm in order to complete the acquisition.
Firms can also stagger the election of Board of Directors. If a firm has 12 board
members, each year 3 will come up for re-election. If an acquiring firm completes a
hostile takeover, it will take 12 years to obtain total control due to the staggering pattern
of board members.
With the number of anti-takeover amendments that can be implemented, the cost
of the acquisition continues to increase. In many cases the acquiring firm will search for
more friendly target firms. This is exactly what happened with Louis Vuitton. PPR
acquired Gucci and Louis Vuitton began to look for other options.
In some cases, target firms will attempt to create additional value in order to
increase the purchase price of the target. Scottish & Newcastle PLC has continued to
reject a hostile takeover bid offered jointly by Heineken NV and Carlsberg A/S34
.
Scottish & Newcastle has sold its unprofitable French business and engaged in
downsizing to cut costs further43
.
Are Acquisitions Beneficial? Evidence suggests that for acquiring firms, acquisition strategies may not always
result in desirable outcomes35
. Studies have found that shareholders of target firms often
earn above-average returns, while shareholders of acquiring firms’ returns are near
zero36
. During the 1990’s, acquiring shareholders lost $216 billion37
. Between 1998 and
2001, 87 of the largest acquisitions lost $134 billion in shareholder wealth38
.
There are several reasons for these results. The failure to complete an effective
due diligence process often results in the acquiring firm paying a premium for the target
company. In addition, the entire acquisition process is very time consuming. Typically,
substantial managerial time and energy are required to research, acquire and implement
acquisitions. Because senior managers are consumed with the acquisition process, they
may not devote the necessary time to run their existing business. Senior managers must
still focus upon the mission of the firm while meeting quarterly financial targets. The
acquisition process is an additional responsibility to the ongoing duties of senior
management. In addition, different stakeholders have different expectations.
Communication to various stakeholders is of critical importance.
Employees need to understand why acquisitions are being made and what the
ramifications are for them. If collective bargaining units represent the employees, they
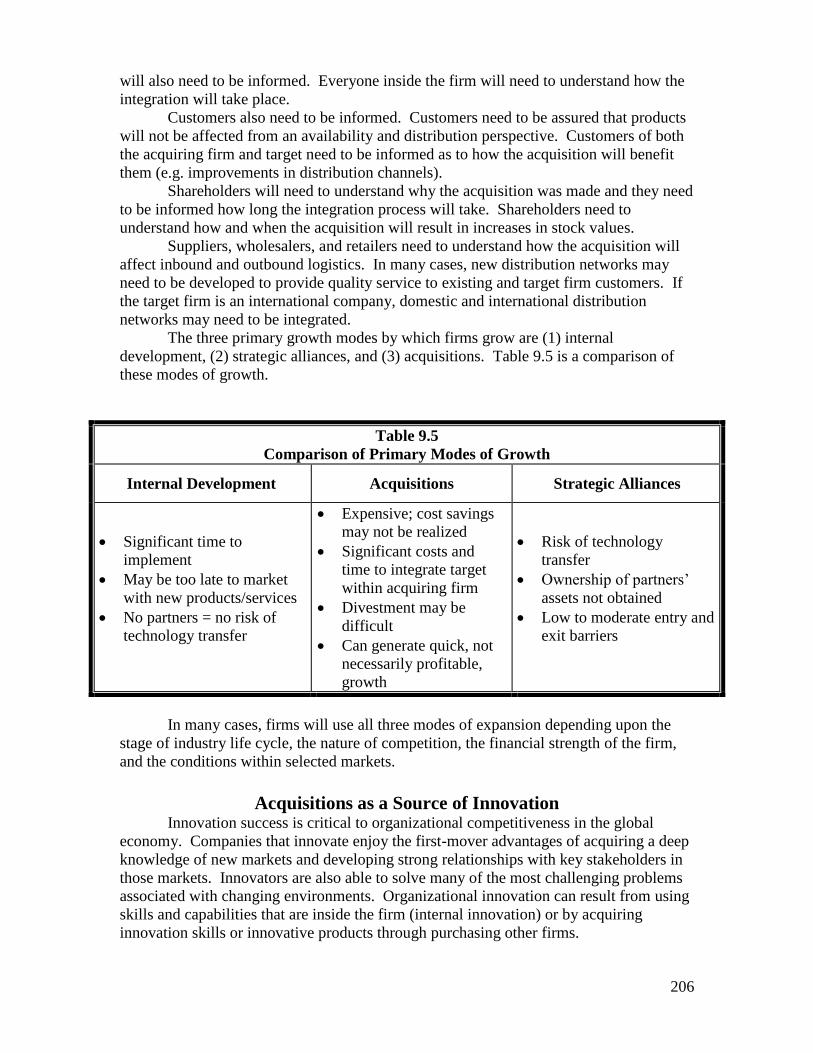
206
will also need to be informed. Everyone inside the firm will need to understand how the
integration will take place.
Customers also need to be informed. Customers need to be assured that products
will not be affected from an availability and distribution perspective. Customers of both
the acquiring firm and target need to be informed as to how the acquisition will benefit
them (e.g. improvements in distribution channels).
Shareholders will need to understand why the acquisition was made and they need
to be informed how long the integration process will take. Shareholders need to
understand how and when the acquisition will result in increases in stock values.
Suppliers, wholesalers, and retailers need to understand how the acquisition will
affect inbound and outbound logistics. In many cases, new distribution networks may
need to be developed to provide quality service to existing and target firm customers. If
the target firm is an international company, domestic and international distribution
networks may need to be integrated.
The three primary growth modes by which firms grow are (1) internal
development, (2) strategic alliances, and (3) acquisitions. Table 9.5 is a comparison of
these modes of growth.
Table 9.5
Comparison of Primary Modes of Growth
Internal Development Acquisitions Strategic Alliances
Significant time to
implement
May be too late to market
with new products/services
No partners = no risk of
technology transfer
Expensive; cost savings
may not be realized
Significant costs and
time to integrate target
within acquiring firm
Divestment may be
difficult
Can generate quick, not
necessarily profitable,
growth
Risk of technology
transfer
Ownership of partners’
assets not obtained
Low to moderate entry and
exit barriers
In many cases, firms will use all three modes of expansion depending upon the
stage of industry life cycle, the nature of competition, the financial strength of the firm,
and the conditions within selected markets.
Acquisitions as a Source of Innovation Innovation success is critical to organizational competitiveness in the global
economy. Companies that innovate enjoy the first-mover advantages of acquiring a deep
knowledge of new markets and developing strong relationships with key stakeholders in
those markets. Innovators are also able to solve many of the most challenging problems
associated with changing environments. Organizational innovation can result from using
skills and capabilities that are inside the firm (internal innovation) or by acquiring
innovation skills or innovative products through purchasing other firms.
207
The rapid change and diffusion of new technology, along with substantial
competition in domestic and international markets, has placed increasing importance on
firms’ ability to innovate and to introduce new innovations into the marketplace39
. In
fact, innovation may be required to maintain or achieve competitive parity within
domestic markets, much less achieve a competitive advantage in many global markets40
.
Any action that either puts the organization into new strategic domains or significantly
alters the way the organization attempts to serve existing customers or constituents is
considered an innovation41
.
Acquisitions assist firms in the innovation process42
. Experiences show that
developing innovations internally and introducing them into the marketplace can be
expensive43
. In some cases, internal innovation is a high risk activity. In 1985, Fed Ex
lost several hundreds of millions of dollars on its Zapmail product innovation. In
addition to the loss of money, the amount of resources which were committed to this
innovation took away substantial resources that could have been utilized for international
expansion. A failure to innovate may put firms on a path to failure44
. Moreover,
significant amounts of time are often required for product innovations to earn a profitable
return on the firm’s investment. Even with proper support in terms of resources and time,
the knowledge that eight of 10 new products fail commercially demonstrates that internal
innovation is risky45
.
Acquisitions can be a substitute for innovation. Because of the low probability of
success and the length of time required for innovations to satisfy hurdle return rates,
some managers believe that internal innovation is a high-risk activity. In these instances,
acquisitions may be an attractive alternative because they offer immediate entrance to a
market that is new for the acquiring firm and/or a larger share of a market the company is
serving already. As with internal innovation, external acquisitions are not risk free;
however, the outcomes from acquisitions are more certain and can be estimated more
accurately compared to internally developed innovation. Firms can innovate by acquiring
innovation skills or innovative products through purchasing other firms.
Many pharmaceutical firms are making acquisitions to add new drugs to existing
product lines (e.g. cholesterol reducing medicine). For example, Warner-Lambert
acquired Agouron Pharmaceuticals Inc. in large part due to Agouron’s research and
development expertise in such areas as cancer.
Innovation (whether developed internally or acquired) is a source of value
creation and competitive advantage for individual firms. Innovation increasingly is
recognized as a key link to the firm’s strategic competitiveness. Innovation may be a
factor that differentiates successful companies from competitors. Acquisitions can
become a substitute for innovation in companies actively using an acquisition strategy.
208
Discussion Questions
1. Why has the telecommunications industry consolidated?
2. Is size of target firm related to acquisition success?
3. Identify and explain the attributes of successful acquisitions.
4. Did Oracle follow the recommended approach of achieving acquisition success?
Explain.
5. Explain the concept of synergy from an acquisition perspective.
6. Will acquisition of large targets continue? Explain.
7. Explain why hostile acquisitions are not normally recommended.
8. Explain anti-takeover amendments that target firms can implement to fight off
hostile takeover attempts.
9. Did the pattern of mergers and acquisitions (M&A) change during the global
economic recession (2009-2010)?
209
References
1. P. Walden, “A Look at 2010’s Mergers & Acquisitions,” Merger & Acquisition
Journal, January, 2011.
2. Ibid
3. ____ “Pharmaceutical Companies Seek Biotech Acquisitions to Boost Drug
Pipelines,” ICIS Chemical Business, February 12, 2010.
4. Ibid
5. Ibid
6. D. Bedell, “Largest M&A Deals in 2009 and 2010,” Thompson Reuters Mergers and
Acquisition Review, 2009, 2010.
7. Ibid
8. Ibid
9. ____ “The Largest Mergers and Acquisitions in History,” Thompson Reuters,
Mergers and Acquisitions Review, 2009.
10. _________. 2005. Merger snapshots: who did the big deals. Wall Street Journal. May
15.
11. Schatz, A. and Hughes, S. 2007. Justice department criticized for approving big
AT&T deal. Wall Street Journal. November 22.
12. Burton, T., Hensley, S. and Sidel, R. 2004. Behind the J&J Guidant talks: heart
implants. Wall Street Journal. December 8.
13. Martinez, B. 2005. Medco to buy Accredo Health in $2.2 billion cash-stock deal.
Wall Street Journal. February 22.
14. Ibid.
15. _________. 2005. The rise of the super brands. The Economist, February 5-11.
16. Ibid.
17. Ibid.
18. Tam, P. 2005. HP’s printer business takes a hit as rivals muscle in. Wall Street
Journal. March 10.
19. Ibid
210
20. Berman, D. and Machalaba, D. 2005. Yellow Roadway is in talks to buy USF. Wall
Street Journal. February 23.
21. Ibid.
22. __________. 2005. The rise of the super brands. The Economist, February 5-11.
23. Ibid
24. Steinburg B. and Vranica S. 2005. When beauty met sweaty. Wall Street Journal.
January 31.
25. Byrnes, N. and Symonds, W. 2005. Brands lessons from Gillette. Wall Street Journal.
February 14.
26. Ibid
27. Ibid
28. _________. 2002. SAB poised to clinch Miller acquisition. Modern Brewery Age.
April 22.
29. Lawton, C. 2005. Stolichnaya maker takes shot at ads for Grey Goose. Wall Street
Journal. April 15.
30. Ibid
31. _________. 2005. Cisco agrees to buy networking firm for $250 million. Wall Street
Journal. April 15.
32. Ibid
33. Ibid
34. Scottish and New Castle rejects takeover bid. 2007. Wall Street Journal. November
21.
35. Ibid
36. Gugler, K., Mueller, D., Yurtoglu, R. and Zulehner, C. 2003. The effects of mergers:
An international comparison. International Journal of Industrial Organization. 21:
625-653.
37. Ibid
38. Cornett, M., Hovakimian, G., Palia, D. and Tehranian, G. 2003. The impact of the
manager-shareholder conflict on acquiring firm’s returns. Journal of Banking &
Finance. 27: 103-131.
211
39. Hitt, M., Nixon, R., Hoskisson, R., and Kochhar. 1999. Entrepreneurship and cross-
functional fertilization: activation, process and disintegration of a new product design
team, Entrepreneurship: Theory & Practice, 23(3): 145-167.
40. Ibid
41. Hitt, M., Haprison, J., and Ireland, R. 1990. Mergers and acquisitions: a guide to
creating value for stakeholders. Oxford University Press.
42. Shank, J.K. and Govindarajan, V. 1992. Strategic cost analysis of technological
investments. Sloan Management Review. 34(Fall): 39-51.
43. Hitt, M., Haprison, J., and Ireland, R. 1990. Mergers and acquisitions: a guide to
creating value for stakeholders. Oxford University Press
44. Marcotti, G. 1998. Technology Innovation: Eight out of 10 new products are
commercial failures. Financial Times. March 31: 21.
45. Ibid
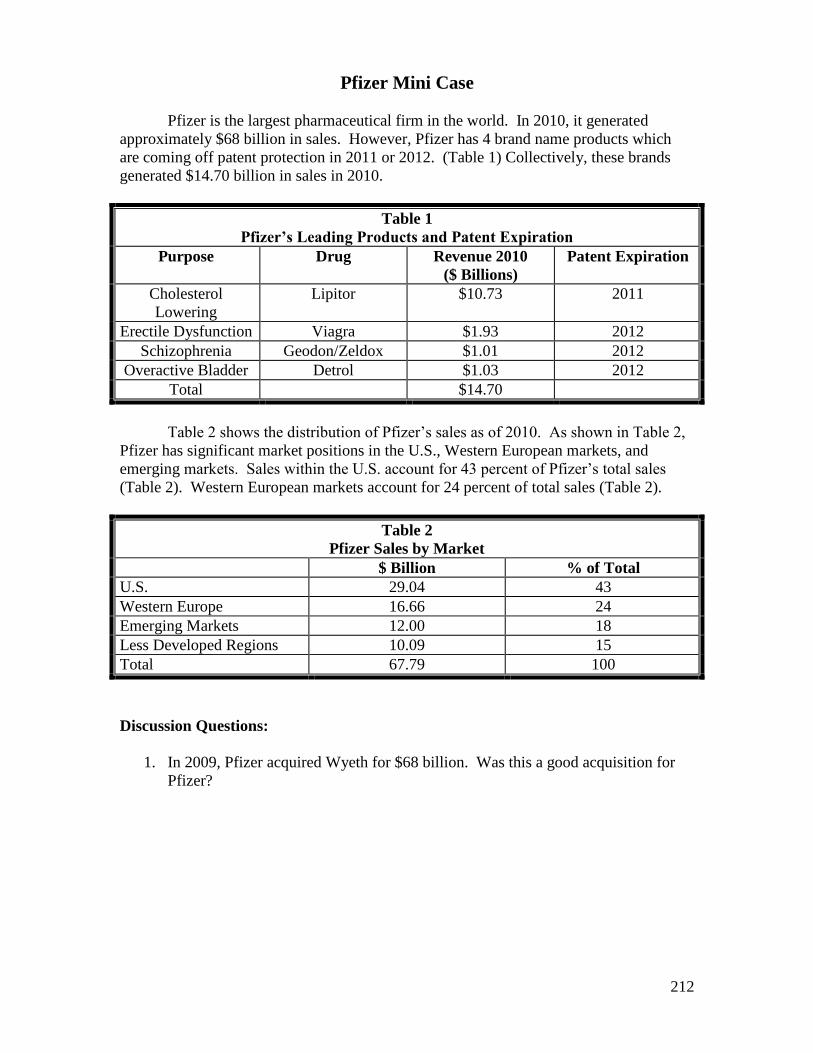
212
Pfizer Mini Case
Pfizer is the largest pharmaceutical firm in the world. In 2010, it generated
approximately $68 billion in sales. However, Pfizer has 4 brand name products which
are coming off patent protection in 2011 or 2012. (Table 1) Collectively, these brands
generated $14.70 billion in sales in 2010.
Table 1
Pfizer’s Leading Products and Patent Expiration
Purpose Drug Revenue 2010
($ Billions)
Patent Expiration
Cholesterol
Lowering
Lipitor $10.73 2011
Erectile Dysfunction Viagra $1.93 2012
Schizophrenia Geodon/Zeldox $1.01 2012
Overactive Bladder Detrol $1.03 2012
Total $14.70
Table 2 shows the distribution of Pfizer’s sales as of 2010. As shown in Table 2,
Pfizer has significant market positions in the U.S., Western European markets, and
emerging markets. Sales within the U.S. account for 43 percent of Pfizer’s total sales
(Table 2). Western European markets account for 24 percent of total sales (Table 2).
Table 2
Pfizer Sales by Market
$ Billion % of Total
U.S. 29.04 43
Western Europe 16.66 24
Emerging Markets 12.00 18
Less Developed Regions 10.09 15
Total 67.79 100
Discussion Questions:
1. In 2009, Pfizer acquired Wyeth for $68 billion. Was this a good acquisition for
Pfizer?
213
Harvard Business Cases for Chapter 9
Grolsch: Growing Globally
Product Number PG0002
Foreign Investment in Russia: Challenging the Beal
Product Number TB0015
Professor Case for Chapter 9
Caterpillar

214

215
Chapter 10
International Strategies
216
Learning and Assessment Goals
1. Understand the process of international strategy analysis
2. Be able to perform the analysis for determining international country
attractiveness.
3. Be able to perform the analysis for identifying attractive international industries.
4. Be able to perform competitive analysis within an international industry.
5. Understand the different modes of entry into international markets.
217
This chapter discusses international strategy. Within the last 3 decades world
trade has expanded from $200 billion to $7 trillion1. U.S. investment in international
markets increased from $198 billion in 1990 to $2.03 trillion in 19992. With these
growth rates, the key question is not “if” a firm should develop an international strategy.
The key questions are “where” and “how” a firm should establish international strategies.
Factors Encouraging International Expansion There are several factors fueling this growth. First, firms generate excess
capacity3. If this excess capacity is excess production capacity, firms may attempt to
utilize this extra capacity in international markets4. Utilization of the excess capacity in
international markets may allow a firm to obtain a lower cost position within its domestic
markets by generating economies of scale. In addition, firms generate additional revenue
streams from international expansion.
Second, firms may be able to enter international industries that are at earlier
stages of the industry life cycle. In Chapter 3, Industry Analysis, we learned that
homogeneous products characterize the maturity stage of an industry’s life cycle with the
advantage to large-scale providers. Within the U.S., many industries are in the maturity
stage of the industry life cycle. Examples are the airline, trucking, fast food, and
beverage industries. All of these industries have undergone substantial consolidation.
Because firms within the maturity stage of the life cycle must compete on price, large
scale is required to survive the industry consolidation. As discussed in Chapter 9, the
U.S. telecommunications industry is a prime example. Verizon’s $8 billion acquisition of
MCI, Sprint’s $35 billion acquisition of Nextel and SBC’s $22 billion acquisition of
AT&T Wireless have created a small number of very large telecommunications players.
If these firms do not expand into international markets, they can only compete on price.
International expansion represents the only substantial opportunity for growth within this
industry.
A third factor that has fueled international growth is the emergence of China as a
consumer market. China has an emerging middle class that has 300 million consumers5.
This is approximately equivalent to the entire U.S. population. China is a primary market
for outsourcing. Many manufacturing firms have significant positions within China. As
China has developed a more complete infrastructure, growth has accelerated. The beer
industry is one example of the growth of China. China is the second largest (U.S. is first)
beer drinking market in the world6. This is one reason Anheuser Busch acquired Hardin,
a large Chinese brewer, in 2003. In the near future, Anheuser Busch will be increasing its
stake to 27 percent in Tsingtao, the largest Chinese brewer7.
A fourth factor that has fueled international growth is the deregulation of many
industries in international markets. India is in the process of deregulating several of its
industries. The passenger airline industry is one example. Air India and Indian Airlines
are experiencing competition from Britain’s Virgin Group, Emirates Group, and Jet
Airways8. Jet Airways is a privately owned airline in India
9.
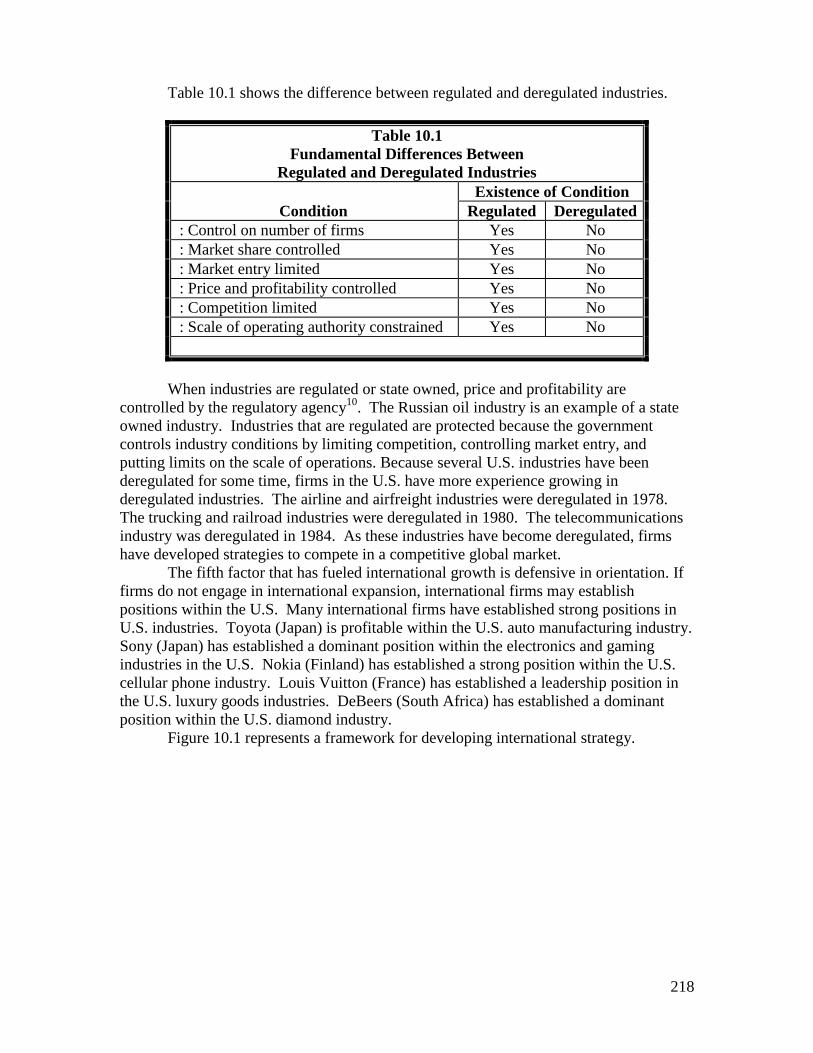
218
Table 10.1 shows the difference between regulated and deregulated industries.
Table 10.1
Fundamental Differences Between
Regulated and Deregulated Industries
Condition
Existence of Condition
Regulated Deregulated
: Control on number of firms Yes No
: Market share controlled Yes No
: Market entry limited Yes No
: Price and profitability controlled Yes No
: Competition limited Yes No
: Scale of operating authority constrained Yes No
When industries are regulated or state owned, price and profitability are
controlled by the regulatory agency10
. The Russian oil industry is an example of a state
owned industry. Industries that are regulated are protected because the government
controls industry conditions by limiting competition, controlling market entry, and
putting limits on the scale of operations. Because several U.S. industries have been
deregulated for some time, firms in the U.S. have more experience growing in
deregulated industries. The airline and airfreight industries were deregulated in 1978.
The trucking and railroad industries were deregulated in 1980. The telecommunications
industry was deregulated in 1984. As these industries have become deregulated, firms
have developed strategies to compete in a competitive global market.
The fifth factor that has fueled international growth is defensive in orientation. If
firms do not engage in international expansion, international firms may establish
positions within the U.S. Many international firms have established strong positions in
U.S. industries. Toyota (Japan) is profitable within the U.S. auto manufacturing industry.
Sony (Japan) has established a dominant position within the electronics and gaming
industries in the U.S. Nokia (Finland) has established a strong position within the U.S.
cellular phone industry. Louis Vuitton (France) has established a leadership position in
the U.S. luxury goods industries. DeBeers (South Africa) has established a dominant
position within the U.S. diamond industry.
Figure 10.1 represents a framework for developing international strategy.
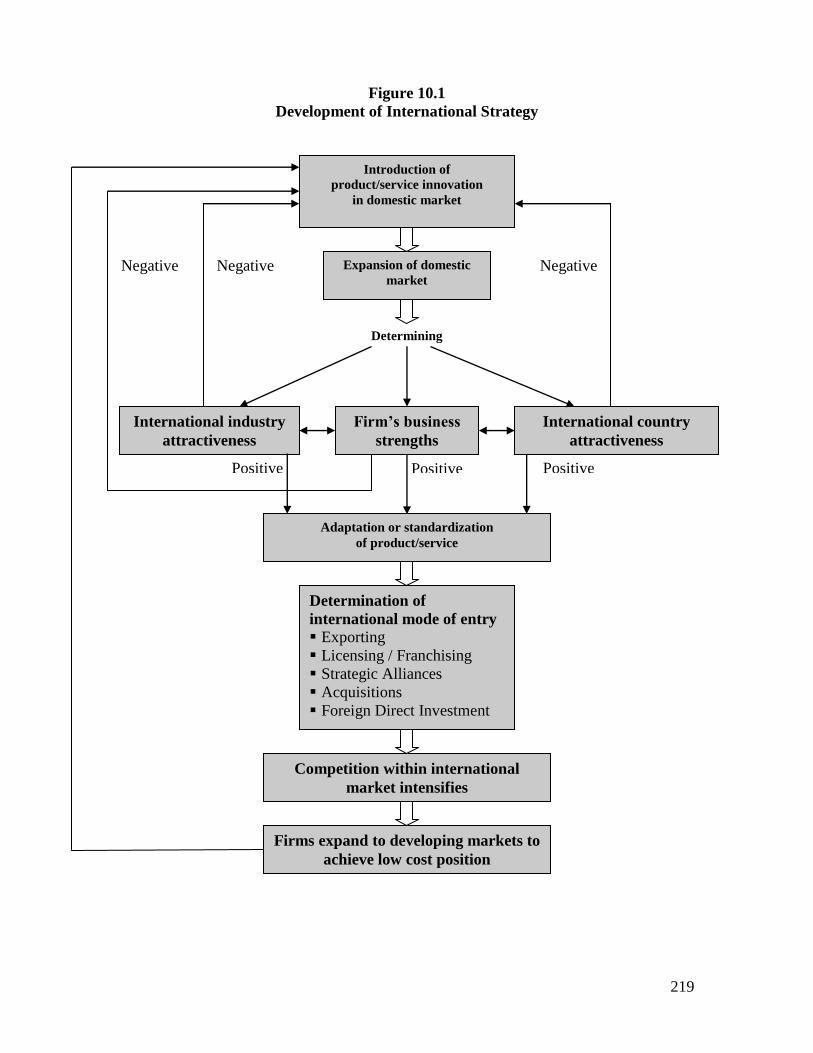
219
Determining
Figure 10.1
Development of International Strategy
Introduction of
product/service innovation
in domestic market
Expansion of domestic
market
Firms expand to developing markets to
achieve low cost position
Competition within international
market intensifies
Negative
Determination of
international mode of entry
Exporting
Licensing / Franchising
Strategic Alliances
Acquisitions
Foreign Direct Investment
Negative
Positive Positive
Adaptation or standardization
of product/service
Positive
Negative
International industry
attractiveness
International country
attractiveness
Firm’s business
strengths
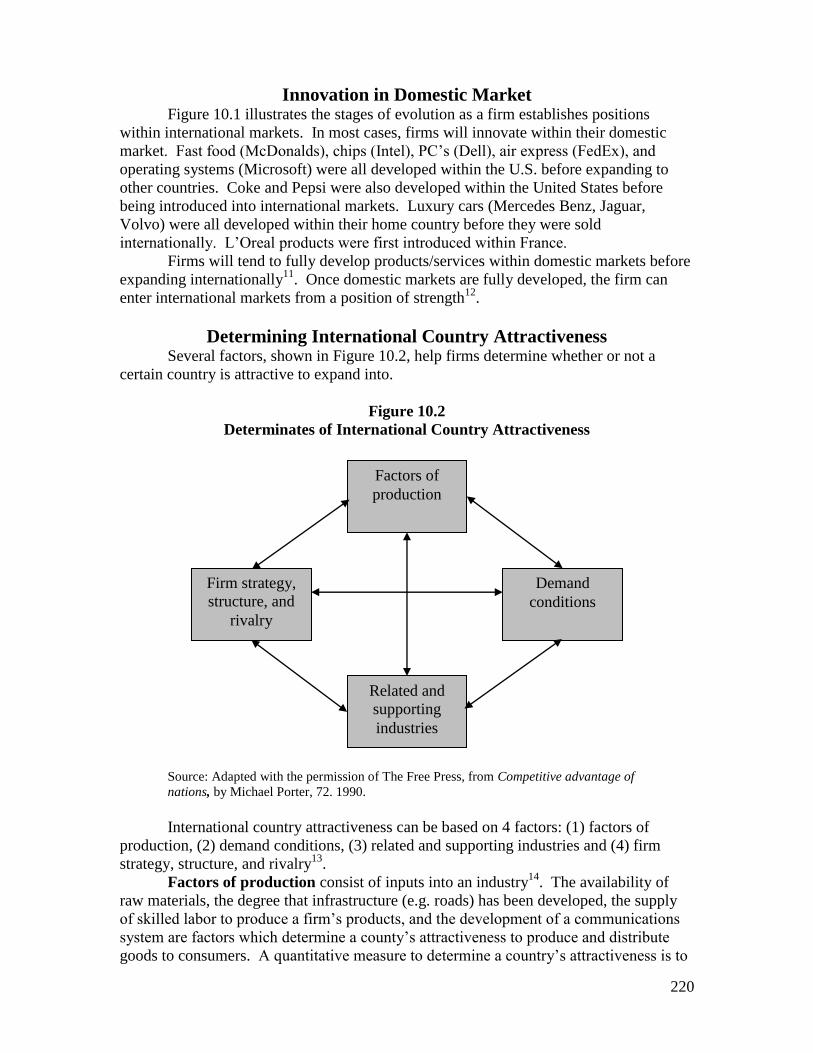
220
Innovation in Domestic Market Figure 10.1 illustrates the stages of evolution as a firm establishes positions
within international markets. In most cases, firms will innovate within their domestic
market. Fast food (McDonalds), chips (Intel), PC’s (Dell), air express (FedEx), and
operating systems (Microsoft) were all developed within the U.S. before expanding to
other countries. Coke and Pepsi were also developed within the United States before
being introduced into international markets. Luxury cars (Mercedes Benz, Jaguar,
Volvo) were all developed within their home country before they were sold
internationally. L’Oreal products were first introduced within France.
Firms will tend to fully develop products/services within domestic markets before
expanding internationally11
. Once domestic markets are fully developed, the firm can
enter international markets from a position of strength12
.
Determining International Country Attractiveness Several factors, shown in Figure 10.2, help firms determine whether or not a
certain country is attractive to expand into.
Figure 10.2
Determinates of International Country Attractiveness
Source: Adapted with the permission of The Free Press, from Competitive advantage of
nations, by Michael Porter, 72. 1990.
International country attractiveness can be based on 4 factors: (1) factors of
production, (2) demand conditions, (3) related and supporting industries and (4) firm
strategy, structure, and rivalry13
.
Factors of production consist of inputs into an industry14
. The availability of
raw materials, the degree that infrastructure (e.g. roads) has been developed, the supply
of skilled labor to produce a firm’s products, and the development of a communications
system are factors which determine a county’s attractiveness to produce and distribute
goods to consumers. A quantitative measure to determine a country’s attractiveness is to
Factors of
production
Firm strategy,
structure, and
rivalry
Demand
conditions
Related and
supporting
industries
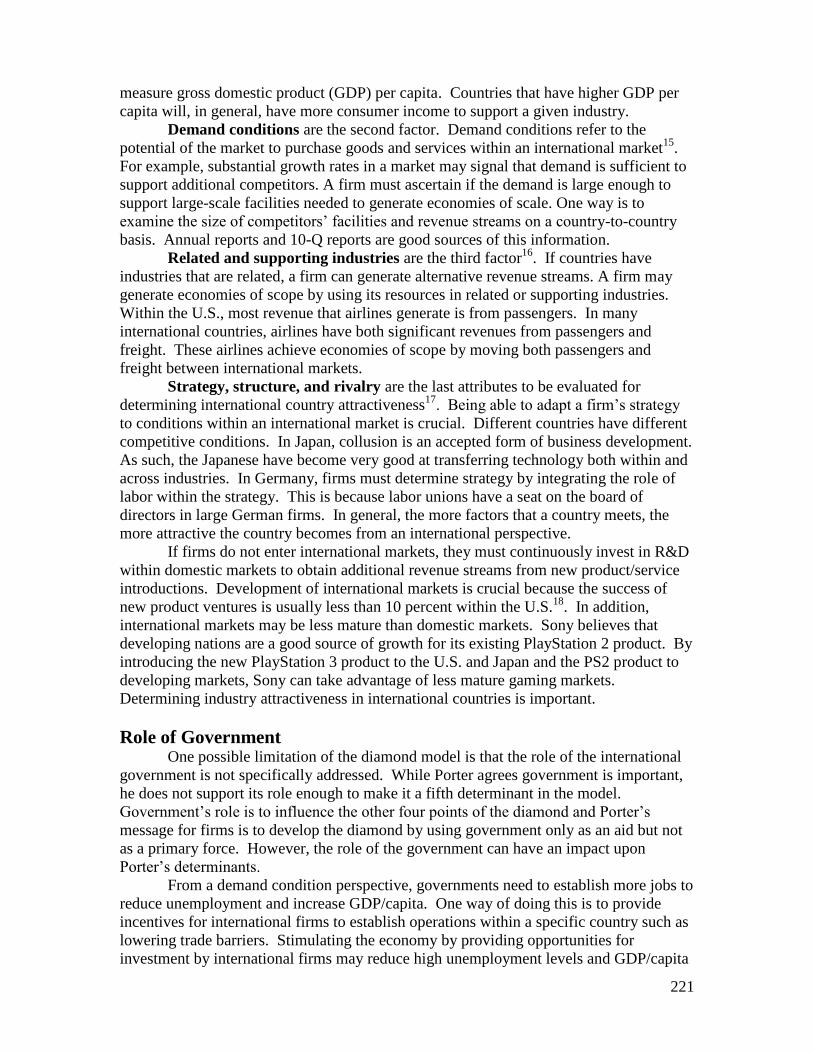
221
measure gross domestic product (GDP) per capita. Countries that have higher GDP per
capita will, in general, have more consumer income to support a given industry.
Demand conditions are the second factor. Demand conditions refer to the
potential of the market to purchase goods and services within an international market15
.
For example, substantial growth rates in a market may signal that demand is sufficient to
support additional competitors. A firm must ascertain if the demand is large enough to
support large-scale facilities needed to generate economies of scale. One way is to
examine the size of competitors’ facilities and revenue streams on a country-to-country
basis. Annual reports and 10-Q reports are good sources of this information.
Related and supporting industries are the third factor16
. If countries have
industries that are related, a firm can generate alternative revenue streams. A firm may
generate economies of scope by using its resources in related or supporting industries.
Within the U.S., most revenue that airlines generate is from passengers. In many
international countries, airlines have both significant revenues from passengers and
freight. These airlines achieve economies of scope by moving both passengers and
freight between international markets.
Strategy, structure, and rivalry are the last attributes to be evaluated for
determining international country attractiveness17
. Being able to adapt a firm’s strategy
to conditions within an international market is crucial. Different countries have different
competitive conditions. In Japan, collusion is an accepted form of business development.
As such, the Japanese have become very good at transferring technology both within and
across industries. In Germany, firms must determine strategy by integrating the role of
labor within the strategy. This is because labor unions have a seat on the board of
directors in large German firms. In general, the more factors that a country meets, the
more attractive the country becomes from an international perspective.
If firms do not enter international markets, they must continuously invest in R&D
within domestic markets to obtain additional revenue streams from new product/service
introductions. Development of international markets is crucial because the success of
new product ventures is usually less than 10 percent within the U.S.18
. In addition,
international markets may be less mature than domestic markets. Sony believes that
developing nations are a good source of growth for its existing PlayStation 2 product. By
introducing the new PlayStation 3 product to the U.S. and Japan and the PS2 product to
developing markets, Sony can take advantage of less mature gaming markets.
Determining industry attractiveness in international countries is important.
Role of Government One possible limitation of the diamond model is that the role of the international
government is not specifically addressed. While Porter agrees government is important,
he does not support its role enough to make it a fifth determinant in the model.
Government’s role is to influence the other four points of the diamond and Porter’s
message for firms is to develop the diamond by using government only as an aid but not
as a primary force. However, the role of the government can have an impact upon
Porter’s determinants.
From a demand condition perspective, governments need to establish more jobs to
reduce unemployment and increase GDP/capita. One way of doing this is to provide
incentives for international firms to establish operations within a specific country such as
lowering trade barriers. Stimulating the economy by providing opportunities for
investment by international firms may reduce high unemployment levels and GDP/capita
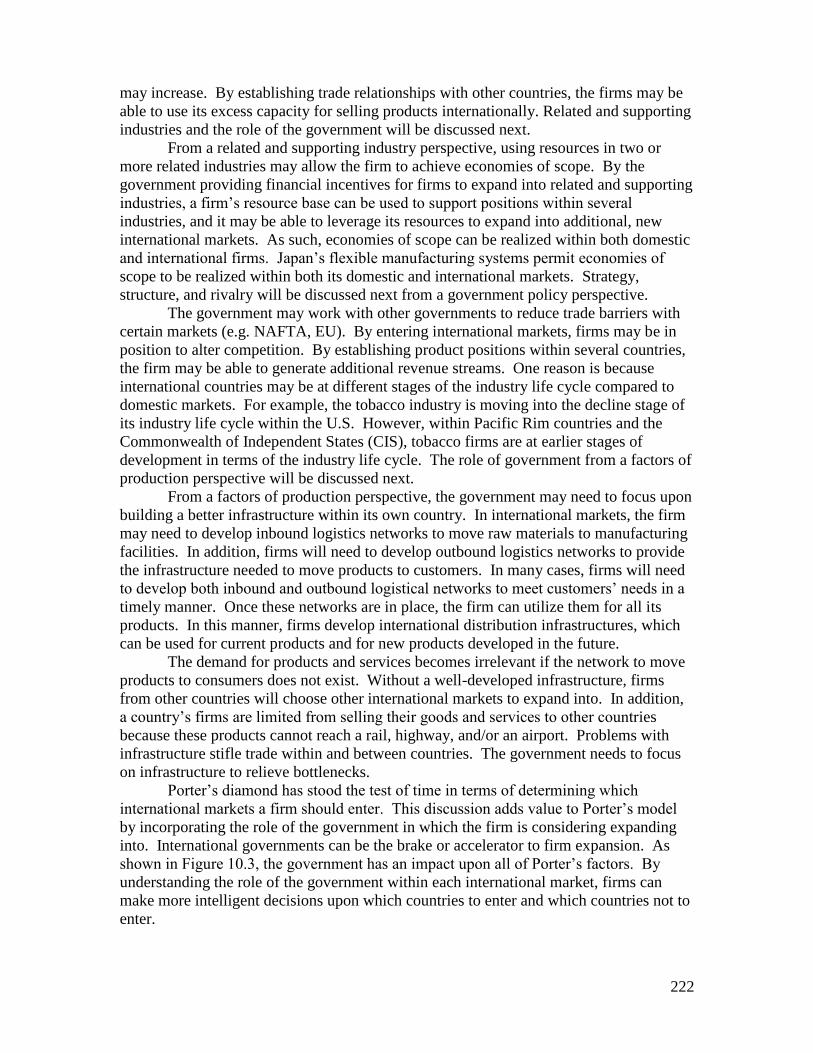
222
may increase. By establishing trade relationships with other countries, the firms may be
able to use its excess capacity for selling products internationally. Related and supporting
industries and the role of the government will be discussed next.
From a related and supporting industry perspective, using resources in two or
more related industries may allow the firm to achieve economies of scope. By the
government providing financial incentives for firms to expand into related and supporting
industries, a firm’s resource base can be used to support positions within several
industries, and it may be able to leverage its resources to expand into additional, new
international markets. As such, economies of scope can be realized within both domestic
and international firms. Japan’s flexible manufacturing systems permit economies of
scope to be realized within both its domestic and international markets. Strategy,
structure, and rivalry will be discussed next from a government policy perspective.
The government may work with other governments to reduce trade barriers with
certain markets (e.g. NAFTA, EU). By entering international markets, firms may be in
position to alter competition. By establishing product positions within several countries,
the firm may be able to generate additional revenue streams. One reason is because
international countries may be at different stages of the industry life cycle compared to
domestic markets. For example, the tobacco industry is moving into the decline stage of
its industry life cycle within the U.S. However, within Pacific Rim countries and the
Commonwealth of Independent States (CIS), tobacco firms are at earlier stages of
development in terms of the industry life cycle. The role of government from a factors of
production perspective will be discussed next.
From a factors of production perspective, the government may need to focus upon
building a better infrastructure within its own country. In international markets, the firm
may need to develop inbound logistics networks to move raw materials to manufacturing
facilities. In addition, firms will need to develop outbound logistics networks to provide
the infrastructure needed to move products to customers. In many cases, firms will need
to develop both inbound and outbound logistical networks to meet customers’ needs in a
timely manner. Once these networks are in place, the firm can utilize them for all its
products. In this manner, firms develop international distribution infrastructures, which
can be used for current products and for new products developed in the future.
The demand for products and services becomes irrelevant if the network to move
products to consumers does not exist. Without a well-developed infrastructure, firms
from other countries will choose other international markets to expand into. In addition,
a country’s firms are limited from selling their goods and services to other countries
because these products cannot reach a rail, highway, and/or an airport. Problems with
infrastructure stifle trade within and between countries. The government needs to focus
on infrastructure to relieve bottlenecks.
Porter’s diamond has stood the test of time in terms of determining which
international markets a firm should enter. This discussion adds value to Porter’s model
by incorporating the role of the government in which the firm is considering expanding
into. International governments can be the brake or accelerator to firm expansion. As
shown in Figure 10.3, the government has an impact upon all of Porter’s factors. By
understanding the role of the government within each international market, firms can
make more intelligent decisions upon which countries to enter and which countries not to
enter.
223
Figure 10.3
The Role of Government and International Country Attractiveness
Determination of International Industry Attractiveness Several criteria can be utilized to determine international industry attractiveness.
Some important factors are as follows: (1) state ownership of industry, (2) government
intervention within industries, (3) industry competitiveness, (4) industry profitability, (5)
degree of product differentiation, (6) presence of large, multi-national firms within the
industry, (7) significance of “Not Invented Here” syndrome, and (8) industry growth
rates. Each criterion will now be briefly discussed.
If the government owns the industry, international firms cannot achieve a position
within it. As such, if the industry is state owned no further consideration should occur.
The second criterion is government intervention within industries. As discussed
earlier, while firms in an industry may not be state owned, governments can take actions
to support existing firms within the industry. Examples of such actions would be import
duties, tariffs, or providing financial support for domestic firms. This is also a criterion
that could prevent firms from entering an international industry.
Porter’s 5 forces model can be used to determine international competitiveness. If
entry barriers are high, an international firm may choose an industry that has lower
barriers to entry. If buyers have significant bargaining power, a new entrant would need
to enter the industry with a value added product or products. These products may require
significant product R&D investment. If products are substitutable, customers within the
international industry have no incentive to switch. If suppliers have significant
bargaining power, firms entering the industry may have difficulty establishing an inbound
Factors of
Production
Demand
Conditions
Firm Strategy,
Structure, and
Rivalry
Related and
Supporting
Industries
Role of the
International
Government
224
logistic network. If existing industry rivalry is significant, new entrants may have
difficulty competing.
Industry profitability is a crucial statistic. Firms are in business to maximize
earning so that shareholder wealth can appreciate. Some industries are more profitable
than others. For example, firms within the U.S. oil industry are achieving much higher
earnings than firms within the U.S. commercial airline industry.
The degree to which products of firms within the industry are differentiated
implies that the industry may not have reached the maturity stage. From Chapter 1, firms
that are marketing differentiated products will most likely be in the growth stage of the
industry life cycle. The maturity state occurs when competitors compete upon the basis
of price as opposed to differentiation.
The presence of large multi-national firms within the international industry may
act as a barrier to entry. If multi-national firms are of sufficient size, they may be
generating economies of scale that would allow them to reduce price to combat new
entrants. These firms may have sufficient resources to introduce value added features to
existing products within the industry. Industries that do not have multi-national firms
may be more attractive to new entrants.
If it is important to have products that are manufactured within the international
market, it may require firms to engage in Foreign Direct Investment (FDI) within these
markets. Brand name of existing firms may be quite significant. For example, because
Harley Davidson motorcycles are “made in America”, it is difficult for an international
firm to compete within the U.S. heavyweight motorcycle market.
High industry growth rates may indicate that the international industry is in the
growth stage of its life cycle. As such, a new entrant may enter the industry and grow as
the industry grows. Lower industry growth rates may imply that the industry is in the
mature stage.
Table 10.2 illustrates how an industry analysis would be conducted within an
international country (A). Industry analysis should be conducted for all industries in all
countries a firm is considering entering.
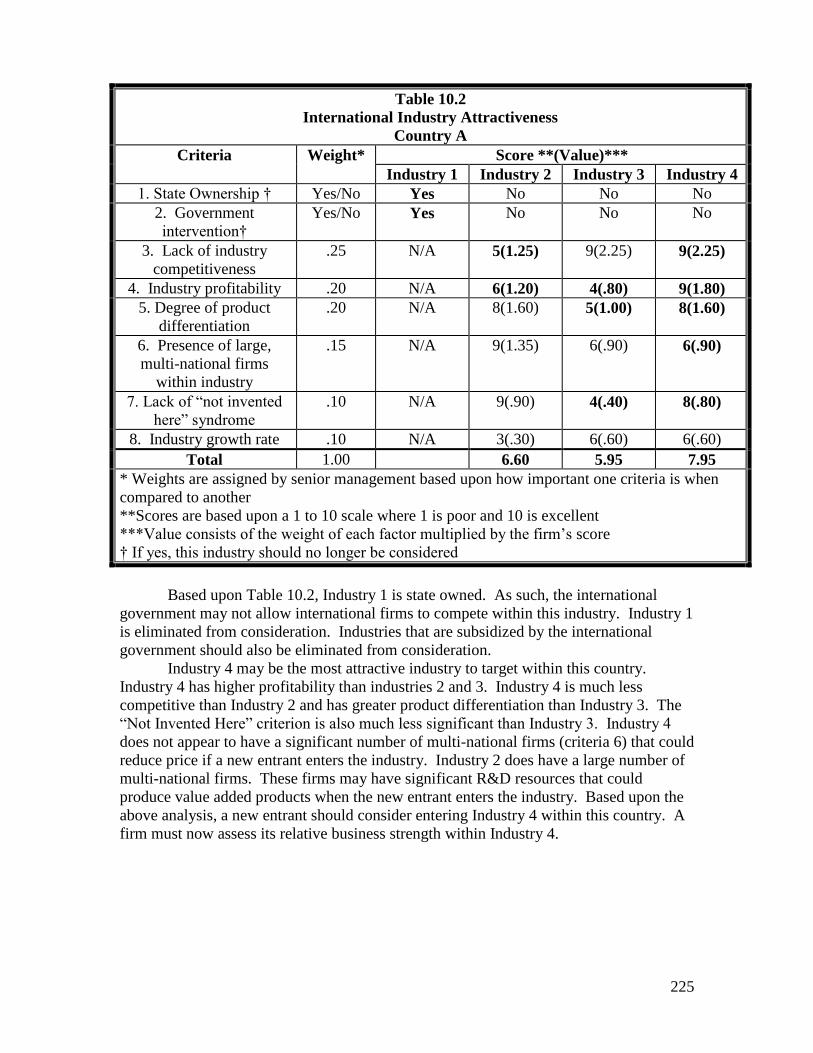
225
Table 10.2
International Industry Attractiveness
Country A
Criteria Weight* Score **(Value)***
Industry 1 Industry 2 Industry 3 Industry 4
1. State Ownership † Yes/No Yes No No No
2. Government
intervention†
Yes/No Yes No No No
3. Lack of industry
competitiveness
.25 N/A 5(1.25) 9(2.25) 9(2.25)
4. Industry profitability .20 N/A 6(1.20) 4(.80) 9(1.80)
5. Degree of product
differentiation
.20 N/A 8(1.60) 5(1.00) 8(1.60)
6. Presence of large,
multi-national firms
within industry
.15 N/A 9(1.35) 6(.90) 6(.90)
7. Lack of “not invented
here” syndrome
.10 N/A 9(.90) 4(.40) 8(.80)
8. Industry growth rate .10 N/A 3(.30) 6(.60) 6(.60)
Total 1.00 6.60 5.95 7.95
* Weights are assigned by senior management based upon how important one criteria is when
compared to another
**Scores are based upon a 1 to 10 scale where 1 is poor and 10 is excellent
***Value consists of the weight of each factor multiplied by the firm’s score
† If yes, this industry should no longer be considered
Based upon Table 10.2, Industry 1 is state owned. As such, the international
government may not allow international firms to compete within this industry. Industry 1
is eliminated from consideration. Industries that are subsidized by the international
government should also be eliminated from consideration.
Industry 4 may be the most attractive industry to target within this country.
Industry 4 has higher profitability than industries 2 and 3. Industry 4 is much less
competitive than Industry 2 and has greater product differentiation than Industry 3. The
“Not Invented Here” criterion is also much less significant than Industry 3. Industry 4
does not appear to have a significant number of multi-national firms (criteria 6) that could
reduce price if a new entrant enters the industry. Industry 2 does have a large number of
multi-national firms. These firms may have significant R&D resources that could
produce value added products when the new entrant enters the industry. Based upon the
above analysis, a new entrant should consider entering Industry 4 within this country. A
firm must now assess its relative business strength within Industry 4.
226
Determination of Firms’ Business Strengths Table 10.3 addresses a firm’s business strength within a specific country and
industry. A new entrant’s relative business strength versus existing competitors needs to
be evaluated before entering the industry. Some of the criteria which impact firm
competitiveness within an industry are: (1) firm’s financial performance, (2) degree of
product R&D required, (3) degree to which large scale production facilities are required,
(4) significance of brand name, (5) level of process R&D required, (6) expense of
developing distribution channels, and (7) expense of sourcing raw materials. Each of
these criteria will now be discussed.
Firms that have strong historical financial performance may be better positioned
to negatively impact new entrants. These firms may be able to add value to existing
products and/or reduce price while maintaining positive margins.
Firms that have significant funds to devote to product R&D expenditures can
more easily adapt products within an industry. If products are not standardized, product
R&D must be incurred. Product R&D is primarily focused upon the development of new
products or the re-positioning of existing products. If the industry requires new products,
R&D expenditures may increase significantly. In addition, marketing research is
necessary to determine what specific types of products are required.
It may be necessary to establish large scale operating facilities within the
international markets. If competitors within the industry have already established such
facilities, they may be able to reduce price to combat the new entrant while maintaining
margins.
If existing products have strong brand names it may be difficult to convince
customers to purchase products from a new firm. A strong brand name can be a factor in
maintaining repeat customer purchasing and act as a barrier of entry. Promotional
expenses could be significant for new entrants if existing customers are brand loyal.
In order to sell products within international markets, firms will need to establish
a distribution network to reach customers within the foreign market. The firm will need
to develop an inbound logistics network to move raw materials to manufacturing
facilities. Both inbound and outbound logistics networks may need to be developed.
Once manufacturing facilities have been constructed, investments in process R&D
may be required. Process R&D investments are primarily focused upon efficiency.
Automation and six sigma are examples of process R&D expenditures. Competitors may
have already incurred the design and implementation of such initiatives. In addition,
many TQM initiatives can be expensive to implement.
Table 10.3 illustrates how a business strength assessment can be developed within
an international industry.
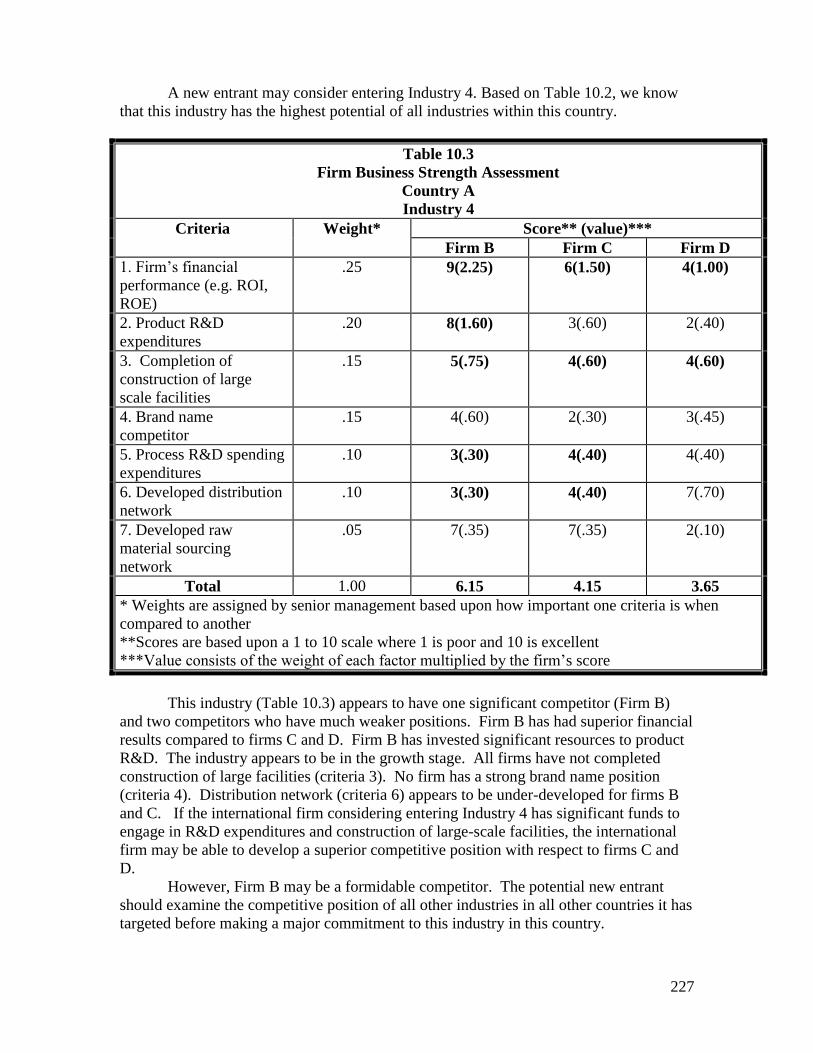
227
A new entrant may consider entering Industry 4. Based on Table 10.2, we know
that this industry has the highest potential of all industries within this country.
Table 10.3
Firm Business Strength Assessment
Country A
Industry 4
Criteria Weight* Score** (value)***
Firm B Firm C Firm D
1. Firm’s financial
performance (e.g. ROI,
ROE)
.25 9(2.25) 6(1.50) 4(1.00)
2. Product R&D
expenditures
.20 8(1.60) 3(.60) 2(.40)
3. Completion of
construction of large
scale facilities
.15 5(.75) 4(.60) 4(.60)
4. Brand name
competitor
.15 4(.60) 2(.30) 3(.45)
5. Process R&D spending
expenditures
.10 3(.30) 4(.40) 4(.40)
6. Developed distribution
network
.10 3(.30) 4(.40) 7(.70)
7. Developed raw
material sourcing
network
.05 7(.35) 7(.35) 2(.10)
Total 1.00 6.15 4.15 3.65
* Weights are assigned by senior management based upon how important one criteria is when
compared to another
**Scores are based upon a 1 to 10 scale where 1 is poor and 10 is excellent
***Value consists of the weight of each factor multiplied by the firm’s score
This industry (Table 10.3) appears to have one significant competitor (Firm B)
and two competitors who have much weaker positions. Firm B has had superior financial
results compared to firms C and D. Firm B has invested significant resources to product
R&D. The industry appears to be in the growth stage. All firms have not completed
construction of large facilities (criteria 3). No firm has a strong brand name position
(criteria 4). Distribution network (criteria 6) appears to be under-developed for firms B
and C. If the international firm considering entering Industry 4 has significant funds to
engage in R&D expenditures and construction of large-scale facilities, the international
firm may be able to develop a superior competitive position with respect to firms C and
D.
However, Firm B may be a formidable competitor. The potential new entrant
should examine the competitive position of all other industries in all other countries it has
targeted before making a major commitment to this industry in this country.
228
AdaptationVersus Standardization A crucial decision that must be made is whether to produce the same
products/services for international markets. If adaptation is not necessary, firms can
utilize excess capacity from their domestic operations. Some types of products do not
require adaptation for sale in international markets.
Magic markers for use on white boards in classrooms are one example. Levi
jeans are another example. Gillette’s blades and razors are a third example. In order to
determine whether a firm’s products/services need adaptation, it is important to obtain
customer input within the international market. One way to judge customer receptiveness
is to perform focus groups within the international markets the firm is considering
entering.
Focus groups are discussions of products/services and competition with
customers. A primary benefit of focus groups is that they can determine whether
adaptation of products/services will be required to meet the needs of each international
market. For example, Coke and Pepsi are beverages that require minor adaptation for
international markets. Within markets in South America, the formula for Coke and Pepsi
is sweeter than in the U.S. Adaptation becomes expensive; however, if products/services
do not meet market needs, they will not be consumed.
Focus groups can provide a current perspective of a country’s political/legal
environment. Understanding the crucial role the government plays with respect to
industries is quite important20
. For example, governments may impose import duties on
certain goods and services. These duties will tend to raise costs for the importing firm.
Governments may also control the type of advertising an international firm can employ.
For example, France and Italy have banned advertising for tobacco products21
.
The moderator of the focus group can have the participants enter into a discussion
concerning competition. The firm considering international entry obtains an unbiased
qualitative view as to the nature of competitors and their relative strengths and
weaknesses. Another benefit of conducting focus groups in international markets is that
firms can access the impact of the “Not Invented Here” (NIH) syndrome22
. Some
markets may not purchase products simply because they are manufactured in markets
other than those in which they are consumed. It is very difficult for international firms to
sell heavyweight motorcycles within the U.S. because Harley Davidson customers are
loyal. Firms have different modes in which to enter international markets.
Determination of International Modes of Entry International markets can be entered via (1) exporting, (2) licensing or
franchising, (3) strategic alliances, (4) acquisitions and/or (5) foreign direct investment.
Exporting will be discussed first.
Exporting
After a country has been identified as a viable international market, a firm must
determine the best mode of entering that specific market. The entry mode with the lowest
level of risk is normally exporting. The firm uses its excess domestic production capacity
to sell products/services in selected international markets. Because the firm is
manufacturing domestically, the international distribution network may have added costs.
For example, a U.S. firm that decides to enter China via exporting must develop a
network to move products from the U.S. to China.
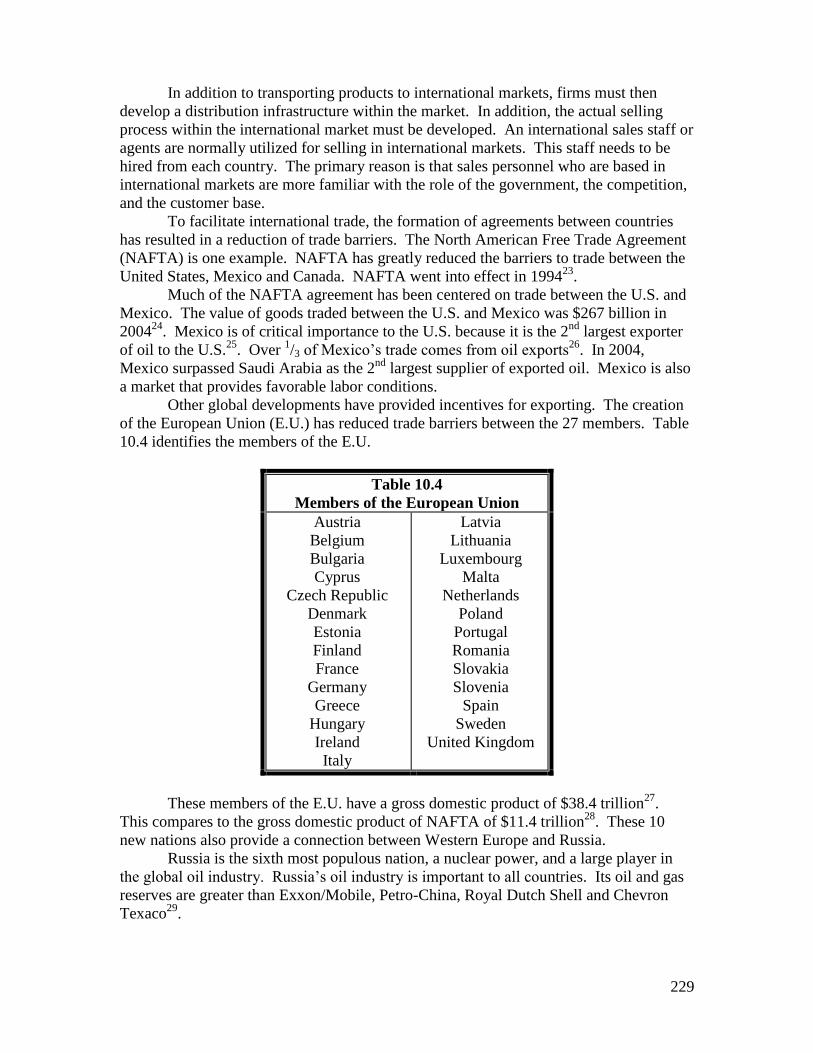
229
In addition to transporting products to international markets, firms must then
develop a distribution infrastructure within the market. In addition, the actual selling
process within the international market must be developed. An international sales staff or
agents are normally utilized for selling in international markets. This staff needs to be
hired from each country. The primary reason is that sales personnel who are based in
international markets are more familiar with the role of the government, the competition,
and the customer base.
To facilitate international trade, the formation of agreements between countries
has resulted in a reduction of trade barriers. The North American Free Trade Agreement
(NAFTA) is one example. NAFTA has greatly reduced the barriers to trade between the
United States, Mexico and Canada. NAFTA went into effect in 199423
.
Much of the NAFTA agreement has been centered on trade between the U.S. and
Mexico. The value of goods traded between the U.S. and Mexico was $267 billion in
200424
. Mexico is of critical importance to the U.S. because it is the 2nd
largest exporter
of oil to the U.S.25
. Over 1/3 of Mexico’s trade comes from oil exports
26. In 2004,
Mexico surpassed Saudi Arabia as the 2nd
largest supplier of exported oil. Mexico is also
a market that provides favorable labor conditions.
Other global developments have provided incentives for exporting. The creation
of the European Union (E.U.) has reduced trade barriers between the 27 members. Table
10.4 identifies the members of the E.U.
Table 10.4
Members of the European Union
Austria
Belgium
Bulgaria
Cyprus
Czech Republic
Denmark
Estonia
Finland
France
Germany
Greece
Hungary
Ireland
Italy
Latvia
Lithuania
Luxembourg
Malta
Netherlands
Poland
Portugal
Romania
Slovakia
Slovenia
Spain
Sweden
United Kingdom
These members of the E.U. have a gross domestic product of $38.4 trillion27
.
This compares to the gross domestic product of NAFTA of $11.4 trillion28
. These 10
new nations also provide a connection between Western Europe and Russia.
Russia is the sixth most populous nation, a nuclear power, and a large player in
the global oil industry. Russia’s oil industry is important to all countries. Its oil and gas
reserves are greater than Exxon/Mobile, Petro-China, Royal Dutch Shell and Chevron
Texaco29
.
230
Licensing/Franchising
Firms may also enter international markets by licensing. Licensing occurs when
one firm, the licensor, allows another firm, the licensee, to use its intellectual property to
generate sales. Intellectual property may include, but is not limited to, product R&D or
process technology, other types of technology, brand names and/or trademarks.
Licensees pay royalties to licensors. The licensor can gain access to international markets
with minimal investment. Licensing may allow the licensor to enter international
markets where acquisitions or direct foreign investment are not permitted by the
government. Licensing is not without risk because technology transfer can occur.
Research In Motion (RIM), the maker of Blackberry Wireless e-mail devices, has been
sued by NTP Inc. for unwanted technology transfer30
. RIM has agreed to pay $450
million to settle the dispute31
. Licensing is also important because of property rights.
Intellectual property rights have affected the international cell phone industry.
Nokia, a worldwide leader in cell phones, licenses the intellectual property of 3G
technologies at much lower rates than rivals such as LG Electronics32
. Because Nokia
holds many of the intellectual property rights, it holds a cost advantage over rivals. It is
possible that Nokia could sell 3G phones for as much as $30 less than rivals33
. One
reason Sony entered into a joint venture with Ericsson was to further develop intellectual
cell phone property rights. Licensing does not only involve intellectual property rights.
Products themselves can also be licensed.
Tate & Lyle PLC (London) has a licensing agreement with Johnson & Johnson to
market and distribute Splenda34
. Splenda is a zero calorie sweetener that tastes closer to
sugar than rival products. Coke, Pepsi, and Cadbury Schweppes have reformulated most
of their diet cola products with Splenda35
.
Franchising is a form of licensing in which a company (the franchiser) grants a
franchisee the right to market its products/services within an international market. The
difference between licensing and franchising concerns operations within the international
market. The franchisee agrees to conduct business in accordance with the franchiser’s
standard of operation.
Fast food chains utilize a great deal of franchising to develop positions within
international markets. In 2005, McDonald’s had franchises in 119 countries36
. Yum
Brands, which consists of KFC, Taco Bell, Pizza Hut, A&W Root Beer, and Long John
Silvers, has over 13,000 franchises worldwide37
. While franchising has resulted in
significant growth for fast food and hotel chains (e.g. Holiday Inn, Marriott), there are
significant risks. To prevent opportunistic behavior on the part of the franchisee, the
franchiser needs to control the point of differentiation. Otherwise, the franchisee may
become a direct competitor of the franchiser. For example, Coke has expanded
internationally via franchising. To maintain control of its many franchising firms, Coke
exports the syrup. As such, this action prevents the franchisee from becoming a direct
competitor. The role of government can also create risks for franchisers.
When Venezuelan President Hugo Chavez changed monetary policies, franchisers
were not able to collect royalties38
. Such political risk can create an unfavorable position
for franchisers. To assist firms in deciding where to enter into franchising agreements,
consulting firms have developed factors that are crucial for franchising success. Factors
such as market size, ease of entry and government corruption are measured on a country-
by-country basis. Countries that provide the best franchising opportunities are fully
developed markets such as the United States, Great Britain, Australia, and Germany39
.
Developing countries such as Malaysia, Poland, India, Russia, and Indonesia provide less
231
favorable conditions for franchising opportunities40
. Strategic alliances are another mode
of international entry.
Strategic Alliances
Strategic alliances are partnerships between firms that pool assets to achieve
competitive advantage. Strategic alliances can be categorized as either scale or link
alliances. Scale alliances allow partners to more fully utilize the excess capacity of their
resource base41
. The 3 major global airline alliances, Star, OneWorld , and Skyteam,
allow partners to utilize the aircraft of other partners to increase global coverage and
reduce costs.
Link alliances consist of firms that contribute different resources42
. Samsung has
an alliance with Deutsche Telekom AG to collaborate on mobile digital broadcasting43
.
Samsung will provide terrestrial mobile digital broadcasting in return for Deutsche
Telekom AG’s assistance in gaining access to the German market44
. Link alliances have
been referred to as “Trojan horses” 45
. Since firms are contributing different resources,
the possibility of technology transfer also exists.
In some cases, both firms jointly working on new technology can minimize
technology transfer. Boeing and Lockheed Martin are jointly working on a project with
the U.S. government to develop new rocket technology46
. This $4 billion project is to
develop lower cost rocket launchers for launching military and surveillance aircraft.
General Motors and Toyota have an alliance to develop technology that will lead to
gasoline-electric hybrid cars47
. This technology will benefit both auto manufacturers.
Siemens entered into a strategic alliance with the Russian rail monopoly, Russian
Railways, to build trains for Russia48
. Siemens provides the technology for building the
high-speed trains and Russian Railways provides the infrastructure. In this case, while
the technology for building high-speed trains may be transferred to Russian Railways, the
risks are not significant because Russian Railways controls all of the rail business in
Russia49
. In addition, Russian Railways has no interest in expanding beyond Russia.
Strategic alliances do have a down side. Firms that engage in alliances may
withdrawal from these partnerships. If firms withdraw, partners won’t have access to
some international markets. For example, if United Airlines goes out of business, its
partners in the Star global airline alliance will not have access to United’s extensive U.S.
based operating network. Currently, United Airlines (which acquired Continental
Airlines in 2010) is the second largest passenger airline (American Airlines is first) in the
world50
.
Acquisitions
Acquisitions are a mode of international entry by which the acquiring firm buys
all or a controlling interest in a target firm. These are referred to as cross border
acquisitions. In some cases, acquisitions may result in redundant assets. When Air
France acquired KLM, Air France obtained KLM’s fleet; Air France did not need all of
KLM’s aircraft51
. When DHL acquired Airborne in 2003, DHL did not need all of
Airborne’s operating facilities. Acquisitions do allow firms access to new markets and
may create financial incentives.
General Electric’s acquisition of Bombardier’s (Canada) sports and recreational
vehicle finance division allowed G.E. to expand its commercial finance division52
. For
Bombardier, the acquisition calls for G.E. to assume $1 billion in debt and provides $3.35
232
billion for Bombardier to pay short-term debt and provide financing for new airplane
ventures53
. Acquisitions can also provide firms with access to high growth markets.
The South American beer industry has attracted several international firms.
Interbrew’s (Belgium) acquisition of AmBev (Brazil) gives Interbrew access to most
South American markets. South African Brewers $6 billion acquisition of Colombian
Brewer GrupoEmpresarial provides similar access for South African Brewers.
With an international acquisition the acquiring firm has access to all of the
target’s resources. Most important are knowledge-based resources with respect to
competition, government relations, raw materials, distributors, financial resources, and
customers within international markets.
Acquisitions also have downsides. For example, international government
regulations may not permit firms from establishing a position within their markets via
acquisition. For example, the Russian oil and power industries are totally controlled by
the Russian government. Only Russian firms have significant market shares54
. The top 6
producers are all Russian firms: Lukiol, Rosneft, TNK, Surutneftegnz, Sibmept, and
Yokos.
Foreign Direct Investment
Foreign direct investment (F.D.I.) is an entry strategy in which a firm establishes
a position within a country without partners. Foreign direct investment may be a
necessary strategy to compete effectively within some international markets. Foreign
direct investment eliminates product entry costs that may be imposed by international
governments.
Foreign direct investment can lead to higher levels of employment within
international markets. Many U.S. based firms are outsourcing management information
system jobs to India. Pharmaceutical firms are outsourcing some aspects of R&D
operations to China55
. Due to the extensive outsourcing by firms into China, Chinese
ports are very congested. With trade between China and the U.S. expected to double by
2020, the U.S. may assist in building new Chinese ports to support the increased trade.
In addition, manufacturing firms are outsourcing many assembly operations to
Mexico. As outsourcing employment presents opportunities within international markets,
the foreign country’s economy may improve. The downside is that many thousands of
U.S. jobs, formerly performed within the U.S., are lost each year. On the other hand,
firms that utilize foreign direct investment into the United States create employment
opportunities for U.S. citizens. Foreign direct investment is a mode of entry that contains
significant risk.
Firms that utilize foreign direct investment may be affected by very volatile
economic conditions within many markets. Foreign direct investment is effected by
political and international government policy. The Gulf Wars have created uncertainty
with respect to investing in Middle Eastern markets. South American markets are also
volatile. In 1994, the Mexican peso was devalued. In 1999, the Brazil real was devalued.
In 2001, Argentina was struck by a financial crisis. In 2005, both Mexico and Brazil
were experiencing high inflation.
233
Competition within International Markets Intensifies As firms invest within international markets, a more competitive international
environment is created. The industry life cycle and international life cycle literature
explains that as a competitive environment becomes more saturated, firms begin to focus
upon price as opposed to differentiation. This focus implies that the lowest cost provider
will have an advantage. As firms compete on price, profit margins tend to be reduced.
Costs saving measures such as increasing scale, implementing TQM initiatives, and/or
increasing automation are all processes that are available to all competitors who have
funds to invest. These approaches will tend to create highly efficient firms. As
competition on price intensifies, firms will need to determine additional ways of reducing
costs.
Relocate to Low Cost Markets Firms, to reduce costs further, may need to move production to less developed
countries. While the variable costs (e.g. labor) are significantly less in developing
countries, firms may still need to invest in plant and equipment. In addition, firms must
develop inbound logistic networks to provide an infrastructure for raw materials to reach
the new plant. Firms will also need to develop outbound logistics to coordinate
movement of products to consumers in a timely matter. In the long run, this network may
provide for overall lower costs. However, the fixed costs and distribution infrastructure
that must be developed are expensive. Also, if unions represent your employees, the
transition to a developing country for manufacturing and distribution activities may not
be easily implemented.
If firms successfully produce in low cost markets, the economy may grow to the
point where customers in the low cost market may have obtained sufficient buying power
to consume your products/services. As low cost markets become more developed, the
infrastructure will tend to become more extensive. With improvements in distribution,
firms may learn to develop distribution infrastructures in additional global markets
quicker and cheaper.
New Innovation in Home Markets The international life cycle starts with innovation in the firm’s home market and
ends with firms producing in low cost markets. Firms begin with products/services that
are differentiated and end trying to obtain a cost advantage. To facilitate further growth,
the firm will need to develop a new innovation in its domestic market that may result in a
second international life cycle.
If firms do establish international positions, they may more fully leverage their
assets to generate returns from countries that are at different stages of the international
life cycle. This relationship between stages of industry evolution and the international
life cycle is illustrated in Table 10.5.
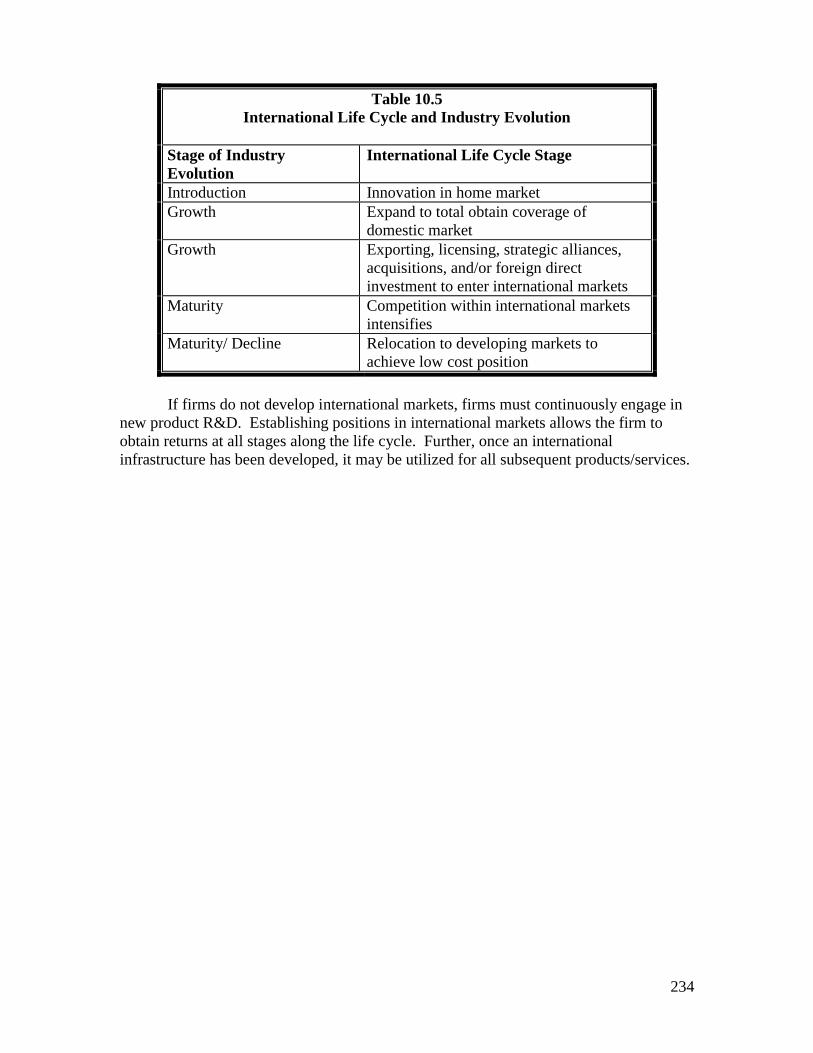
234
Table 10.5
International Life Cycle and Industry Evolution
Stage of Industry
Evolution
International Life Cycle Stage
Introduction Innovation in home market
Growth Expand to total obtain coverage of
domestic market
Growth Exporting, licensing, strategic alliances,
acquisitions, and/or foreign direct
investment to enter international markets
Maturity Competition within international markets
intensifies
Maturity/ Decline Relocation to developing markets to
achieve low cost position
If firms do not develop international markets, firms must continuously engage in
new product R&D. Establishing positions in international markets allows the firm to
obtain returns at all stages along the life cycle. Further, once an international
infrastructure has been developed, it may be utilized for all subsequent products/services.
235
Discussion Questions
1. Explain why international expansion is necessary.
2. What factors encourage international expansion?
3. Explain the difference between regulated and deregulated industries.
4. Discuss Porter’s determinates of international country attractiveness.
5. Explain the modes of international entry.
6. Explain the risks with respect to foreign direct investment (FDI).
7. Explain what happens when a firm does not expand into international markets.
8. Explain the role of government with respect to Porter’s determinants of
international country attractiveness.
9. What will be the most popular outsourcing locations in 2011?
236
References
1. Cateora, P. and Graham, J. 1999. International marketing. Boston, MA. McGraw-Hill
Irwin.
2. Czinkota, M. and Ronkainen, I. 2004. International marketing. Mason, Ohio:
Southwestern.
3. Penrose, E. 1959. A theory of the growth of the firm. New York: John Wiley & Sons.
4. Wernerfelt, B. 1984. A resource-based view of the firm. Strategic
ManagementJournal. 5: 171-180.
5. _____. 2005. Stake in large Chinese brewer increases to 27 percent. Wall Street
Journal.
6. Ibid
7. Ibid
8. Larkin, J. 2005.Growth revolutionizes Indian air travel. Wall Street Journal. March 7.
9. Ibid
10. Mahon, J. and Murray, E. 1981. Strategic planning for regulated companies. Strategic
Management Journal. 2: 251-262.
11. Wernerfelt. A resource-based view of the firm.
12. Ibid
13. Porter, M. 1990. The competitive advantage of nations. New York, NY. The Free
Press.
14. Ibid
15. Ibid
16. Ibid
17. Ibid
18. Jain, S. 2004. Marketing: planning and strategy. Mason, OH. Thompson Custom
Publishing.
19. Ankli, Robert E. 1992. Michael Porter’s competitive advantage and business history.
Business and economic history, Second Series. Volume 21. William J. Hausman,
Editor Williamsburg, VA. Business History Conference Publisher
237
20. Cateora and Graham. International marketing.
21. Ibid
22. Ibid
23. Ibid
24. ____________. 2005. Mexican heritage celebration. New York Times. May 5.
25. Luhnow, D. 2005. Pemex chief says Mexican oil patch needs investors. Wall Street
Journal. May 6.
26. Ibid
27. Miller, S., Grow, B., and Bilefsky, S. 2004. European Union gets ready to grow. Wall
Street Journal. March 15.
28. Ibid
29. White, G. 2004. Latest move seals Gazprom’s role as energy giant. Wall Street
Journal. December 24.
30. Heinzl, M. 2005. Blackberry maker asks court to enforce patent settlement. Wall
Street Journal. June 15.
31. Ibid
32. Pringle, D. 2005. Dial time: hidden assets could let Nokia capitalize on boom for 3G
phones. Wall Street Journal. March 10.
33. Ibid
34. Rashidi, E. and Ball, D. 2005. Tate & Lyle is in a sticky spot. Wall Street Journal.
March 19.
35. Ibid
36. ____________. 2005. McDonald’s at 50. New York Times. April 15.
37. Kilman, S. and Gray, S. 2005. Fast food seeks influence in WTO. Wall Street
Journal. April 19.
38. Bennett, J. 2005. A franchiser’s path to international success is often paved with
pitfalls. Wall Street Journal. April 7.
39. Ibid
238
40. Ibid
41. Dussauge, P., Garrette, B., and Mitchell, W. 2004. Asymmetric performance: the
market share impact of scale and link alliances in the global auto industry. Strategic
Management Journal. 25: 701-711.
42. Dussauge, Garrette, and Mitchell. 2000. Learning from competing partners:
outcomes and duration of scale and link alliances in Europe, North America, and
Asia. Strategic Management Journal. 21: 99-126
43. _____. 2005. Samsung Electronics. Wall Street Journal. April 11.
44. Ibid
45. Dussauge, Garrette, and Mitchell. Asymmetric performance: the market share impact
of scale and link alliances in the global auto industry.
46. Pasztor, A., Karp, J., and Lunsford, J. 2005. Lockheed Martin, Boeing to form rocket
venture. Wall Street Journal. May 3.
47. Shirouzu, N. and Sapsford, J. 2005. GM, Toyota weighs a bid to share hybrid
expertise. Wall Street Journal. May 9.
48. White, G. and Chazan, G. 2005. BP Russia venture faces more taxes. Wall Street
Journal. April 11.
49. Ibid
50. __________. 2005. Boeing 2010 passenger aircraft forecast. Boeing. Seattle, WA.
51. Keller, G. 2004. Air France acquires KLM. Wall Street Journal. September 1.
52. Kranhold, K. 2005. G.E. to purchase Bombardier arm for $1.4 billion. Wall Street
Journal. May 3.
53. Ibid
54. White, G. and Singer, J. 2005. Gazprom, Rosneft each seek Sibneft. Wall Street
Journal. May 26.
55. Santini, L. 2004. Drug companies look at China for cheap R&D. Wall Street
Journal. November 24.
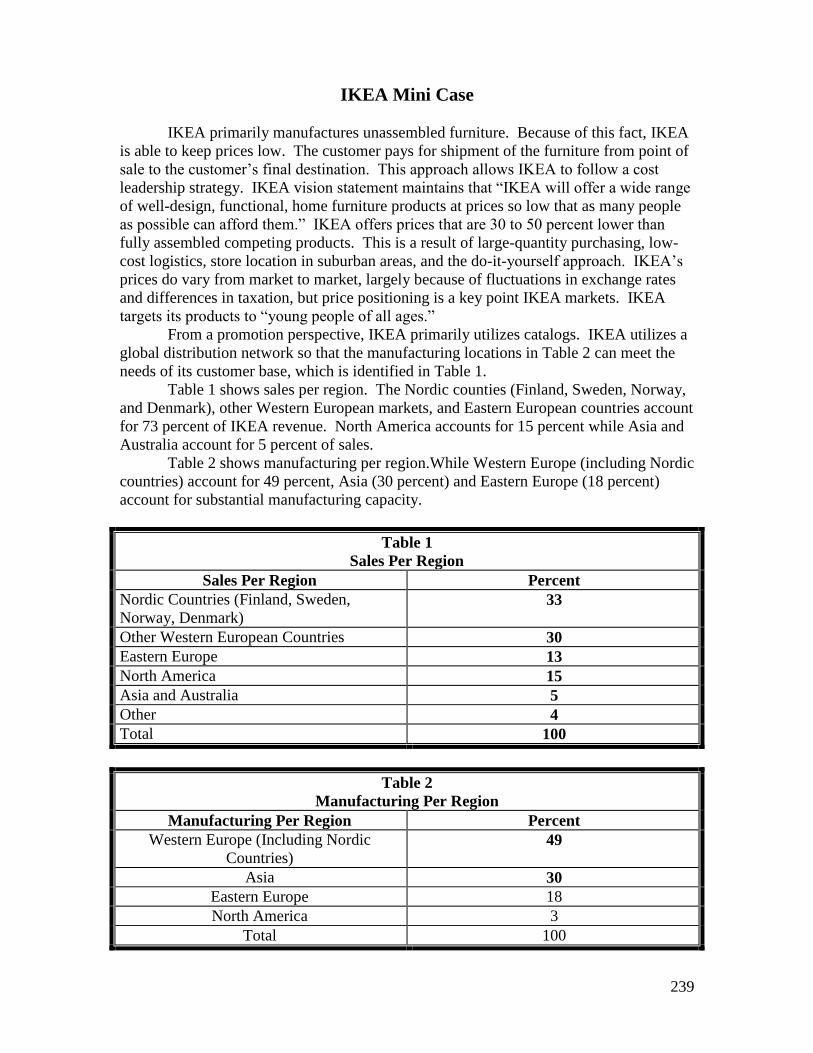
239
IKEA Mini Case
IKEA primarily manufactures unassembled furniture. Because of this fact, IKEA
is able to keep prices low. The customer pays for shipment of the furniture from point of
sale to the customer’s final destination. This approach allows IKEA to follow a cost
leadership strategy. IKEA vision statement maintains that “IKEA will offer a wide range
of well-design, functional, home furniture products at prices so low that as many people
as possible can afford them.” IKEA offers prices that are 30 to 50 percent lower than
fully assembled competing products. This is a result of large-quantity purchasing, low-
cost logistics, store location in suburban areas, and the do-it-yourself approach. IKEA’s
prices do vary from market to market, largely because of fluctuations in exchange rates
and differences in taxation, but price positioning is a key point IKEA markets. IKEA
targets its products to “young people of all ages.”
From a promotion perspective, IKEA primarily utilizes catalogs. IKEA utilizes a
global distribution network so that the manufacturing locations in Table 2 can meet the
needs of its customer base, which is identified in Table 1.
Table 1 shows sales per region. The Nordic counties (Finland, Sweden, Norway,
and Denmark), other Western European markets, and Eastern European countries account
for 73 percent of IKEA revenue. North America accounts for 15 percent while Asia and
Australia account for 5 percent of sales.
Table 2 shows manufacturing per region.While Western Europe (including Nordic
countries) account for 49 percent, Asia (30 percent) and Eastern Europe (18 percent)
account for substantial manufacturing capacity.
Table 1
Sales Per Region
Sales Per Region Percent
Nordic Countries (Finland, Sweden,
Norway, Denmark) 33
Other Western European Countries 30
Eastern Europe 13
North America 15
Asia and Australia 5
Other 4
Total 100
Table 2
Manufacturing Per Region
Manufacturing Per Region Percent
Western Europe (Including Nordic
Countries) 49
Asia 30
Eastern Europe 18
North America 3
Total 100

240
Discussion Questions
1. How and where should IKEA expand in the future?
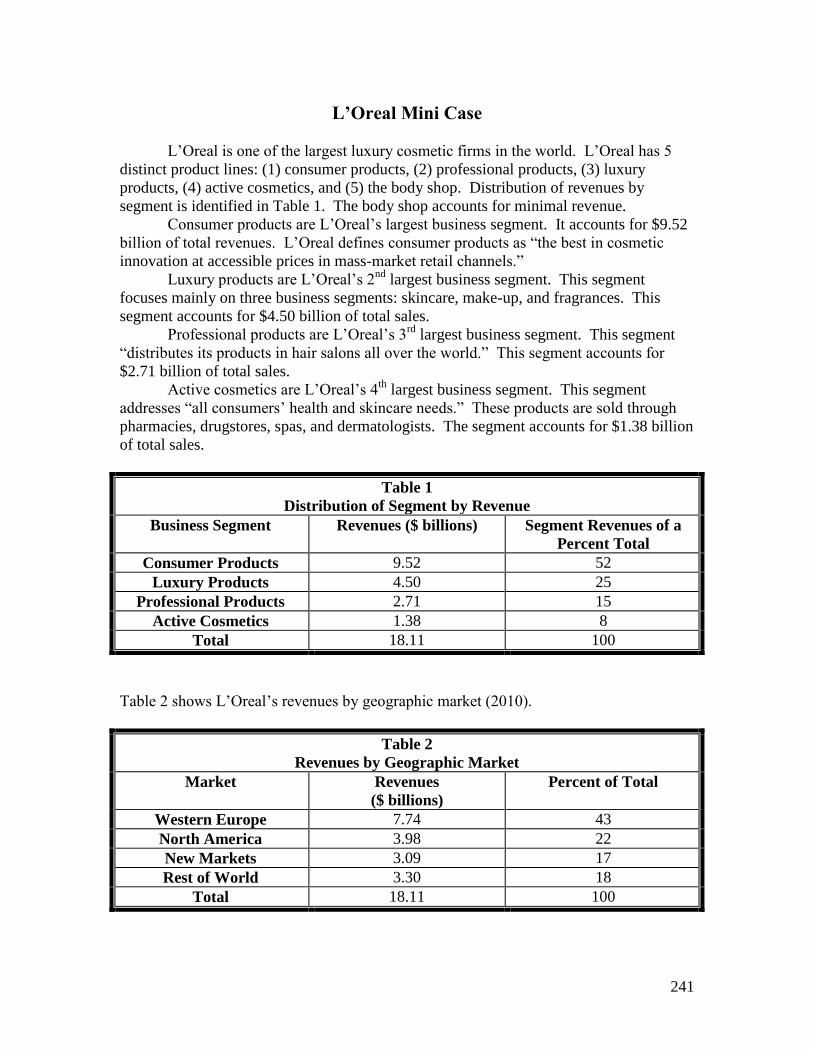
241
L’Oreal Mini Case
L’Oreal is one of the largest luxury cosmetic firms in the world. L’Oreal has 5
distinct product lines: (1) consumer products, (2) professional products, (3) luxury
products, (4) active cosmetics, and (5) the body shop. Distribution of revenues by
segment is identified in Table 1. The body shop accounts for minimal revenue.
Consumer products are L’Oreal’s largest business segment. It accounts for $9.52
billion of total revenues. L’Oreal defines consumer products as “the best in cosmetic
innovation at accessible prices in mass-market retail channels.”
Luxury products are L’Oreal’s 2nd
largest business segment. This segment
focuses mainly on three business segments: skincare, make-up, and fragrances. This
segment accounts for $4.50 billion of total sales.
Professional products are L’Oreal’s 3rd
largest business segment. This segment
“distributes its products in hair salons all over the world.” This segment accounts for
$2.71 billion of total sales.
Active cosmetics are L’Oreal’s 4th
largest business segment. This segment
addresses “all consumers’ health and skincare needs.” These products are sold through
pharmacies, drugstores, spas, and dermatologists. The segment accounts for $1.38 billion
of total sales.
Table 1
Distribution of Segment by Revenue
Business Segment Revenues ($ billions) Segment Revenues of a
Percent Total
Consumer Products 9.52 52
Luxury Products 4.50 25
Professional Products 2.71 15
Active Cosmetics 1.38 8
Total 18.11 100
Table 2 shows L’Oreal’s revenues by geographic market (2010).
Table 2
Revenues by Geographic Market
Market Revenues
($ billions)
Percent of Total
Western Europe 7.74 43
North America 3.98 22
New Markets 3.09 17
Rest of World 3.30 18
Total 18.11 100
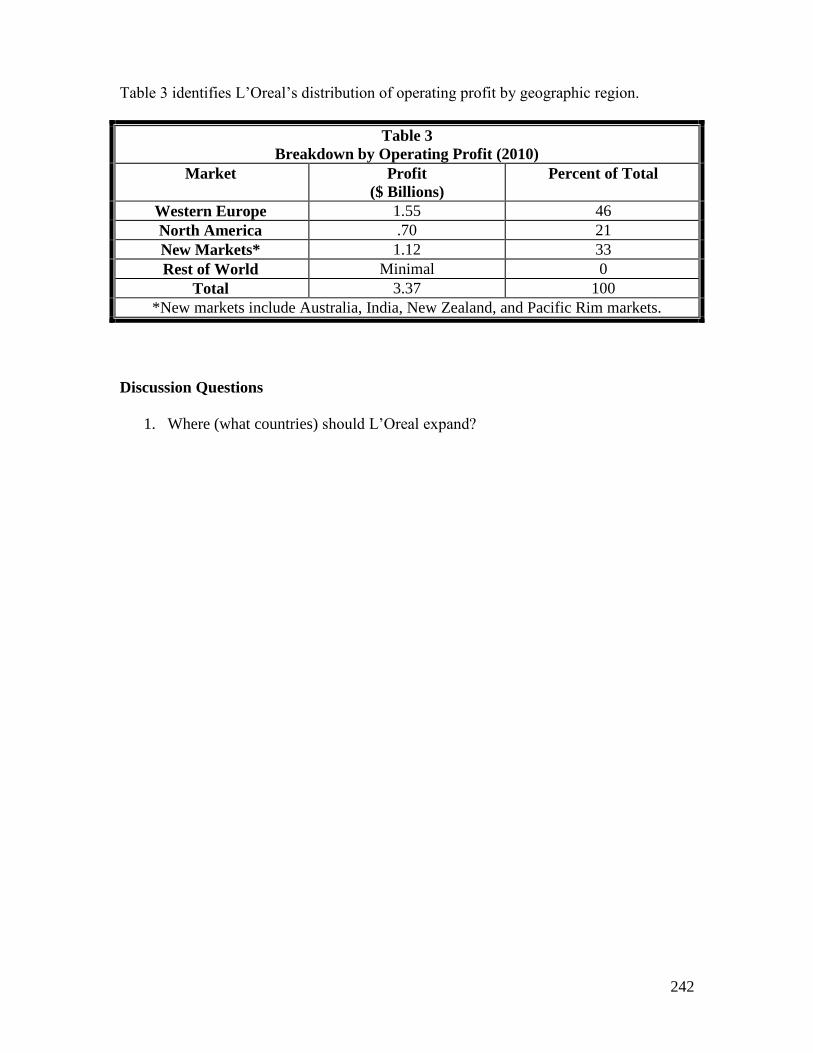
242
Table 3 identifies L’Oreal’s distribution of operating profit by geographic region.
Table 3
Breakdown by Operating Profit (2010)
Market Profit
($ Billions)
Percent of Total
Western Europe 1.55 46
North America .70 21
New Markets* 1.12 33
Rest of World Minimal 0
Total 3.37 100
*New markets include Australia, India, New Zealand, and Pacific Rim markets.
Discussion Questions
1. Where (what countries) should L’Oreal expand?
243
Harvard Business Cases for Chapter 10
Worldcom Inc.: What Went Wrong?
Product Number 905M43
Re-Thinking Think: The Electronic Car Company
Product Number 810105
Professor Case for Chapter 10
McDonalds

244

245
Chapter 11
Strategic Leadership Decision Making
246
Learning and Assessment Goals
1. Determine how strategic leaders make decisions which meet the needs of the
firm’s various stakeholders.
2. Determine how strategic leaders make decisions at both corporate and business
levels.
3. Determine how strategic leaders make decisions over time within multiple
industries.
4. Understand how strategic leaders evaluate competition.
5. Understand what strategic leadership decisions need to be made in difference
stages of an industry’s life cycle.
6. Determine why some strategic leaders have made or not made ethical decisions
247
“Apple has lost a visionary and creative genius, and the world has lost an
amazing human being. Those of us who have been fortunate enough to know and work
with Steve have lost a dear friend and an inspiring mentor. Steve leaves behind a
company that only he could have built, and his spirit will forever be the foundation of
Apple”.(Apple News Release 2011)
Strategy has been defined as the ability to gain and sustain competitive
advantage1. In essence, firms must be able to identify trends within the environment and
develop resources and capabilities to capitalize on these trends to increase shareholder
wealth. Leadership has been defined as the process of transforming organizations from
what they are to what the leader would have them become2. Therefore, strategic
leadership is the ability to transform organizations to meet the needs of various
stakeholders over time.
Strategic Leadership Strategic leadership encompasses a number of attributes: developing human
capital, exploiting and maintaining core competencies, sustaining an effective
organizational culture, emphasizing ethical practices, and establishing balanced
organizational controls3. Each of these elements will be briefly discussed. Developing
human capital is, by far, the most important.
In the long run, the growth of any firm is based upon the quality of human
capital4. Human capital may be the source of competitive advantage now and in the
future because it is non-substitutable. In addition, human capital drives the development
of all other attributes listed above. Therefore, human capital allows the firm to gain
competitive advantage5. The development of human capital at all levels of management
allows the firm to sustain competitive advantage. Fred Smith, founder of Fed Ex,
believes that people are more important than products or services. He believes that if you
hire, train, and retain good people they provide superior service. By providing superior
service, the firm will be able to sustain continued profitability. Exploiting and
maintaining core capabilities is a second attribute which is crucial for strategic leadership
to be effective.
Core competencies are the resources and capabilities that give a firm a
competitive advantage over its rivals. In the 21st century, an ability to develop and
exploit core competencies will be linked even more positively and significantly with the
firm’s success. Only the combinations of a firm’s resources and capabilities that are
valuable, rare, costly to imitate, and for which there are no equivalent strategic substitutes
can be rightly identified as core competencies.6 The relatively unstable market conditions
resulting from innovations, diversity of competitors, and array of revolutionary
technological changes occurring in the new competitive landscape have caused core
competencies rather than served markets to become “the basis upon which firms establish
their long-term strategies.”7
As firms continue to globalize, developing core competencies becomes even more
important. Once a firm has achieved advantage within its domestic markets, it can enter
international markets from a position of strength.8A firm that can build competencies to
profitably develop domestic markets and exploit international markets will have multiple
sources of advantage over competitors which may be unable to achieve this expansion.
An excellent way of obtaining and sustaining an effective organizational culture is
to provide incentives (stock and/or money) based upon the financial success of the firm
248
on a year-to-year basis. This simple principle has led UPS to be one of the largest firms
in the world. Caterpillar and Archer Daniels Midland (ADM) are also examples of firms
which reward senior managers based upon the profitability of the firm. Both of these
firms have been experiencing record growth and profit.
Providing an environment that supports ethical practices is another aspect of
effective strategic leadership.9 Strategic leader’s commitment to serve stakeholders’
claims will contribute to the establishment and continuation of an ethical organizational
culture. This condition applies both to domestic and international markets which a firm
services. This is one reason the Sarbanes-Oxley Act (SOX) of 2002 was created. This
act was implemented in 2002 with the effects coming into play in 2003 and 2004. The
Sarbanes-Oxley Act, “Introduced a new era of corporate governance, including
requirements for auditor independence, the restriction of firms engaging in accounting
from both auditing and consulting services, independence of firms board committees,
management assessment of internal controls and personal certification of financial reports
by CEO’s and CFO’s.10
These are important reasons why establishing and maintaining
ethical practices are important. Unethical practices take away both managerial time and
resources which should have been allocated to running a successful firm to maximize
shareholder wealth. Because firms are global in nature, establishing balanced
organizational controls is a crucial aspect of effective strategic leadership.11
Defined as the “formal, information-based…procedures used by managers to
maintain or alter patterns in organizational activities,” controls help strategic leaders
build credibility, demonstrate the value of strategies to the firm’s stakeholders, and
promote and support strategic change.12
Controls provide the parameters within which
strategies are to be implemented, as well as corrective actions to be taken.13
Strategic leadership’s impact upon both corporate and business level strategy will
now be discussed. The chief executive officer (CEO) and the senior management team
normally have strategic leadership responsibilities within firms. The stakeholders of
strategic leaders are illustrated in Figure 11.1.
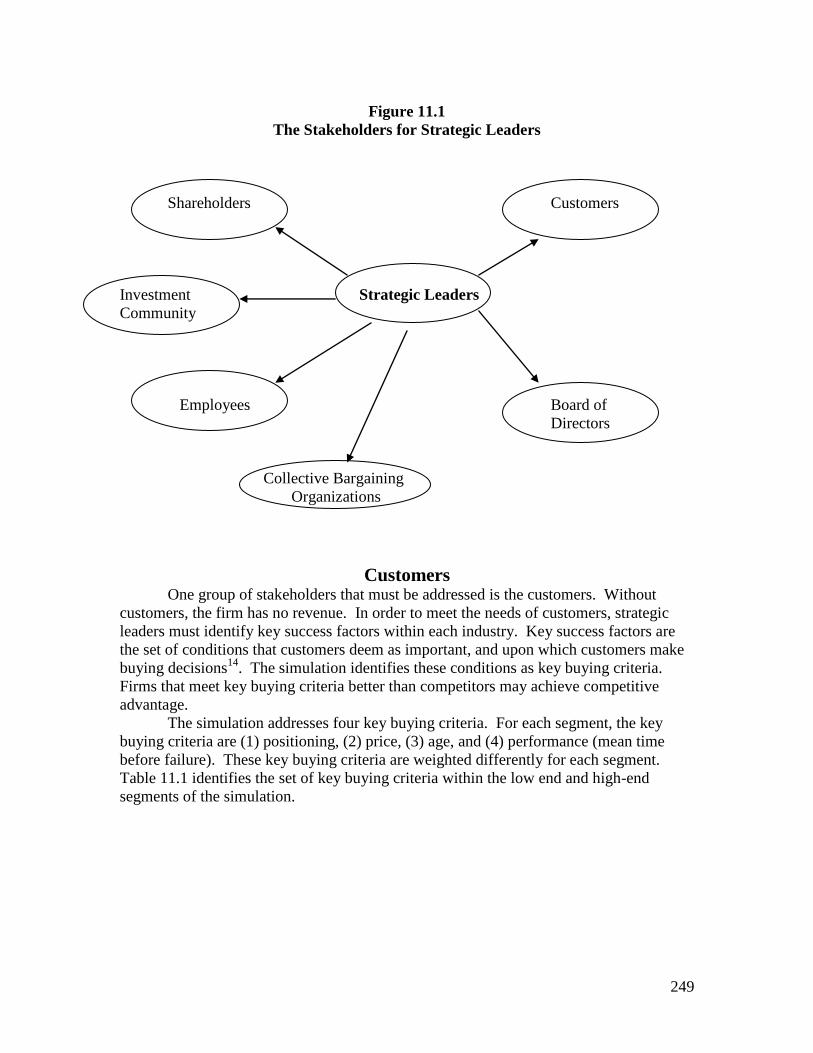
249
Figure 11.1
The Stakeholders for Strategic Leaders
Shareholders Customers
Investment Strategic Leaders
Community
Employees Board of
Directors
Collective Bargaining
Organizations
Customers One group of stakeholders that must be addressed is the customers. Without
customers, the firm has no revenue. In order to meet the needs of customers, strategic
leaders must identify key success factors within each industry. Key success factors are
the set of conditions that customers deem as important, and upon which customers make
buying decisions14
. The simulation identifies these conditions as key buying criteria.
Firms that meet key buying criteria better than competitors may achieve competitive
advantage.
The simulation addresses four key buying criteria. For each segment, the key
buying criteria are (1) positioning, (2) price, (3) age, and (4) performance (mean time
before failure). These key buying criteria are weighted differently for each segment.
Table 11.1 identifies the set of key buying criteria within the low end and high-end
segments of the simulation.
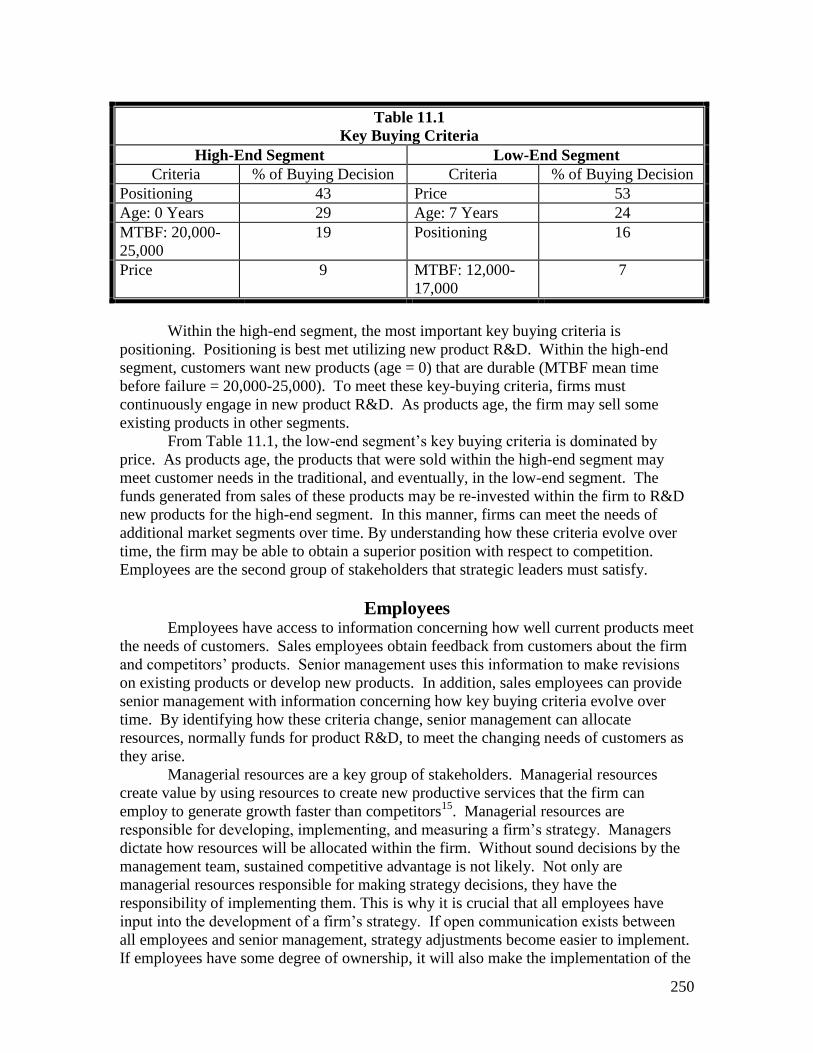
250
Table 11.1
Key Buying Criteria
High-End Segment Low-End Segment
Criteria % of Buying Decision Criteria % of Buying Decision
Positioning 43 Price 53
Age: 0 Years 29 Age: 7 Years 24
MTBF: 20,000-
25,000
19 Positioning 16
Price 9 MTBF: 12,000-
17,000
7
Within the high-end segment, the most important key buying criteria is
positioning. Positioning is best met utilizing new product R&D. Within the high-end
segment, customers want new products (age = 0) that are durable (MTBF mean time
before failure = 20,000-25,000). To meet these key-buying criteria, firms must
continuously engage in new product R&D. As products age, the firm may sell some
existing products in other segments.
From Table 11.1, the low-end segment’s key buying criteria is dominated by
price. As products age, the products that were sold within the high-end segment may
meet customer needs in the traditional, and eventually, in the low-end segment. The
funds generated from sales of these products may be re-invested within the firm to R&D
new products for the high-end segment. In this manner, firms can meet the needs of
additional market segments over time. By understanding how these criteria evolve over
time, the firm may be able to obtain a superior position with respect to competition.
Employees are the second group of stakeholders that strategic leaders must satisfy.
Employees Employees have access to information concerning how well current products meet
the needs of customers. Sales employees obtain feedback from customers about the firm
and competitors’ products. Senior management uses this information to make revisions
on existing products or develop new products. In addition, sales employees can provide
senior management with information concerning how key buying criteria evolve over
time. By identifying how these criteria change, senior management can allocate
resources, normally funds for product R&D, to meet the changing needs of customers as
they arise.
Managerial resources are a key group of stakeholders. Managerial resources
create value by using resources to create new productive services that the firm can
employ to generate growth faster than competitors15
. Managerial resources are
responsible for developing, implementing, and measuring a firm’s strategy. Managers
dictate how resources will be allocated within the firm. Without sound decisions by the
management team, sustained competitive advantage is not likely. Not only are
managerial resources responsible for making strategy decisions, they have the
responsibility of implementing them. This is why it is crucial that all employees have
input into the development of a firm’s strategy. If open communication exists between
all employees and senior management, strategy adjustments become easier to implement.
If employees have some degree of ownership, it will also make the implementation of the
251
strategy easier. The implemented strategy, not the designed strategy, is what determines
competitive advantage.
Because of these responsibilities, strategic leaders must accomplish two primary
objectives: (1) maximize quarterly firm performance and (2) maximize long-run
shareholder value. The second objective must be the result of a well thought out and
properly implemented strategic plan.
Because strategic leadership involves transforming organizations, significant
expenses may need to be incurred. Some of the expenses are related to product and/or
process R&D, implementation of TQM initiatives, investments in promotion and
infrastructure, and development of domestic and global markets. As John Skelly, former
CEO of Apple, stated: “The best way to compete in the future is to create it”.
Managerial resources create growth potential for the firm. As multi-national
firms expand, the importance of understanding and competing in international markets
becomes important. One reason why Paul Mullehom, former president of Archer,
Daniels, Midland, obtained his job was because of his international experience.
Knowledge of international markets allows firms to re-deploy resources to obtain
maximum returns. As discussed in Chapter 10, International Strategies, international
markets represent significant growth potential. In addition, the development of
international markets may reduce spending needed on new product R&D. The firm may
not need to be continuously focused on innovations in domestic markets. International
markets allow for expansion of existing or adapted products. International expansion
allows firms to grow within the firm’s core business. If the management team does not
have international experience, the firm may soon be reacting to international competitors
as opposed to leading change. The U.S. auto industry is an example of firms that have
engaged in a reactive strategy. Effective strategic leadership identifies not only where the
firm needs to grow but also how and when this growth can occur.
Collective Bargaining Organizations If employees are members of collective bargaining organizations, these
organizations may moderate what actions a firm can take. Labor unions may reduce a
firm’s flexibility.
Firms with strong collective bargaining units may have less flexibility to
participate in outsourcing programs. Faced with rapid global expansion, leaders of the
world’s top unions are forming cross-border alliances to share strategies for contract
negotiations and to develop international safety and workers-rights standards16
. These
moves could make collective bargaining stronger. This focus on global labor unions
comes at a time when union membership, as a percentage of the total work force, has
been declining in the U.S., most of Western Europe, and Australia.
Shareholders Leadership decisions can lead to “destruction” for shareholders. One only needs
to pick up the paper. Corruption and greed have occurred with alarming regularity
among CEOs entrusted with strategic leadership responsibilities. Enron, WorldCom,
Arthur Andersen, Tyco, and AIG all had CEOs who attempted to utilize their leadership
positions for personal gain at the expense of shareholders. One of the reasons why these
CEOs engaged in opportunistic behavior is because of risk. One type of risk that has
different consequences for shareholders and CEOs (including senior management)
concerns acquisitions. Figure 11.2 illustrates these different risk profiles.
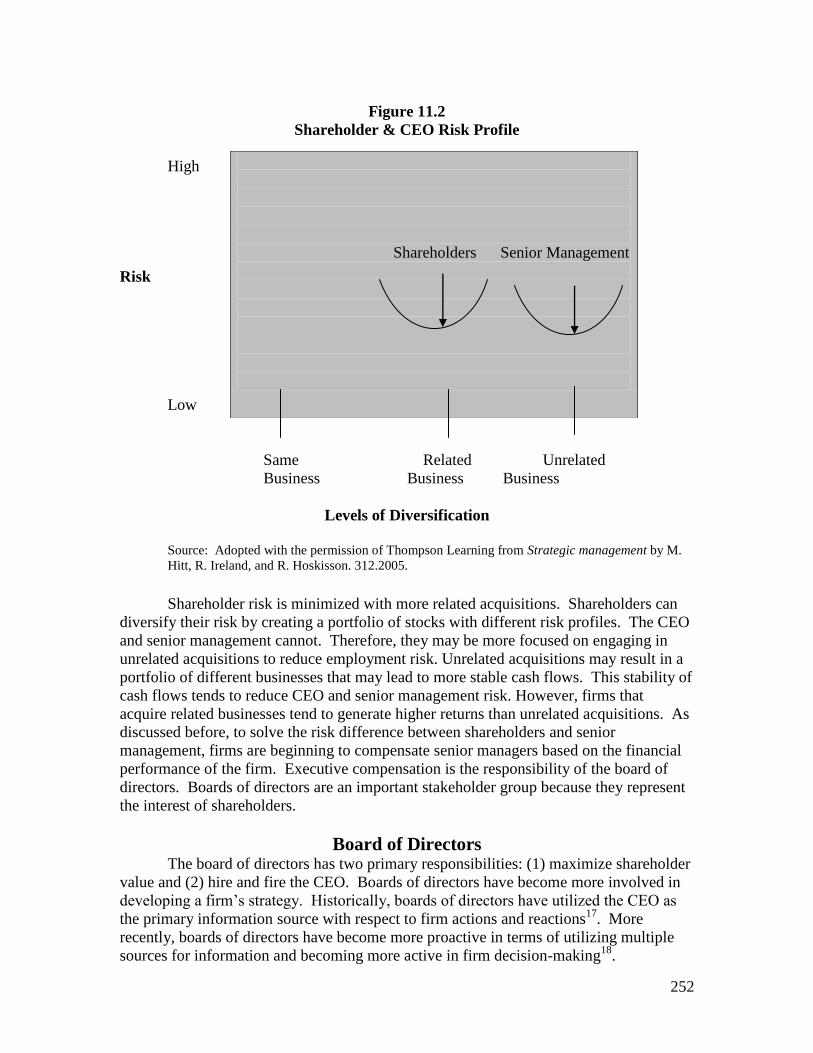
252
Figure 11.2
Shareholder & CEO Risk Profile
High
Risk
Low
Same Related Unrelated
Business Business Business
Levels of Diversification
Source: Adopted with the permission of Thompson Learning from Strategic management by M.
Hitt, R. Ireland, and R. Hoskisson. 312.2005.
Shareholder risk is minimized with more related acquisitions. Shareholders can
diversify their risk by creating a portfolio of stocks with different risk profiles. The CEO
and senior management cannot. Therefore, they may be more focused on engaging in
unrelated acquisitions to reduce employment risk. Unrelated acquisitions may result in a
portfolio of different businesses that may lead to more stable cash flows. This stability of
cash flows tends to reduce CEO and senior management risk. However, firms that
acquire related businesses tend to generate higher returns than unrelated acquisitions. As
discussed before, to solve the risk difference between shareholders and senior
management, firms are beginning to compensate senior managers based on the financial
performance of the firm. Executive compensation is the responsibility of the board of
directors. Boards of directors are an important stakeholder group because they represent
the interest of shareholders.
Board of Directors The board of directors has two primary responsibilities: (1) maximize shareholder
value and (2) hire and fire the CEO. Boards of directors have become more involved in
developing a firm’s strategy. Historically, boards of directors have utilized the CEO as
the primary information source with respect to firm actions and reactions17
. More
recently, boards of directors have become more proactive in terms of utilizing multiple
sources for information and becoming more active in firm decision-making18
.
Shareholders Senior Management
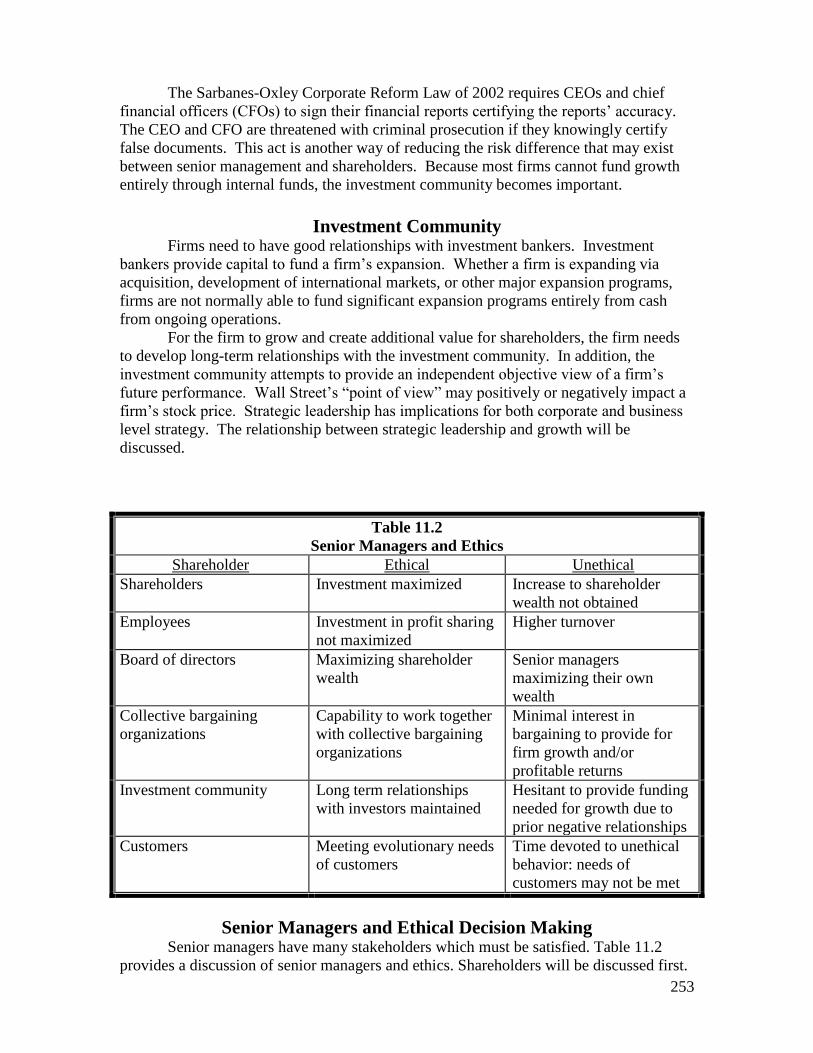
253
The Sarbanes-Oxley Corporate Reform Law of 2002 requires CEOs and chief
financial officers (CFOs) to sign their financial reports certifying the reports’ accuracy.
The CEO and CFO are threatened with criminal prosecution if they knowingly certify
false documents. This act is another way of reducing the risk difference that may exist
between senior management and shareholders. Because most firms cannot fund growth
entirely through internal funds, the investment community becomes important.
Investment Community Firms need to have good relationships with investment bankers. Investment
bankers provide capital to fund a firm’s expansion. Whether a firm is expanding via
acquisition, development of international markets, or other major expansion programs,
firms are not normally able to fund significant expansion programs entirely from cash
from ongoing operations.
For the firm to grow and create additional value for shareholders, the firm needs
to develop long-term relationships with the investment community. In addition, the
investment community attempts to provide an independent objective view of a firm’s
future performance. Wall Street’s “point of view” may positively or negatively impact a
firm’s stock price. Strategic leadership has implications for both corporate and business
level strategy. The relationship between strategic leadership and growth will be
discussed.
Table 11.2
Senior Managers and Ethics
Shareholder Ethical Unethical
Shareholders Investment maximized Increase to shareholder
wealth not obtained
Employees Investment in profit sharing
not maximized
Higher turnover
Board of directors Maximizing shareholder
wealth
Senior managers
maximizing their own
wealth
Collective bargaining
organizations
Capability to work together
with collective bargaining
organizations
Minimal interest in
bargaining to provide for
firm growth and/or
profitable returns
Investment community Long term relationships
with investors maintained
Hesitant to provide funding
needed for growth due to
prior negative relationships
Customers Meeting evolutionary needs
of customers
Time devoted to unethical
behavior: needs of
customers may not be met
Senior Managers and Ethical Decision Making Senior managers have many stakeholders which must be satisfied. Table 11.2
provides a discussion of senior managers and ethics. Shareholders will be discussed first.
254
A primary role of senior managers is to provide for increasing shareholder wealth.
Ethical decision makers will work to make decisions which will maximize the returns to
shareholders. They will not engage in risky decision making which could reduce
shareholder wealth. From a diversification perspective, senior managers will most likely
engage in related diversification because, in general, these types of actions will increase
shareholder wealth (Figure 7.1: Chapter 7). In addition, unethical decision makers will
normally decrease shareholder wealth.
Unethical decision makers can have a negative impact upon employees.
Employees model behavior of their superiors. If employees are aware of unethical senior
manager actions, employees may take the position that unethical decision making is fine
and act accordingly (in this case, unethically). If employees are ethical, they may change
jobs to more ethical firms who have ethical senior managers. In this case, the unethical
firms will need to incur significant time and money to hire and educate new employees.
The employees who have moved to ethical firms take institutional knowledge about their
former firm, its position in the industry, and knowledge of the industry and customer base
they have acquired during their employment with the unethical firm.
If senior managers are unethical, boards of directors must fire them. In addition,
boards of directors must then conduct a search to replace them. In the meantime, the
unethical firm may lose some of its market positions because no one in the unethical firm
can make superior decisions in the firm’s best interest. As a result, shareholder wealth
may decline.
With declines in shareholder wealth, firms may have difficulty obtaining needed
funds from investment banks which are needed for growth. In fact, investment banks may
be more inclined to provide funds to competitors because the value of shareholder wealth
with unethical decision makers has declined and will continue to decline.
In order to meet the needs of customers, the needs of collective bargaining
organizations must be met. If firms do not deal ethically with collective bargaining units,
firms may be forced to deal with labor strikes. Trust is of crucial importance when
dealing with labor unions. Strikes do not allow firms to meet the needs of the marketplace
(e.g. customers). If a firm goes on strike, competitors may benefit from obtaining
customer revenues from customer bases of the unethical firm. In addition, if the
competitor has good relationships with its collective bargaining unit, it knows that
product supply will be met when needed. In addition, once customers move to
competitors of the unethical firm, there is no guarantee that the customers will return to
the initial firm once the strike is over. This takes revenue from the firm that is engaged in
the strike and this revenue immediately goes to competitors. This diversion of revenue
could affect the domestic and international customer base of the firm that is engaged in
the strike.
One overarching theme that can be stated is that unethical senior managers are
limited from a conceptual perspective. Visionary senior managers do not need to be
unethical because they create industries: Steve Jobs (Apple), Bill Gates (Microsoft), Jim
Casey (UPS), Fred Smith (FedEx), Ray Kroc (McDonald’s) and Larry Ellison (Oracle).
The above list is not all inclusive but shows that industries can be created by ethical,
visionary, senior managers. I am not aware of any industries which have been created by
unethical decision makers. Visionary leaders are too busy developing new industries;
they do not have the time or the interest of engaging in unethical behavior.
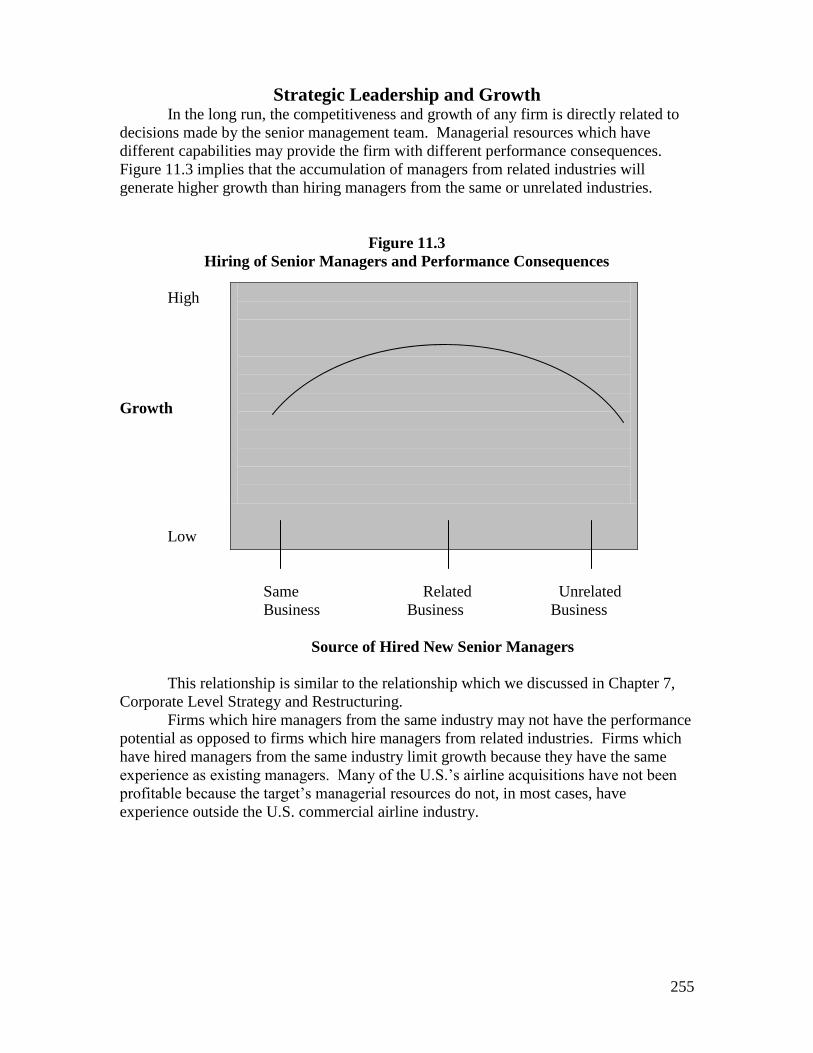
255
Strategic Leadership and Growth In the long run, the competitiveness and growth of any firm is directly related to
decisions made by the senior management team. Managerial resources which have
different capabilities may provide the firm with different performance consequences.
Figure 11.3 implies that the accumulation of managers from related industries will
generate higher growth than hiring managers from the same or unrelated industries.
Figure 11.3
Hiring of Senior Managers and Performance Consequences
High
Growth
Low
Same Related Unrelated
Business Business Business
Source of Hired New Senior Managers
This relationship is similar to the relationship which we discussed in Chapter 7,
Corporate Level Strategy and Restructuring.
Firms which hire managers from the same industry may not have the performance
potential as opposed to firms which hire managers from related industries. Firms which
have hired managers from the same industry limit growth because they have the same
experience as existing managers. Many of the U.S.’s airline acquisitions have not been
profitable because the target’s managerial resources do not, in most cases, have
experience outside the U.S. commercial airline industry.
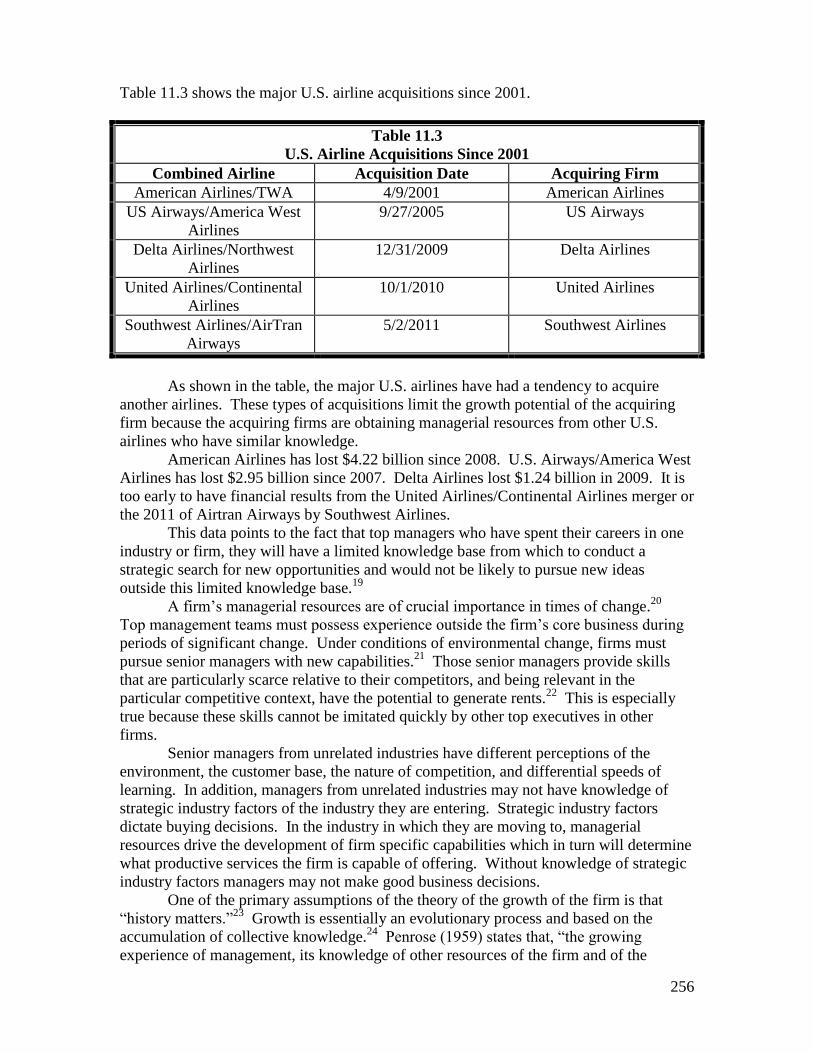
256
Table 11.3 shows the major U.S. airline acquisitions since 2001.
Table 11.3
U.S. Airline Acquisitions Since 2001
Combined Airline Acquisition Date Acquiring Firm
American Airlines/TWA 4/9/2001 American Airlines
US Airways/America West
Airlines
9/27/2005 US Airways
Delta Airlines/Northwest
Airlines
12/31/2009 Delta Airlines
United Airlines/Continental
Airlines
10/1/2010 United Airlines
Southwest Airlines/AirTran
Airways
5/2/2011 Southwest Airlines
As shown in the table, the major U.S. airlines have had a tendency to acquire
another airlines. These types of acquisitions limit the growth potential of the acquiring
firm because the acquiring firms are obtaining managerial resources from other U.S.
airlines who have similar knowledge.
American Airlines has lost $4.22 billion since 2008. U.S. Airways/America West
Airlines has lost $2.95 billion since 2007. Delta Airlines lost $1.24 billion in 2009. It is
too early to have financial results from the United Airlines/Continental Airlines merger or
the 2011 of Airtran Airways by Southwest Airlines.
This data points to the fact that top managers who have spent their careers in one
industry or firm, they will have a limited knowledge base from which to conduct a
strategic search for new opportunities and would not be likely to pursue new ideas
outside this limited knowledge base.19
A firm’s managerial resources are of crucial importance in times of change.20
Top management teams must possess experience outside the firm’s core business during
periods of significant change. Under conditions of environmental change, firms must
pursue senior managers with new capabilities.21
Those senior managers provide skills
that are particularly scarce relative to their competitors, and being relevant in the
particular competitive context, have the potential to generate rents.22
This is especially
true because these skills cannot be imitated quickly by other top executives in other
firms.
Senior managers from unrelated industries have different perceptions of the
environment, the customer base, the nature of competition, and differential speeds of
learning. In addition, managers from unrelated industries may not have knowledge of
strategic industry factors of the industry they are entering. Strategic industry factors
dictate buying decisions. In the industry in which they are moving to, managerial
resources drive the development of firm specific capabilities which in turn will determine
what productive services the firm is capable of offering. Without knowledge of strategic
industry factors managers may not make good business decisions.
One of the primary assumptions of the theory of the growth of the firm is that
“history matters.”23
Growth is essentially an evolutionary process and based on the
accumulation of collective knowledge.24
Penrose (1959) states that, “the growing
experience of management, its knowledge of other resources of the firm and of the
257
potential for using them in different ways, create incentives for further expansion as the
firm searches for ways of using the services of its resources more profitably. This is
especially true in industries with turbulent environments.
The air freight and airline industries were deregulated in 1978 while the trucking
and railroad industries were deregulation in 1980. Many firms did not survive the
consolidation of these industries. The transportation firms which are successful today are
multi-modal carriers. These firms have become total transportation firms which provide
all modes of transportation worldwide. These firms offer trucking, rail, air freight, ocean
shipping, and logistical services worldwide.
Managers with superior knowledge of a firm’s capabilities and industry context
are more likely to design strategies that create value by being more effective than rivals at
bundling and deploying resources in new ways.
This perspective of the firm as being able to dictate environmental change extends
the traditional position of the firm from responding to environmental change after the
fact. By the management team acquiring new capabilities, the firm has the potential to
create environmental change that alters the competitive environment in the firm’s favor to
provide for long-term growth.
As such, through the integration of related industry managerial resources with the
firm’s existing management team, the firm may be able to “creatively construct” its
environment to the point where the firm can dictate the path of environmental change.
Firms which have not incorporated new managerial resources from related industries may
not have the capacity to grow through “creative construction.”
Scandals and Strategic Leadership Throughout the first part of the new century, corporate scandals have played a
central role within many U.S. corporations. The WorldCom scandal resulted in negative
consequences for the firm’s board of directors. Eleven of the former board members
agreed to pay $20.2 million to settle a lawsuit concerning the firm’s accounting fraud25
.
In March 2005, Bernard Ebbers, former WorldCom CEO, was convicted of fraud and
conspiracy and sentenced to 25 years in prison. Many other senior executives face
situations similar to that confronting Bernard Ebbers26
. Others who have been convicted
are Kenneth Lay (former chairman of Enron), and Jeffery Skilling (former CEO of
Enron). Kenneth Lay has died and Jeffery Skilling is serving 25 to life. The senior
management team at AIG Inc., the world’s largest insurance firm, admitted to a broad
range of accounting frauds that reduced the firm’s net worth by $1.7 billion27
. In
addition, Michael Eisner (Disney) stepped down as CEO after considerable pressure from
the board of directors. Carly Fiorina, former CEO of Hewlett Packard, resigned as a
result of the Compaq acquisition.
In many cases, individuals attempted to maximize their own personal financial
gains instead of trying to increase shareholder wealth. What is alarming is that CEO
bonuses rose 46 percent at 100 of the largest U.S. companies in 200428
. Many of these
firms did not experience similar increases in shareholder wealth29
.
Due to the fact that many individuals conspired together (e.g. WorldCom senior
management), the amount of time to engage in these illegal actions was considerable.
This time reduced the focus and commitment the senior management teams needed to
devote to maximizing shareholder wealth. Strategic leadership should be focused on
gaining and sustaining competitive advantage for shareholders. Strategic leadership is
not eliminating or significantly reducing shareholder wealth. Acts of fraud are focused
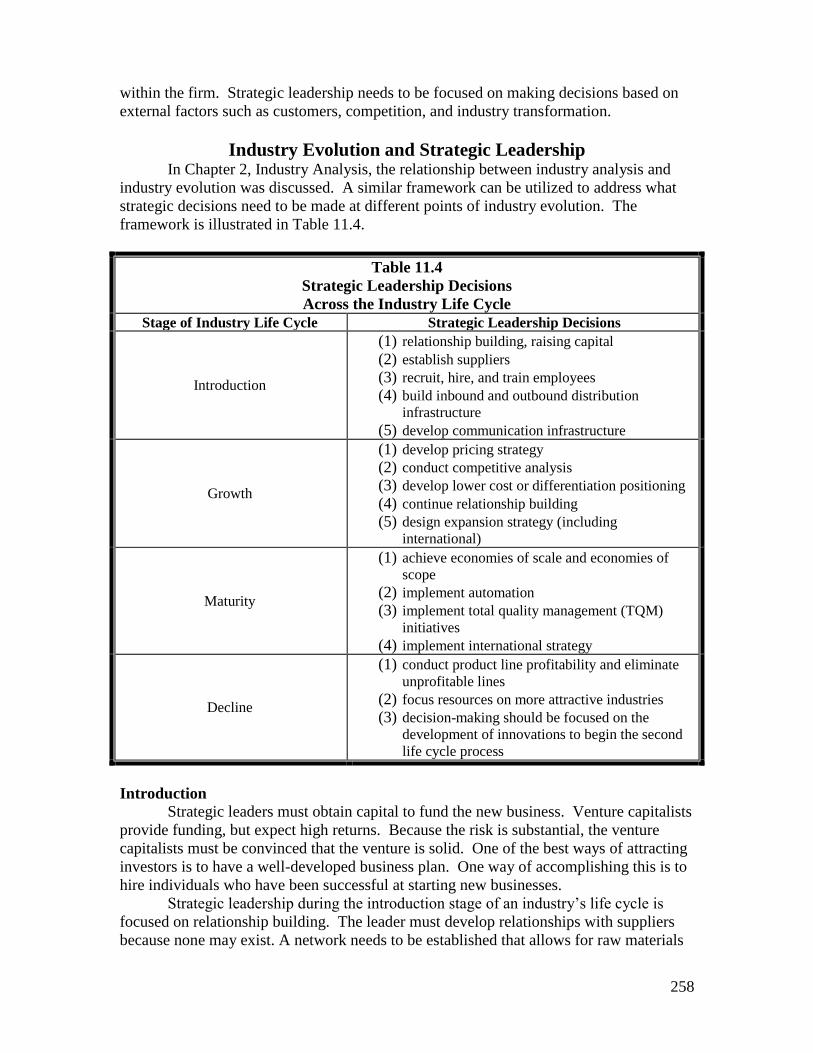
258
within the firm. Strategic leadership needs to be focused on making decisions based on
external factors such as customers, competition, and industry transformation.
Industry Evolution and Strategic Leadership In Chapter 2, Industry Analysis, the relationship between industry analysis and
industry evolution was discussed. A similar framework can be utilized to address what
strategic decisions need to be made at different points of industry evolution. The
framework is illustrated in Table 11.4.
Table 11.4
Strategic Leadership Decisions
Across the Industry Life Cycle
Stage of Industry Life Cycle Strategic Leadership Decisions
Introduction
(1) relationship building, raising capital
(2) establish suppliers (3) recruit, hire, and train employees (4) build inbound and outbound distribution
infrastructure
(5) develop communication infrastructure
Growth
(1) develop pricing strategy (2) conduct competitive analysis (3) develop lower cost or differentiation positioning
(4) continue relationship building (5) design expansion strategy (including
international)
Maturity
(1) achieve economies of scale and economies of
scope (2) implement automation (3) implement total quality management (TQM)
initiatives (4) implement international strategy
Decline
(1) conduct product line profitability and eliminate
unprofitable lines (2) focus resources on more attractive industries (3) decision-making should be focused on the
development of innovations to begin the second
life cycle process
Introduction
Strategic leaders must obtain capital to fund the new business. Venture capitalists
provide funding, but expect high returns. Because the risk is substantial, the venture
capitalists must be convinced that the venture is solid. One of the best ways of attracting
investors is to have a well-developed business plan. One way of accomplishing this is to
hire individuals who have been successful at starting new businesses.
Strategic leadership during the introduction stage of an industry’s life cycle is
focused on relationship building. The leader must develop relationships with suppliers
because none may exist. A network needs to be established that allows for raw materials
259
to be transported to manufacturing/operating facilities and then to customers in a timely
manner.
Leaders must hire employees to manufacture raw materials into finished goods.
Leaders must instill in employees a sense of pride and commitment. One of the best
ways of doing this is to make your employees shareholders. When their compensation is
partially rewarded based on the profitability of the firm, employees will be more highly
motivated to perform at peak efficiency. A commitment to the firm from sales people
during this stage is crucial because the firm is offering new goods/services to new
customers. The firm’s existence is dependent upon the sales force converting prospects
into customers. Compensation programs that provide high incentives to generate sales
quickly are crucial at this point.
Since the firm is offering new products/services to new customers, customer
acceptance is crucial. The leader must make certain that feedback with respect to
products/services, competition, and changing key buying criteria reaches senior level
management in a timely manner. A communication infrastructure must be developed to
permit timely information to flow throughout the firm and especially to customers. This
infrastructure needs to facilitate the building of long-term relationships with employees
and customers.
Growth
When competitors have entered the industry, the growth stage of the life cycle has
begun. A well-developed pricing strategy is crucial as the firm enters the growth stage.
Low prices by the incumbent firm may act as a barrier to entry. Potential entrants may
choose to enter other industries that offer more favorable margins.
When competition does enter the industry, strategic leaders can follow one of two
approaches. First, as competitors enter the industry with similar products/services, the
initial firm may reduce price. Because competitors have start-up costs to recover, price
reductions will make this recovery process longer. Second, the initial firm’s leaders may
decide to improve the quality of existing products by adding value-based features. The
attempt with the second option is to create differentiation from competitors. If margins
are sufficient, strategic leaders may engage in both approaches. By creating
differentiation from competition and offering consumers lower prices, the firm can
maximize growth.
It is the leaders’ responsibility to anticipate actions by competitors, and quickly
implement strategic responses to competitors’ actions. Leaders must be aware of the
strengths and weaknesses of their firm and of competitors. Strategic leaders will design
and implement programs to capitalize upon competitors’ weaknesses. Strategic leaders
will also implement an expansion strategy to penetrate international markets.
Maturity
When price becomes more of an elastic variable, the industry has entered the
maturity stage of the life cycle. Strategic leaders need to design and implement programs
that allow for economies of scale to be obtained. As the industry moves further into the
maturity stage, price becomes an important key buying criterion. In addition to actions
that achieve scale economies, strategic leaders need to design and implement total quality
management (TQM) initiatives that reduce costs.
While a firm’s domestic market may be mature, the firm may be able to obtain
higher margins in international markets within the same industry. International markets
260
may be at earlier stages of the industry life cycle than the firm’s domestic market. As
such, firms may enjoy the benefits of the growth stage of industry evolution in some
international markets. This expansion may permit strategic leaders to obtain additional
funds to expand into other international markets.
Decline
As firms begin to exit the industry and/or go out of business, the industry has
reached the decline stage. This stage is characterized by decreasing sales and margins.
Product line profitability studies need to be continually reviewed. Unprofitable lines
need to be eliminated. Strategic leaders need to determine the best allocation of
resources. Leaders may reallocate resources to developing international markets that are
at earlier stages of the life cycle. This process of industry and international expansion is
what sustains firms in the long run. Strategic leaders may allocate resources to create
new industries; this begins a new industry life cycle. The entire process will then follow a
new life cycle.

261
Discussion Questions
1. Define strategic leadership.
2. Identify the primary stakeholders of strategic leaders.
3. Why have some strategic leaders engaged in greed and corruption?
4. Explain how strategic leaders analyze competition.
5. What should strategic leaders do when their firm enters the maturity stage of the
industry’s life cycle? Why?
6. Explain what decisions strategic leaders need to make at each stage of the
industry life cycle.
7. Explain why strategic leaders need to develop long-term relationships.
262
References
1. Rumelt, R., Schendel, D. and Teece, D. 1991. Strategic management and
economics. Strategic Management Journal. 12(winter): 5-29.
2. Dess, G., Lumpkin, G., and Eisner, A. 2005. Strategic management. McGraw-Hill
Irwin. Boston, MA.
3. Ireland R. and Hitt M. 2005. Achieving and maintaining strategic competitiveness
in the 21st century: the role of strategic leadership. Academy of Management
Executive, 13: 63-77.
4. Penrose E. 1959. A theory of growth of the firm. John Wiley & Sons: New York.
5. Ireland R. and Hitt M. 2005.
6. Barney J. 1991. Firm resources and sustained competitive advantage. Journal of
Management, 17: 99-120.
7. Ireland R. and Hitt M. 2005.
8. Wernerfelt B. 1984. A resource based view of the firm. Strategic Management
Journal, 5: 171-180.
9. Thompson A., Strickland A., and Gamble J. 2007. Crafting and executing strategy;
the quest for competitive advantage. 14th
edition. McGraw-Hill Irwin: New York
10. Dalton D. & Dalton C. 2005. Sarbanes-Oxley legislation and the private company:
If not a marriage, then certainly an engagement. Journal of Business Strategy,
26(2): 7-8.
11. Ireland R. and Hitt M. 2005.
12. Laverty K.J. 1996. Economic “short termism”: The debate, the unresolved issues,
and the implications for management practice and research, Academy of
Management Review.
13. ibid
14. Amit, R. and Shoemaker, P. 1003. Strategic assets and organizational rent. Strategic
Management Journal. 17: 33-46.
15. Moran, P. and Ghoshal, S. 1999. Firms and the process of economic development.
Academy of Management Review. 24: 390-412.
16. Glader, P. and Maher, K. 2005. Mining and unions seek to form cross-border
alliances. Wall Street Journal. May 6.
263
17. ____2004. The view from the boardroom. Wall Street Journal. November 11.
18. Young, S. 2005. Ex-WorldCom directors reach pact. Wall Street Journal. March 24.
19. Hambrick, D. and Mason, P., (1984). Upper echelons: The organization as a
reflection of its top managers. Academy of Management Review, 9: 193-206.
20. Adner, R. and Helfat, C., (2003). Corporate effects and dynamic managerial
capabilities. Strategic Management Journal, 24: 1011-1025.
21. Holcomb, T., Holmes. R., and Connelly, B., (2009). Making the most of what you
have: Managerial ability as a source of resource value creation. Strategic
Management Journal, 30: 457-486.
22. Castanias, R.P. and Helfat, C.E. (2001). The managerial rents model: Theory and
empirical analysis. Journal of Management, 27: 661-678.
23. Teece, D., Pisano, G., and Shuen, A., (1997). Dynamic capabilities and strategic
management. Strategic Management Journal, 18: 509-533.
24. Penrose, E., (1995). Forward in Penrose, E. The Theory of the Growth of the Firm.
Oxford: Basil Blackwell.
25. Pulliam, S. 2005. At center of fraud, WorldCom officials see life unravel. Wall
Street Journal. March 24.
26. Ibid
27. McDonald, I., Francis, T., and Solomon, M. 2005. AIG admits improper
accounting. Wall Street Journal. March 31.
28. Lublin, J. 2005. CEO bonuses rose 46.4% at 100 big firms in 2004. Wall Street
Journal. February 25.
29. Ibid
264
Hershey Mini Case
The Hershey Company is the largest producer of quality chocolate in North
America and a global leader in chocolate and sugar confectionery. This firm has
continued to grow from a sales and profit perspective in light of the fact that many of its
products are not viewed positively by health conscious consumers.
Revenues have increased from $5.13 billion in 2008 to $5.67 billion in 2010. In
addition, net income has increased from $311 million in 2008 to $509 billion in 2010.
Further, earnings per share have increased from $1.41/share in 2008 to $2.29/share in
2010.
Hershey has substantial international operations (in addition to the U.S.) in
Canada, Mexico, Brazil, Asia, the Middle East, and Africa. Some of these international
markets are a source of growth because many of these countries are currently not focused
upon the concerns of healthy chocolate products. While some products, may need
minimal adaptation, the consumers in general, are focused more on taste than upon
health. From this perspective, Hershey is focusing upon Mexico and the Pacific Rim
markets as two of its growth markets.
Hershey’s International group is responsible for building global brands,
developing growth platforms, brand positioning and portfolio strategy. This group also
develops market-specific insights, strategies and innovation for Hershey International.
In international markets, one of Hershey’s strategic goals is to deliver sustainable
innovation to improve their position in these key growth areas. Hershey believes that this
approach would strengthen their position globally in sugar confections, building a
competitive position in the premium and value confectionery segments and supporting
health and wellness product offerings. The “supporting health and wellness product
offerings” are one key to profitable growth in fully developed markets which are focused
upon healthy choice options (e.g., U.S.). Hershey has a goal of being a socially
responsibility corporate citizen.
Discussion Questions
1. Explain how Hershey has designed its strategy to meet the needs of a health
conscious society.
2. Explain how Hershey is focusing upon corporate social responsibility.
265
Harvard Business Cases for Chapter 11
Hocol
Product Number SKE141
Volkswagen to Brazil: Driving Strategy with the Balanced Scorecard
Product Number 111049
Professor Case for Chapter 11
AB Inbev

266

267
Chapter 12
Wealth Creation

268
Learning and Assessment Goals
1. Understand what wealth creation is and how it is achieved.
2. Understand how the balanced scorecard can be utilized to provide a framework
for assessing wealth creation.
3. Develop an understanding of financial ratios and how they are used.
4. Understand the concepts of economic value added (EVA) and market value added
(MVA).
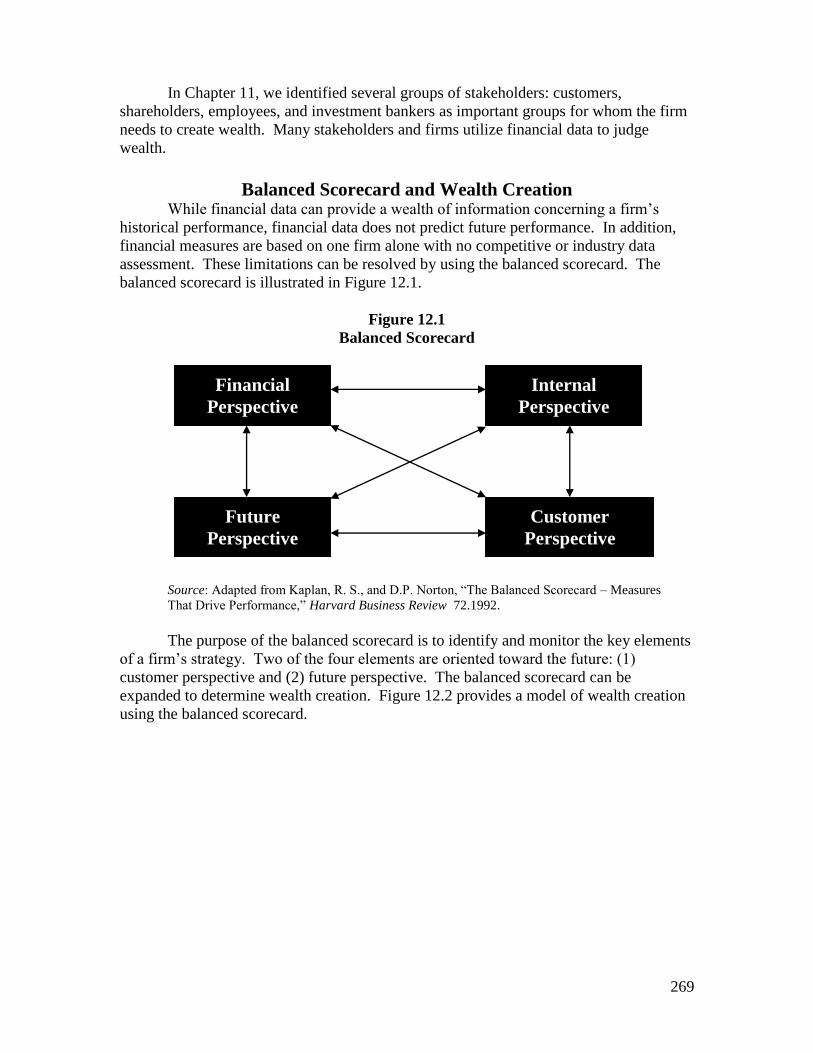
269
In Chapter 11, we identified several groups of stakeholders: customers,
shareholders, employees, and investment bankers as important groups for whom the firm
needs to create wealth. Many stakeholders and firms utilize financial data to judge
wealth.
Balanced Scorecard and Wealth Creation While financial data can provide a wealth of information concerning a firm’s
historical performance, financial data does not predict future performance. In addition,
financial measures are based on one firm alone with no competitive or industry data
assessment. These limitations can be resolved by using the balanced scorecard. The
balanced scorecard is illustrated in Figure 12.1.
Figure 12.1
Balanced Scorecard
Source: Adapted from Kaplan, R. S., and D.P. Norton, “The Balanced Scorecard – Measures
That Drive Performance,” Harvard Business Review 72.1992.
The purpose of the balanced scorecard is to identify and monitor the key elements
of a firm’s strategy. Two of the four elements are oriented toward the future: (1)
customer perspective and (2) future perspective. The balanced scorecard can be
expanded to determine wealth creation. Figure 12.2 provides a model of wealth creation
using the balanced scorecard.
Financial
Perspective
Customer
Perspective
Future
Perspective
Internal
Perspective
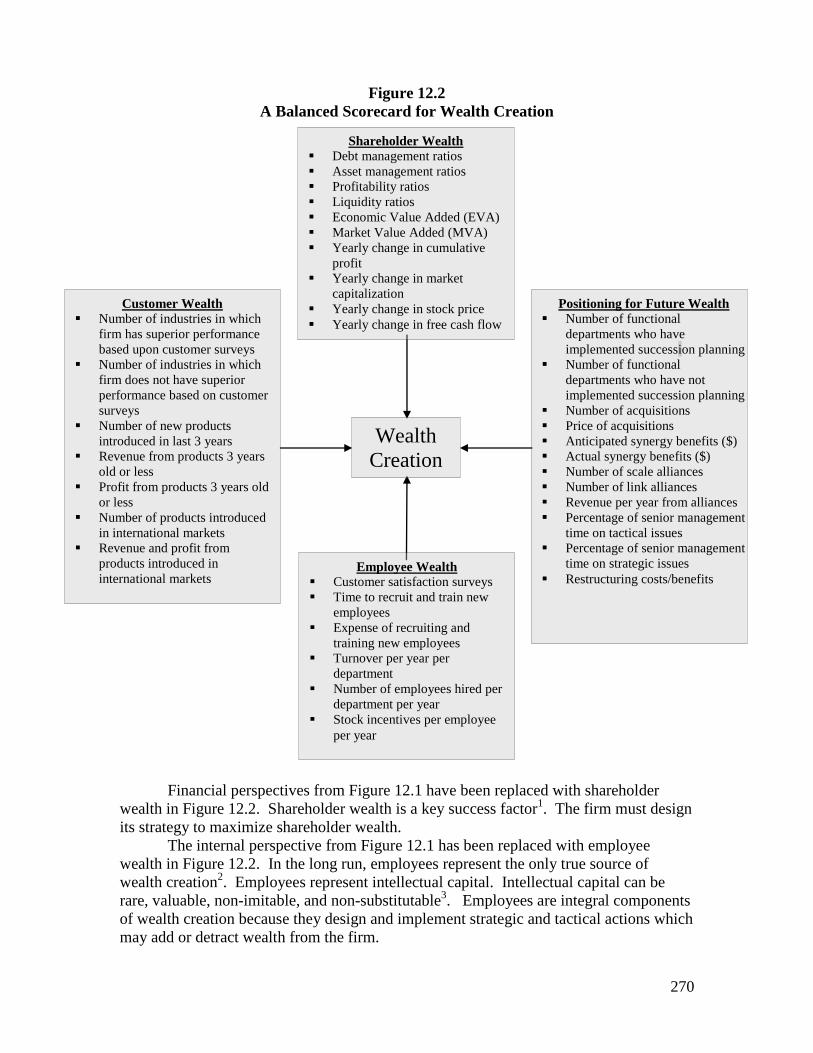
270
Figure 12.2
A Balanced Scorecard for Wealth Creation
Financial perspectives from Figure 12.1 have been replaced with shareholder
wealth in Figure 12.2. Shareholder wealth is a key success factor1. The firm must design
its strategy to maximize shareholder wealth.
The internal perspective from Figure 12.1 has been replaced with employee
wealth in Figure 12.2. In the long run, employees represent the only true source of
wealth creation2. Employees represent intellectual capital. Intellectual capital can be
rare, valuable, non-imitable, and non-substitutable3. Employees are integral components
of wealth creation because they design and implement strategic and tactical actions which
may add or detract wealth from the firm.
Shareholder Wealth
Debt management ratios
Asset management ratios
Profitability ratios
Liquidity ratios
Economic Value Added (EVA)
Market Value Added (MVA)
Yearly change in cumulative
profit
Yearly change in market
capitalization
Yearly change in stock price
Yearly change in free cash flow
Customer Wealth
Number of industries in which
firm has superior performance
based upon customer surveys
Number of industries in which
firm does not have superior
performance based on customer
surveys
Number of new products
introduced in last 3 years
Revenue from products 3 years
old or less
Profit from products 3 years old
or less
Number of products introduced
in international markets
Revenue and profit from
products introduced in
international markets
Positioning for Future Wealth
Number of functional
departments who have
implemented succession planning
Number of functional
departments who have not
implemented succession planning
Number of acquisitions
Price of acquisitions
Anticipated synergy benefits ($)
Actual synergy benefits ($)
Number of scale alliances
Number of link alliances
Revenue per year from alliances
Percentage of senior management
time on tactical issues
Percentage of senior management
time on strategic issues
Restructuring costs/benefits Employee Wealth
Customer satisfaction surveys
Time to recruit and train new
employees
Expense of recruiting and
training new employees
Turnover per year per
department
Number of employees hired per
department per year
Stock incentives per employee
per year
Wealth
Creation
271
The customer perspective has been modified to include data that can be measured
to create customer wealth.
The future perspective of the balanced scorecard has been expanded to focus upon
positioning for wealth creation over time. The key to wealth creation is to meet or
exceed stakeholders’ expectations over time. Each aspect of wealth creation will now be
discussed. We will begin with customers.
Customer Wealth Creating wealth for consumers is critical for success. Increasing customer wealth
is dependent upon how much better the firm meets the key buying criteria within each
industry compared to competition. Firms may have multiple sources of revenue because
they may have positioning in multiple industries. The first step is to identify what
industries a firm is competing within. Industries can be defined by the Standard
Industrial Classification (SIC), for U.S. domestic firms. The North American Industry
Classification System (NAICS) is used for classifying firms within North America. The
International Standard Industrial Classification (ISIC) is used to classify international
firms outside North America. These classification systems were discussed in Chapter 1,
Industry Analysis.
Once industry boundaries have been identified, it is important to ascertain a firm’s
performance within each industry. Chapter 4, Business Level Strategy, fully developed
this issue, and explained how a firm can achieve competitive advantage. Chapter 5,
Analysis of Markets and Positioning, examined the process by which firms can evaluate
their position versus competitors on an industry-by-industry basis. A crucial component
of this analysis is obtaining feedback from customers through the sales force. Chapter
11, Strategic Leadership Decision Making, discussed how firms could obtain such
feedback. Examining the results of customer surveys is one approach that was discussed.
A crucial point that has been addressed throughout the book is the sales force developing
long-term relationships with customers. If these relationships exist, the sales force can
communicate to senior leaders how the firm and competitors are positioned within each
industry.
Based on this feedback from customers, the firm can judge where resources
should be reallocated to maximize firm performance. Without this assessment on an
industry-by-industry basis, the firm is more likely to engage in reactive as opposed to
proactive decision-making. The industry analysis may determine that in some industries,
the firm is not meeting the key buying criteria. If key buying criteria are not being met,
the firm may need to develop new products that do meet key buying criteria.
Therefore, one wealth-creating statistic would be the number of new products
introduced per year. Wealth can be determined by measuring the revenue and profit
these new products generate. Another measure of wealth creation would consist of how
much revenue and profits these new products have generated over time.
The success of new products is dependent upon the degree of benefit that
customers obtain as opposed to the benefits obtained from competitors’
products/services5. One way to measure this benefit is to determine the number of
products competitors introduced per year and the revenue and profitability of those
products. In many cases, product line profitability data is available in competitors’
annual reports and 10-K reports.
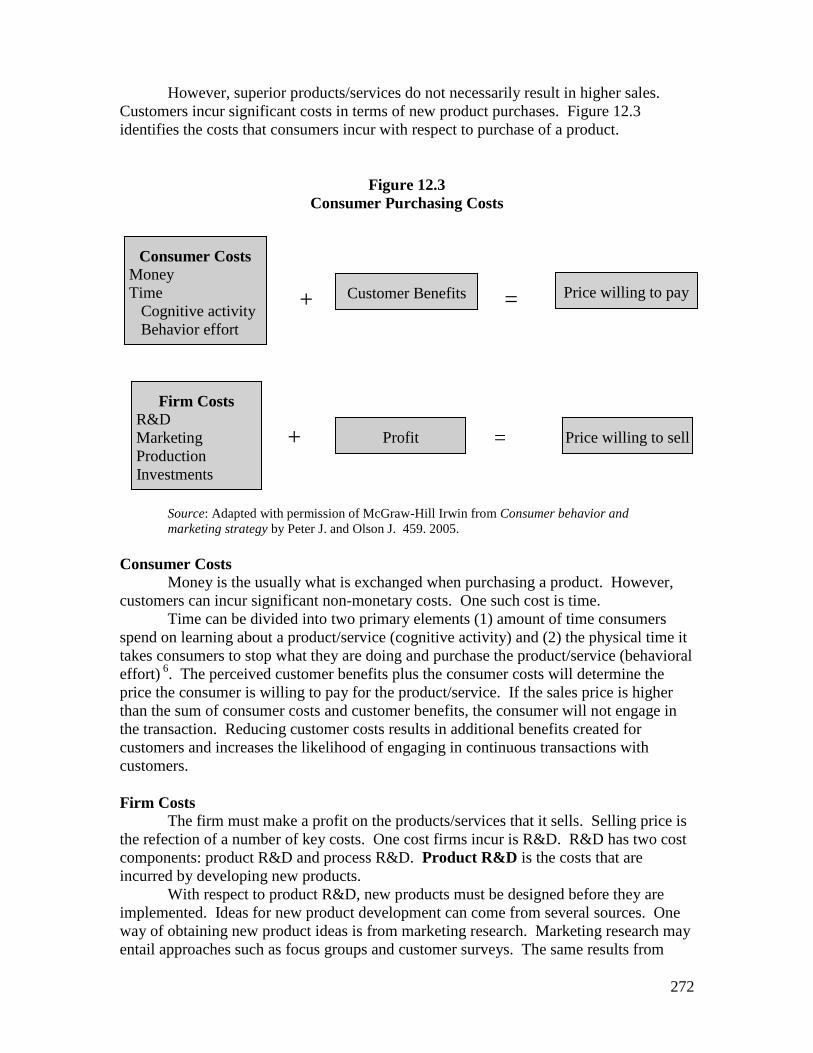
272
However, superior products/services do not necessarily result in higher sales.
Customers incur significant costs in terms of new product purchases. Figure 12.3
identifies the costs that consumers incur with respect to purchase of a product.
Figure 12.3
Consumer Purchasing Costs
=
+ =
+ =
Source: Adapted with permission of McGraw-Hill Irwin from Consumer behavior and
marketing strategy by Peter J. and Olson J. 459. 2005.
Consumer Costs
Money is the usually what is exchanged when purchasing a product. However,
customers can incur significant non-monetary costs. One such cost is time.
Time can be divided into two primary elements (1) amount of time consumers
spend on learning about a product/service (cognitive activity) and (2) the physical time it
takes consumers to stop what they are doing and purchase the product/service (behavioral
effort) 6
. The perceived customer benefits plus the consumer costs will determine the
price the consumer is willing to pay for the product/service. If the sales price is higher
than the sum of consumer costs and customer benefits, the consumer will not engage in
the transaction. Reducing customer costs results in additional benefits created for
customers and increases the likelihood of engaging in continuous transactions with
customers.
Firm Costs
The firm must make a profit on the products/services that it sells. Selling price is
the refection of a number of key costs. One cost firms incur is R&D. R&D has two cost
components: product R&D and process R&D. Product R&D is the costs that are
incurred by developing new products.
With respect to product R&D, new products must be designed before they are
implemented. Ideas for new product development can come from several sources. One
way of obtaining new product ideas is from marketing research. Marketing research may
entail approaches such as focus groups and customer surveys. The same results from
Consumer Costs
Money
Time
Cognitive activity
Behavior effort
Customer Benefits Price willing to pay
Firm Costs
R&D
Marketing
Production
Investments
Profit Price willing to sell
273
multiple techniques will tend to create a more accurate picture for identifying customers’
changing needs.
New products may generate additional costs. New product introduction may create
changes in both inbound and outbound logistics. An infrastructure may need to be
developed to move materials into manufacturing operations. In addition, an evaluation
needs to be conducted to determine if existing outbound logistics are sufficient for
moving new products to consumers on time.
If the firm is introducing products into new international markets, an
infrastructure may need to be developed. Investments in plant and/or equipment to
generate economies of scale and/or economies of scope may be substantial. Further, if
the product is new to the firm, an international sales staff that has sold similar products
may need to be hired.
Introducing new products does not necessarily increase wealth creation.
Customer wealth may result from re-positioning existing products. As products age, they
may become more attractive to other segments. An example would be the Play Station 2
(PS2) from Sony. The newer version, Play Station 3 (PS3) will be initially sold in the
United States and Japan. However, production facilitates still exist for manufacturing
PS2. To more fully utilize this capacity, Sony could sell PS2 products in developing
markets. Because GDP per capita is significantly lower in developing countries, potential
customers may not be able to afford new PS3’s. The selling of PS2’s in developing
countries may begin to develop a new customer base for Sony. As these customers begin
to earn higher GDP per capita in the future, they may be able to afford PS3’s. Sony may
be able to create wealth by offering new products to existing customers and offering
existing products to new customers.
Firms can incur significant production costs manufacturing new products.
Existing processes may need to be changed significantly for new product creation. These
process R&D costs are changes in manufacturing that may need to be implemented to
improve efficiencies. Examples include automation, flexible manufacturing, and six
sigma. Process R&D initiatives, such as quality function deployment efforts, may also
reduce R&D cycle time and/or increase demand.
As these costs increase, the firm needs to determine revenue, costs, and profits.
To conduct this profit/cost trade-off, many firms utilize test markets. Test markets are
beneficial because they can be used to determine actual sales and actual costs. This
analysis will determine what price the firm needs to sell products/services. If this price is
equal to or lower than customer costs and expected benefits, a transaction will occur. If
not, no transaction will occur.
Shareholder Wealth Most firms are in business to increase shareholder wealth. In other words, the
price of the firm’s stock needs to appreciate. There is a good reason for increasing the
wealth of shareholders. If wealth is not created, shareholders will invest in other firms.
Because increasing shareholder wealth is important, more firms are beginning to
compensate senior management based upon firm performance. Cisco compensates all of
its senior management team based upon changes in shareholder wealth. This approach to
compensating senior management tends to reduce agency problems between senior
management and shareholders.
Several firms have implemented processes for measuring shareholder wealth.
Caterpillar initiated a new style of management reporting in 2004. Called Transparent
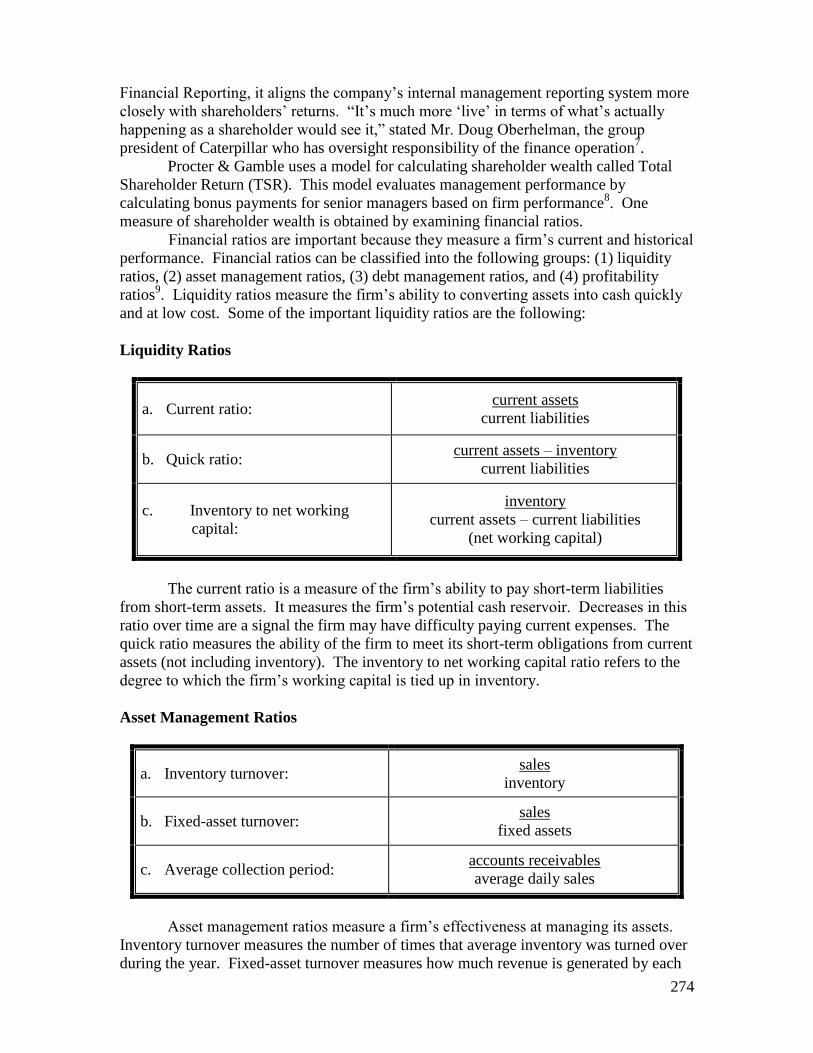
274
Financial Reporting, it aligns the company’s internal management reporting system more
closely with shareholders’ returns. “It’s much more ‘live’ in terms of what’s actually
happening as a shareholder would see it,” stated Mr. Doug Oberhelman, the group
president of Caterpillar who has oversight responsibility of the finance operation7.
Procter & Gamble uses a model for calculating shareholder wealth called Total
Shareholder Return (TSR). This model evaluates management performance by
calculating bonus payments for senior managers based on firm performance8. One
measure of shareholder wealth is obtained by examining financial ratios.
Financial ratios are important because they measure a firm’s current and historical
performance. Financial ratios can be classified into the following groups: (1) liquidity
ratios, (2) asset management ratios, (3) debt management ratios, and (4) profitability
ratios9. Liquidity ratios measure the firm’s ability to converting assets into cash quickly
and at low cost. Some of the important liquidity ratios are the following:
Liquidity Ratios
a. Current ratio: current assets
current liabilities
b. Quick ratio: current assets – inventory
current liabilities
c. Inventory to net working
capital:
inventory
current assets – current liabilities
(net working capital)
The current ratio is a measure of the firm’s ability to pay short-term liabilities
from short-term assets. It measures the firm’s potential cash reservoir. Decreases in this
ratio over time are a signal the firm may have difficulty paying current expenses. The
quick ratio measures the ability of the firm to meet its short-term obligations from current
assets (not including inventory). The inventory to net working capital ratio refers to the
degree to which the firm’s working capital is tied up in inventory.
Asset Management Ratios
a. Inventory turnover: sales
inventory
b. Fixed-asset turnover: sales
fixed assets
c. Average collection period: accounts receivables
average daily sales
Asset management ratios measure a firm’s effectiveness at managing its assets.
Inventory turnover measures the number of times that average inventory was turned over
during the year. Fixed-asset turnover measures how much revenue is generated by each
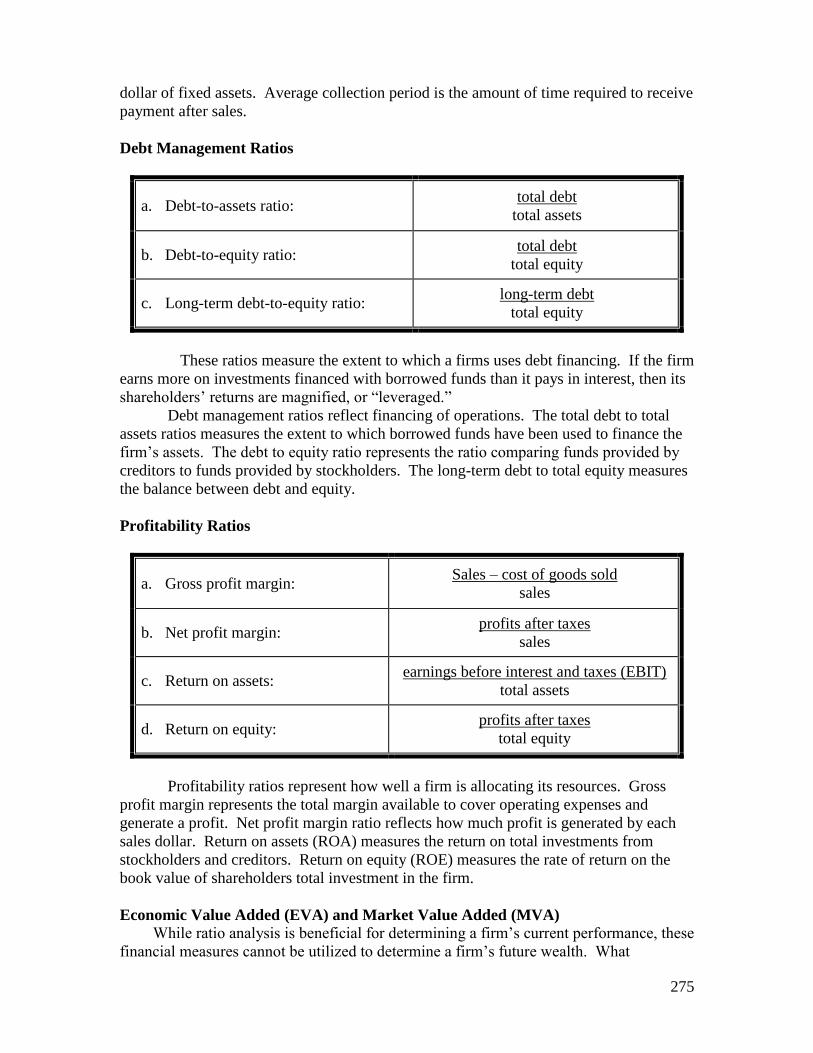
275
dollar of fixed assets. Average collection period is the amount of time required to receive
payment after sales.
Debt Management Ratios
a. Debt-to-assets ratio: total debt
total assets
b. Debt-to-equity ratio: total debt
total equity
c. Long-term debt-to-equity ratio: long-term debt
total equity
These ratios measure the extent to which a firms uses debt financing. If the firm
earns more on investments financed with borrowed funds than it pays in interest, then its
shareholders’ returns are magnified, or “leveraged.”
Debt management ratios reflect financing of operations. The total debt to total
assets ratios measures the extent to which borrowed funds have been used to finance the
firm’s assets. The debt to equity ratio represents the ratio comparing funds provided by
creditors to funds provided by stockholders. The long-term debt to total equity measures
the balance between debt and equity.
Profitability Ratios
a. Gross profit margin: Sales – cost of goods sold
sales
b. Net profit margin: profits after taxes
sales
c. Return on assets: earnings before interest and taxes (EBIT)
total assets
d. Return on equity: profits after taxes
total equity
Profitability ratios represent how well a firm is allocating its resources. Gross
profit margin represents the total margin available to cover operating expenses and
generate a profit. Net profit margin ratio reflects how much profit is generated by each
sales dollar. Return on assets (ROA) measures the return on total investments from
stockholders and creditors. Return on equity (ROE) measures the rate of return on the
book value of shareholders total investment in the firm.
Economic Value Added (EVA) and Market Value Added (MVA) While ratio analysis is beneficial for determining a firm’s current performance, these
financial measures cannot be utilized to determine a firm’s future wealth. What
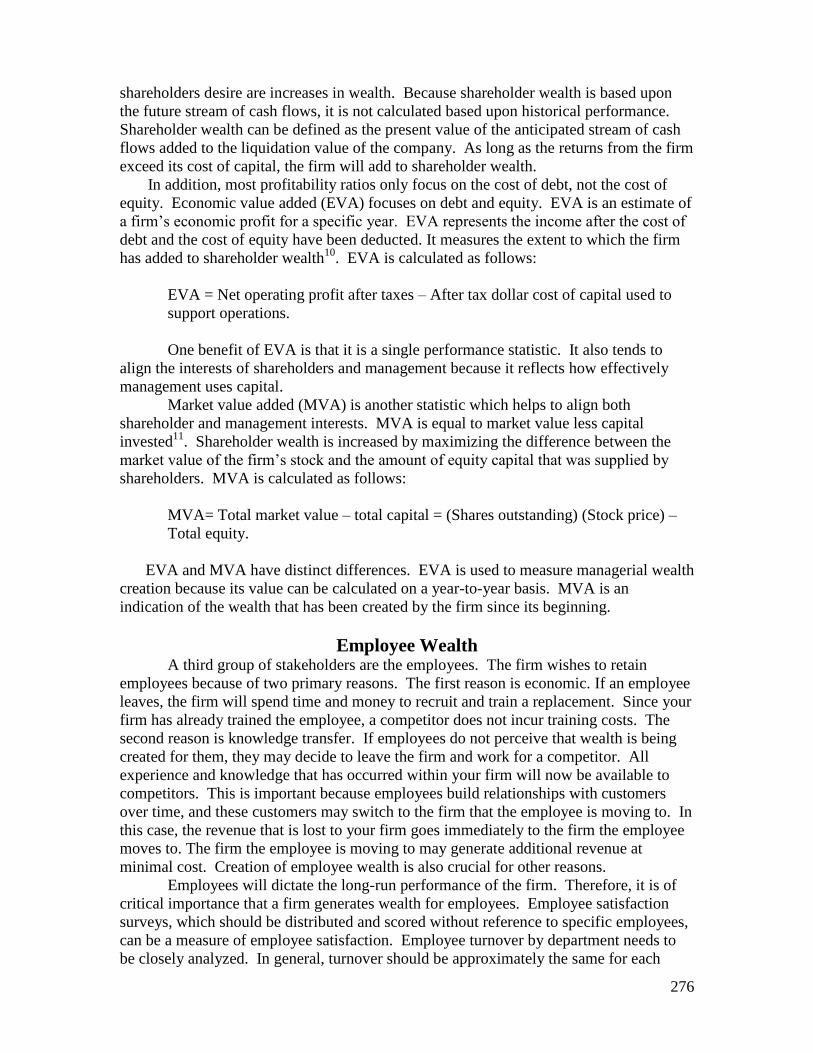
276
shareholders desire are increases in wealth. Because shareholder wealth is based upon
the future stream of cash flows, it is not calculated based upon historical performance.
Shareholder wealth can be defined as the present value of the anticipated stream of cash
flows added to the liquidation value of the company. As long as the returns from the firm
exceed its cost of capital, the firm will add to shareholder wealth.
In addition, most profitability ratios only focus on the cost of debt, not the cost of
equity. Economic value added (EVA) focuses on debt and equity. EVA is an estimate of
a firm’s economic profit for a specific year. EVA represents the income after the cost of
debt and the cost of equity have been deducted. It measures the extent to which the firm
has added to shareholder wealth10
. EVA is calculated as follows:
EVA = Net operating profit after taxes – After tax dollar cost of capital used to
support operations.
One benefit of EVA is that it is a single performance statistic. It also tends to
align the interests of shareholders and management because it reflects how effectively
management uses capital.
Market value added (MVA) is another statistic which helps to align both
shareholder and management interests. MVA is equal to market value less capital
invested11
. Shareholder wealth is increased by maximizing the difference between the
market value of the firm’s stock and the amount of equity capital that was supplied by
shareholders. MVA is calculated as follows:
MVA= Total market value – total capital = (Shares outstanding) (Stock price) –
Total equity.
EVA and MVA have distinct differences. EVA is used to measure managerial wealth
creation because its value can be calculated on a year-to-year basis. MVA is an
indication of the wealth that has been created by the firm since its beginning.
Employee Wealth A third group of stakeholders are the employees. The firm wishes to retain
employees because of two primary reasons. The first reason is economic. If an employee
leaves, the firm will spend time and money to recruit and train a replacement. Since your
firm has already trained the employee, a competitor does not incur training costs. The
second reason is knowledge transfer. If employees do not perceive that wealth is being
created for them, they may decide to leave the firm and work for a competitor. All
experience and knowledge that has occurred within your firm will now be available to
competitors. This is important because employees build relationships with customers
over time, and these customers may switch to the firm that the employee is moving to. In
this case, the revenue that is lost to your firm goes immediately to the firm the employee
moves to. The firm the employee is moving to may generate additional revenue at
minimal cost. Creation of employee wealth is also crucial for other reasons.
Employees will dictate the long-run performance of the firm. Therefore, it is of
critical importance that a firm generates wealth for employees. Employee satisfaction
surveys, which should be distributed and scored without reference to specific employees,
can be a measure of employee satisfaction. Employee turnover by department needs to
be closely analyzed. In general, turnover should be approximately the same for each
277
functional group. If it is not, a closer analysis of those departments generating higher
turnover is required.
One of the best ways of retaining employees is to make them shareholders. Each
year, United Parcel Service (UPS) rewards employees based upon how well the firm has
performed during the year. Because these rewards are stocks, employees have an
incentive to maximize shareholder wealth. This reward system links the compensation of
employees to stock price changes because all employees are rewarded for stock
appreciation. If the company has a bad year, all employees within the firm aggressively
search to find the source of the stock decline and implement corrective action quickly.
These actions increase wealth for the shareholders, the firm’s senior management, and all
other managers within the firm.
Positioning for Future Wealth For the firm to create future wealth, it must design and implement its strategic
plan. Some of the issues that need to be addressed are (1) expansion within domestic and
international markets, (2) acquisitions and mergers, (3) costs and anticipated benefits of
acquisitions, (4) restructuring, (5) resource utilization (6) implementation of strategic
plan, (7) creation of strategic alliances, and (8) succession planning
Because employees represent the most important asset of any firm, succession
plans must be developed to retain high performing employees. Most employees in firms
want to advance. Many times, succession planning only addresses the CEO and senior
management team. The plan should include general parameters for all employees. If
employees are unaware of how they can advance within a firm, they may leave and join
competitors that have more fully developed succession plans.
Succession planning affects many levels within a firm. Assume a new CEO is
chosen from within the firm. Further assume that the former job of the new CEO was
chief operating officer (COO) and the new COO was the chief financial officer (CFO).
Assume that the new CFO was vice president of North American operations. The
selection of an internal CEO puts in place a domino effect that impacts the entire
organization.
Positioning for future wealth creation is due, in part, to identifying, acquiring, and
implementing acquisitions. The price paid for each target firm needs to be evaluated
versus the actual benefits (e.g. cost savings) realized. Chapter 9 covers acquisitions in
depth. To determine changes in wealth, the wealth of the firm before the acquisition is
compared to the wealth created after the target is totally integrated within the acquiring
firm.
In order to engage in acquisitions, a firm may need to restructure existing
businesses. The wealth created, as a result of the acquisition, needs to be compared to
any restructuring that was needed to fund the acquisition. In general, acquisitions should
add wealth to the firm, while restructuring should not result in decreases in wealth.
The number of strategic alliances a firm has entered into can also measure future
wealth. Alliances may allow firms to generate increases in future wealth more quickly
than other modes of growth (e.g. internal development). Scale alliances allow firms to
combine similar resources to lower costs by increasing utilization of assets. Scale
alliances allow firms to combine similar resources to grow quickly12
. Scale alliances are
also less expensive than acquisitions. In general, costs may be reduced because the firm
is using the resources of partners.
278
Link alliances are formed by firms combining different resources to create new
products/services13
. Because firms are combining different resources, new sources of
wealth may be created because they generate new resources for the firm. New resources,
or new combinations of existing resources, provide new productive services, which
creates wealth for the firm14
.
The relationship between tactical and strategic issues needs to be discussed.
Tactical issues are internal firm issues such as under-producing employees or more fully
utilizing manufacturing facilities. Tactical issues will usually not have a significant
impact upon financial performance. Lower levels of management are responsible for
identifying and correcting tactical issues. This will allow time for senior management to
be focused on creating shareholder wealth from a strategic perspective. It is the
responsibility of the CEOs and senior managers to be focused on long-term wealth
creation.
Many firms do not approach decision-making in this manner. Many CEOs and
senior managers become immersed in tactical issues inside the firm. Tactical issues need
to be dealt with by the function that is most closely affected. Lower levels of
management have much greater knowledge than senior management as to the cause and
solution of tactical issues. Resolving tactical issues is one reason why these managers are
compensated. CEOs and senior management are paid to create a strategic vision and
implement that vision to achieve long-term wealth creation. An internal focus is not
oriented toward strategic issues (e.g. changes in industry structure, customers,
competition, and/or domestic or international expansion). Positioning for future wealth
cannot be done if senior level executives are focused on tactical issues. For example,
while Hewlett Packard was trying to integrate the Compaq acquisition, Dell’s strategy of
aggressively building international market positions increased shareholder wealth.
Hewlett Packard’s acquisition of Compaq resulted in decreases in shareholder wealth:
HP lost 66% of the value of its stock between the date the acquisition was announced to
the time the CEO resigned.
One quick way of creating greater wealth is to capitalize upon competitor’s
mistakes. Downsizing may be a weakness of many firms. By focusing on downsizing, as
opposed to downscoping, firms are only addressing internal cost measures. By General
Motors eliminating approximately 25,000 jobs per year, the firm is not addressing
changing consumer needs. In many cases, downsizing results in reduction of human
resources. This reduction in resources may create a situation where wealth is reduced
because of loss in intellectual capital. By reducing wealth, firms may have less revenue.
With less revenue the firm may cut additional resources. The cycle can continue
indefinitely. Downscoping, on the other hand, does address changing consumer needs
because it focuses resources on the profit generating segments of a firm’s businesses.
All elements of the scorecard are interrelated. A firm’s financial performance is a
result of meeting consumer needs over time. Employees create wealth by building long-
term relationships with customers and suppliers. By understanding how consumer needs
change over time, the firm’s senior managers can design and implement new strategies to
improve financial performance. As a result of increases in financial performance,
increases in cash flow may occur. The firm’s CEO and senior management may then
have sufficient funds to begin to generate additional sources of wealth for the firm. As
the firm successfully positions for the future, customer, shareholder and employee wealth
should all increase. It is the interconnectedness of these elements that provide for
increases in wealth creation over time.
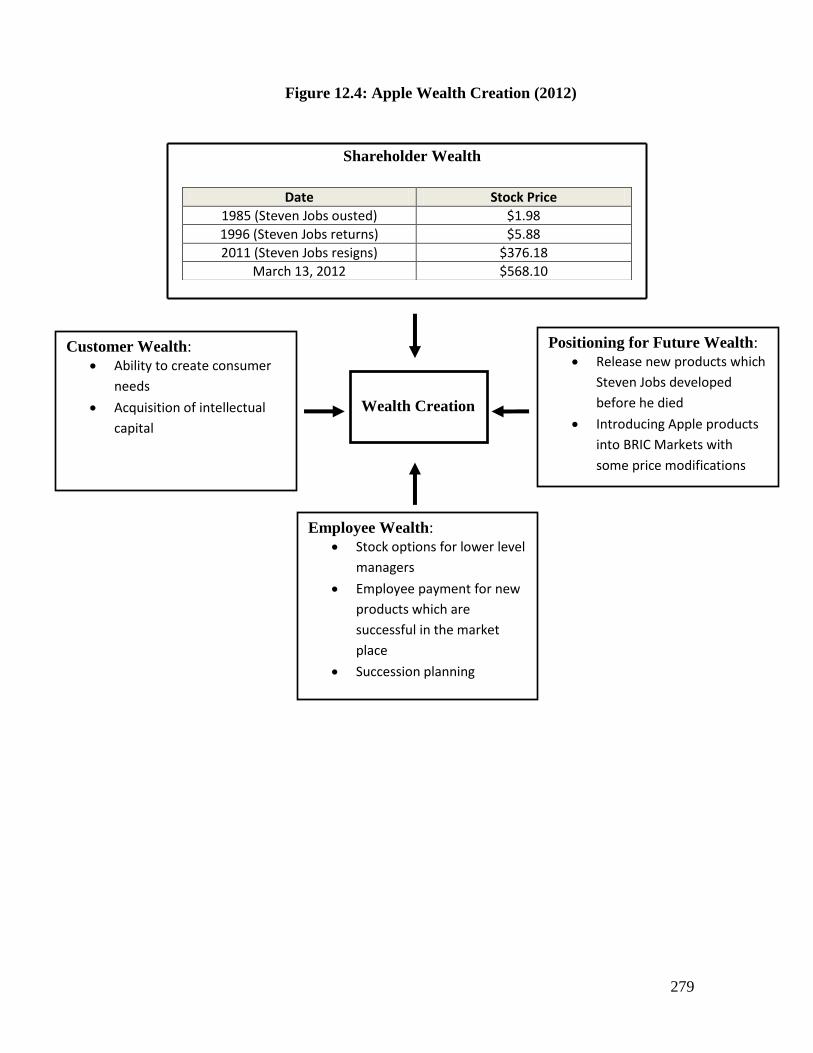
279
Figure 12.4: Apple Wealth Creation (2012)
Date Stock Price 1985 (Steven Jobs ousted) $1.98 1996 (Steven Jobs returns) $5.88 2011 (Steven Jobs resigns) $376.18
March 13, 2012 $568.10
Shareholder Wealth
Wealth Creation
Positioning for Future Wealth:
Release new products which
Steven Jobs developed
before he died
Introducing Apple products
into BRIC Markets with
some price modifications
Customer Wealth:
Ability to create consumer
needs
Acquisition of intellectual
capital
Employee Wealth:
Stock options for lower level
managers
Employee payment for new
products which are
successful in the market
place
Succession planning
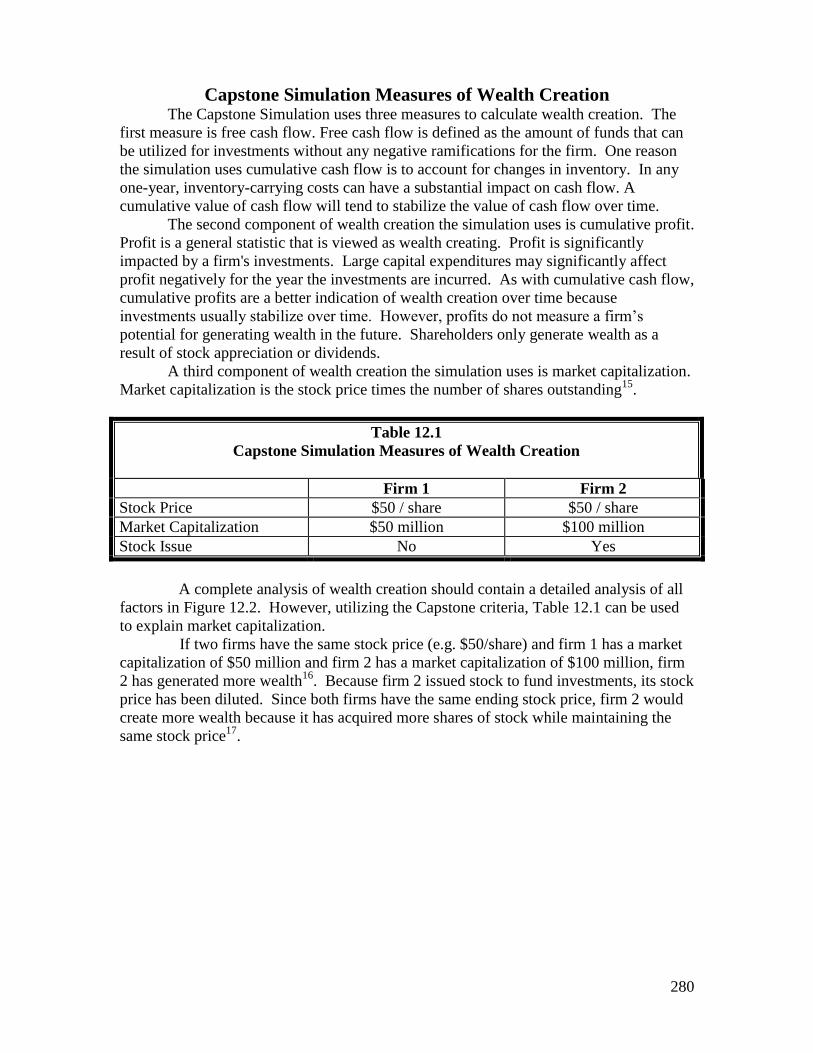
280
Capstone Simulation Measures of Wealth Creation The Capstone Simulation uses three measures to calculate wealth creation. The
first measure is free cash flow. Free cash flow is defined as the amount of funds that can
be utilized for investments without any negative ramifications for the firm. One reason
the simulation uses cumulative cash flow is to account for changes in inventory. In any
one-year, inventory-carrying costs can have a substantial impact on cash flow. A
cumulative value of cash flow will tend to stabilize the value of cash flow over time.
The second component of wealth creation the simulation uses is cumulative profit.
Profit is a general statistic that is viewed as wealth creating. Profit is significantly
impacted by a firm's investments. Large capital expenditures may significantly affect
profit negatively for the year the investments are incurred. As with cumulative cash flow,
cumulative profits are a better indication of wealth creation over time because
investments usually stabilize over time. However, profits do not measure a firm’s
potential for generating wealth in the future. Shareholders only generate wealth as a
result of stock appreciation or dividends.
A third component of wealth creation the simulation uses is market capitalization.
Market capitalization is the stock price times the number of shares outstanding15
.
Table 12.1
Capstone Simulation Measures of Wealth Creation
Firm 1 Firm 2
Stock Price $50 / share $50 / share
Market Capitalization $50 million $100 million
Stock Issue No Yes
A complete analysis of wealth creation should contain a detailed analysis of all
factors in Figure 12.2. However, utilizing the Capstone criteria, Table 12.1 can be used
to explain market capitalization.
If two firms have the same stock price (e.g. $50/share) and firm 1 has a market
capitalization of $50 million and firm 2 has a market capitalization of $100 million, firm
2 has generated more wealth16
. Because firm 2 issued stock to fund investments, its stock
price has been diluted. Since both firms have the same ending stock price, firm 2 would
create more wealth because it has acquired more shares of stock while maintaining the
same stock price17
.
281
Discussion Questions
1. What are the limitations of using only financial ratios to measure wealth creation?
2. Explain the concept of the balanced scorecard.
3. Why is employee wealth creation important?
4. What is economic value added (EVA)? How does it differ from market value
added (MVA)?
5. Explain the difference between liquidity, asset management, debt management,
and profitability ratios.
6. Explain “positioning for the future.”
7. Explain how the Capstone Simulation measures wealth creation.
282
References
1. Norton, R. 2005. CFO thought leaders. Booz, Allen, Hamilton. New York, NY.
2. Penrose, E. 1959. A theory of the growth of the firm. John Wiley. New York, NY.
3. Barney, J. 1991. Firm resources and sustained competitive advantage. Journal of
Management. 17: 99-120.
4. Peteraf, M. and Bergen, M. 2003. Scanning dynamic competitive landscapes: a
market-based and resource-based framework. Strategic Management Journal. 24:
1024-1042.
5. Peter, J. and Olson, J., 2005. Consumer behavior and marketing strategy. McGraw-
Hill Irwin. New York, NY.
6. Ibid
7. Norton. CFO thought leaders.
8. Ibid
9. Brealey, R., Myers S., and Marcus, A. 2004. Fundamentals of corporate finance.
McGraw-Hill Irwin. New York, NY.
10. Leach, J. and Melicher, R. 2003. Entrepreneurial finance. Thomson. Mason, OH.
11. Ibid
12. Dussauge, P., Garrette, B., and Mitchell, W. 2004. Asymmetric performance: the
market share impact of scale and link alliances in the global auto industry. Strategic
Management Journal.25: 701-711.
13. Ibid
14. Penrose. A theory of the growth of the firm.
15. _____ 2011. Capstone simulation.
16. Ibid
17. Ibid

283
Chapter 13
Conducting Case Analysis: An Exercise in Wealth
Creation
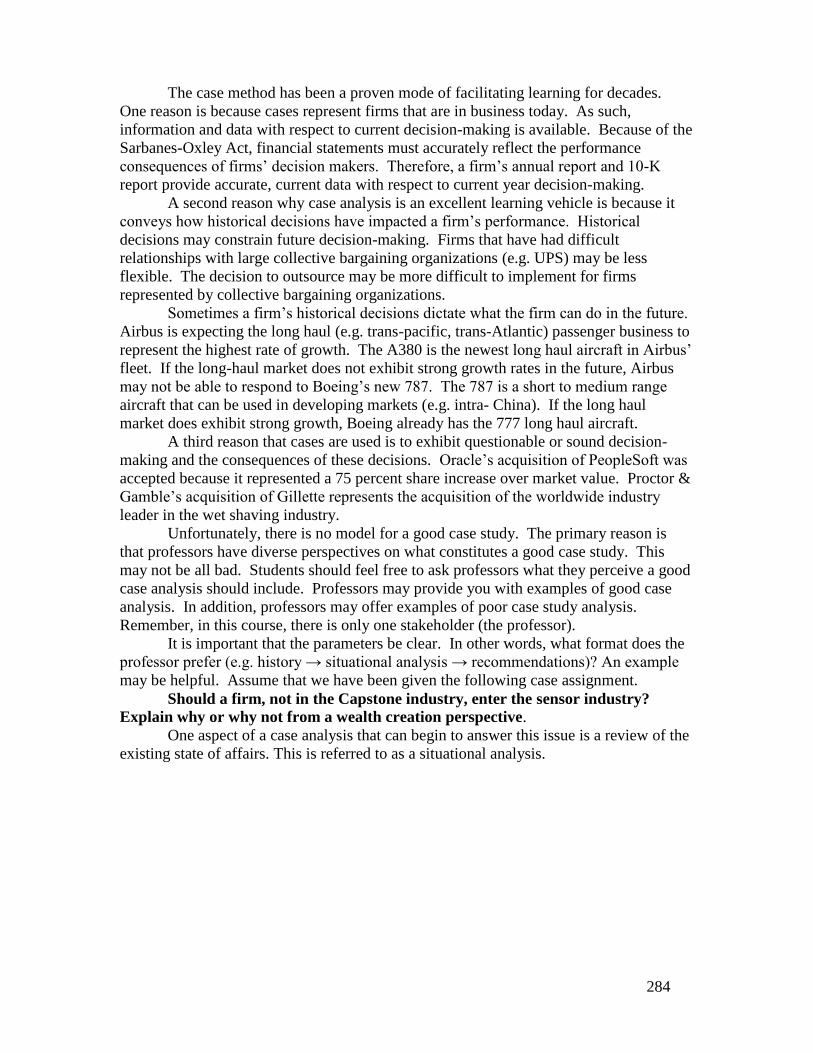
284
The case method has been a proven mode of facilitating learning for decades.
One reason is because cases represent firms that are in business today. As such,
information and data with respect to current decision-making is available. Because of the
Sarbanes-Oxley Act, financial statements must accurately reflect the performance
consequences of firms’ decision makers. Therefore, a firm’s annual report and 10-K
report provide accurate, current data with respect to current year decision-making.
A second reason why case analysis is an excellent learning vehicle is because it
conveys how historical decisions have impacted a firm’s performance. Historical
decisions may constrain future decision-making. Firms that have had difficult
relationships with large collective bargaining organizations (e.g. UPS) may be less
flexible. The decision to outsource may be more difficult to implement for firms
represented by collective bargaining organizations.
Sometimes a firm’s historical decisions dictate what the firm can do in the future.
Airbus is expecting the long haul (e.g. trans-pacific, trans-Atlantic) passenger business to
represent the highest rate of growth. The A380 is the newest long haul aircraft in Airbus’
fleet. If the long-haul market does not exhibit strong growth rates in the future, Airbus
may not be able to respond to Boeing’s new 787. The 787 is a short to medium range
aircraft that can be used in developing markets (e.g. intra- China). If the long haul
market does exhibit strong growth, Boeing already has the 777 long haul aircraft.
A third reason that cases are used is to exhibit questionable or sound decision-
making and the consequences of these decisions. Oracle’s acquisition of PeopleSoft was
accepted because it represented a 75 percent share increase over market value. Proctor &
Gamble’s acquisition of Gillette represents the acquisition of the worldwide industry
leader in the wet shaving industry.
Unfortunately, there is no model for a good case study. The primary reason is
that professors have diverse perspectives on what constitutes a good case study. This
may not be all bad. Students should feel free to ask professors what they perceive a good
case analysis should include. Professors may provide you with examples of good case
analysis. In addition, professors may offer examples of poor case study analysis.
Remember, in this course, there is only one stakeholder (the professor).
It is important that the parameters be clear. In other words, what format does the
professor prefer (e.g. history → situational analysis → recommendations)? An example
may be helpful. Assume that we have been given the following case assignment.
Should a firm, not in the Capstone industry, enter the sensor industry?
Explain why or why not from a wealth creation perspective.
One aspect of a case analysis that can begin to answer this issue is a review of the
existing state of affairs. This is referred to as a situational analysis.
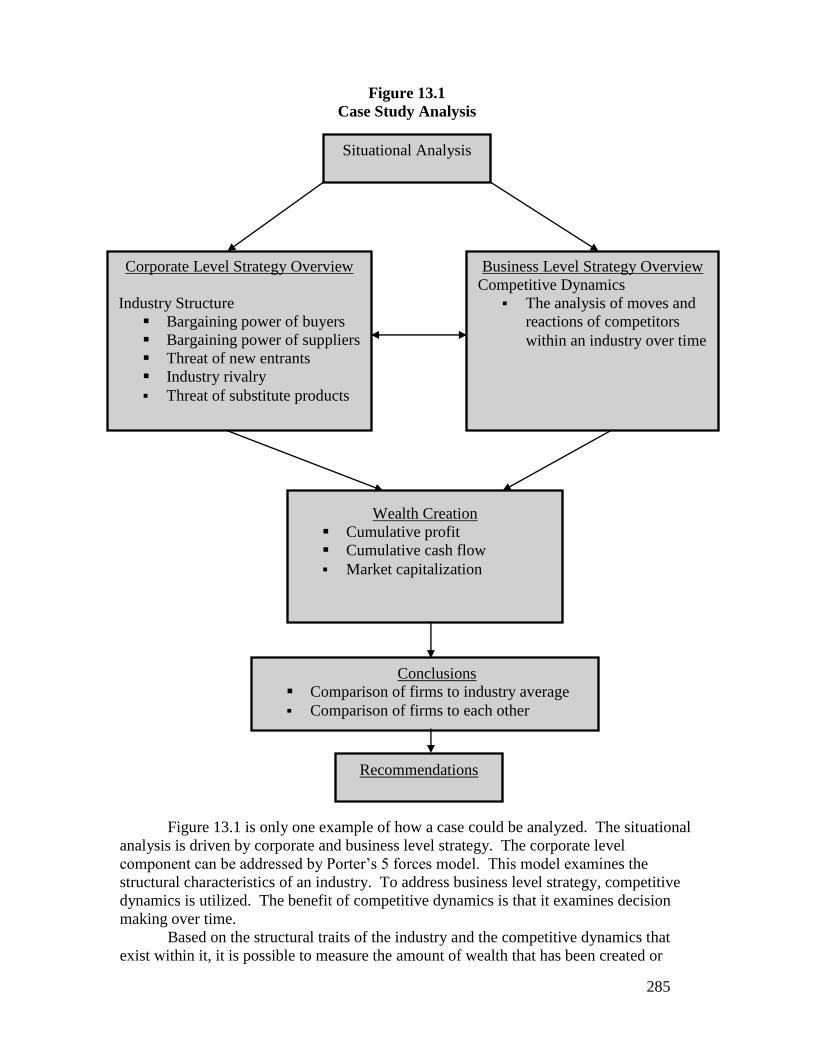
285
Figure 13.1
Case Study Analysis
Figure 13.1 is only one example of how a case could be analyzed. The situational
analysis is driven by corporate and business level strategy. The corporate level
component can be addressed by Porter’s 5 forces model. This model examines the
structural characteristics of an industry. To address business level strategy, competitive
dynamics is utilized. The benefit of competitive dynamics is that it examines decision
making over time.
Based on the structural traits of the industry and the competitive dynamics that
exist within it, it is possible to measure the amount of wealth that has been created or
Situational Analysis
Corporate Level Strategy Overview
Industry Structure
Bargaining power of buyers
Bargaining power of suppliers
Threat of new entrants
Industry rivalry
Threat of substitute products
Business Level Strategy Overview
Competitive Dynamics
The analysis of moves and
reactions of competitors
within an industry over time
Conclusions
Comparison of firms to industry average
Comparison of firms to each other
Wealth Creation
Cumulative profit
Cumulative cash flow
Market capitalization
Recommendations
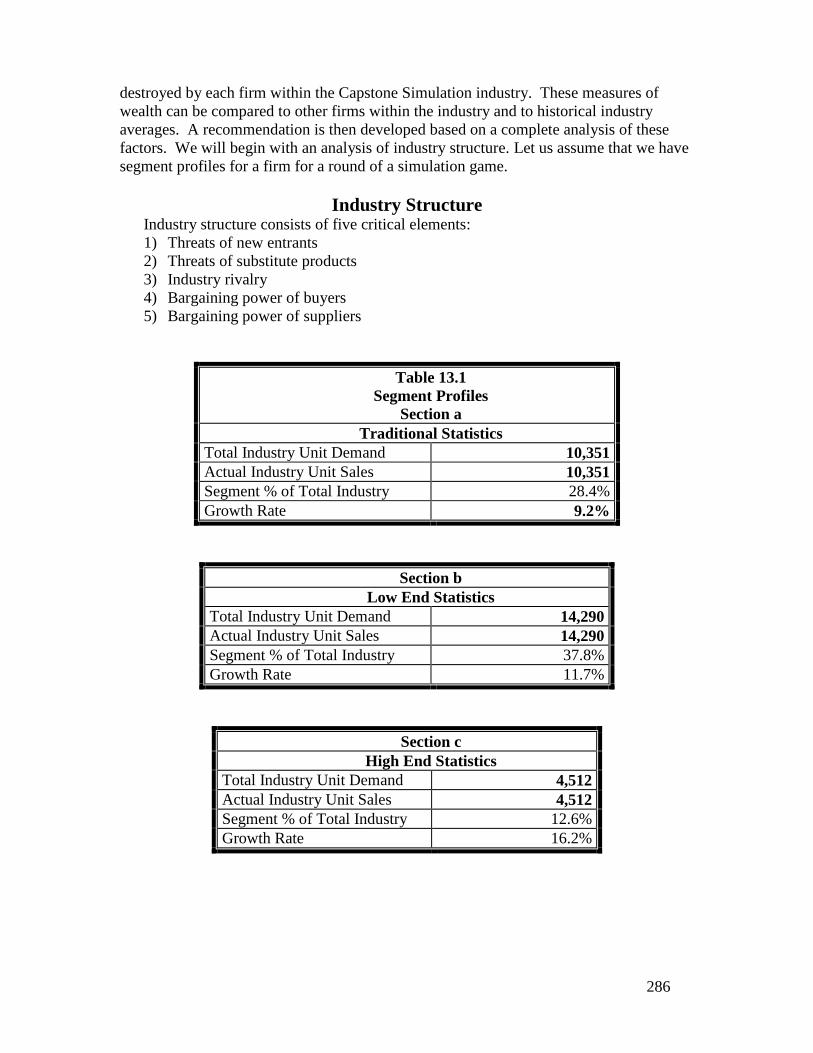
286
destroyed by each firm within the Capstone Simulation industry. These measures of
wealth can be compared to other firms within the industry and to historical industry
averages. A recommendation is then developed based on a complete analysis of these
factors. We will begin with an analysis of industry structure. Let us assume that we have
segment profiles for a firm for a round of a simulation game.
Industry Structure Industry structure consists of five critical elements:
1) Threats of new entrants
2) Threats of substitute products
3) Industry rivalry
4) Bargaining power of buyers
5) Bargaining power of suppliers
Table 13.1
Segment Profiles
Section a
Traditional Statistics
Total Industry Unit Demand 10,351
Actual Industry Unit Sales 10,351
Segment % of Total Industry 28.4%
Growth Rate 9.2%
Section b
Low End Statistics
Total Industry Unit Demand 14,290
Actual Industry Unit Sales 14,290
Segment % of Total Industry 37.8%
Growth Rate 11.7%
Section c
High End Statistics
Total Industry Unit Demand 4,512
Actual Industry Unit Sales 4,512
Segment % of Total Industry 12.6%
Growth Rate 16.2%
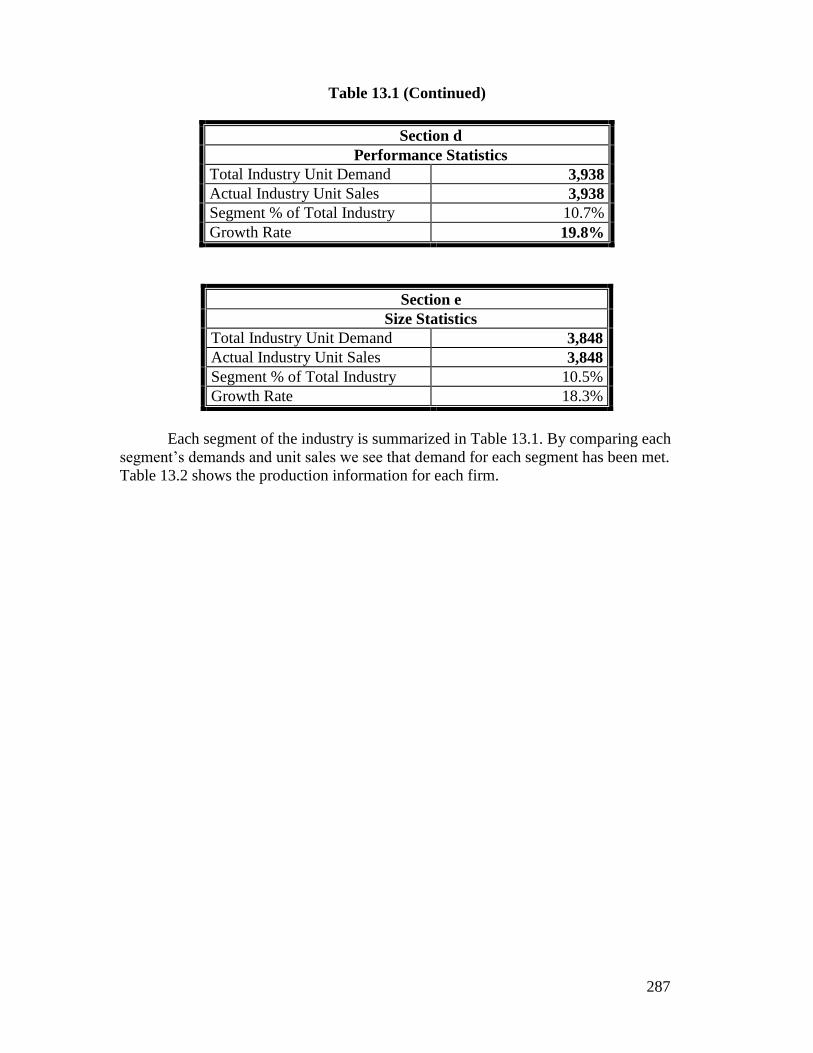
287
Table 13.1 (Continued)
Section d
Performance Statistics
Total Industry Unit Demand 3,938
Actual Industry Unit Sales 3,938
Segment % of Total Industry 10.7%
Growth Rate 19.8%
Section e
Size Statistics
Total Industry Unit Demand 3,848
Actual Industry Unit Sales 3,848
Segment % of Total Industry 10.5%
Growth Rate 18.3%
Each segment of the industry is summarized in Table 13.1. By comparing each
segment’s demands and unit sales we see that demand for each segment has been met.
Table 13.2 shows the production information for each firm.
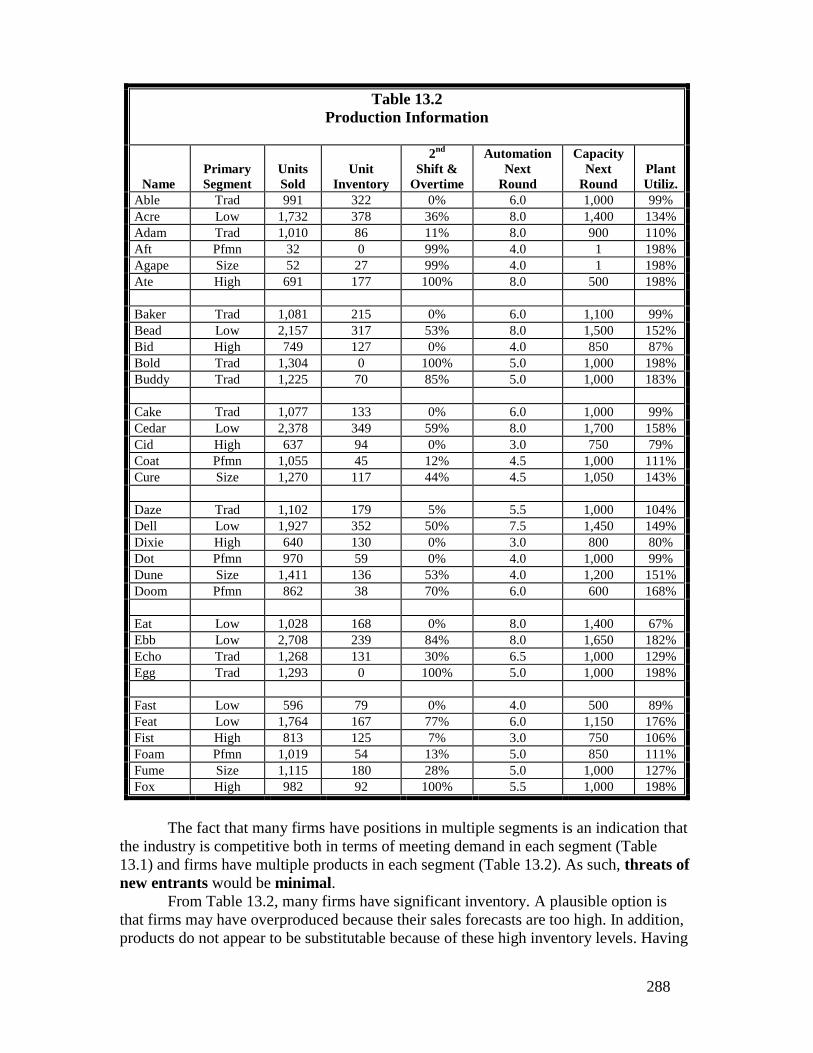
288
Table 13.2
Production Information
Name
Primary
Segment
Units
Sold
Unit
Inventory
2nd
Shift &
Overtime
Automation
Next
Round
Capacity
Next
Round
Plant
Utiliz.
Able Trad 991 322 0% 6.0 1,000 99%
Acre Low 1,732 378 36% 8.0 1,400 134%
Adam Trad 1,010 86 11% 8.0 900 110%
Aft Pfmn 32 0 99% 4.0 1 198%
Agape Size 52 27 99% 4.0 1 198%
Ate High 691 177 100% 8.0 500 198%
Baker Trad 1,081 215 0% 6.0 1,100 99%
Bead Low 2,157 317 53% 8.0 1,500 152%
Bid High 749 127 0% 4.0 850 87%
Bold Trad 1,304 0 100% 5.0 1,000 198%
Buddy Trad 1,225 70 85% 5.0 1,000 183%
Cake Trad 1,077 133 0% 6.0 1,000 99%
Cedar Low 2,378 349 59% 8.0 1,700 158%
Cid High 637 94 0% 3.0 750 79%
Coat Pfmn 1,055 45 12% 4.5 1,000 111%
Cure Size 1,270 117 44% 4.5 1,050 143%
Daze Trad 1,102 179 5% 5.5 1,000 104%
Dell Low 1,927 352 50% 7.5 1,450 149%
Dixie High 640 130 0% 3.0 800 80%
Dot Pfmn 970 59 0% 4.0 1,000 99%
Dune Size 1,411 136 53% 4.0 1,200 151%
Doom Pfmn 862 38 70% 6.0 600 168%
Eat Low 1,028 168 0% 8.0 1,400 67%
Ebb Low 2,708 239 84% 8.0 1,650 182%
Echo Trad 1,268 131 30% 6.5 1,000 129%
Egg Trad 1,293 0 100% 5.0 1,000 198%
Fast Low 596 79 0% 4.0 500 89%
Feat Low 1,764 167 77% 6.0 1,150 176%
Fist High 813 125 7% 3.0 750 106%
Foam Pfmn 1,019 54 13% 5.0 850 111%
Fume Size 1,115 180 28% 5.0 1,000 127%
Fox High 982 92 100% 5.5 1,000 198%
The fact that many firms have positions in multiple segments is an indication that
the industry is competitive both in terms of meeting demand in each segment (Table
13.1) and firms have multiple products in each segment (Table 13.2). As such, threats of
new entrants would be minimal.
From Table 13.2, many firms have significant inventory. A plausible option is
that firms may have overproduced because their sales forecasts are too high. In addition,
products do not appear to be substitutable because of these high inventory levels. Having
289
varying levels of inventory for products within a market segment is an indication that
products are not substitutable.
Based upon the significant inventory levels, it would appear that firms do not
have an understanding of key buying criteria on a segment by segment basis. Since the
firm is not meeting key buying criteria, customers have no choice but to buy whatever
products are available. Therefore, bargaining power of buyers is low.
Table 13.2 shows that all firms are producing in excess first shift plant capacity
(plant utilization) on most production lines. Some firms are incurring substantial
overtime. Firms may be able to reduce costs by adding a 2nd
shift. This issue will need to
be reviewed with the firms’ collective bargaining organization (e.g. unions). Based on
these factors, it would appear that firms are not having problems sourcing raw materials.
The above factors would lead to the conclusion that bargaining power of suppliers is
moderate. The degree of rivalry in this industry is quite competitive. Firms are not meeting
the needs of the customer. However, as can be seen from Table 13.2, virtually all firms
are running their production lines with substantial overtime. Firms are competing
aggressively with each other: demand for each segment is being met (Table 13.1). Even
with significant growth rates in the high end (16.2 percent), performance (19.8 percent),
and size segment (18.3 percent), firms are still running significant overtime. Most firms
have substantial capacity in the traditional and low end products (Table 13.2). In addition,
it can be seen from Table 13.2, many firms have high automation levels on their low end
product lines. In addition, firms (Chester, Digby, and Ferris) have significant capacity in
performance and size markets. Further, Baldwin and Erie have eliminated their
performance and size products. Collectively, all of these decisions lead us to the
conclusion that the industry rivalry is high.
Competitive Dynamics for the Capstone Simulation From Chapter 4, Business Level Strategy, it is important to understand how firms
have grown. A crucial aspect of growth is competitive dynamics. Competitive dynamics
addresses firms’ actions and reactions to competitors’ actions and reactions.
Competitors’ actions and reactions can be examined from an analysis of production.
Table 13.2 is a complete review of the production summary for all firms.
The production summary identifies opportunities that a new competitor may be
able to capitalize upon. Refer to the 2nd
Shift & Overtime column. Bead, Cedar, Dell,
and Ebb are generating substantial overtime charges. Firms are under-producing because
their sales forecasts are too conservative. Most firms are generating significant levels of
overtime on many production lines. Since firms have ending inventory they should not
expand capacity.
All firms, with the exception of Ferris, have significant automation of their low
end products. Higher levels of automation increase efficiencies and lower costs.
Investing in TQM initiatives is another way of reducing costs and reducing R&D cycle
time. In general, firms may not be making enough investments to reduce costs of
production (e.g. additional plant capacity, automation).
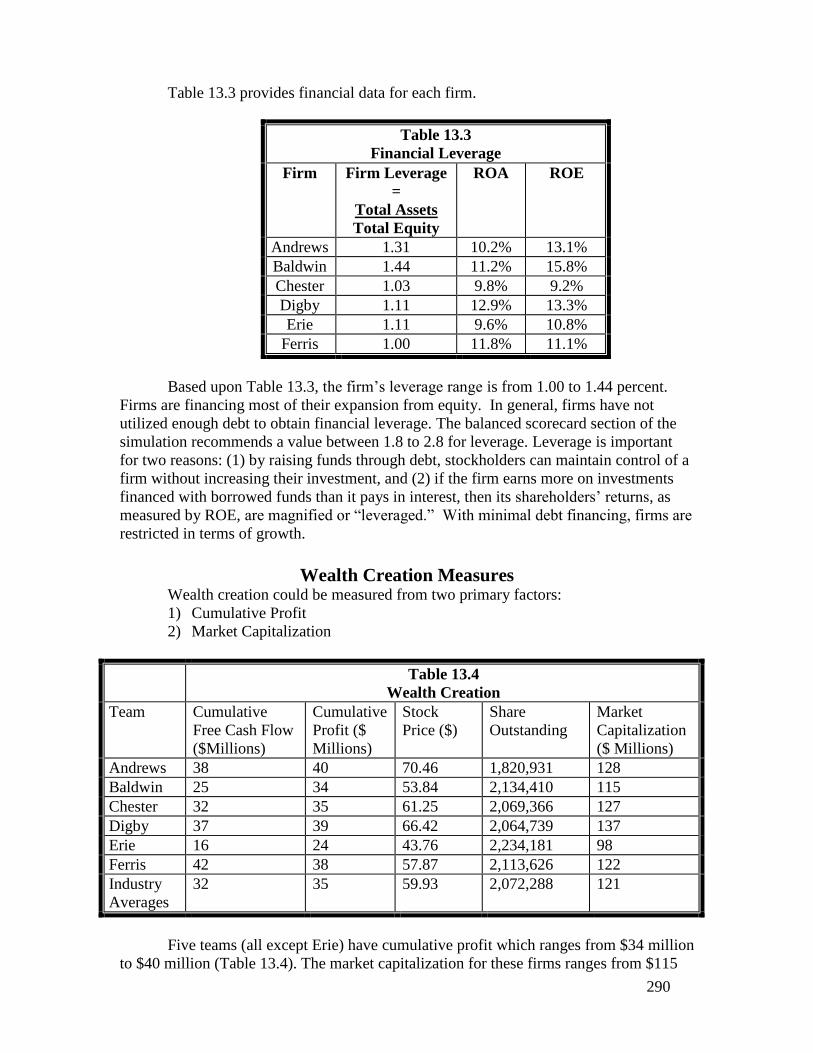
290
Table 13.3 provides financial data for each firm.
Based upon Table 13.3, the firm’s leverage range is from 1.00 to 1.44 percent.
Firms are financing most of their expansion from equity. In general, firms have not
utilized enough debt to obtain financial leverage. The balanced scorecard section of the
simulation recommends a value between 1.8 to 2.8 for leverage. Leverage is important
for two reasons: (1) by raising funds through debt, stockholders can maintain control of a
firm without increasing their investment, and (2) if the firm earns more on investments
financed with borrowed funds than it pays in interest, then its shareholders’ returns, as
measured by ROE, are magnified or “leveraged.” With minimal debt financing, firms are
restricted in terms of growth.
Wealth Creation Measures Wealth creation could be measured from two primary factors:
1) Cumulative Profit
2) Market Capitalization
Table 13.4
Wealth Creation
Team Cumulative
Free Cash Flow
($Millions)
Cumulative
Profit ($
Millions)
Stock
Price ($)
Share
Outstanding
Market
Capitalization
($ Millions)
Andrews 38 40 70.46 1,820,931 128
Baldwin 25 34 53.84 2,134,410 115
Chester 32 35 61.25 2,069,366 127
Digby 37 39 66.42 2,064,739 137
Erie 16 24 43.76 2,234,181 98
Ferris 42 38 57.87 2,113,626 122
Industry
Averages
32 35 59.93 2,072,288 121
Five teams (all except Erie) have cumulative profit which ranges from $34 million
to $40 million (Table 13.4). The market capitalization for these firms ranges from $115
Table 13.3
Financial Leverage
Firm Firm Leverage
=
Total Assets
Total Equity
ROA ROE
Andrews 1.31 10.2% 13.1%
Baldwin 1.44 11.2% 15.8%
Chester 1.03 9.8% 9.2%
Digby 1.11 12.9% 13.3%
Erie 1.11 9.6% 10.8%
Ferris 1.00 11.8% 11.1%
291
million to $137 million. Erie’s low cumulative profit ($24 million) and market
capitalization of $98, put it in position to be exploited by other firms. In addition, Erie
has the least ($16 million) free cash flow. This restricts its ability to increase its value.
Andrews and Ferris have much higher levels of free cash flow for investment purposes.
Conclusion Figure 13.2 illustrates the results for this industry at the end of Round 8. From a
corporate level strategy perspective the industry appears to be in the growth stage. The
industry structure will permit new entrants. As far as competitive dynamics are
concerned, firms do not appear to have well-developed strategies to maximize
performance. Issues such as automation to reduce costs have not been implemented by
most teams. Each teams’ forecasting is not accurate and results in significant inventory
levels. These mistakes are amplified by examining the wealth creation statistics. Firms
are performing below industry averages on most factors (e.g. cumulative profitability).
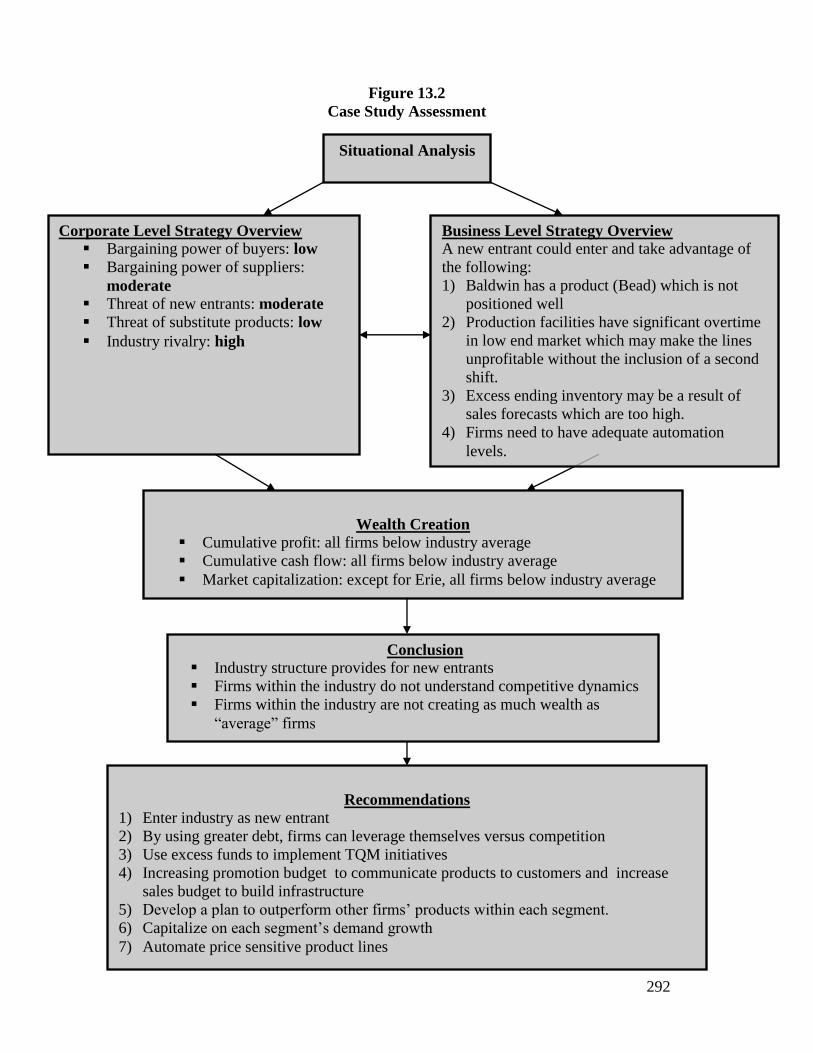
292
Figure 13.2
Case Study Assessment
Situational Analysis
Corporate Level Strategy Overview
Bargaining power of buyers: low
Bargaining power of suppliers:
moderate Threat of new entrants: moderate
Threat of substitute products: low
Industry rivalry: high
Business Level Strategy Overview
A new entrant could enter and take advantage of
the following:
1) Baldwin has a product (Bead) which is not
positioned well
2) Production facilities have significant overtime
in low end market which may make the lines
unprofitable without the inclusion of a second
shift.
3) Excess ending inventory may be a result of
sales forecasts which are too high.
4) Firms need to have adequate automation
levels.
Conclusion
Industry structure provides for new entrants
Firms within the industry do not understand competitive dynamics
Firms within the industry are not creating as much wealth as
“average” firms
Wealth Creation
Cumulative profit: all firms below industry average
Cumulative cash flow: all firms below industry average
Market capitalization: except for Erie, all firms below industry average
Recommendations
1) Enter industry as new entrant
2) By using greater debt, firms can leverage themselves versus competition
3) Use excess funds to implement TQM initiatives
4) Increasing promotion budget to communicate products to customers and increase
sales budget to build infrastructure
5) Develop a plan to outperform other firms’ products within each segment.
6) Capitalize on each segment’s demand growth
7) Automate price sensitive product lines

293
Recommendations This review of corporate level strategy, competitive dynamics, and wealth
creation leads to the conclusion that a firm should enter this industry and could be quite
successful. Higher levels of financial leverage will allow the new firm(s) to grow at
much faster rates than competitors. More accurate sales forecasting will allow the new
entrant to capitalize on unmet demand. Investing significantly in TQM initiatives will
create efficiencies and/or reduce R&D cycle time. This new entrant could develop a
strategy for achieving a leadership position within each segment.

294

295
Chapter 14
Comp-XM®
296
Comp-XM: Example 1 Up until this point, many of your decisions with respect to the Capstone
simulation have been made in groups by committee. Comp-XM provides an opportunity
for you to make all the decisions over a several year time window. I will give you some
pointers about what to look for and then we will go through a round of Comp-XM
together.
The first point concerns scale of operation. If you have market segments that are
price sensitive (such as the low end in Capstone), it is important to increase scale of
operations. Investments in plant improvement provide for economies of scale, which will
tend to reduce costs. As you invest in plant improvement, additional economies of scale
will result. There is another way of obtaining efficiencies in price sensitive markets.
Automation will tend to increase efficiency and provide for additional economies
of scale. However, you must be careful with automation. Automation makes it more
difficult to reposition products because automation does not allow for flexible
manufacturing processes. The following approach may be helpful. Increase plant capacity
first and then automate in price sensitive market segments. As you invest in plant
improvement, you can reposition products easier than if you had automated first.
Efficiencies can also be obtained as a result of some of the TQM initiatives: (1)
continuous process improvements will reduce both material and labor costs, (2) JIT will
reduce administrative costs, (3) quality initiative training will reduce labor costs, (4)
benchmarking will reduce administration and inventory carrying costs, (5) concurrent
engineering will reduce material and labor costs. Positioning is also a crucial element.
While Comp-XM uses the same key buying criteria as Capstone, the weights on
each criterion are different. For example, the thrift market segment has 55 percent of the
customer buying criteria as price. This should be treated as a cost leadership segment.
The elite segment should be treated as a differentiation segment because 34 percent of the
customer buying criteria is based upon an age = 0. With age = 0, it is necessary to invest
in new product development. Positioning accounts for 22 percent of the customer buying
criteria. The key to positioning is to have your product positioned superior to competitors
on the customer buying criteria.
Another key element is forecasting. The basic trade-off is between running out of
cash and running out of inventory. Forecasting too high leads to inventory carrying costs
and forecasting too low means not obtaining sales that would have been available if
forecasting had been more optimistic. Because of this trade-off, it is important to forecast
a range and then adjust the estimates based upon how well your products meet the
customer buying criteria.
As in capstone, forecasts are obtained by taking the segment demand and
multiplying by the segment growth rate. If you divide by 6 (assuming there are 6 firms in
the segment), you are estimating that you will gain 1/6 of the segment. Let us use an
example.
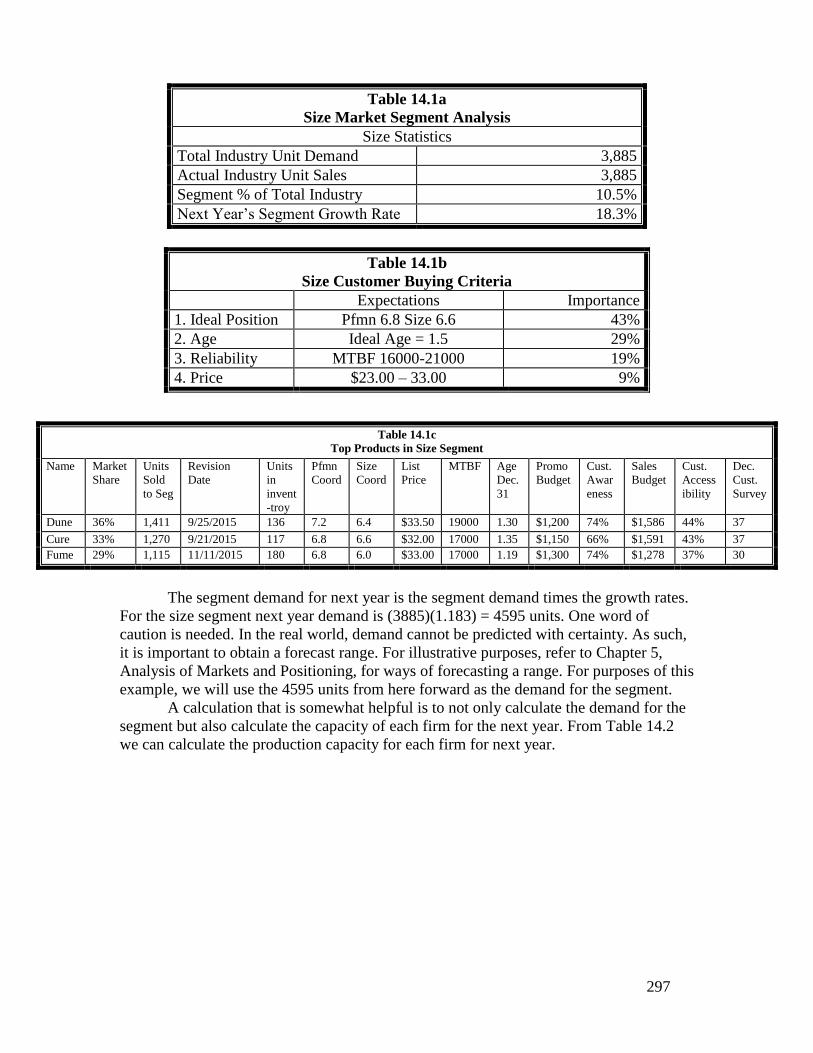
297
Table 14.1a
Size Market Segment Analysis
Size Statistics
Total Industry Unit Demand 3,885
Actual Industry Unit Sales 3,885
Segment % of Total Industry 10.5%
Next Year’s Segment Growth Rate 18.3%
Table 14.1b
Size Customer Buying Criteria
Expectations Importance
1. Ideal Position Pfmn 6.8 Size 6.6 43%
2. Age Ideal Age = 1.5 29%
3. Reliability MTBF 16000-21000 19%
4. Price $23.00 – 33.00 9%
The segment demand for next year is the segment demand times the growth rates.
For the size segment next year demand is (3885)(1.183) = 4595 units. One word of
caution is needed. In the real world, demand cannot be predicted with certainty. As such,
it is important to obtain a forecast range. For illustrative purposes, refer to Chapter 5,
Analysis of Markets and Positioning, for ways of forecasting a range. For purposes of this
example, we will use the 4595 units from here forward as the demand for the segment.
A calculation that is somewhat helpful is to not only calculate the demand for the
segment but also calculate the capacity of each firm for the next year. From Table 14.2
we can calculate the production capacity for each firm for next year.
Table 14.1c
Top Products in Size Segment
Name Market
Share
Units
Sold
to Seg
Revision
Date
Units
in
invent
-troy
Pfmn
Coord
Size
Coord
List
Price
MTBF Age
Dec.
31
Promo
Budget
Cust.
Awar
eness
Sales
Budget
Cust.
Access
ibility
Dec.
Cust.
Survey
Dune 36% 1,411 9/25/2015 136 7.2 6.4 $33.50 19000 1.30 $1,200 74% $1,586 44% 37
Cure 33% 1,270 9/21/2015 117 6.8 6.6 $32.00 17000 1.35 $1,150 66% $1,591 43% 37
Fume 29% 1,115 11/11/2015 180 6.8 6.0 $33.00 17000 1.19 $1,300 74% $1,278 37% 30
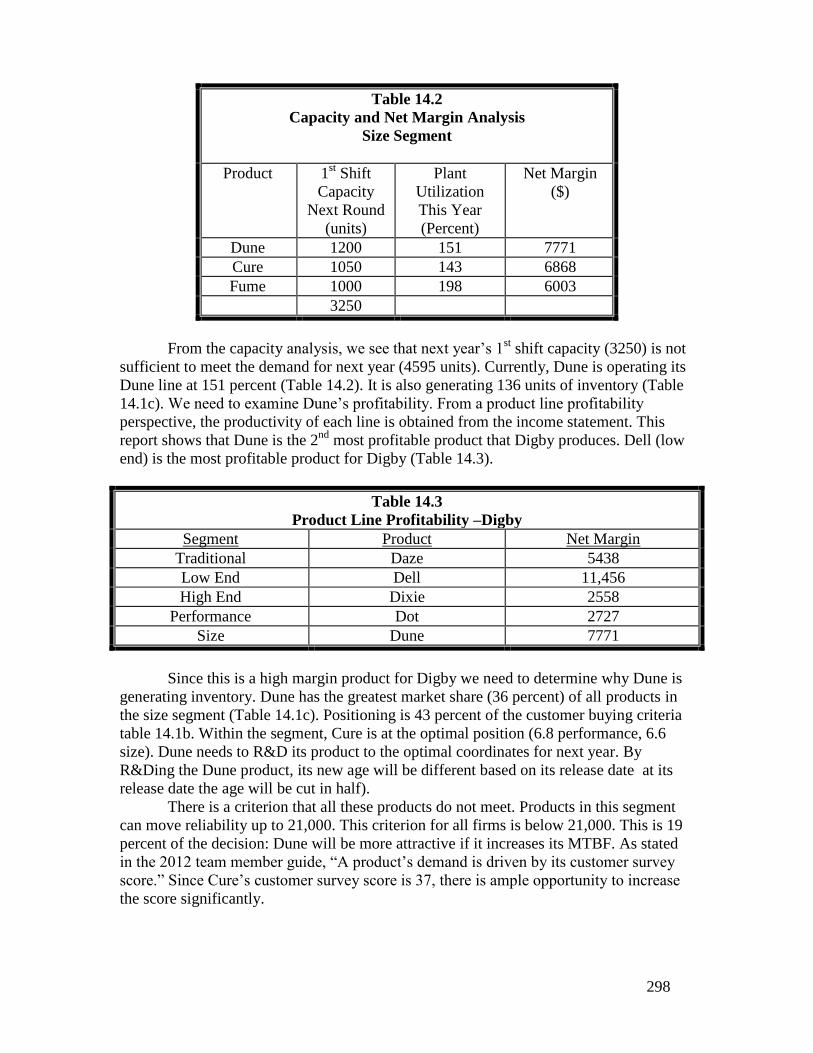
298
Table 14.2
Capacity and Net Margin Analysis
Size Segment
Product 1st Shift
Capacity
Next Round
(units)
Plant
Utilization
This Year
(Percent)
Net Margin
($)
Dune 1200 151 7771
Cure 1050 143 6868
Fume 1000 198 6003
3250
From the capacity analysis, we see that next year’s 1st shift capacity (3250) is not
sufficient to meet the demand for next year (4595 units). Currently, Dune is operating its
Dune line at 151 percent (Table 14.2). It is also generating 136 units of inventory (Table
14.1c). We need to examine Dune’s profitability. From a product line profitability
perspective, the productivity of each line is obtained from the income statement. This
report shows that Dune is the 2nd
most profitable product that Digby produces. Dell (low
end) is the most profitable product for Digby (Table 14.3).
Table 14.3
Product Line Profitability –Digby
Segment Product Net Margin
Traditional Daze 5438
Low End Dell 11,456
High End Dixie 2558
Performance Dot 2727
Size Dune 7771
Since this is a high margin product for Digby we need to determine why Dune is
generating inventory. Dune has the greatest market share (36 percent) of all products in
the size segment (Table 14.1c). Positioning is 43 percent of the customer buying criteria
table 14.1b. Within the segment, Cure is at the optimal position (6.8 performance, 6.6
size). Dune needs to R&D its product to the optimal coordinates for next year. By
R&Ding the Dune product, its new age will be different based on its release date at its
release date the age will be cut in half).
There is a criterion that all these products do not meet. Products in this segment
can move reliability up to 21,000. This criterion for all firms is below 21,000. This is 19
percent of the decision: Dune will be more attractive if it increases its MTBF. As stated
in the 2012 team member guide, “A product’s demand is driven by its customer survey
score.” Since Cure’s customer survey score is 37, there is ample opportunity to increase
the score significantly.
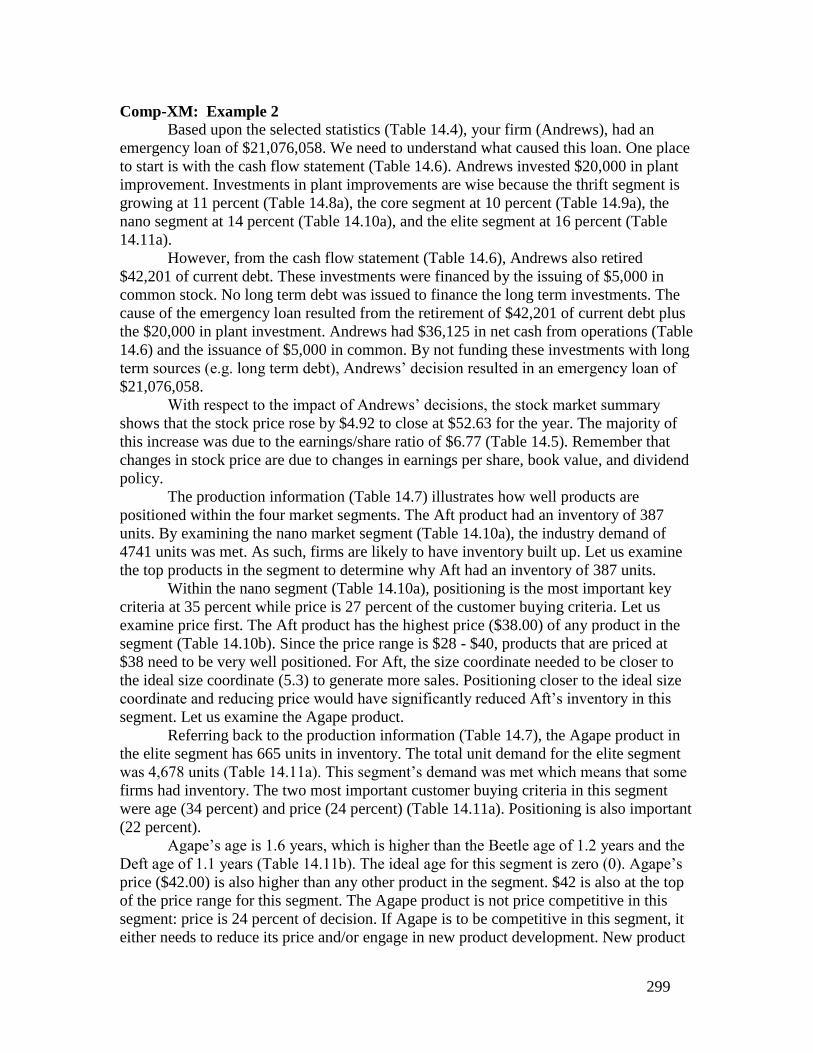
299
Comp-XM: Example 2
Based upon the selected statistics (Table 14.4), your firm (Andrews), had an
emergency loan of $21,076,058. We need to understand what caused this loan. One place
to start is with the cash flow statement (Table 14.6). Andrews invested $20,000 in plant
improvement. Investments in plant improvements are wise because the thrift segment is
growing at 11 percent (Table 14.8a), the core segment at 10 percent (Table 14.9a), the
nano segment at 14 percent (Table 14.10a), and the elite segment at 16 percent (Table
14.11a).
However, from the cash flow statement (Table 14.6), Andrews also retired
$42,201 of current debt. These investments were financed by the issuing of $5,000 in
common stock. No long term debt was issued to finance the long term investments. The
cause of the emergency loan resulted from the retirement of $42,201 of current debt plus
the $20,000 in plant investment. Andrews had $36,125 in net cash from operations (Table
14.6) and the issuance of $5,000 in common. By not funding these investments with long
term sources (e.g. long term debt), Andrews’ decision resulted in an emergency loan of
$21,076,058.
With respect to the impact of Andrews’ decisions, the stock market summary
shows that the stock price rose by $4.92 to close at $52.63 for the year. The majority of
this increase was due to the earnings/share ratio of $6.77 (Table 14.5). Remember that
changes in stock price are due to changes in earnings per share, book value, and dividend
policy.
The production information (Table 14.7) illustrates how well products are
positioned within the four market segments. The Aft product had an inventory of 387
units. By examining the nano market segment (Table 14.10a), the industry demand of
4741 units was met. As such, firms are likely to have inventory built up. Let us examine
the top products in the segment to determine why Aft had an inventory of 387 units.
Within the nano segment (Table 14.10a), positioning is the most important key
criteria at 35 percent while price is 27 percent of the customer buying criteria. Let us
examine price first. The Aft product has the highest price ($38.00) of any product in the
segment (Table 14.10b). Since the price range is $28 - $40, products that are priced at
$38 need to be very well positioned. For Aft, the size coordinate needed to be closer to
the ideal size coordinate (5.3) to generate more sales. Positioning closer to the ideal size
coordinate and reducing price would have significantly reduced Aft’s inventory in this
segment. Let us examine the Agape product.
Referring back to the production information (Table 14.7), the Agape product in
the elite segment has 665 units in inventory. The total unit demand for the elite segment
was 4,678 units (Table 14.11a). This segment’s demand was met which means that some
firms had inventory. The two most important customer buying criteria in this segment
were age (34 percent) and price (24 percent) (Table 14.11a). Positioning is also important
(22 percent).
Agape’s age is 1.6 years, which is higher than the Beetle age of 1.2 years and the
Deft age of 1.1 years (Table 14.11b). The ideal age for this segment is zero (0). Agape’s
price ($42.00) is also higher than any other product in the segment. $42 is also at the top
of the price range for this segment. The Agape product is not price competitive in this
segment: price is 24 percent of decision. If Agape is to be competitive in this segment, it
either needs to reduce its price and/or engage in new product development. New product
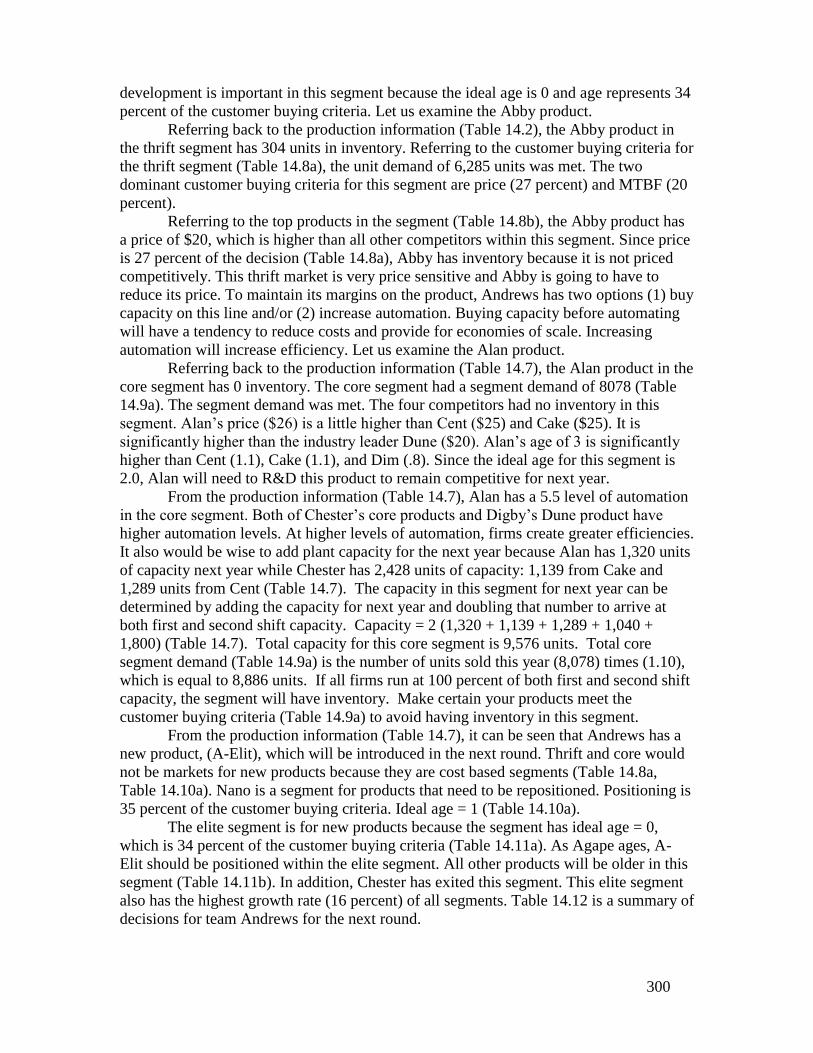
300
development is important in this segment because the ideal age is 0 and age represents 34
percent of the customer buying criteria. Let us examine the Abby product.
Referring back to the production information (Table 14.2), the Abby product in
the thrift segment has 304 units in inventory. Referring to the customer buying criteria for
the thrift segment (Table 14.8a), the unit demand of 6,285 units was met. The two
dominant customer buying criteria for this segment are price (27 percent) and MTBF (20
percent).
Referring to the top products in the segment (Table 14.8b), the Abby product has
a price of $20, which is higher than all other competitors within this segment. Since price
is 27 percent of the decision (Table 14.8a), Abby has inventory because it is not priced
competitively. This thrift market is very price sensitive and Abby is going to have to
reduce its price. To maintain its margins on the product, Andrews has two options (1) buy
capacity on this line and/or (2) increase automation. Buying capacity before automating
will have a tendency to reduce costs and provide for economies of scale. Increasing
automation will increase efficiency. Let us examine the Alan product.
Referring back to the production information (Table 14.7), the Alan product in the
core segment has 0 inventory. The core segment had a segment demand of 8078 (Table
14.9a). The segment demand was met. The four competitors had no inventory in this
segment. Alan’s price ($26) is a little higher than Cent ($25) and Cake ($25). It is
significantly higher than the industry leader Dune ($20). Alan’s age of 3 is significantly
higher than Cent (1.1), Cake (1.1), and Dim (.8). Since the ideal age for this segment is
2.0, Alan will need to R&D this product to remain competitive for next year.
From the production information (Table 14.7), Alan has a 5.5 level of automation
in the core segment. Both of Chester’s core products and Digby’s Dune product have
higher automation levels. At higher levels of automation, firms create greater efficiencies.
It also would be wise to add plant capacity for the next year because Alan has 1,320 units
of capacity next year while Chester has 2,428 units of capacity: 1,139 from Cake and
1,289 units from Cent (Table 14.7). The capacity in this segment for next year can be
determined by adding the capacity for next year and doubling that number to arrive at
both first and second shift capacity. Capacity = 2 (1,320 + 1,139 + 1,289 + 1,040 +
1,800) (Table 14.7). Total capacity for this core segment is 9,576 units. Total core
segment demand (Table 14.9a) is the number of units sold this year (8,078) times (1.10),
which is equal to 8,886 units. If all firms run at 100 percent of both first and second shift
capacity, the segment will have inventory. Make certain your products meet the
customer buying criteria (Table 14.9a) to avoid having inventory in this segment.
From the production information (Table 14.7), it can be seen that Andrews has a
new product, (A-Elit), which will be introduced in the next round. Thrift and core would
not be markets for new products because they are cost based segments (Table 14.8a,
Table 14.10a). Nano is a segment for products that need to be repositioned. Positioning is
35 percent of the customer buying criteria. Ideal age = 1 (Table 14.10a).
The elite segment is for new products because the segment has ideal age = 0,
which is 34 percent of the customer buying criteria (Table 14.11a). As Agape ages, A-
Elit should be positioned within the elite segment. All other products will be older in this
segment (Table 14.11b). In addition, Chester has exited this segment. This elite segment
also has the highest growth rate (16 percent) of all segments. Table 14.12 is a summary of
decisions for team Andrews for the next round.
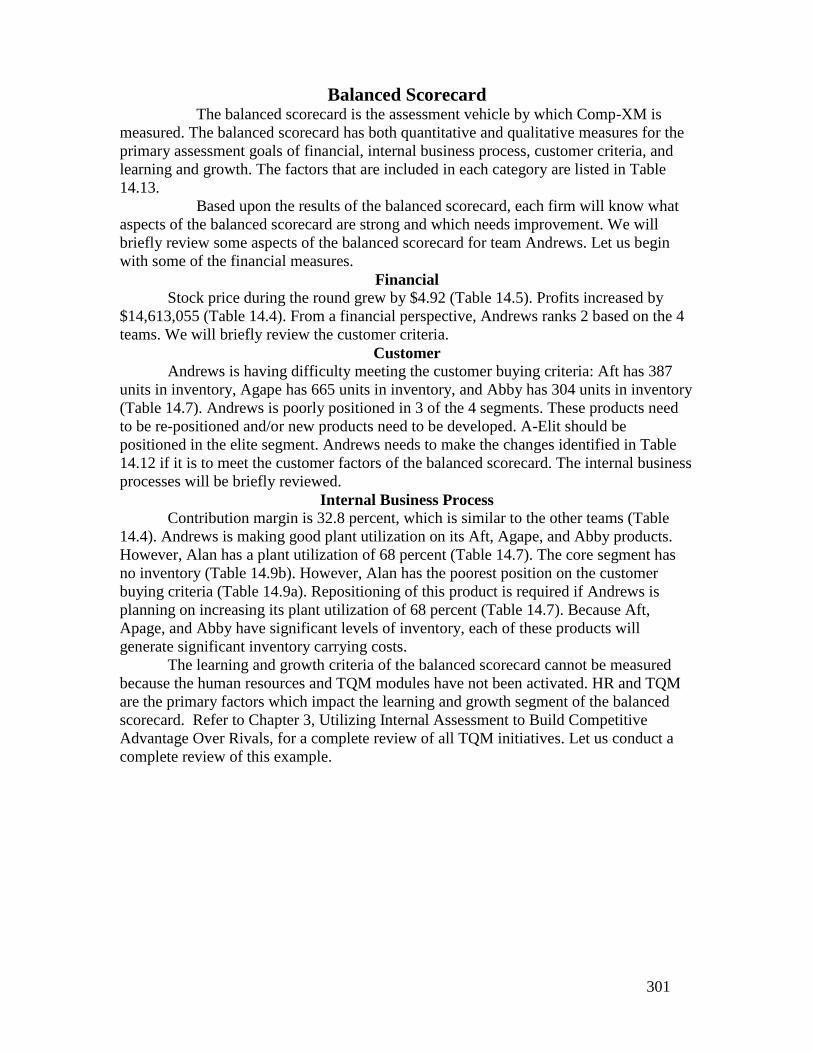
301
Balanced Scorecard The balanced scorecard is the assessment vehicle by which Comp-XM is
measured. The balanced scorecard has both quantitative and qualitative measures for the
primary assessment goals of financial, internal business process, customer criteria, and
learning and growth. The factors that are included in each category are listed in Table
14.13.
Based upon the results of the balanced scorecard, each firm will know what
aspects of the balanced scorecard are strong and which needs improvement. We will
briefly review some aspects of the balanced scorecard for team Andrews. Let us begin
with some of the financial measures.
Financial
Stock price during the round grew by $4.92 (Table 14.5). Profits increased by
$14,613,055 (Table 14.4). From a financial perspective, Andrews ranks 2 based on the 4
teams. We will briefly review the customer criteria.
Customer
Andrews is having difficulty meeting the customer buying criteria: Aft has 387
units in inventory, Agape has 665 units in inventory, and Abby has 304 units in inventory
(Table 14.7). Andrews is poorly positioned in 3 of the 4 segments. These products need
to be re-positioned and/or new products need to be developed. A-Elit should be
positioned in the elite segment. Andrews needs to make the changes identified in Table
14.12 if it is to meet the customer factors of the balanced scorecard. The internal business
processes will be briefly reviewed.
Internal Business Process
Contribution margin is 32.8 percent, which is similar to the other teams (Table
14.4). Andrews is making good plant utilization on its Aft, Agape, and Abby products.
However, Alan has a plant utilization of 68 percent (Table 14.7). The core segment has
no inventory (Table 14.9b). However, Alan has the poorest position on the customer
buying criteria (Table 14.9a). Repositioning of this product is required if Andrews is
planning on increasing its plant utilization of 68 percent (Table 14.7). Because Aft,
Apage, and Abby have significant levels of inventory, each of these products will
generate significant inventory carrying costs.
The learning and growth criteria of the balanced scorecard cannot be measured
because the human resources and TQM modules have not been activated. HR and TQM
are the primary factors which impact the learning and growth segment of the balanced
scorecard. Refer to Chapter 3, Utilizing Internal Assessment to Build Competitive
Advantage Over Rivals, for a complete review of all TQM initiatives. Let us conduct a
complete review of this example.
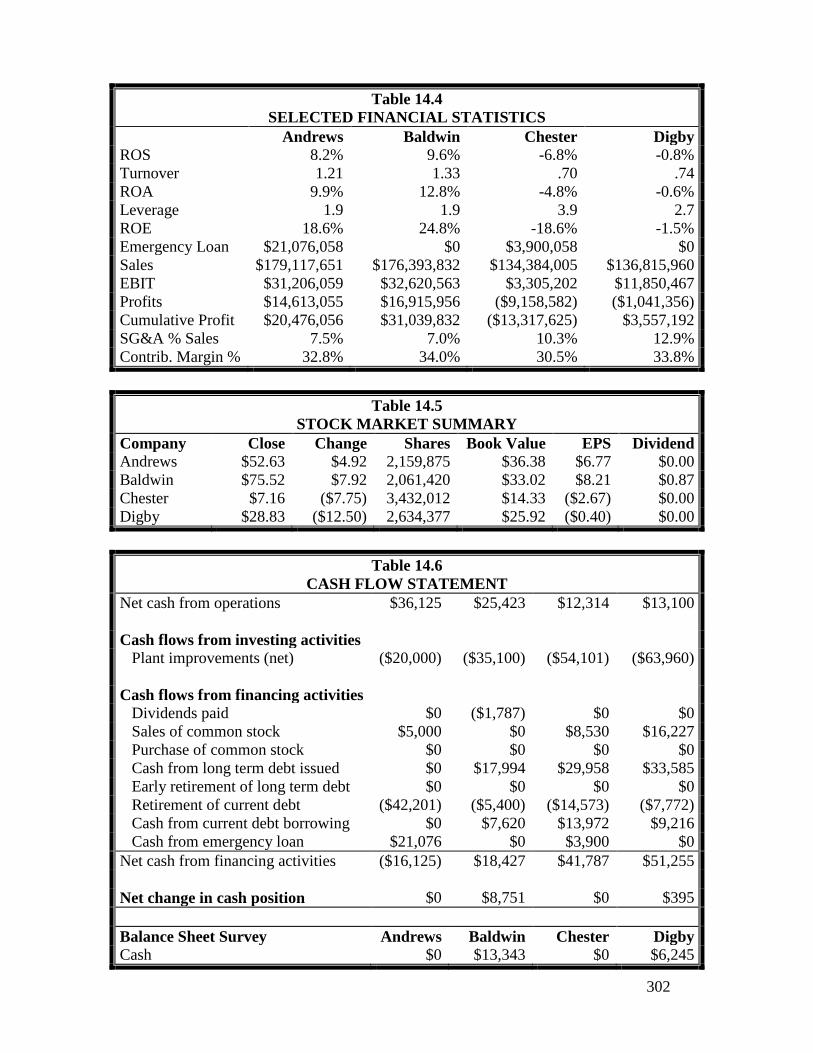
302
Table 14.4
SELECTED FINANCIAL STATISTICS
Andrews Baldwin Chester Digby
ROS 8.2% 9.6% -6.8% -0.8%
Turnover 1.21 1.33 .70 .74
ROA 9.9% 12.8% -4.8% -0.6%
Leverage 1.9 1.9 3.9 2.7
ROE 18.6% 24.8% -18.6% -1.5%
Emergency Loan $21,076,058 $0 $3,900,058 $0
Sales $179,117,651 $176,393,832 $134,384,005 $136,815,960
EBIT $31,206,059 $32,620,563 $3,305,202 $11,850,467
Profits $14,613,055 $16,915,956 ($9,158,582) ($1,041,356)
Cumulative Profit $20,476,056 $31,039,832 ($13,317,625) $3,557,192
SG&A % Sales 7.5% 7.0% 10.3% 12.9%
Contrib. Margin % 32.8% 34.0% 30.5% 33.8%
Table 14.5
STOCK MARKET SUMMARY
Company Close Change Shares Book Value EPS Dividend
Andrews $52.63 $4.92 2,159,875 $36.38 $6.77 $0.00
Baldwin $75.52 $7.92 2,061,420 $33.02 $8.21 $0.87
Chester $7.16 ($7.75) 3,432,012 $14.33 ($2.67) $0.00
Digby $28.83 ($12.50) 2,634,377 $25.92 ($0.40) $0.00
Table 14.6
CASH FLOW STATEMENT
Net cash from operations $36,125 $25,423 $12,314 $13,100
Cash flows from investing activities
Plant improvements (net) ($20,000) ($35,100) ($54,101) ($63,960)
Cash flows from financing activities
Dividends paid $0 ($1,787) $0 $0
Sales of common stock $5,000 $0 $8,530 $16,227
Purchase of common stock $0 $0 $0 $0
Cash from long term debt issued $0 $17,994 $29,958 $33,585
Early retirement of long term debt $0 $0 $0 $0
Retirement of current debt ($42,201) ($5,400) ($14,573) ($7,772)
Cash from current debt borrowing $0 $7,620 $13,972 $9,216
Cash from emergency loan $21,076 $0 $3,900 $0
Net cash from financing activities ($16,125) $18,427 $41,787 $51,255
Net change in cash position $0 $8,751 $0 $395
Balance Sheet Survey Andrews Baldwin Chester Digby
Cash $0 $13,343 $0 $6,245
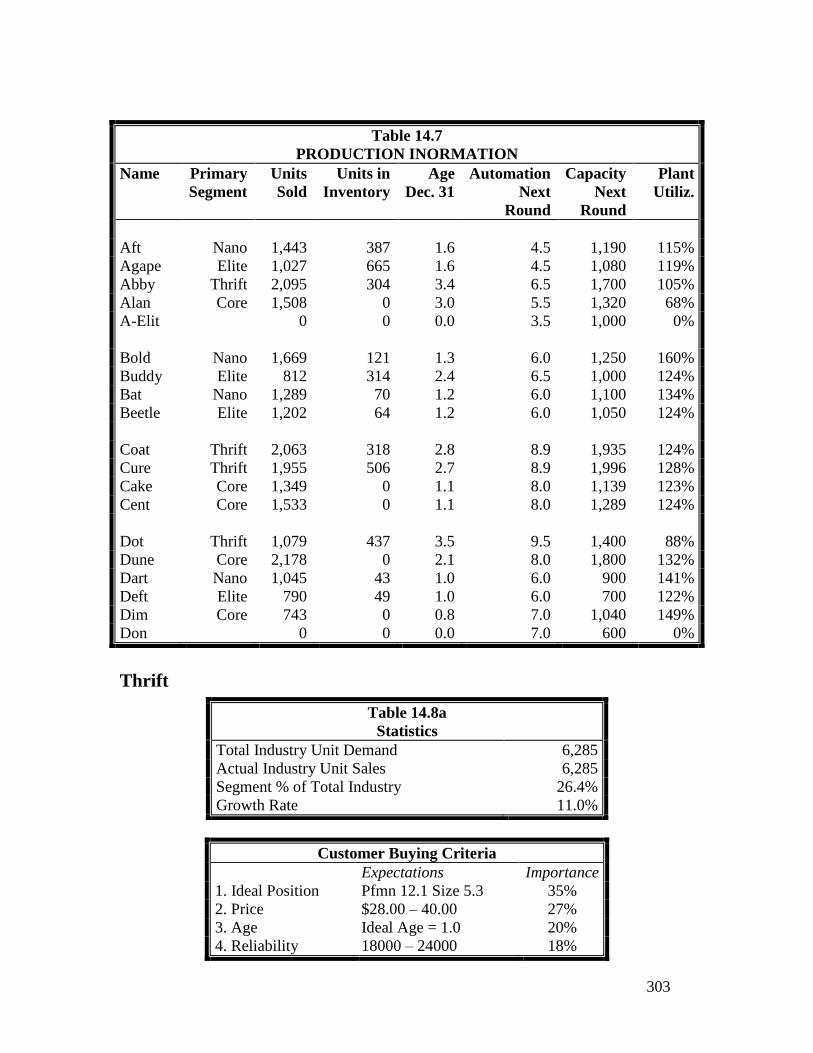
303
Table 14.7
PRODUCTION INORMATION
Name Primary
Segment
Units
Sold
Units in
Inventory
Age
Dec. 31
Automation
Next
Round
Capacity
Next
Round
Plant
Utiliz.
Aft Nano 1,443 387 1.6 4.5 1,190 115%
Agape Elite 1,027 665 1.6 4.5 1,080 119%
Abby Thrift 2,095 304 3.4 6.5 1,700 105%
Alan Core 1,508 0 3.0 5.5 1,320 68%
A-Elit 0 0 0.0 3.5 1,000 0%
Bold Nano 1,669 121 1.3 6.0 1,250 160%
Buddy Elite 812 314 2.4 6.5 1,000 124%
Bat Nano 1,289 70 1.2 6.0 1,100 134%
Beetle Elite 1,202 64 1.2 6.0 1,050 124%
Coat Thrift 2,063 318 2.8 8.9 1,935 124%
Cure Thrift 1,955 506 2.7 8.9 1,996 128%
Cake Core 1,349 0 1.1 8.0 1,139 123%
Cent Core 1,533 0 1.1 8.0 1,289 124%
Dot Thrift 1,079 437 3.5 9.5 1,400 88%
Dune Core 2,178 0 2.1 8.0 1,800 132%
Dart Nano 1,045 43 1.0 6.0 900 141%
Deft Elite 790 49 1.0 6.0 700 122%
Dim Core 743 0 0.8 7.0 1,040 149%
Don 0 0 0.0 7.0 600 0%
Thrift
Customer Buying Criteria
Expectations Importance
1. Ideal Position Pfmn 12.1 Size 5.3 35%
2. Price $28.00 – 40.00 27%
3. Age Ideal Age = 1.0 20%
4. Reliability 18000 – 24000 18%
Table 14.8a
Statistics
Total Industry Unit Demand 6,285
Actual Industry Unit Sales 6,285
Segment % of Total Industry 26.4%
Growth Rate 11.0%
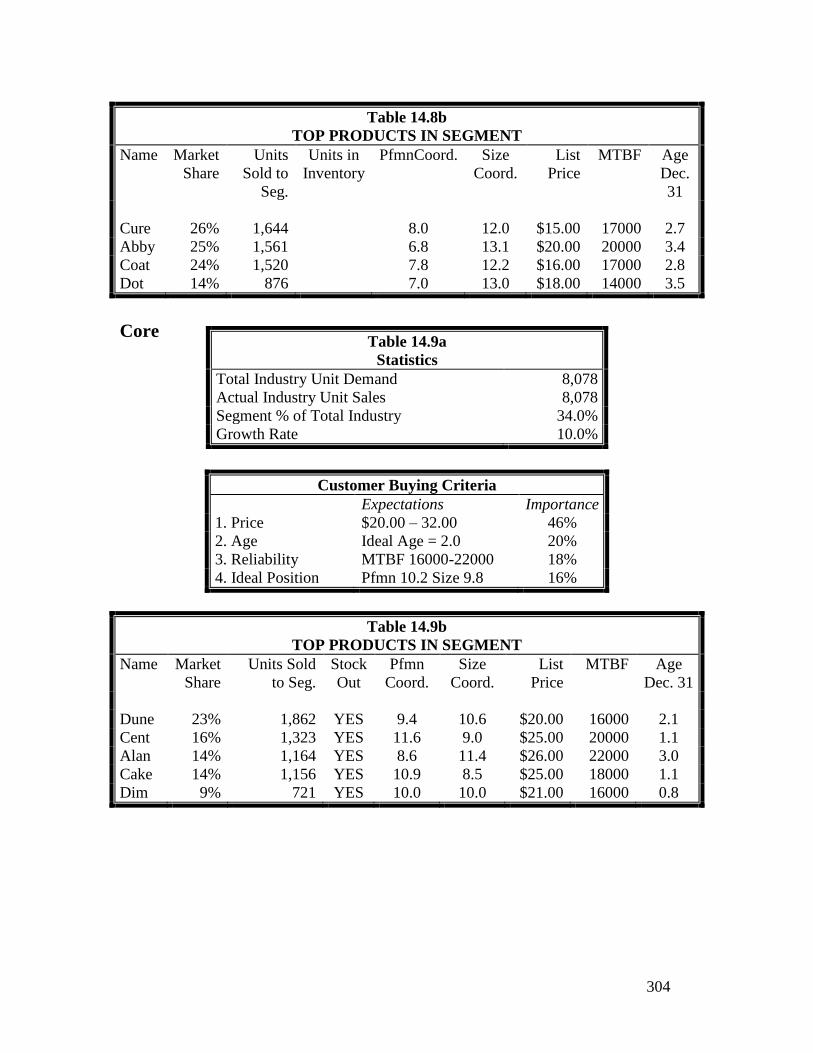
304
Table 14.8b
TOP PRODUCTS IN SEGMENT
Name Market
Share
Units
Sold to
Seg.
Units in
Inventory
PfmnCoord. Size
Coord.
List
Price
MTBF Age
Dec.
31
Cure 26% 1,644 8.0 12.0 $15.00 17000 2.7
Abby 25% 1,561 6.8 13.1 $20.00 20000 3.4
Coat 24% 1,520 7.8 12.2 $16.00 17000 2.8
Dot 14% 876 7.0 13.0 $18.00 14000 3.5
Core
Customer Buying Criteria
Expectations Importance
1. Price $20.00 – 32.00 46%
2. Age Ideal Age = 2.0 20%
3. Reliability MTBF 16000-22000 18%
4. Ideal Position Pfmn 10.2 Size 9.8 16%
Table 14.9b
TOP PRODUCTS IN SEGMENT
Name Market
Share
Units Sold
to Seg.
Stock
Out
Pfmn
Coord.
Size
Coord.
List
Price
MTBF Age
Dec. 31
Dune 23% 1,862 YES 9.4 10.6 $20.00 16000 2.1
Cent 16% 1,323 YES 11.6 9.0 $25.00 20000 1.1
Alan 14% 1,164 YES 8.6 11.4 $26.00 22000 3.0
Cake 14% 1,156 YES 10.9 8.5 $25.00 18000 1.1
Dim 9% 721 YES 10.0 10.0 $21.00 16000 0.8
Table 14.9a
Statistics
Total Industry Unit Demand 8,078
Actual Industry Unit Sales 8,078
Segment % of Total Industry 34.0%
Growth Rate 10.0%
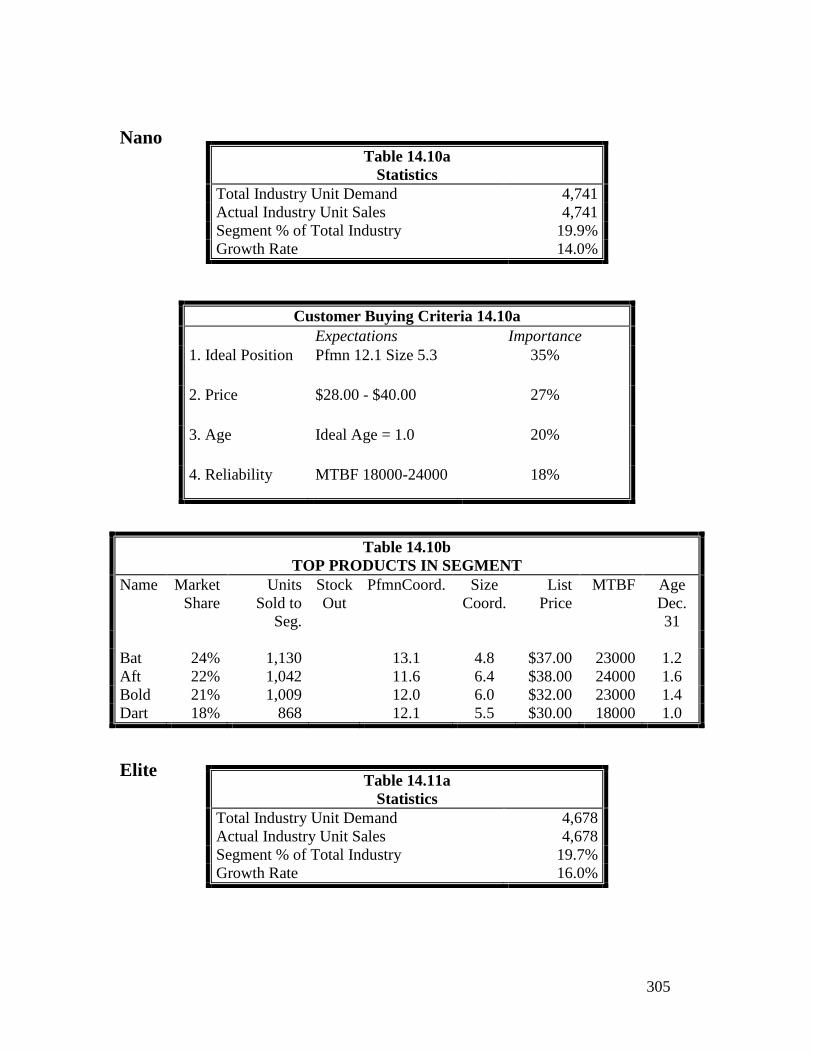
305
Nano
Customer Buying Criteria 14.10a
Expectations Importance
1. Ideal Position Pfmn 12.1 Size 5.3 35%
2. Price $28.00 - $40.00 27%
3. Age Ideal Age = 1.0 20%
4. Reliability MTBF 18000-24000 18%
Table 14.10b
TOP PRODUCTS IN SEGMENT
Name Market
Share
Units
Sold to
Seg.
Stock
Out
PfmnCoord. Size
Coord.
List
Price
MTBF Age
Dec.
31
Bat 24% 1,130 13.1 4.8 $37.00 23000 1.2
Aft 22% 1,042 11.6 6.4 $38.00 24000 1.6
Bold 21% 1,009 12.0 6.0 $32.00 23000 1.4
Dart 18% 868 12.1 5.5 $30.00 18000 1.0
Elite
Table 14.10a
Statistics
Total Industry Unit Demand 4,741
Actual Industry Unit Sales 4,741
Segment % of Total Industry 19.9%
Growth Rate 14.0%
Table 14.11a
Statistics
Total Industry Unit Demand 4,678
Actual Industry Unit Sales 4,678
Segment % of Total Industry 19.7%
Growth Rate 16.0%
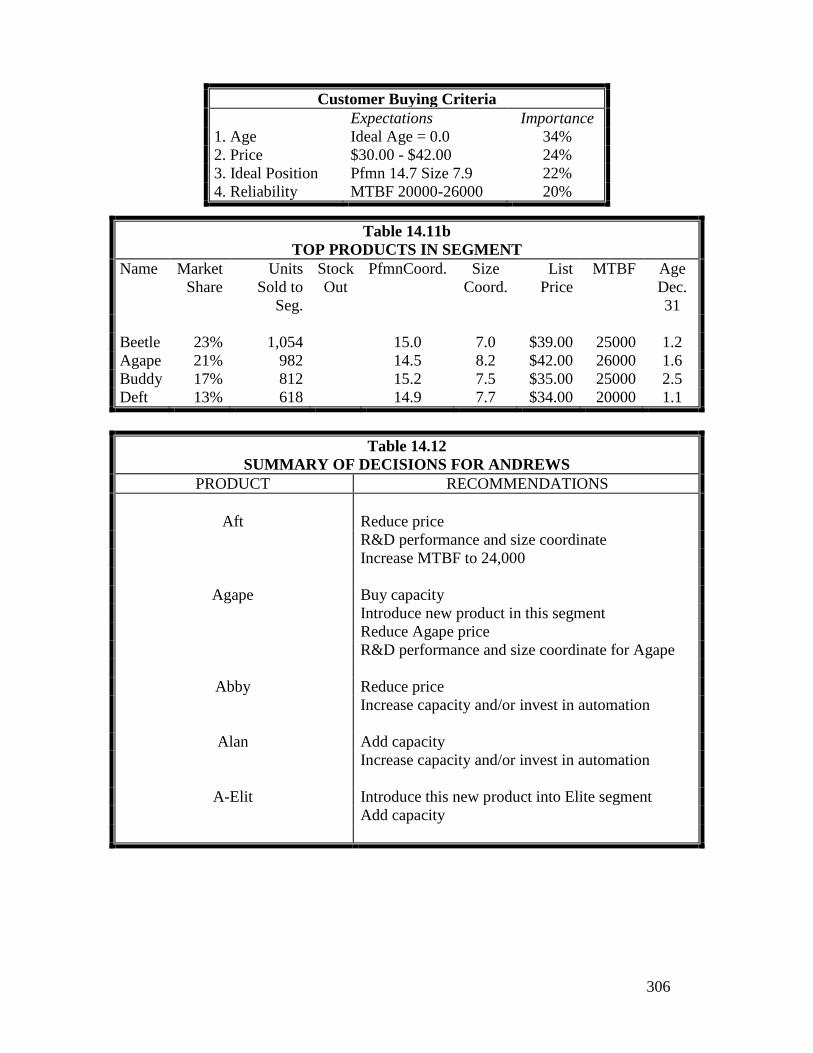
306
Customer Buying Criteria
Expectations Importance
1. Age Ideal Age = 0.0 34%
2. Price $30.00 - $42.00 24%
3. Ideal Position Pfmn 14.7 Size 7.9 22%
4. Reliability MTBF 20000-26000 20%
Table 14.11b
TOP PRODUCTS IN SEGMENT
Name Market
Share
Units
Sold to
Seg.
Stock
Out
PfmnCoord. Size
Coord.
List
Price
MTBF Age
Dec.
31
Beetle 23% 1,054 15.0 7.0 $39.00 25000 1.2
Agape 21% 982 14.5 8.2 $42.00 26000 1.6
Buddy 17% 812 15.2 7.5 $35.00 25000 2.5
Deft 13% 618 14.9 7.7 $34.00 20000 1.1
Table 14.12
SUMMARY OF DECISIONS FOR ANDREWS
PRODUCT RECOMMENDATIONS
Aft Reduce price
R&D performance and size coordinate
Increase MTBF to 24,000
Agape Buy capacity
Introduce new product in this segment
Reduce Agape price
R&D performance and size coordinate for Agape
Abby Reduce price
Increase capacity and/or invest in automation
Alan Add capacity
Increase capacity and/or invest in automation
A-Elit Introduce this new product into Elite segment
Add capacity
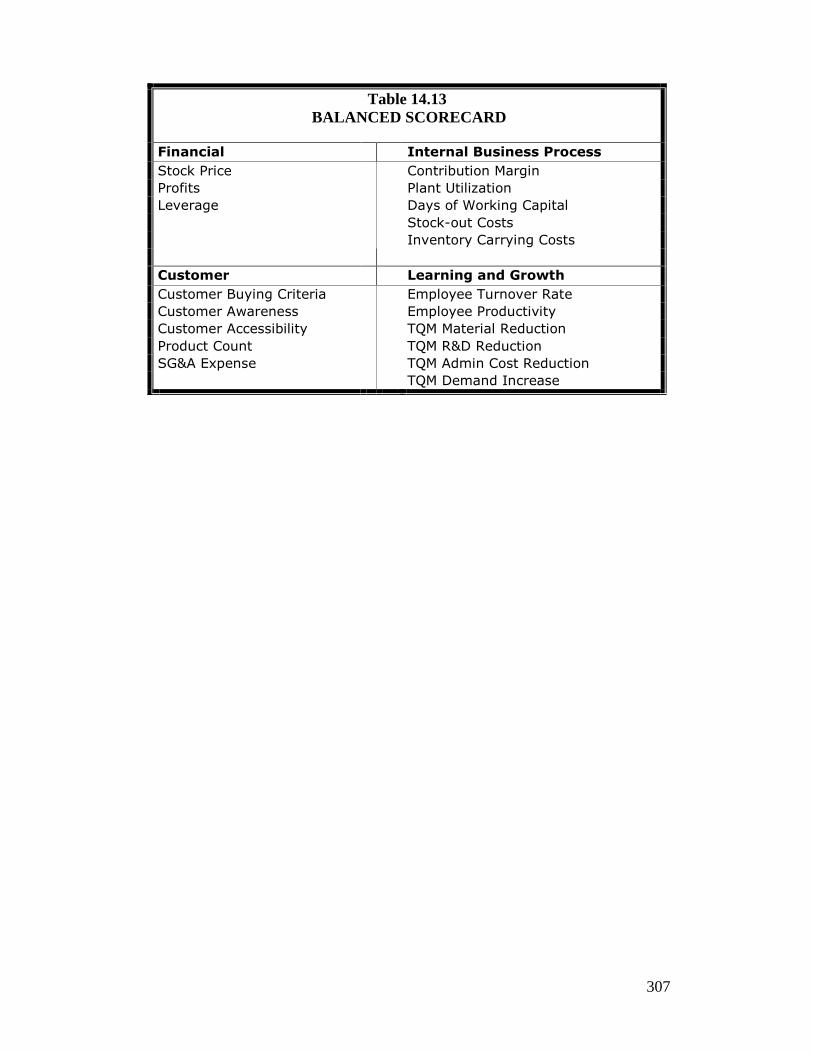
307
Table 14.13
BALANCED SCORECARD
Financial Internal Business Process
Stock Price Contribution Margin
Profits Plant Utilization
Leverage Days of Working Capital
Stock-out Costs
Inventory Carrying Costs
Customer Learning and Growth
Customer Buying Criteria Employee Turnover Rate
Customer Awareness Employee Productivity
Customer Accessibility TQM Material Reduction
Product Count TQM R&D Reduction
SG&A Expense TQM Admin Cost Reduction
TQM Demand Increase
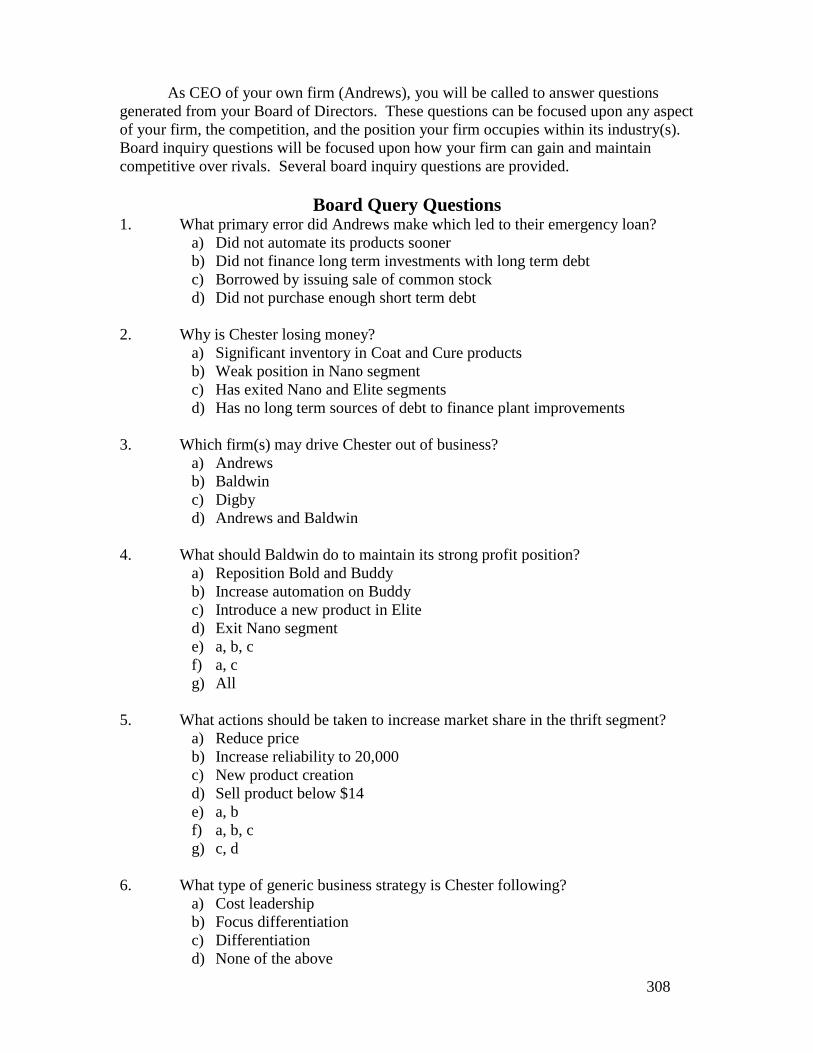
308
As CEO of your own firm (Andrews), you will be called to answer questions
generated from your Board of Directors. These questions can be focused upon any aspect
of your firm, the competition, and the position your firm occupies within its industry(s).
Board inquiry questions will be focused upon how your firm can gain and maintain
competitive over rivals. Several board inquiry questions are provided.
Board Query Questions 1. What primary error did Andrews make which led to their emergency loan?
a) Did not automate its products sooner
b) Did not finance long term investments with long term debt
c) Borrowed by issuing sale of common stock
d) Did not purchase enough short term debt
2. Why is Chester losing money?
a) Significant inventory in Coat and Cure products
b) Weak position in Nano segment
c) Has exited Nano and Elite segments
d) Has no long term sources of debt to finance plant improvements
3. Which firm(s) may drive Chester out of business?
a) Andrews
b) Baldwin
c) Digby
d) Andrews and Baldwin
4. What should Baldwin do to maintain its strong profit position?
a) Reposition Bold and Buddy
b) Increase automation on Buddy
c) Introduce a new product in Elite
d) Exit Nano segment
e) a, b, c
f) a, c
g) All
5. What actions should be taken to increase market share in the thrift segment?
a) Reduce price
b) Increase reliability to 20,000
c) New product creation
d) Sell product below $14
e) a, b
f) a, b, c
g) c, d
6. What type of generic business strategy is Chester following?
a) Cost leadership
b) Focus differentiation
c) Differentiation
d) None of the above
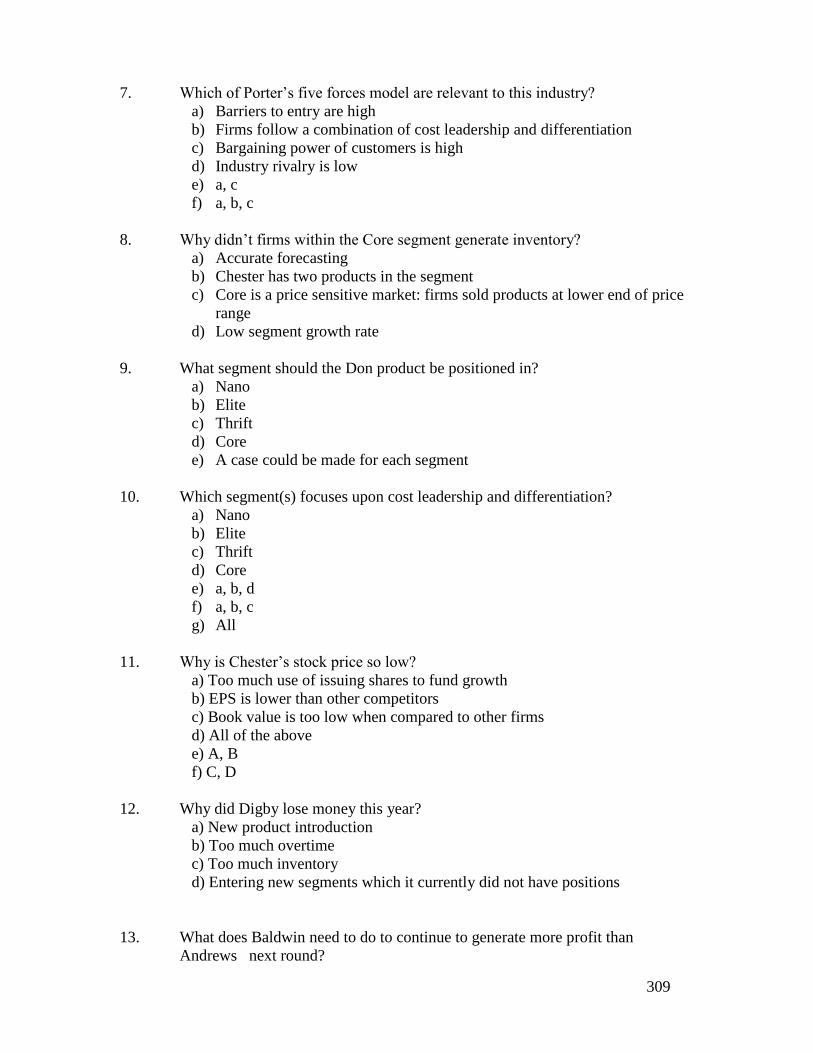
309
7. Which of Porter’s five forces model are relevant to this industry?
a) Barriers to entry are high
b) Firms follow a combination of cost leadership and differentiation
c) Bargaining power of customers is high
d) Industry rivalry is low
e) a, c
f) a, b, c
8. Why didn’t firms within the Core segment generate inventory?
a) Accurate forecasting
b) Chester has two products in the segment
c) Core is a price sensitive market: firms sold products at lower end of price
range
d) Low segment growth rate
9. What segment should the Don product be positioned in?
a) Nano
b) Elite
c) Thrift
d) Core
e) A case could be made for each segment
10. Which segment(s) focuses upon cost leadership and differentiation?
a) Nano
b) Elite
c) Thrift
d) Core
e) a, b, d
f) a, b, c
g) All
11. Why is Chester’s stock price so low?
a) Too much use of issuing shares to fund growth
b) EPS is lower than other competitors
c) Book value is too low when compared to other firms
d) All of the above
e) A, B
f) C, D
12. Why did Digby lose money this year?
a) New product introduction
b) Too much overtime
c) Too much inventory
d) Entering new segments which it currently did not have positions
13. What does Baldwin need to do to continue to generate more profit than
Andrews next round?
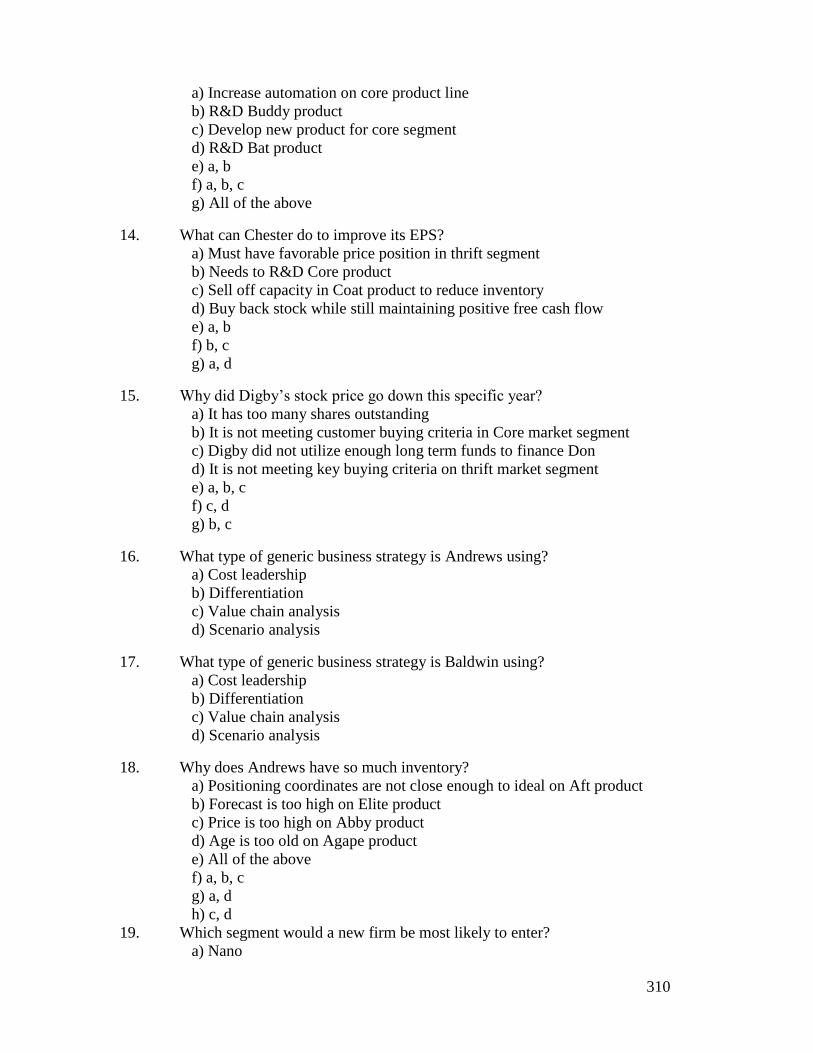
310
a) Increase automation on core product line
b) R&D Buddy product
c) Develop new product for core segment
d) R&D Bat product
e) a, b
f) a, b, c
g) All of the above
14. What can Chester do to improve its EPS?
a) Must have favorable price position in thrift segment
b) Needs to R&D Core product
c) Sell off capacity in Coat product to reduce inventory
d) Buy back stock while still maintaining positive free cash flow
e) a, b
f) b, c
g) a, d
15. Why did Digby’s stock price go down this specific year?
a) It has too many shares outstanding
b) It is not meeting customer buying criteria in Core market segment
c) Digby did not utilize enough long term funds to finance Don
d) It is not meeting key buying criteria on thrift market segment
e) a, b, c
f) c, d
g) b, c
16. What type of generic business strategy is Andrews using?
a) Cost leadership
b) Differentiation
c) Value chain analysis
d) Scenario analysis
17. What type of generic business strategy is Baldwin using?
a) Cost leadership
b) Differentiation
c) Value chain analysis
d) Scenario analysis
18. Why does Andrews have so much inventory?
a) Positioning coordinates are not close enough to ideal on Aft product
b) Forecast is too high on Elite product
c) Price is too high on Abby product
d) Age is too old on Agape product
e) All of the above
f) a, b, c
g) a, d
h) c, d
19. Which segment would a new firm be most likely to enter?
a) Nano

311
b) Elite
c) Thrift
d) Core
e) A case could be made for all
f) None
20. What firm has not properly financed its long term investments?
a) Andrews
b) Baldwin
c) Chester
d) Digby

312
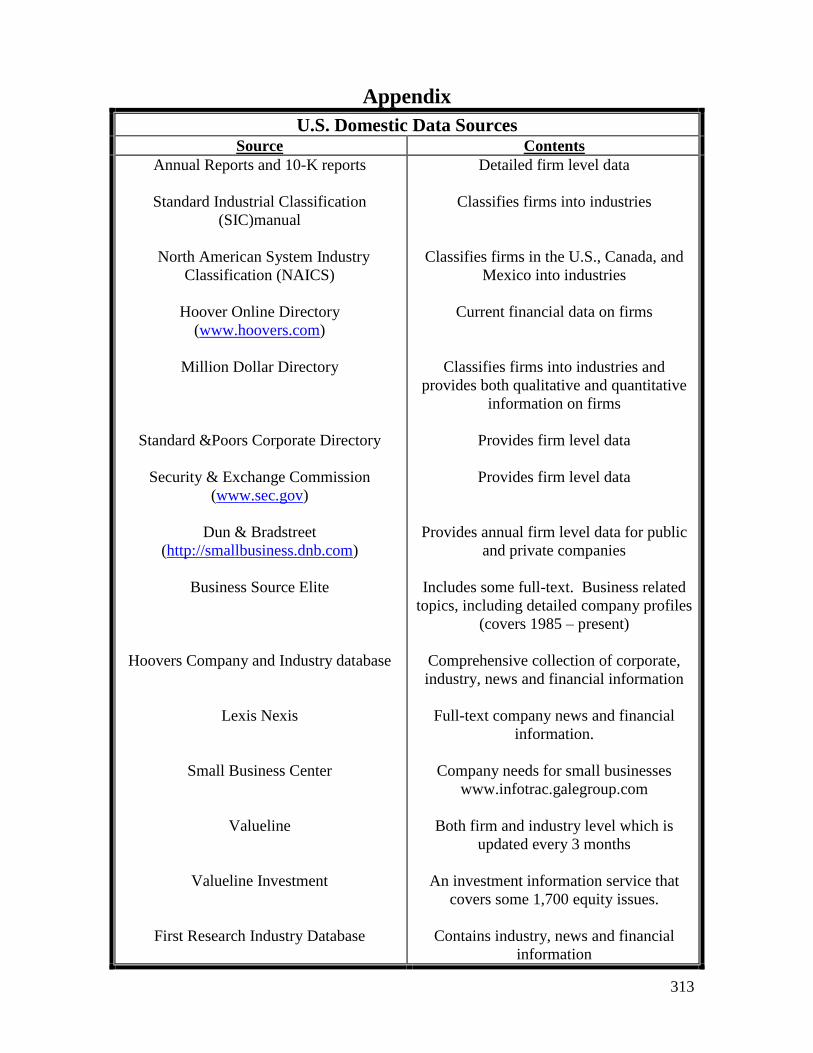
313
Appendix
U.S. Domestic Data Sources Source Contents
Annual Reports and 10-K reports
Standard Industrial Classification
(SIC)manual
North American System Industry
Classification (NAICS)
Hoover Online Directory
(www.hoovers.com)
Million Dollar Directory
Standard &Poors Corporate Directory
Security & Exchange Commission
(www.sec.gov)
Dun & Bradstreet
(http://smallbusiness.dnb.com)
Business Source Elite
Hoovers Company and Industry database
Lexis Nexis
Small Business Center
Valueline
Valueline Investment
First Research Industry Database
Detailed firm level data
Classifies firms into industries
Classifies firms in the U.S., Canada, and
Mexico into industries
Current financial data on firms
Classifies firms into industries and
provides both qualitative and quantitative
information on firms
Provides firm level data
Provides firm level data
Provides annual firm level data for public
and private companies
Includes some full-text. Business related
topics, including detailed company profiles
(covers 1985 – present)
Comprehensive collection of corporate,
industry, news and financial information
Full-text company news and financial
information.
Company needs for small businesses
www.infotrac.galegroup.com
Both firm and industry level which is
updated every 3 months
An investment information service that
covers some 1,700 equity issues.
Contains industry, news and financial
information
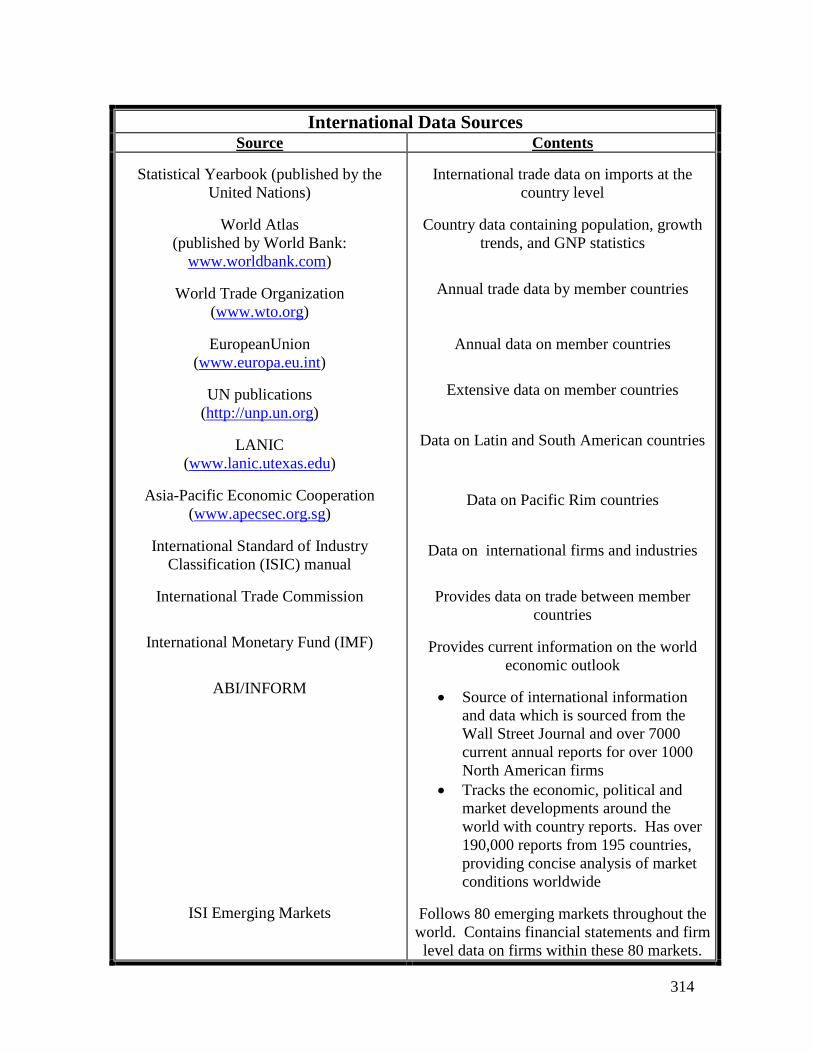
314
International Data Sources Source Contents
Statistical Yearbook (published by the
United Nations)
World Atlas
(published by World Bank:
www.worldbank.com)
World Trade Organization
(www.wto.org)
EuropeanUnion
(www.europa.eu.int)
UN publications
(http://unp.un.org)
LANIC
(www.lanic.utexas.edu)
Asia-Pacific Economic Cooperation
(www.apecsec.org.sg)
International Standard of Industry
Classification (ISIC) manual
International Trade Commission
International Monetary Fund (IMF)
ABI/INFORM
ISI Emerging Markets
International trade data on imports at the
country level
Country data containing population, growth
trends, and GNP statistics
Annual trade data by member countries
Annual data on member countries
Extensive data on member countries
Data on Latin and South American countries
Data on Pacific Rim countries
Data on international firms and industries
Provides data on trade between member
countries
Provides current information on the world
economic outlook
Source of international information
and data which is sourced from the
Wall Street Journal and over 7000
current annual reports for over 1000
North American firms
Tracks the economic, political and
market developments around the
world with country reports. Has over
190,000 reports from 195 countries,
providing concise analysis of market
conditions worldwide
Follows 80 emerging markets throughout the
world. Contains financial statements and firm
level data on firms within these 80 markets.
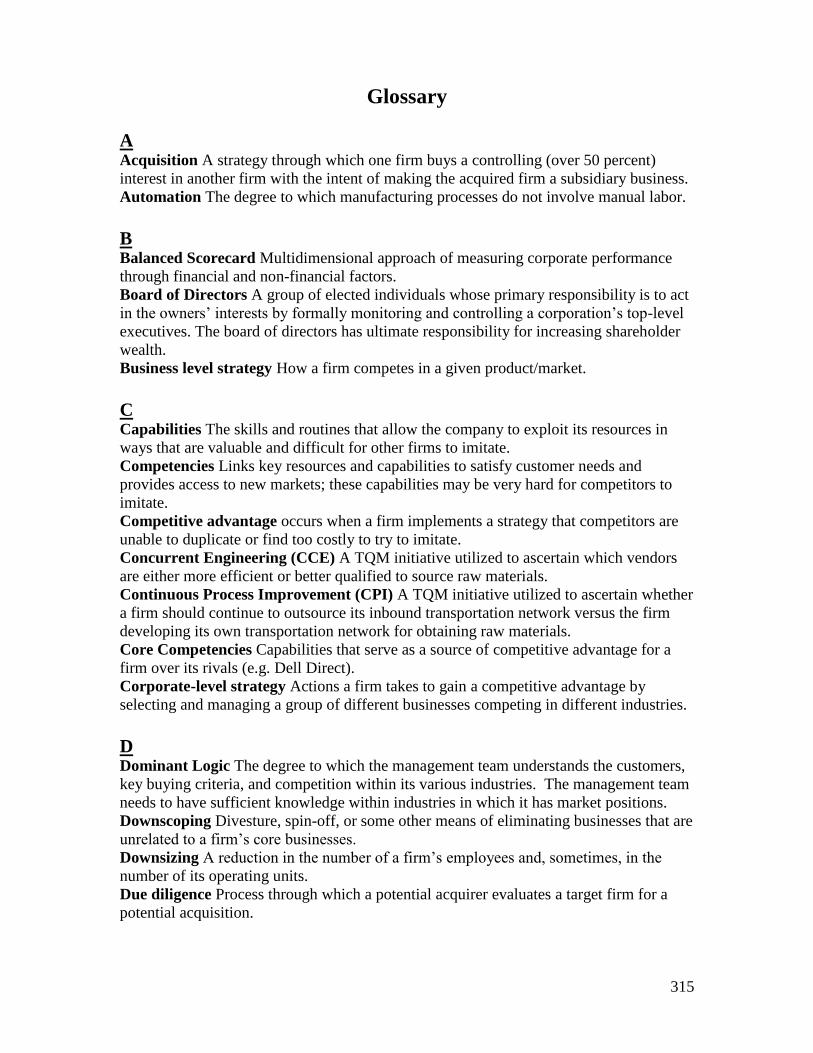
315
Glossary
A Acquisition A strategy through which one firm buys a controlling (over 50 percent)
interest in another firm with the intent of making the acquired firm a subsidiary business.
Automation The degree to which manufacturing processes do not involve manual labor.
B Balanced Scorecard Multidimensional approach of measuring corporate performance
through financial and non-financial factors.
Board of Directors A group of elected individuals whose primary responsibility is to act
in the owners’ interests by formally monitoring and controlling a corporation’s top-level
executives. The board of directors has ultimate responsibility for increasing shareholder
wealth.
Business level strategy How a firm competes in a given product/market.
C Capabilities The skills and routines that allow the company to exploit its resources in
ways that are valuable and difficult for other firms to imitate.
Competencies Links key resources and capabilities to satisfy customer needs and
provides access to new markets; these capabilities may be very hard for competitors to
imitate.
Competitive advantage occurs when a firm implements a strategy that competitors are
unable to duplicate or find too costly to try to imitate.
Concurrent Engineering (CCE) A TQM initiative utilized to ascertain which vendors
are either more efficient or better qualified to source raw materials.
Continuous Process Improvement (CPI) A TQM initiative utilized to ascertain whether
a firm should continue to outsource its inbound transportation network versus the firm
developing its own transportation network for obtaining raw materials.
Core Competencies Capabilities that serve as a source of competitive advantage for a
firm over its rivals (e.g. Dell Direct).
Corporate-level strategy Actions a firm takes to gain a competitive advantage by
selecting and managing a group of different businesses competing in different industries.
D Dominant Logic The degree to which the management team understands the customers,
key buying criteria, and competition within its various industries. The management team
needs to have sufficient knowledge within industries in which it has market positions.
Downscoping Divesture, spin-off, or some other means of eliminating businesses that are
unrelated to a firm’s core businesses.
Downsizing A reduction in the number of a firm’s employees and, sometimes, in the
number of its operating units.
Due diligence Process through which a potential acquirer evaluates a target firm for a
potential acquisition.
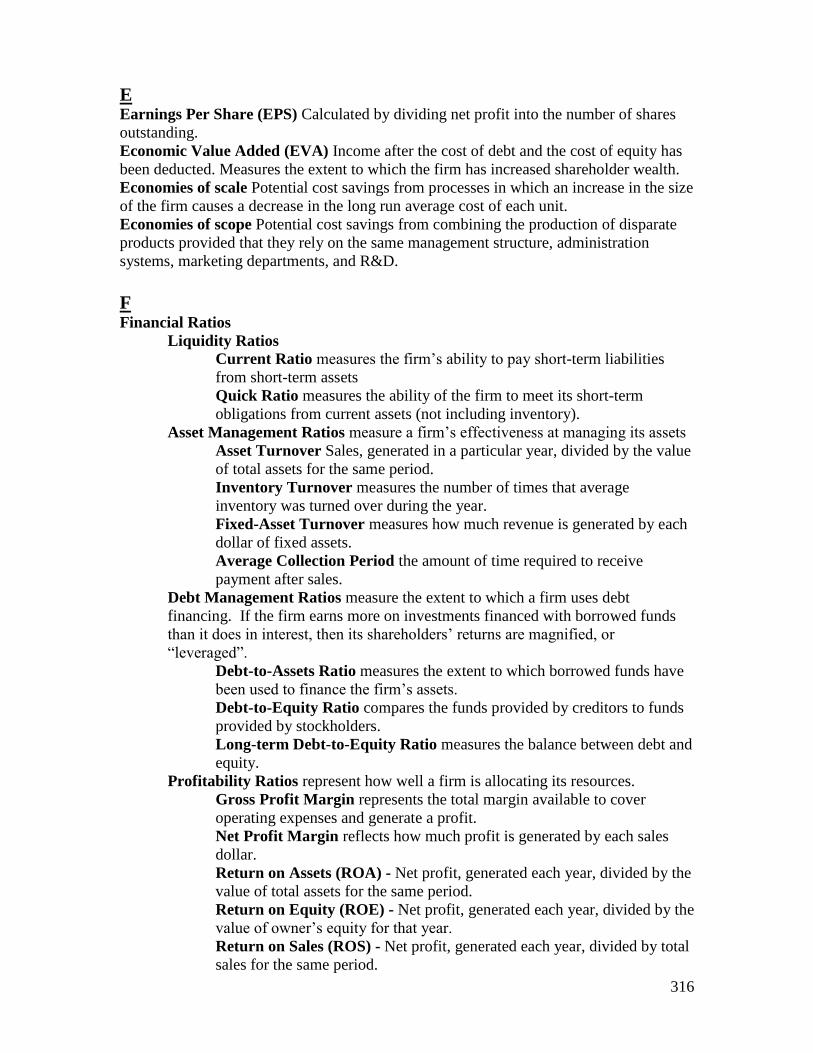
316
E Earnings Per Share (EPS) Calculated by dividing net profit into the number of shares
outstanding.
Economic Value Added (EVA) Income after the cost of debt and the cost of equity has
been deducted. Measures the extent to which the firm has increased shareholder wealth.
Economies of scale Potential cost savings from processes in which an increase in the size
of the firm causes a decrease in the long run average cost of each unit.
Economies of scope Potential cost savings from combining the production of disparate
products provided that they rely on the same management structure, administration
systems, marketing departments, and R&D.
F Financial Ratios
Liquidity Ratios
Current Ratio measures the firm’s ability to pay short-term liabilities
from short-term assets
Quick Ratio measures the ability of the firm to meet its short-term
obligations from current assets (not including inventory).
Asset Management Ratios measure a firm’s effectiveness at managing its assets
Asset Turnover Sales, generated in a particular year, divided by the value
of total assets for the same period.
Inventory Turnover measures the number of times that average
inventory was turned over during the year.
Fixed-Asset Turnover measures how much revenue is generated by each
dollar of fixed assets.
Average Collection Period the amount of time required to receive
payment after sales.
Debt Management Ratios measure the extent to which a firm uses debt
financing. If the firm earns more on investments financed with borrowed funds
than it does in interest, then its shareholders’ returns are magnified, or
“leveraged”.
Debt-to-Assets Ratio measures the extent to which borrowed funds have
been used to finance the firm’s assets.
Debt-to-Equity Ratio compares the funds provided by creditors to funds
provided by stockholders.
Long-term Debt-to-Equity Ratio measures the balance between debt and
equity.
Profitability Ratios represent how well a firm is allocating its resources.
Gross Profit Margin represents the total margin available to cover
operating expenses and generate a profit.
Net Profit Margin reflects how much profit is generated by each sales
dollar.
Return on Assets (ROA) - Net profit, generated each year, divided by the
value of total assets for the same period.
Return on Equity (ROE) - Net profit, generated each year, divided by the
value of owner’s equity for that year.
Return on Sales (ROS) - Net profit, generated each year, divided by total
sales for the same period.
317
Flexible Manufacturing A computer-controlled process used to produce a variety of
products in moderate, flexible quantities with a minimum of manual intervention.
Free Cash Flow The money left after investment that a company could either put in the
bank or give to shareholders as dividends.
G G.E. Matrix A framework for identifying a firm’s position(s) on factors related to
industry attractiveness and the firm’s own business strengths.
H Hostile Takeover Special type of acquisition strategy wherein the target firm does not
wish to be acquired.
I Industry analysis An assessment of the attractiveness of an industry based on (Porter’s
1980) five forces- the bargaining power of buyers, the bargaining power of suppliers,
degree of rivalry, threat of new entrants and threat of substitute products.
Industry Life Cycle
Introduction stage This stage is dominated by the marketing of an innovation for
the first time. Competition is minimal (if any). The firm becomes a first mover.
Returns during this stage are not positive because the first mover must recover
costs of product development, advertising, and manufacturing.
Growth stage The stage of the industry life cycle when profits rise; product
reliability increases as does the competition. Firms differentiate based upon
value/quality.
Maturity stage Sales tend to be the highest during this period. The industry faces
significant price pressure because customers view a firm’s offering as
homogeneous. Margins are negatively impacted because price becomes the
dominant key buying criteria.
Decline stage Revenues and profits are reduced significantly during this stage.
Firms may choose to allocate resources to products/markets which are at earlier
stages of the life cycle.
Innovation Putting an invention or other important discoveries into widespread use (e.g.
laser)
International Strategy A strategy through which a firm sells its goods or services
outside its domestic market. Typical modes of international entry are exporting,
licensing, franchising, strategic alliances, acquisitions, mergers and foreign direct
investment (FDI).
J Joint Venture A strategic alliance in which two or more firms create a legally
independent company to share some of their resources and capabilities to develop a
competitive advantage.
Just in time (JIT) Inventory management approach in which a company products only
what the customer wants, in the quantities the customer actually requires, and when the
customer needs it.
318
K
Key buying criteria Factors that dictate the purchase of a product/service.
L Leverage Total assets at the end of the period divided by owner’s equity for the same
period.
Licensing A legal arrangement whereby one company permits another firm to produce
and sell the company’s products for royalties.
M Market Capitalization (from the perspective of the Simulation) This statistic is
measured by multiplying the stock price per share times the number of shares
outstanding.
Market Value Added (MVA) Market value less capital invested.
Mean Time Before Failure (MTBF) Reliability of product, expresses in hours.
Merger A strategy through which two firms agree to integrate their operations on a
relatively coequal basis.
Mission Specifies the business or businesses in which the firm intends to compete and
the customers it intends to serve.
N Net Income Value of profits as calculated on the Income Statement
Net Margin Value of total sales less variable and period costs
Net Profit Earnings left after all expenses are paid. Net profit can only be allocated to
one of two directions. It is either paid out to the owners of the business, in the form of a
dividend or it is retained in the business to grow the company and is thus added to the
Retained Earnings of the business.
P P/E Ratio The closing stock price divided by the earnings per share (EPS). The P/E is
sometimes referred to as the earnings multiple or simply the multiple.
Porter’s Five Forces See Industry Analysis
R Resources An organization’s basic financial, physical, and human capital assets.
Restructuring A strategy through which a firm changes its set of businesses or its
financial structure.
Retained Earnings Total of all company profits and losses over the life of the company,
less any dividends paid out. The monies are captured in the assets of the company. This
may be cash but it may just as easily be in the form of plant or even accounts receivable.
S Sales Forecasting
Delphi Technique An iterative process of forecasting a future event based upon
experts who are dispersed geographically
319
Executive Judgment The senior level executives within a firm, based upon their
judgment, predict sales forecasts at the industry and product market level.
Exponential Smoothing Projects next year’s sales by combining an average of
past sales and more recent sales giving more weight to the latter.
Naïve Method Developed based upon historical (usually last year’s) sales and
growth rates.
Regression Analysis This technique requires the use of historical sales data. The
forecaster seeks to find a relationship between past sales (the dependent variable)
and one or more independent variables, such as population, per capita income, or
gross domestic product. An accurate forecast depends upon identifying a specific
relationship between the dependent and independent variables.
Scenario Analysis This technique is used to generate strategic alternatives based
on varying assumptions about the future. A scenario is a possible set of
environmental circumstances concerning what the environment may look like in
the future. It depicts potential actions and events in a likely order of occurrence,
beginning with a set of conditions that describe the current situation.
Test Market Study Actually selling the product in a number of specific markets.
Actual cost and revenue data can be gathered from each market.
Time Series Analysis The forecaster uses the firm’s historical sales data to
attempt to discover a pattern or patterns in the firm’s sales over time. If a pattern
is found, it can be used to forecast future sales. This forecasting method assumes
that past sales patterns will continue in the future.
Stakeholders Those who affect and are affected by a company’s actions and results.
Strategic Leaders People located in different parts of a firm who use the strategic
management process to help the firm reach its vision and mission.
SWOT Analysis Strengths, weaknesses, opportunities and threats analysis; examining
the internal strengths and weaknesses of a firm, comparing them with external
opportunities and threats, and matching the two in order to choose a strategy based on the
analysis. SWOT can also be used to determine the position of competitors.
Synergy When the value created by business units working together exceeds the value
that those same units create working independently.
T Total Quality Management (TQM) Initiatives Activities designed to achieve enhanced
productivity and increase quality at the same time;
Benchmarking reduces administrative costs.
Channel Support Systems (Sales Force support) Increases demand.
Concurrent Engineering (CCE) Reduces R&D cycle time.
Continuous Process Improvement (CPI) Reduces material and labor costs
Quality Function Deployment Effort reduces R&D cycle time and increases
demand.
Quality Initiative Training (QIT) reduces labor costs.
6 Sigma Training reduces material and labor costs.
Vendor/Just-In-Time (JIT)Reduces material costs and administrative overhead.
320
V
Value Chain The primary and support activities a firm undertakes to deliver products
and services to customers; each element in the value chain can be broken down to
determine how profitable it is. Consists of primary activities which examine the product
from source of raw material to after sales service. Secondary activities (e.g. technology)
provide support for the primary activities.
Vertical Integration Corporate structure in which a company combines production,
distribution, and/or sales within its organization.
Vision A picture of what a firm wanted to be and, in broad terms, what it wants to
ultimately achieve.
321
Index Adaptation, 215
Advanced marketing module, 55
Auto Industry (U.S), 20
Automation, 53, 55, 56, 290, 291
Balanced Scorecard, 253, 254
BNSF Railroad Acquisition, 67, 68, 69
Board of Directors, 237
Brand
equity, 27
image, 69
loyalty, 47
name, 46
BRIC (Brazil, Russia, India, China), 18,
23, 179, 241
Capital budgeting, 54
Cash flow. See Free cash flow
Chapter 11 bankruptcy, 31, 35
Chief Executive Officer (CEO), 233,
237
Collective bargaining organizations,
220, 235, 285
Collusion, 208
Concurrent Engineering (CCE), 116,
142, 164
Continuous Process Improvement (CPI),
142, 164
Continuous Process Improvements
(CPI), 116
Cumulative profit, 262, 291
Data Sources (U.S. Domestic), 311
Data Sources (International), 312
Depression (1930s), 22, 24, 29
Dominant logic, 132
Dow Jones, 25
Downscoping, 137, 261
Downsizing, 136, 261
Due diligence, 189, 192
Economic value added (EVA), 258
Economies of scale, 29, 55, 106, 107,
115, 127, 156, 181, 185, 189, 204
Economies of scope, 127, 158, 186, 208
Electronic data interchange (EDI), 95
Emergent strategy, 67
European Union, 216, 228, 235, 241
Experience curve, 106
Finance spreadsheet, 54
Financial Ratios
Asset Management Ratios, 257
Debt Management Ratios, 258
Liquidity Ratios, 257
Profitability Ratios, 258
Flexible manufacturing, 108, 256
Free cash flow, 262, 291
G.E. Matrix, 133
Global Outsourcing, 240
Government Stimulus Plan ($787
Billion), 24
Great Depression (1930s), 17, 19
Gross Domestic Product (GDP), 35, 208,
256
Housing Prices, 23, 26
Hostile acquisitions, 189
Industry
aircraft, 186
airline, 82, 185, 204
cell phone, 217
evolution, 47
fashion, 27
mining and steel, 27
pharmaceutical, 27, 73, 126, 186
railroad, 29
telecommunications, 84, 181, 185, 204
tobacco, 84
wet shaving, 190, 285
Innovation, 30
International Monetary Fund (IMF), 27
International Standard Industrial
Classification System, 23
Interstate Commerce Commission (ICC),
45
Just in time (JIT), 46, 55, 95, 96, 116,
164
Key buying criteria, 57, 86, 93, 111
Learn by doing, 54, 106
LTL (Less Than Truck) Trucking
Industry, 45, 46, 47
Market capitalization, 262
Market value added (MVA), 258
Marketing spreadsheet, 56
Mean Time Before Failure (MTBF), 56
Mission statement, 22
Monopolistic Competition, 41
Monopoly, 41
322
NASDAQ, 25
North American Free Trade Agreement
(NAFTA), 23, 216
North American Industry Classification
System (NAICS), 23, 41, 42, 228, 235
Not Invented Here, 215
Oligopoly, 41
OPEC Cartel, 44
Organization for Economic
Co-operation and Development
(OECD), 28
Outsourcing, 57, 204
Perceptual Map, 100, 101
Product
adaptation, 110
line profitability, 243
Production spreadsheet, 55
Quality/price tradeoff, 135
R&D
cycle time, 54, 116, 290
investments, 92, 116
process, 31, 34, 35, 53, 182, 255
product, 31, 34, 35, 51, 52, 53, 73, 221,
255
Realignment, 137
Sabbanes-Oxley of 2002, 255
Sales forecasting
Delphi technique, 85
executive judgment, 84
exponential smoothing, 84
naïve methods, 84
regression analysis, 85
scenario analysis, 85
time series analysis, 85
Scale economies. See Economies of
scale
Senior management. See Strategic
leaders
Shareholders, 236
Six sigma, 256
Standard and Poor's, 25
Standard Industrial Classification
System (SIC), 23, 41, 42
Standardization, 215
Strategic leaders, 233, 235
Switching costs, 26
Synergies, 185
Technology transfer, 159
Test markets, 256
Total Quality Management (TQM), 31,
34, 55, 112, 116, 138, 243
U.S. Bankruptcy Filings, 18, 19
U.S. Economic Conditions, 16, 24, 25
U.S. Government Bailout Plan, 20
U.S. Government Stimulus Plan, 20
U.S. Housing Market, 18, 22, 24
Walmart Expansion, 84, 85