Embed Size (px)
Citation preview

A SUSTAINABLE DECISION SUPPORT SYSTEM FOR THE
DEMANUFACTURING PROCESS OF PRODUCT TAKE-BACK BASED ON
CONCEPTS OF INDUSTRIAL ECOLOGY
By
Sirine A. Saleem
Bachelor of Industrial Engineering University of Jordan, 1997
Submitted in Partial Fulfillment of the
Requirements for the Degree of Master of Science in the
Department of Mechanical Engineering
College of Engineering & Information Technology
University of South Carolina
2001
________________________________ ______________________________ Department of Mechanical Engineering Department of Mechanical Engineering Director of Thesis 2nd Reader
__________________________ Dean of The Graduate School
i
DEDICATION
To My Mother
For Your Everlasting Love, Patience, and Sacrifice
I Love You
To My Husband and Daughter
Ayman and Yasmine
For Your Continuous Support, Love, and Understanding
With All My Love
ii
ACKNOWLEDGMENTS
Throughout my master’s process the list of people who contributed to my success
grew larger.
First of all, I would like to thank my advisor, Dr. Wally Peters, whose guidance
motivated my interest in Industrial Sustainability. He has been an excellent teacher;
always there to listen to me and give me sincere advice, his confidence in LSS and in me
as part of this team brought out the best in me. Working with him has been extremely
valuable to me.
Besides my advisor, I would like to express my honest gratitude to Dr. Bayoumi
for being member of my committee and his invaluable help, guidance, support and
understanding throughout my master’s process.
Moreover, I would like to thank Dr. Rocheleau for being a member of my
committee. And my thankfulness goes to Dr. Khan without whom I would have never
been directed to Dr. Peters, and for his support and nourishing me with some very useful
guidance during the course of my research work.
For her invaluable help and assistance throughout my research and writing my
thesis, I am forever grateful to Lynn Odom without whom all this would have never been
possible, she has been a precious source of knowledge, guidance, support, she had
confidence in me when I doubted my self, she was always there to talk about my ideas, to
proofread and to make up my thesis, without her everlasting encouragement and help I
could not have finished this thesis. More importantly, she has always been a good friend
and will always be my best friend.
iii

I feel very fortunate to have Beth Locklear as my thesis mate who shared endless
laughter and worries. Without our support for each other, belief in Industrial
Sustainability, and determination to make this work come true, this work would have
never been done. Beth, we made it! I would also like to thank Jamie Russell for his help
in calculations and giving me good ideas and entertainment. Patience Russell, Katty
Chen, David Grigg, Tara Alden for your legal help, Emily Peterson you are truly
wonderful it was nice working with you, and the team of LSS.
I am grateful to Excel Comfort Systems, Inc. for their financial support,
especially, Mr. Johnny Johnson, for his enthusiasm and actively supporting my research.
I am thankful to Gene Bishop, Midlands Tech, for arranging an air conditioner
disassembly workshop that helped a lot in creating the model.
I am also grateful to the faculty, students, and staff in the Department of
Mechanical Engineering for your continuous help.
I have saved the best for last. I could not have reached this stage without the
support of my family. I am grateful to my mother for her influence, encouragement, and
everlasting sacrifice .You have set high standards for me to look up to. I am grateful for
everything you did in shaping me as the person who I am now. I have to mention my
special appreciation for my husband Ayman El-Kattan I would not have had the courage
or strength to continue working on my thesis without your support. Thanks for being a
supporting husband, and making the possible to give me the chance to work on my
research and finish my master’s. Finally I would like to thank my adorable Yasmine for
being a good understanding patient baby, I love you all!
iv
ABSTRACT
Industrial ecology, the science of sustainability, is an evolving concept that offers
a unique approach to the design of industrial products and processes, and the
implementation of sustainable manufacturing strategies. It aims to incorporate the
cyclical patterns of ecosystems into the design phase in order to achieve a pattern of
industrialization that is not only more efficient, but also in compliance with the laws of
Mother Nature. This designed industrial system intends to generate no adverse
environmental effects, since it will eliminate potential causes in the design stage.
The product take-back system is a strategic industry response for moving toward
sustainable development based on the concepts of industrial ecology. The concept is to
shift the industry from take-make-waste system that assumes infinite sources of raw
material and sinks for the industrial wastes into an industrial ecosystem, which operates
successfully in a cyclical manner. It mimics Mother Nature in recognizing that “waste
equals food”, and what goes “out” must finally come “in”. This system promotes and
sells the functionality of the product rather than the product itself.
In this thesis, three comparative scenarios are investigated for the Heating
Ventilation and Air Conditioning (HVAC) industry. The scenarios are either already
existing or theoretically proposed. The first is the current manufacturing process, using
extracted raw materials (primary mining), the second is secondary mining (product
shredding), and finally the demanufacturing process (product disassembly). The
environmental, economic and social dimensions of sustainability are studied using
manufacturer or hypothetical data, or information collected from literature. This work
v

was carried out in conjunction with a local HVAC manufacturer, thus all the generated
data and conducted analysis is contributed from their manufacturing processes. At the
end of this study, the most sustainable process that fulfills the requirements of industrial
ecology is identified.
vi
TABLE OF CONTENTS
DEDICATION..............................................................................................................................................II
ACKNOWLEDGMENTS.......................................................................................................................... III
ABSTRACT ..................................................................................................................................................V
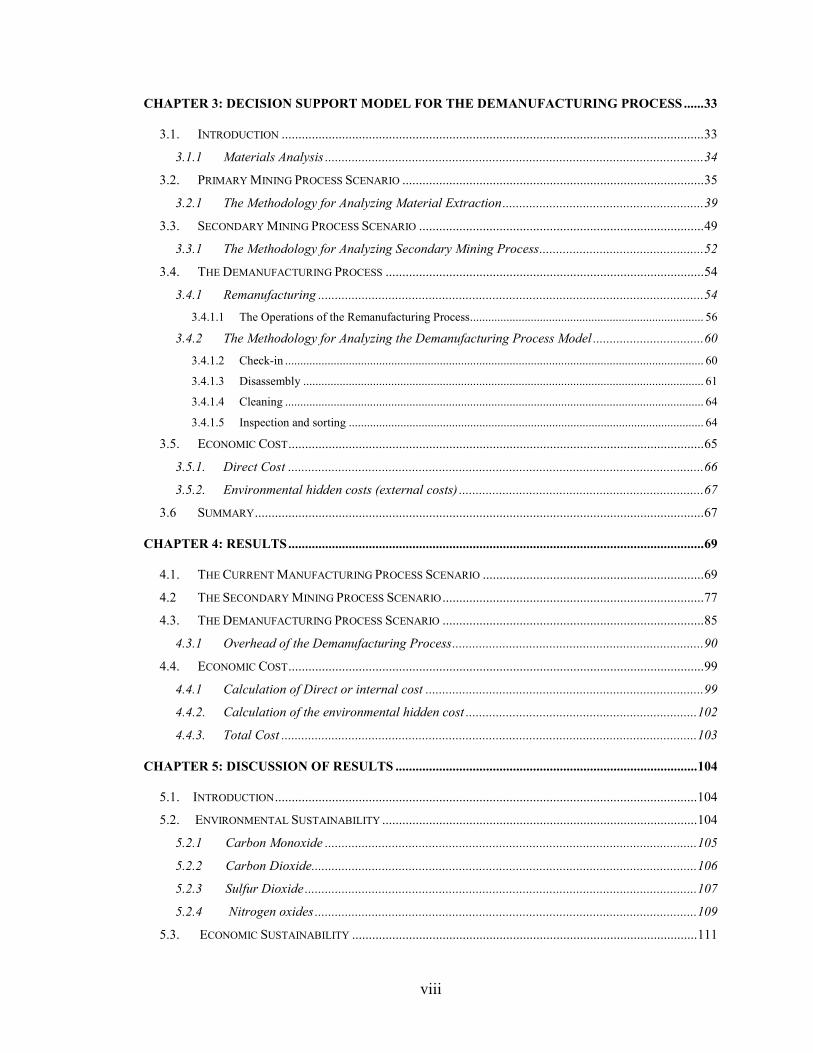
TABLE OF CONTENTS..........................................................................................................................VII
LIST OF TABLES .......................................................................................................................................X
LIST OF FIGURES ..................................................................................................................................XII
CHAPTER 1: INTRODUCTION ................................................................................................................1
1.1. BACKGROUND..................................................................................................................................1
1.2. CONCEPT OF SUSTAINABILITY .........................................................................................................3
1.3. CONCEPT OF SUSTAINABLE DEVELOPMENT.....................................................................................5
1.4. INDUSTRIAL ECOLOGY.....................................................................................................................9
1.4.1 Emulating Mother Nature......................................................................................................10
1.5. INDUSTRIAL METABOLISM .............................................................................................................12
1.5.1 Types of Industrial Ecosystems..............................................................................................15
1.6. INDUSTRIAL SYSTEM MODELS OF THE 21ST CENTURY....................................................................17
1.7. THE PRODUCT TAKE-BACK MODEL..............................................................................................18
1.8. THE FOCUS OF THIS THESIS............................................................................................................20
CHAPTER 2:THE PRODUCT TAKE-BACK MODEL........................................................................21
2.1. BACKGROUND................................................................................................................................21
2.2. DEVELOPMENT OF A PRODUCT TAKE-BACK SYSTEM ....................................................................22
2.3. DRIVERS FOR APPLYING A PRODUCT TAKE-BACK SYSTEM ...........................................................26
2.4. IMPLEMENTING PRODUCT TAKE-BACK SYSTEM IN THE U.S. .........................................................27
2.4.1 The Battery Industry ..............................................................................................................27
2.4.2 Xerox.....................................................................................................................................28
2.4.3 Interface.................................................................................................................................28
2.4.4 Siemens and Nixdorf..............................................................................................................30
2.4.5 Rheem ....................................................................................................................................31
2.5. SUMMARY......................................................................................................................................31
vii
CHAPTER 3: DECISION SUPPORT MODEL FOR THE DEMANUFACTURING PROCESS......33
3.1. INTRODUCTION ..............................................................................................................................33
3.1.1 Materials Analysis .................................................................................................................34
3.2. PRIMARY MINING PROCESS SCENARIO ..........................................................................................35
3.2.1 The Methodology for Analyzing Material Extraction............................................................39
3.3. SECONDARY MINING PROCESS SCENARIO .....................................................................................49
3.3.1 The Methodology for Analyzing Secondary Mining Process.................................................52
3.4. THE DEMANUFACTURING PROCESS ...............................................................................................54
3.4.1 Remanufacturing ...................................................................................................................54
3.4.1.1 The Operations of the Remanufacturing Process............................................................................. 56
3.4.2 The Methodology for Analyzing the Demanufacturing Process Model .................................60
3.4.1.2 Check-in .......................................................................................................................................... 60
3.4.1.3 Disassembly .................................................................................................................................... 61
3.4.1.4 Cleaning .......................................................................................................................................... 64
3.4.1.5 Inspection and sorting ..................................................................................................................... 64
3.5. ECONOMIC COST............................................................................................................................65
3.5.1. Direct Cost ............................................................................................................................66
3.5.2. Environmental hidden costs (external costs) .........................................................................67
3.6 SUMMARY......................................................................................................................................67
CHAPTER 4: RESULTS............................................................................................................................69
4.1. THE CURRENT MANUFACTURING PROCESS SCENARIO ..................................................................69
4.2 THE SECONDARY MINING PROCESS SCENARIO..............................................................................77
4.3. THE DEMANUFACTURING PROCESS SCENARIO ..............................................................................85
4.3.1 Overhead of the Demanufacturing Process...........................................................................90
4.4. ECONOMIC COST............................................................................................................................99
4.4.1 Calculation of Direct or internal cost ...................................................................................99
4.4.2. Calculation of the environmental hidden cost .....................................................................102
4.4.3. Total Cost ............................................................................................................................103
CHAPTER 5: DISCUSSION OF RESULTS ..........................................................................................104
5.1. INTRODUCTION..............................................................................................................................104
5.2. ENVIRONMENTAL SUSTAINABILITY ..............................................................................................104
5.2.1 Carbon Monoxide ...............................................................................................................105
5.2.2 Carbon Dioxide...................................................................................................................106
5.2.3 Sulfur Dioxide .....................................................................................................................107
5.2.4 Nitrogen oxides ..................................................................................................................109
5.3. ECONOMIC SUSTAINABILITY .......................................................................................................111
viii
5.3.1 Economic Cost.....................................................................................................................114
5.4. SOCIAL SUSTAINABILITY .............................................................................................................115
CHAPTER 6: CONCLUSIONS AND RECOMMENDATIONS..........................................................118
6.1. RESEARCH RESULTS.....................................................................................................................118
6.2. EFFECT OF THE DISASSEMBLY OPERATION ON OTHER AREAS .....................................................120
6.3. PRODUCT DESIGN........................................................................................................................121
6.3.1 Sustainable Product Design..................................................................................................122
6.3.2 Design for Disassembly ........................................................................................................123
6.4. GENERAL RECOMMENDATIONS ...................................................................................................124
6.5. FUTURE WORK...........................................................................................................................125
6.6. CONCLUSION .............................................................................................................................127
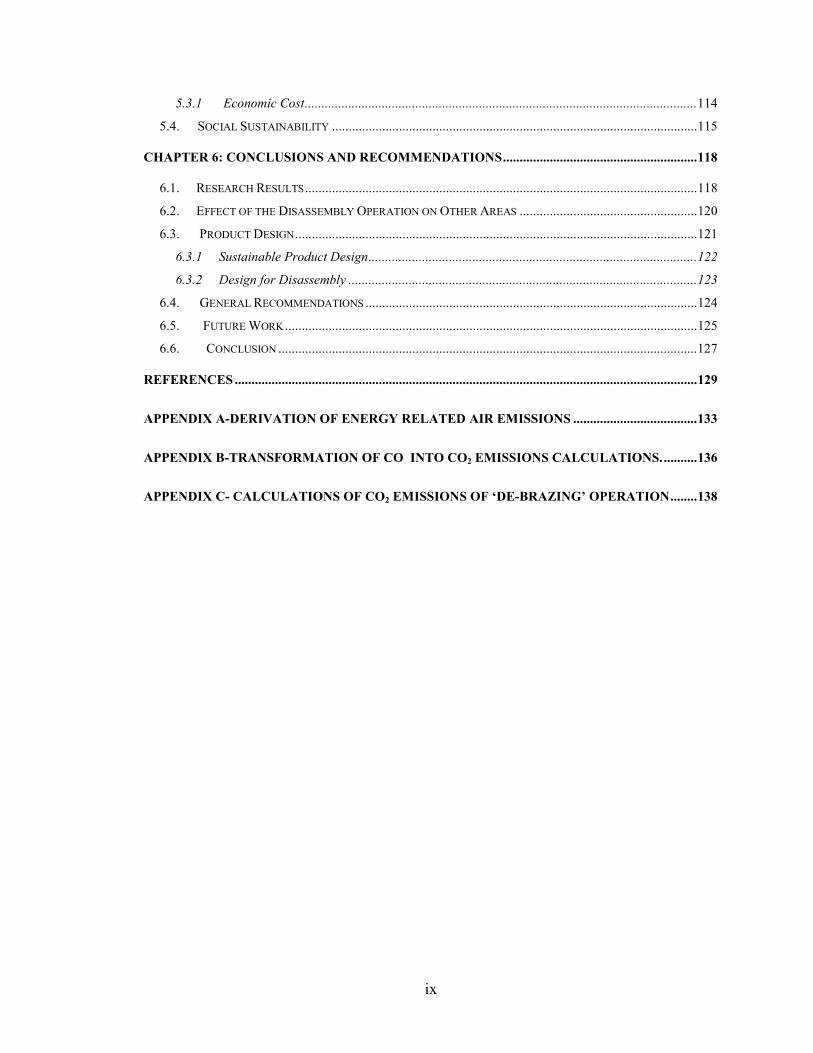
REFERENCES ..........................................................................................................................................129
APPENDIX A-DERIVATION OF ENERGY RELATED AIR EMISSIONS .....................................133
APPENDIX B-TRANSFORMATION OF CO INTO CO2 EMISSIONS CALCULATIONS...........136
APPENDIX C- CALCULATIONS OF CO2 EMISSIONS OF ‘DE-BRAZING’ OPERATION........138
ix

LIST OF TABLES
Table 3.1: Materials Used in Air Conditioner Unit. ......................................................................................34
Table 3.2: Energy Source Percentages. .........................................................................................................41
Table 3.3: The Reduction Factor of the Secondary Mining Process ............................................................52
Table 4.1: Air Conditioner Materials Used Per Year. ...................................................................................71
Table 4.2: Materials Flow Required for the Extraction Process in Lb. .........................................................73
Table 4.3: Total Outputs for All Materials of the Extraction Process. .........................................................74
Table 4.4: Energy Consumed in the Production of the Extraction of Copper, Steel, and Aluminum. .........74
Table 4.5: Air Emissions Associated with Energy Use Required for Extracting Copper...........................75
Table 4.6: Air Emissions Associated with Energy Use Required for Extracting Aluminum. .......................75
Table 4.7: Air Emissions Associated with Energy Use Required for Extracting Steel. ..............................75
Table 4.8: Energy Related Air Emissions for Extracting Materials Used in Producing 100,200 Air
Conditioner Units.................................................................................................................................76
Table 4.9: The Total Environmental Impact of the Primary Mining Process Scenario. ................................77
Table 4.10: Materials That Are Sent for Secondary Mining Process. ...........................................................78
Table 4.11: Reduction Factors for Copper, Steel and Aluminum..................................................................79
Table 4.12: Secondary Mining Process Results. ...........................................................................................79
Table 4.13: Energy Consumed in the Production of Secondary Copper, Steel, and Aluminum ...................80
Table 4.14: Energy Emissions for Mining Secondary Copper. .....................................................................80
Table 4.15: Energy Emissions for Mining Secondary Aluminum.................................................................80
Table 4.16: Energy Emissions for Mining Secondary Steel. .........................................................................81
Table 4.17: Utility Related Air Emissions for Secondary Mining Materials Used in the Production of
100,200 Air Conditioners. ...................................................................................................................81
Table 4.18: The Environmental Impact of Secondary Mining Materials Process. ........................................82
Table 4.19: The Amount of Extracted Raw Materials Needed......................................................................82
Table 4.20: The Environmental Impact of the Extracted Materials for the Secondary Mining Materials
Scenario. ..............................................................................................................................................83
Table 4.21: The Utility Related Air Emissions Resulting from Energy Consumption for Materials
Extraction Process within the Secondary Mining Scenario. ................................................................83
Table 4.22: The Total Environmental Impact for Extracting Materials for the Secondary Mining Materials
Scenario. ..............................................................................................................................................84
Table 4.23: The Total Environmental Impact the Secondary Mining Materials Scenario. ...........................85
Table 4.24: Estimation of Disassembly Times for Air Conditioner. .............................................................88
Table 4.25: Utility Related Air Emissions for Disassembly One Air Conditioner........................................89
Table 4.26: Total Utility Related Air Emissions for Disassembly by Using Power Tools............................90
x
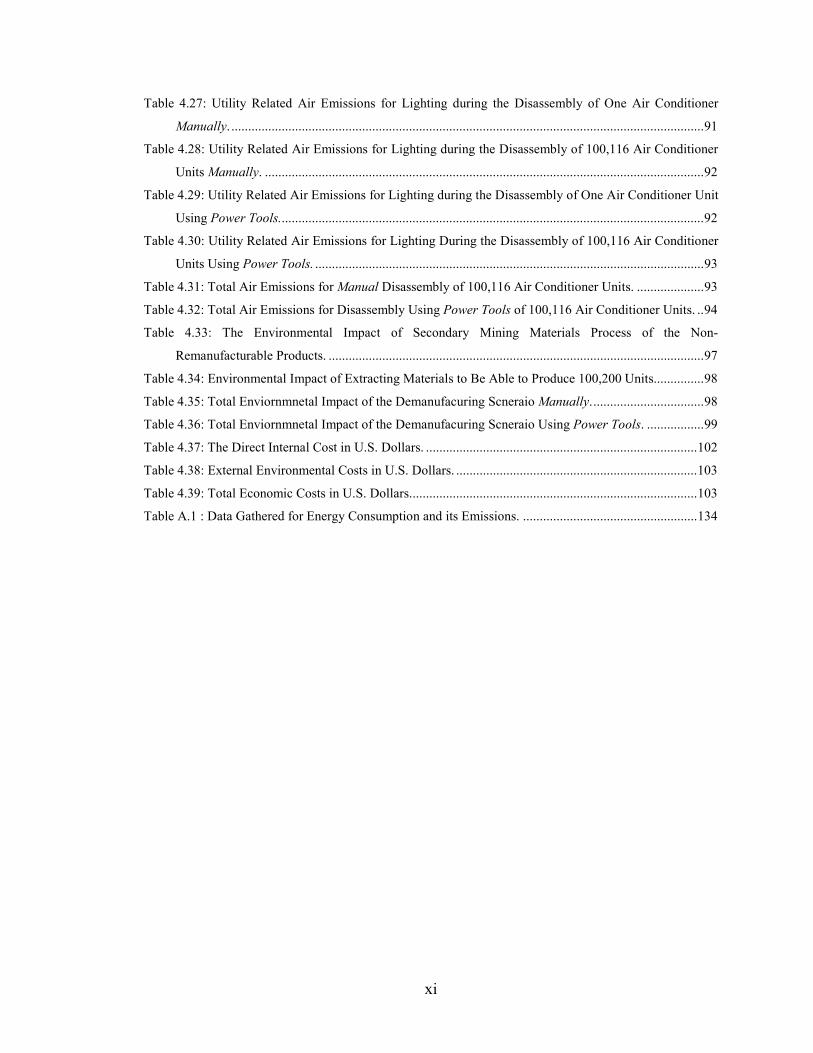
Table 4.27: Utility Related Air Emissions for Lighting during the Disassembly of One Air Conditioner
Manually. .............................................................................................................................................91
Table 4.28: Utility Related Air Emissions for Lighting during the Disassembly of 100,116 Air Conditioner
Units Manually. ...................................................................................................................................92
Table 4.29: Utility Related Air Emissions for Lighting during the Disassembly of One Air Conditioner Unit
Using Power Tools...............................................................................................................................92
Table 4.30: Utility Related Air Emissions for Lighting During the Disassembly of 100,116 Air Conditioner
Units Using Power Tools. ....................................................................................................................93
Table 4.31: Total Air Emissions for Manual Disassembly of 100,116 Air Conditioner Units. ....................93
Table 4.32: Total Air Emissions for Disassembly Using Power Tools of 100,116 Air Conditioner Units. ..94
Table 4.33: The Environmental Impact of Secondary Mining Materials Process of the Non-
Remanufacturable Products. ................................................................................................................97
Table 4.34: Environmental Impact of Extracting Materials to Be Able to Produce 100,200 Units...............98
Table 4.35: Total Enviornmnetal Impact of the Demanufacuring Scneraio Manually..................................98
Table 4.36: Total Enviornmnetal Impact of the Demanufacuring Scneraio Using Power Tools. .................99
Table 4.37: The Direct Internal Cost in U.S. Dollars. .................................................................................102
Table 4.38: External Environmental Costs in U.S. Dollars. ........................................................................103
Table 4.39: Total Economic Costs in U.S. Dollars......................................................................................103
Table A.1 : Data Gathered for Energy Consumption and its Emissions. ....................................................134
xi
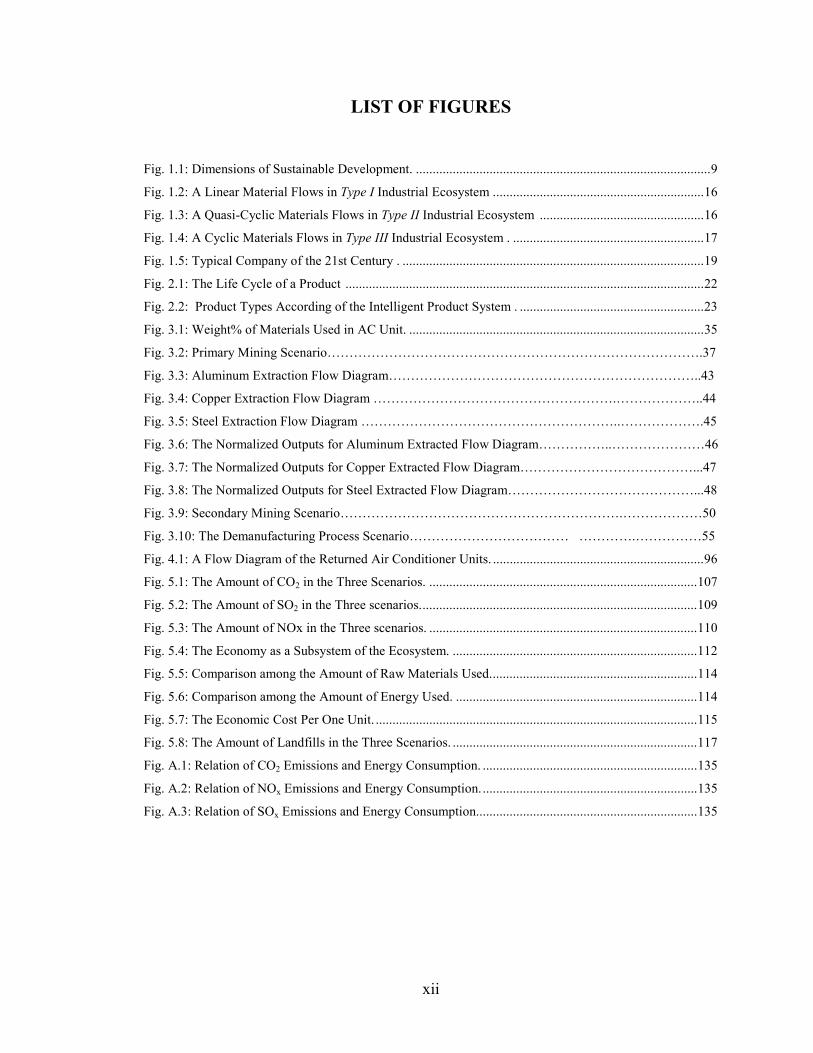
LIST OF FIGURES
Fig. 1.1: Dimensions of Sustainable Development. ........................................................................................9
Fig. 1.2: A Linear Material Flows in Type I Industrial Ecosystem ...............................................................16
Fig. 1.3: A Quasi-Cyclic Materials Flows in Type II Industrial Ecosystem .................................................16
Fig. 1.4: A Cyclic Materials Flows in Type III Industrial Ecosystem . .........................................................17
Fig. 1.5: Typical Company of the 21st Century . ..........................................................................................19
Fig. 2.1: The Life Cycle of a Product ...........................................................................................................22
Fig. 2.2: Product Types According of the Intelligent Product System . .......................................................23
Fig. 3.1: Weight% of Materials Used in AC Unit. ........................................................................................35
Fig. 3.2: Primary Mining Scenario………………………………………………………………………….37
Fig. 3.3: Aluminum Extraction Flow Diagram……………………………………………………………..43
Fig. 3.4: Copper Extraction Flow Diagram ……………………………………………….………………..44
Fig. 3.5: Steel Extraction Flow Diagram …………………………………………………..……………….45
Fig. 3.6: The Normalized Outputs for Aluminum Extracted Flow Diagram……………..…………………46
Fig. 3.7: The Normalized Outputs for Copper Extracted Flow Diagram…………………………………...47
Fig. 3.8: The Normalized Outputs for Steel Extracted Flow Diagram……………………………………...48
Fig. 3.9: Secondary Mining Scenario……………………………………………………….………………50
Fig. 3.10: The Demanufacturing Process Scenario……………………………… ………….……………55
Fig. 4.1: A Flow Diagram of the Returned Air Conditioner Units. ...............................................................96
Fig. 5.1: The Amount of CO2 in the Three Scenarios. ................................................................................107
Fig. 5.2: The Amount of SO2 in the Three scenarios...................................................................................109
Fig. 5.3: The Amount of NOx in the Three scenarios. ................................................................................110
Fig. 5.4: The Economy as a Subsystem of the Ecosystem. .........................................................................112
Fig. 5.5: Comparison among the Amount of Raw Materials Used..............................................................114
Fig. 5.6: Comparison among the Amount of Energy Used. ........................................................................114
Fig. 5.7: The Economic Cost Per One Unit. ................................................................................................115
Fig. 5.8: The Amount of Landfills in the Three Scenarios. .........................................................................117
Fig. A.1: Relation of CO2 Emissions and Energy Consumption. ................................................................135
Fig. A.2: Relation of NOx Emissions and Energy Consumption.................................................................135
Fig. A.3: Relation of SOx Emissions and Energy Consumption..................................................................135
xii
CHAPTER 1
INTRODUCTION
1.1. Background
Since the turn of the twentieth century, technology has been continuously revised
because of the industrial revolution. The result has been a take-make-waste system that
has taken on a life of its own with no regard to the laws of Mother Nature. This system
assumes infinite sources of raw material inputs and sinks for the industrial wastes
[ McDonough 1998].
During this period, it was not important to be concerned about the impact of
industry on the environment since natural resources were thought of as inexhaustible, and
nature was viewed as something to be tamed and civilized. However, the exponential
growth in population, which reached six billion at the end of last year and is expected to
be in excess of ten billion by the year 2030, with its associated increase in demand for
consumer goods, drives the expanded use of national resources as raw material and
extensive growth in energy consumption. This resulted in a negative impact on our
common global environment.
1
Furthermore, we have begun to exceed the carrying capacity of the planet1, and
continued growth will eventually destroy our host, the earth [Hawken 1993]. Taking
these considerations in regard, some leading industrialists realized that conventional ways
of doing things might not be sustainable2 for the generations to come. "What we thought
was boundless has limits,” said Robert Shapiro, the chairman and chief executive officer
of Monsanto, said in a 1997 interview, “and we are beginning to hit them." [ McDonough
1998].
Lester Throw [Anderson 1999]. is of the opinion that we are already in the third
industrial revolution. He believes the first was steam powered; the second was electricity
powered; making possible the third, which is the current information revolution, leading
in the information age. However, Ray Anderson [Anderson 1999]. holds that they all
share some fundamental characteristics that lump them together with an overarching
common theme. They were and remain in an unsustainable phase in civilization’s
development.
Recently, Paul Hawken and Bill McDonough have called for the next industrial
revolution. Anderson as well has called for the next truly revolutionary industrial
revolution - but this time, he said, to get it right - we must be certain it attains
sustainability.
1 Hawken defined the carrying capacity of the planet as the maximum level of a species or population that can be steadily and consistently supported by the resources of the planet 2 See section 1.2
2
1.2. Concept of Sustainability
The concept of sustainability has been proposed in several publications. In his
interesting book, The Ecology of Commerce, the author and entrepreneur Paul Hawken
[ 1993, pg. 139]. described sustainability as “an economic state where the demands
placed upon the environment by people and commerce can be met without reducing the
capacity of the environment to provide for future generations. It can be also expressed in
the simple terms of an economic golden rule for the restorative economy: Leave the
world better than you found it, take no more than you need, try not to harm life or the
environment, make amends if you do”. Thus, sustainability encompasses the principle of
taking from the earth only what it can provide indefinitely thus leaving future generations
no less than we have access to ourselves.
Sustainability was also defined anthropocentrically as meeting the needs of all
humans, being able to do so on a finite planet for generations to come while ensuring
some degree of openness and flexibility to adapt to changing circumstances.
It is interesting to note that all the definitions of sustainability researched share
two common goals:
A goal of conserving irreplaceable resources. ��
�� A goal of environmental maintenance.
It should be emphasized that the concept of sustainability is not a new concept. It
originated in Germany during the late 18th and 19th centuries. At that time, forests upon
which Germany was dependent for wood to support its growing economy were declining
while the population and economy continued to grow. They started to search for a
solution for the national forest resource depletion and its consequences. This resulted in a
3
rise of the sustainability concept that was viewed as a mechanism to ensure prosperity
through ongoing economic growth. This concept was defined as sustained yield. In the
later part of the 19th century, Gifford Pinchot, an American pioneer introduced the
concept of sustained yield in the U.S. Pinchot thought that the U.S. should take an active
role in managing the nation’s natural resources in order to secure a sustainable future and
make economic expansion indefinite [Zovanyi 1998].
It can be speculated that the driving forces behind a move toward sustainability
are:
�� Increasing global population
�� Man's environmental impact on the global commons, and
�� Natural resources depletion
In June 1992, the United Nations Conference on Environment and Development
(UNCED), popularly known as the Earth Summit, took place in Rio de Janeiro, Brazil. It
was the largest UN conference ever held. Approximately 30,000 people from around the
world, including more than a hundred world leaders and representatives of 167 countries,
gathered in Rio de Janeiro to respond to troubling symptoms of environmental decline.
Although it was difficult to get agreement among the participating countries on issues
where deeply held values or economic interests were at stake, everyone anticipated that
this would happen. So, many industrial participants touted a particular strategy:
sustainable development.
4
1.3. Concept of Sustainable Development
In 1972, the concept of sustainable development burst into visibility with the
publication of Donella Meadows’ book, The Limits to Growth, and with the United
Nations' Conference on Human Environment in Sweden, which coined the term
"sustainable development". Since then, it has received growing attention through
deliberate discussion and support via ongoing global conferences.
Sustainable development, like the term sustainability, has many definitions. But
first, it should be explicated as to why it is called sustainable development and not
sustainable growth.
Growth is a quantitative increase in the physical scale. However, development is a
qualitative improvement to a greater or better state. We live on a planet with limited
resources that will never grow because the earth has physical limits. However, it develops
endlessly so as to improve the quality of life may achieve sustainability and create a
better world via sustainable development rather than growth. Sustainable development has been defined according to the work produced by the
World Commission on Environment and Development in 1987 under the title Our
Common Future as, “development that meets the needs of the present without
compromising the ability of future generations to meet their own needs” [WCED 1987].
In other words, sustainable development is used for improvement that satisfies today’s
needs without compromising the needs of future generations. This definition establishes
that the concept of intergenerational equity is the backbone of sustainability, which
means leaving an equitable share of natural resources for future generations. With
sustainable development, environmental issues and concerns cannot be considered in
5
isolation - separate from economic and social development. This new sustainable
development demands the integration of ecological, social, and economic interests.
According to the World Business Council on Sustainable Development,
"sustainable development involves the simultaneous pursuit of economic prosperity,
environmental quality, and social equity. Companies aiming for sustainability need to
perform not against a single, financial bottom line, but against the triple bottom line3
"Over time, human and social values change. Concepts that once seemed extraordinary
(e.g. emancipating slaves, enfranchising women) are now taken for granted. New
concepts (e.g. responsible consumerism, environmental justice, intra- and inter-
generational equity) are now coming up the curve” [WBCSB 2000].
The International Institute for Sustainable Development, in conjunction with
Deloitte and Touche, developed the following description of sustainable development for
business strategy.
For the business enterprise, sustainable development means adopting
business strategies and activities that meet the needs of the enterprise and
its stakeholders today while protecting, sustaining, and enhancing the
human and natural resources that will be needed in the future. This
definition falls far short of the concept of "full sustainability" or the
rigorous definition of sustainable development. The conflict of stakeholder
needs versus resource protection opens the door to ambiguity and
interpretation. This definition also falls short by failing to provide for
3 See chapter 5 for more information.
6
measurability. Despite weakness of this definition, the existing business
climate (including political and economic infrastructures and technology)
does not provide a suitable environment for pursuing rigorous
sustainability. The Deloitte and Touche definition is arguably the most
practical definition for the short-term future. As sustainability becomes an
increasingly visible issue it seems likely that corporations will find
themselves facing more rigorous definitions [IISD 2000].
Herman Daly [1996]. defined sustainable development in his book Beyond
Growth as “development without growth – without growth in throughput beyond
environmental regenerative and a absorptive capacity. Throughput is the flow of
materials and energy through the human economy. It includes everything we make and
do. Throughput is calculated as the total number of people multiplied by their
consumption”. In other words, the regenerative and absorptive capacity of the
environment is its ability to produce raw materials for our use and to provide us a sink for
discarding our wastes. To be sustainable, our throughput should not exceed the capacity
of the environment; otherwise, negative consequences will be produced.
So far, there is no definition for sustainable development that satisfies everyone,
and perhaps there will never be such a thing. But, a practical understanding of sustainable
development is easily achieved if we are going to bear in our minds the following
concepts:
It is a direction rather than a “carved in stone” list of specific definitions. ��
�� It is about creating a better world through balancing environmental, social,
and economic factors.
7
Accordingly, sustainable development can be symbolized as the search for an
economy that can exists in an equilibrium with the earth’s limited resources and its
natural ecosystems. Furthermore, sustainable development can bring the environmental
quality together with economic growth into harmony rather than conflict. It is a concept
that recognizes that both economic activities and environmental considerations should
always be integrated for humanity’s long-term well being [Richards, et. al. 1994].
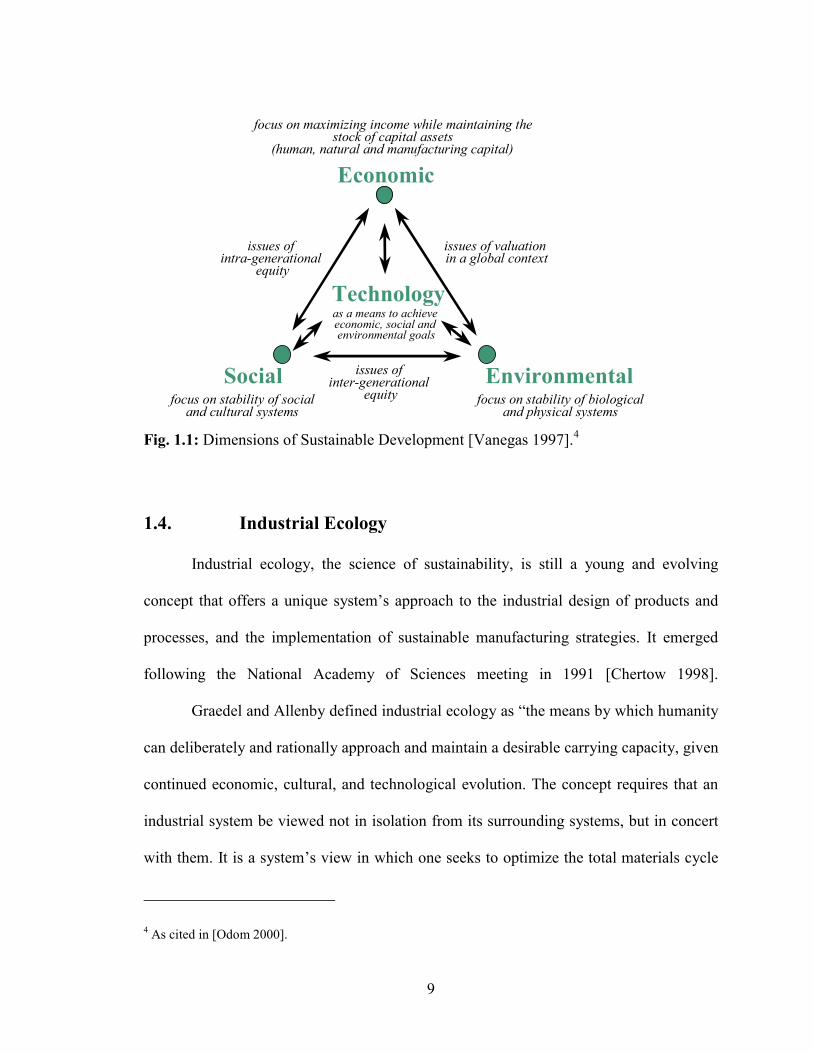
As a summary, sustainable development involves the simultaneous pursuit of
economic prosperity, environmental quality, and social equity. It improves the economy
without undermining the social and environmental forces upon which it depends. It
focuses on improving our lives without continuously increasing the amount of energy or
raw materials consumed in a manner that is faster than the natural systems can
regenerate. Furthermore, it requires managing our lives in a way that ensures that both
economy and society can continue to exist without destroying the natural environment
upon which our lives depend. Companies aiming for sustainable development need to
perform not just in accordance with the economic aspect, but in accordance with all three
aspects [Vanegas 1997]. This is illustrated in Fig. 1.1 , which demonstrates that these
dimensions inextricably linked.
8
Economic
EnvironmentalSocial
issues of valuation in a global context
issues of intra-generational
equity
Technologyas a means to achieve economic, social and environmental goals
issues of inter-generational
equityfocus on stability of socialand cultural systems
focus on stability of biologicaland physical systems
focus on maximizing income while maintaining thestock of capital assets
(human, natural and manufacturing capital)
Fig. 1.1: Dimensions of Sustainable Development [Vanegas 1997].4
1.4. Industrial Ecology
Industrial ecology, the science of sustainability, is still a young and evolving
concept that offers a unique system’s approach to the industrial design of products and
processes, and the implementation of sustainable manufacturing strategies. It emerged
following the National Academy of Sciences meeting in 1991 [Chertow 1998].
Graedel and Allenby defined industrial ecology as “the means by which humanity
can deliberately and rationally approach and maintain a desirable carrying capacity, given
continued economic, cultural, and technological evolution. The concept requires that an
industrial system be viewed not in isolation from its surrounding systems, but in concert
with them. It is a system’s view in which one seeks to optimize the total materials cycle
4 As cited in [Odom 2000].
9
from virgin material, to finished material, to component, to product, to obsolete product,
and finally to ultimate disposal” [Graedel and Allenby 1995].
1.4.1 Emulating Mother Nature
The principle of industrial ecology was acknowledged 500 years ago by Leonardo
da Vinci when he said:
“Although human genius through various inventions, makes instruments
corresponding the same ends, it will never discover an invention more beautiful, nor
more ready, nor more economical than does nature, because in her inventions nothing is
lacking and nothing is superfluous” [Young, et. al. 1997].
Therefore, industrial ecology is about the incorporation of natural systems into
our industrial infrastructures and learning from the efficiency of natural systems. It takes
the model of the natural environment as a way for solving environmental problems,
creating a new paradigm for the industrial system in the process.
The idea of an industrial ecology is based upon a straightforward analogy
with natural ecological systems. In nature an ecological system operates
through a web of connections in which organisms live and consume each
other and each other’s waste. The system has evolved so that the
characteristic of communities of living organisms seems to be that nothing
that contains available energy or useful material will be lost. There will
evolve some organism that will manage to make its living by dealing with
any waste product that provides available energy or usable material.
Ecologists talk of a food web: an interconnection of uses of both
10
organisms and their wastes. In the industrial context, we may think of this
as being use of products and waste products. The system structure of a
natural ecology and the structure of an industrial system, or an economic
system, are extremely similar [Frosch 1992].
In nature, all materials are reused and nothing is endlessly discarded. Nature has
acquired this approach because extracting these materials from reserves is costly in terms
of resources and energy, and this is always avoided whenever possible. On the other
hand, our industrial system discards materials to the ecosystem at unnecessary high cost.
As a result, products should be thought of as residues rather than wastes, and it should be
considered that wastes are basically residues that our economy has yet to use efficiently.
Characteristic features of Mother Nature that could be emulated by industry
includes [Tibbs 1991]:
1. In natural ecosystems there is no such thing as "waste"; considering something
that cannot be absorbed in the system.
2. Waste from one species is the food for another.
3. Concentrated toxins are not stored or transported in bulk at the system level, but
are synthesized and used as needed only by the individuals of a species. (Snake
venom is produced in glands immediately behind the snake’s teeth.)
4. Materials and energy are constantly circulating and transforming within Mother
Nature.
5. Mother Nature runs entirely on solar energy.
6. Mother Nature is dynamic and information-driven, and the identity of each of its
species is defined in process terms.
11
7. Mother Nature allows independent activity of species individuals. However,
cooperation and competition interlink them and hold them in balance.
In conclusion, the aim of industrial ecology is to incorporate the cyclical patterns
of ecosystems into designs for industrial production processes, in order to achieve a
pattern of industrialization that is not only more efficient, but adjusted to the
characteristic features of Mother Nature. An industrial system of this type will have no
adverse environmental effects, because it will have eliminated potential causes in the
design stage.
1.5. Industrial Metabolism
Metabolism, as used in its original biological definition, can be described as the
process in which the organism ingests energy rich materials (food) to support its
maintenance and functions, as well as a surplus to permit its own growth and
reproduction. It also involves excretion of the generated waste consisting of degraded
materials.
With this information in mind, industrial metabolism can be defined as a complete
integrated collection of physical processes that convert raw materials, energy, and labor
into finished products as well as wastes in a steady state condition. The stabilizing
controls of the system are provided by its human component.
It is worth noting that this concept can also be applied to other self-organizing
entities, such as manufacturing firms. A manufacturing firm is the economic synonym of
a living organism. However, some differences prevail between a living organism and a
firm. For example, biological organisms reproduce themselves. On the contrary, firms
12
produce products or services. Furthermore, the firms are not specialized and can easily
change from one product or business to another depending on the market demands. By
contrast, organisms are highly specialized and cannot change their behavior except over a
long period of time. The life cycle of individual materials in the living organism are
closed, whereas, most industrial cycles are open. In other words, the industrial system
doesn’t generally recycle its wastes. However, it starts with high quality materials
extracted from the earth, and returns them to the nature in degraded forms [Ayres and
Ayres 1998].
The ultimate goal in industrial metabolism is to achieve advances across the
horizon of industrial processes, bringing them more into line with the metabolic patterns
used in the natural ecosystem. As a result of this, management of the interface between
industry and the biosphere would become easier and the in-process energy demands
would be reduced, process would be safer, and the industrial metabolites would be more
compatible with natural ecosystems. This is the absolute longer-term objective, however,
at this point and in the form of modest rationale process improvement, industrial
metabolism has much to offer, as a result it is always considered as an important
component of industrial ecology [Tibbs 1991]. Frosch and Gallopoulos have discussed
the relationship between biological ecology and that of industrial activities:
In a biological ecosystem, some of the organisms use sunlight, water, and
minerals to grow, while others consume the first. Alive or dead, along
with minerals and gases, and produce wastes of their own. These wastes
are in turn food for other organisms, some of which may convert the
wastes into the minerals used by the primary producers, and some of
13
which consume each other in a complex network of processes in which
everything produced is used by some organism for its own metabolism.
Similarly, in the industrial ecosystem, each process and network of
processes must be viewed as a dependent and interrelated part of a larger
whole. The analogy between the industrial ecosystem concept and the
biological ecosystem is not perfect, but much could be gained if the
industrial system were to mimic the best features of the biological
analogue [Frosch 1992].
The approaches that can be used to achieve these goals are:
1. Optimizing the use of materials and embedded energy, waste reduction, re-
evaluation of wastes as raw material for other processes, and consideration of
wastes as products so as to close the manufacturing loop.
2. Understanding the ecosystem assimilative capacity and development of
indicators to quantify the environmental impact of industrial processes so as to
balance the industrial input and output in relation to natural ecosystem capacity.
3. Creating metabolic pathways in industrial processes.
4. Introducing systemic schemes of energy use.
5. Opening of long-term viewpoints in analysis of industrial system development.
It can be speculated that new processes (organisms) were created by the biological
evolution to stabilize the inherently unstable situations and close the open cycles. This
degree of stability that the biosphere reached took several billion years. However, in the
case of industrial system, the time scales have been significantly shortened. Furthermore,
14
the rate of resources mobilization by human industrial activity is in most cases
comparable to that of the natural rate. This is reason for concern about long term stability.
[Ayres and Ayres 1998].
The aim of the industrial metabolism is to understand the circulation of materials
and energy in industrial systems from their initial extraction to their inevitable
reintegration into the overall biogeochemical cycles. In addition, to develop an ecosystem
in which the consumption of energy and materials is optimized, waste generation is
minimized, and the effluents of one process serve as raw materials for another process.
Ultimately, The industrial ecosystem should end up working as a biological system
[Hileman 1998].
From the above discussion, it can be seen that industrial ecology is an expansion
of industrial metabolism. The industrial metabolism aims to look at the total pattern of
energy/material flows from initial extraction of resources to final disposal of wastes.
However, industrial ecology looks for determining how the industrial system can be
restructured to make it compatible with the way Mother Nature functions.
1.5.1 Types of Industrial Ecosystems
It is instructive to consider first the current state of existing industrial ecosystems,
to be able to start thinking about environmentally preferable industrial systems.
The evolution of industrial ecosystem is recognized in three possible stages:
Type �: In this stage, the industrial ecosystem might be described as linear, one-way flows
of products where the life cycle of the product occurs with no regard for reuse or
15

recovery of materials or components, and independent of all other flows. Schematically,
it takes the form of Fig. 1.2.
Unlimited
Waste
Unlimited
Resource
ECOSYSTEM
COMPONENET
Fig. 1.2: A Linear Material Flows in Type I Industrial Ecosystem [Graedel and Allenby 1995].
Type II: In this stage, the industrial ecosystem interlinking between products and related
materials occurs. Although there is still an input of virgin materials and a disposal of
wastes outside the system, the flows of material within the system are larger, but the
flows into and out of it are smaller. Schematically, it takes the form of Fig. 1.3.
The Type II industrial ecosystem is more efficient than Type I, but still it is not
sustainable because it continues to have an input (virgin materials) and an output
(wastes); moving linearly in one direction.
ECOSYSTEMComponent
ECOSYSTEMComponent
ECOSYSTEMComponent
UnlimitedWaste
Energy and limited
Resources
Fig. 1.3: A Quasi-Cyclic Materials Flows in Type II Industrial Ecosystem [Graedel and Allenby 1995].
Hypothetical Type III: In this arrangement, the industrial ecosystem follows the principle
“waste from one component is the food for another”. It mimics the biological ecosystem,
16
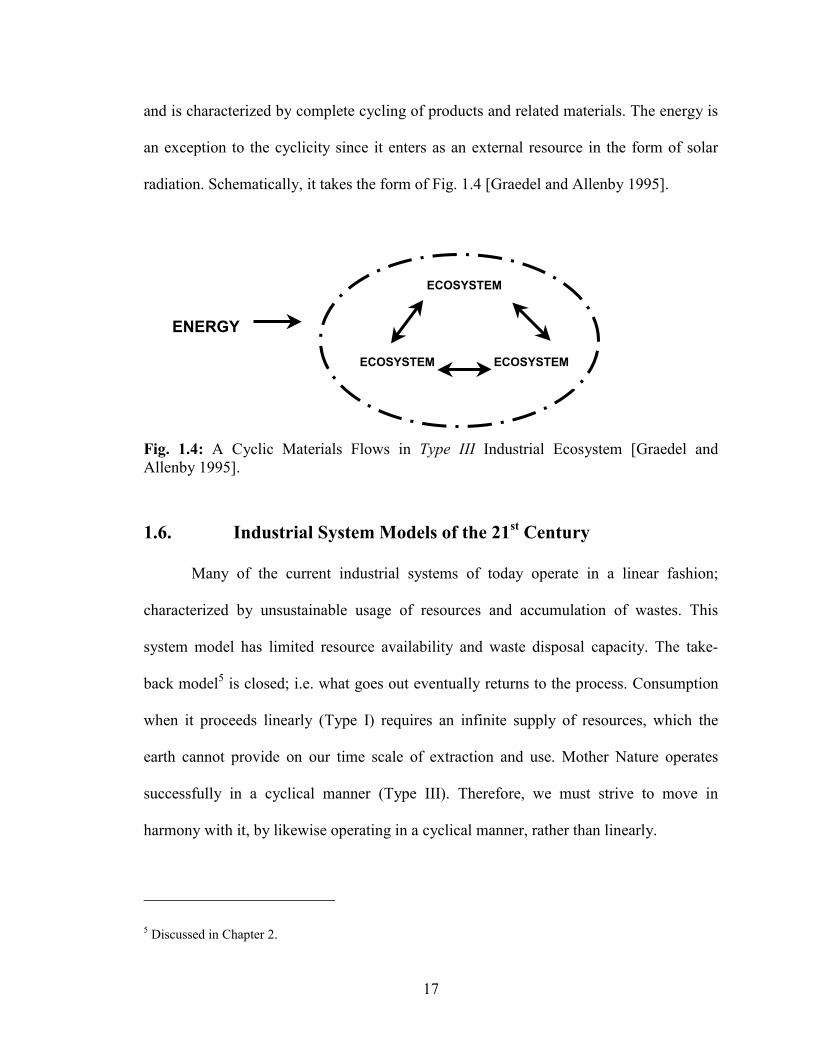
and is characterized by complete cycling of products and related materials. The energy is
an exception to the cyclicity since it enters as an external resource in the form of solar
radiation. Schematically, it takes the form of Fig. 1.4 [Graedel and Allenby 1995].
ENERGY
ECOSYSTEM ECOSYSTEM
ECOSYSTEM
Fig. 1.4: A Cyclic Materials Flows in Type III Industrial Ecosystem [Graedel and Allenby 1995].
1.6. Industrial System Models of the 21st Century
Many of the current industrial systems of today operate in a linear fashion;
characterized by unsustainable usage of resources and accumulation of wastes. This
system model has limited resource availability and waste disposal capacity. The take-
back model5 is closed; i.e. what goes out eventually returns to the process. Consumption
when it proceeds linearly (Type I) requires an infinite supply of resources, which the
earth cannot provide on our time scale of extraction and use. Mother Nature operates
successfully in a cyclical manner (Type III). Therefore, we must strive to move in
harmony with it, by likewise operating in a cyclical manner, rather than linearly.
5 Discussed in Chapter 2.
17
Hawken puts it elegantly: "Any ecological model of commerce must not only
mimic nature in recognizing that waste equals food, running off of current solar income,
and protecting diversity, but it must also have firmly and clearly in place feedback that
allows it to recalibrate constantly and quickly adjust its costs, supply, and demand.
Instead of following the cyclical paradigm, most of our resource businesses today are
linear systems that by their nature receive and give out the wrong information to
themselves and the greater environment." [Hawken 1993].
Instead of continuously searching for virgin resources and then disposing of
process excesses when they become waste, we need to design our industrial systems so
that as little waste as possible is provided to begin with, i.e. it will focus on service and
value of the product instead of material throughput. And engaging external organizations
to encourage sustainable practices. Fig. 1.5 summarizes all the above as a schematic
diagram [Anderson 1998].
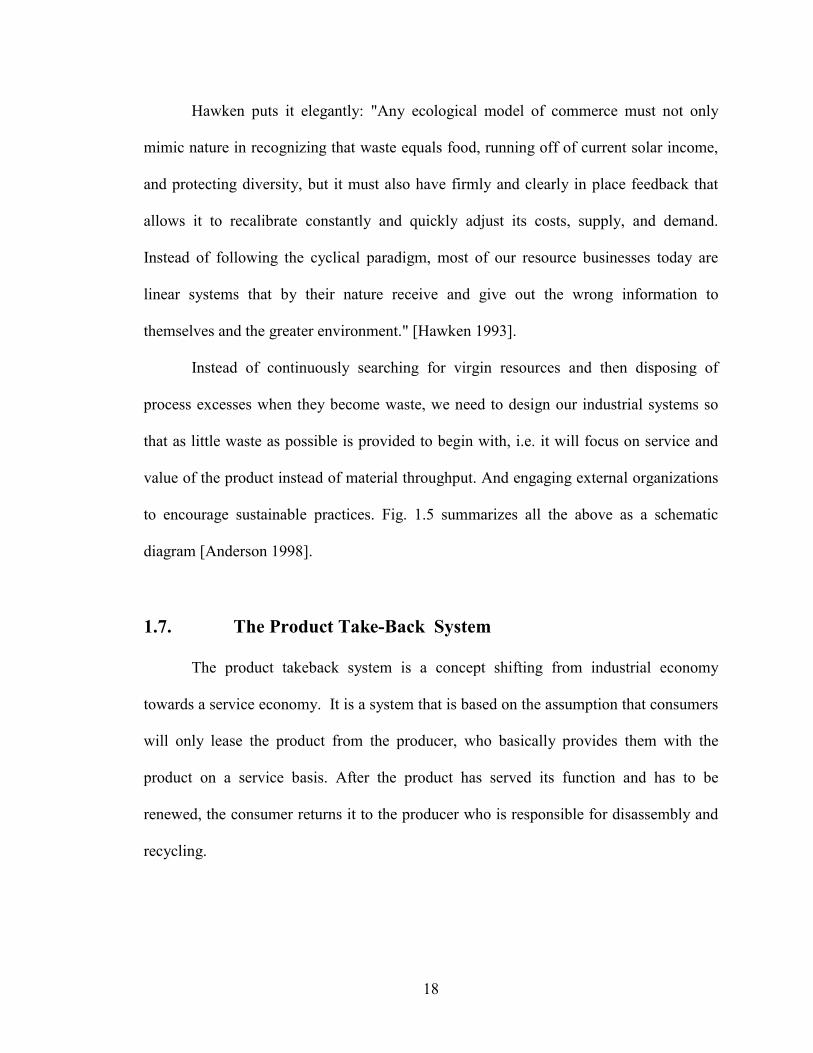
1.7. The Product Take-Back System
The product takeback system is a concept shifting from industrial economy
towards a service economy. It is a system that is based on the assumption that consumers
will only lease the product from the producer, who basically provides them with the
product on a service basis. After the product has served its function and has to be
renewed, the consumer returns it to the producer who is responsible for disassembly and
recycling.
18
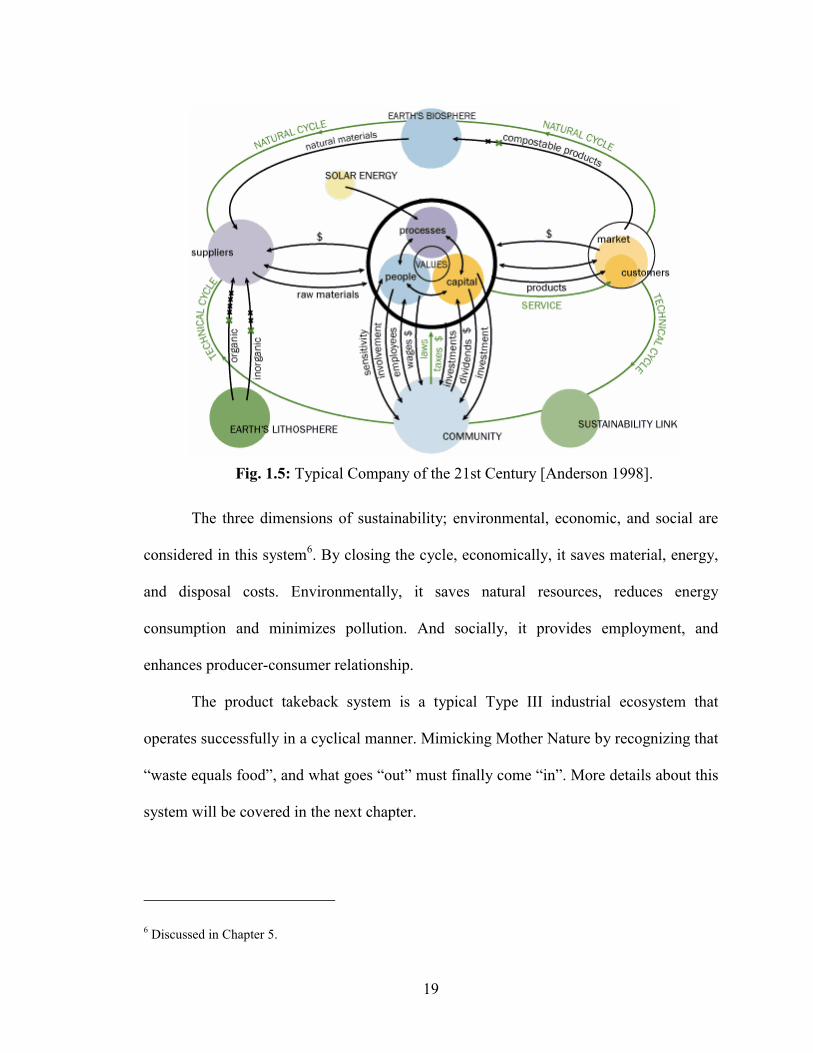
Fig. 1.5: Typical Company of the 21st Century [Anderson 1998].
The three dimensions of sustainability; environmental, economic, and social are
considered in this system6. By closing the cycle, economically, it saves material, energy,
and disposal costs. Environmentally, it saves natural resources, reduces energy
consumption and minimizes pollution. And socially, it provides employment, and
enhances producer-consumer relationship.
The product takeback system is a typical Type III industrial ecosystem that
operates successfully in a cyclical manner. Mimicking Mother Nature by recognizing that
“waste equals food”, and what goes “out” must finally come “in”. More details about this
system will be covered in the next chapter.
6 Discussed in Chapter 5.
19
1.8. The Focus of this Thesis
This thesis provides a decision support comparison of the demanufacturing
process for an industry pursuing sustainability via the product take-back model. This
model views each product as a service provided to the consumer and aims to transform
industry from a Type I industrial ecosystem into a Type III (cyclical one)in an attempt to
mimic Mother Nature by recognizing that “waste equals food”, and what goes “out” must
finally come “in”.
Three comparative scenarios are investigated for the Heating Ventilation and Air
Conditioning (HVAC) industry. The scenarios are either already existing or theoretically
proposed. The first is the current manufacturing process, using extracted raw materials
(primary mining), the second is secondary mining (product shredding), and the third is
the demanufacturing process (product disassembly). The environmental, economic, and
social dimensions of sustainability are studied using manufacturer or hypothetical data, or
information collected from literature. This work was carried out in conjunction with a
local HVAC manufacturer, thus all the generated data and conducted analysis is
contributed from their manufacturing processes. At the end, the most sustainable process
that fulfills the requirements of industrial ecology is identified.
20
CHAPTER 2
THE PRODUCT TAKE-BACK MODEL
2.1. Background
The product take-back model is a new strategy that is being adopted by industry
attempting to move toward sustainable development. It is a product-oriented approach to
environmental protection that promotes and sells the functionality of products rather than
the products themselves. It also encourages the reuse of the products rather than their
recycling. In other words, the value of the products is more closely attributed to their
performance and real use [Richards, et. al. 1994].
The concept of this approach is to close the loop of materials and component
usage by reusing them in new product manufacturing. As illustrated in Fig. 2.1, in this
system the life cycle of a product is changing from a linear cycle (Type I) into a cyclic
one (Type III). In Type I, the first stage is designing the product according to customer’s
needs; in this linear life cycle raw materials go through processing and manufacturing
into products that will be used by the customers. At the end of the life cycle, the product
reaches the retirement phase, which is the final stage of the linear life cycle. On the
contrary, in the cyclic life cycle, the environmental factors (materials recyclability,
reusability, and energy needed for assembly or ease of disassembly) are integrated in the
early design of the product and the raw materials used in the product manufacturing
21
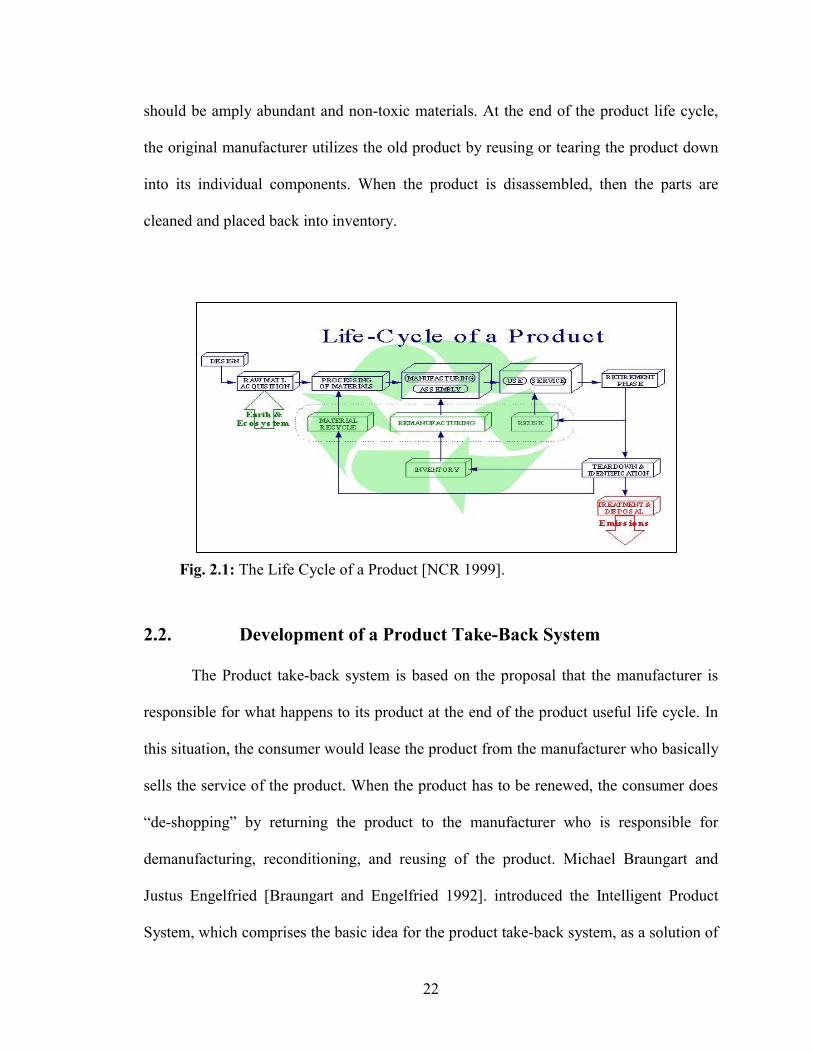
should be amply abundant and non-toxic materials. At the end of the product life cycle,
the original manufacturer utilizes the old product by reusing or tearing the product down
into its individual components. When the product is disassembled, then the parts are
cleaned and placed back into inventory.
Fig. 2.1: The Life Cycle of a Product [NCR 1999].
2.2. Development of a Product Take-Back System
The Product take-back system is based on the proposal that the manufacturer is
responsible for what happens to its product at the end of the product useful life cycle. In
this situation, the consumer would lease the product from the manufacturer who basically
sells the service of the product. When the product has to be renewed, the consumer does
“de-shopping” by returning the product to the manufacturer who is responsible for
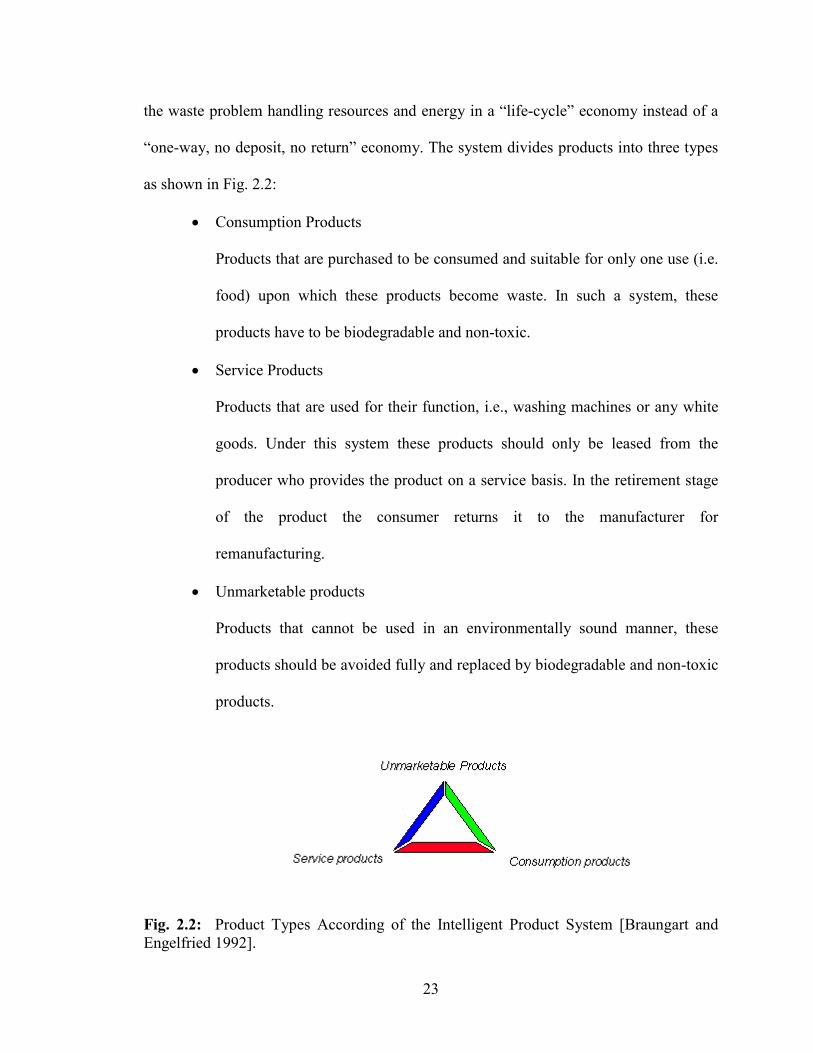
demanufacturing, reconditioning, and reusing of the product. Michael Braungart and
Justus Engelfried [Braungart and Engelfried 1992]. introduced the Intelligent Product
System, which comprises the basic idea for the product take-back system, as a solution of
22
the waste problem handling resources and energy in a “life-cycle” economy instead of a
“one-way, no deposit, no return” economy. The system divides products into three types
as shown in Fig. 2.2:
Consumption Products ��
��
��
Products that are purchased to be consumed and suitable for only one use (i.e.
food) upon which these products become waste. In such a system, these
products have to be biodegradable and non-toxic.
Service Products
Products that are used for their function, i.e., washing machines or any white
goods. Under this system these products should only be leased from the
producer who provides the product on a service basis. In the retirement stage
of the product the consumer returns it to the manufacturer for
remanufacturing.
Unmarketable products
Products that cannot be used in an environmentally sound manner, these
products should be avoided fully and replaced by biodegradable and non-toxic
products.
Fig. 2.2: Product Types According of the Intelligent Product System [Braungart and Engelfried 1992].
23
As a result, according to the “intelligent product system” consumption and service
products can substitute all current types of waste.
The product take-back system, which aims at transforming industry into a
restorative cooperation by providing food for the process, is considered as an outgrowth
of extended producer responsibility (EPR). EPR was introduced early in this decade by
Thomas Lindhqvist, a Swedish professor of environmental economics, who defined EPR
as:
“Extended producer responsibility is an environmental protection
principle to reach an environmental objective of a decreased total
environmental impact from a product, by making the manufacturer of the
product responsible for the entire life-cycle of the product and especially
for the take-back, recycling and final disposal of the product. The
extended producer responsibility is implemented through administrative,
economic and informative instruments. The composition of these
instruments determines the precise form of the extended producer
responsibility” [Lindhqvist 1993].
The concept of EPR has also evolved in the U.S. In 1996, the President's Council
on Sustainable Development (PCSD) defined EPR “extended product responsibility” as
the shared responsibility of government, consumers, and all industry actors in the product
chain for all the environmental impacts of a product over its life cycle [Fishbein 1998].
It can be speculated that the main attribute of the product take-back system in the
U.S. is that there is no emphasis on the producer's unique responsibilities or on the post-
24
consumer stage, rather it is a shared responsibility to decrease the life cycle
environmental impacts of the product between of producer, consumer and government.
These responsibilities are:
Producer’s Responsibility
To design environmentally friendly products that directly involve: ��
��
��
��
��
��
��
��
��
��
��
��
Including materials that are readily recyclable.
Avoiding using different and a variety of materials.
Minimizing the use of non-renewable resources.
Eliminating and or reducing hazardous materials use.
�� To design products for reusability and remanufacturability by:
Increasing product modularity to reduce variability of parts.
Reducing the amount of products and materials to be landfilled by including
durable products and materials.
Avoiding deleterious material combinations.
Protecting parts against soil and corrosion.
To design the product for ease of disassembly and reassembly.
To sell the functionality of the product rather than the product itself.
To take-back the product at the end of its life cycle.
Consumer’s Responsibility
To buy Ecoproducts. ��
�� To Support product take-back systems.
25
Government’s Responsibility
�� To buy products with benign environmental impacts.
�� To reduce obstacles to recovery of take-back products.
It should be emphasized that the EPR in the U.S. is not mandatory but it is a
recommended policy by PCSD to "achieve national environmental, economic and social
goals” [EPA 2000].
2.3. Drivers for Applying a Product Take-Back System
There are many drivers behind the application of product take-back system. This
system reduces virgin materials extraction by transforming the used materials that are
regarded as waste into valuable products. In addition, it minimizes the cost of the
purchased parts and components by realizing a savings in raw material and spares parts
costs when reusing components from end of life cycle products. This will be associated
with a reduction in the energy use and its associated environmental impacts (i.e. by
recovering embedded energy from reused parts). It should also be emphasized that the
waste issue is becoming a priority in environmental policies in Europe and other
countries, since available landfill space is shrinking thereby increasing disposal fees.
Therefore the product take-back model is one of the most important solutions for this
problem. Moreover, with the global concern about environment, companies may take a
competitive advantage by applying a product take-back system. Remanufactured products
may be introduced to the market as Ecoproducts. This type of label is appealing to the
consumer. In purchasing these products, people are fulfilling a desire to do something
26

good for the environment. Furthermore, remanufactured products are cheaper and have
the same guarantees against failure as new ones, which make for a good marketing
argument for selling, especially to customers with budget limitations. Likewise, this
system fosters customer loyalty (i.e. in returning an end of life product to the original
manufacturer, the customer can be encouraged to purchase again). Finally, in some
countries, legislation exist that has made product take-back system obligatory for the
companies to apply it [Lindhqvist 1993].
2.4. Implementing Product Take-Back System in the U.S.
Although EPR in the U.S. is not obligatory, a number of corporations have started
implementing their own product take-back systems. The industry examples in the
following sections are but a few examples of the product take-back system are in
existence:
2.4.1 The Battery Industry
The battery industry started a product take-back system because of the
inconsistent legislation of producer responsibility for nickel-cadmium rechargeable
batteries. In 1995, they established the Rechargeable Battery Recycling Corporation
(RBRC) to collect and recycle the batteries. Their goal is to recycle 70 percent of
disposed batteries by 2001. By 1997, they reached 22 percent from 2 percent in 1993
[Fishbein, 1998].
27
2.4.2 Xerox
Xerox, a leading company in manufacturing photocopiers, used to “takeback” its
products for use as service parts. However, after refurbishing the parts, they used to sell
them to contractors who would recondition the old equipment. Gradually, Xerox found
itself in competition with those contractors but customers continued to blame Xerox for
quality problems [Ayres, Ferre et al. 1997] . To handle the “takeback” machines
returning to Xerox and to standardize its take-back and remanufacturing operations,
Xerox established its Asset Recycle Management (ARM) Program in 1991 [Davis 1996].
This program saved raw materials and gained Xerox a competitive edge over other
manufacturers. In addition, this program has cut about $200 million in raw material and
parts savings by taking back 70% of its equipment once disposed of at landfills. As for
landfills, it dropped from 2500 tons in 1992 to 1000 tons by the second quarter of 1995
with annual savings of $200,000 in disposal costs by applying ARM. Total savings in
1996 amounted to about $65 million. Furthermore, the huge amount of raw materials
savings interprets lowering the metal ores, coal, petroleum and other materials that would
be extracted to produce them [Ayres, Ferre et al. 1997] .
2.4.3 Interface
Interface, a global carpet company, has created what they refer to as theEvergreen
Lease program - the leasing of carpet, rather than selling it. The customer pays monthly
for the service of the carpet, not the carpet itself. Interface seeks to be the first sustainable
corporation, following that, the first restorative company. In 1994, they put into practice
the Quality Utilizing Employee Suggestions and Teamwork (QUEST). Then, Interface
28
Research managed a program called EcoSense, to measure their progress. They joined the
two programs (QUEST and EcoSense) together so as to be able to achieve their goal.
Interface emulated Mother Nature by redesigning its processes and products into cyclical
material flow. They reduced the use of raw materials from the earth and tried to get best
use of the materials they use. To do so, they used natural organic materials. Interface is
already on the track to produce zero waste and scrap to the landfill [Interface 1997]. After
three and a half years of applying their program, they reduced the waste by 40 percent,
almost $67 million savings which they used in paying the costs of their new model. In
addition, scrap to landfills has been reduced to 60 percent [Anderson 1999] .
Being a typical company in the 21st century, Interface has taken the following
steps to align itself with its sustainability goals [Anderson 1998]:
1 Zero waste.
The first step is eliminating the waste, not reducing it.
2 Benign emissions.
Through eliminating the emissions to Mother Nature that have toxic effects.
3 Use renewable resources.
By reducing the energy needed in the processes and substituting non-renewable
sources with renewable ones.
4 Close the loop.
By mimicking the Mother Nature’s biological ecosystem; operating in a cyclic -
not a one-way system.
29
5 Resource efficient transportation.
Investigating methods to reduce the transportation of products and people in favor
of moving information.
6 Sensitivity hook-up.
Creating a community that sees the operation of Mother Nature and our impact on
it.
7 Redesign commerce.
So that it will focus on service and value of the product instead of material, and
engaging external organizations to encourage sustainable practices. Recall Fig.
1.5 summarizes all the above in a schematic preview.
2.4.4 Siemens and Nixdorf
Siemens and Nixdorf are two companies that have an established take-back
program to remarket old computers without any disassembly process. Since their merge
in 1991, they started to think about closing the loop by reusing the old parts in service
operations. They realized the potential that the recycling held for improving product
design. By learning the design limitations during the process of disassembly, they could
build newer computers that are better and more recyclable in the future. They established
a centralized recycling facility in Paderborn, Germany that manages computer recycling
and provides input for product designers. In 1995, they got back 5,400 tons of equipment,
and 85% of this was either reused or recycled. The objective is to reduce the amount of
landfill from 18% to 10% by year 2000. At this stage, the firm charges its customers
when they return products. The fees are based on a sliding scale. In the future when the
30
electronic waste legislation is implemented in Germany the company is aware that they
will be obligated to take-back its products free of charge. As a result, the company has
started to institute a point-of-sale recycling fee on some of its products, thus increasing
the total sales price of the item [Davis 1996] .
2.4.5 Rheem
Disposal of used water heaters is difficult, in addition there is a $25 landfill
charge. Rheem, a water heater manufacturing company instituted a National Water
Heater Recycling Program. In this program, Rheem “takes-back” old products provided
the contractor buys a new Rheem product. Rheem as an aside has set up a container for
free disposal of any water heater made by any company. When the container is full, a
scrap metal company retrieves the old water heaters and recycles them. They recycled
80,000 tons of steel, which is a huge saving in raw material use and in landfill space. In
addition, this program, would solve disposal problem for plumbing contractors, create
sales for Rheem since each must buy a new Rheem product after disposing an old one
and helps improve environmental quality [Ferenc 1994] .
2.5. Summary
Based on the previous discussion, most of the current applied take-back systems
focus is on the economic profit by disassembling the returned products and reusing their
parts for the purpose of service or marketing their products.
Economic profit is only a part of the advantages that result from a product take-
back system over other implemented systems. In the next chapter, a suggested
31
demanufacturing process model of product take-back system will be introduced. It
emphasizes integrating the ecological, economic, and social dimensions of sustainability
as an approach industrial sustainability attainment.
32

CHAPTER 3
DECISION SUPPORT MODEL FOR
THE DEMANUFACTURING PROCESS
3.1. Introduction
The product take-back system is a method that promotes the concept that the
product provides a service for consumers. It is based on the premise that the manufacturer
sells the functionality of products rather than the products themselves. Under this system,
consumers will only lease the product from the producer who basically provides them
with the product on a service basis. After the product has served its function and has to be
renewed, the consumer returns it to the producer who is responsible for disassembling
and reusing the product’s parts. As a result, the product, which is considered a “waste”
under the current manufacture-consume-dispose industrial system, becomes actually
"food" in the proposed product take-back system.
As mentioned before, the aim of product take-back system is to approach
industrial sustainability. It demands the integration of ecological, social, and economic
interests. So the product take-back system will perform not just against a single economic
aspect but against these three aspects. It can be speculated that the main objective of this
system is to improve the economy without undermining the social and environmental
aspects and decreasing the amount of energy and/or raw materials consumption. Taking
33
these findings into account, Interface is one of a handful of companies that applies the
product take-back system seeking sustainability. However, it lacks the technology for
reusing old fibers as raw material for making new carpet fiber [Anderson 1999] .
In this chapter, the three comparative scenarios are investigated; these scenarios
include the current manufacturing process, using extracted raw materials (primary
mining), the secondary mining (product shredding), and the demanufacturing process
(product disassembly).
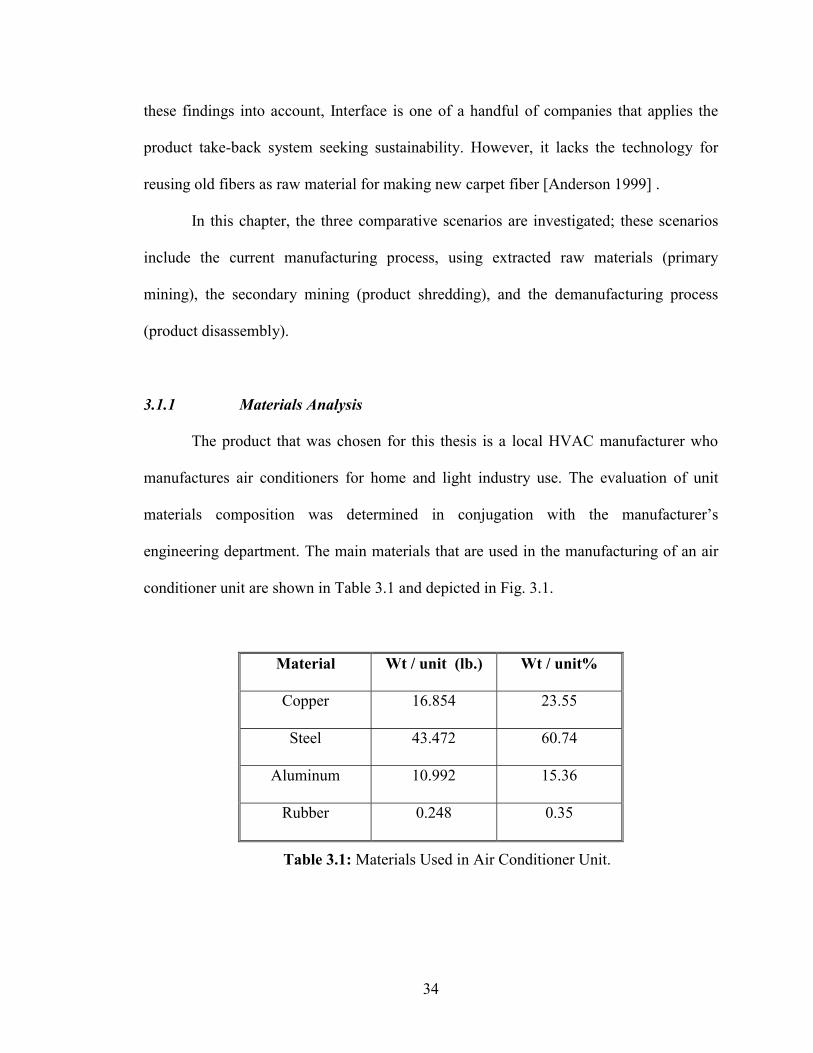
3.1.1 Materials Analysis
The product that was chosen for this thesis is a local HVAC manufacturer who
manufactures air conditioners for home and light industry use. The evaluation of unit
materials composition was determined in conjugation with the manufacturer’s
engineering department. The main materials that are used in the manufacturing of an air
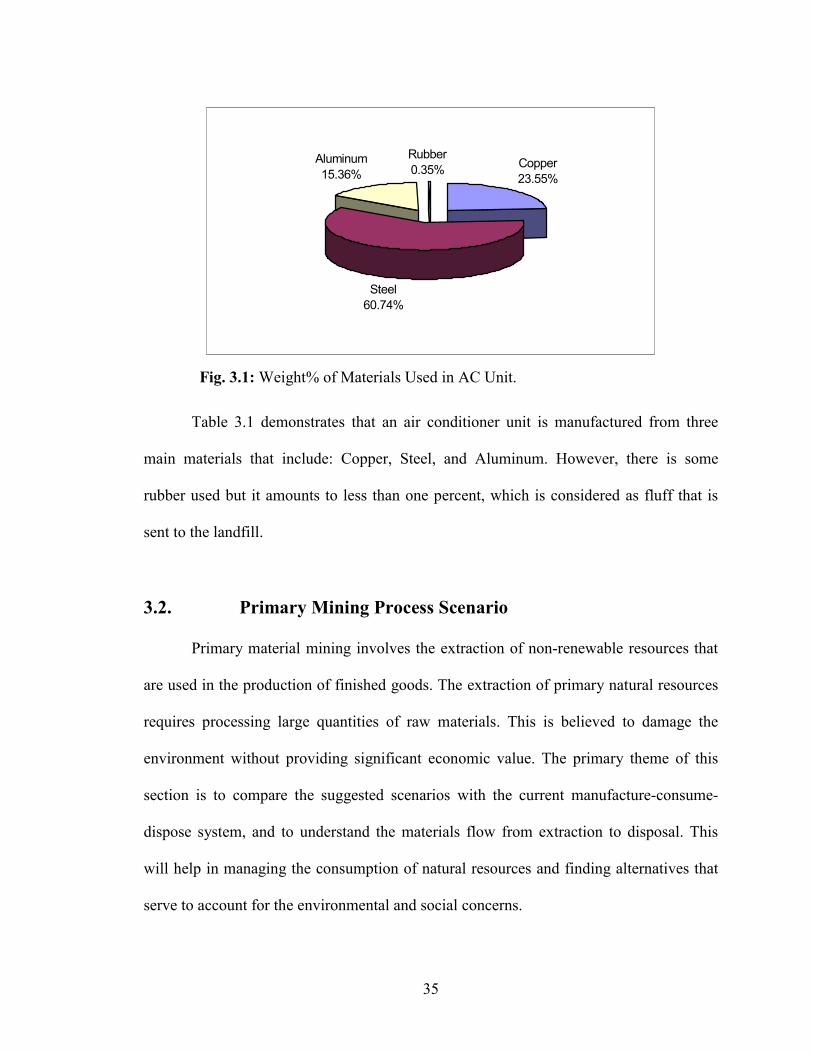
conditioner unit are shown in Table 3.1 and depicted in Fig. 3.1.
Material Wt / unit (lb.) Wt / unit%
Copper 16.854 23.55
Steel 43.472 60.74
Aluminum 10.992 15.36
Rubber 0.248 0.35
Table 3.1: Materials Used in Air Conditioner Unit.
34
Copper23.55%
Steel60.74%
Aluminum15.36%
Rubber0.35%
Fig. 3.1: Weight% of Materials Used in AC Unit.
Table 3.1 demonstrates that an air conditioner unit is manufactured from three
main materials that include: Copper, Steel, and Aluminum. However, there is some
rubber used but it amounts to less than one percent, which is considered as fluff that is
sent to the landfill.
3.2. Primary Mining Process Scenario
Primary material mining involves the extraction of non-renewable resources that
are used in the production of finished goods. The extraction of primary natural resources
requires processing large quantities of raw materials. This is believed to damage the
environment without providing significant economic value. The primary theme of this
section is to compare the suggested scenarios with the current manufacture-consume-
dispose system, and to understand the materials flow from extraction to disposal. This
will help in managing the consumption of natural resources and finding alternatives that
serve to account for the environmental and social concerns.
35
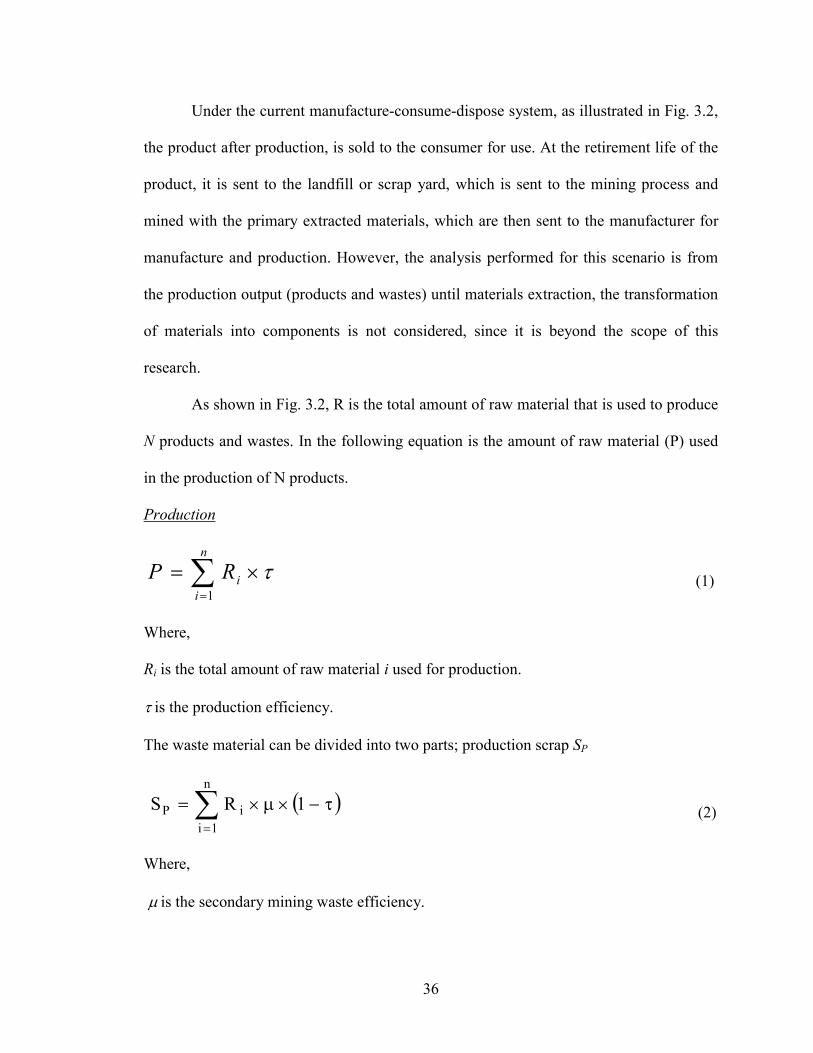
Under the current manufacture-consume-dispose system, as illustrated in Fig. 3.2,
the product after production, is sold to the consumer for use. At the retirement life of the
product, it is sent to the landfill or scrap yard, which is sent to the mining process and
mined with the primary extracted materials, which are then sent to the manufacturer for
manufacture and production. However, the analysis performed for this scenario is from
the production output (products and wastes) until materials extraction, the transformation
of materials into components is not considered, since it is beyond the scope of this
research.
As shown in Fig. 3.2, R is the total amount of raw material that is used to produce
N products and wastes. In the following equation is the amount of raw material (P) used
in the production of N products.
Production
��� ��
n
iiRP
1 (1)
Where,
Ri is the total amount of raw material i used for production.
� is the production efficiency.
The waste material can be divided into two parts; production scrap SP
(2) � ��������
1RSn
1iiP �
Where,
� is the secondary mining waste efficiency.
36
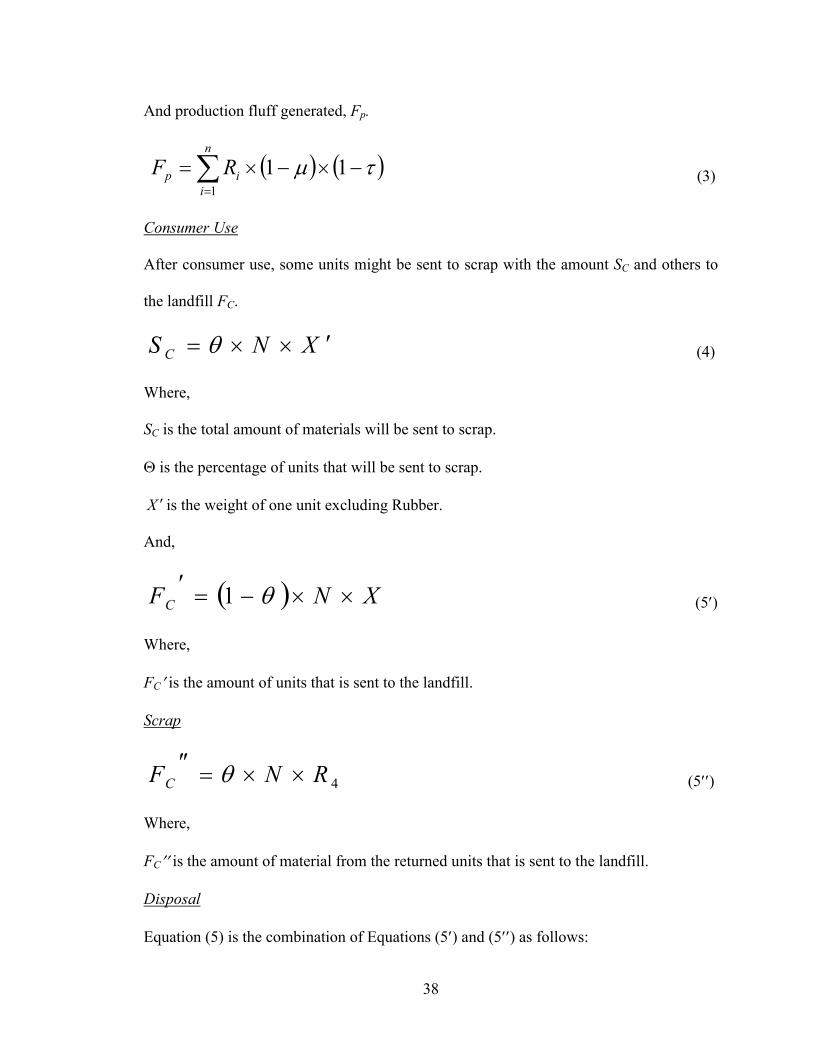
And production fluff generated, Fp.
(3) � � � �� �������
111
n
iip RF �
Consumer Use
After consumer use, some units might be sent to scrap with the amount SC and others to
the landfill FC.
XNS C ���� � (4)
Where,
SC is the total amount of materials will be sent to scrap.
� is the percentage of units that will be sent to scrap.
X � is the weight of one unit excluding Rubber.
And,
� � XNFC �����
�1 (5�)
Where,
FC� is the amount of units that is sent to the landfill.
Scrap
4RNFC ����
� (5��)
Where,
FC�� is the amount of material from the returned units that is sent to the landfill.
Disposal
Equation (5) is the combination of Equations (5�) and (5��) as follows:
38
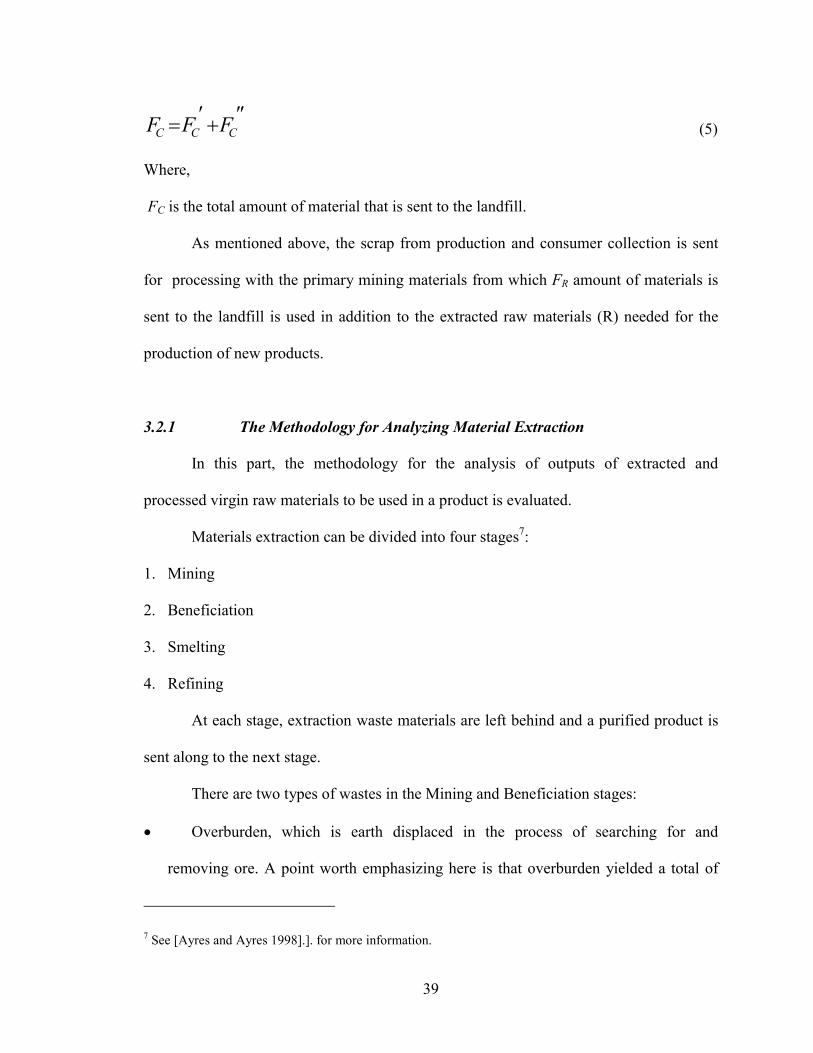
���
� CCC FFF (5)
Where,
FC is the total amount of material that is sent to the landfill.
As mentioned above, the scrap from production and consumer collection is sent
for processing with the primary mining materials from which FR amount of materials is
sent to the landfill is used in addition to the extracted raw materials (R) needed for the
production of new products.
3.2.1 The Methodology for Analyzing Material Extraction
In this part, the methodology for the analysis of outputs of extracted and
processed virgin raw materials to be used in a product is evaluated.
Materials extraction can be divided into four stages7:
1. Mining
2. Beneficiation
3. Smelting
4. Refining
At each stage, extraction waste materials are left behind and a purified product is
sent along to the next stage.
There are two types of wastes in the Mining and Beneficiation stages:
�� Overburden, which is earth displaced in the process of searching for and
removing ore. A point worth emphasizing here is that overburden yielded a total of
7 See [Ayres and Ayres 1998].]. for more information.
39
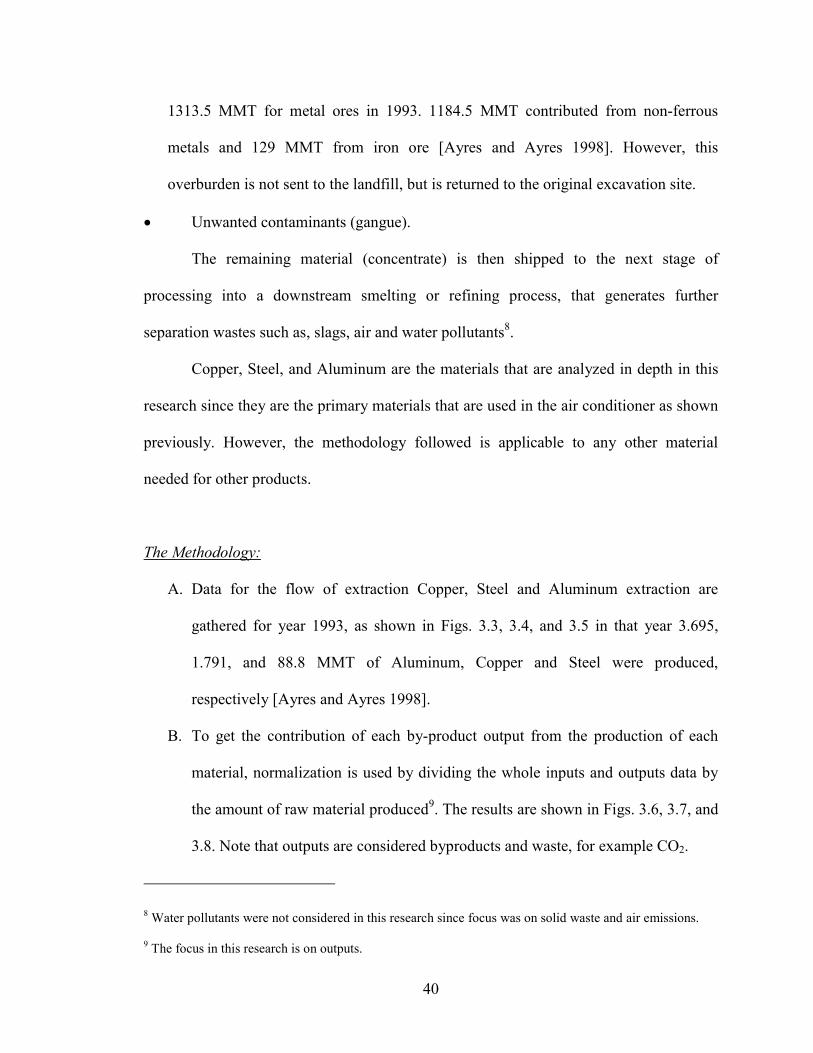
1313.5 MMT for metal ores in 1993. 1184.5 MMT contributed from non-ferrous
metals and 129 MMT from iron ore [Ayres and Ayres 1998]. However, this
overburden is not sent to the landfill, but is returned to the original excavation site.
�� Unwanted contaminants (gangue).
The remaining material (concentrate) is then shipped to the next stage of
processing into a downstream smelting or refining process, that generates further
separation wastes such as, slags, air and water pollutants8.
Copper, Steel, and Aluminum are the materials that are analyzed in depth in this
research since they are the primary materials that are used in the air conditioner as shown
previously. However, the methodology followed is applicable to any other material
needed for other products.
The Methodology:
A. Data for the flow of extraction Copper, Steel and Aluminum extraction are
gathered for year 1993, as shown in Figs. 3.3, 3.4, and 3.5 in that year 3.695,
1.791, and 88.8 MMT of Aluminum, Copper and Steel were produced,
respectively [Ayres and Ayres 1998].
B. To get the contribution of each by-product output from the production of each
material, normalization is used by dividing the whole inputs and outputs data by
the amount of raw material produced9. The results are shown in Figs. 3.6, 3.7, and
3.8. Note that outputs are considered byproducts and waste, for example CO2.
8 Water pollutants were not considered in this research since focus was on solid waste and air emissions.
9 The focus in this research is on outputs.
40

C. From the above results, outputs of producing N units are calculated according the
following equation:
Y (6) XNC jiji ���
Where,
Yij: is the by-product output i of material j extraction.
jiC : is the normalizing factor of output i with respect to materials j extraction
N: is the number of units produced.
X: is the amount of material j used for producing one unit.
D. All similar by-product outputs resulting from the mining of Copper, Steel and
Aluminum are added together to evaluate the impact of producing N units by
combining all used materials in producing such product.
E. The amount of air releases resulting from the energy consumption for each mining
process was determined.
To evaluate these releases, some assumptions for energy source were made as
shown in Table 3.2:
Energy source Percentage
Coal 61% Oil 1%
Natural Gas 5% Nuclear 28%
Large Hydroelectric 5% Renewable 0%
Table 3.2: Energy Source Percentages10.
10 Based on South Carolina Energy Sources [EDF 2000].
41

The three main air emissions resulting from energy are11:
(7)
(8)
(9)ESO
ENO
ECO
X
���
���
���
�
�
�
62
6
42
1056.2
1022.1
1072.3
Where,
E : is energy consumed in kJ.
meE ��
Where,
e: is energy consumed in kJ/Kg.
m: is the mass of materials processed.
F. The similar releases of materials extraction (e.g. CO2) and energy con
releases (e.g. CO2) are added together.
G. These results and some additional needed information are used in chap
analyzing the current manufacturing process with regard to the three dime
sustainability.
11 Calculations for obtaining these values are described in appendix A.
42
sum
ter
nsi
(10)
ption
5 for
ons of
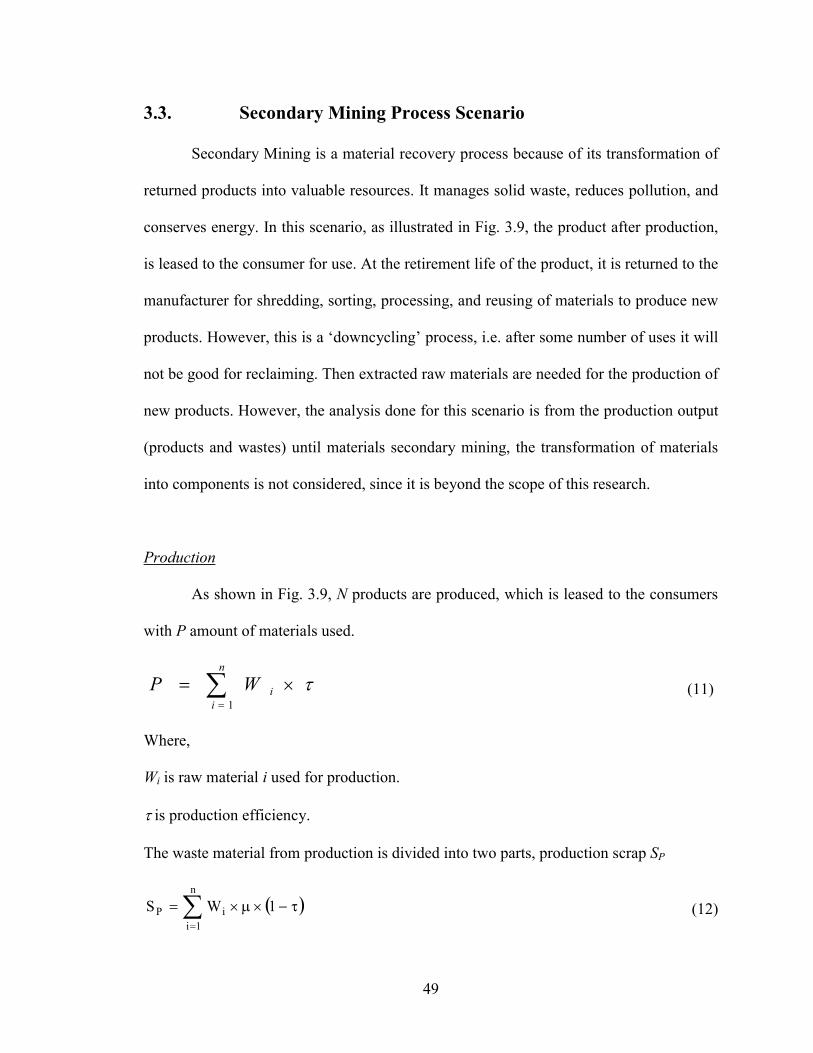
3.3. Secondary Mining Process Scenario
Secondary Mining is a material recovery process because of its transformation of
returned products into valuable resources. It manages solid waste, reduces pollution, and
conserves energy. In this scenario, as illustrated in Fig. 3.9, the product after production,
is leased to the consumer for use. At the retirement life of the product, it is returned to the
manufacturer for shredding, sorting, processing, and reusing of materials to produce new
products. However, this is a ‘downcycling’ process, i.e. after some number of uses it will
not be good for reclaiming. Then extracted raw materials are needed for the production of
new products. However, the analysis done for this scenario is from the production output
(products and wastes) until materials secondary mining, the transformation of materials
into components is not considered, since it is beyond the scope of this research.
Production
As shown in Fig. 3.9, N products are produced, which is leased to the consumers
with P amount of materials used.
��� ��
n
iiWP
1 (11)
Where,
Wi is raw material i used for production.
� is production efficiency.
The waste material from production is divided into two parts, production scrap SP
� ��������
1WSn
1iiP � (12)
49
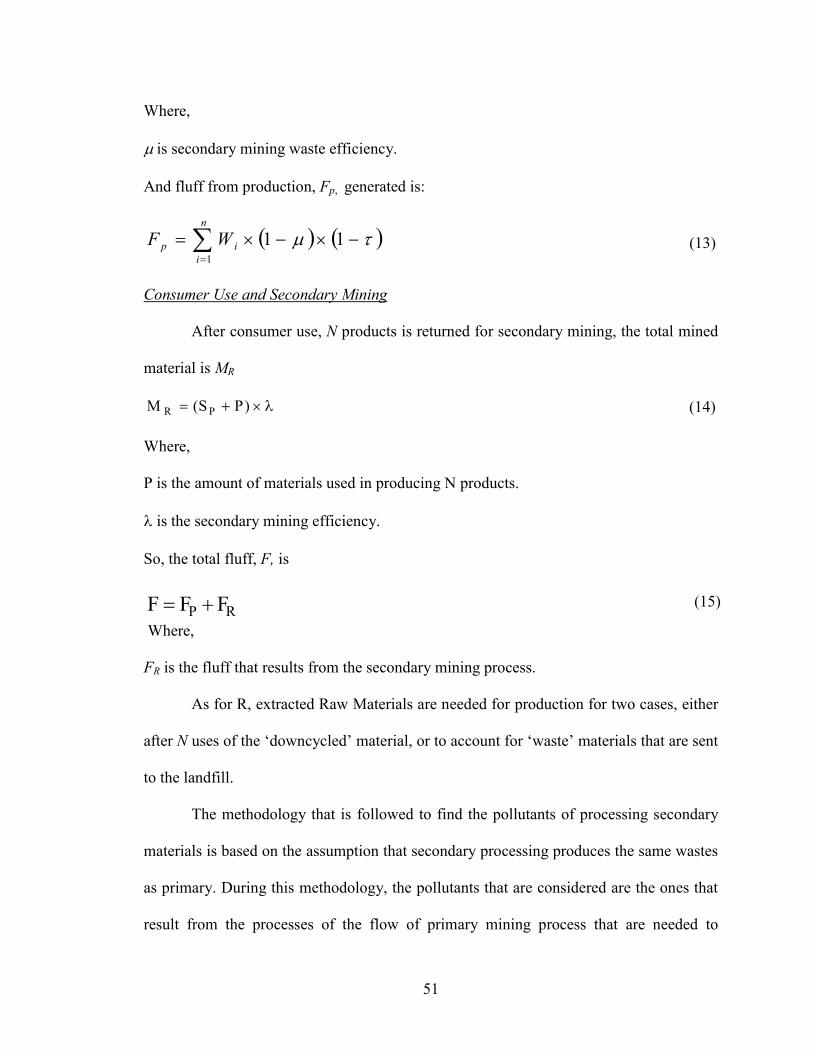
Where,
� is secondary mining waste efficiency.
And fluff from production, Fp, generated is:
� � � �� ����� ��
111
n
iip WF � (13)
Consumer Use and Secondary Mining
After consumer use, N products is returned for secondary mining, the total mined
material is MR
���� )PS(M PR (14)
Where,
P is the amount of materials used in producing N products.
� is the secondary mining efficiency.
So, the total fluff, F, is
RP FFF ��
Where,
FR is the fluff that results from the secondary mining process.
As for R, extracted Raw Materials are needed for production for two cases, e
after N uses of the ‘downcycled’ material, or to account for ‘waste’ materials that are
to the landfill.
The methodology that is followed to find the pollutants of processing secon
materials is based on the assumption that secondary processing produces the same w
as primary. During this methodology, the pollutants that are considered are the ones
result from the processes of the flow of primary mining process that are neede
51
(15)
ither
sent
dary
astes
that
d to
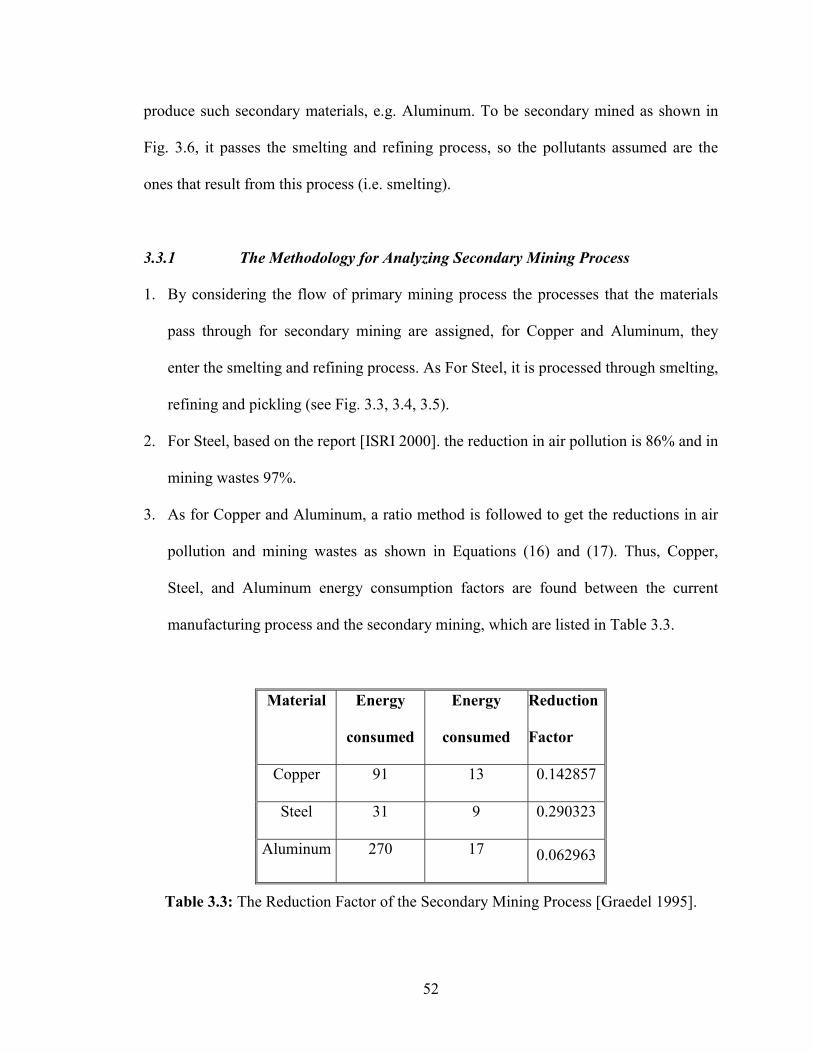
produce such secondary materials, e.g. Aluminum. To be secondary mined as shown in
Fig. 3.6, it passes the smelting and refining process, so the pollutants assumed are the
ones that result from this process (i.e. smelting).
3.3.1 The Methodology for Analyzing Secondary Mining Process
1. By considering the flow of primary mining process the processes that the materials
pass through for secondary mining are assigned, for Copper and Aluminum, they
enter the smelting and refining process. As For Steel, it is processed through smelting,
refining and pickling (see Fig. 3.3, 3.4, 3.5).
2. For Steel, based on the report [ISRI 2000]. the reduction in air pollution is 86% and in
mining wastes 97%.
3. As for Copper and Aluminum, a ratio method is followed to get the reductions in air
pollution and mining wastes as shown in Equations (16) and (17). Thus, Copper,
Steel, and Aluminum energy consumption factors are found between the current
manufacturing process and the secondary mining, which are listed in Table 3.3.
Material Energy
consumed
Energy
consumed
Reduction
Factor
Copper 91 13 0.142857
Steel 31 9 0.290323
Aluminum 270 17 0.062963
Table 3.3: The Reduction Factor of the Secondary Mining Process [Graedel 1995].
52
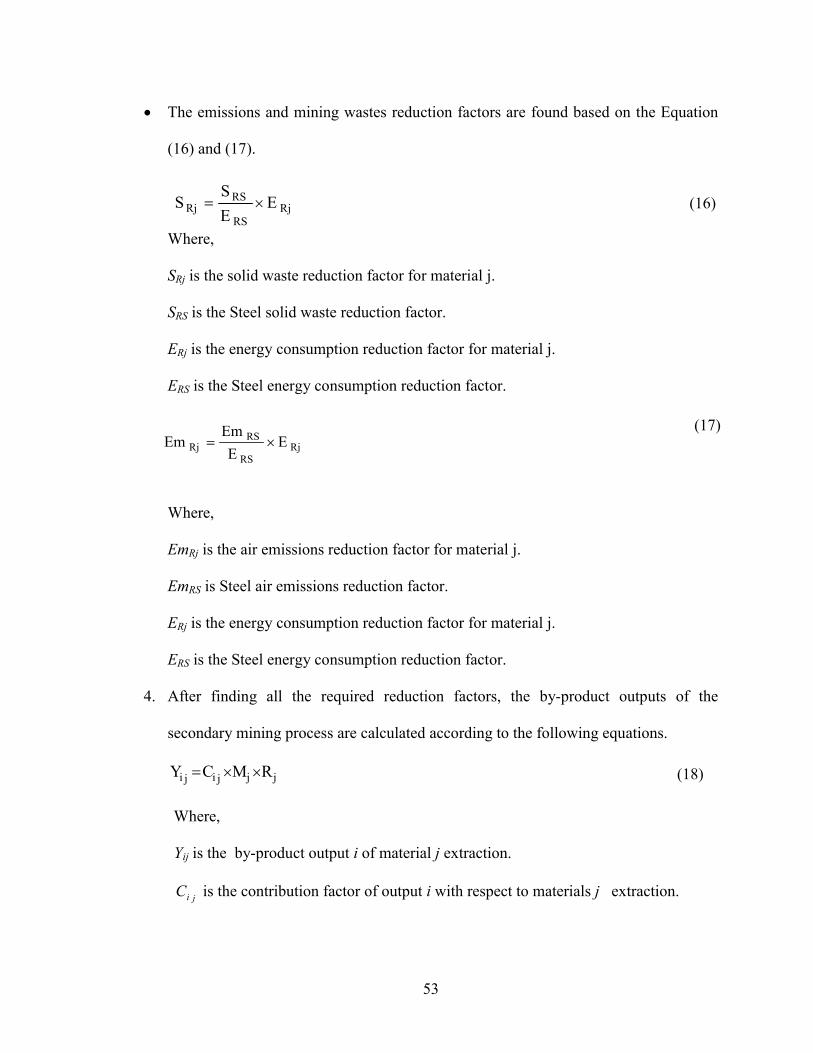
The emissions and mining wastes reduction factors are found based on the Equation
(16) and (17).
��
RjRS
RSRj E
ES
S ��
Where,
SRj is the solid waste reduction factor for material j.
SRS is the Steel solid waste reduction factor.
ERj is the energy consumption reduction factor for material j.
ERS is the Steel energy consumption reduction factor.
Rj
RS
RSRj E
EEm
Em ��
Where,
EmRj is the air emissions reduction factor for material j.
EmRS is Steel air emissions reduction factor.
ERj is the energy consumption reduction factor for material j.
ERS is the Steel energy consumption reduction factor.
4. After finding all the required reduction factors, the by-product outputs of
secondary mining process are calculated according to the following equations.
Y (1jjjiji RMC ���
Where,
Yij is the by-product output i of material j extraction.
jiC is the contribution factor of output i with respect to materials j extraction.
53
(17)
(16)
the
8)

Mj is the amount of material j that enters the secondary mining process, which is
found by calculating the amount of materials that is needed for producing N units
divided by �.
Rj is the air emissions or solid waste reduction factor for material j.
5. From energy consumption of this process, we are able to determine the amount of
releases resulting from each process using utility via energy Equations (7), (8), (9),
and (10).
6. By adding all the results together, the total outputs will be obtained.
3.4. The Demanufacturing Process
The demanufacturing process is part of remanufacturing, which is considered as
an approach to reserve natural resources and accomplish sustainable development. In the
this section, the concept of remanufacturing is elaborated, which is followed by the
demanufacturing process and its model and methodology of analysis.
3.4.1 Remanufacturing
Remanufacturing is an environmentally, economically and socially desirable
approach of secondary mining. Its main objective is to accomplish sustainable
development through a product take-back system (Fig. 3.10). It is a value-added recovery
not just materials recovery, since it preserves the product parts identified by disassembly,
sorting, cleaning, refurbishing, and reassembly and transforms durable products to serve
their original function by substituting worn or damaged parts. It also recaptures most of
54
the value embedded that entered a product into its initial manufacture of the product, i.e.
energy, labor, and capital equipment.
Lund [1984]. described remanufacturing as “..an industrial process in which
worn-out products are restored to like-new condition. Through a series of industrial
processes in a factory environment, a discarded product is completely disassembled.
Usable parts are cleaned, refurbished, and put into inventory. Then the product is
reassembled from old parts (and where necessary new parts) to produce a unit fully
equivalent or sometimes superior in performance and expected lifetime to the original
new product.”
Remanufacturing involves the reuse of obsolescent or obsolete products by
retaining serviceable parts, refurbishing usable parts, and introducing replacement
components (either identical or upgraded) [Graedel and Allenby 1995].
Fleischmann et al. [1997]. defined remanufacturing as a process of bringing the
used products back to ‘as new” condition by performing the necessary operations such as
disassembly, overhaul, and replacement.
3.4.1.1 The Operations of the Remanufacturing Process
Check-in ��
This is the first stage of the remanufacturing process, in which the manufacturer
receives the takeback products. An inspection is first performed to identify damages in
the products and classify the product as remanufacturable or non-remanufacturable. Then,
the product is conveyed to the next stage for disassembly. However, this operation can be
56
performed at the resident’s or dealer’s from where the product is taken back, this way
when the product comes in will go directly for disassembly.
�� Disassembly
Disassembling is the first step in processing for remanufacturing that requires
attention in the design process for the product since it establishes a gateway for parts to
the remanufacturing processes. The effect of disassembly impacts several areas in the
facility, i.e. production control, scheduling, and materials planning. Robotisation may be
applied in the disassembly process when large batches are processed; however, manual
(low skilled) labor is the most commonly used. The two main factors of the disassembly
process are the time and easiness of disassembly. These factors are the clues to the
success in the remanufacturing process. In other words, if a product takes a long time for
disassembly the cost will increase. Thus, it will not be cost-effective to remanufacture the
products.
�� Cleaning
This operation is essential for the removal of the dirt on the components of the
disassembled product. That could alter the functionality of the component. However, this
phase of demanufacturing, which damages the environment because of the chemicals
used and waste generated. It may include washing, removing paint, de-greasing, de-
oiling, and de-rusting. Techniques vary to do the job. However, it may be as simple as
using hot water to using ultrasonic cleaning.
�� Inspection and Sorting
In this operation, an assessment to the condition of parts on their re-usability or
reconditionability is done. It comes after the cleaning phase since it is hard to inspect
57
dirty parts. Consequently, The components are classified in this stage into three
categories as follows:
��Good quality
They are suitable for remanufacturing.
��Moderate
Components are suitable for repairing and then they can be reconditioned and
reused in newer products as spare parts.
��Obsolete
Suitable only for materials recovery, where the un-reusable components are
transferred for shredding.
Reconditioning ��
��
��
��
It is a pre-assembly process, which concerns the parts that have to be painted or
surface treated.
Reassembly
This operation depends on the number of reusable parts from the disassembly
process, which is subjected to variation regarding the number and quality of “take-
back” products.
Testing
This is a functional inspection of remanufactured product, which aims to
guarantee that the remanufactured product is of the same quality as a new one.
Packaging
This operation involves the packaging of the remanufactured product.
58

To be able to remanufacture a product it requires that [Klausner and Grimm 1999].:
1. There is a high demand for the remanufactured product.
2. Parts of the product can be reused after being disassembled, and reconditioned.
3. The remanufacturing cost is low to be able to sell the remanufactured product no
more than 60% of the price of the new one
4. The number of taken back products is sufficient for an efficient remanufacturing
production line.
59
3.4.2 The Methodology for Analyzing the Demanufacturing Process Model
The demanufacturing process is the third scenario of this research. This process
preserves the products parts identity; it includes the checking in, disassembling, cleaning,
inspection and sorting, and remanufacturing operations. This process is the equivalent
process to raw material extraction of the current manufacturing process, and the
discussed secondary mining process, which is a way to recover the material content of the
retired products for product takeback. It is very important to realize that the extracted
components in this scenario have embedded value. Meaning that the value placed within
the component during its initial manufacture (energy, labor, and materials) is preserved
and available for reuse. This is not the case for the current and secondary mining
scenarios, where energy and overhead are added to the materials to produce the same
component.
As illustrated in Fig. 3.10, the product after production is leased to the consumer
for use. At the end of the product life, it is reclaimed and returned to the manufacturer for
demanufacturing where it is disassembled, parts are then sorted either for reuse, cleaning,
refurbishing, and reassembly, or for secondary mining, depending on its quality and
reusability condition.
3.4.1.2 Check-in
According to Fig. 3.10, N products are reclaimed, and entered the check-in
operation. The product might be classified as non-remanufactured or remanufactured
product. However, with either classification, products are conveyed to the disassembly
process as discussed below.
60
Non-remanufactured product
This classification of the product at check-in will send the product to the
secondary mining process, however, some parts might be reused as spare parts for repair
or in other remanufacturable products if the cost of remanufacturing of these parts is
lower than using new parts. In this option, the product is transferred to the disassembly
process, yet it is disassembled just to the level where the required part could be taken out,
and then it is directly conveyed to the secondary mining process.
Remanufactured product
In this process, the returned product is disassembled. To handle the disassembled
parts many options are used, and they include the following:
1. Reusable parts or the parts of moderate quality are restored and then reused:
�� By selling the reusable parts to another manufacturer.
�� Sending it overseas where consumer is not insistent on buying the latest
technology (that doesn’t indicate that reusable parts are of less quality).
�� Reassembly of the product by the same manufacturer and giving it a
second life.
2. The worn-out parts are mined.
3.4.1.3 Disassembly
As soon as either classification won’t affect the product since it will yield for
disassembly, then N products are transferred for disassembly. After check in the product
is conveyed to the disassembly process, which is the gateway to the whole
remanufacturing process, and as discussed in the above the disassembly process is a
61
function of time, the longer the disassembly process the higher the cost of the
remanufacturing process.
Analysis of the Disassembly Process
Total disassembly time T can be expressed by the following equation:
i
k
1ii tnT �� �
�
(19)
where,
ni is the number of the ith component.
ti is the disassembly time for ith component.
Taking into consideration joint type, all the operations that are included in the
disassembly of one component, i.e. pick up, removal of the component.
Where the cost of disassembly can be expressed by the following equation:
As for the disassembly cost, CD,
CD= E*CE + (CL+Co).T + Ct (20)
Where,
E is the energy consumed in disassembling N products.
CE is the cost of consuming one Kilo-joule of energy.
T is the total disassembly time.
CL is the hourly labor cost.
Co is the overhead cost.
Ct is the tools cost.
Disassembly can be done either manually or including power tools in the
disassembly process. Therefore, the disassembly time will be:
62
am ttT �� (21)
Where,
tm is manual disassembly time .
ta is disassembly with power tools time.
The purpose of this research is to design a demanufacturing process that is
sustainable, and cost-effective. Therefore, there should be a trade-off between both tm and
ta since, the higher tm the higher the cost of disassembly (labor and overhead), and the
less use of powered tools, the less environmental impact, less energy consumption and as
a result less emissions.
The methodology
The time of the disassembly of one air conditioner is estimated, based on the results
of the research of [Dowie and Kelly 1994]. and personal experience at a disassembly
workshop, by applying Equation (19).
��
��
��
��
The energy consumed by the power tools is calculated according to Equation (22),
which helped in evaluating the emissions of using power tools based on Equations
(7), (8), (9), and (10).
(22) IVP ��
Where,
V is the voltage (in volts) on which the tool works.
I is the electric current (in Amps) of the tool.
Estimation of power needed for lighting and emissions were also calculated based on
the same air emission energy related equations.
The power-consumed form using HVAC in the plant is also considered and studied.
63
All the results are added together to estimate the total environmental impact. ��
3.4.1.4 Cleaning
The reusable parts must be cleaned to remove all the dirt that may alter the service
of the part more discussion about this operation and its environmental impact is
elaborated in chapter 4.
3.4.1.5 Inspection and sorting
After the cleaning process, all parts and components are conveyed for inspection
and sorting. Consequently, we will end in two streams, either reusable parts or secondary
mining ability. The mass, M, of N remanufacturable products is that flows to the
secondary mining
(23-a) ii
k
ii mnNM ����� �
�1
)1( �
Where,
� is the reusability probability of the ith component
ni is the number of component i that will be sent for secondary mining.
m is the mass of component i.
k is the number of components in one unit.
Or, if the calculations were per unit, then
PSm)1(NM ������ (23-b)
64

Where,
� is the reusability probability of the product
m is the mass of one unit.
The output of the secondary mining process, O, is
MO ���
Where,
� is the secondary mining efficiency.
And the fluff is calculated according to Equation (25).
F = FP + FS
M)1(FS ����
Where,
FS is the fluff results of secondary mining and is calculated according to Equation (2
3.5. Economic Cost
There are two costs that affect the total economic cost, direct m
internalized cost that is related to the cost of primary raw materials, secondary m
and the demanufacturing process, and hidden cost, which are the external environm
costs.
65
(24)
(25)
(25-a)5-a).
eaning
ining,
ental
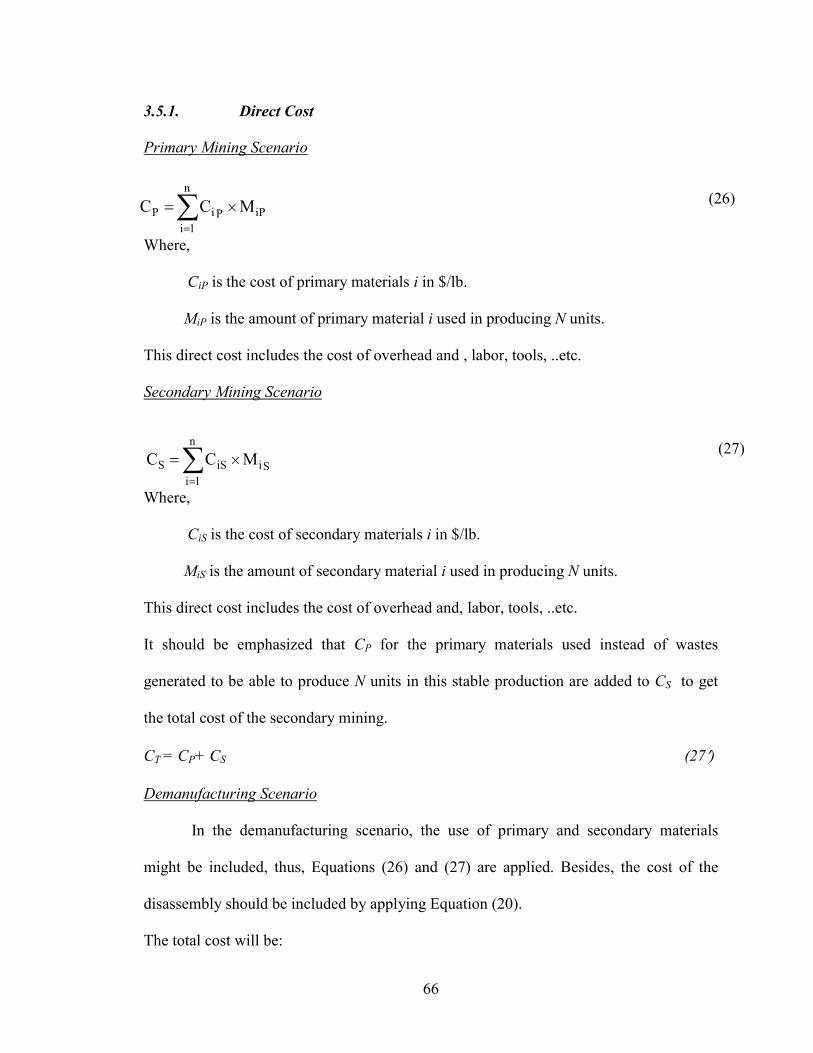
3.5.1. Direct Cost
Primary Mining Scenario
iP
n
1iPiP MCC ���
�
(26)
Where,
CiP is the cost of primary materials i in $/lb.
MiP is the amount of primary material i used in producing N units.
This direct cost includes the cost of overhead and , labor, tools, ..etc.
Secondary Mining Scenario
Si
n
1iiSS MCC ���
�
(27)
Where,
CiS is the cost of secondary materials i in $/lb.
MiS is the amount of secondary material i used in producing N units.
This direct cost includes the cost of overhead and, labor, tools, ..etc.
It should be emphasized that CP for the primary materials used instead of wastes
generated to be able to produce N units in this stable production are added to CS to get
the total cost of the secondary mining.
CT = CP+ CS (27�)
Demanufacturing Scenario
In the demanufacturing scenario, the use of primary and secondary materials
might be included, thus, Equations (26) and (27) are applied. Besides, the cost of the
disassembly should be included by applying Equation (20).
The total cost will be:
66
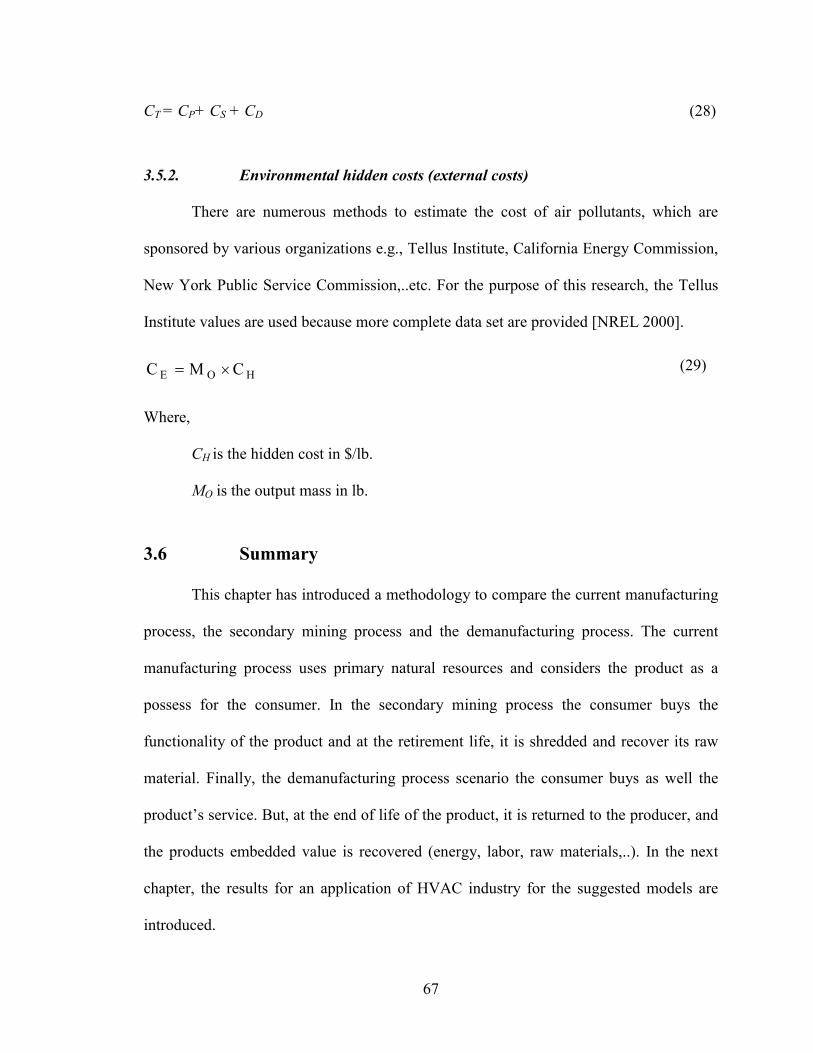
CT = CP+ CS + CD (28)
3.5.2. Environmental hidden costs (external costs)
There are numerous methods to estimate the cost of air pollutants, which are
sponsored by various organizations e.g., Tellus Institute, California Energy Commission,
New York Public Service Commission,..etc. For the purpose of this research, the Tellus
Institute values are used because more complete data set are provided [NREL 2000].
)HOE CMC ��
Where,
CH is the hidden cost in $/lb.
MO is the output mass in lb.
3.6 Summary
This chapter has introduced a methodology to compare the current manufa
process, the secondary mining process and the demanufacturing process. The
manufacturing process uses primary natural resources and considers the produ
possess for the consumer. In the secondary mining process the consumer bu
functionality of the product and at the retirement life, it is shredded and recover
material. Finally, the demanufacturing process scenario the consumer buys as w
product’s service. But, at the end of life of the product, it is returned to the produc
the products embedded value is recovered (energy, labor, raw materials,..). In th
chapter, the results for an application of HVAC industry for the suggested mod
introduced.
67
(29
cturing
current
ct as a
ys the
its raw
ell the
er, and
e next
els are

Moreover, the discussion of the environmental, economic, and social dimensions of the
system are described in chapter 5 so as to investigate the most sustainable scenario.
68
CHAPTER 4
RESULTS
This chapter presents the results obtained from the sustainability analysis
methodology applied to current manufacturing, the secondary mining, and the
demanufacturing scenarios respectively, as discussed in chapter 3. It should be noted that
these results do not include the manufacture of materials into components in the current
and secondary mining processes, which consumes energy and materials and produces
waste and emissions. Since in the demanufacturing scenario the components have
already been manufactured, additional energy consumption and emissions from this
production process are eliminated.
4.1. The Current Manufacturing Process Scenario
Production
Based on the data from a local HVAC company, which produces on average
100,20012 air conditioner units per year, the amount of production materials needed is
shown in Table 4.1. Taking into account that 0.2%13 of sales (or 84 units) are sent to
12 Based on manufacturer sales information. 13 Based on manufacturer sales information.
69
scrap as a result of defects in the manufacturing process, N is assumed to be 100,116
units.
By applying Equation (1), where 14= 0.99916 and R1, R2, R3, and R4 are
1,688,770.80, 4,355,894.40, 1,101,398.40 and 24,849.6 lb. representing the amount of
Copper, Steel, Aluminum, and Rubber used respectively in the production of 100,200
units per year, the total material15 that is used in producing N units is:
P= (1,688,770.80+ 4,355,894.40 + 1,101,398.40 + 24,849.6) � 0.99916
P= 7,164,889.63 lb.
By applying Equation (2) and considering that �16 =0.99653 the amount of
production materials that goes to scrap, SP is
SP = (1,688,770.8 + 4,355,894.4 + 1,101,398.4 + 24,849.6) (1-0.99916) 0.99653 � �
SP = 6,002.67 lb.
The production fluff, FP, is calculated by applying Equation (3):
FP = (1,688,770.8 + 4,355,894.4 + 1,101,398.4 + 24,849.6) � (1-0.99916) � (1-0.99653)
FP = 20.90 lb.
Consumer Use
After consumer use, some units are sent to the landfill and others to scrap. From
Equation (4), the amount of material from the units are sent to scrap, SC is determined
14 Where �= 1-Number of scrap units/Total number of units. 15 Taking into account just the main materials used. 16 where it is assumed that all rubber will go for fluff and the rest is recyclable materials, see Table 3.1 for values. � = (1-Rrubber/Rtotal).
70
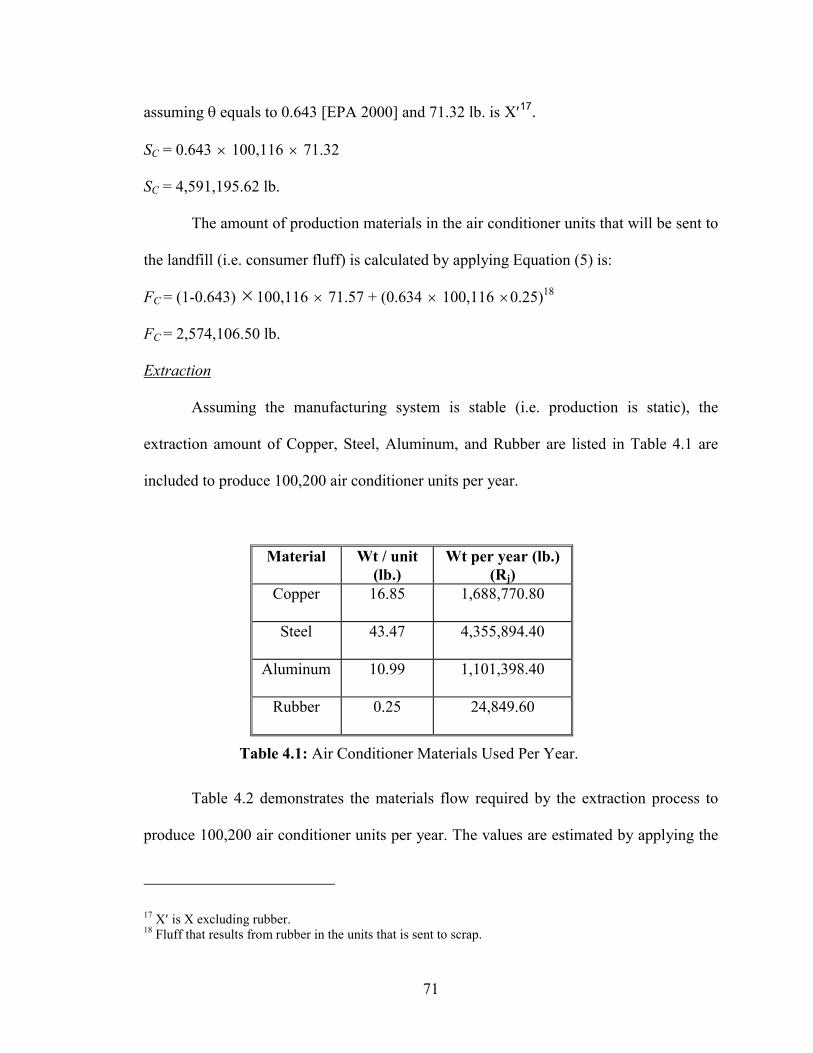
assuming equals to 0.643 [EPA 2000] and 71.32 lb. is X�17.
SC = 0.643 � 100,116 � 71.32
SC = 4,591,195.62 lb.
The amount of production materials in the air conditioner units that will be sent to
the landfill (i.e. consumer fluff) is calculated by applying Equation (5) is:
FC = (1-0.643) � 100,116 � 71.57 + (0.634 � 100,116 �0.25)18
FC = 2,574,106.50 lb.
Extraction
Assuming the manufacturing system is stable (i.e. production is static), the
extraction amount of Copper, Steel, Aluminum, and Rubber are listed in Table 4.1 are
included to produce 100,200 air conditioner units per year.
Material Wt / unit (lb.)
Wt per year (lb.) (Rj)
Copper 16.85 1,688,770.80
Steel 43.47 4,355,894.40
Aluminum 10.99 1,101,398.40
Rubber 0.25 24,849.60
Table 4.1: Air Conditioner Materials Used Per Year.
Table 4.2 demonstrates the materials flow required by the extraction process to
produce 100,200 air conditioner units per year. The values are estimated by applying the
17 X� is X excluding rubber. 18 Fluff that results from rubber in the units that is sent to scrap.
71
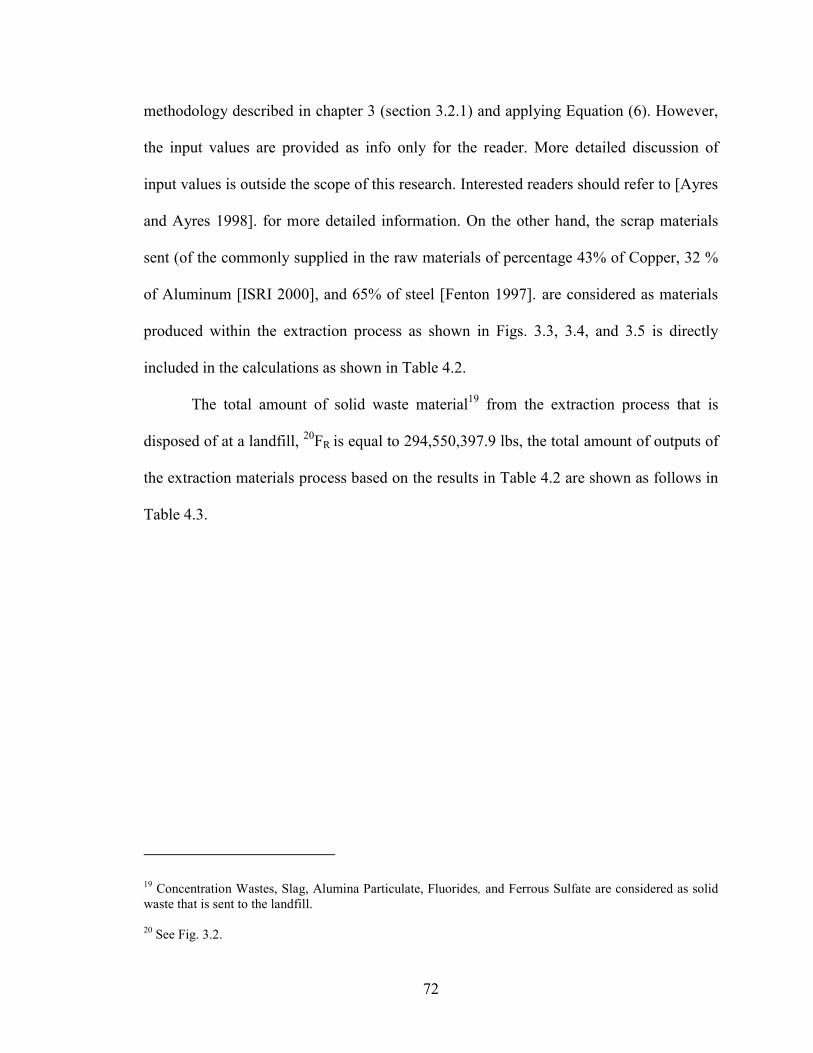
methodology described in chapter 3 (section 3.2.1) and applying Equation (6). However,
the input values are provided as info only for the reader. More detailed discussion of
input values is outside the scope of this research. Interested readers should refer to [Ayres
and Ayres 1998]. for more detailed information. On the other hand, the scrap materials
sent (of the commonly supplied in the raw materials of percentage 43% of Copper, 32 %
of Aluminum [ISRI 2000], and 65% of steel [Fenton 1997]. are considered as materials
produced within the extraction process as shown in Figs. 3.3, 3.4, and 3.5 is directly
included in the calculations as shown in Table 4.2.
The total amount of solid waste material19 from the extraction process that is
disposed of at a landfill, 20FR is equal to 294,550,397.9 lbs, the total amount of outputs of
the extraction materials process based on the results in Table 4.2 are shown as follows in
Table 4.3.
19 Concentration Wastes, Slag, Alumina Particulate, Fluorides, and Ferrous Sulfate are considered as solid waste that is sent to the landfill. 20 See Fig. 3.2.
72
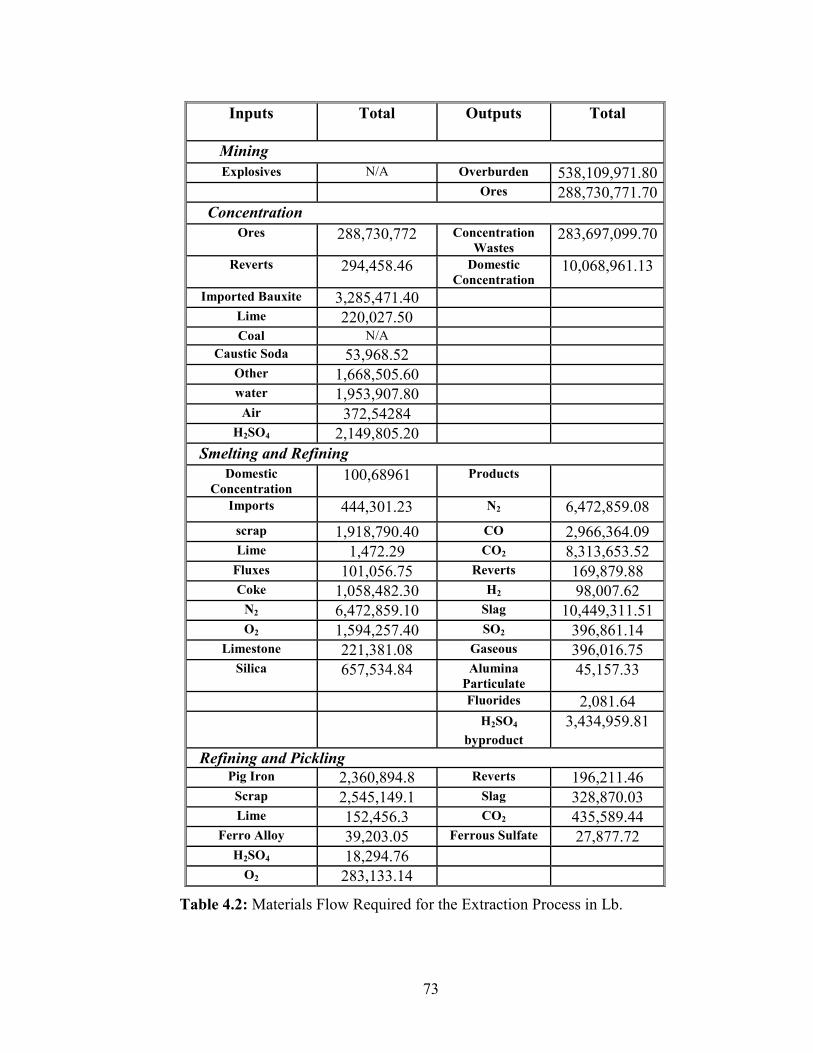
Inputs Total Outputs Total
Mining Explosives N/A Overburden 538,109,971.80
Ores 288,730,771.70 Concentration
Ores 288,730,772 Concentration Wastes
283,697,099.70
Reverts 294,458.46 Domestic Concentration
10,068,961.13
Imported Bauxite 3,285,471.40 Lime 220,027.50 Coal N/A
Caustic Soda 53,968.52 Other 1,668,505.60 water 1,953,907.80
Air 372,54284 H2SO4 2,149,805.20
Smelting and Refining Domestic
Concentration 100,68961 Products
Imports 444,301.23 N2 6,472,859.08
scrap 1,918,790.40 CO 2,966,364.09 Lime 1,472.29 CO2 8,313,653.52
Fluxes 101,056.75 Reverts 169,879.88 Coke 1,058,482.30 H2 98,007.62
N2 6,472,859.10 Slag 10,449,311.51 O2 1,594,257.40 SO2 396,861.14
Limestone 221,381.08 Gaseous 396,016.75 Silica 657,534.84 Alumina
Particulate 45,157.33
Fluorides 2,081.64 H2SO4
byproduct 3,434,959.81
Refining and Pickling Pig Iron 2,360,894.8 Reverts 196,211.46
Scrap 2,545,149.1 Slag 328,870.03 Lime 152,456.3 CO2 435,589.44
Ferro Alloy 39,203.05 Ferrous Sulfate 27,877.72 H2SO4 18,294.76
O2 283,133.14
Table 4.2: Materials Flow Required for the Extraction Process in Lb.
73
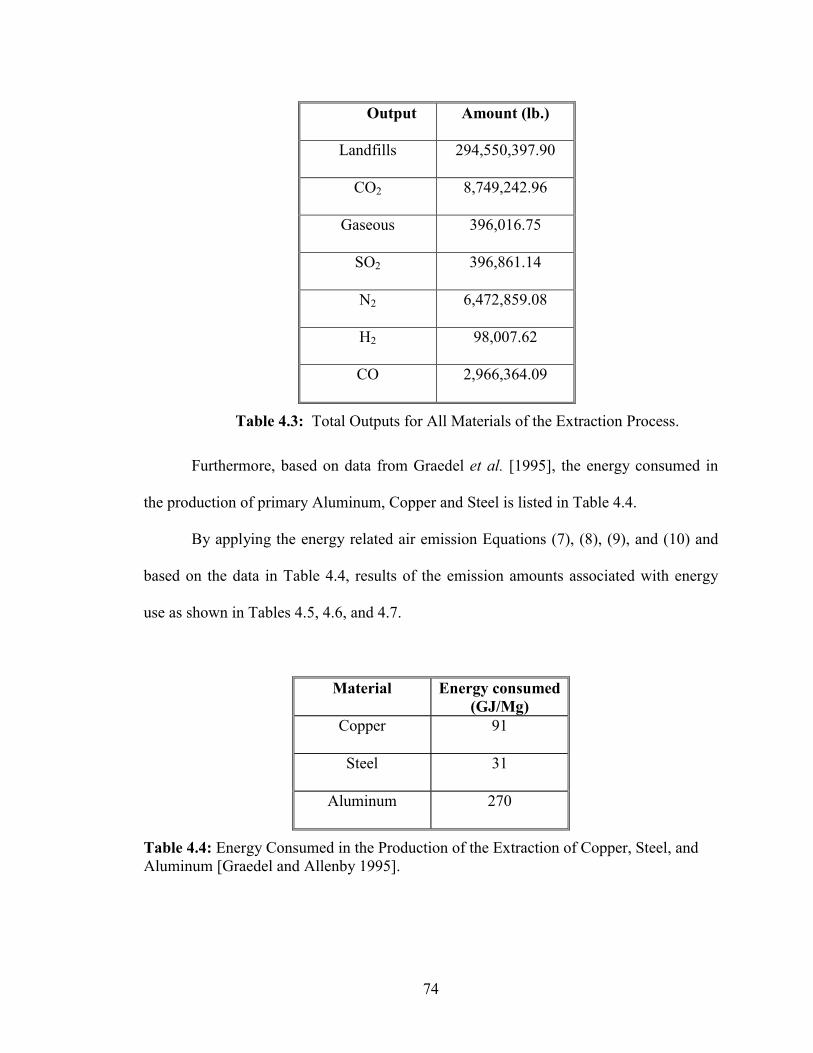
Output Amount (lb.)
Landfills 294,550,397.90
CO2 8,749,242.96
Gaseous 396,016.75
SO2 396,861.14
N2 6,472,859.08
H2 98,007.62
CO 2,966,364.09
Table 4.3: Total Outputs for All Materials of the Extraction Process.
Furthermore, based on data from Graedel et al. [1995], the energy consumed in
the production of primary Aluminum, Copper and Steel is listed in Table 4.4.
By applying the energy related air emission Equations (7), (8), (9), and (10) and
based on the data in Table 4.4, results of the emission amounts associated with energy
use as shown in Tables 4.5, 4.6, and 4.7.
Material Energy consumed (GJ/Mg)
Copper 91
Steel 31
Aluminum 270
Table 4.4: Energy Consumed in the Production of the Extraction of Copper, Steel, and Aluminum [Graedel and Allenby 1995].
74

Air Emissions Amount (lb.)
CO2 25,931,526.87
NOx 85,044.25
SO2 178,453.52
Table 4.5: Air Emissions Associated with Energy Use Required for Extracting Copper.
Air Emissions Amount (lb.)
CO2 50,179,252.92
NOx 164,566.40
SO2 345,319.59
Table 4.6: Air Emissions Associated with Energy Use Required for Extracting Aluminum.
Air Emissions Amount (lb.)
CO2 22,785,314.23
NOx 74,726.03
SO2 156,802.16
Table 4.7: Air Emissions Associated with Energy Use Required for Extracting Steel.
By adding the results in Tables 4.5, 4.6, and 4.7 the total air emissions associated
with energy use required for producing 100,200 air conditioner units are estimated and
shown in Table 4.8.
75
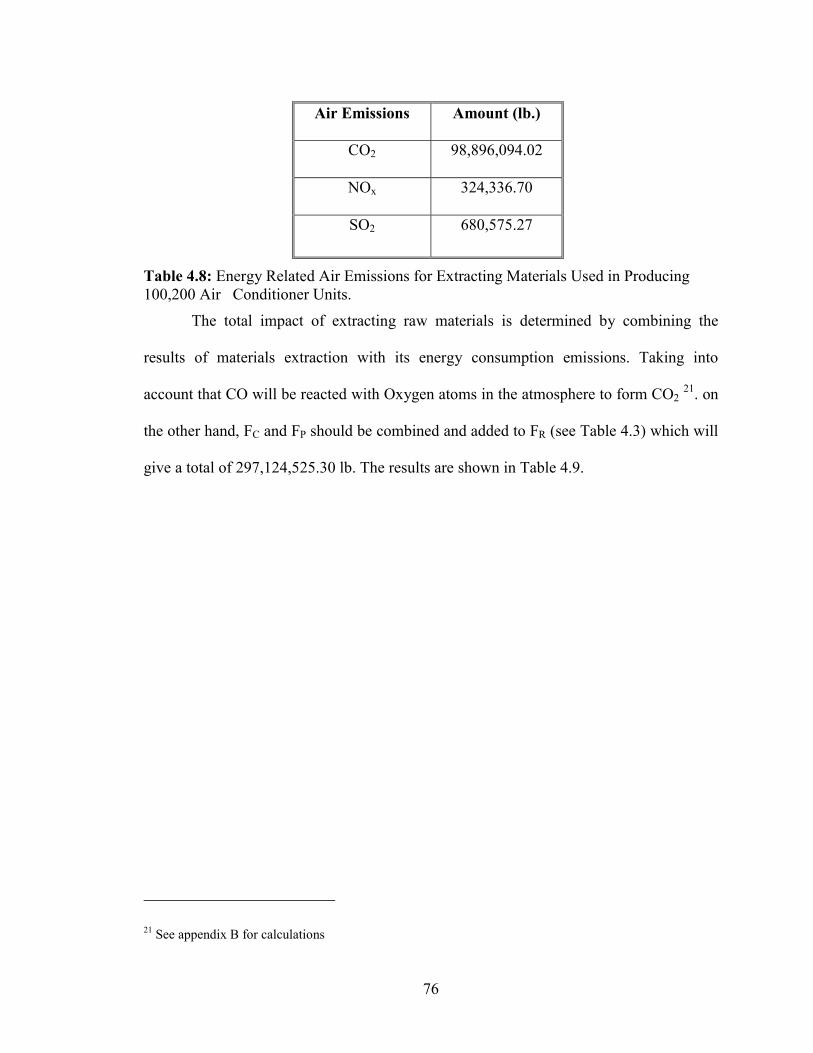
Air Emissions Amount (lb.)
CO2 98,896,094.02
NOx 324,336.70
SO2 680,575.27
Table 4.8: Energy Related Air Emissions for Extracting Materials Used in Producing 100,200 Air Conditioner Units.
The total impact of extracting raw materials is determined by combining the
results of materials extraction with its energy consumption emissions. Taking into
account that CO will be reacted with Oxygen atoms in the atmosphere to form CO2 21. on
the other hand, FC and FP should be combined and added to FR (see Table 4.3) which will
give a total of 297,124,525.30 lb. The results are shown in Table 4.9.
21 See appendix B for calculations
76
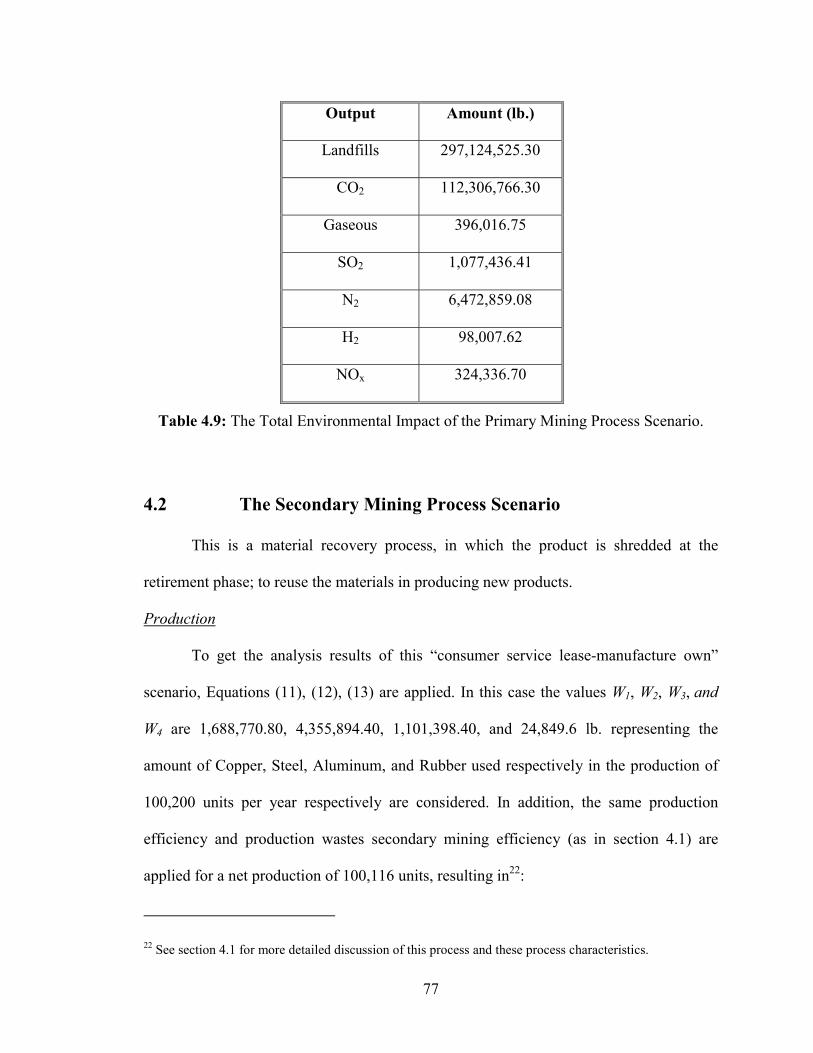
Output Amount (lb.)
Landfills 297,124,525.30
CO2 112,306,766.30
Gaseous 396,016.75
SO2 1,077,436.41
N2 6,472,859.08
H2 98,007.62
NOx 324,336.70
Table 4.9: The Total Environmental Impact of the Primary Mining Process Scenario.
4.2 The Secondary Mining Process Scenario
This is a material recovery process, in which the product is shredded at the
retirement phase; to reuse the materials in producing new products.
Production
To get the analysis results of this “consumer service lease-manufacture own”
scenario, Equations (11), (12), (13) are applied. In this case the values W1, W2, W3, and
W4 are 1,688,770.80, 4,355,894.40, 1,101,398.40, and 24,849.6 lb. representing the
amount of Copper, Steel, Aluminum, and Rubber used respectively in the production of
100,200 units per year respectively are considered. In addition, the same production
efficiency and production wastes secondary mining efficiency (as in section 4.1) are
applied for a net production of 100,116 units, resulting in22:
22 See section 4.1 for more detailed discussion of this process and these process characteristics.
77
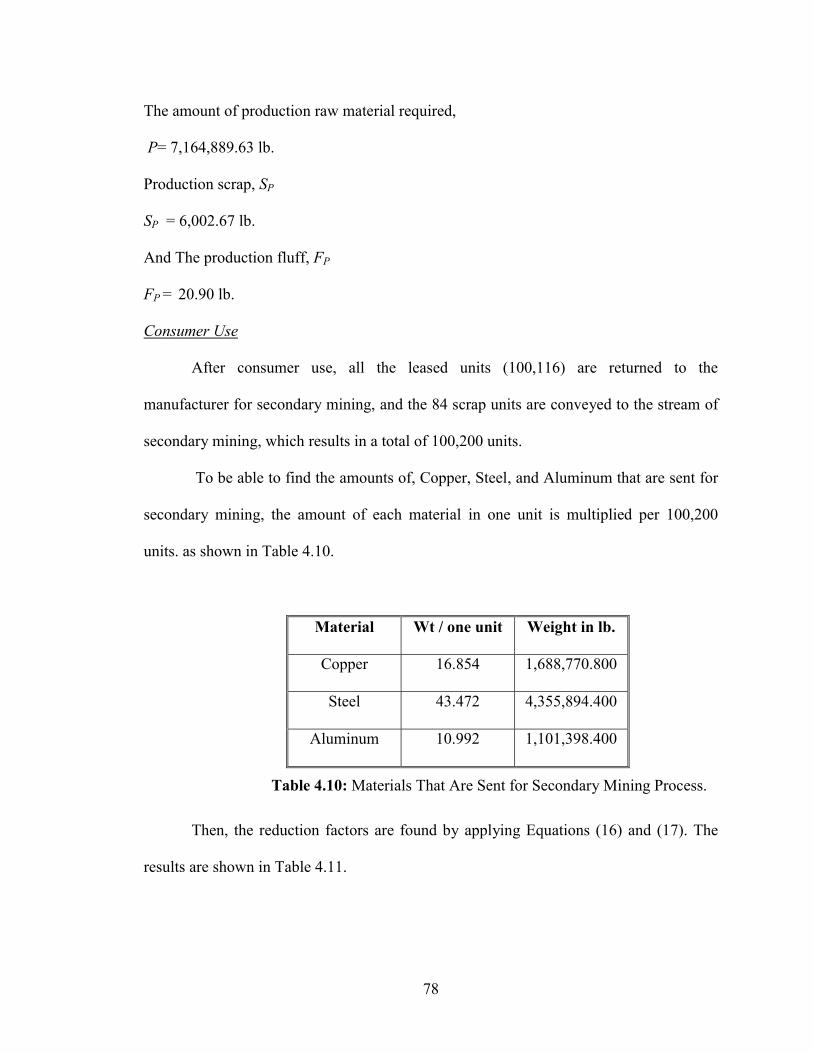
The amount of production raw material required,
P= 7,164,889.63 lb.
Production scrap, SP
SP = 6,002.67 lb.
And The production fluff, FP
FP = 20.90 lb.
Consumer Use
After consumer use, all the leased units (100,116) are returned to the
manufacturer for secondary mining, and the 84 scrap units are conveyed to the stream of
secondary mining, which results in a total of 100,200 units.
To be able to find the amounts of, Copper, Steel, and Aluminum that are sent for
secondary mining, the amount of each material in one unit is multiplied per 100,200
units. as shown in Table 4.10.
Material Wt / one unit Weight in lb.
Copper 16.854 1,688,770.800
Steel 43.472 4,355,894.400
Aluminum 10.992 1,101,398.400
Table 4.10: Materials That Are Sent for Secondary Mining Process.
Then, the reduction factors are found by applying Equations (16) and (17). The
results are shown in Table 4.11.
78
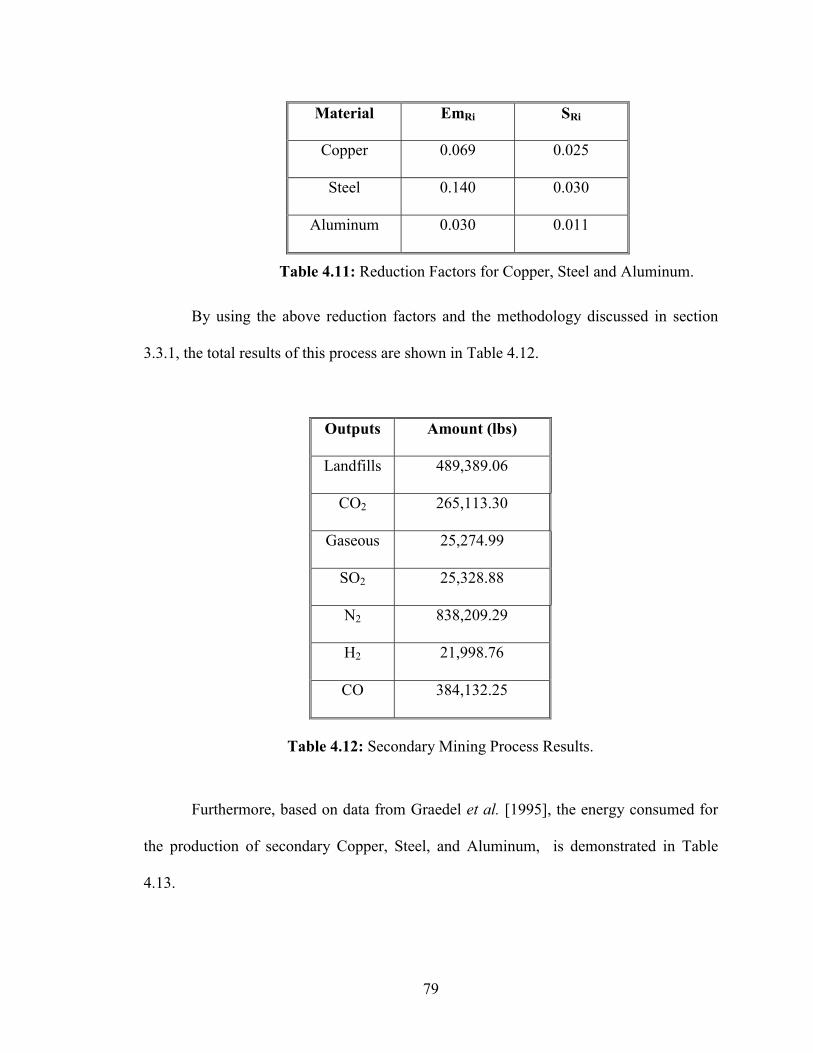
Material EmRi SRi
Copper 0.069 0.025
Steel 0.140 0.030
Aluminum 0.030 0.011
Table 4.11: Reduction Factors for Copper, Steel and Aluminum.
By using the above reduction factors and the methodology discussed in section
3.3.1, the total results of this process are shown in Table 4.12.
Outputs Amount (lbs)
Landfills 489,389.06
CO2 265,113.30
Gaseous 25,274.99
SO2 25,328.88
N2 838,209.29
H2 21,998.76
CO 384,132.25
Table 4.12: Secondary Mining Process Results.
Furthermore, based on data from Graedel et al. [1995], the energy consumed for
the production of secondary Copper, Steel, and Aluminum, is demonstrated in Table
4.13.
79
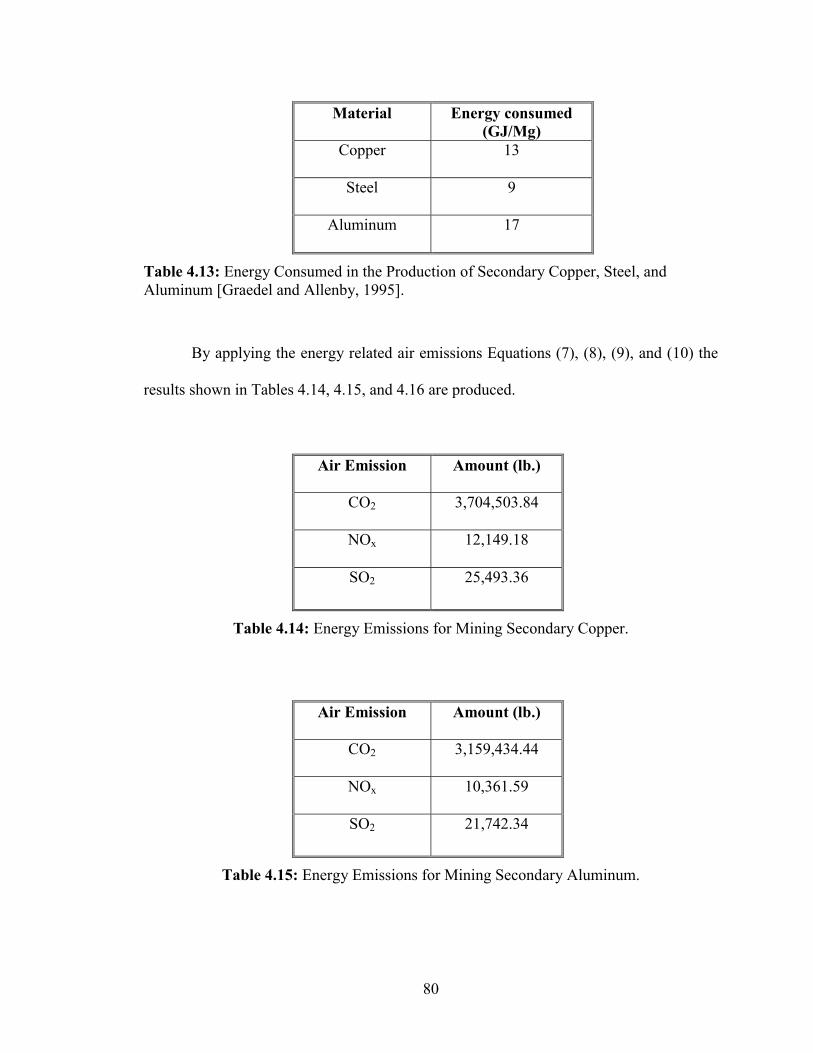
Material Energy consumed (GJ/Mg)
Copper 13
Steel 9
Aluminum 17
Table 4.13: Energy Consumed in the Production of Secondary Copper, Steel, and Aluminum [Graedel and Allenby, 1995].
By applying the energy related air emissions Equations (7), (8), (9), and (10) the
results shown in Tables 4.14, 4.15, and 4.16 are produced.
Air Emission Amount (lb.)
CO2 3,704,503.84
NOx 12,149.18
SO2 25,493.36
Table 4.14: Energy Emissions for Mining Secondary Copper.
Air Emission Amount (lb.)
CO2 3,159,434.44
NOx 10,361.59
SO2 21,742.34
Table 4.15: Energy Emissions for Mining Secondary Aluminum.
80
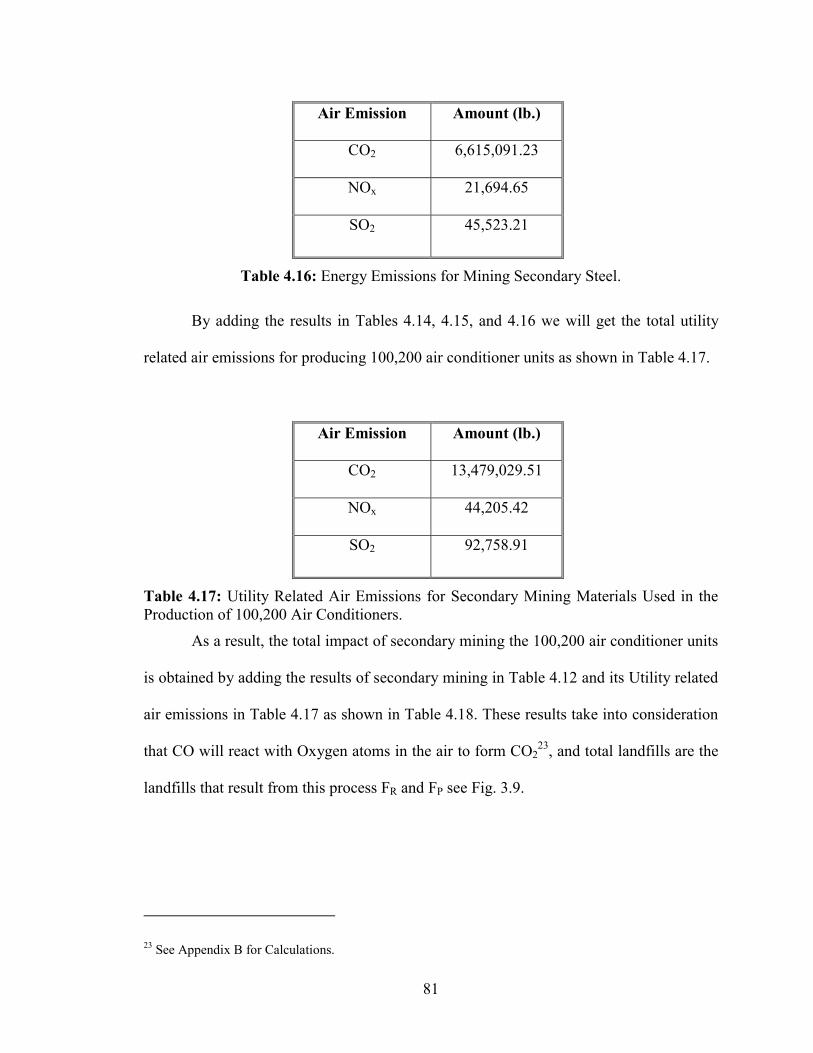
Air Emission Amount (lb.)
CO2 6,615,091.23
NOx 21,694.65
SO2 45,523.21
Table 4.16: Energy Emissions for Mining Secondary Steel.
By adding the results in Tables 4.14, 4.15, and 4.16 we will get the total utility
related air emissions for producing 100,200 air conditioner units as shown in Table 4.17.
Air Emission Amount (lb.)
CO2 13,479,029.51
NOx 44,205.42
SO2 92,758.91
Table 4.17: Utility Related Air Emissions for Secondary Mining Materials Used in the Production of 100,200 Air Conditioners.
As a result, the total impact of secondary mining the 100,200 air conditioner units
is obtained by adding the results of secondary mining in Table 4.12 and its Utility related
air emissions in Table 4.17 as shown in Table 4.18. These results take into consideration
that CO will react with Oxygen atoms in the air to form CO223, and total landfills are the
landfills that result from this process FR and FP see Fig. 3.9.
23 See Appendix B for Calculations.
81
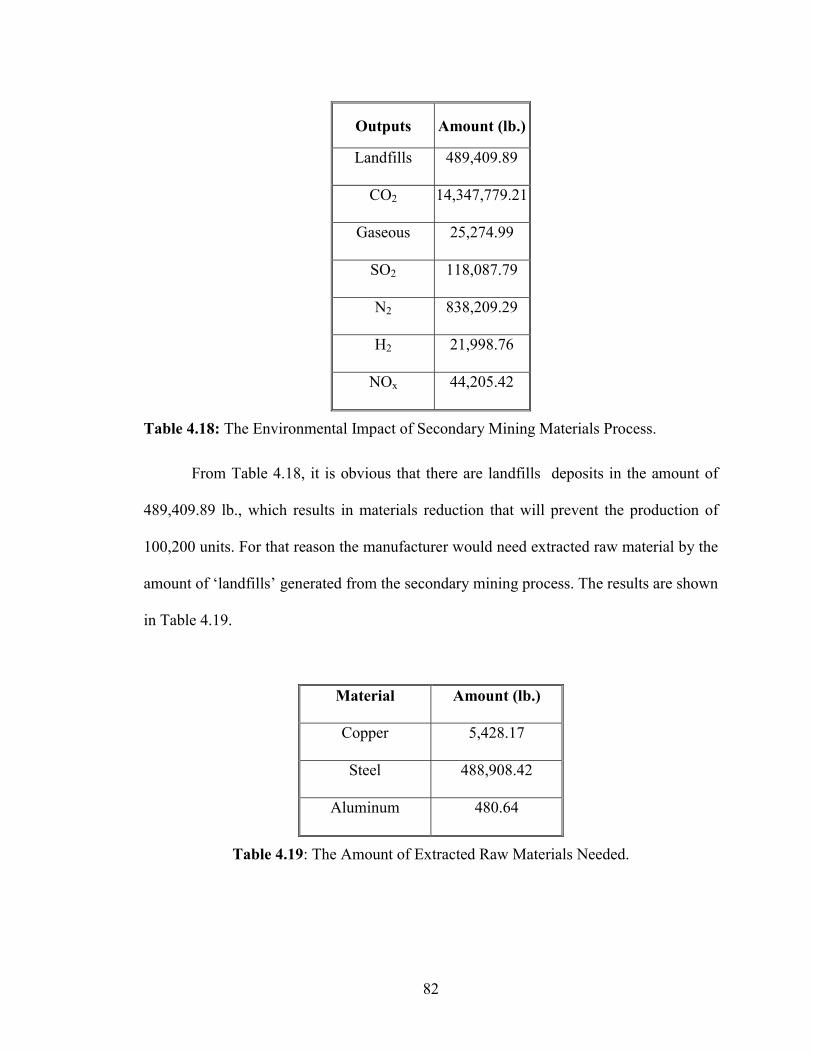
Outputs Amount (lb.)
Landfills 489,409.89
CO2 14,347,779.21
Gaseous 25,274.99
SO2 118,087.79
N2 838,209.29
H2 21,998.76
NOx 44,205.42
Table 4.18: The Environmental Impact of Secondary Mining Materials Process.
From Table 4.18, it is obvious that there are landfills deposits in the amount of
489,409.89 lb., which results in materials reduction that will prevent the production of
100,200 units. For that reason the manufacturer would need extracted raw material by the
amount of ‘landfills’ generated from the secondary mining process. The results are shown
in Table 4.19.
Material Amount (lb.)
Copper 5,428.17
Steel 488,908.42
Aluminum 480.64
Table 4.19: The Amount of Extracted Raw Materials Needed.
82
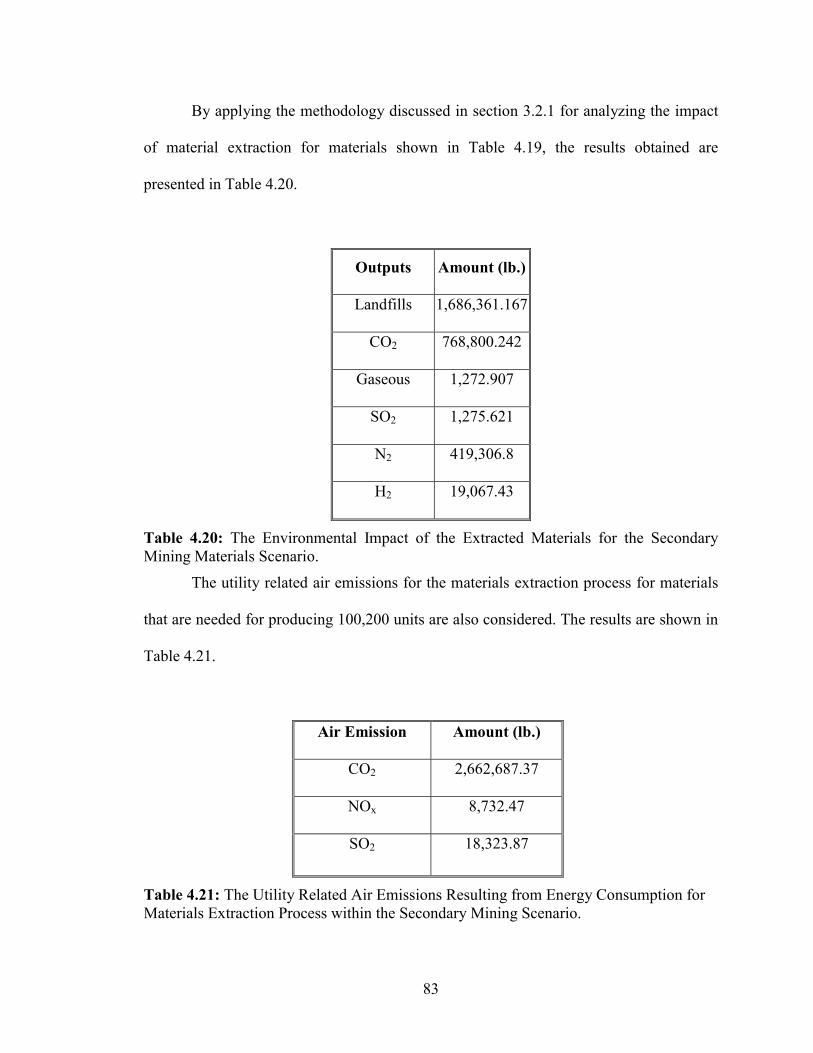
By applying the methodology discussed in section 3.2.1 for analyzing the impact
of material extraction for materials shown in Table 4.19, the results obtained are
presented in Table 4.20.
Outputs Amount (lb.)
Landfills 1,686,361.167
CO2 768,800.242
Gaseous 1,272.907
SO2 1,275.621
N2 419,306.8
H2 19,067.43
Table 4.20: The Environmental Impact of the Extracted Materials for the Secondary Mining Materials Scenario.
The utility related air emissions for the materials extraction process for materials
that are needed for producing 100,200 units are also considered. The results are shown in
Table 4.21.
Air Emission Amount (lb.)
CO2 2,662,687.37
NOx 8,732.47
SO2 18,323.87
Table 4.21: The Utility Related Air Emissions Resulting from Energy Consumption for Materials Extraction Process within the Secondary Mining Scenario.
83
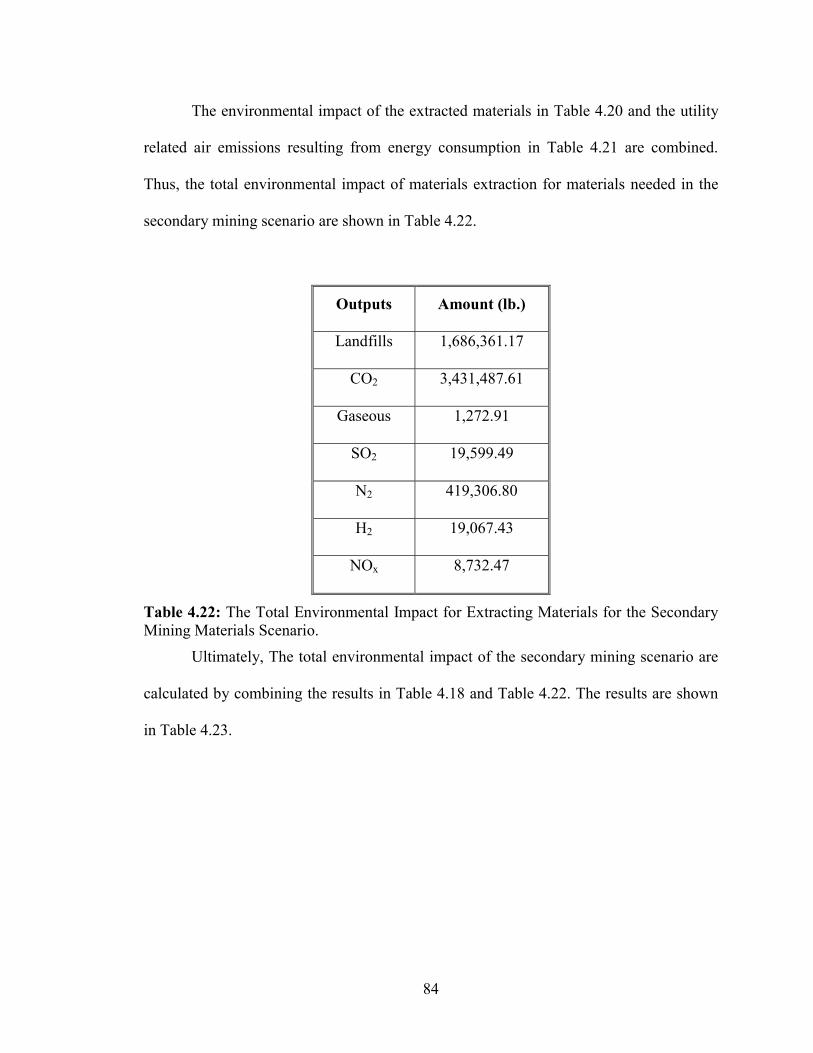
The environmental impact of the extracted materials in Table 4.20 and the utility
related air emissions resulting from energy consumption in Table 4.21 are combined.
Thus, the total environmental impact of materials extraction for materials needed in the
secondary mining scenario are shown in Table 4.22.
Outputs Amount (lb.)
Landfills 1,686,361.17
CO2 3,431,487.61
Gaseous 1,272.91
SO2 19,599.49
N2 419,306.80
H2 19,067.43
NOx 8,732.47
Table 4.22: The Total Environmental Impact for Extracting Materials for the Secondary Mining Materials Scenario.
Ultimately, The total environmental impact of the secondary mining scenario are
calculated by combining the results in Table 4.18 and Table 4.22. The results are shown
in Table 4.23.
84
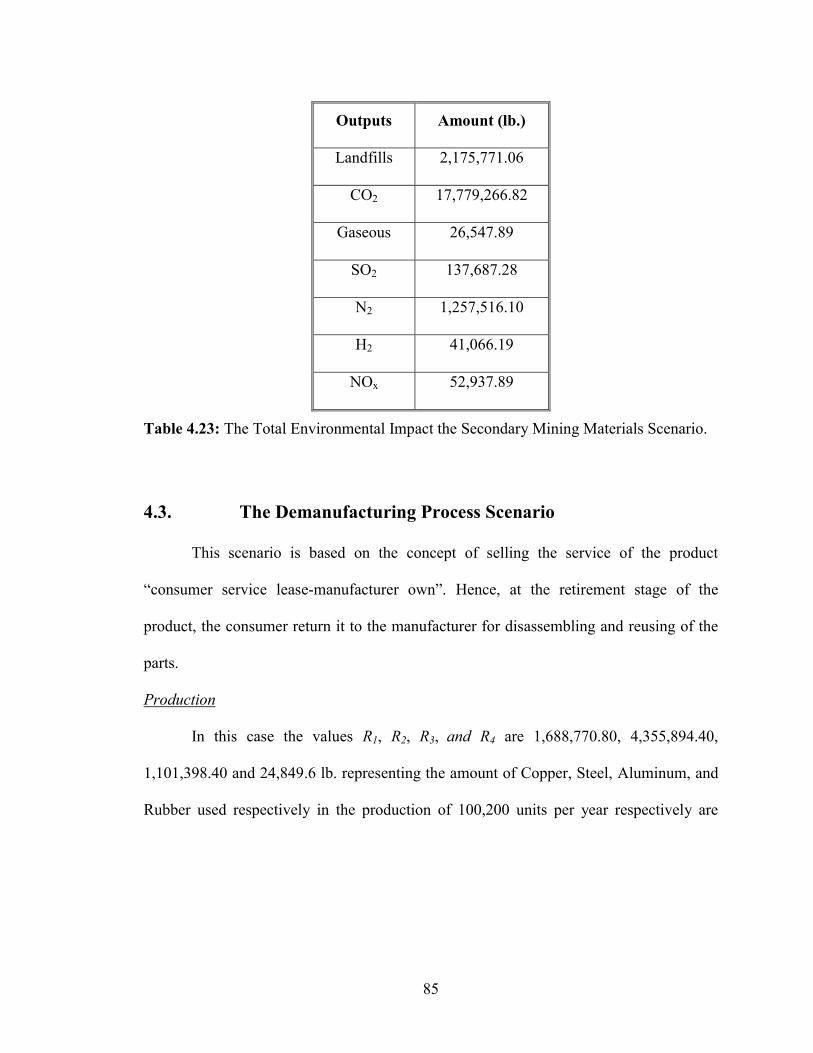
Outputs Amount (lb.)
Landfills 2,175,771.06
CO2 17,779,266.82
Gaseous 26,547.89
SO2 137,687.28
N2 1,257,516.10
H2 41,066.19
NOx 52,937.89
Table 4.23: The Total Environmental Impact the Secondary Mining Materials Scenario.
4.3. The Demanufacturing Process Scenario
This scenario is based on the concept of selling the service of the product
“consumer service lease-manufacturer own”. Hence, at the retirement stage of the
product, the consumer return it to the manufacturer for disassembling and reusing of the
parts.
Production
In this case the values R1, R2, R3, and R4 are 1,688,770.80, 4,355,894.40,
1,101,398.40 and 24,849.6 lb. representing the amount of Copper, Steel, Aluminum, and
Rubber used respectively in the production of 100,200 units per year respectively are
85
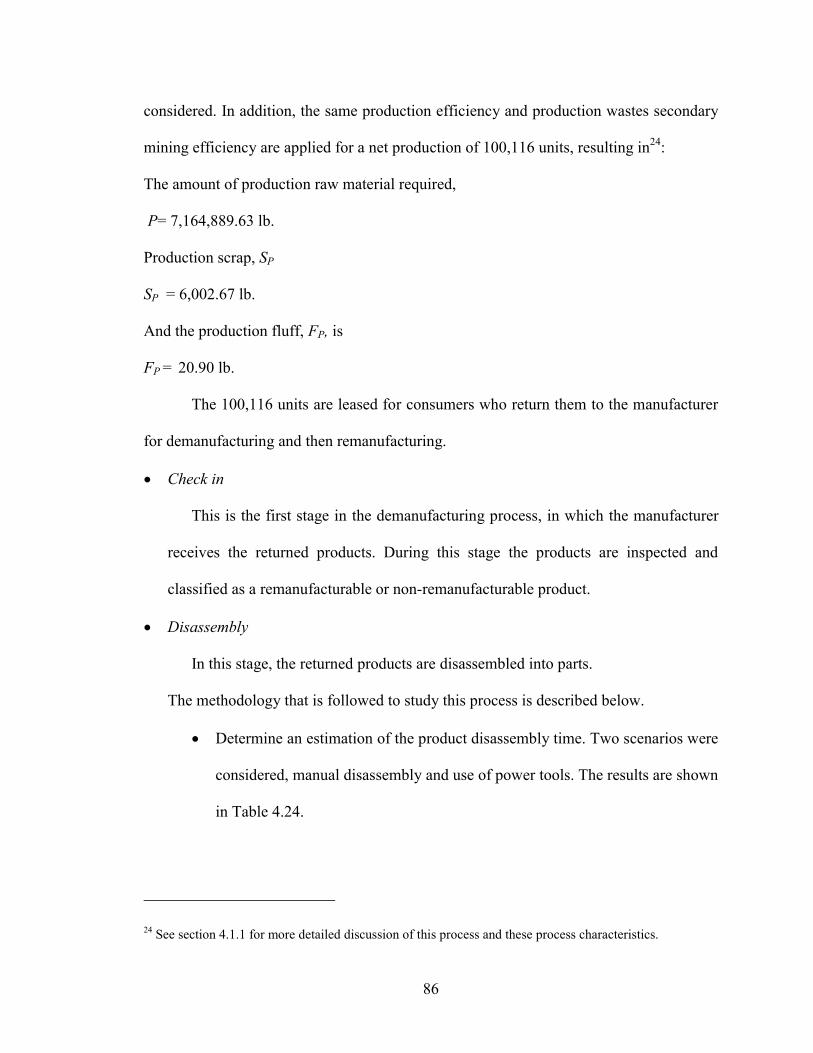
considered. In addition, the same production efficiency and production wastes secondary
mining efficiency are applied for a net production of 100,116 units, resulting in24:
The amount of production raw material required,
P= 7,164,889.63 lb.
Production scrap, SP
SP = 6,002.67 lb.
And the production fluff, FP, is
FP = 20.90 lb.
The 100,116 units are leased for consumers who return them to the manufacturer
for demanufacturing and then remanufacturing.
�� Check in
This is the first stage in the demanufacturing process, in which the manufacturer
receives the returned products. During this stage the products are inspected and
classified as a remanufacturable or non-remanufacturable product.
�� Disassembly
In this stage, the returned products are disassembled into parts.
The methodology that is followed to study this process is described below.
�� Determine an estimation of the product disassembly time. Two scenarios were
considered, manual disassembly and use of power tools. The results are shown
in Table 4.24.
24 See section 4.1.1 for more detailed discussion of this process and these process characteristics.
86
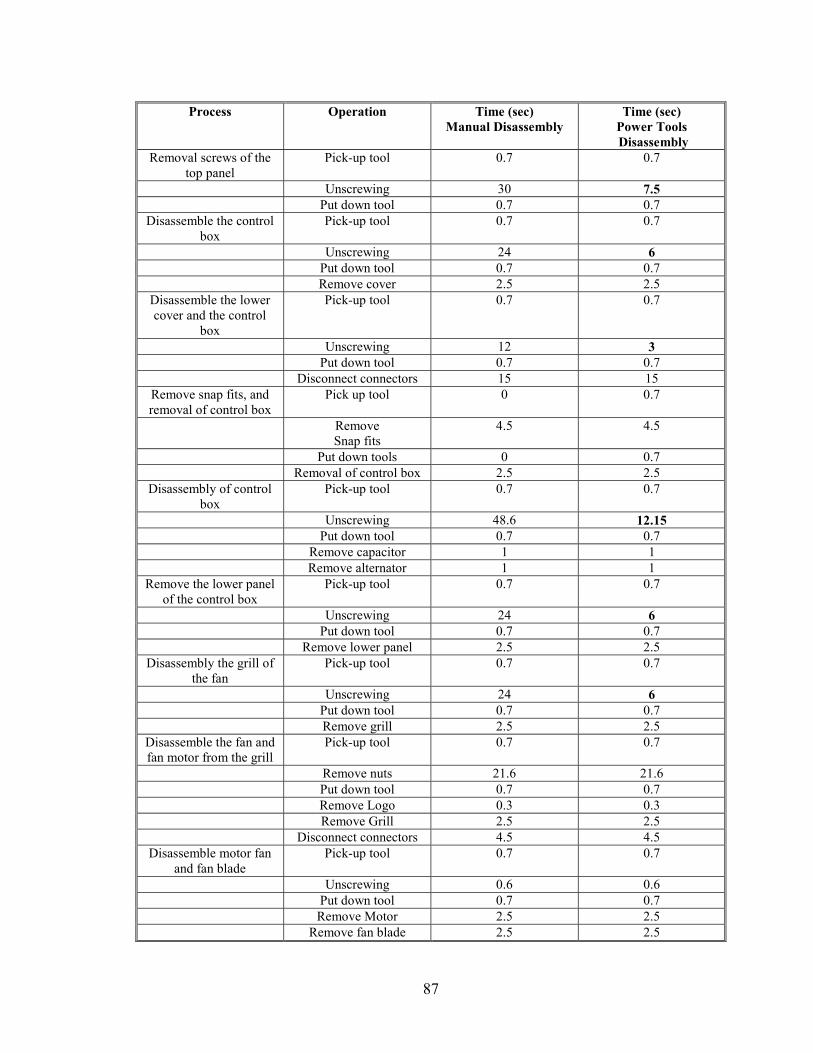
Process Operation Time (sec) Manual Disassembly
Time (sec) Power Tools Disassembly
Removal screws of the top panel
Pick-up tool 0.7 0.7
Unscrewing 30 7.5 Put down tool 0.7 0.7
Disassemble the control box
Pick-up tool 0.7 0.7
Unscrewing 24 6 Put down tool 0.7 0.7 Remove cover 2.5 2.5
Disassemble the lower cover and the control
box
Pick-up tool 0.7 0.7
Unscrewing 12 3 Put down tool 0.7 0.7 Disconnect connectors 15 15
Remove snap fits, and removal of control box
Pick up tool 0 0.7
Remove Snap fits
4.5 4.5
Put down tools 0 0.7 Removal of control box 2.5 2.5
Disassembly of control box
Pick-up tool 0.7 0.7
Unscrewing 48.6 12.15 Put down tool 0.7 0.7 Remove capacitor 1 1 Remove alternator 1 1
Remove the lower panel of the control box
Pick-up tool 0.7 0.7
Unscrewing 24 6 Put down tool 0.7 0.7 Remove lower panel 2.5 2.5
Disassembly the grill of the fan
Pick-up tool 0.7 0.7
Unscrewing 24 6 Put down tool 0.7 0.7 Remove grill 2.5 2.5
Disassemble the fan and fan motor from the grill
Pick-up tool 0.7 0.7
Remove nuts 21.6 21.6 Put down tool 0.7 0.7 Remove Logo 0.3 0.3 Remove Grill 2.5 2.5 Disconnect connectors 4.5 4.5
Disassemble motor fan and fan blade
Pick-up tool 0.7 0.7
Unscrewing 0.6 0.6 Put down tool 0.7 0.7 Remove Motor 2.5 2.5 Remove fan blade 2.5 2.5
87
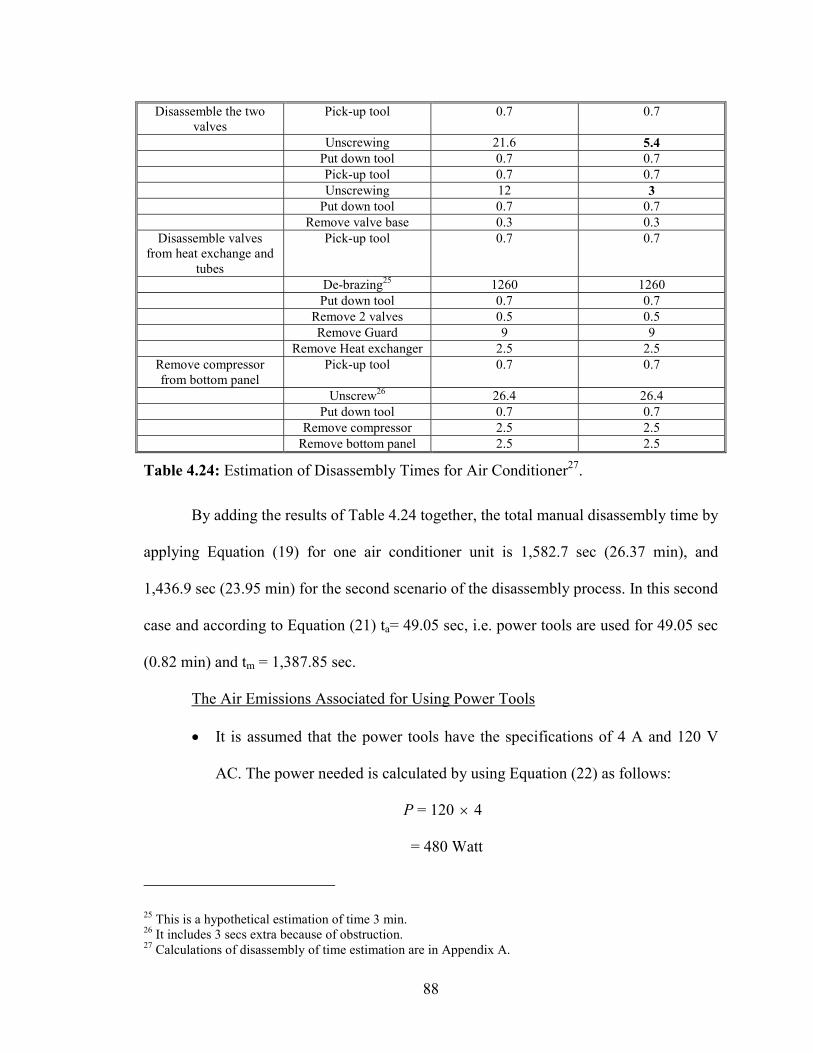
Disassemble the two valves
Pick-up tool 0.7 0.7
Unscrewing 21.6 5.4 Put down tool 0.7 0.7 Pick-up tool 0.7 0.7 Unscrewing 12 3 Put down tool 0.7 0.7 Remove valve base 0.3 0.3
Disassemble valves from heat exchange and
tubes
Pick-up tool 0.7 0.7
De-brazing25 1260 1260 Put down tool 0.7 0.7 Remove 2 valves 0.5 0.5 Remove Guard 9 9 Remove Heat exchanger 2.5 2.5
Remove compressor from bottom panel
Pick-up tool 0.7 0.7
Unscrew26 26.4 26.4 Put down tool 0.7 0.7 Remove compressor 2.5 2.5 Remove bottom panel 2.5 2.5
Table 4.24: Estimation of Disassembly Times for Air Conditioner27.
By adding the results of Table 4.24 together, the total manual disassembly time by
applying Equation (19) for one air conditioner unit is 1,582.7 sec (26.37 min), and
1,436.9 sec (23.95 min) for the second scenario of the disassembly process. In this second
case and according to Equation (21) ta= 49.05 sec, i.e. power tools are used for 49.05 sec
(0.82 min) and tm = 1,387.85 sec.
The Air Emissions Associated for Using Power Tools
�� It is assumed that the power tools have the specifications of 4 A and 120 V
AC. The power needed is calculated by using Equation (22) as follows:
P = 120 � 4
= 480 Watt
25 This is a hypothetical estimation of time 3 min. 26 It includes 3 secs extra because of obstruction. 27 Calculations of disassembly of time estimation are in Appendix A.
88
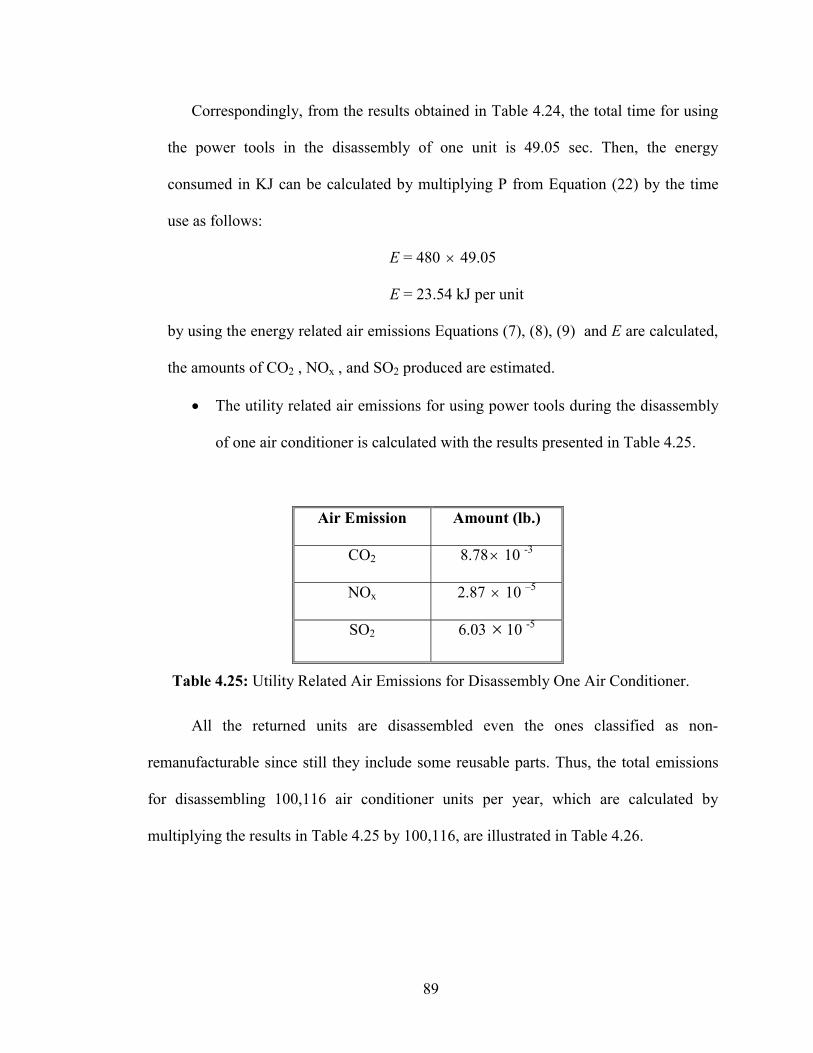
Correspondingly, from the results obtained in Table 4.24, the total time for using
the power tools in the disassembly of one unit is 49.05 sec. Then, the energy
consumed in KJ can be calculated by multiplying P from Equation (22) by the time
use as follows:
E = 480 49.05 �
E = 23.54 kJ per unit
by using the energy related air emissions Equations (7), (8), (9) and E are calculated,
the amounts of CO2 , NOx , and SO2 produced are estimated.
�� The utility related air emissions for using power tools during the disassembly
of one air conditioner is calculated with the results presented in Table 4.25.
Air Emission Amount (lb.)
CO2 8.78� 10 -3
NOx 2.87 10 �–5
SO2 6.03 � 10 -5
Table 4.25: Utility Related Air Emissions for Disassembly One Air Conditioner.
All the returned units are disassembled even the ones classified as non-
remanufacturable since still they include some reusable parts. Thus, the total emissions
for disassembling 100,116 air conditioner units per year, which are calculated by
multiplying the results in Table 4.25 by 100,116, are illustrated in Table 4.26.
89
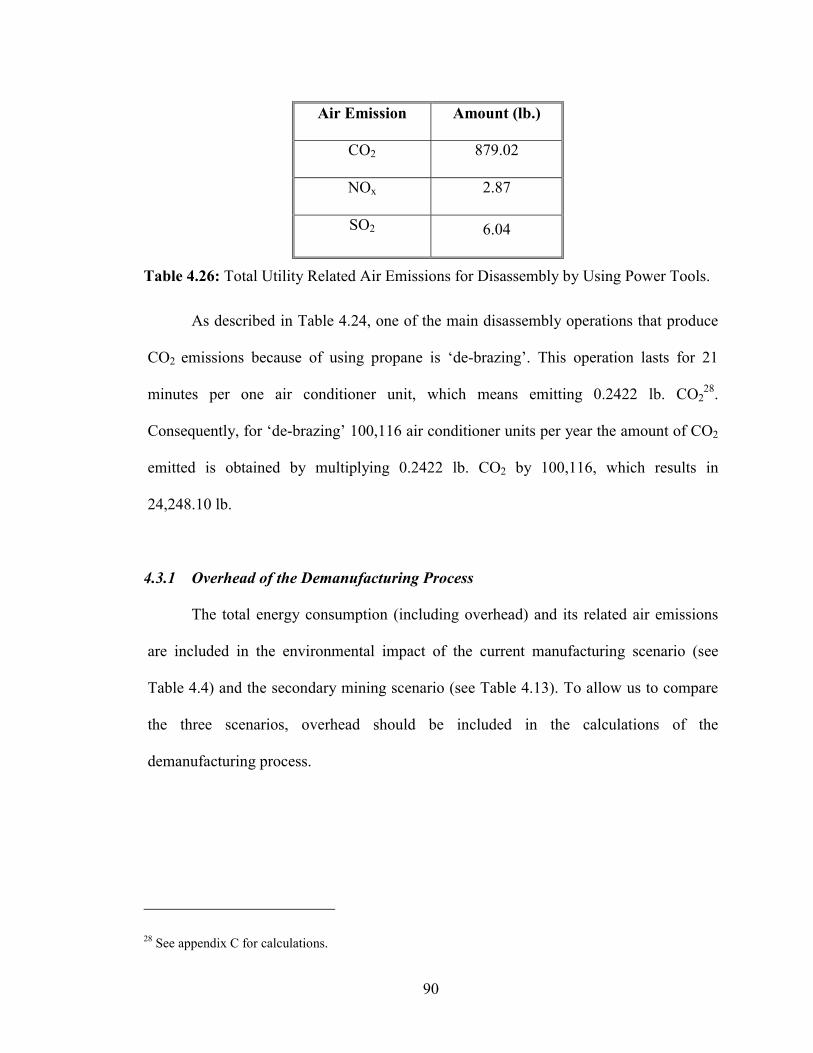
Air Emission Amount (lb.)
CO2 879.02
NOx 2.87
SO2 6.04
Table 4.26: Total Utility Related Air Emissions for Disassembly by Using Power Tools.
As described in Table 4.24, one of the main disassembly operations that produce
CO2 emissions because of using propane is ‘de-brazing’. This operation lasts for 21
minutes per one air conditioner unit, which means emitting 0.2422 lb. CO228.
Consequently, for ‘de-brazing’ 100,116 air conditioner units per year the amount of CO2
emitted is obtained by multiplying 0.2422 lb. CO2 by 100,116, which results in
24,248.10 lb.
4.3.1 Overhead of the Demanufacturing Process
The total energy consumption (including overhead) and its related air emissions
are included in the environmental impact of the current manufacturing scenario (see
Table 4.4) and the secondary mining scenario (see Table 4.13). To allow us to compare
the three scenarios, overhead should be included in the calculations of the
demanufacturing process.
28 See appendix C for calculations.
90
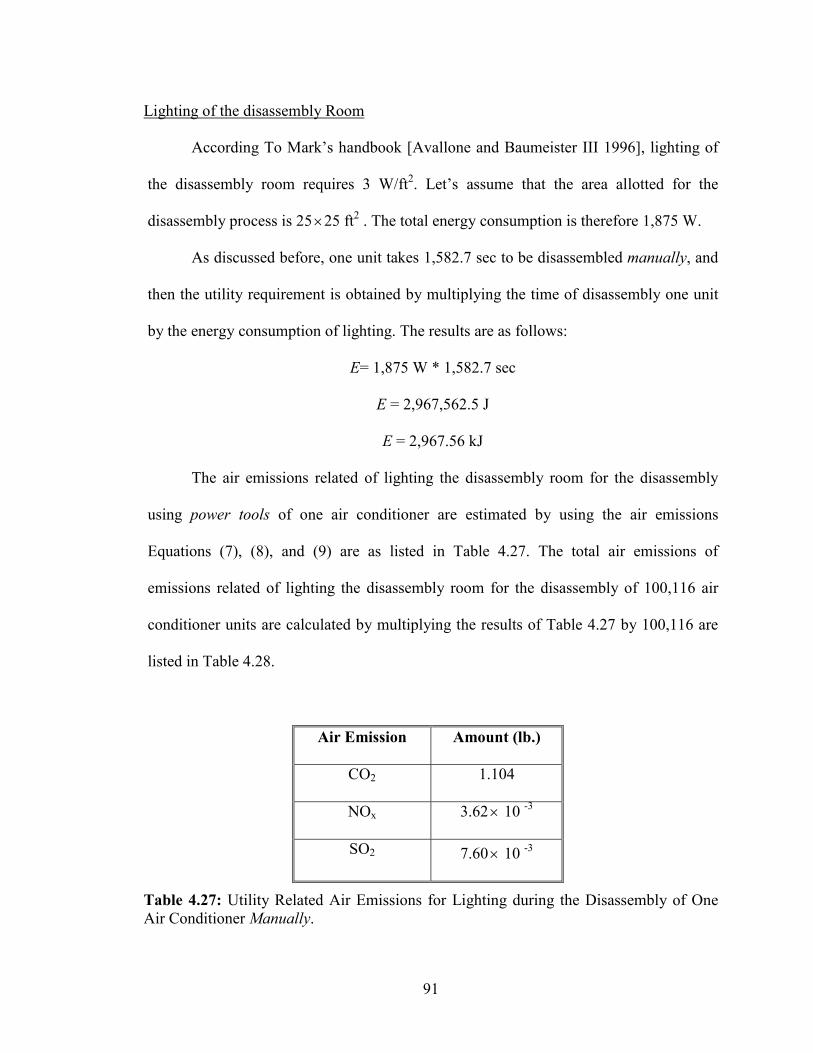
Lighting of the disassembly Room
According To Mark’s handbook [Avallone and Baumeister III 1996], lighting of
the disassembly room requires 3 W/ft2. Let’s assume that the area allotted for the
disassembly process is 25�25 ft2 . The total energy consumption is therefore 1,875 W.
As discussed before, one unit takes 1,582.7 sec to be disassembled manually, and
then the utility requirement is obtained by multiplying the time of disassembly one unit
by the energy consumption of lighting. The results are as follows:
E= 1,875 W * 1,582.7 sec
E = 2,967,562.5 J
E = 2,967.56 kJ
The air emissions related of lighting the disassembly room for the disassembly
using power tools of one air conditioner are estimated by using the air emissions
Equations (7), (8), and (9) are as listed in Table 4.27. The total air emissions of
emissions related of lighting the disassembly room for the disassembly of 100,116 air
conditioner units are calculated by multiplying the results of Table 4.27 by 100,116 are
listed in Table 4.28.
Air Emission Amount (lb.)
CO2 1.104
NOx 3.62� 10 -3
SO2 7.60� 10 -3
Table 4.27: Utility Related Air Emissions for Lighting during the Disassembly of One Air Conditioner Manually.
91
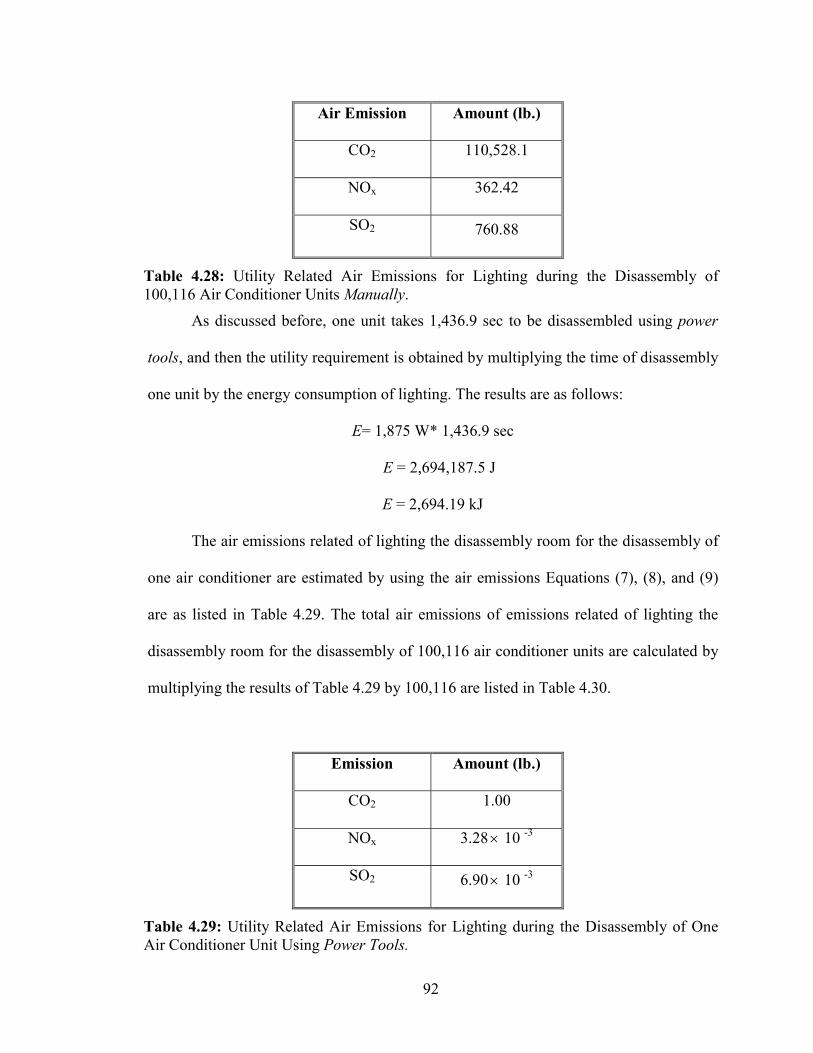
Air Emission Amount (lb.)
CO2 110,528.1
NOx 362.42
SO2 760.88
Table 4.28: Utility Related Air Emissions for Lighting during the Disassembly of 100,116 Air Conditioner Units Manually.
As discussed before, one unit takes 1,436.9 sec to be disassembled using power
tools, and then the utility requirement is obtained by multiplying the time of disassembly
one unit by the energy consumption of lighting. The results are as follows:
E= 1,875 W* 1,436.9 sec
E = 2,694,187.5 J
E = 2,694.19 kJ
The air emissions related of lighting the disassembly room for the disassembly of
one air conditioner are estimated by using the air emissions Equations (7), (8), and (9)
are as listed in Table 4.29. The total air emissions of emissions related of lighting the
disassembly room for the disassembly of 100,116 air conditioner units are calculated by
multiplying the results of Table 4.29 by 100,116 are listed in Table 4.30.
Emission Amount (lb.)
CO2 1.00
NOx 3.28� 10 -3
SO2 6.90� 10 -3
Table 4.29: Utility Related Air Emissions for Lighting during the Disassembly of One Air Conditioner Unit Using Power Tools.
92

The total air emissions related to lightning during the disassembly of 100,116 air
conditioner units are as follows in Table 4.30.
Emission Amount (lb.)
CO2 100,340.10
NOx 328.38
SO2 690.80
Table 4.30: Utility Related Air Emissions for Lighting During the Disassembly of 100,116 Air Conditioner Units Using Power Tools.
HVAC of the disassembly Warehouse
According to ASHRAE Handbook [ASHRAE 1995]. and based on the weather in
South Carolina, the HVAC energy consumption would be negligible.
Summary of results
Finally, the total emissions of the manual disassembly process are estimated by
combining the emission of CO2 24,248.10 lb. from the ‘de-brazing’ operation, with the
results form Table 4.28. The results are listed in Table 4.31.
Air Emission Amount (lb.)
CO2 134,776.2
NOx 362.42
SO2 760.88
Table 4.31: Total Air Emissions for Manual Disassembly of 100,116 Air Conditioner Units.
93
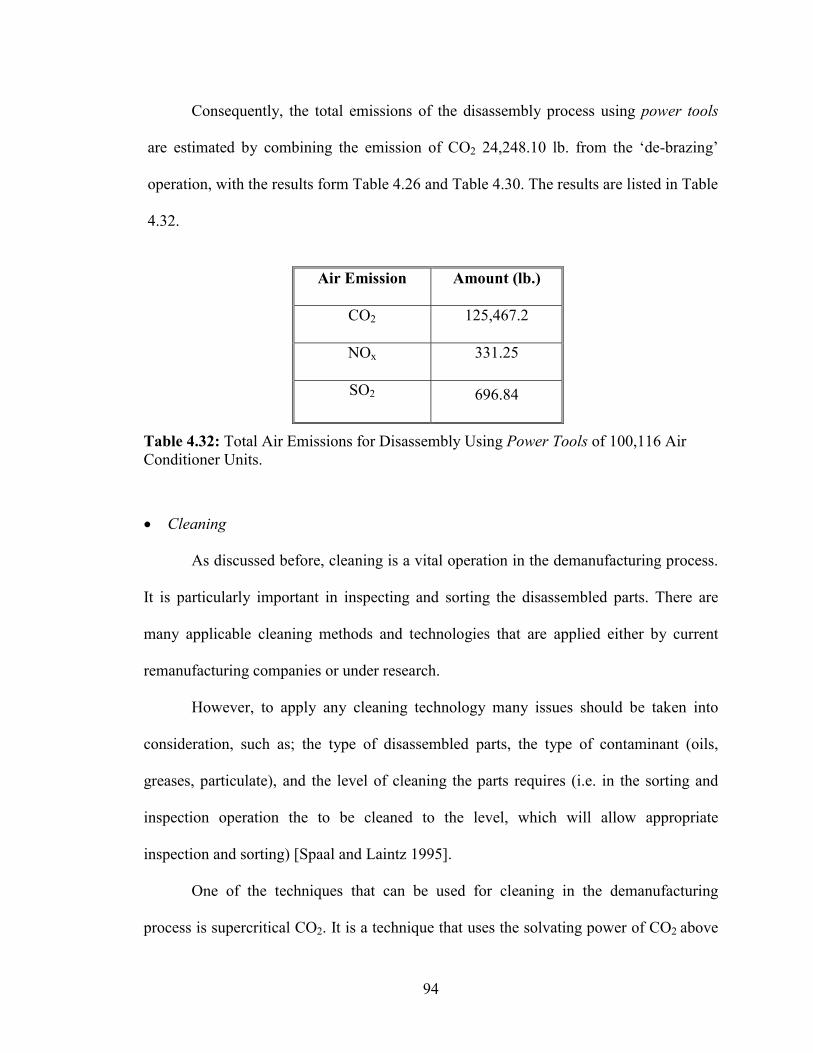
Consequently, the total emissions of the disassembly process using power tools
are estimated by combining the emission of CO2 24,248.10 lb. from the ‘de-brazing’
operation, with the results form Table 4.26 and Table 4.30. The results are listed in Table
4.32.
Air Emission Amount (lb.)
CO2 125,467.2
NOx 331.25
SO2 696.84
Table 4.32: Total Air Emissions for Disassembly Using Power Tools of 100,116 Air Conditioner Units.
�� Cleaning
As discussed before, cleaning is a vital operation in the demanufacturing process.
It is particularly important in inspecting and sorting the disassembled parts. There are
many applicable cleaning methods and technologies that are applied either by current
remanufacturing companies or under research.
However, to apply any cleaning technology many issues should be taken into
consideration, such as; the type of disassembled parts, the type of contaminant (oils,
greases, particulate), and the level of cleaning the parts requires (i.e. in the sorting and
inspection operation the to be cleaned to the level, which will allow appropriate
inspection and sorting) [Spaal and Laintz 1995].
One of the techniques that can be used for cleaning in the demanufacturing
process is supercritical CO2. It is a technique that uses the solvating power of CO2 above
94
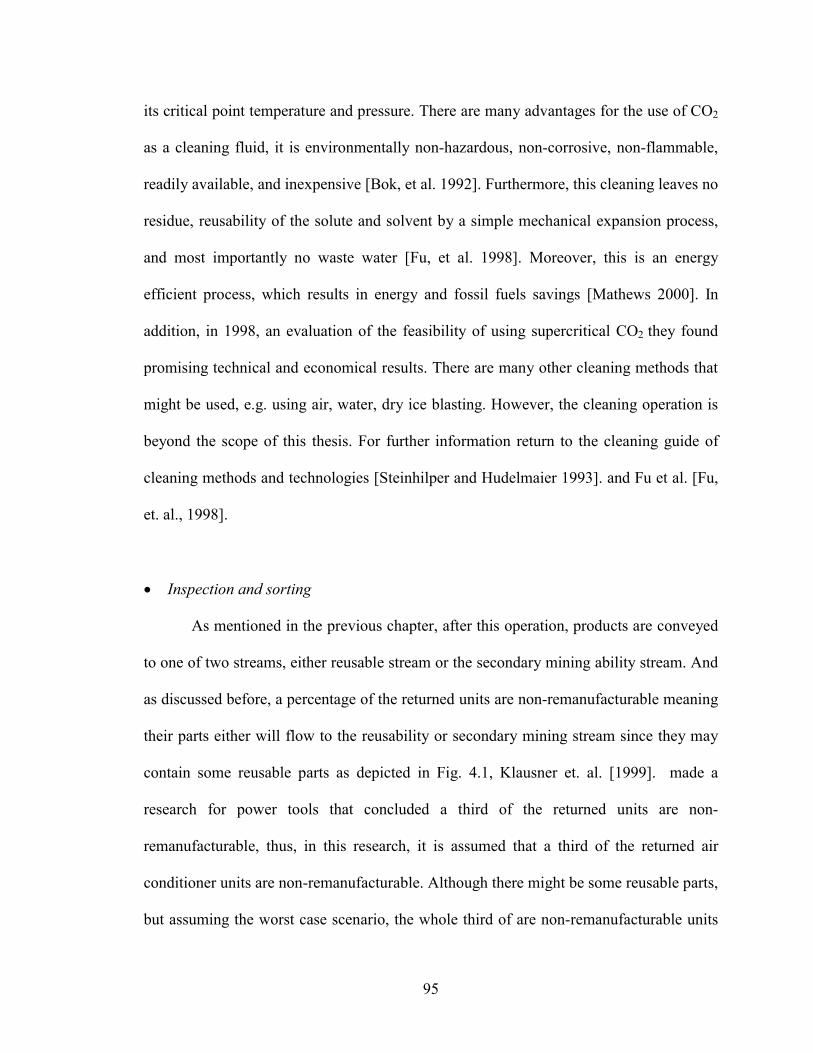
its critical point temperature and pressure. There are many advantages for the use of CO2
as a cleaning fluid, it is environmentally non-hazardous, non-corrosive, non-flammable,
readily available, and inexpensive [Bok, et al. 1992]. Furthermore, this cleaning leaves no
residue, reusability of the solute and solvent by a simple mechanical expansion process,
and most importantly no waste water [Fu, et al. 1998]. Moreover, this is an energy
efficient process, which results in energy and fossil fuels savings [Mathews 2000]. In
addition, in 1998, an evaluation of the feasibility of using supercritical CO2 they found
promising technical and economical results. There are many other cleaning methods that
might be used, e.g. using air, water, dry ice blasting. However, the cleaning operation is
beyond the scope of this thesis. For further information return to the cleaning guide of
cleaning methods and technologies [Steinhilper and Hudelmaier 1993]. and Fu et al. [Fu,
et. al., 1998].
�� Inspection and sorting
As mentioned in the previous chapter, after this operation, products are conveyed
to one of two streams, either reusable stream or the secondary mining ability stream. And
as discussed before, a percentage of the returned units are non-remanufacturable meaning
their parts either will flow to the reusability or secondary mining stream since they may
contain some reusable parts as depicted in Fig. 4.1, Klausner et. al. [1999]. made a
research for power tools that concluded a third of the returned units are non-
remanufacturable, thus, in this research, it is assumed that a third of the returned air
conditioner units are non-remanufacturable. Although there might be some reusable parts,
but assuming the worst case scenario, the whole third of are non-remanufacturable units
95

are secondarily mined. Therefore, Equation (23-b) is used to calculate the secondary
mining weight since the data available is not specified for each part only; the percentage
of reusability compiled for the whole unit.
3 3
Reusable Parts
Remanufacturable
units
100% returned units
Fig. 4.1: A Flow Diagram of the Returned Air Co
From the above discussion the reusability efficien
the weight of one unit 71.57 lb., and N is the number o
100,116. Then, M will be 2,386,045.606 lb. In addition, f
lb. Thus, the total amount that is conveyed to the
2,392,048.28 lb.
96
1/
2/Secondary Mining
Non-remanufacturable
units
nditioner Units.
cy is 2/3 then, � = 0.667, m is
f the units that are taken back
rom production SP is 6,002.67
secondary mining process is
By following the methodology applied for secondary mining (section 3.3.1) and
combining the results with utility related air emissions by using Equations (7), (8), and
(9), the total environmental impact of secondary mining the non-remanufacturable
products are listed in Table 4.33.
Outputs Amount (lb.)
Landfills 193,091.95
CO2 5,337,170
Gaseous 9,853.97
SO2 43,325.21
N2 326,775.77
H2 8,576.21
NOx 15,941.13
Table 4.33: The Environmental Impact of Secondary Mining Materials Process of the Non-Remanufacturable Products.
Based on the results from Table 4.33, and by applying Equation (24) the
secondary mining efficiency, � is 7%.
In order to produce 100,200 units per year, then, by the amount of wastes
(landfills) generated 193,091.95 lb. materials should be extracted, which has an impact
that combines the materials extraction outputs and utility related air emissions as shown
in Table 4.34.
97

Outputs Amount (lb.)
Landfills 462,871.45
CO2 1,337,767.89
Gaseous 496.27
SO2 7,640.85
N2 283,232.89
H2 7,433.43
NOx 3,404.36
Table 4.34: Environmental Impact of Extracting Materials to Be Able to Produce 100,200 Units.
Accordingly, the total environmental impact of the demanufacturing process is
calculated for the two scenarios. For the manual disassembly, the results in Tables 4.31
and 4.33 and 4.34 are combined together and obtained the results listed in Tables 4.35.
Outputs Amount (lb.)
Landfills 655,963.40
CO2 6,809,714.09
Gaseous 10,350.24
SO2 51,726.94
N2 610,008.66
H2 16,009.64
NOx 19,707.91
Table 4.35: Total Enviornmnetal Impact of the Demanufacuring Scneraio Manually.
98
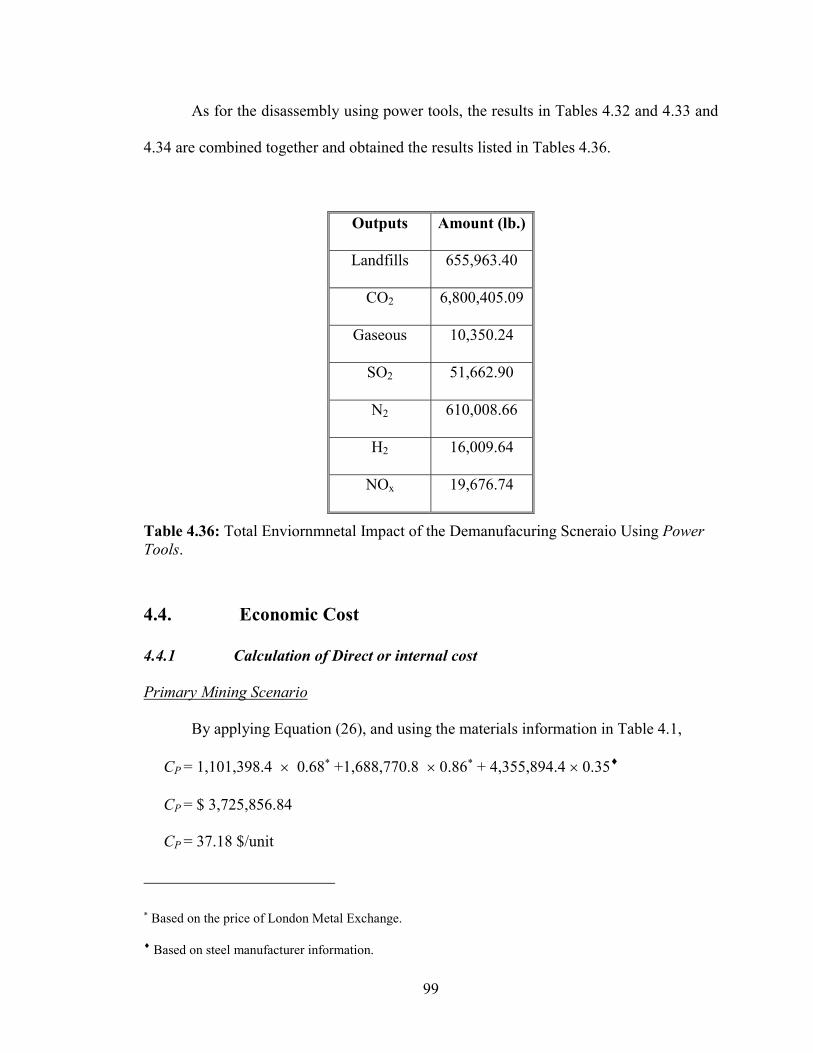
As for the disassembly using power tools, the results in Tables 4.32 and 4.33 and
4.34 are combined together and obtained the results listed in Tables 4.36.
Outputs Amount (lb.)
Landfills 655,963.40
CO2 6,800,405.09
Gaseous 10,350.24
SO2 51,662.90
N2 610,008.66
H2 16,009.64
NOx 19,676.74
Table 4.36: Total Enviornmnetal Impact of the Demanufacuring Scneraio Using Power Tools.
4.4. Economic Cost
4.4.1 Calculation of Direct or internal cost
Primary Mining Scenario
By applying Equation (26), and using the materials information in Table 4.1,
CP = 1,101,398.4 � 0.68� +1,688,770.8 � 0.86� + 4,355,894.4 � 0.35�
CP = $ 3,725,856.84
CP = 37.18 $/unit
� Based on the price of London Metal Exchange. � Based on steel manufacturer information.
99
Secondary mining
In this scenario, two costs should be considered, the secondary mined materials
cost (CS) Equation (27) and the cost of primary materials (CP) Equation (26) used to be
able to produce the required number of annual production, and using the information in
Tables 4.10 and 4.19. The secondary mined materials cost based on the [Richardon, K.
1999]. the results are as follows: CP = 480.64 � 0.68 + 5,428.18 � 0.86 + 488,908 � 0.35
CP = $176,113.016
CS = 1,101,398.4 � 0.325 +1,688,770.8 � 0.425 + 4,355,894.4 � 0.0225
CS =$1,173,689.694
The total internal cost by applying Equation (27�) is:
CT = CP + CS
CP = 1,173,689.694 + 176,113.016
CP = $1,349,802.71
CP = 13.47 $/unit
Demanufacturing
As for this scenario, the cost of using primary (CP) and secondary materials (CS)
are accounted, besides the cost of energy consumption (CE) and the disassembly cost (CD)
Equation (20) other than the cost of tools (CT).
CP = 160.2 � 0.68 + 1,809.39 � 0.86 + 162,969.47 � 0.35
CP = $391,229.90
CS = 367,132.8 � 0.325 +562,923.6 � 0.425 + 1,451,964.8� 0.0225
100
CS = $58,704.326
By applying Equation (20) the manual disassembly cost is:
CD = 2,967.56 �1/575,24429 � 100,116 + 1530 � 26.37/60 � 100,116 + 27.931 +
16.9532 � 100,116 � 21/60/15
CD = $700,154.985
By using Equation (28) the total direct or internal cost is:
CT= CP + CS + CD
CT= $1,150,089.205
CT = 11.48 $/ unit
By applying Equation (20) the disassembly cost using power tools is:
CP = 160.2 � 0.68 + 1,809.39 � 0.86 + 162,969.47 � 0.35
CP = $391,229.90
CS = 367,132.8 � 0.325 +562,923.6 � 0.425 + 1,451,964.8� 0.0225
CS = $58,704.326
CD = (23.544 + 2,694.19) �1/575,244 � 100,116 + 15 � 23.95/60 � 100,116 +
+43.733 + 27.9 + 16.95 � 100,116 � 21/60/15
CD = $639,595.025
By using Equation (28) the total direct or internal cost is:
CT= CP + CS + CD
29 Price of Energy per kJ based on South Carolina Rate [EDF 2000].. 30 Assumed Labor Cost. 31 Torch Cost [Grainger 1996].. 32 Propane Cylinder Cost which lasts for 15 hours [Grainger 1996]..
33 Power Tool Cost [Grainger 1996]..
101
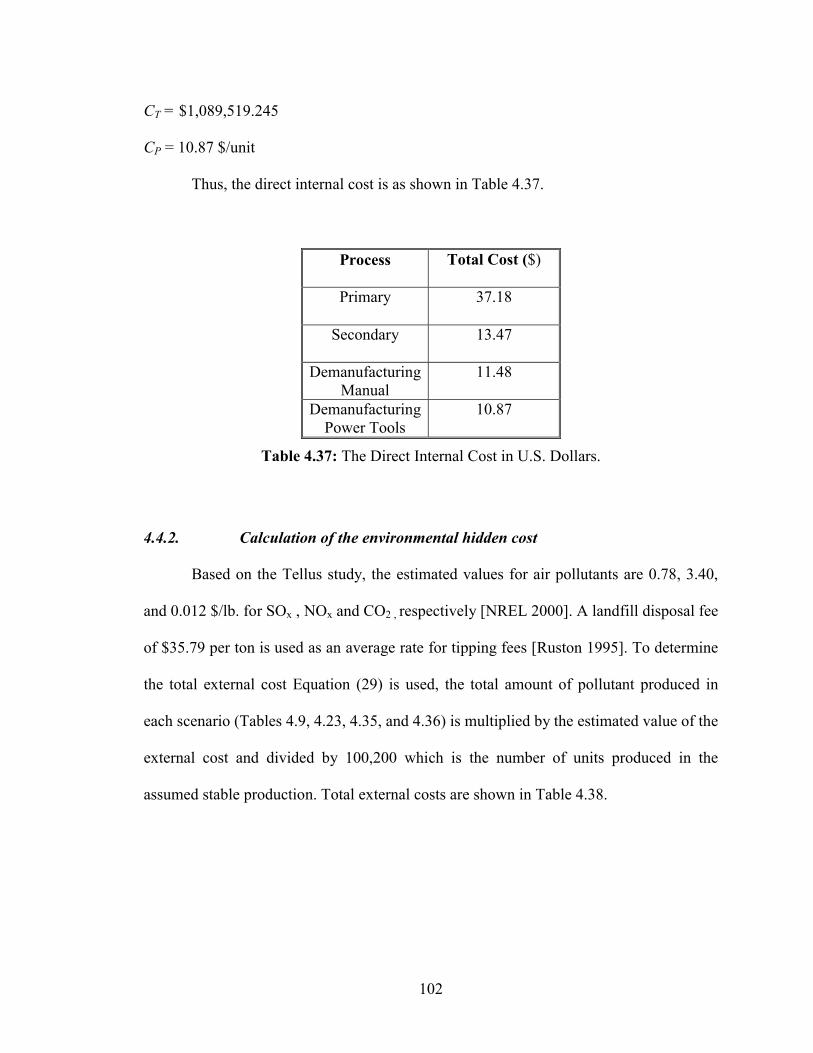
CT = $1,089,519.245
CP = 10.87 $/unit
Thus, the direct internal cost is as shown in Table 4.37.
Process Total Cost ($)
Primary 37.18
Secondary 13.47
DemanufacturingManual
11.48
DemanufacturingPower Tools
10.87
Table 4.37: The Direct Internal Cost in U.S. Dollars.
4.4.2. Calculation of the environmental hidden cost
Based on the Tellus study, the estimated values for air pollutants are 0.78, 3.40,
and 0.012 $/lb. for SOx , NOx and CO2 , respectively [NREL 2000]. A landfill disposal fee
of $35.79 per ton is used as an average rate for tipping fees [Ruston 1995]. To determine
the total external cost Equation (29) is used, the total amount of pollutant produced in
each scenario (Tables 4.9, 4.23, 4.35, and 4.36) is multiplied by the estimated value of the
external cost and divided by 100,200 which is the number of units produced in the
assumed stable production. Total external costs are shown in Table 4.38.
102
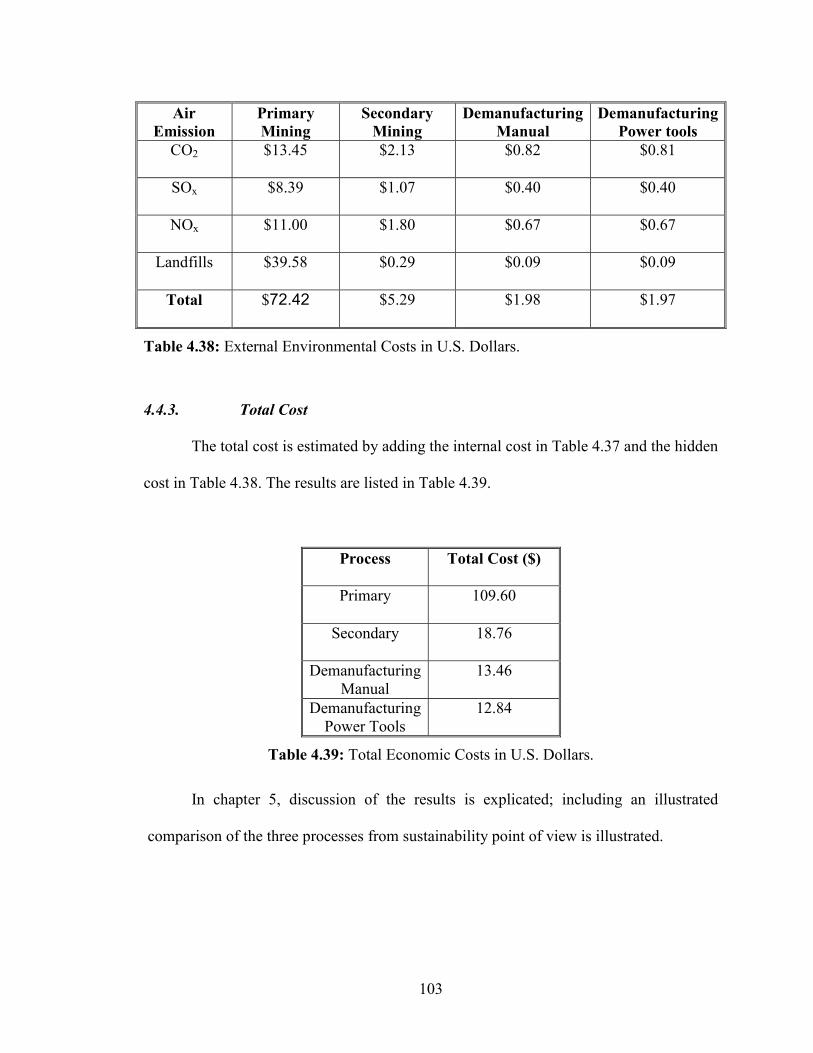
Air Emission
Primary Mining
Secondary Mining
Demanufacturing Manual
DemanufacturingPower tools
CO2 $13.45 $2.13 $0.82 $0.81
SOx $8.39 $1.07 $0.40 $0.40
NOx $11.00 $1.80 $0.67 $0.67
Landfills $39.58 $0.29 $0.09 $0.09
Total $72.42 $5.29 $1.98 $1.97
Table 4.38: External Environmental Costs in U.S. Dollars.
4.4.3. Total Cost
The total cost is estimated by adding the internal cost in Table 4.37 and the hidden
cost in Table 4.38. The results are listed in Table 4.39.
Process Total Cost ($)
Primary 109.60
Secondary 18.76
DemanufacturingManual
13.46
DemanufacturingPower Tools
12.84
Table 4.39: Total Economic Costs in U.S. Dollars.
In chapter 5, discussion of the results is explicated; including an illustrated
comparison of the three processes from sustainability point of view is illustrated.
103
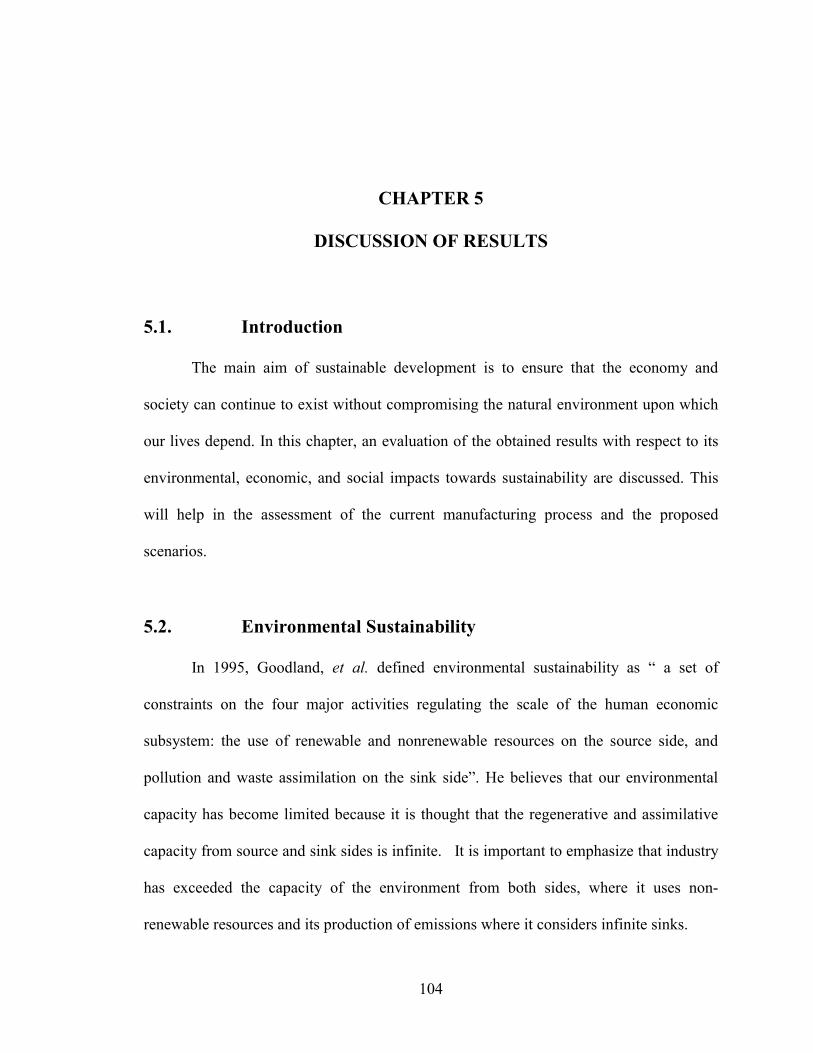
CHAPTER 5
DISCUSSION OF RESULTS
5.1. Introduction
The main aim of sustainable development is to ensure that the economy and
society can continue to exist without compromising the natural environment upon which
our lives depend. In this chapter, an evaluation of the obtained results with respect to its
environmental, economic, and social impacts towards sustainability are discussed. This
will help in the assessment of the current manufacturing process and the proposed
scenarios.
5.2. Environmental Sustainability
In 1995, Goodland, et al. defined environmental sustainability as “ a set of
constraints on the four major activities regulating the scale of the human economic
subsystem: the use of renewable and nonrenewable resources on the source side, and
pollution and waste assimilation on the sink side”. He believes that our environmental
capacity has become limited because it is thought that the regenerative and assimilative
capacity from source and sink sides is infinite. It is important to emphasize that industry
has exceeded the capacity of the environment from both sides, where it uses non-
renewable resources and its production of emissions where it considers infinite sinks.
104

One of the interesting articles demonstrated that if the release of all substances
that cause ozone depletion stopped now, it would take one century for it to return to its
pre-CFC effectiveness [Goodland 1995]. Taking these findings into consideration,
industry has to find a solution for its environmental unsustainability, immediately.
The following discussion shows the environmental impact assessment of some
conventional emissions to the grand cycle of earth associated with the three scenarios
studied.
5.2.1 Carbon Monoxide
Carbon monoxide (CO) is a colorless, odorless, tasteless, poisonous gas that
results from incomplete combustion of fuels, i.e. coal, heating oil, or any combustible
materials.
When CO enters the body, it inhibits the blood from absorbing oxygen; thus, the
heart and brain are not going to function appropriately. A person exposed to high levels
of CO may die, or just complain of heart pains, headache, nausea fatigue, poor vision and
concentration if just exposed to small amounts [CARB 1994].
CO is one of the emissions that result from the current, and proposed scenarios.
However, in this case CO is emitted to the air, which will then react with oxygen and end
up as CO2. That is the reason behind adding carbon monoxide to CO2.
105
5.2.2 Carbon Dioxide
Carbon dioxide (CO2) is balanced in nature when oceans and plants absorb it34. It
is emitted to the atmosphere by natural processes in equilibrium. Since the Industrial
Revolution, the concentration of CO2 have risen about 28% and considered as the second
prevalent greenhouse gas after water vapor, which contributes 70% of the effect. 80% of
CO2 emissions are contributed to energy burned for transportation, heating, and power
plants.
Greenhouse gases are important to the earth, since they allow sunlight to penetrate
the atmosphere to warm the earth, by infrared radiation, to about 63 °F. Otherwise, it
would be 3 °F. Greenhouse gases work like a blanket to trap the infrared rays that warm
the surface of the earth.
CO2 is not the only gas that causes greenhouse effects, however, each greenhouse
gas absorbs heat in the atmosphere differently. That’s why the idea of Global Warming
Potential (GWP) has been “developed to compare the ability of each greenhouse gas to
trap heat in the atmosphere relative to another gas. CO2 was chosen as a reference gas to
be consistent with Intergovernmental Panel on Climate Change (IPCC) guidelines” [EPA
2000]. However, some gases, e.g. CO, NOx, SO2, don’t have GWP since there is no
agreement upon the method to estimate its contribution to climate change.
Each year, 6.6 billion metric tons of carbon dioxide is produced. In 1994, 1.65
billion metric tons of carbon equivalent were produced by the U.S. Almost 85% of
greenhouse gas emissions are produced from the burning of fossil fuels [DOE 2000].
34 Through a process called photosynthesis.
106

The industrial sector is one of the main contributors to CO2 emissions, which results
either directly from the combustion of fossil fuels or consumption of electricity.
CO2 is one of the main emissions that are produced in the current, and proposed
scenarios. From the results in chapter four, it is evident that CO2 emissions were reduced
by 84.17% between the current and the secondary mining scenarios. Consequently, it is
decreased by 93.9% between the current and the demanufacturing process. Alternatively,
the percent of reduction of CO2 between the secondary mining and the demanufacturing
process is 61.7%.
The amounts of CO2 produced in the three scenarios are shown in Fig. 5.1.
0.00E+002.00E+074.00E+076.00E+078.00E+071.00E+081.20E+08
Amount (lb.)
Prim
ary
Seco
ndar
y
Man
ual
Dis
.
Pow
erto
ols
Dis
Carbon Dioxide
Fig. 5.1: The Amount of CO2 in the Three Scenarios.
5.2.3 Sulfur Dioxide
Sulfur dioxide (SO2) is produced during the combustion of fuels containing sulfur,
metal smelting and other industrial processes [EPA 1998]. Although 70% of SO2
emissions are accounted to electric utility, approximately 96% of this value is contributed
107
to coal combustion. SO2 is the main cause of acid rain. When SO2 is emitted into the
atmosphere, it reacts with water to form sulfuric acid (H2SO4), which then falls to the
earth with rain, snow, fog or as gas and particles. When it falls dry (gas and particles); it
corrodes what it settles on. This is then sometimes rinsed by rainstorms, contributing
additional acidity to the existing acid rain.
Acid rain affects water streams and lakes acidity in addition to its damage of
trees, impact on public health, deterioration of building materials, paints, statues, and
visibility degradation. Emissions of SO2 should be reduced to improve the environmental
quality of water streams and lakes, visibility, public health, and slow the deterioration of
buildings. However, SO2 emissions have decayed in recent years, resulting from the
change of electric utilities from using high sulfur to low sulfur coal [EPA 2000].
SO2 is one of the emissions that result from the current, and proposed scenarios,
because of the use of electric utility in such processes. From the results in chapter four, it
is obvious that SO2 emissions were reduced by 87.22% between the current and the
secondary mining scenarios. It is further diminished to 95.2% between the current and the
demanufacturing process. Sequentially, the percent of reduction of SO2 between the
secondary mining and the demanufacturing process is 66.4%. The amounts of SO2
produced in the three scenarios are shown in Fig. 5.2.
108
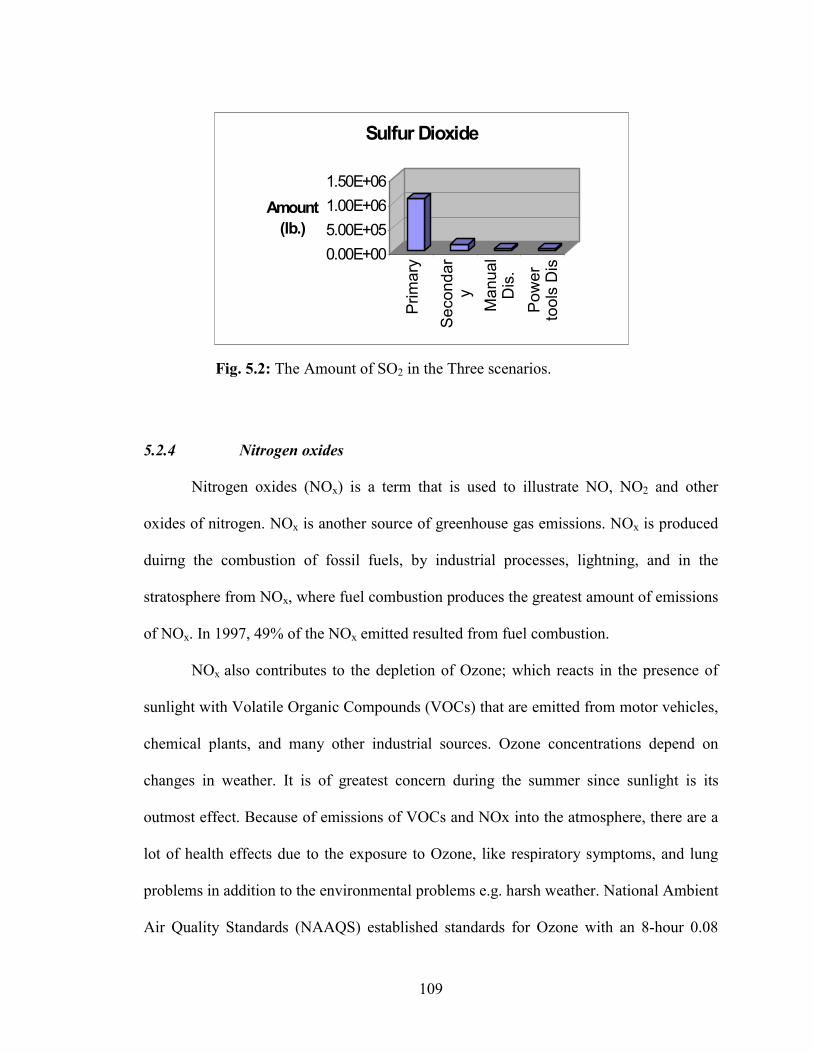
0.00E+005.00E+051.00E+061.50E+06
Amount (lb.)
Prim
ary
Seco
ndar
yM
anua
lD
is.
Pow
erto
ols
Dis
Sulfur Dioxide
Fig. 5.2: The Amount of SO2 in the Three scenarios.
5.2.4 Nitrogen oxides
Nitrogen oxides (NOx) is a term that is used to illustrate NO, NO2 and other
oxides of nitrogen. NOx is another source of greenhouse gas emissions. NOx is produced
duirng the combustion of fossil fuels, by industrial processes, lightning, and in the
stratosphere from NOx, where fuel combustion produces the greatest amount of emissions
of NOx. In 1997, 49% of the NOx emitted resulted from fuel combustion.
NOx also contributes to the depletion of Ozone; which reacts in the presence of
sunlight with Volatile Organic Compounds (VOCs) that are emitted from motor vehicles,
chemical plants, and many other industrial sources. Ozone concentrations depend on
changes in weather. It is of greatest concern during the summer since sunlight is its
outmost effect. Because of emissions of VOCs and NOx into the atmosphere, there are a
lot of health effects due to the exposure to Ozone, like respiratory symptoms, and lung
problems in addition to the environmental problems e.g. harsh weather. National Ambient
Air Quality Standards (NAAQS) established standards for Ozone with an 8-hour 0.08
109

parts per million (ppm) standard. NOx plays a role as well in the creation of acid rain35.
Recently NOx emissions levels are relatively constant. Where, they decayed 1%, between
1988 and 1997, and increased 1% between 1996 and 1997. However, since 1970, NOx
have increased 44% from power plants and 11% as a total [EPA 1998].
It can be determined from the results in chapter 4, that the emissions of NOx were
reduced by 83.68% between the current and the secondary mining scenarios. In addition,
it is reduced by 93.92% between the current and the demanufacturing process.
Alternatively, the percent of reduction of NOx between the secondary mining and
disassembly process using power tools is 62.8%. The amounts of NOx produced in the
three scenarios are shown in Fig. 5.3.
0.0E+001.0E+052.0E+053.0E+054.0E+05
Amount (lb.)
Prim
ary
Seco
ndar
yM
anua
lD
is.
Pow
erto
ols
Dis
Nitrogen Oxides
Fig. 5.3: The Amount of NOx in the Three scenarios.
It should be emphasized at this point that the manufacture process of the materials
into components is not studied in this research. This process would add more emissions
to these two scenarios (primary and secondary mining) which is eliminated in the
35 See section 5.2.2 for more information.
110
demanufacturing process since components already been manufactured and it preserves
its identity.
5.3. Economic Sustainability
Economics is the second fundamental characteristic of sustainable development to
be discussed in this chapter. According to the World Bank “sustainable development
requires maintenance of the environmental and human resource base that is essential for
long-term economic growth" [Foy 1990]. Notwithstanding, economist like Herman Daly
view economic activity as “develops without growth”, in other words, it doesn’t grow
beyond the carrying capacity of the earth36. From this macro view of the economy, Daly
is taking into account the finite limits on the earth’s ability to provide materials to use and
sinks for discarding our wastes. Based on that, the economic theory of sustainable
development has evolved, the theory in which the economy is viewed as a subsystem of
the ecosystem as shown in Fig. 5.4. As a result, this theory considers economic activity as bound by the constraints of
the ecosystem having the characteristics regenerative and absorptive capacity, i.e. its
ability to provide us with high quality raw materials to make things, and to break down
our wastes. To be able to accomplish a sustainable economy, the economy must not
surpass the limits of the ecosystem, since it will greatly decrease its capacity to support
humans. Growth beyond these limits will result in negative rather than positive
consequences [Motague 1998].
36 See section 1.2 for the definition of carrying capacity.
111
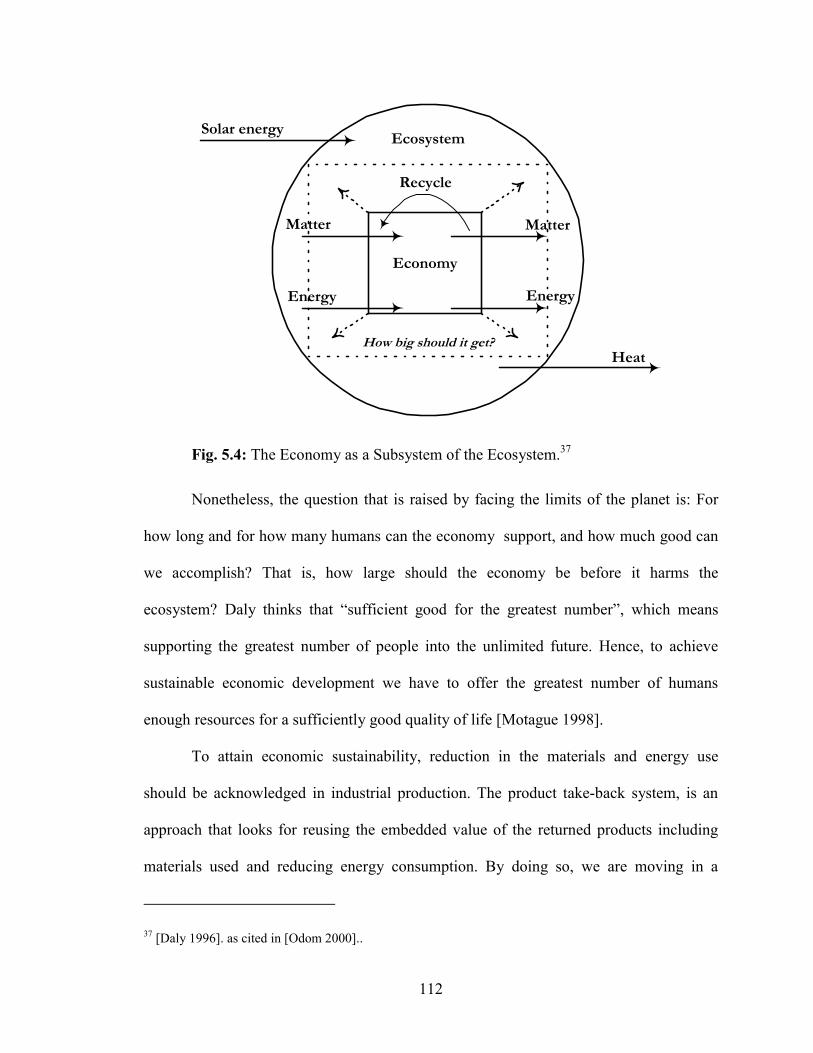
Ecosystem
How big should it get?
Solar energy
Heat
Matter Matter
Energy Energy
Recycle
Economy
Fig. 5.4: The Economy as a Subsystem of the Ecosystem.37
Nonetheless, the question that is raised by facing the limits of the planet is: For
how long and for how many humans can the economy support, and how much good can
we accomplish? That is, how large should the economy be before it harms the
ecosystem? Daly thinks that “sufficient good for the greatest number”, which means
supporting the greatest number of people into the unlimited future. Hence, to achieve
sustainable economic development we have to offer the greatest number of humans
enough resources for a sufficiently good quality of life [Motague 1998].
To attain economic sustainability, reduction in the materials and energy use
should be acknowledged in industrial production. The product take-back system, is an
approach that looks for reusing the embedded value of the returned products including
materials used and reducing energy consumption. By doing so, we are moving in a
37 [Daly 1996]. as cited in [Odom 2000]..
112
sustainable direction, one in which we are not exceeding the limits of the ecosystem’s
capacity to regenerate natural resources and absorb wastes.
In the current scenario, most of the materials used are raw, natural resources that
consume large amounts of energy to transform them into products, leaving behind
various production wastes. However, the secondary mining scenario preserves natural
resources since it recovers and ‘downcycles’ the material embedded in the product,
though, it consumes some energy and destroys the product. On the other hand, the
demanufacturing process preserves the embedded value of the product (its energy, labor
used, etc.) and doesn’t require a high-energy use. In Fig. 5.5 the amount of raw materials
used in the production of the air conditioners per year considering the three scenarios are
depicted.
From Fig. 5.5, it is shown that there is a tremendous reduction in the use of
natural resources, i.e. there is a percentage change of 93.1% between the current and
secondary mining scenarios, and 97.3% between the current and demanufacturing
scenarios.
Conversely, there is a decrease in the energy consumption as shown in Fig. 5.6. It
is shown that there is a tremendous reduction in the use of energy, i.e., there is a
percentage change of 83.7% between the current and secondary mining scenario, and
94.2% between the current and demanufacturing scenario.
113
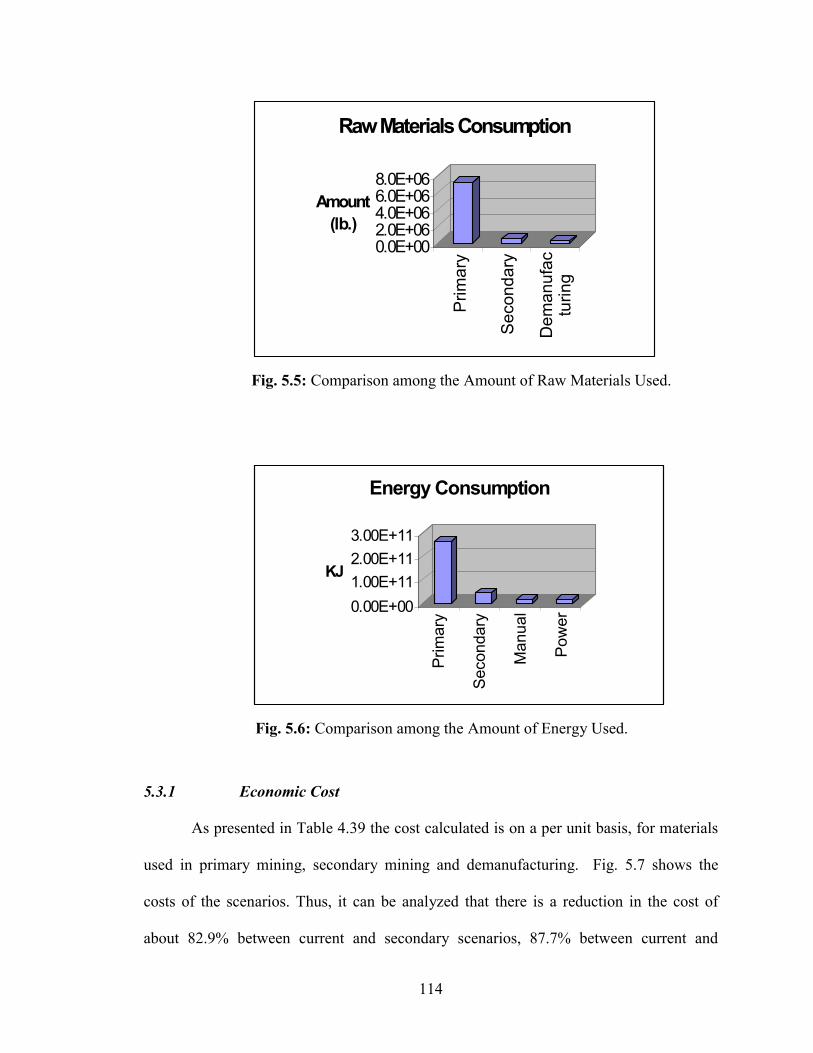
0.0E+002.0E+064.0E+066.0E+068.0E+06
Amount (lb.)
Prim
ary
Seco
ndar
y
Dem
anuf
actu
ring
Raw Materials Consumption
Fig. 5.5: Comparison among the Amount of Raw Materials Used.
0.00E+001.00E+112.00E+113.00E+11
KJ
Prim
ary
Seco
ndar
y
Man
ual
Pow
er
Energy Consumption
Fig. 5.6: Comparison among the Amount of Energy Used.
5.3.1 Economic Cost
As presented in Table 4.39 the cost calculated is on a per unit basis, for materials
used in primary mining, secondary mining and demanufacturing. Fig. 5.7 shows the
costs of the scenarios. Thus, it can be analyzed that there is a reduction in the cost of
about 82.9% between current and secondary scenarios, 87.7% between current and
114

manual disassembly, and 88.3% between current and disassembly using power tools.
Meaning, this system ensures promising economic results.
050
100150
$/Unit
Prim
ary
Seco
ndar
y
Man
ual
Dis
.Po
wer
Tool
s D
is.
Economic Cost in US Dollars/ Unit.
Fig. 5.7: The Economic Cost Per One Unit.
This cost might even increase more for primary and secondary mining scenarios if
the manufacture process of the materials into components is considered. Which
consequently would increase the reduction in cost between these two scenarios and the
demanufacturing process since components already been manufactured and it preserves
its identity .
5.4. Social Sustainability
As discussed before, development must be environmentally, economically, as
well as socially sustainable. From this concept, care must be taken that the product take-
back system is not socially destructive; conversely, outmost effort must be made to
ensure that it is restorative.
115
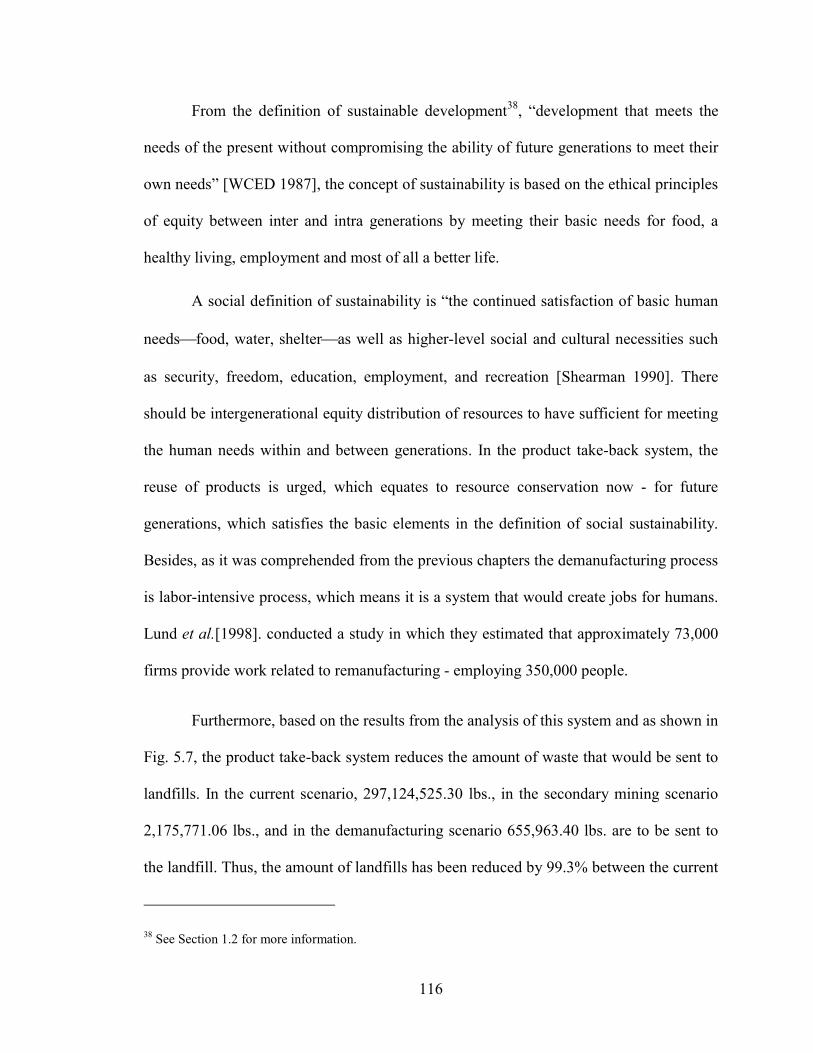
From the definition of sustainable development38, “development that meets the
needs of the present without compromising the ability of future generations to meet their
own needs” [WCED 1987], the concept of sustainability is based on the ethical principles
of equity between inter and intra generations by meeting their basic needs for food, a
healthy living, employment and most of all a better life.
A social definition of sustainability is “the continued satisfaction of basic human
needs�food, water, shelter�as well as higher-level social and cultural necessities such
as security, freedom, education, employment, and recreation [Shearman 1990]. There
should be intergenerational equity distribution of resources to have sufficient for meeting
the human needs within and between generations. In the product take-back system, the
reuse of products is urged, which equates to resource conservation now - for future
generations, which satisfies the basic elements in the definition of social sustainability.
Besides, as it was comprehended from the previous chapters the demanufacturing process
is labor-intensive process, which means it is a system that would create jobs for humans. Lund et al.[1998]. conducted a study in which they estimated that approximately 73,000
firms provide work related to remanufacturing - employing 350,000 people.
Furthermore, based on the results from the analysis of this system and as shown in
Fig. 5.7, the product take-back system reduces the amount of waste that would be sent to
landfills. In the current scenario, 297,124,525.30 lbs., in the secondary mining scenario
2,175,771.06 lbs., and in the demanufacturing scenario 655,963.40 lbs. are to be sent to
the landfill. Thus, the amount of landfills has been reduced by 99.3% between the current
38 See Section 1.2 for more information.
116
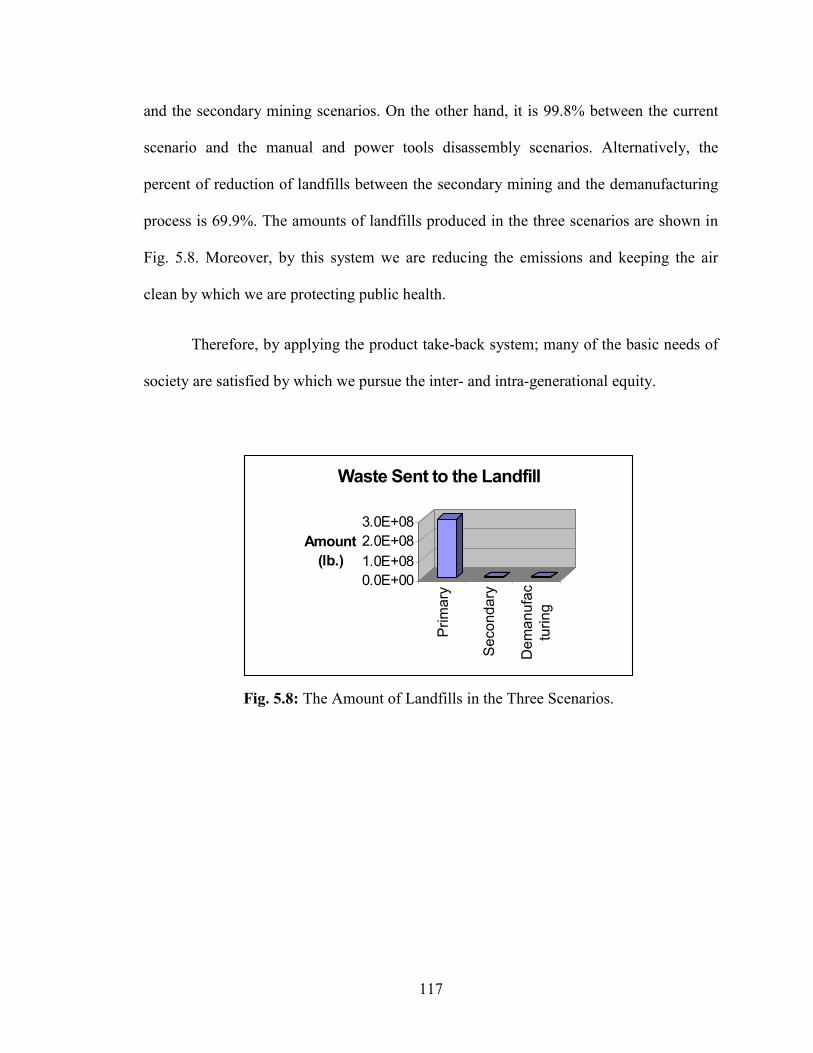
and the secondary mining scenarios. On the other hand, it is 99.8% between the current
scenario and the manual and power tools disassembly scenarios. Alternatively, the
percent of reduction of landfills between the secondary mining and the demanufacturing
process is 69.9%. The amounts of landfills produced in the three scenarios are shown in
Fig. 5.8. Moreover, by this system we are reducing the emissions and keeping the air
clean by which we are protecting public health.
Therefore, by applying the product take-back system; many of the basic needs of
society are satisfied by which we pursue the inter- and intra-generational equity.
0.0E+001.0E+082.0E+083.0E+08
Amount (lb.)
Prim
ary
Seco
ndar
y
Dem
anuf
actu
ring
Waste Sent to the Landfill
Fig. 5.8: The Amount of Landfills in the Three Scenarios.
117
CHAPTER 6
CONCLUSIONS AND RECOMMENDATIONS
6.1. Research Results
The product take-back system is a valuable approach towards industrial
sustainability, when it is implemented with regards to the environmental, economic and
social dimensions of sustainability. It can be speculated that the product take-back system
is a paradigm that is needed in our society; since by reusing components, the demand for
natural resources is reduced resulting in an efficient use of such resources and
improvement in waste management. By this scheme, we could attain a sustainable
economy that would not surpass the constraining limits of the ecosystem. Moreover, we
could offer “sufficient good for the greatest number”.
An analysis of the scenarios studied was presented in Chapter 3 and 4. The
current scenario is based on the existing use of primary raw materials where the post-
consumer product is either sent to landfills or secondary mined. However, the product
take-back system conserves natural resources, either as materials recovery when the
secondary mining scenario is applied, or as product embedded value recovery in the
demanufacturing scenario where the reuse of components within the product is the main
goal. The current system is linear, one that diminishes natural resources and degrades the
environment. It produces a large amount of emissions that contribute to greenhouse gas
effects and depletes the ozone. Producing one air conditioner generates 4,165,848.13 lbs.
118

of landfilled waste. Needless to say, the current system is not sustainable, i.e. it doesn’t
obey the principle of “waste-equals-food”, on the contrary it moves against it. To achieve
progression towards sustainability, alternative approaches must be studied and applied to
replace the current system.
Conversely, the secondary mining and the demanufacturing processes are
scenarios for the product take-back system, which represent alternatives for the current
industrial system. It gives the opportunity to recover higher value for the product.
However, it requires changes in the design of the manufacturing process and the product,
which results in a sustainable manufacturing process. As for the secondary mining, it is
developed as a material recovery system where the product is shredded. The
demanufacturing process is designed as a product embedded-value alternative. Because
the demanufacturing process is less energy intensive than the other scenarios, it reduces
pollutant emissions, landfills, and consumption of natural resources. It create jobs and
recovers the embedded value of the post-consumer air conditioner. By applying this
system, costs reductions are realized by i) avoiding waste treatment and disposal, and ii)
reducing inputs of raw materials and energy, both of which result in a lower
environmental impact. It should be emphasized at this point that the production and
manufacture of materials into components are not included in the analysis of the primary
and secondary mining process, which if added it would improve the efficiency of the
demanufacturing scenario.
The product take-back scenario is a near-zero waste scenario, the primary
objective if industry is to achieve industrial sustainability, and accomplish massive
improvements in the resource efficiency. In conclusion, the demanufacturing process
119
scenario ensures higher energy and materials savings when compared to the secondary
mining scenario. Although some of the returned products are secondary mined under this
new manufacturing concept, the overall performance when analyzed within the realm of
sustainability is a major improvement over the current system.
Therefore, based on the results of Chapter 4 and the discussion of Chapter 5, it
can be concluded that the demanufacturing process is the most sustainable process among
the three alternatives studied. It attempts to balance the three dimensions of sustainability.
Economically, it reduces the depletion of natural resources and energy consumption.
Socially, it creates jobs, provides quality goods at a reasonable price - hence a higher
standard of living, and reduces the need for landfill space. And finally, environmentally,
it reduces pollutant emissions.
6.2. Effect of the Disassembly Operation on Other Areas
It can be argued that the main process in the demanufacturing scenario is the
disassembly process. It is considered as the gateway of the parts for the remanufacturing
process. Therefore, it impacts other areas in the production; e.g., inventory control,
because of the uncertainty in the number and quality of the returned products.
Nonetheless, the proposed system is based on a leasing program, where the manufacturer
may lease the product for a predetermined (designed) time, which ensures that he will get
it back to remanufacture and lease out again. Using this approach the manufacturer will
be able to expect the number and quality of the ‘taken back’ products. On the other hand,
there should be collaboration between the disassembly and reassembly operations to
control inventory levels and prevent poor customer service. Production planning is
120
needed because of the hidden condition of the parts and the variation of the flow of the
returned equipment. A recommendation that should be considered for this issue is
employing a flexible workforce (part time labor). In addition, materials planning becomes
necessary due to the variation in the quality of the part. However, the leasing program
may solve some of these problems because the manufacturer having prepared parts
reliability studies could calculate how long the product should be used. Thus he could
forecast the probability of excellent, good, and bad quality of the ‘taken back’ products.
At that point, he would be able to reduce the uncertainty in the materials planning. One of
the main problems that might be faced is the supply and demand of the remanufactured
products, which may keep the production line idle for some time and cause economic loss
for the firm.
Daniel et al. [R. and Jr. 2000]. conducted a survey that implied 75% of
remanufactured products are not designed for disassembly, which results in higher
disassembly time and more waste. Therefore, product design plays a significant role in
making production sustainable, i.e., easier to disassemble; and as an approach for
increasing the product take-back system efficiency. From the perspective of the analysis
followed in this study, it is concluded that the more waste generated, the less the
efficiency and vice versa.
6.3. Product Design
This stage determines the efficiency of the life cycle of the product, even though
it uses 5% of the time and resources of the manufacturing cost, it determines about 70%
of the final product cost. All considerations should be taken into account as early as
121
possible, because design changes introduced later only add to the cost [Boothroyd, et al.
1994]. Therefore, resource requirements, environmental consequences and emissions of
the product should be addressed in this critical phase.
6.3.1 Sustainable Product Design
Maresa et al. [ 1999]. defined Sustainable Product Design as “the process which
creates product designs that are sustainable in terms of the environment and resource-use
whilst considering the need for the product.” Guidelines that are required in the design
stage to attain sustainable products are as follows:
1. Materials choice by supply, where materials should be amply abundant (i.e. not
scarce by considering the rates of use and sizes of reservoirs) and sufficiently
available in the rock and soil near the surface of the earth [Graedel and Allenby
1995]. On the other hand, material choices are not only limited by supply, but also
by toxicity levels. Selected materials should have very little toxicity properties.
2. Substitute hazardous with non-hazardous materials.
3. Resource-use efficiency in terms of materials and energy, by designing products
that are lighter and more integrated.
4. Use renewable resources, i.e. materials and energy.
5. Sometimes, non-renewable materials should be used, designers could ensure to
increase the life span of the product by designing for reuse, and recyclability.
6. Take into consideration the end life of the product where possible reuse and
remanufacture may be applied, which requires disassembly (see section 6.3.2 for
design for disassembly).
122

6.3.2 Design for Disassembly
Disassembly is important and cannot be by-passed in remanufacturing, however,
it is a non-value-added phase. To increase the efficiency of the demanufacturing process,
products should be redesigned in order to simplify and accelerate disassembly. The
longer it takes to disassemble a returned product, the higher the cost. Thus, reducing the
time of disassembly and simplifying the process improves the remanufacturing
feasibility.
Guidelines that might be considered for design of disassembly are:
�� Avoid brute force techniques for disassembly to salvage sub-system components
that are in good condition.
�� Design the product in order to allow technological upgrade.
�� Parts must be joined in a manner that makes separation easy. Permanent joining
such as welding and crimping should not be used for remanufactured products,
since it is either destructive disassembly or time consuming, e.g. using snap fits
are suitable for disassembly.
�� It should be taken into consideration that the lifetime of the joints is the same as
the whole product. Joints must be corrosion resistant, durable and reusable, and
screw heads that can be easily damaged are not recommended.
�� Facilitate the accessibility to components.
�� Minimize the number of parts.
�� Minimize number of fasteners.
�� Leave surfaces available for tool grasping.
�� Provide easy access to inaccessible points.
123
�� Minimization of product structure complexity by minimizing the number of parts.
�� Standardize and use fewer fastener types in order to use fewer tools in
disassembly.
One of the issues that should be considered in product design is standardization, to
allow the manufacturer to make agreements to take-back each other’s products. This way
a high percentage of inventory, production planning, etc. problems are solved.
6.4. General Recommendations
�� Consider internal reuse of scrap products instead of sending them to secondary
mining.
�� Offer a like-new warranty (instead of repair) to the customer buying a new
remanufactured product. The U.S. and Germany have high labor rates, which
make products, and thus repair, more expensive. This offer is attractive to the
consumer and a good option for the manufacturer since he insures that the
returned product is reusable [Klausner and Grimm 1999].
�� Convey an up-to-date image of the product. Some features might be added to the
product, and the outer parts that determines the cognition of the product should be
replaced.
�� Employ Total Quality Environmental Management (TQEM). Quality is
equivalent to reducing the waste. Sustainability, which aims toward zero waste is
then a quality concept that can be approached by TQEM. This practice facilitates
the integration of sustainability and industrial ecology into the industrial
production and manufacturing. The key to TQEM is not producing waste in the
124
first place; it is continually improving the environmental performance of the
process. There are many tools of TQEM, e.g. Pareto Charts, Cause and Effect
Diagrams, and Control Charts, can be used to identify the significant causes of the
pollution problem, potential causes for the environmental problems in the process,
and to determine the quantity of natural process variability respectively. Using
such techniques the company might study the amount of solid waste, air
emissions, and energy use. I would recommend the company might start with
TQEM philosophy as a starting point to accomplish sustainability.
�� Investigate Reverse Logistics, a critical stage that is considered to be one of the
main issues in a product take-back system. It involves the number and locations of
the take-back centers and routes for transportation. Locklear [2000] developed a
decision support model using geographic information systems (GIS) to design the
reverse logistics of the product take-back process. In her research, she quantified
the resulting effects of such a system and evaluated results taking the concept and
dimensions of sustainability into account.
6.5. Future Work
Issues in the product take-back system model require further research as follows:
�� One of the main assumptions in this research is stable production (static
production line). This assumption might not be the case for many industrial
manufacturing processes, since most of them are dynamic, so the results in this
research might be expanded to a dynamic system rather than a stable one.
125
�� The environmental impacts studied in this research were limited to the solid waste
and air emissions, more research might be done to include water waste, noise,
odor, etc.
�� The check in operation in the demanufacturing process classifies the taken back
products either as remanufacturable or non-remanufacturable. More attention
should be given to this operation, e.g. if the product classified as non-
remanufacturable includes some reusable parts, and then full disassembly should
not be performed. Efforts should be made to remove only the reusable parts, and
the rest of the product should be sent directly to the secondary mining stream.
This way, there will be a reduction in the disassembly time, energy consumed and
its environmental impact, and thus disassembly cost. Therefore, product design
plays a major role in this perspective, where attention should be given during the
design stage for this issue.
One of the applicable recommendations in this perspective is checking the
product at the residential site, when the technician can test it when he un-installs
the old product and affixes a description sticker about the product’s status.
�� Research should be done with regard to the number of times the product can be
reused, and the materials can be ‘downcycled’. This may help in two aspects: it
will help during the check in process, where a code bar that shows the number the
time the product has been remanufactured, or its materials ‘downcycled’ to make
the decision to which stream it would flow. Moreover, the other issue is that this
study might give the manufacturer a broader image of the system and determines
if it is feasible and cost-effective.
126
�� As discussed before (section 4.3) research has been done for the cleaning
operation in the demanufacturing process, which ensures a promising
environmental and economic results, further research is needed in this area in
collaboration with the Chemical Engineering department.
�� The demanufacturing process that includes check-in, disassembly, cleaning,
inspection and sorting is only a partial creation of a product take-back system.
Research should be done for the remanufacturing process which may include
reconditioning, reassembly, testing and packaging and compare it to the
manufacture of the raw materials and the product to complete the entire take-back
system and combine the results of both studies.
6.6. Conclusion
Finally, I would suggest that industry should work by operating in a cyclical
manner and moving foreword not just into materials recovery but also into a value-added
recovery that recaptures most of the embedded value that entered a product during its
initial manufacture. As shown in this research, when comparing the current system with
the demanufacturing process of a product take-back system, movement towards a zero
waste system and sustainability is achieved. It was shown that the product take-back
model reduced the need of ever more raw material inputs, saved energy consumption,
contributed in comparison a minor environmental impact since it reduces discharges of
pollutant air emissions (e.g. CO2, NOX, and SO2), and greater social consequences since
it reduces amount of lanfilling and creating jobs. Consequently, the product take-back
system predicts as shown in Table 4.39 an average cost of $12.84 per one unit in the
127
demanufacturing using power tools which is a gain of $96.76 or 88.35% less than the
current manufacturing process. Ultimately, by product take-back system the overall
resource demand and environmental impact would be diminished and industrial practice
would move toward industrial sustainability.
128
REFERENCES
Anderson, R. C. (1998). Mid-Course Correction. Atlanta, Georgia, The Peregrinzilla Press.
Anderson, R. C. (1999). “The NEXT Industrial Revolution.” Georgia Tech Alumni Magazine: 20-28.
ASHRAE (1995). ASHRAE Handbook: Heating, Ventilating, and Air-Conditioning Applications. Atlanta,
GA, ASHRAE.
Avallone, E. and T. Baumeister III, Eds. (1996). Marks' Standard Handbook for Mechanical Engineers.
New York, New York, McGraw Hill.
Ayres, R., G. Ferre, et al. (1997). “Eco-Efficiency, Asset Recovery and Remanufacturing.” European
Management Journal. 15(5): 557-574.
Ayres, R. U. and L. W. Ayres (1998). Accounting for Resources, 1. Cheltenham, Uk. Northampton, MA,
USA, Edward Elgar.
Bok, E., D. Kelch, et al. (1992). “Supercritical Fluids for single wafer cleaning.” Solid State Technolgy.:
117-120.
Boothroyd, G., P. Dewhurst, et al. (1994). Product Design for Manufacture and Assembly. New York, New
York., Marcel Dekker, Inc.
Braungart, M. and J. Engelfried (1992). “An "Intelligent Product System" to replace "Waste
Management".” Fresenius Envir Bull. 1: 613-619.
CARB (1994). Combustion Pollutants in your Home, California Air Resources Board.
<http://www.arb.ca.gov/research/indoor/combustf.htm> (Nov 01, 2000).
Chertow, M. R. (1998). “Waste, Industrial ecology, and sustainability.” Social Research 65(1): 31-53.
Daly, H. (1996). Beyond Growth: The Economics of Sustainable Development. Boston, Massachusetts.,
Beacon Press.
Davis, J. (1996). Product Stewardship and the Coming Age of Takeback. Arlington, MA, Cutter
Information Corp.
DOE (2000). Greenhouse Gases, Global Climate Change, and Energy, U. S. Department of Energy.
<http://www.eia.doe.gov/oiaf/1605/ggccebro/chapter1.html.> (Nov,09, 2000)
129
Dowie, T. and P. Kelly (1994). Estimation of disassembly times. Manchester, UK., Machester Metroplitan
University.
EDF (2000). Find out about your electricity, Environmental Defense.
<http://www.environmentaldefense.org/programs/Energy/green_power/x_calculator.html> (Oct. 3, 2000).
EPA (1998). 1997 National Air Quality: Status and Trends, U.S. EPA Office of Air & Radiation.
<htp://www.epa.gov/oar/aqtrnd97/brochure/so2.html.>(Nov, 03, 2000).
EPA (1998). Six Principal Pollutants - Nitrogen Dioxide (NO2), U.S. EPA Office of Air & Radiation.
<ttp://www.epa.gov/oar/aqtrnd97/brochure/no2.html.>ct. 20, 2000).
EPA (2000). , United States Environmental Protection Agency. <ttp://www.epa.gov/.>(Aug. 22, 2000).
EPA (2000). Criteria Pollutants, United States Environmental Protection Agency.
<http://www.epa.gov/globalwarming/emissions/national/crit-pol.html.> (Aug.13, 2000).
EPA (2000). Extended Producer Responsibility. <http://www.epa.gov/epaoswer/non-hw/reduce/epr/abt-
over.htm.> (sep, 09, 2000).
EPA (2000). Global Warming Potentials., United States Environmnetal Protection Agency.
<http://www.epa.gov/globalwarming/emissions/national/gwp.html.> (Nov. 01, 2000).
Fenton, M. (1997). Iron and Steel Scrap, U.S. Geological Survey (USGS): 1-18.
<http://minerals.usgs.gov/minerals/pubs/commodity/iron_&_steel_scrap/360497.pdf.>
Ferenc, J. (June 1994). Rheem's recycling program is hot stuff. Contractor 41(6): 5.
Fishbein, B. (1998). EPR: What Does It Mean? Where Is It Headed? P2: Pollution Prevention Review 8:
43-55.
Foy, G. (1990). “Economic Sustainability and the Preservation of Environmental Assets.” Environmental
Management 14(6): 771-778.
Frosch, R. A. (1992). Industrial Ecology: A Philosophical introduction. Proceedings of the National
Academy of Sciences 89.
Fu, H., M. Matthews , et al. (1998). “Recycling steel from grinding swarf.” Waste Management. WM 394:
1-9.
Goodland, R. (1995). “The concept of environmental sustainability.” Annual Review of ecology and
Systematics 26: 1-24.
130
Graedel, T. E. and B. R. Allenby (1995). Industrial Ecology. Englewood Cliffs, New Jersey, Prentice Hall.
Grainger (1996). Industrial and Commercial Equipment and Supplies.
Hawken, P. (1993). The Ecology of Commerce. New York, HarperCollins Publishers, Inc.
Hileman, B. (1998). “Industrial ecology making an impact.” C&EN: 41-42.
Interface (1997). Sustainability Report.
ISRI (2000). Recycling Nonferrous Scrap Metals, Institue of Scrap Recycling Industries, Inc: 1-9.
ISRI (2000). Recycling Scrap Iron an Steel. United States., Institue of Scrap Recycling Industries, Inc.
Klausner, M. and W. Grimm (1999). “Integrating product takeback and technical service.” IEEE 8: 48-53.
Lindhqvist, T. (1993). Europe's Move toward Extended Producer Responsibility:
Experience in Germany, the Netherlands and Scandinavia. The Greening of Durable Products: What's the
Best Route - Public Policy vs. Private Initiative, Massachusetts Institute of Technology.
Locklear, B. (2000). A Decision Support System for the Reverse Logistics of Product Take-Back Using
Geographic Information Systems and the Concepts of Sustainability. School of the Environment.
Columbia, South Carolina, University of South Carolina.
Lund, R. (1984). “Remanufacturing.” Technology Review 87(2): 19-29.
Lund, R. (1998). Remanufacturing: and American resource. Proceedings of the fifth International Congress
Environmentally Conscious Design and Manufacturing., Rochester Institute of Technology, Rochester, NY.
Masera, D. (1999). “Sustainable product development: a key factor for small enterprise development - the
case of furniture production in the Purepecha region, Mexico.” The journal of sustainable product
development.: 28-29.
Mathews, M. (2000). Supercritical Carbon Dioxide. University of South Carolina. Personal
Communication.
Motague, P. (1998). “Sustainable Development.” Rachel's Environment and Health Weekly.(624).
NCR (1999). Life-Cycle Analysis and Costing in an Environmentally Conscious Manufacturing
Environment, The National Center Remanufacturing. <http://www.reman.rit.educ/> , (Aug, 12,1999).
NREL (2000). The Environmental Externality Costs of Petroleum. " National Renewable
Energy Laboratory. http://rredc.nrel.gov/biomass/doe/rbep/ethanol/seven.html." (Sep. 05, 2000).
131
Odom, L. (2000). The Sustainable Systems Analysis Algorithm (SSAA):A Sustainable Design and
Development Valuation Methodology. Department of Mechanical Engineering. Columbia, South Carolina,
University Of South Carolina.
R., V. d. and G. Jr. (2000). “Production planning and control for remanufacturing: industry practice and
research needs.” Journal of Operations Management. 18: 467-483.
Richards, D., B. Allenby, et al. (1994). The greening of industrial ecosystems. Washington DC, National
Academy of Engineering.
Richardson, K. (1999). Recycling Cost Rates. Mid Carolina Steel and Recycling. Personal Contact.
Ruston, J. (1995). Advantage Recycle: Assessing the Full Costs and Benefits of Curbside Recycling,
Environmental Defense.<http://www.environmentaldefense.org/pubs/Reports/advrec.html#table1.> (July
11, 2000)
Shearman, Richard. (1990) The Meaning and Ethics of Sustainability. Environmental Management 14 (1)
1-8.
Spaal, W. and K. Laintz (1995). A Survey on the Use of Supercritical Carbon Dioxide as a Cleaning
Solvent. Supercritical Fluid Cleaning. Park Ridge, NJ, Noyes Publications.
Steinhilper, R. and U. Hudelmaier (1993). Erfolgreiches Produktrecycling zur erneuten Verwendung oder
Verwertung: Ein Leitfaden fur Unternehmen. Eschborn, Germany, Rationalisierungs Kuratorium der
Deutschen Wirtschaft.
Tibbs, H. B. C. (1991). Industrial Ecology: An Environmental Agenda for Industry., Arthur D. Little, Inc.
Vanegas, J. (1997). Sustainable Design and Construction Strategies for the Built
Environment. Building Energy: Ensuring a Sustainable Future.
WCED (1987). Our common future. World Commission on Environment and Development. Oxford,
Oxford University Press.
William McDonough, M. B. (1998). “The NEXT Industrial Revolution.” The Atlantic Monthly: 82-92.
Young, P., G. Byrne , et al. (1997). “Manufacturing and the Enviornmnet.” The international Journal of
Advanced Manufacturing Technology 13: 488-493.
Zovanyi, G. (1998). Growth Management for a Sustainable Future. Westport, Connecticut, London,
PRAEGER.
132

APPENDIX A-Derivation of Energy Related Air Emissions
133
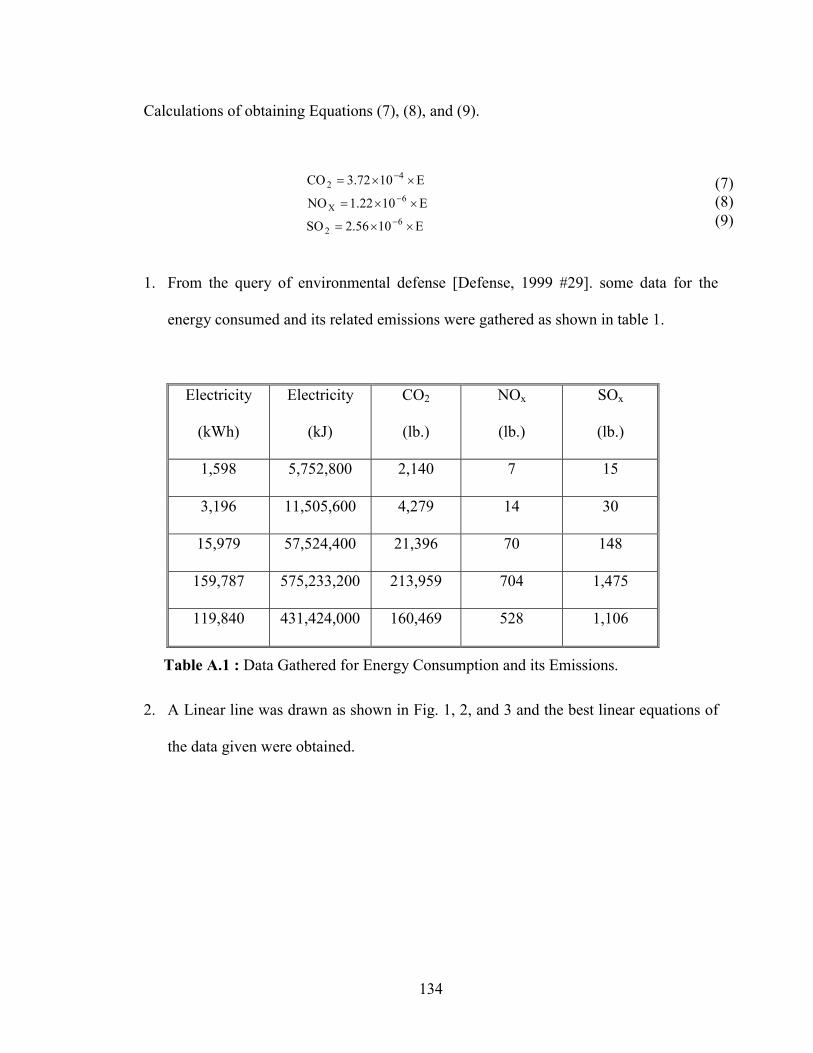
Calculations of obtaining Equations (7), (8), and (9).
E1056.2SO
E1022.1NO
E1072.3CO
62
6X
42
���
���
���
�
�
� (7) (8) (9)
1. From the query of environmental defense [Defense, 1999 #29]. some data for the
energy consumed and its related emissions were gathered as shown in table 1.
Electricity
(kWh)
Electricity
(kJ)
CO2
(lb.)
NOx
(lb.)
SOx
(lb.)
1,598 5,752,800 2,140 7 15
3,196 11,505,600 4,279 14 30
15,979 57,524,400 21,396 70 148
159,787 575,233,200 213,959 704 1,475
119,840 431,424,000 160,469 528 1,106
Table A.1 : Data Gathered for Energy Consumption and its Emissions.
2. A Linear line was drawn as shown in Fig. 1, 2, and 3 and the best linear equations of
the data given were obtained.
134

Carbon Dioxide y = 3.72E-04xR2 = 1.00E+00
0100,000200,000300,000
0.0000E+00
2.0000E+08
4.0000E+08
6.0000E+08
8.0000E+08
Energy Consumption in KJ
Am
ount
of C
O2
in
Lbs
Fig. A.1: Relation of CO2 Emissions and Energy Consumption.
Nitrogen oxides y = 1.22E-06xR2 = 1.00E+00
0200400600800
0 2E+08 4E+08 6E+08 8E+08
Energy Consumption in KJ
Am
ount
of N
Ox
in
Lbs
Fig. A.2: Relation of NOx Emissions and Energy Consumption.
Sulfur Dioxide y = 2.56E-06xR2 = 1.00E+00
0500
100015002000
0 2E+08 4E+08 6E+08 8E+08
Energy Consumption in KJ
Am
ount
of S
O2
in
Lbs
Fig. A.3: Relation of SOx Emissions and Energy Consumption.
135
APPENDIX B-Transformation of CO into CO2 Emissions Calculations.
136
CO will react with Oxygen according to the following chemical reaction
CO + ½ O2 CO2
The molecular weight of CO is 12 + 16 = 28
The molecular weight of CO2 is 12 + 2*16 = 44
The equation that will transform CO into CO2 equivalent is as follows:
CO2 equivalent = CO amount * 44/28
137
APPENDIX C- Calculations of CO2 Emissions of ‘De-brazing’
Operation
138
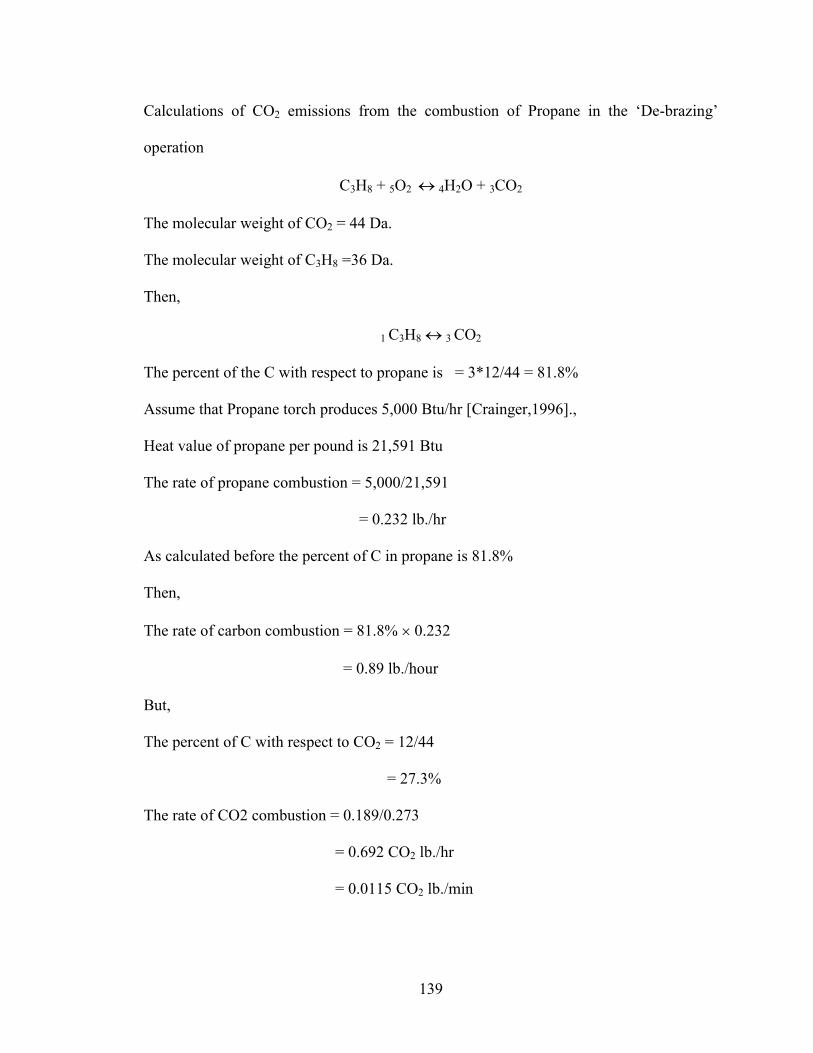
Calculations of CO2 emissions from the combustion of Propane in the ‘De-brazing’
operation
C3H8 + 5O2 � 4H2O + 3CO2
The molecular weight of CO2 = 44 Da.
The molecular weight of C3H8 =36 Da.
Then,
1 C3H8 � 3 CO2
The percent of the C with respect to propane is = 3*12/44 = 81.8%
Assume that Propane torch produces 5,000 Btu/hr [Crainger,1996].,
Heat value of propane per pound is 21,591 Btu
The rate of propane combustion = 5,000/21,591
= 0.232 lb./hr
As calculated before the percent of C in propane is 81.8%
Then,
The rate of carbon combustion = 81.8% � 0.232
= 0.89 lb./hour
But,
The percent of C with respect to CO2 = 12/44
= 27.3%
The rate of CO2 combustion = 0.189/0.273
= 0.692 CO2 lb./hr
= 0.0115 CO2 lb./min
139
Well, in the disassembly process the torch is used for 21 minutes per one air conditioner
CO2 emissions in the disassembly process of one air conditioner= 0.0115 � 21
= 0.2422 lb. CO2
In our case 100,116 air conditioners are returned and disassembled,
Total CO2 emissions from the ‘de-brazing’ operation = 0.2422 � 100,116
= 24,248.1 lb. CO2
140