Embed Size (px)
Citation preview
Horizon Scanning evidence and analysis report (1) – Issue 2 Prepared by SAMI Consulting 1
STRATEGIC EVIDENCE OF FUTURE CHANGE
Horizon Scanning evidence and analysis report (1)
Defra Partnership
March 2015
Produced by: SAMI Consulting
The Rectory 1 Toomers Wharf Canal Walk Newbury RG14 1DY Contact: Huw Williams [email protected] Direct line: 07711 107223
Disclaimer: The views expressed in this document are those of the authors, SAMI Consulting Ltd, and do not necessarily reflect those of DEFRA or its partners
Horizon Scanning evidence and analysis report (1) – Issue 2 Prepared by SAMI Consulting 2
STRATEGIC EVIDENCE OF FUTURE CHANGE
Horizon Scanning evidence and analysis report (1)
Defra Partnership
March 2015
CONTENTS
EXECUTIVE SUMMARY .............................................................................................. 3
SECTION A - INTRODUCTION .................................................................................... 4
A1 What is this report for? ......................................................................................... 4 A2 The capture of existing data – the “scan of scans” ............................................... 4 A3 Analysing the data ............................................................................................... 5 A4 Structure of this report .......................................................................................... 6 A5 How to read a Futurescaper influence map .......................................................... 7 A6 Gap analysis ........................................................................................................ 8 A7 Next steps for this report ...................................................................................... 8
SECTION B – MAPPING THE LANDSCAPE - BIG EXTERNAL DRIVERS AND EFFECTS OF CHANGE ............................................................................................... 9
B1 Top causes ........................................................................................................ 10 B2 Top effects ......................................................................................................... 11
SECTION C - CLUSTERS OF CHANGES EMERGING FROM THE SCANNING ...... 12
C1 Smart countryside .............................................................................................. 12 C2 Big Data and food security ................................................................................. 16 C3 Biotechnology and gene editing ......................................................................... 19 C4 Public attitudes to climate change ...................................................................... 22
SECTION D- EMERGING SIGNALS .......................................................................... 25
D1 Artificial intelligence and Expert Systems ........................................................... 25 D2 Non-transport air pollution .................................................................................. 29 D3 Massively distributed energy sources ................................................................ 32 D4 Increasing challenges and solutions for water quality ........................................ 35 D5 Decline in nutritional value of C3 crops .............................................................. 38 D6 Environmental monitoring by citizens ................................................................. 40
SECTION E – WHERE THE PROJECT IS GOING NEXT .......................................... 43
E1 Scanning ............................................................................................................ 43 E2 Analysis ............................................................................................................. 43
APPENDICES ............................................................................................................ 44
Appendix A – project structure and methodology .................................................... 44 Appendix B - Influence maps by NEAPS+ ............................................................... 47 Appendix C - Comparative table of issues/NEAPS, Cranfield 2013 key factors, our stories ..................................................................................................................... 56 Appendix D – Expert Panel comments .................................................................... 56
Horizon Scanning evidence and analysis report (1) – Issue 2 Prepared by SAMI Consulting 3
EXECUTIVE SUMMARY
This is the first report of a project to provide foresight and insight to help Defra and its partners to identify potential threats, risks and opportunities, in order to achieve their strategy, policy and operational goals. This first report is predominantly a “scan of scans” – getting the baseline data from earlier work into our database so that it reflects the current level of knowledge. In future reports we will look ahead using a range of analytical techniques. We look to use this first report to stimulate comments and reaction in order to hone the structure of future reports to more closely meet the needs of the Defra Partnership. Four major clusters of factors emerged from the data.
Smart countryside ICT can increasingly be used to improve the effectiveness of countryside management. What would an interagency policy to support the emergence of the ‘smart countryside’ look like? How might the ‘smart countryside’ support the digitisation of the food chain in a way that enhances food security and continued economic growth and competitiveness of the UK agricultural sector?
Big Data and food security Surprisingly we saw few linkages between these topics, despite there being increased digitisation of the food chain - this could represent an opportunity area. Are Defra and its partners doing enough to utilise Big Data to explore impacts on food security? Are there further opportunities to exploit advances in Big Data techniques to gauge the risk to the UK food supply?
Advances in bio-technology Bio-technology developments are accelerating so policy responses may be needed in shorter timescales than previously expected. How will GM policy in Europe be affected by increasing economic pressure for GM crops (and other GMOs) for biofuel, pharma, animal feed, and human consumption? What are the implications of accelerating biotechnology for UK farming and land use?
Public attitudes to climate change Climate change is clearly a well-known over-arching factor that affects a myriad of environmental and food safety and security concerns. But public attitude is key to any response. Is there any research which assesses changes in public attitudes to climate change following extreme weather events? How will the campaigns by certain media affect public pressure for action on climate change?
In each case, we identified where things had moved on from the Annual Key Factors 2013 (AKF2013) report produced for Defra by Cranfield University, and posed some questions to consider. We also explored six emerging signals:
Artificial intelligence and expert systems
Non-transport air pollution
Massively distributed energy sources
Increasing challenges and solutions for water quality
Decline in nutritional value of C3 crops
Environmental monitoring by citizens One important observation from the scanning and analysis is the high degree of interaction and interdependencies of all the issues.
Horizon Scanning evidence and analysis report (1) – Issue 2 Prepared by SAMI Consulting 4
SECTION A - INTRODUCTION
A1 What is this report for? The evidence of future change identified by the new Horizon Scanning project is intended to stimulate strategic thinking within the Defra Partnership1, to ask questions such as: The objective is to provide evidence that delivers foresight and insight to help identify potential threats, risks and opportunities in order to achieve strategy, policy and operational goals. As with all futures work, the evidence presented in this report is not predictive and cannot give the answer of ‘this is what will happen in 10 years’ time’. What it does present is the current evidence of future change - where we think societal, economic and environmental change may be headed, so we can think more strategically and plan for the longer term.
A2 The capture of existing data – the “scan of scans” Horizon Scanning is the “systematic examination of information to identify potential threats, risks, emerging issues and opportunities, beyond the Parliamentary term, allowing for better preparedness and the incorporation of mitigation and exploitation into the policy making process.” 2 This first report captures existing data firstly the Annual Key Factors reports from 2012 and 2013 (AKF2012, AKF2013), compiled for Defra by Cranfield University. The highlights from these reports were validated and expanded with additional trends and emerging changes extracted from six other leading UK and international scanning projects: a “scan of scans” (see Appendix A for sources). We have also commenced selected interviews within the Defra Partnership and some initial original scanning. This baseline set of change data is stored as short ‘stories’ in a scanning database called Futurescaper3, which has powerful mapping tools to show the interlinking between stories and depicting their relationship graphically.
1 Defra, Environment Agency, Natural England, Food Standards Agency, and Welsh
Government 2 Definition from Jon Day Review of cross-government horizon scanning
3 www.futurescaper.com
How could these issues affect or interact with our objectives?
What are the possible risks and opportunities? How might we need to respond and when, for example
by commissioning research or using new/existing technologies?
What is the challenge for the way we do things now? Do we need to change our approach, work with
different partners, be more
innovative and take more risks?
Horizon Scanning evidence and analysis report (1) – Issue 2 Prepared by SAMI Consulting 5
A3 Analysing the data Futurescaper was used to analyse the collected scanning data in four very different ways:
1. At the largest scale, the body of scanning data was analysed as a whole, showing, for instance, the most influential causes of change, or where the greatest effects are felt.
2. At the medium scale, clusters of cause and effect were extracted from the full database to explore different topics.
3. Individual stories of change were examined and mapped against other stories.
4. Subsets of the whole database were viewed to show the stories relevant to specific Defra NEAPs4 and FSA issues.5
4 Defra Network Evidence Action Plan areas.
5 The combined list of NEAPS together with FSA issues is referred to in this report as NEAPS+
Horizon Scanning evidence and analysis report (1) – Issue 2 Prepared by SAMI Consulting 6
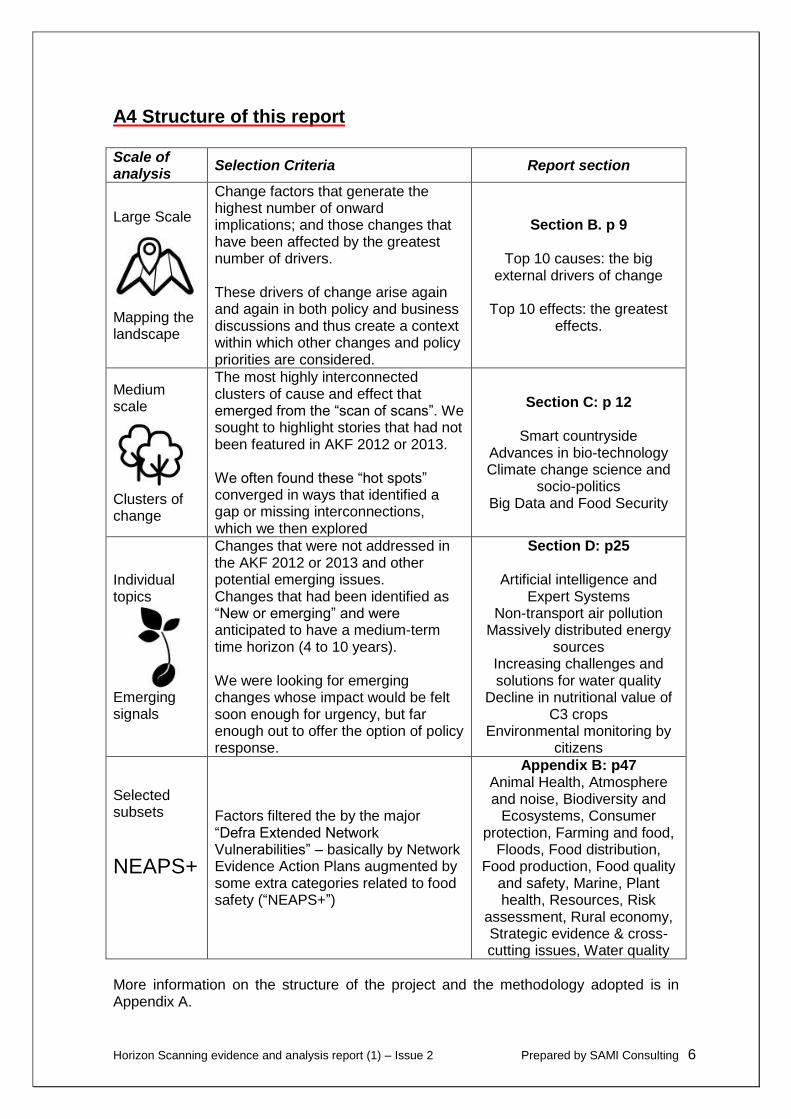
A4 Structure of this report
Scale of analysis
Selection Criteria Report section
Large Scale
Mapping the landscape
Change factors that generate the highest number of onward implications; and those changes that have been affected by the greatest number of drivers. These drivers of change arise again and again in both policy and business discussions and thus create a context within which other changes and policy priorities are considered.
Section B. p 9
Top 10 causes: the big external drivers of change
Top 10 effects: the greatest
effects.
Medium scale
Clusters of change
The most highly interconnected clusters of cause and effect that emerged from the “scan of scans”. We sought to highlight stories that had not been featured in AKF 2012 or 2013. We often found these “hot spots” converged in ways that identified a gap or missing interconnections, which we then explored
Section C: p 12
Smart countryside Advances in bio-technology Climate change science and
socio-politics Big Data and Food Security
Individual topics
Emerging signals
Changes that were not addressed in the AKF 2012 or 2013 and other potential emerging issues. Changes that had been identified as “New or emerging” and were anticipated to have a medium-term time horizon (4 to 10 years). We were looking for emerging changes whose impact would be felt soon enough for urgency, but far enough out to offer the option of policy response.
Section D: p25
Artificial intelligence and Expert Systems
Non-transport air pollution Massively distributed energy
sources Increasing challenges and solutions for water quality
Decline in nutritional value of C3 crops
Environmental monitoring by citizens
Selected subsets
NEAPS+
Factors filtered the by the major “Defra Extended Network Vulnerabilities” – basically by Network Evidence Action Plans augmented by some extra categories related to food safety (“NEAPS+”)
Appendix B: p47 Animal Health, Atmosphere and noise, Biodiversity and
Ecosystems, Consumer protection, Farming and food,
Floods, Food distribution, Food production, Food quality
and safety, Marine, Plant health, Resources, Risk
assessment, Rural economy, Strategic evidence & cross-cutting issues, Water quality
More information on the structure of the project and the methodology adopted is in Appendix A.
Horizon Scanning evidence and analysis report (1) – Issue 2 Prepared by SAMI Consulting 7
A5 How to read a Futurescaper influence map Terminology The Futurescaper tool imposes a defined structure on to the scanning which allows us to filter and search the data in a variety of ways. It has its own specific terminology. The key terms used in the report are:
A “story” is an item of interest found by the scanners and stored in the database.
Stories are structured into “causes” (the drivers of change), and implications (effects of the change); each of these elements is called a “factor”.
Stories are that share the same factors are interlinked. This allows us to produce “influence maps” showing the causal relationships between factors.
In the influence maps, the “nodes” correspond to factors and the “links” show the cause-effect relationship between them.
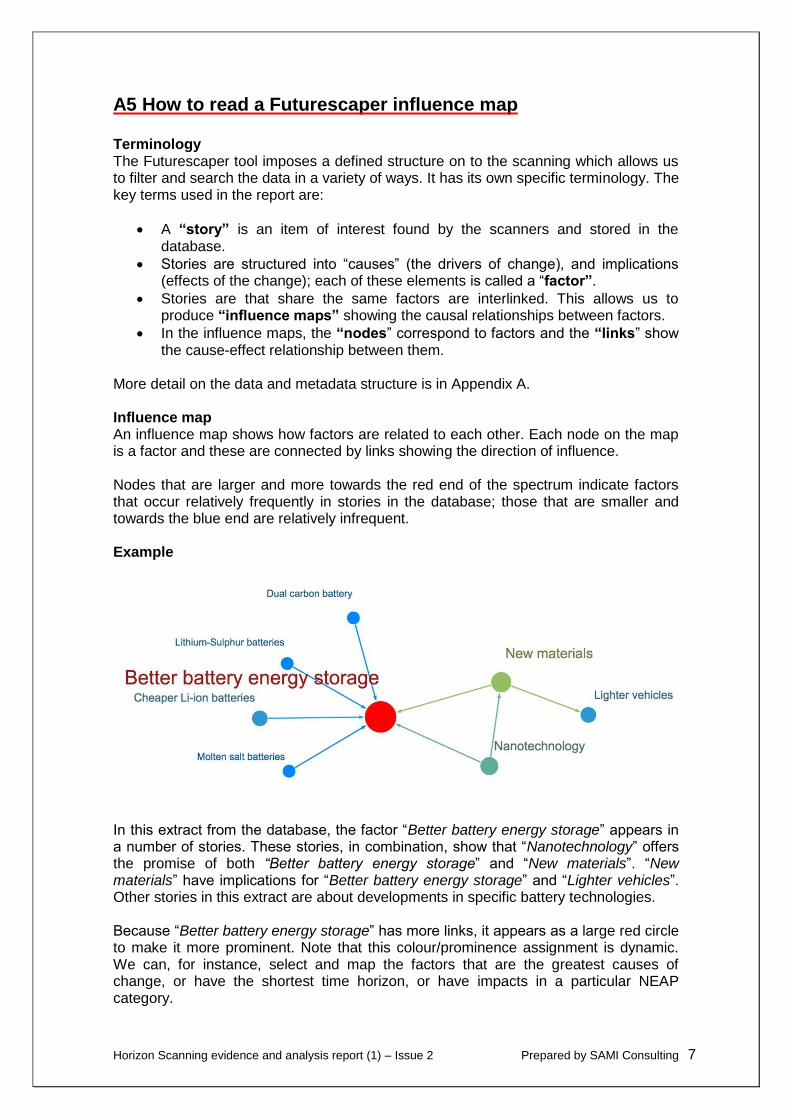
More detail on the data and metadata structure is in Appendix A. Influence map An influence map shows how factors are related to each other. Each node on the map is a factor and these are connected by links showing the direction of influence. Nodes that are larger and more towards the red end of the spectrum indicate factors that occur relatively frequently in stories in the database; those that are smaller and towards the blue end are relatively infrequent. Example
In this extract from the database, the factor “Better battery energy storage” appears in a number of stories. These stories, in combination, show that “Nanotechnology” offers the promise of both “Better battery energy storage” and “New materials”. “New materials” have implications for “Better battery energy storage” and “Lighter vehicles”. Other stories in this extract are about developments in specific battery technologies. Because “Better battery energy storage” has more links, it appears as a large red circle to make it more prominent. Note that this colour/prominence assignment is dynamic. We can, for instance, select and map the factors that are the greatest causes of change, or have the shortest time horizon, or have impacts in a particular NEAP category.
Horizon Scanning evidence and analysis report (1) – Issue 2 Prepared by SAMI Consulting 8
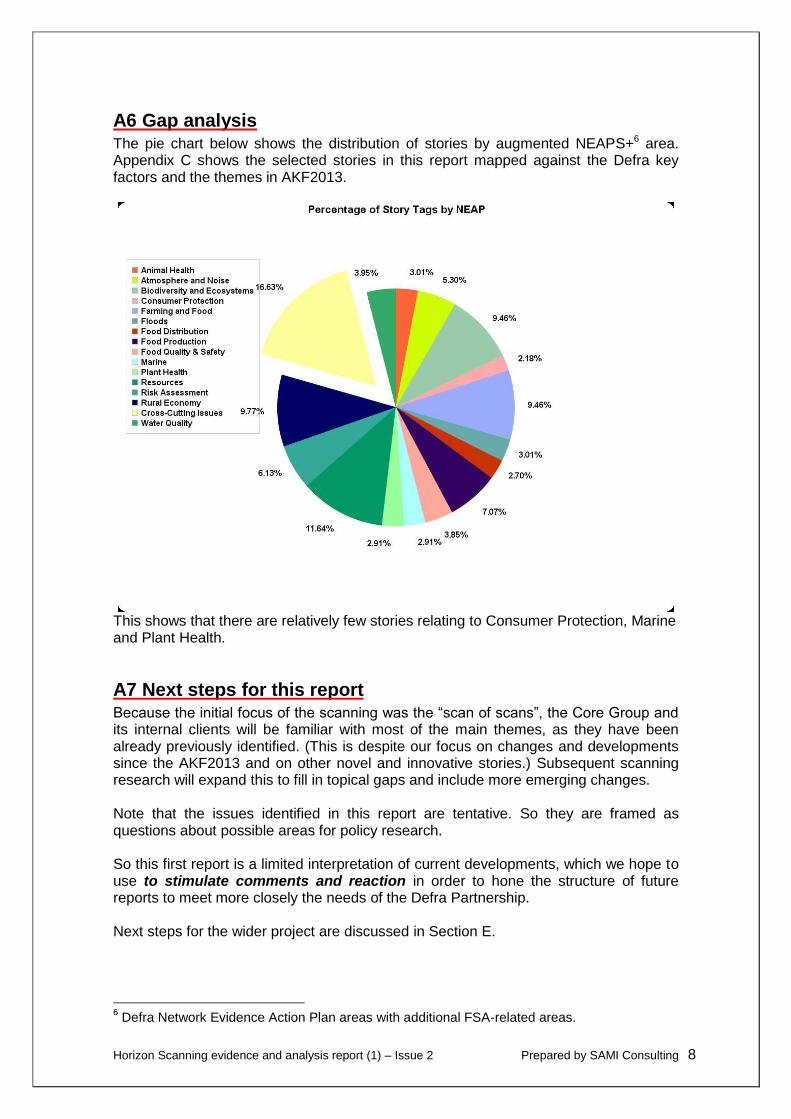
A6 Gap analysis The pie chart below shows the distribution of stories by augmented NEAPS+6 area. Appendix C shows the selected stories in this report mapped against the Defra key factors and the themes in AKF2013.
This shows that there are relatively few stories relating to Consumer Protection, Marine and Plant Health.
A7 Next steps for this report Because the initial focus of the scanning was the “scan of scans”, the Core Group and its internal clients will be familiar with most of the main themes, as they have been already previously identified. (This is despite our focus on changes and developments since the AKF2013 and on other novel and innovative stories.) Subsequent scanning research will expand this to fill in topical gaps and include more emerging changes. Note that the issues identified in this report are tentative. So they are framed as questions about possible areas for policy research. So this first report is a limited interpretation of current developments, which we hope to use to stimulate comments and reaction in order to hone the structure of future reports to meet more closely the needs of the Defra Partnership. Next steps for the wider project are discussed in Section E.
6 Defra Network Evidence Action Plan areas with additional FSA-related areas.
Section B- Mapping the landscape
Horizon Scanning evidence and analysis report (1) – Issue 2 Prepared by SAMI Consulting 9
SECTION B – Mapping the landscape - big external drivers and effects of change
To generate an overview of the data, we first identified the “top causes” and “top effects” within the database: the factors that generate the highest number of onward implications; and those changes that have been affected by the greatest number of drivers. These factors should show the biggest external drivers of change, and the where the greatest impacts will be felt. These drivers of change arise again and again in both policy and business discussions and thus create a context within which other changes and policy priorities are considered. The influence maps provide a visualisation of the resulting issue landscape, with the visual “hot spots” identifying those items with the largest number of interconnections. It provides a starting point for the project and in future reports we will augment this visual influence mapping with a range of additional analytical techniques.
Section B- Mapping the landscape
Horizon Scanning evidence and analysis report (1) – Issue 2 Prepared by SAMI Consulting 10
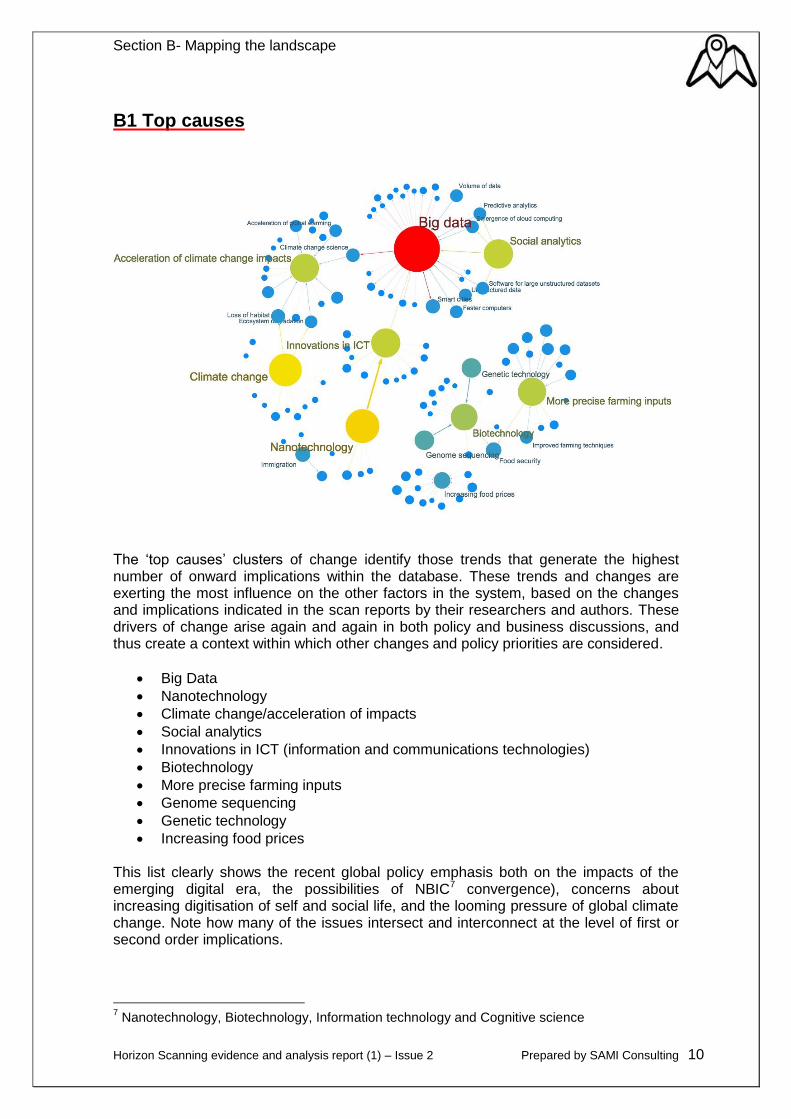
B1 Top causes
The ‘top causes’ clusters of change identify those trends that generate the highest number of onward implications within the database. These trends and changes are exerting the most influence on the other factors in the system, based on the changes and implications indicated in the scan reports by their researchers and authors. These drivers of change arise again and again in both policy and business discussions, and thus create a context within which other changes and policy priorities are considered.
Big Data
Nanotechnology
Climate change/acceleration of impacts
Social analytics
Innovations in ICT (information and communications technologies)
Biotechnology
More precise farming inputs
Genome sequencing
Genetic technology
Increasing food prices This list clearly shows the recent global policy emphasis both on the impacts of the emerging digital era, the possibilities of NBIC7 convergence), concerns about increasing digitisation of self and social life, and the looming pressure of global climate change. Note how many of the issues intersect and interconnect at the level of first or second order implications.
7 Nanotechnology, Biotechnology, Information technology and Cognitive science
Section B- Mapping the landscape
Horizon Scanning evidence and analysis report (1) – Issue 2 Prepared by SAMI Consulting 11
B2 Top effects
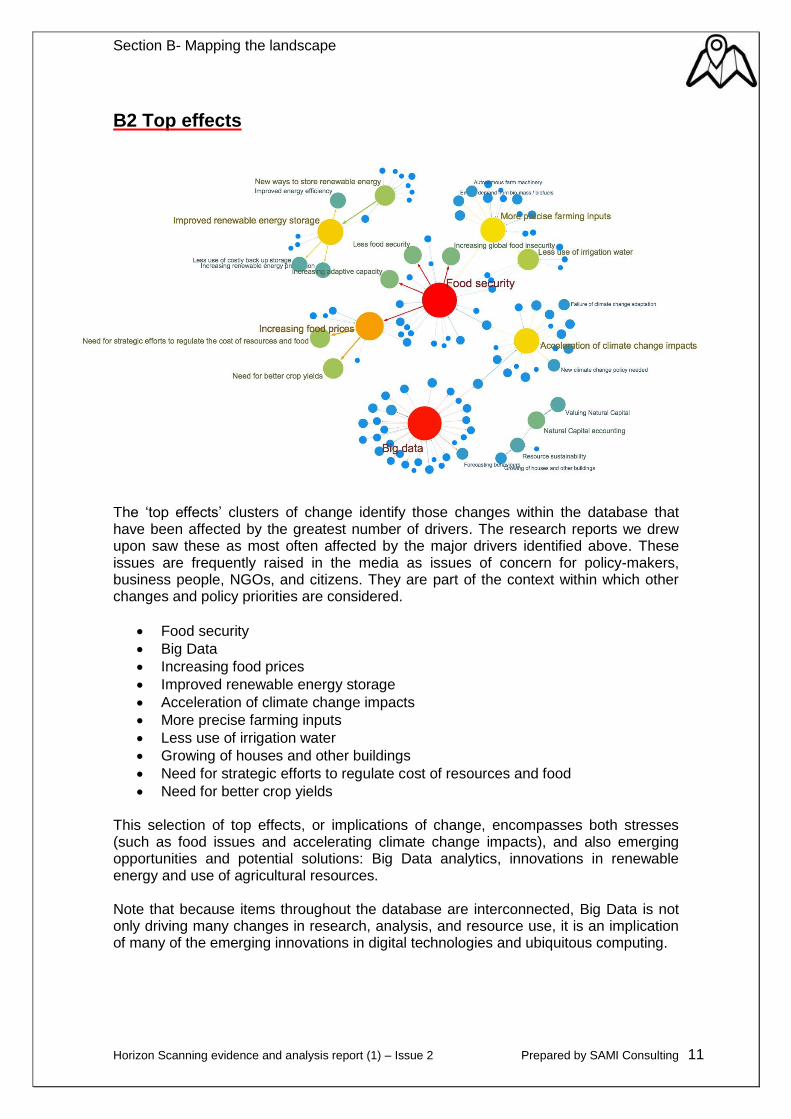
The ‘top effects’ clusters of change identify those changes within the database that have been affected by the greatest number of drivers. The research reports we drew upon saw these as most often affected by the major drivers identified above. These issues are frequently raised in the media as issues of concern for policy-makers, business people, NGOs, and citizens. They are part of the context within which other changes and policy priorities are considered.
Food security
Big Data
Increasing food prices
Improved renewable energy storage
Acceleration of climate change impacts
More precise farming inputs
Less use of irrigation water
Growing of houses and other buildings
Need for strategic efforts to regulate cost of resources and food
Need for better crop yields This selection of top effects, or implications of change, encompasses both stresses (such as food issues and accelerating climate change impacts), and also emerging opportunities and potential solutions: Big Data analytics, innovations in renewable energy and use of agricultural resources. Note that because items throughout the database are interconnected, Big Data is not only driving many changes in research, analysis, and resource use, it is an implication of many of the emerging innovations in digital technologies and ubiquitous computing.
Section C- Clusters of change
Horizon Scanning evidence and analysis report (1) – Issue 2 Prepared by SAMI Consulting 12
SECTION C - Clusters of changes emerging from the scanning
This section describes four of the most highly interconnected clusters of cause and effect that emerged from the “scan of scans”. We sought to highlight stories that had not been featured in AKF2012 or 2013. We often found these “hot spots” converged in ways that identified a gap or missing interconnections, which we then explored.
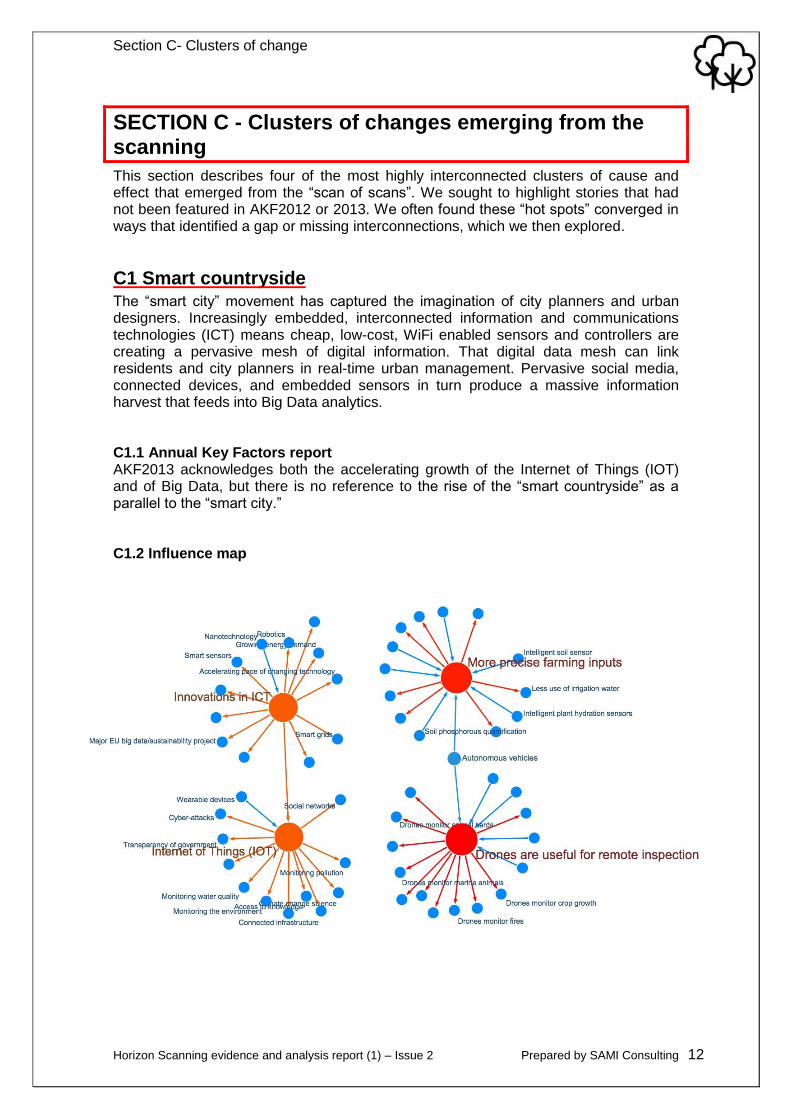
C1 Smart countryside The “smart city” movement has captured the imagination of city planners and urban designers. Increasingly embedded, interconnected information and communications technologies (ICT) means cheap, low-cost, WiFi enabled sensors and controllers are creating a pervasive mesh of digital information. That digital data mesh can link residents and city planners in real-time urban management. Pervasive social media, connected devices, and embedded sensors in turn produce a massive information harvest that feeds into Big Data analytics. C1.1 Annual Key Factors report AKF2013 acknowledges both the accelerating growth of the Internet of Things (IOT) and of Big Data, but there is no reference to the rise of the “smart countryside” as a parallel to the “smart city.” C1.2 Influence map
Section C- Clusters of change
Horizon Scanning evidence and analysis report (1) – Issue 2 Prepared by SAMI Consulting 13
C1.3 Our scanning Our scan of scans maps a space where innovations in ICT and the expanse of the Internet of Things are enabling the digitisation of environmental management generally (See stories 1,2,3,4)8, and more precise farming inputs specifically (5): the emergence of the UK’s “smart countryside.” Increasing use of automated or smart technologies such as Unmanned Aerial Vehicles (UAVs) to monitor environmental conditions and movements of both wildlife and domestic livestock will accelerate this (6,7). Implications suggested by the scan of scans for increasing innovations in ICT and the rise of the Internet of Things include:
Smart grids – more efficiently managed energy use, alongside the potential for increased energy demand
A widely deployed environmental sensor net continuously collecting, eg, o climate change data o real-time pollution data o water quality data o invasive species data
Connected infrastructure o from ‘smart buildings’ to ‘smart cities’ to ‘smart regions’ and ‘smart
sectors’ – infrastructure stays in touch with ambient conditions (eg, rail tracks that upload current conditions pinpointed via GPS, or canal lock sensors that stream water level and water quality data in real time), energy flows, water flows, other infrastructure, goods in transit and in situ
o even connects to people via their wearable computing devices, becoming part of the social media landscape
o potentially connects to livestock – for example, fitting sheep with digital collars (8) to track their movements and monitor their health and external conditions
Potential implications for the natural environment and food systems include more detailed real-time data for local conditions, crops, and livestock. For businesses and consumers implications might include innovative business models, increased access to knowledge and data, enhanced government transparency, and expanded social networks. The Internet of Things enables what we can automate, including automated vehicles. Solar-powered UAVs could be airborne stewards, used to:
Track patterns of crop growth and herd movements
Monitor crops for insect infestation
Track wildlife, both land and marine
Monitor for natural hazards, eg flooding and wildfire conditions, both before, during, and after emergencies
Questions regarding privacy may arise, but in the rural environment issues of noise, odour, and the impact on animal habitats and animal behaviour would also be critical. Intelligent soil and water sensors, and the potential to track and monitor the health of domestic animals, would combine to create much more precise farming. Increasingly autonomous farm machinery would mean increasingly automated farming. Implications include:
Improved water use efficiency
Improved food security – increased food production and reduced food waste
8 The numbers in parenthesis refer to sources listed in section C1.5. The same approach is
taken in subsequent sections.
Section C- Clusters of change
Horizon Scanning evidence and analysis report (1) – Issue 2 Prepared by SAMI Consulting 14
Improved animal health and safety
A core question might be whether the improved efficiencies and animal and plant health pay for the potentially high cost of this ‘smart countryside’ infrastructure. It could potentially be the foundation block of the emerging digital food chain: a chain of linked sensors from soil or water environments to individual crops or livestock, to storage facility conditions, GPS tracking of raw materials, processing plant conditions, and cheap smart sensors to monitor food freshness and purity embedded in packaging – and readable by customers’ smartphone health apps.
These clusters create an opportunity space for the smart countryside, and some initial seeds for its creation. But it was not specifically identified in any of the scans reviewed, and certainly is not yet as pervasive a conceptual model as ‘smart cities’. The UK’s Strategy for Agricultural Technologies refers to precision farming, remote sensing, web-based crop management tools, and citizen-based data collection (9), without linking the emerging sensing, data, and autonomous technologies into an integrated digital ecology of countryside management. An integrated digital ecology for the smart countryside could connect a widespread sensor net for environmental monitoring with smart infrastructure for farming that also connects to a digital food chain and a smart health network – linking as well with UK’s emerging smart cities. Previous government foresight scenarios (10) have suggested the potential for a future smart countryside, for which this emerging cluster may thus be a leading indicator.
C1.4 Questions to consider The questions that might flow from this include:
What would a cross-government policy to support the emergence of the ‘smart countryside’ look like? What would be the advantages? Costs?
How might the smart countryside support the digitisation of the food chain in a way that enhances food security, reduces food waste, and supports economic growth and competitiveness of the UK agricultural sector?
What privacy issues might arise with the emergence of the smart countryside? Where might citizen pushback or backlash erupt?
What scientific and data-related challenges would this create? For example, issues of storage, curation, safeguarding, analysis, sense-making, skills and capabilities, value-generation, etc; creating value-added markets; etc.
What environmental impact assessments would be needed to implement the emerging innovations with applications in environmental sensing, monitoring, and management, such as UAVs?
Recognising this as a potential opportunity and a leading indicator, scanning in the next period will seek to monitor developments in this area contributing to the emergence of the smart countryside – and its potential implications. C1.5 Selected stories from the Futurescaper database (1) The ICT revolution continues
Nanotechnology drives, if not amplifies, innovations in ICT, fuelling continued growth in the Internet of Things, Big Data, 3D printing, robotics, autonomous cars, smart grids, smart sensors – and growing energy demand. “Global Megatrend 4: Accelerating technological change,” EEA Global Megatrends, European Environmental Agency. 2/3/2015. http://www.eea.europa.eu/publications/global-megatrends-update-4-accelerating
Section C- Clusters of change
Horizon Scanning evidence and analysis report (1) – Issue 2 Prepared by SAMI Consulting 15
(2) The acceleration of technology is itself accelerating
Even the most optimistic of technology pundits are now being routinely overtaken by events as the pace of technology advances continues to accelerate. “The acceleration of acceleration: how the future is arriving far faster than expected,” Steven Kotler, Forbes via Shaping Tomorrow. 6/2/2015. forbes.com/sites/stevenkotler/2015/02/06/the-acceleration-of-acceleration-how-the-future-is-arriving-far-faster-than-expected/4 (3) Ever increasing information
In 2000, processors had the computational power of a spider; by 2014, that of a mouse. By 2023 some computers could have the processing power of the human brain. Tools to analyse Big Data are allowing us to predict behaviours more accurately. The internet of things and ubiquitous sensors will monitor the environment. Global Strategic Trends – Out to 2045, UK Ministry of Defence. 16/6/2014. gov.uk/government/uploads/system/uploads/attachment_data/file/348164/20140821_DCDC_GST_5_Web_Secured.pdf (4) Hyperconnectivity
Billions of people are now networked together. “Hyperconnectivity,” Futures Centre, Forum for the Future. thefuturescentre.org/trend-cards/159/hyperconnectivity (5) Precision agriculture
Precision agriculture promises to increase yields whilst reducing inputs of water, fertiliser, seed etc. and reducing environmental harm. Automated tractors and other machinery is likely, and the scale at which they can be economically applied will get smaller. Global Trends 2030 – Alternative Worlds. US National Intelligence Council. 10/12/2012 dni.gov/index.php/about/organization/global-trends-2030 dni.gov/files/documents/GlobalTrends_2030.pdf (6) Variety of uses for drone aircraft
Uses for drones reported by New Scientist magazine includes monitoring wildfires in Alaska; tracking patterns of crop growth and animal herds for farmers; monitoring crops for insect infestation; surveillance by Police SWAT teams; tracking whale populations to keep shipping away. Amazon has stated that 87% of the items it sells could be transported by drone, and predicts that packages could be delivered within 30 minutes of ordering. “The use of drone aircraft is likely to grow explosively, when the FAA issue sweeping rule changes in the USA by September 2015.” European countries will inevitably be under pressure to follow suit. “US opens drone zones for a year of pioneer testing,” New Scientist. 20/9/2014. newscientist.com/article/mg22329874.100-us-opens-drone-zones-for-a-year-of-pioneer-testing.html (7) Drones for environmental monitoring “Scientists monitor environmental trends with eco-drones,” Arbitrage Magazine. 18/2/2014. arbitragemagazine.com/general/scientists-monitor-environmental-trends-with-eco-drones-473
C1.6 Other references Connected infrastructure
(8) “Conwy study: Could sheep lead smart countryside?” BBC News. 24/12/2014. http://www.bbc.co.uk/news/uk-wales-north-west-wales-30591129 (9) UK Strategy for Agricultural Technologies, July 2013. https://www.gov.uk/government/uploads/system/uploads/attachment_data/file/227259/9643-BIS-UK_Agri_Tech_Strategy_Accessible.pdf Previous government foresight scenarios (10) See for example, England’s Natural Environment in 2060, Natural England, 2009, http://publications.naturalengland.org.uk/publication/31030; UK National Ecosystems Assessment (NEA), 2011, http://uknea.unep-wcmc.org/; NEA Follow-on, 2014, http://uknea.unep-wcmc.org/NEWFollowonPhase/tabid/123/Default.aspx.
Section C- Clusters of change
Horizon Scanning evidence and analysis report (1) – Issue 2 Prepared by SAMI Consulting 16
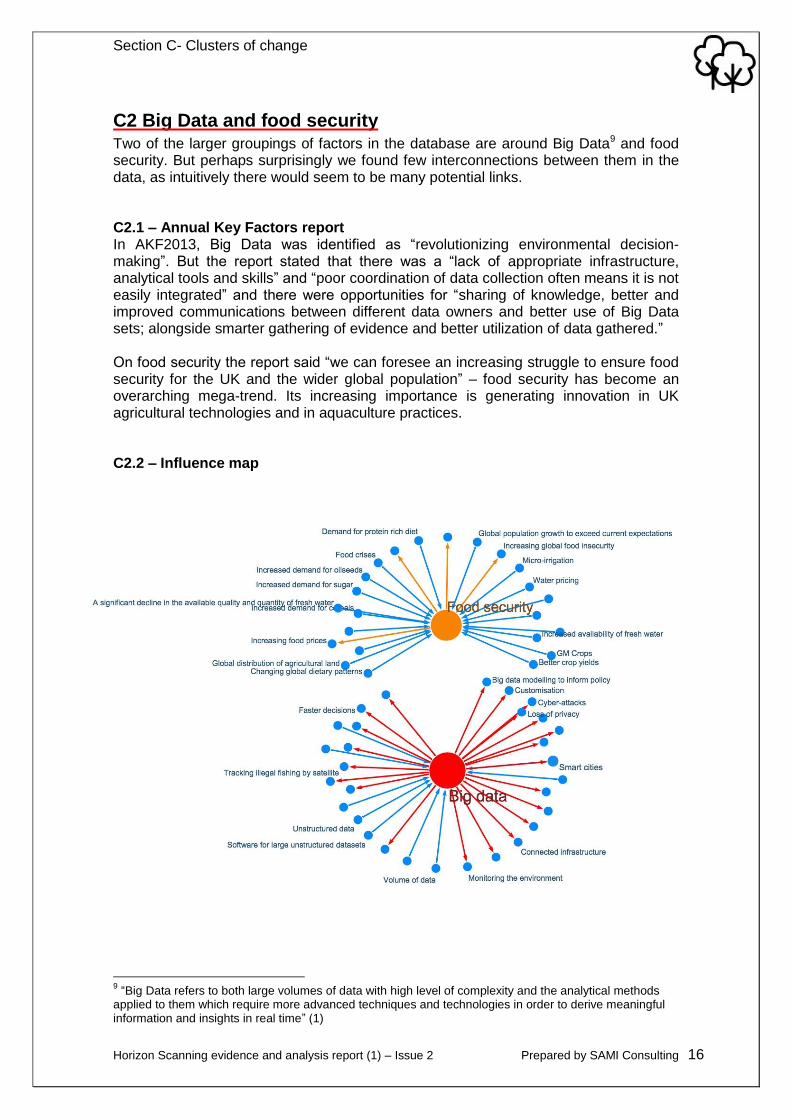
C2 Big Data and food security Two of the larger groupings of factors in the database are around Big Data9 and food security. But perhaps surprisingly we found few interconnections between them in the data, as intuitively there would seem to be many potential links. C2.1 – Annual Key Factors report In AKF2013, Big Data was identified as “revolutionizing environmental decision-making”. But the report stated that there was a “lack of appropriate infrastructure, analytical tools and skills” and “poor coordination of data collection often means it is not easily integrated” and there were opportunities for “sharing of knowledge, better and improved communications between different data owners and better use of Big Data sets; alongside smarter gathering of evidence and better utilization of data gathered.” On food security the report said “we can foresee an increasing struggle to ensure food security for the UK and the wider global population” – food security has become an overarching mega-trend. Its increasing importance is generating innovation in UK agricultural technologies and in aquaculture practices. C2.2 – Influence map
9 “Big Data refers to both large volumes of data with high level of complexity and the analytical methods
applied to them which require more advanced techniques and technologies in order to derive meaningful information and insights in real time” (1)
Section C- Clusters of change
Horizon Scanning evidence and analysis report (1) – Issue 2 Prepared by SAMI Consulting 17
C2.3 Our scanning In our scan of scans, Big Data features as one of the most influential factors in the overview of the landscape influence maps (in B1), with many drivers and implications:
the emergence of cloud computing (See section reference 1)
improved software for managing large amounts of unstructured data and better predictive analysis (1)
underpinned by faster computers. leading to:
improved forecasting of behaviours (1)
better monitoring of the environment (eg of water quality and pollution) and better weather forecasting and flood forecasting
more sophisticated customer segmentation and customisation (1)
algorithmic decision-making (1)
new business models (1).
Set against these benefits are concerns about:
loss of privacy (2)
surveillance by the state (2); and
threats of cyber-attacks (2). Food security also features strongly on the overview influence map with a major effect on food prices and food crises. The factors affecting food security can be described as falling into three groups:
Demographic change – generally threats o global population growth (4); o increasing demand for water (5); o changing global dietary patterns: demand for protein rich diet, increasing
demand for cereals, sugars and meat (with some beginnings of countervailing trends towards veganism) (6).
Generic climate change factors – also threats o a significant decline in available quality and quantity of water (7).
Technological innovation - opportunities o biotechnology o better crop yields o micro-irrigation o more precise farming inputs o GM crops (however controversial) o reducing food waste.
The lack of connection between these two major issues in our data could simply be due to the early stage of scanning in the project as indicated in section A2.4. However, it could also suggest an opportunity to explore the ways in which Big Data could enhance food security. Improved forecasting capabilities should enable Defra and the FSA to see more clearly the likely scale of impact of the threats from demographic and climate change. The Horizon Scanning Big Data community of interest (1) identified five different types of opportunities arising from the use of Big Data applications - if applied in this area they could potentially lead to technological innovation to mitigate climate change impacts.
Section C- Clusters of change
Horizon Scanning evidence and analysis report (1) – Issue 2 Prepared by SAMI Consulting 18
C2.4 Questions to consider The questions that this discussion raises include:
Are Defra and its partners doing enough to utilise Big Data to explore impacts on food security? Are there further opportunities to exploit advances in Big Data techniques to gauge the risk to the UK food supply?
Would it be beneficial to encourage the use of advanced Big Data techniques by commercial organisations with interests in food security that might mitigate the threats?
How might research and innovation organisations (e.g. BBSRC, NERC, Innovate UK, Nesta) combine forces to realise opportunities in this area. Are there links with the AgriTech Strategy?
Scanning in the next period will seek to establish whether the apparent gap in connection between the topics is simply an effect of the scanning to date, or whether it exposes a lack of development of potential opportunities. C2.5 Section references Big Data
(1) Five categories of opportunity for applying Big Data in Government: 1 Creating transparency 2 Enabling experimentation to discover needs, expose variability, and improve performance 3 Segmenting populations to customise actions. Plus creation of Smart Cities. 4 Replacing/supporting human decision making with automated algorithms 5 Innovating new business models, products and services with Big Data HM GOVT HORIZON SCANNING PROGRAMME EMERGING TECHNOLOGIES: BIG DATA gov.uk/government/publications/emerging-technologies-big-data
(2) The greatest areas of uncertainty are the speed with which big data can be usefully and securely utilized by organizations. US NIC: Global Trends 2030 – Alternative Worlds dni.gov/index.php/about/organization/global-trends-2030 dni.gov/files/documents/GlobalTrends_2030.pdf (3) Assessment of global megatrends — an update. Global megatrend 4: Accelerating technological change. European Environment Agency eea.europa.eu/themes/scenarios/global-megatends/global-megatends
Food Security
(4) A new study has determined that global populations are unlikely to plateau at 9bn people by 2050 as previously thought, rather increase to 11bn in 2100. http://www.theguardian.com/environment/2014/sep/18/world-population-new-study-11bn-2100 (5) By 2045, global agricultural water consumption could increase by 19%, with global fresh water demands likely to grow by 55% in the same period, UK Ministry of Defence: Global Strategic Trends – Out to 2045 https://www.gov.uk/government/uploads/system/uploads/attachment_data/file/348164/20140821_DCDC_GST_5_Web_Secured.pdf (6) Growing affluence in the developing world is likely to lead to increased demand for protein-rich diets. China, for example, has seen meat consumption increase by 63% between 1985 and 2009, and the trend seems likely to continue. UN FAO (2009), ‘How to Feed the World in 2050’, http://www.fao.org/fileadmin/templates/wsfs/docs/expert_paper/How_to_Feed_the_World_in_2050.pdf (7) Climate change is expected to reduce the amount of freshwater supply due to increased water temperatures and reduced levels of water flow in rivers. http://www.eea.europa.eu/soer-2015/global/action-download-pdf
Section C- Clusters of change
Horizon Scanning evidence and analysis report (1) – Issue 2 Prepared by SAMI Consulting 19
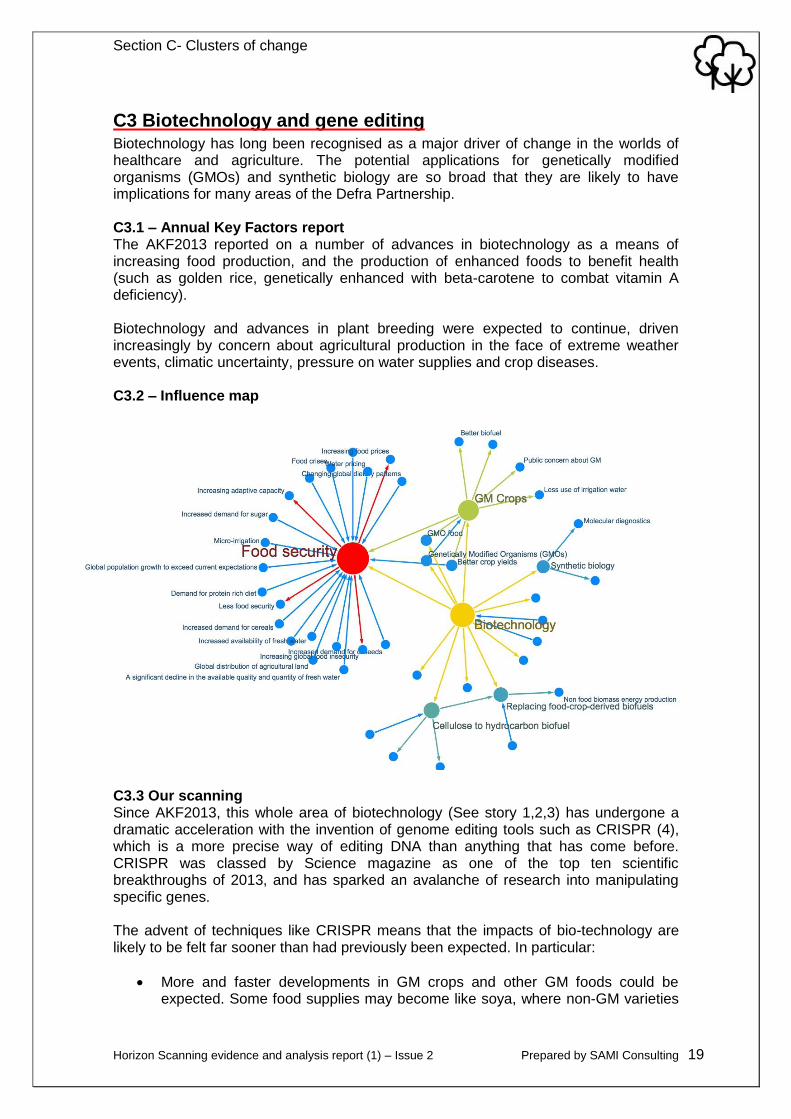
C3 Biotechnology and gene editing Biotechnology has long been recognised as a major driver of change in the worlds of healthcare and agriculture. The potential applications for genetically modified organisms (GMOs) and synthetic biology are so broad that they are likely to have implications for many areas of the Defra Partnership. C3.1 – Annual Key Factors report The AKF2013 reported on a number of advances in biotechnology as a means of increasing food production, and the production of enhanced foods to benefit health (such as golden rice, genetically enhanced with beta-carotene to combat vitamin A deficiency). Biotechnology and advances in plant breeding were expected to continue, driven increasingly by concern about agricultural production in the face of extreme weather events, climatic uncertainty, pressure on water supplies and crop diseases. C3.2 – Influence map
C3.3 Our scanning Since AKF2013, this whole area of biotechnology (See story 1,2,3) has undergone a dramatic acceleration with the invention of genome editing tools such as CRISPR (4), which is a more precise way of editing DNA than anything that has come before. CRISPR was classed by Science magazine as one of the top ten scientific breakthroughs of 2013, and has sparked an avalanche of research into manipulating specific genes. The advent of techniques like CRISPR means that the impacts of bio-technology are likely to be felt far sooner than had previously been expected. In particular:
More and faster developments in GM crops and other GM foods could be expected. Some food supplies may become like soya, where non-GM varieties
Section C- Clusters of change
Horizon Scanning evidence and analysis report (1) – Issue 2 Prepared by SAMI Consulting 20
are becoming difficult and more expensive to source. This could increase the economic incentive to introduce GM varieties into Europe.
Biotechnology is increasingly used to produce pharmaceuticals: we already have yeasts that have been modified to produce morphine (5). It is possible that criminals will in future use GM techniques to transfer the genes for illegal drugs into common food plants where they can be more easily disguised.
All the other potential advantages of biotechnology, such as salt-tolerant food crops, renewable energy sources like algal biofuels, bioremediation, and climate change mitigation might happen faster than previously envisaged.
C3.4 Questions to consider The questions raised here may not be not new, but responses could be needed in shorter timescales than previously expected:
How will GM policy in Europe be affected by increasing economic pressure for GM crops (and other GMOs) for biofuel, pharma, animal feed, and human consumption?
If food crops are ever detected that have been genetically enhanced to produce illegal drugs, what food safety action would be needed to keep them out of the food chain? What legal changes might be needed?
What are the implications of accelerating biotechnology for UK farming and land use?
Also, CRISPR technology makes it possible to introduce genome modifications which are virtually identical to those introduced by conventional breeding. Consequently some may argue that crops varieties using this technology may be classified as non-GM. What policy response would be appropriate to this?
Scanning in the next period will seek to explore current developments in biotechnology in more detail, including especially the topics of eDNA and metagenomics. C3.5 Selected stories from the Futurescaper database (1) Biotech Frontiers
Biotechnology has uses in pharmaceuticals, aquaculture, agriculture, and industrial biotechnology. This brings varying risks and benefits. Futures Centres, Forum for the Future. http://www.thefuturescentre.org/trend-cards/127/biotech-frontiers (2) Biotechnology
Assessment of global megatrends - an update: Global megatrend 4: Accelerating technological change. European Environment Agency "Biotechnology has contributed to a broad range of existing applications, including: the development of new medicines, health diagnostics and treatments for treatments such as dementia; testing methods for animal disease and food safety more generally; enzymes for chemical production, pulp and paper manufacturing, textile production and other industrial applications; (and also enzymes in consumer products, such as detergents); and microbes for the bioremediation of contaminated sites" http://www.eea.europa.eu/themes/scenarios/global-megatends/global-megatends (3) Genetically modified (GM) crops
Advances in molecular biology and transgenic technology have enabled the creation of GM crops with better yields for both food and fuel. This science has the intense regulatory and public pressure. US National Intelligence Council: Global Trends 2030 – Alternative Worlds http://www.dni.gov/index.php/about/organization/global-trends-2030 http://www.dni.gov/files/documents/GlobalTrends_2030.pdf for the pdf
Section C- Clusters of change
Horizon Scanning evidence and analysis report (1) – Issue 2 Prepared by SAMI Consulting 21
(4) The CRISPR Revolution
CRISPR was classed by Science magazine as one of the top ten scientific breakthroughs of 2013: “A year-old gene-editing technique called CRISPR touched off an explosion of research in 2013. It’s short for “clustered regularly interspaced short palindromic repeats”: repetitive stretches of DNA that bacteria have evolved to combat predatory viruses by slicing up the viral genomes. The “knife” is a protein called Cas9; in 2012, researchers showed they could use it as a scalpel to perform microsurgery on genes. This year, the new technology became red hot, as more than a dozen teams wielded it to manipulate specific genes in mice, rats, bacteria, yeast, zebrafish, nematodes, fruit flies, plants, and human cells, paving the way for understanding how these genes function and possibly harnessing them to improve health.” Science Magazine. Special Collection - The CRISPR Revolution http://www.sciencemag.org/site/extra/crispr/ (5) GM yeasts modified to produce morphine
Biotechnology is increasingly used to produce pharmaceuticals: we already have yeasts that have been modified to produce morphine Journal Reference: Kate Thodey, Stephanie Galanie & Christina D Smolke. A microbial biomanufacturing platform for natural and semisynthetic opioids. Nature Chemical Biology 10, 837–844 (2014) doi:10.1038/nchembio.1613
Section C- Clusters of change
Horizon Scanning evidence and analysis report (1) – Issue 2 Prepared by SAMI Consulting 22
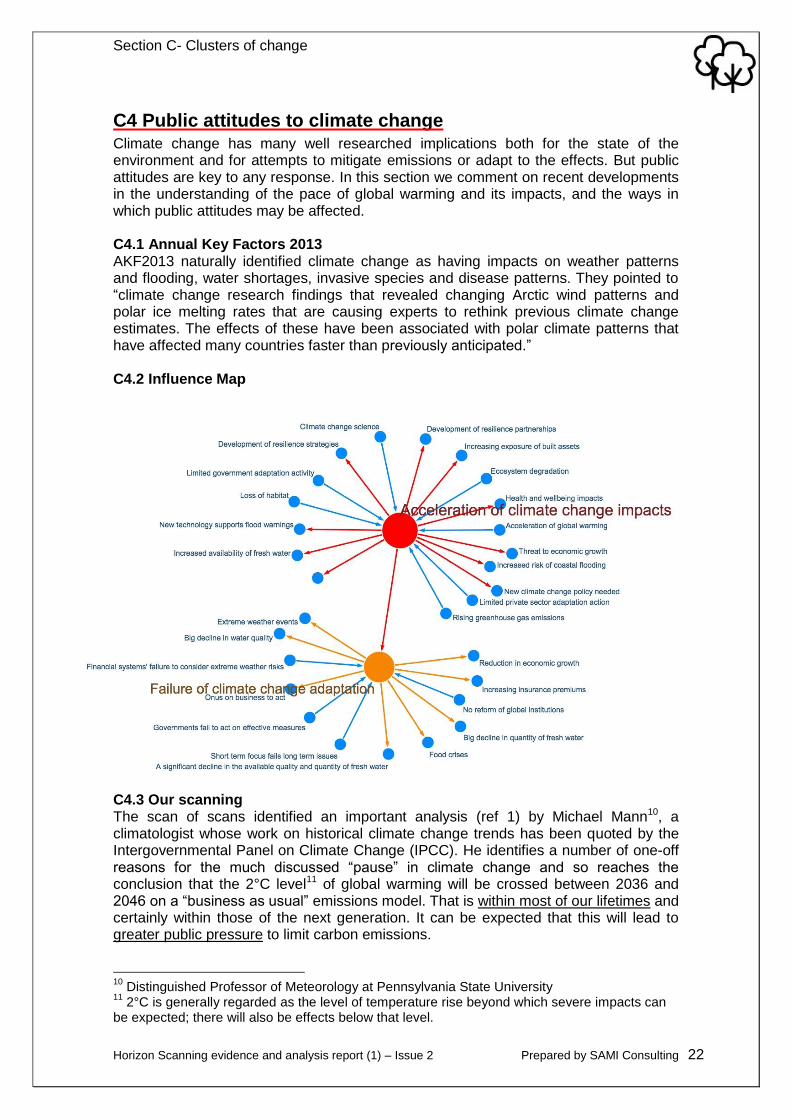
C4 Public attitudes to climate change Climate change has many well researched implications both for the state of the environment and for attempts to mitigate emissions or adapt to the effects. But public attitudes are key to any response. In this section we comment on recent developments in the understanding of the pace of global warming and its impacts, and the ways in which public attitudes may be affected. C4.1 Annual Key Factors 2013 AKF2013 naturally identified climate change as having impacts on weather patterns and flooding, water shortages, invasive species and disease patterns. They pointed to “climate change research findings that revealed changing Arctic wind patterns and polar ice melting rates that are causing experts to rethink previous climate change estimates. The effects of these have been associated with polar climate patterns that have affected many countries faster than previously anticipated.” C4.2 Influence Map
C4.3 Our scanning The scan of scans identified an important analysis (ref 1) by Michael Mann10, a climatologist whose work on historical climate change trends has been quoted by the Intergovernmental Panel on Climate Change (IPCC). He identifies a number of one-off reasons for the much discussed “pause” in climate change and so reaches the conclusion that the 2°C level11 of global warming will be crossed between 2036 and 2046 on a “business as usual” emissions model. That is within most of our lifetimes and certainly within those of the next generation. It can be expected that this will lead to greater public pressure to limit carbon emissions.
10
Distinguished Professor of Meteorology at Pennsylvania State University 11
2°C is generally regarded as the level of temperature rise beyond which severe impacts can be expected; there will also be effects below that level.
Section C- Clusters of change
Horizon Scanning evidence and analysis report (1) – Issue 2 Prepared by SAMI Consulting 23
With the next UN Climate Change Conference taking place in November/December this year, the political intensity surrounding the issue is increasing. Other research by UCL (2) identified how much, and indeed which, fossil fuels need to be left in the ground to reduce emissions by enough to stay within 2°C – a campaign now taken up by The Guardian (3). Although there is substantial political consensus (4) to commit to the 2°C target, other high profile authors question whether the capitalist system itself precludes such action (5).
The recent report from the European Environment Agency (6) says the EU remains heavily dependent on fossil fuels. It suggests that projected reductions of EU greenhouse gas emissions that will result from the implementation of existing policies are currently insufficient to put the EU on a pathway towards its 2050 decarbonisation target. It suggests policies favouring renewables. Data from the International Energy Agency (IEA) (7) indicate that global emissions of carbon dioxide from the energy sector stalled in 2014, marking the first time in 40 years in which there was a halt or reduction in emissions of the greenhouse gas that was not solely tied to an economic downturn. Global energy-related emissions of carbon dioxide stood at 32.3 billion tonnes in 2014, unchanged from the preceding year. China burnt less coal than expected (8) as the projected rise in its energy demand faltered along with the rise in its economic growth, and as the expansion of its renewable energy generation continued. This data highlights the close relationship between carbon dioxide emissions and economic growth, and provides a first positive sign concerning the challenging task of decoupling growth and emissions
The World Economic Forum's Global Risk Report 2015 (9) identifies the failure of climate change adaptation as a particular cause for concern, highlighting that little tangible action has been taken to address the risk. This is placed as the highest environmental risk in terms of likelihood and impact. It highlights the perception that, to date, there has been limited action on climate change adaptation by both governments and private sector. This comes at a time where the frequency and intensity of extreme events is increasing, with scientists beginning to connect these events to global climate change processes. In the project interviews, a number of comments were made about the impact on public attitudes of increasing number and severity of extreme weather events. Two years on from Hurricane Sandy, the US Federal Emergency Management Agency (FEMA) is still running adaptation programs (10) to reduce the risk of loss of life and property from future disasters. FEMA is investing $84.7 million in projects across the state, including repairs and upgrades to bridges and community planning initiatives focused on improving sustainability and increasing resilience. Whether increasingly severe or common extreme weather events will bring increased lobbying for climate change mitigation or adaptation is yet to be seen.
Section C- Clusters of change
Horizon Scanning evidence and analysis report (1) – Issue 2 Prepared by SAMI Consulting 24
C4.4 Questions to consider We assume that, along with DECC, Defra is monitoring the political responses to climate change developments. As a matter of policy and strategy it may be worth considering the following questions:
whether there is adequate research on changes in public attitudes to climate change following extreme weather events?
whether the increasing campaigns by certain media are leading to increasing public pressure for action on climate change?
in particular, whether the “keep it in the ground” campaign (10) has an effect on the public acceptance of fracking?
whether adaptation is becoming more accepted as an alternative to mitigation (on the basis that some may argue that the fight against carbon emissions is lost)?
C4.5 Section references (1) World will cross climate change “threshold” by 2036. Michael Mann analysis of climate change timescales http://www.scientificamerican.com/article/earth-will-cross-the-climate-danger-threshold-by-2036/
(2) UCL study identifies which fossil fuel reserves must stay in the ground to avoid dangerous climate change
http://www.bartlett.ucl.ac.uk/sustainable/sustainable-news/nature_fossil_fuels (3) Petition urges the world's two biggest charitable funds to move their money out of fossil fuels http://www.theguardian.com/environment/ng-interactive/2015/mar/16/keep-it-in-the-ground-guardian-climate-change-campaign
(4) Party leaders make joint climate commitment http://www.bbc.co.uk/news/science-environment-31456161 (5) Naomi Klein book: “This changes everything: capitalism vs climate change”
http://thischangeseverything.org/ (6) European Environment Agency report: Increasingly severe consequences of climate change http://www.eea.europa.eu/soer (7) International Energy Agency data: Global energy-related emissions of carbon dioxide stalled in 2014 http://www.iea.org/newsroomandevents/news/2015/march/global-energy-related-emissions-of-carbon-dioxide-stalled-in-2014.html (8) China coal production falls for first time this century http://www.theguardian.com/environment/2015/jan/27/china-coal-production-falls-for-first-time-this-century (9) Failure of climate change adaption programmes is a top 4 risk World Economic Forum risk report 2015 http://www3.weforum.org/docs/WEF_Global_Risks_2015_Report15.pdf (10) New York disaster mitigation programs http://www.fema.gov/disaster/4085/updates/new-york-embraces-stronger-future-through-mitigation
Section D – Emerging signals
Horizon Scanning evidence and analysis report (1) – Issue 2 Prepared by SAMI Consulting 25
SECTION D - Emerging signals
T his section on emerging signals seeks to both identify changes that were not addressed in AKF2013, and also to spot potential emerging issues. We filtered the change database to look at changes (“factors”) tagged as “New or emerging change,” coupled with a medium-term time horizon (4 to 10 years). We were looking for emerging changes whose impact would be felt soon enough for urgency, but far enough out to offer the option of policy response. The scan of scans includes data that is by definition between 1-4 years old, and so many of these emerging issues, drawn as they are from previous scan projects, may by now be familiar. The six issues presented below are not represented in AKF2013, and some in fact define a gap even in the scan of scans that we filled with original scan data.
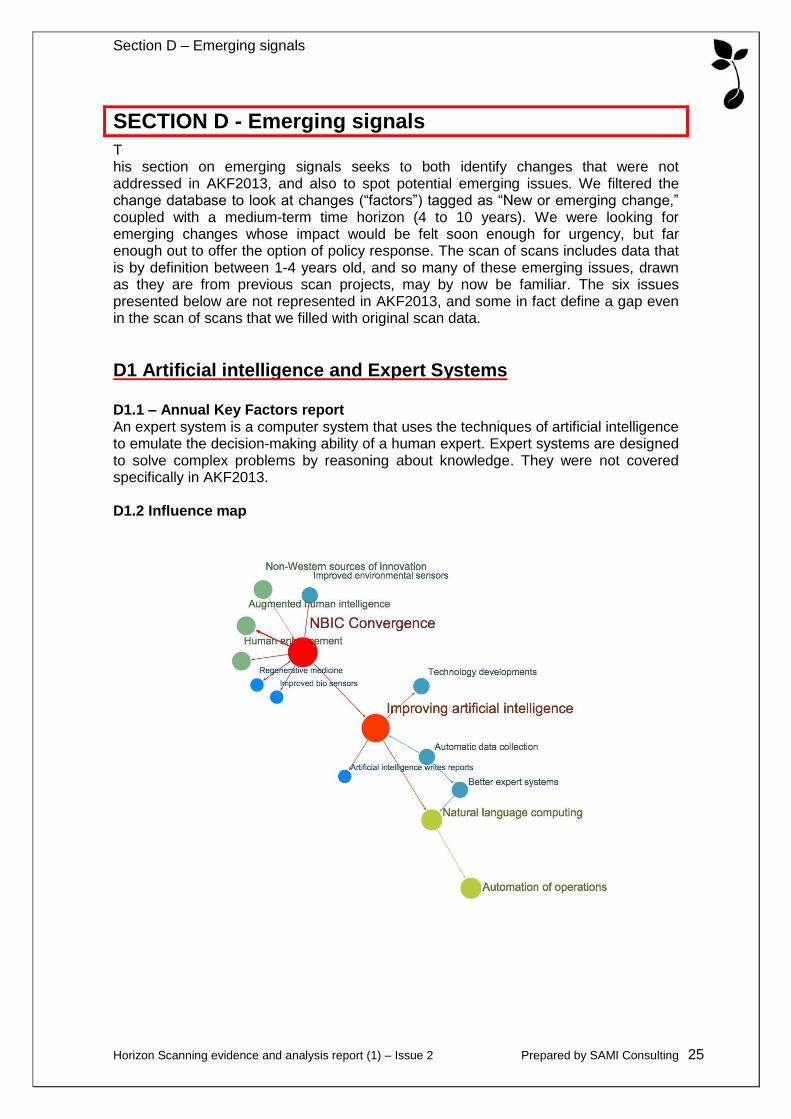
D1 Artificial intelligence and Expert Systems D1.1 – Annual Key Factors report An expert system is a computer system that uses the techniques of artificial intelligence to emulate the decision-making ability of a human expert. Expert systems are designed to solve complex problems by reasoning about knowledge. They were not covered specifically in AKF2013. D1.2 Influence map
Section D – Emerging signals
Horizon Scanning evidence and analysis report (1) – Issue 2 Prepared by SAMI Consulting 26
D1.3 Our scanning Artificial intelligence research has accelerated in the past few years (Story 1) This has been driven by three inter-related developments in ICT:
Cheap parallel computation. Networks of massively parallel processors (derived from GPU graphics processing units), able to process many tasks at the same time.
Big Data. Availability of data about how the world works. The best example is probably the Google Knowledge Vault (2). This collects data from many sources and merges information from across the web, to generate a single database of facts about the world and the people in it. The latest version collects data (1.6bn facts so far) automatically, rather than relying on human input.
Deep learning algorithms. Algorithms that enable computers to automatically identify and extract high-level features of unstructured data.
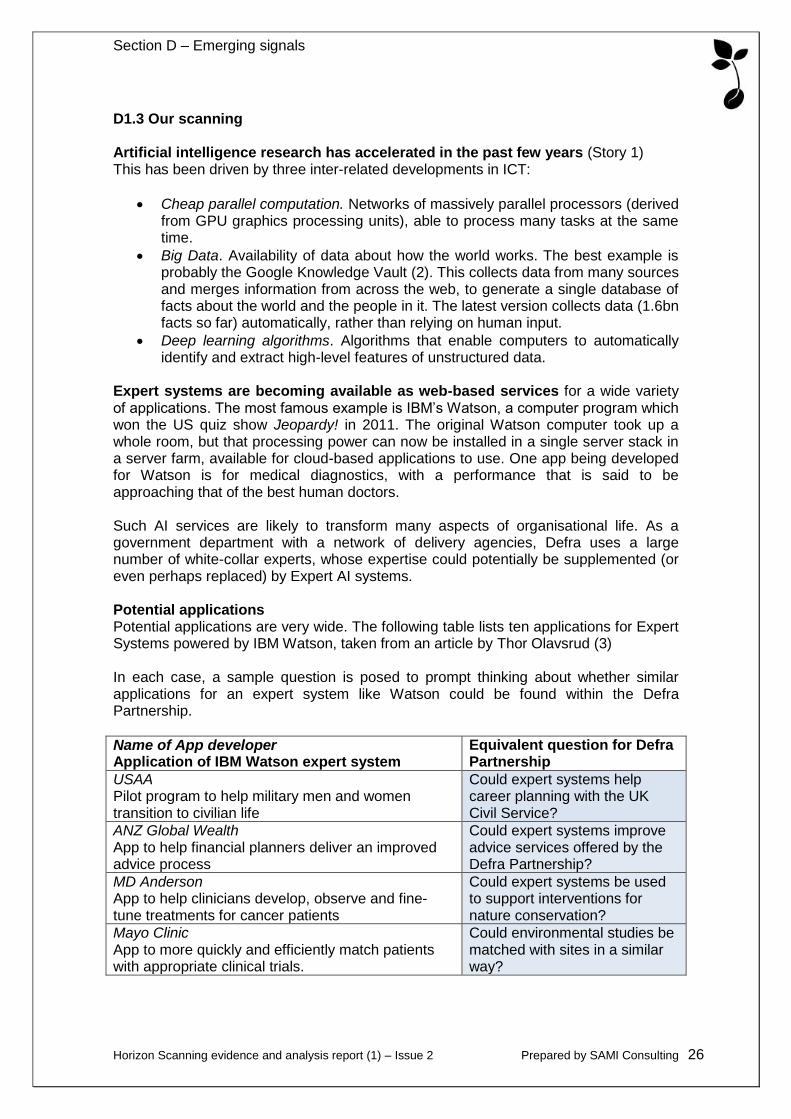
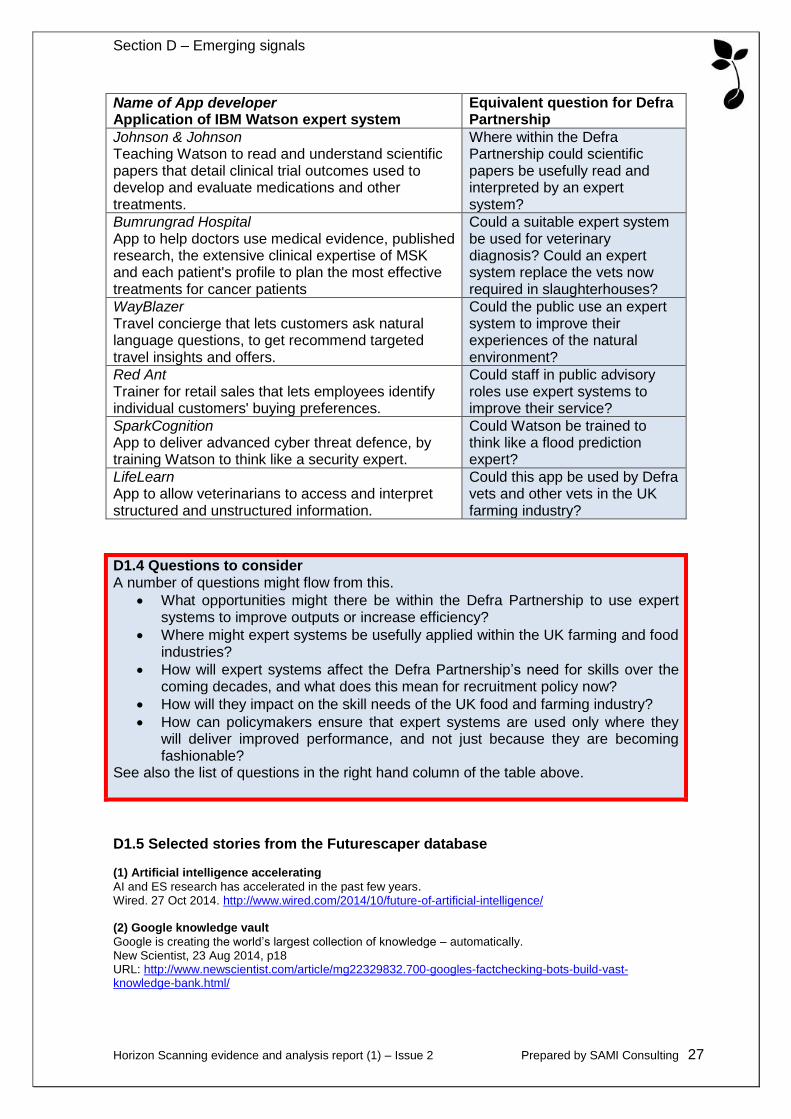
Expert systems are becoming available as web-based services for a wide variety of applications. The most famous example is IBM’s Watson, a computer program which won the US quiz show Jeopardy! in 2011. The original Watson computer took up a whole room, but that processing power can now be installed in a single server stack in a server farm, available for cloud-based applications to use. One app being developed for Watson is for medical diagnostics, with a performance that is said to be approaching that of the best human doctors. Such AI services are likely to transform many aspects of organisational life. As a government department with a network of delivery agencies, Defra uses a large number of white-collar experts, whose expertise could potentially be supplemented (or even perhaps replaced) by Expert AI systems. Potential applications Potential applications are very wide. The following table lists ten applications for Expert Systems powered by IBM Watson, taken from an article by Thor Olavsrud (3) In each case, a sample question is posed to prompt thinking about whether similar applications for an expert system like Watson could be found within the Defra Partnership.
Name of App developer Application of IBM Watson expert system
Equivalent question for Defra Partnership
USAA Pilot program to help military men and women transition to civilian life
Could expert systems help career planning with the UK Civil Service?
ANZ Global Wealth App to help financial planners deliver an improved advice process
Could expert systems improve advice services offered by the Defra Partnership?
MD Anderson App to help clinicians develop, observe and fine-tune treatments for cancer patients
Could expert systems be used to support interventions for nature conservation?
Mayo Clinic App to more quickly and efficiently match patients with appropriate clinical trials.
Could environmental studies be matched with sites in a similar way?
Section D – Emerging signals
Horizon Scanning evidence and analysis report (1) – Issue 2 Prepared by SAMI Consulting 27
Name of App developer Application of IBM Watson expert system
Equivalent question for Defra Partnership
Johnson & Johnson Teaching Watson to read and understand scientific papers that detail clinical trial outcomes used to develop and evaluate medications and other treatments.
Where within the Defra Partnership could scientific papers be usefully read and interpreted by an expert system?
Bumrungrad Hospital App to help doctors use medical evidence, published research, the extensive clinical expertise of MSK and each patient's profile to plan the most effective treatments for cancer patients
Could a suitable expert system be used for veterinary diagnosis? Could an expert system replace the vets now required in slaughterhouses?
WayBlazer Travel concierge that lets customers ask natural language questions, to get recommend targeted travel insights and offers.
Could the public use an expert system to improve their experiences of the natural environment?
Red Ant Trainer for retail sales that lets employees identify individual customers' buying preferences.
Could staff in public advisory roles use expert systems to improve their service?
SparkCognition App to deliver advanced cyber threat defence, by training Watson to think like a security expert.
Could Watson be trained to think like a flood prediction expert?
LifeLearn App to allow veterinarians to access and interpret structured and unstructured information.
Could this app be used by Defra vets and other vets in the UK farming industry?
D1.4 Questions to consider A number of questions might flow from this.
What opportunities might there be within the Defra Partnership to use expert systems to improve outputs or increase efficiency?
Where might expert systems be usefully applied within the UK farming and food industries?
How will expert systems affect the Defra Partnership’s need for skills over the coming decades, and what does this mean for recruitment policy now?
How will they impact on the skill needs of the UK food and farming industry?
How can policymakers ensure that expert systems are used only where they will deliver improved performance, and not just because they are becoming fashionable?
See also the list of questions in the right hand column of the table above.
D1.5 Selected stories from the Futurescaper database (1) Artificial intelligence accelerating
AI and ES research has accelerated in the past few years. Wired. 27 Oct 2014. http://www.wired.com/2014/10/future-of-artificial-intelligence/ (2) Google knowledge vault
Google is creating the world’s largest collection of knowledge – automatically. New Scientist, 23 Aug 2014, p18 URL: http://www.newscientist.com/article/mg22329832.700-googles-factchecking-bots-build-vast-knowledge-bank.html/

Section D – Emerging signals
Horizon Scanning evidence and analysis report (1) – Issue 2 Prepared by SAMI Consulting 28
(3) IBM Watson expert system
10 IBM Watson-Powered Apps That Are Changing Our World. By Thor Olavsrud, CIO. Nov 6, 2014 http://www.cio.com/article/2843710/big-data/10-ibm-watson-powered-apps-that-are-changing-our-world.html/
Section D – Emerging signals
Horizon Scanning evidence and analysis report (1) – Issue 2 Prepared by SAMI Consulting 29
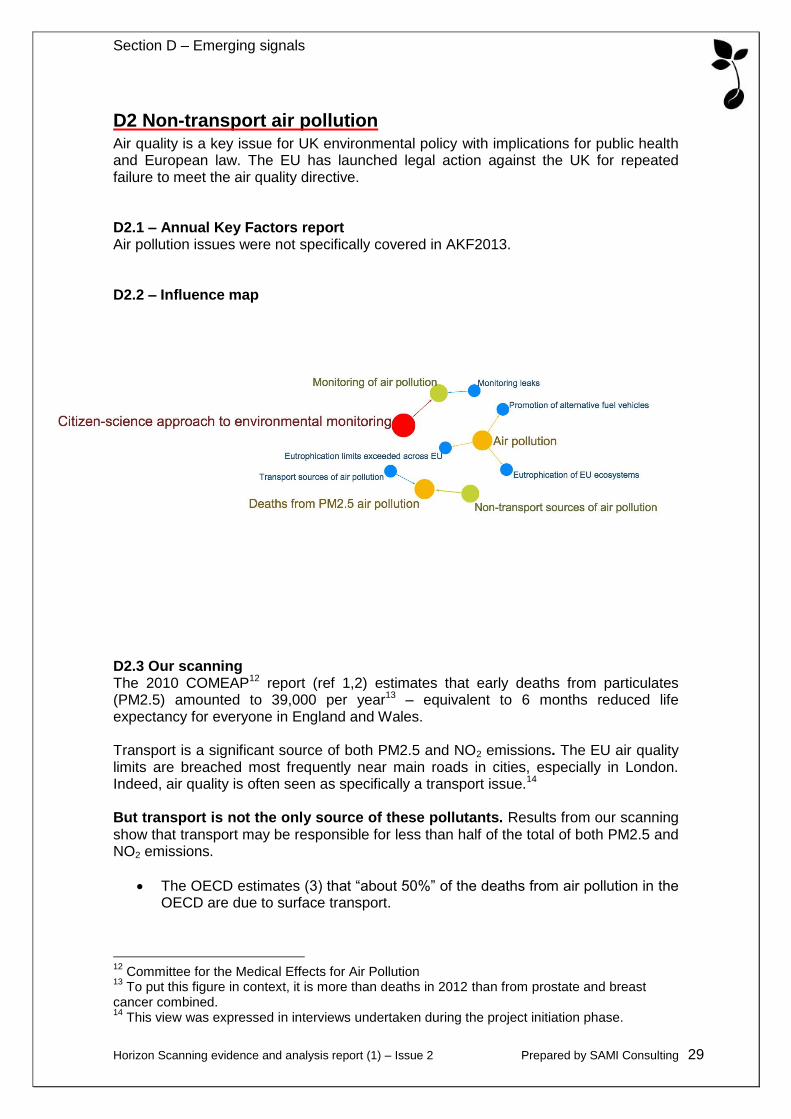
D2 Non-transport air pollution Air quality is a key issue for UK environmental policy with implications for public health and European law. The EU has launched legal action against the UK for repeated failure to meet the air quality directive. D2.1 – Annual Key Factors report Air pollution issues were not specifically covered in AKF2013. D2.2 – Influence map
D2.3 Our scanning The 2010 COMEAP12 report (ref 1,2) estimates that early deaths from particulates (PM2.5) amounted to 39,000 per year13 – equivalent to 6 months reduced life expectancy for everyone in England and Wales.
Transport is a significant source of both PM2.5 and NO2 emissions. The EU air quality limits are breached most frequently near main roads in cities, especially in London. Indeed, air quality is often seen as specifically a transport issue.14 But transport is not the only source of these pollutants. Results from our scanning show that transport may be responsible for less than half of the total of both PM2.5 and NO2 emissions.
The OECD estimates (3) that “about 50%” of the deaths from air pollution in the OECD are due to surface transport.
12
Committee for the Medical Effects for Air Pollution 13
To put this figure in context, it is more than deaths in 2012 than from prostate and breast cancer combined. 14
This view was expressed in interviews undertaken during the project initiation phase.
Section D – Emerging signals
Horizon Scanning evidence and analysis report (1) – Issue 2 Prepared by SAMI Consulting 30
One academic study (4) estimated the global and national health burden of ambient PM2.5 exposure attributable to surface transportation emissions - the “transportation attributable fraction” (TAF). The TAF for Western Europe in 2005 was estimated at just 23%.
Defra’s own figures (5) show that “road transport still accounts for just under one third of total NOx emissions”; and that “Emissions from road transport accounted for around 18 per cent of the total emissions for both PM2.5 and PM10 in 2013.”
According to the National Atmospheric Emissions Inventory (NAEI) (6), “almost a third of the UK NOx emissions arise from road transport, most of which comes from diesel vehicles” (though the graphic in the same reference suggests a somewhat higher proportion).
If these scanning observations are taken at face value, they suggest that more than half of the deaths in the UK from air pollution could be attributable to non-transport sources. Air quality is rising up the political agenda. People are becoming more aware of air pollution as an issue that might affect their wellbeing and the health of their families.
This social trend is being reinforced by changes in technology (7). Environmental sensors are getting cheaper and more portable; and mapping applications are becoming available which allow people to track their individual exposures to air pollution in real time.
COMEAP is currently researching deaths from nitrogen dioxide (NO2), and is due to report in 2015. Reports in the press suggest that including the impact of NO2 would nearly double the PM2.5 figure – to around 60,000 early deaths per year. The chair of the committee is quoted as saying that including NO2 “would increase air pollution’s contribution to the total death rate from 5%-9% across the UK to 10%-18%”.
D2.4 Questions to consider A number of questions might be thrown up by this:
Across government policy as a whole, is the right balance being struck between the focus on transport versus non-transport sources of PM2.5 and NO2 emissions?
Given the substantial reductions in air pollution since 1970, is environmental policy being given sufficient credit for any role it may have had in the increase in life expectancy over that period?
Scanning in the next period will look for any more published research that quantifies the mortality from non-transport sources of air pollution (particularly PM2.5 and NO2 emissions).
Section D – Emerging signals
Horizon Scanning evidence and analysis report (1) – Issue 2 Prepared by SAMI Consulting 31
D2.5 Section references Air Quality
(1) Committee for the Medical Effects for Air Pollution. Mortality effects of long-term exposure to particulate air pollution in the UK. ISBN 978-0-85951-685-3 https://www.gov.uk/government/publications/comeap-mortality-effects-of-long-term-exposure-to-particulate-air-pollution-in-the-uk (2) Independent: 30 Nov 2014. http://www.independent.co.uk/news/uk/home-news/air-pollution-to-blame-for-60000-early-deaths-per-year-government-to-be-warned-9893810.html (3) The Cost of Air Pollution: Health Impacts of Road Transport. Published on May 21, 2014 http://www.oecd.org/environment/the-cost-of-air-pollution-9789264210448-en.htm (4) The transportation attributable fraction (TAF), for deaths from particulate air pollution in Western Europe is estimated at just 23%. Reference: S E Chambliss et al 2014 Environ. Res. Lett. 9 104009 doi:10.1088/1748-9326/9/10/104009. Date: 10 Oct 2014. URL: http://iopscience.iop.org/1748-9326/9/10/104009/article (5) Air pollution has fallen significantly since 1970. NO2 by half, SO2 by over 90%, and particulates by three quarters. Defra National Statistics Release: Emissions of air pollutants in the UK, 1970 to 2013. (6) “Almost a third of the UK NOx emissions arise from road transport, most of which comes from diesel vehicles.” National Atmospheric Emissions Inventory. http://naei.defra.gov.uk/overview/pollutants?pollutant_id=6 (7) Live mapping of air pollution in London. Nowcast of air pollution in London. London Air Quality Network (LAQN) http://www.londonair.org.uk/london/asp/nowcast.asp
Section D – Emerging signals
Horizon Scanning evidence and analysis report (1) – Issue 2 Prepared by SAMI Consulting 32
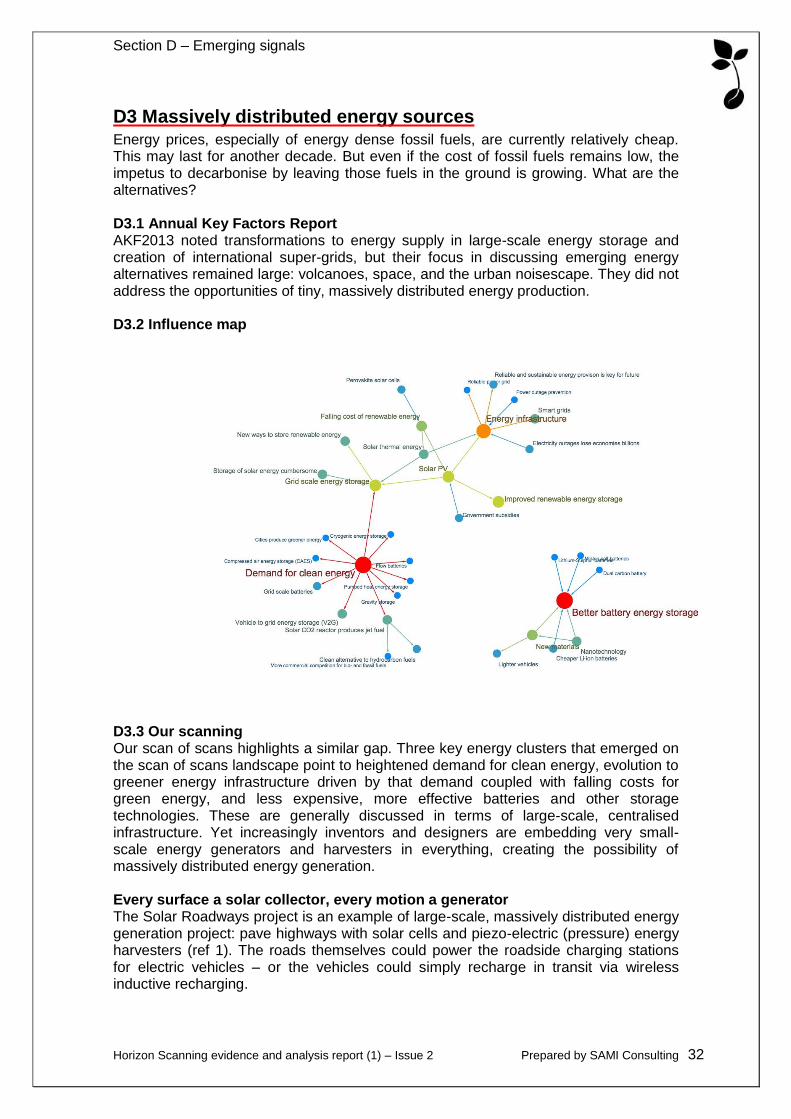
D3 Massively distributed energy sources Energy prices, especially of energy dense fossil fuels, are currently relatively cheap. This may last for another decade. But even if the cost of fossil fuels remains low, the impetus to decarbonise by leaving those fuels in the ground is growing. What are the alternatives? D3.1 Annual Key Factors Report AKF2013 noted transformations to energy supply in large-scale energy storage and creation of international super-grids, but their focus in discussing emerging energy alternatives remained large: volcanoes, space, and the urban noisescape. They did not address the opportunities of tiny, massively distributed energy production. D3.2 Influence map
D3.3 Our scanning Our scan of scans highlights a similar gap. Three key energy clusters that emerged on the scan of scans landscape point to heightened demand for clean energy, evolution to greener energy infrastructure driven by that demand coupled with falling costs for green energy, and less expensive, more effective batteries and other storage technologies. These are generally discussed in terms of large-scale, centralised infrastructure. Yet increasingly inventors and designers are embedding very small-scale energy generators and harvesters in everything, creating the possibility of massively distributed energy generation. Every surface a solar collector, every motion a generator The Solar Roadways project is an example of large-scale, massively distributed energy generation project: pave highways with solar cells and piezo-electric (pressure) energy harvesters (ref 1). The roads themselves could power the roadside charging stations for electric vehicles – or the vehicles could simply recharge in transit via wireless inductive recharging.
Section D – Emerging signals
Horizon Scanning evidence and analysis report (1) – Issue 2 Prepared by SAMI Consulting 33
At the scale of a building, Solar Ivy15 is the siding equivalent of solar roadways: a net of ‘artificial ivy’ whose leaves are solar cells that blow in the wind and as they move trigger piezoelectric energy harvesting. Innovations in transparent solar concentrators suggest that every window in every building could effectively generate energy (2) – even at low efficiencies, the potential for massive deployment could create practical benefits. How could massively distributed energy harvesting devices contribute to creating the next-generation carbon negative farm or rural community? On the personal scale, more electronic devices – or their carrying cases – come with solar cells built-in. Even more personally, your body movements could generate electricity using piezoelectric fabrics, as could your body heat via a new thermo-electric material called Power Felt (3). Moving from wearable technology to embedded technology, biofuel cells generate electricity from glucose and oxygen to power medical implants (4). Is this the key power source for the coming age of cyborgs? Is it the power source for the Internet of Livestock, as we embed tracking and health sensor chips in all our livestock and domestic animals? Finally, on the tiny and massively distributed scale, researchers have developed low-power electronic chips that can themselves harvest power from a variety of sources – sunlight, heat, or environmental vibrations (5). New wireless device designs can stay digitally connected without the need for a battery – they harvest their operating energy from the ambient radio, TV and WiFi waves (6).
D3.4 Questions to consider
The current UK policy paper on microgeneration focuses on household scale heat pumps, wind generators, and solar panels. How might this be adjusted to encompass more emerging opportunities in distributed energy production?
What would be the environmental impacts of solar roadways with inductive charging? What would be the breakeven cost of construction vs energy production and decarbonisation potential?
The current mindset for considering national energy supply is still large-scale and centralised – one emerging mindset focusses on the small-scale and decentralised. What practical opportunities for innovative, sustainable energy production does that emerging perspective present?
These innovations enabling massively distributed energy production sit squarely in the gap between the three factors highlighted above: they answer the demand for clean energy, they require better battery energy storage, and they expand the resilience and capacity of the current energy infrastructure. Further developments and case studies would be useful in demonstrating their practicality for a widespread rural sustainability strategy. D3.5 Section references (1) “Solar Roads, Charging Roads, and The Future Of Transportation,” Glen Hiemstra, Fast.Co. 12 March 2013. http://www.fastcoexist.com/1681562/solar-roads-charging-roads-and-the-future-of-transportation (2) Solar energy that doesn’t block the view,” MSU Today, 19/8/2014. http://msutoday.msu.edu/news/2014/solar-energy-that-doesnt-block-the-view/
15
http://solarivy.com/the_idea
Section D – Emerging signals
Horizon Scanning evidence and analysis report (1) – Issue 2 Prepared by SAMI Consulting 34
(3) “Power Felt gives a charge,” Wake Forest University. 22/2/2012. http://news.wfu.edu/2012/02/22/power-felt-gives-a-charge/ (4) “Power from the people,” BBC News. 17/10/2011. http://www.bbc.co.uk/news/technology-15305579 (5)“New chip captures power from multiple sources,” MIT News. 9/7/2012. http://newsoffice.mit.edu/2012/chip-power-heat-vibration-light-0709 (6) “Devices Connect with Borrowed TV Signals and Need No Power Source,” MIT Technology Review. 14/8/2013. http://www.technologyreview.com/news/518111/devices-connect-with-borrowed-tv-signals-and-need-no-power-source/
D3.6 Selected stories from the Futurescaper database (7) Solar-jet reactor turns carbon dioxide, water, and concentrated sunlight into jet fuel
For the first time, EU chemists have made jet fuel from scratch using a solar reactor. They estimate a full scale solar concentrator would produce 20,000 litres a day. It turns one of the gases responsible for climate change (CO2) into a useful resource and the technology would improve energy security and answer the demand for high-density clean energy. “’Solar’ jet fuel made out of thin air,” Chemistry World. 2/5/2014. http://www.rsc.org/chemistryworld/2014/05/solar-jet-fuel-made-out-thin-air (8) Turning city noise into green energy
Parametric Frequency Increased Generators - Soundscrapers - pick up city noise (vibrations), which an energy harvester converts into kinetic energy. Transducer cells then convert the energy to electricity, which can be stored or distributed to the grid for regular electric use. A Soundscraper could produce 150 megawatts of energy in a densely populated city which is roughly equivalent to 10% of the lighting needs of Los Angeles. This clean energy could help reduce carbon emissions and reliance upon fossil fuels. Several Soundscapers could drastically offset a city's electrical requirements. “Soundscraper Captures Sound Kinetic Energy While Reducing Noise Pollution,” eVolo. 12/3/2013. http://www.evolo.us/competition/soundscraper-captures-sound-kinetic-energy-while-reducing-noise-pollution/ (9) Dual carbon battery charges faster and needs no rare metals
A new “dual carbon” battery (ie with both the anode and the cathode made of carbon) has been launched by Power Japan Plus. The battery charges 20 times faster than lithium ion batteries and has the same energy density. “Power Japan Plus Reveals New Ryden Dual Carbon Battery,” BusinessWire. 13/5/2014. http://www.businesswire.com/news/home/20140513005472/en/Power-Japan-Reveals-Ryden-Dual-Carbon-Battery#.VRmDypPF87O (10) Energy internet, a new electric grid infrastructure
Researchers in the US (the FREEDM Systems Center, a collaboration of leaders in research, industry and engineering education) are envisioning and creating the energy network of the future. They are looking to develop a smart grid, more efficient and capable of meeting increased consumer demand without adding infrastructure. It also will be more intelligent, sensing system overloads and rerouting power to prevent or to minimise any potential outage. It will accept energy from virtually any fuel source and offer improved security and resiliency in case of a natural disaster or threat. It also aims to enable real-time communication between utilities and consumers so giving consumers choice. “Creating the energy internet,” National Science Foundation. 2/15/2015. nsf.gov/discoveries/disc_summ.jsp?cntn_id=134274&WT.mc_id=USNSF_51&WT.mc_ev=click
Section D – Emerging signals
Horizon Scanning evidence and analysis report (1) – Issue 2 Prepared by SAMI Consulting 35
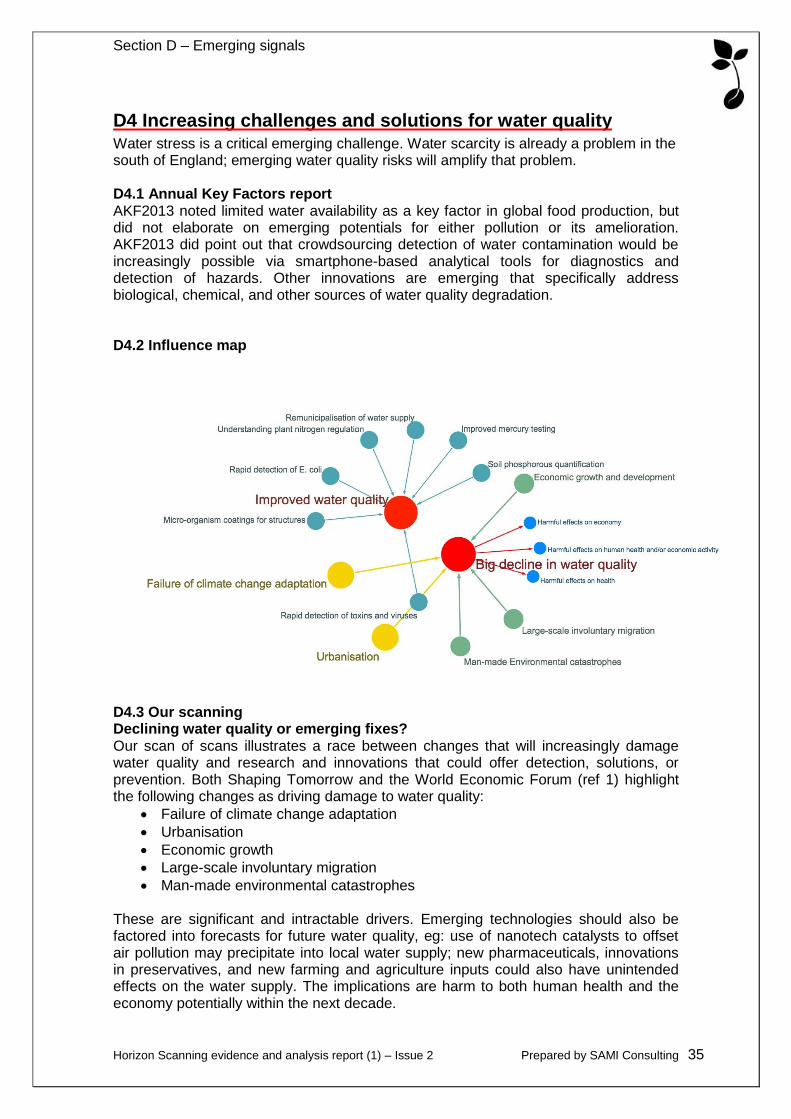
D4 Increasing challenges and solutions for water quality Water stress is a critical emerging challenge. Water scarcity is already a problem in the south of England; emerging water quality risks will amplify that problem. D4.1 Annual Key Factors report AKF2013 noted limited water availability as a key factor in global food production, but did not elaborate on emerging potentials for either pollution or its amelioration. AKF2013 did point out that crowdsourcing detection of water contamination would be increasingly possible via smartphone-based analytical tools for diagnostics and detection of hazards. Other innovations are emerging that specifically address biological, chemical, and other sources of water quality degradation. D4.2 Influence map
D4.3 Our scanning Declining water quality or emerging fixes? Our scan of scans illustrates a race between changes that will increasingly damage water quality and research and innovations that could offer detection, solutions, or prevention. Both Shaping Tomorrow and the World Economic Forum (ref 1) highlight the following changes as driving damage to water quality:
Failure of climate change adaptation
Urbanisation
Economic growth
Large-scale involuntary migration
Man-made environmental catastrophes These are significant and intractable drivers. Emerging technologies should also be factored into forecasts for future water quality, eg: use of nanotech catalysts to offset air pollution may precipitate into local water supply; new pharmaceuticals, innovations in preservatives, and new farming and agriculture inputs could also have unintended effects on the water supply. The implications are harm to both human health and the economy potentially within the next decade.
Section D – Emerging signals
Horizon Scanning evidence and analysis report (1) – Issue 2 Prepared by SAMI Consulting 36
Improving water quality The scientific and technical innovations include:
Biological contaminants sensing including on-the-spot detection of E. coli (2) via a cheap, colour-changing filter, and detection of toxins and viruses via a quick, efficient, quick, cost-effective method of multiple protein analysis (3). Both of these innovations focus on cheap, easily deployed sensors suitable for communities with limited resources.
Chemical contaminants sensing including improved mercury testing (4), and soil phosphorus quantification (5) and increased understanding of plant nitrogen regulation (6), leading to lowered fertiliser use.
Innovations in biological infrastructure coatings minimize the toxicity and use of biocides needed to combat corrosion in bridges, pipelines, railroads, ships, and other infrastructure, reducing impacts on water quality(7).
A common thread across these innovations is low-cost, on-the-spot, instant read-out sensing that could contribute to massively decentralised water quality monitoring. Preserving water quality is not just a matter of technological fixes. In a report on global water policy trends, the Transnational Institute (8) note that in the last 15 years, more than 180 cities across 35 countries have re-municipalised their water supply. The common issues cited in the report’s case studies include “under-investment, soaring water bills, lack of transparency and poor service quality,” which this policy shift is meant to address. While the cases may not exactly match the UK context, the report illustrates the rising challenges of providing consistent, high-quality water supply. In an era of increasing water stress, global case studies of alternative models of water management could prove as useful as technological innovations.
D4.4 Questions to consider
What would a UK-wide massively decentralised water quality sensing network look like? To what extent could it be crowdsourced to ‘citizen science’?
What UK public-private partnerships could encourage R&D to address UK risks to water quality from increasingly dense urban and economic infrastructure?
What model for the national water supply system will assure the best oversight for improving and maintaining water quality?
See section D6 for further emerging issues regarding citizen science, monitoring, and whistle-blowing. D4.5 Selected stories from the Futurescaper database (1) Risk of significant decline in quality and quantity of fresh water available
The World Economic Forum's Global Risk Report identified a significant decline in the quantity of fresh water available as one of its top risks. Global Risk Report 2015, World Economic Forum. 12 January 2015 www3.weforum.org/docs/WEF_Global_Risks_2015_Report.pd (2) Rapid test for E. coli in water developed
A research team from the University of Alberta has developed a device that detects E. coli bacteria in water in minutes—rather than existing technology which takes 24 to 48 hours. The team hopes to tie the new test to mobile phone technology to alert health workers and the public that a water source is contaminated. “Research team develops new method to detect E. coli in water,” University of Alberta. 23/9/2013. http://uofa.ualberta.ca/news-and-events/newsarticles/2013/september/research-team-develops-new-method-to-detect-ecoli-in-water
Section D – Emerging signals
Horizon Scanning evidence and analysis report (1) – Issue 2 Prepared by SAMI Consulting 37
(3) Sensors for rapid detection of toxins and viruses developed
Chemists from Johannes Gutenberg University, Mainz, have developed a new method for multiple protein analysis that in principle is capable of identifying hundreds thousands of different proteins in tiny samples. It could be used to detect and identify viruses, and detection of various kinds of toxin for water monitoring, environment technology and food analysis. The method is quite efficient, quick and cost-effective. “Sensors for Rapid Detection of Proteins Developed,” United Academics. 1/8/2013. http://www.united-academics.org/magazine/health-medicine/sensors-detection-proteins/ (4) Improved mercury detection in water
A new ultra-sensitive, low-cost and portable system for detecting mercury in environmental water has been developed by researchers at the University of Adelaide. The technique, capable of monitoring mercury at trace levels, could provide the basis for improved systems for monitoring water quality in situ. “New system to detect mercury in water systems,” Science Daily. 25 July 2014. http://www.sciencedaily.com/releases/2014/07/140725110710.htm (5) Soil phosphorus quantification
A method for assessing the soil phosphorous levels of agricultural land using a combination of x-ray and diffusive gradients in thin films (DGT) technologies has been developed. “Smart farming technique to boost yields and cut fertiliser pollution,” Lancaster University. 15/1/2015. http://www.lancaster.ac.uk/news/articles/2015/smart-farming-technique-to-boost-yields-and-cut-fertiliser-pollution-/ (6) Research into plant nitrogen regulation
Research into how plants regulate their absorption nitrogen could lead to breeding new crop varieties that need less fertiliser thus helping to avoid pollution caused by excess use of fertiliser. “Insights into plant growth could curb need for fertilizers,” Phys Org. 12/11/2014. http://phys.org/news/2014-11-insights-growth-curb-fertilizers.html#jCp (7) Micro-organism coatings used to protect infrastructure
Research has identified a bacterial coating that can be applied to metallic structures that reduces corrosion. “How micro-organisms can help hold up bridges,” Horizon 2020. 6/2/2015. http://ec.europa.eu/programmes/horizon2020/en/news/how-microorganisms-can-help-hold-bridges (8) Re-municipalisation of water sources
180 cities worldwide, including major centres such as Paris, Berlin, Kuala Lumpur and Buenos Aires, are taking back public control of water supply from private companies. Countries with long histories of water privatisation, such as France, are leading the trend. “180 cities take back public control of water showing remunicipalisation is here to stay,” Transnational Institute, http://www.tni.org/pressrelease/180-cities-take-back-public-control-water-showing-remunicipalisation-here-stay
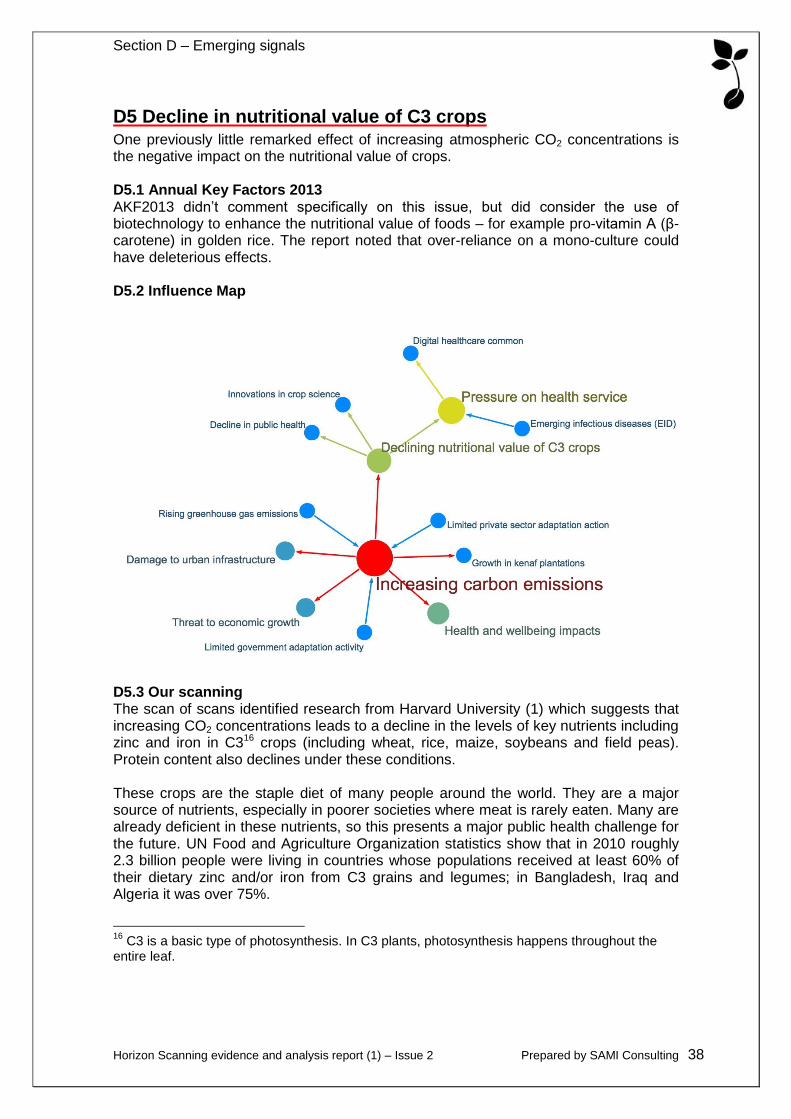
Section D – Emerging signals
Horizon Scanning evidence and analysis report (1) – Issue 2 Prepared by SAMI Consulting 38
D5 Decline in nutritional value of C3 crops One previously little remarked effect of increasing atmospheric CO2 concentrations is the negative impact on the nutritional value of crops. D5.1 Annual Key Factors 2013 AKF2013 didn’t comment specifically on this issue, but did consider the use of biotechnology to enhance the nutritional value of foods – for example pro-vitamin A (β-carotene) in golden rice. The report noted that over-reliance on a mono-culture could have deleterious effects. D5.2 Influence Map
D5.3 Our scanning The scan of scans identified research from Harvard University (1) which suggests that increasing CO2 concentrations leads to a decline in the levels of key nutrients including zinc and iron in C316 crops (including wheat, rice, maize, soybeans and field peas). Protein content also declines under these conditions. These crops are the staple diet of many people around the world. They are a major source of nutrients, especially in poorer societies where meat is rarely eaten. Many are already deficient in these nutrients, so this presents a major public health challenge for the future. UN Food and Agriculture Organization statistics show that in 2010 roughly 2.3 billion people were living in countries whose populations received at least 60% of their dietary zinc and/or iron from C3 grains and legumes; in Bangladesh, Iraq and Algeria it was over 75%.
16
C3 is a basic type of photosynthesis. In C3 plants, photosynthesis happens throughout the entire leaf.
Section D – Emerging signals
Horizon Scanning evidence and analysis report (1) – Issue 2 Prepared by SAMI Consulting 39
Reductions in the zinc and iron content of the edible portion of these food crops will increase the risk of zinc and iron deficiencies across these populations and will add to the already considerable burden of disease associated with them. Simply eating more staple foods to meet zinc and iron requirements is not realistic when food production already must double by 2050 to meet the demand of rising populations (1). Differences between cultivars of a single crop suggest that breeding for decreased sensitivity to atmospheric CO2 concentration could partly address the issue, but researchers noted “Such breeding programmes will not be a panacea for many reasons including the affordability of improved seeds and the numerous criteria used by farmers in making planting decisions that include taste, tradition, marketability, growing requirements and yield." It is known that increasing global CO2 increases yield and decreases water use by crops and this is often presented as one positive of atmospheric change. This research however suggests increased quantity is at the expense of quality. CO2 enrichment experiments at the University of Illinois at Urbana-Champaign (2) have also shown that rising CO2 levels lower crops' resistance to pests. When plants were exposed to levels of CO2 similar to those used in the Harvard study, crop damage from three major crop pests and diseases (including coffee rust) doubled.
D5.4 Questions to consider If increasing global CO2 reduces the nutritional value of C3 crops significantly, Defra and FSA may need to consider:
whether imports of C3 crops from vulnerable areas may be threatened, and whether this represents a significant challenge?
whether lower nutritional value of C3 crops consumed in the UK represents a threat to health? And if so, how this can be ameliorated?
whether crop yields may be affected by increasing crop damage from pests?
D5.5 Selected stories from the Futurescaper database (1) Rising CO2 to increase dietary deficiencies
Increasing CO2 threatens human nutrition. Research suggests that as atmospheric CO2 concentrations increase, levels of key nutrients including Zinc and Iron in C3 crops (including grains and legumes) are set to fall. http://environment.harvard.edu/sites/default/files/myers_2014_increasing_co2_threatens_human_nutrition_aop_version.pdf
D5.6 Other section references (2) Rising CO2 levels lower crops' resistance to pests http://news.nationalgeographic.com/news/2014/05/140507-crops-nutrition-climate-change-carbon-dioxide-science/
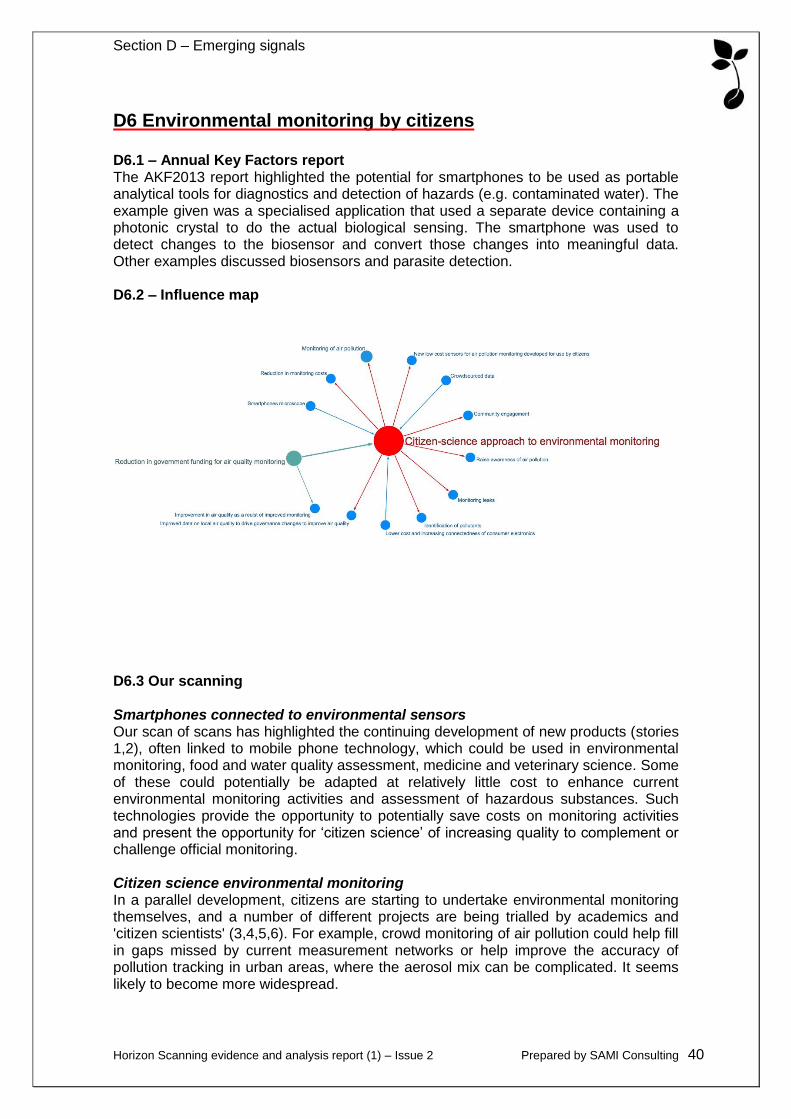
Section D – Emerging signals
Horizon Scanning evidence and analysis report (1) – Issue 2 Prepared by SAMI Consulting 40
D6 Environmental monitoring by citizens D6.1 – Annual Key Factors report The AKF2013 report highlighted the potential for smartphones to be used as portable analytical tools for diagnostics and detection of hazards (e.g. contaminated water). The example given was a specialised application that used a separate device containing a photonic crystal to do the actual biological sensing. The smartphone was used to detect changes to the biosensor and convert those changes into meaningful data. Other examples discussed biosensors and parasite detection. D6.2 – Influence map
D6.3 Our scanning Smartphones connected to environmental sensors Our scan of scans has highlighted the continuing development of new products (stories 1,2), often linked to mobile phone technology, which could be used in environmental monitoring, food and water quality assessment, medicine and veterinary science. Some of these could potentially be adapted at relatively little cost to enhance current environmental monitoring activities and assessment of hazardous substances. Such technologies provide the opportunity to potentially save costs on monitoring activities and present the opportunity for ‘citizen science’ of increasing quality to complement or challenge official monitoring. Citizen science environmental monitoring In a parallel development, citizens are starting to undertake environmental monitoring themselves, and a number of different projects are being trialled by academics and 'citizen scientists' (3,4,5,6). For example, crowd monitoring of air pollution could help fill in gaps missed by current measurement networks or help improve the accuracy of pollution tracking in urban areas, where the aerosol mix can be complicated. It seems likely to become more widespread.
Section D – Emerging signals
Horizon Scanning evidence and analysis report (1) – Issue 2 Prepared by SAMI Consulting 41
Environmental monitoring by other organisations Other organisations are collecting environmental data as part of their normal activities: For instance, city dashboards in Smart Cities (7) are increasingly used to integrate data from a wide variety of sources, including smartphone sensors, to manage the smart city. And the story of Google’s Street View cars being equipped to detect gas leaks (8) illustrates the opportunity to collect environmental monitoring data from a variety of other sources - especially if they are in the area of interest anyway.
D6.4 Questions to consider A number of questions might arise around the technology of collecting data, and the citizens’ reactions to this:
What data could and should the Defra Partnership encourage citizens to collect on its behalf? Would this lead to any liability issues etc.?
What about quality control (e.g. admissibility if used as evidence)?
How might this affect behaviours, and/or the way people interact with the environment?
What data is the Defra Partnership already collecting (e.g. invasive species app)?
What new environmental sensing devices might the Defra Partnership need in the future? What, if any, developments should it be funding?
What opportunities are there for the Defra Partnership to add environmental sensors to already deployed resources (vans, staff smartphones, installations, infrastructure) to collect additional environmental data?
How could the Defra Partnership store, manage and use such data? Would it be overwhelmed with data?
D6.5 Selected stories from the Futurescaper database Smartphone attachments for environmental science
(1) Smartphones becoming tools for hazard detection
Improved computing power is turning smartphones into portable analytical tools for diagnostics and detection of hazards (e.g. contaminated water) Ahlberg L (2013). Cradle turns smartphone into handheld biosensor. University of Illinois. http://news.illinois.edu/news/13/0523iphone_biosensor_BrianCunningham.html (2) Smart phone microscope with wide applications
A powerful microscope for use with mobile phone cameras, costing only $1 in materials, which can be produced with 3D printing technology. The researchers developed the technology for use by 'first responders' in hazardous materials teams. Smartphones can be used to photograph the magnified images and send the images for analysis at laboratories. http://availabletechnologies.pnnl.gov/technology.asp?id=393 Citizen monitoring
(3) Citizen science air monitoring
The US EPA is providing support and tools for volunteers to undertake community air monitoring projects. They have developed a specific tool kit to be used by citizen science volunteers that enables them to collect data on the air pollutants; particulate matter and (PM) nitrogen dioxide (NO2). WILLIAMS, R. W., T. M. BARZYK, AND A. KAUFMAN. Citizen Science Air Monitor (CSAM) Quality Assurance Guidelines. U.S. Environmental Protection Agency, EPA/600/R-15/008, 2015. http://cfpub.epa.gov/si/si_public_record_report.cfm?dirEntryId=305651 (Via Environment Agency HS – Scan of scans)
Section D – Emerging signals
Horizon Scanning evidence and analysis report (1) – Issue 2 Prepared by SAMI Consulting 42
(4) Air pollution monitoring will in the future be done by citizens / citizen science.
New sensors are being developed that will allow 'citizen sensing' to replace expensive sensor networks for particulates, nitrogen dioxide and carbon monoxide. In US there is government support from the EPA for development of these devices and different projects are being trialled by academics and 'citizen scientists'. http://www.nature.com/news/environmental-science-pollution-patrol-1.16654 http://www.atmos-meas-tech-discuss.net/7/605/2014/amtd-7-605-2014.html (5) Particulate matter detectors costing just $50.
A low cost sensor may cost one fiftieth of a regulatory sensor, though there are still concerns about the quality of data these sensors collect. http://www.nature.com/news/environmental-science-pollution-patrol-1.16654 (6) Personal sensors to provide air quality monitors.
The continuous rise of sensors in consumer electronics is leading to new applications in local air quality monitoring and the generation of very wide monitoring networks. Ref: Nature Vol 517, 8 January 2015, 136- 138 Environmental monitoring by other organisations
(7) Smart cities (extract)
City dashboards in Smart Cities are increasingly used to integrate data from a wide variety of sources, including smartphone sensors, to manage the smart city. US National Intelligence Council: Global Trends 2030 – Alternative Worlds http://www.dni.gov/index.php/about/organization/global-trends-2030 http://www.dni.gov/files/documents/GlobalTrends_2030.pdf for the pdf (8) Google cars detect gas leaks.
Google Street View cars, used to photograph street scenes, have been equipped with sensors that map concentrations of methane as they pass and thus detect gas leaks. This development illustrates the growth of ubiquitous sensing and localised environmental monitoring. http://www.newscientist.com/article/dn25902-google-streetview-cars-sniff-out-gas-leaks-in-cities.html/.
Horizon Scanning evidence and analysis report (1) – Issue 2 Prepared by SAMI Consulting 43
SECTION E – Where the project is going next
The next report will be produced at the end of June 2015. Whereas this report was predominantly focussed on the “scan of scans” conducted to bring our database up to a baseline level compared with other external scans, the next report will cover analysis of scanning of current events and is expected to be considerably shorter.
E1 Scanning The project is designed to integrate with scanning activities under way in within the Defra Partnership. The levels of formal scanning activity vary across the Partnership, but in each of the partner organisations there will be coverage of current developments. As the scale of this effort far exceeds the scanning hours that the SAMI team itself is commissioned to do, our first priority is to ensure that there are good and continuing linkages from these internal scanning activities into the Futurescaper database. Those who have not been trained in the use of Futurescaper will be invited to contribute links to stories in other ways. We also noted a number of areas where the database currently seemed to be less well developed and where we would want to add some explicit focus:
The gap analysis in A2.4 showed that there are relatively few stories relating to Consumer Protection, Marine and Plant Health, so we will look to address this.
Recognising it as a potential opportunity and a leading indicator, we will seek to monitor developments contributing to the emergence of the smart countryside – and its potential implications
We will seek to establish whether the apparent gap in connection between the Big Data and food security is simply an effect of the scanning to date, or whether it offers an area of opportunity.
Given the accelerating developments in biotechnology, we will seek to explore this area in more detail, including especially the topics of eDNA and metagenomics.
We will also look again at the mapping of our stories against Defra key issues and the AKF2013 themes (in Appendix C), and the contributions of our Expert Panel (Appendix D) to improve the coverage of the scanning. The subject topics suggested by the interviews will also be reviewed. We will be building up a set of regular sources for our scanning activities, but this will inevitably remain less specific than the sources used internally.
E2 Analysis We will again use the Futurescaper tool to explore the data in the database. We will be focussing initially on what has changed from this current report but will also report on the overall position. For the second report, once we have completed an initial review of the data and selected a number of issues of interest, we will seek the input of the Core Group and other clients to select those on which to focus. We will then use a range of futures thinking tools – eg futures wheels, causal layered analysis – to draw out ways in which the future might develop around these issues. We will be looking to identify more clearly the questions that emerge and their implications. So we will meet with the Core Group to discuss how to address this.
Horizon Scanning evidence and analysis report (1) – Issue 2 Prepared by SAMI Consulting 44
APPENDICES
Appendix A – project structure and methodology SAMI Consulting has been commissioned by Defra to undertake Horizon Scanning to provide strategic evidence of future change for the Defra Partnership17, for a three year period starting in December 2014. The project is managed by a Core Group of representatives from the five Partner organisations. This report is the first in a sequence of reports on the Horizon Scanning. Horizon Scanning is the “systematic examination of information to identify potential threats, risks, emerging issues and opportunities, beyond the Parliamentary term, allowing for better preparedness and the incorporation of mitigation and exploitation into the policy making process.” 18 Defra and its partners have used Horizon Scanning for a number of years, to help ensure that policies, strategies and delivery approaches are more robust, adaptable and resilient over time. The techniques enable the Partnership to anticipate and prepare for events that may happen in coming decades which are highly uncertain and/or beyond their control. This project follows on from one recently completed, managed by Cranfield University’s Institute for Environment, Health, Risks and Futures, and builds on the evidence base created by that project. The purpose of this project is to deliver foresight and insight to help Defra and its partners identify potential threats, risks and opportunities in order to achieve strategy, policy and operational goals. This project will also support futures capacity within the Defra Partnership and help develop the skills and knowledge required to use Horizon Scanning and futures techniques and to use the outputs to enhance strategy, policy and delivery. The project will be scanning for developments affecting each of the areas of interest to the Defra Partnership. There is already a considerable amount of scanning activity within the Partnership and experts in specific fields will be keeping abreast of developments in them as part of their normal work. So rather than duplicate this scanning specific to specialist areas within the broad Defra remit, the SAMI Consulting team will instead address new and emerging issues that are relevant across the Defra Partnership. The scale of the SAMI Consulting effort will be equivalent to approximately one FTE over the three years of the project. Each year SAMI Consulting will produce three reports on the Horizon Scanning (of which this is the first). In addition there will be one “Annual Synthesis” which will draw developments together and look to identify more fundamental Questions to consider. The Annual Synthesis activity will be supported by workshops involving the Core Group and other interested parties. INTERVIEWS In the project initiation phase, SAMI undertook a number of interviews across the Defra Partnership to understand better the requirements for this work and to ensure that the
17
Defra, Natural England, Environment Agency, Food Standards Agency, Welsh Government 18
Definition from Jon Day Review of cross-government horizon scanning
Horizon Scanning evidence and analysis report (1) – Issue 2 Prepared by SAMI Consulting 45
outputs better meet the needs of the intended audience. Interviewees were also asked for their perspectives of the future. The wide range of subject areas identified in the interviews was then used to help focus the scanning activity and inform the analysis. A common theme from the interviews was that the output should be useful rather than just interesting. This clearly requires close integration of the scanning activity with the policy, strategy and operational teams across the Partnership. Output from the interviews is recorded in another document. METHODOLOGY Scanning The Horizon Scanning is being carried out by three distinct groups:
The Defra Partnership itself: there are many existing scanning activities conducted within the partnership, though the degree of formality varies between the different organisations. The Partnership scanners will be covering the more specialist areas for input into the scanning database.
SAMI Consultants, who will focus on the broader PEST categories
Academics at Manchester University, who have been sub-contracted to provide focussed scanning on specific environmental issues.
The scanners have been trained in the use of the software tool, Futurescaper. This acts both as a store for the scanning and a means of analysing the interactions between the different “stories”, with advanced graphics supporting the development of insights. Each “story” contains links between the change identified and both causes and implications of the change. Together these interlink to form an ”influence map” of the overall system. The initial focus of the scanning activity has been on a range of pre-existing scans, in order to bring the database up to the current state of knowledge. This so-called “scan of scans” began with the Annual Key Factors 2013 report produced by Cranfield, and also covered:
Shaping Tomorrow, an extensive database of futures issues from which we selected those most relevant to the Defra Partnership: www.shapingtomorrow.com
EU Futurium, a set of preferred futures, which also describes trends and emerging issues of change: https://ec.europa.eu/futurium/en
iKnow, a collection of wild cards in addition to its emerging trends (“weak signals”) http://wiwe.iknowfutures.eu/scan/advanced/?scfly=occurrence#go-to-filter-top
European Environment Agency Global Megatrends Update: http://www.eea.europa.eu/soer-2015#tab-global-megatrends
United Nations Environment Program Global Environmental Outlook: http://www.unep.org/geo/pdfs/geo5/GEO5_report_full_en.pdf
Horizon scanning undertaken by SAMI Consulting on behalf of the Department of Transport.
Latterly, we have begun entering original scans from current sources, including both popular press, technical papers and other specialist sources. By March 16th the scanners had entered some 333 “stories”.
Horizon Scanning evidence and analysis report (1) – Issue 2 Prepared by SAMI Consulting 46
Analysis
SAMI Consultants used the Futurescaper analysis functionality to select the key issues to report on in this report. This was done in three distinct ways:
Big external drivers and effects of change: the factors that have the greatest number of effects and those that have the greatest number of causes.
Mapping the linkages around the top 10 stories (by frequency of relationships) and identifying a number of groupings of relationships. Four groups were selected and examined in more detail.
Additionally, SAMI consultants identified six emerging signals they felt were important or influential.
The results of these analyses are in Section B. A more detailed coverage of the data in Futurescaper is described according to Network Evidence Action Plan (NEAP) areas in Appendix B.
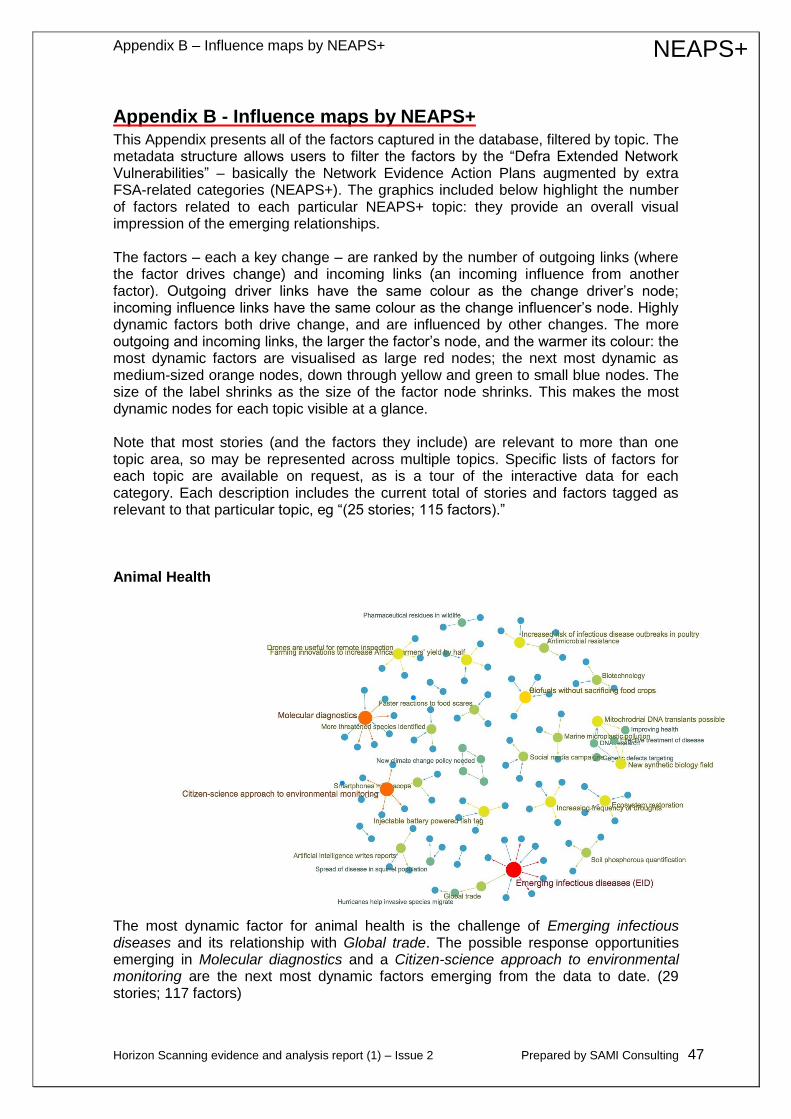
Appendix B – Influence maps by NEAPS+
Horizon Scanning evidence and analysis report (1) – Issue 2 Prepared by SAMI Consulting 47
NEAPS+
Appendix B - Influence maps by NEAPS+ This Appendix presents all of the factors captured in the database, filtered by topic. The metadata structure allows users to filter the factors by the “Defra Extended Network Vulnerabilities” – basically the Network Evidence Action Plans augmented by extra FSA-related categories (NEAPS+). The graphics included below highlight the number of factors related to each particular NEAPS+ topic: they provide an overall visual impression of the emerging relationships. The factors – each a key change – are ranked by the number of outgoing links (where the factor drives change) and incoming links (an incoming influence from another factor). Outgoing driver links have the same colour as the change driver’s node; incoming influence links have the same colour as the change influencer’s node. Highly dynamic factors both drive change, and are influenced by other changes. The more outgoing and incoming links, the larger the factor’s node, and the warmer its colour: the most dynamic factors are visualised as large red nodes; the next most dynamic as medium-sized orange nodes, down through yellow and green to small blue nodes. The size of the label shrinks as the size of the factor node shrinks. This makes the most dynamic nodes for each topic visible at a glance. Note that most stories (and the factors they include) are relevant to more than one topic area, so may be represented across multiple topics. Specific lists of factors for each topic are available on request, as is a tour of the interactive data for each category. Each description includes the current total of stories and factors tagged as relevant to that particular topic, eg “(25 stories; 115 factors).” Animal Health
The most dynamic factor for animal health is the challenge of Emerging infectious diseases and its relationship with Global trade. The possible response opportunities emerging in Molecular diagnostics and a Citizen-science approach to environmental monitoring are the next most dynamic factors emerging from the data to date. (29 stories; 117 factors)
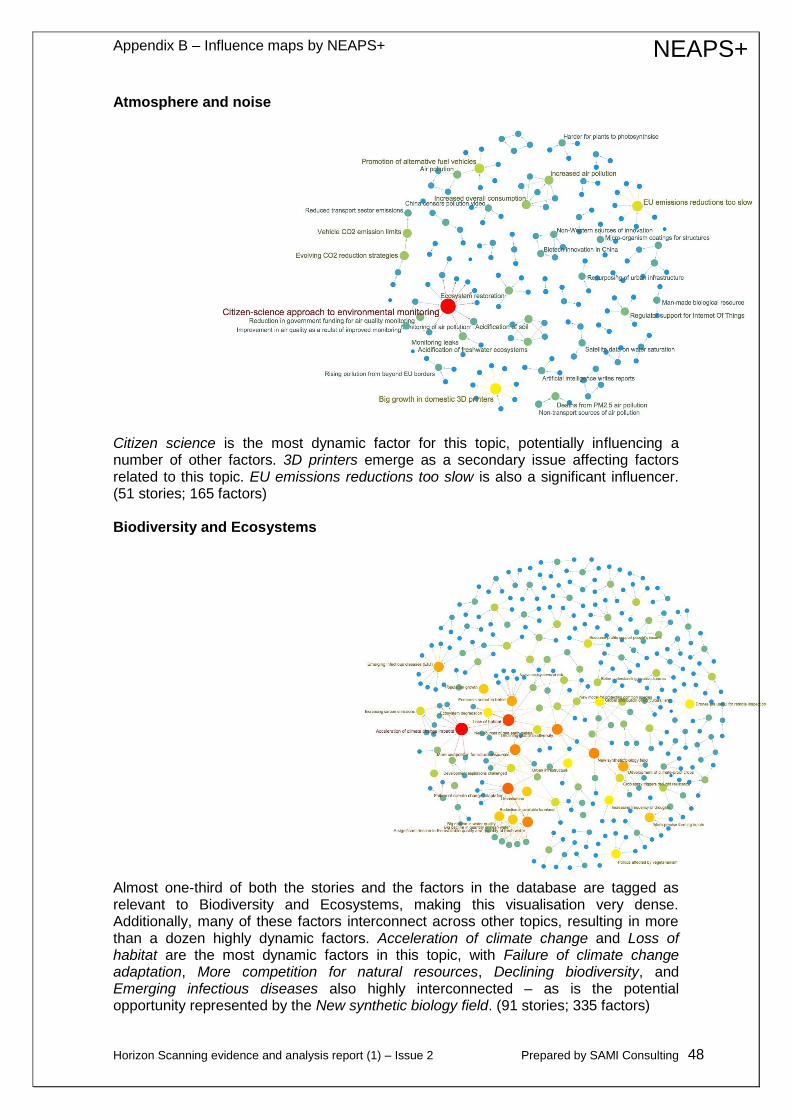
Appendix B – Influence maps by NEAPS+
Horizon Scanning evidence and analysis report (1) – Issue 2 Prepared by SAMI Consulting 48
NEAPS+
Atmosphere and noise
Citizen science is the most dynamic factor for this topic, potentially influencing a number of other factors. 3D printers emerge as a secondary issue affecting factors related to this topic. EU emissions reductions too slow is also a significant influencer. (51 stories; 165 factors) Biodiversity and Ecosystems
Almost one-third of both the stories and the factors in the database are tagged as relevant to Biodiversity and Ecosystems, making this visualisation very dense. Additionally, many of these factors interconnect across other topics, resulting in more than a dozen highly dynamic factors. Acceleration of climate change and Loss of habitat are the most dynamic factors in this topic, with Failure of climate change adaptation, More competition for natural resources, Declining biodiversity, and Emerging infectious diseases also highly interconnected – as is the potential opportunity represented by the New synthetic biology field. (91 stories; 335 factors)
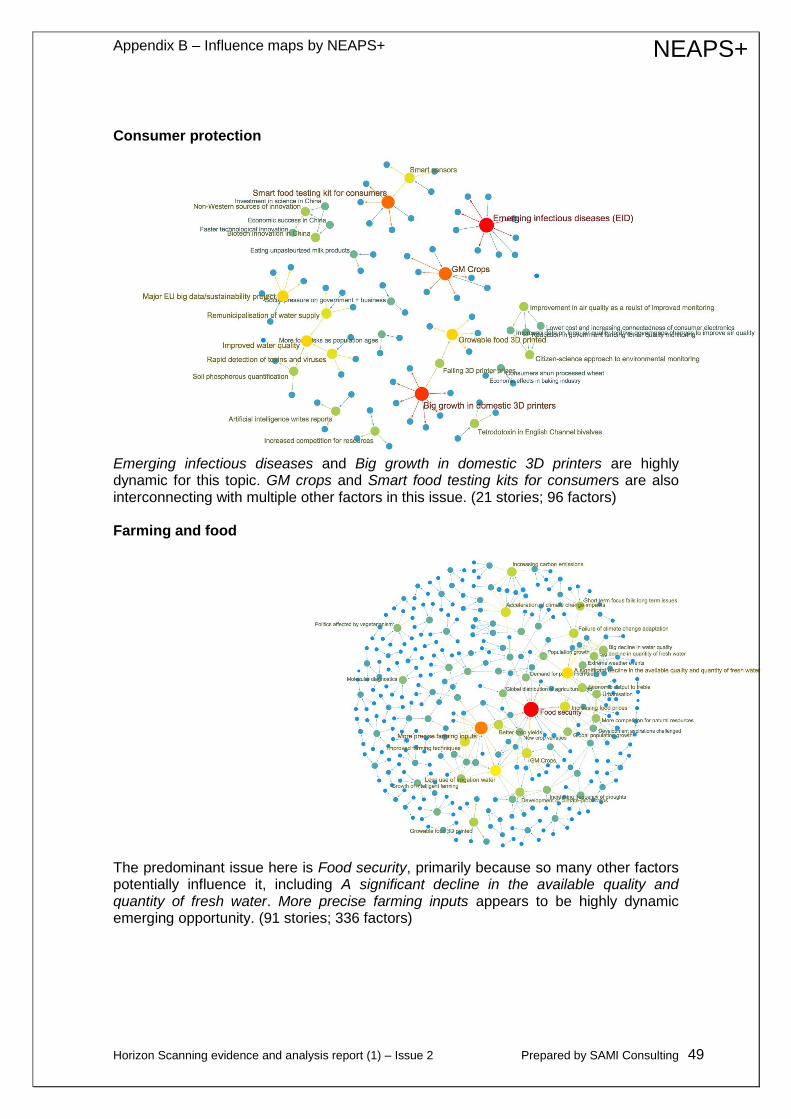
Appendix B – Influence maps by NEAPS+
Horizon Scanning evidence and analysis report (1) – Issue 2 Prepared by SAMI Consulting 49
NEAPS+
Consumer protection
Emerging infectious diseases and Big growth in domestic 3D printers are highly dynamic for this topic. GM crops and Smart food testing kits for consumers are also interconnecting with multiple other factors in this issue. (21 stories; 96 factors) Farming and food
The predominant issue here is Food security, primarily because so many other factors potentially influence it, including A significant decline in the available quality and quantity of fresh water. More precise farming inputs appears to be highly dynamic emerging opportunity. (91 stories; 336 factors)
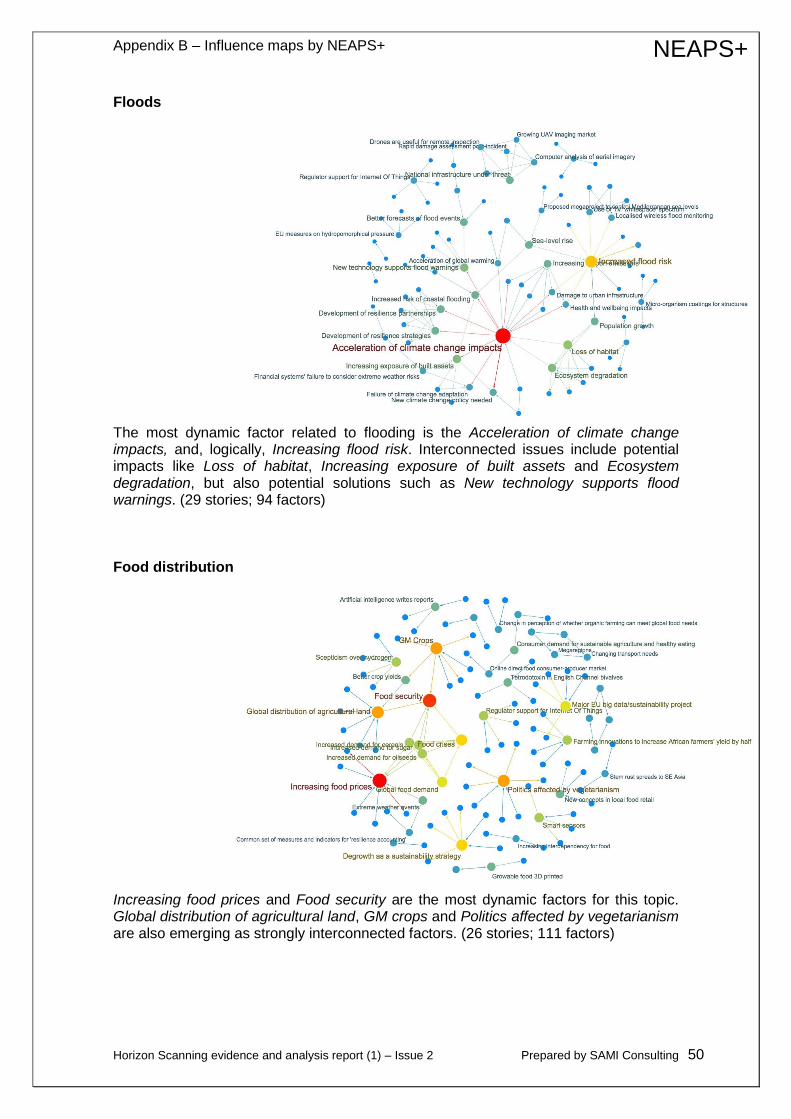
Appendix B – Influence maps by NEAPS+
Horizon Scanning evidence and analysis report (1) – Issue 2 Prepared by SAMI Consulting 50
NEAPS+
Floods
The most dynamic factor related to flooding is the Acceleration of climate change impacts, and, logically, Increasing flood risk. Interconnected issues include potential impacts like Loss of habitat, Increasing exposure of built assets and Ecosystem degradation, but also potential solutions such as New technology supports flood warnings. (29 stories; 94 factors) Food distribution
Increasing food prices and Food security are the most dynamic factors for this topic. Global distribution of agricultural land, GM crops and Politics affected by vegetarianism are also emerging as strongly interconnected factors. (26 stories; 111 factors)
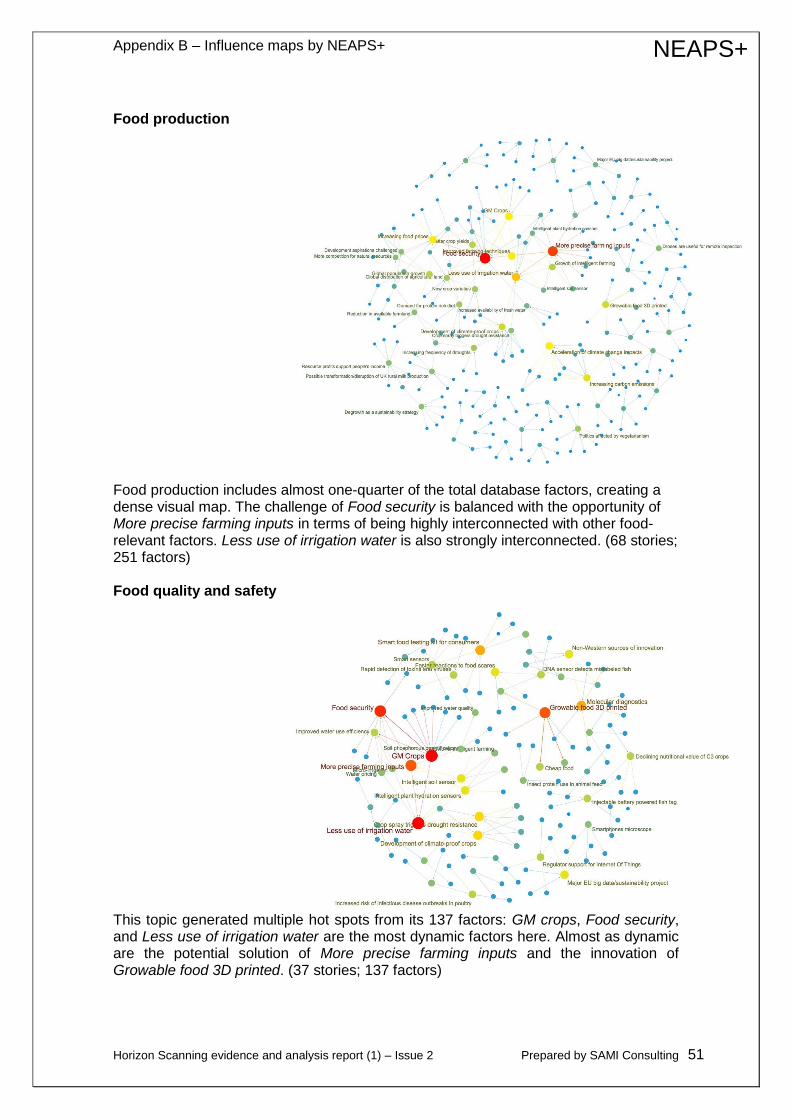
Appendix B – Influence maps by NEAPS+
Horizon Scanning evidence and analysis report (1) – Issue 2 Prepared by SAMI Consulting 51
NEAPS+
Food production
Food production includes almost one-quarter of the total database factors, creating a dense visual map. The challenge of Food security is balanced with the opportunity of More precise farming inputs in terms of being highly interconnected with other food-relevant factors. Less use of irrigation water is also strongly interconnected. (68 stories; 251 factors) Food quality and safety
This topic generated multiple hot spots from its 137 factors: GM crops, Food security, and Less use of irrigation water are the most dynamic factors here. Almost as dynamic are the potential solution of More precise farming inputs and the innovation of Growable food 3D printed. (37 stories; 137 factors)
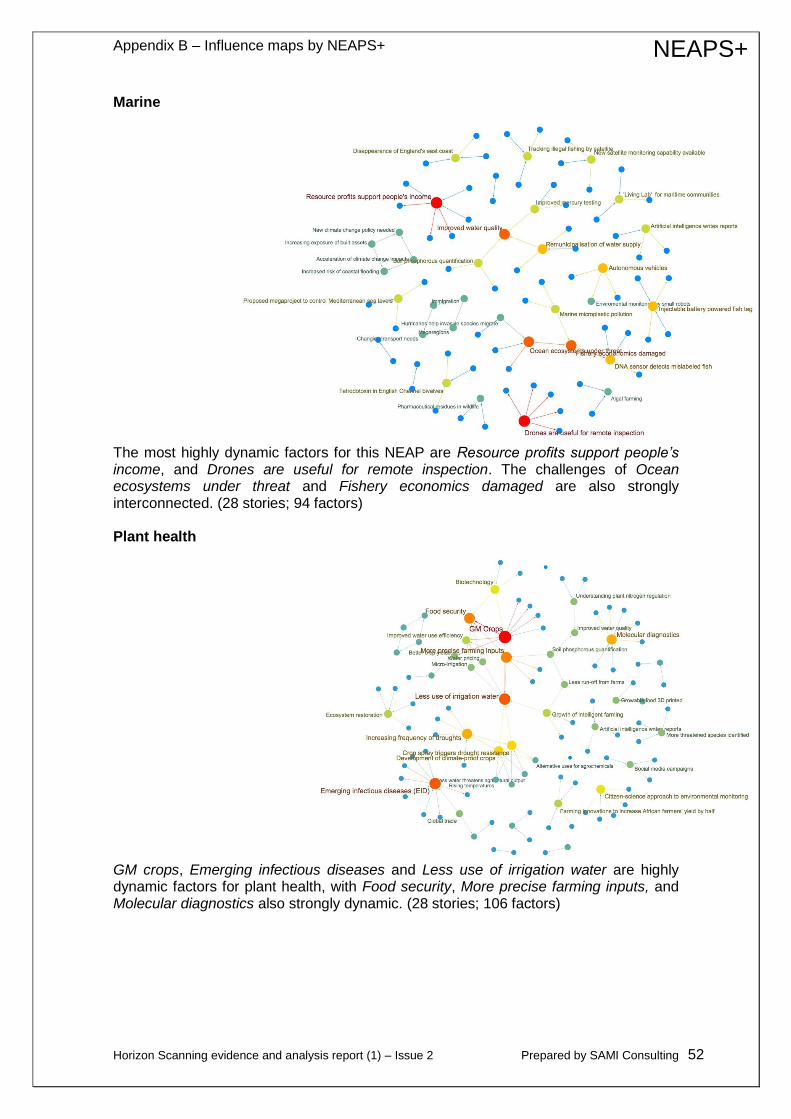
Appendix B – Influence maps by NEAPS+
Horizon Scanning evidence and analysis report (1) – Issue 2 Prepared by SAMI Consulting 52
NEAPS+
Marine
The most highly dynamic factors for this NEAP are Resource profits support people’s income, and Drones are useful for remote inspection. The challenges of Ocean ecosystems under threat and Fishery economics damaged are also strongly interconnected. (28 stories; 94 factors) Plant health
GM crops, Emerging infectious diseases and Less use of irrigation water are highly dynamic factors for plant health, with Food security, More precise farming inputs, and Molecular diagnostics also strongly dynamic. (28 stories; 106 factors)
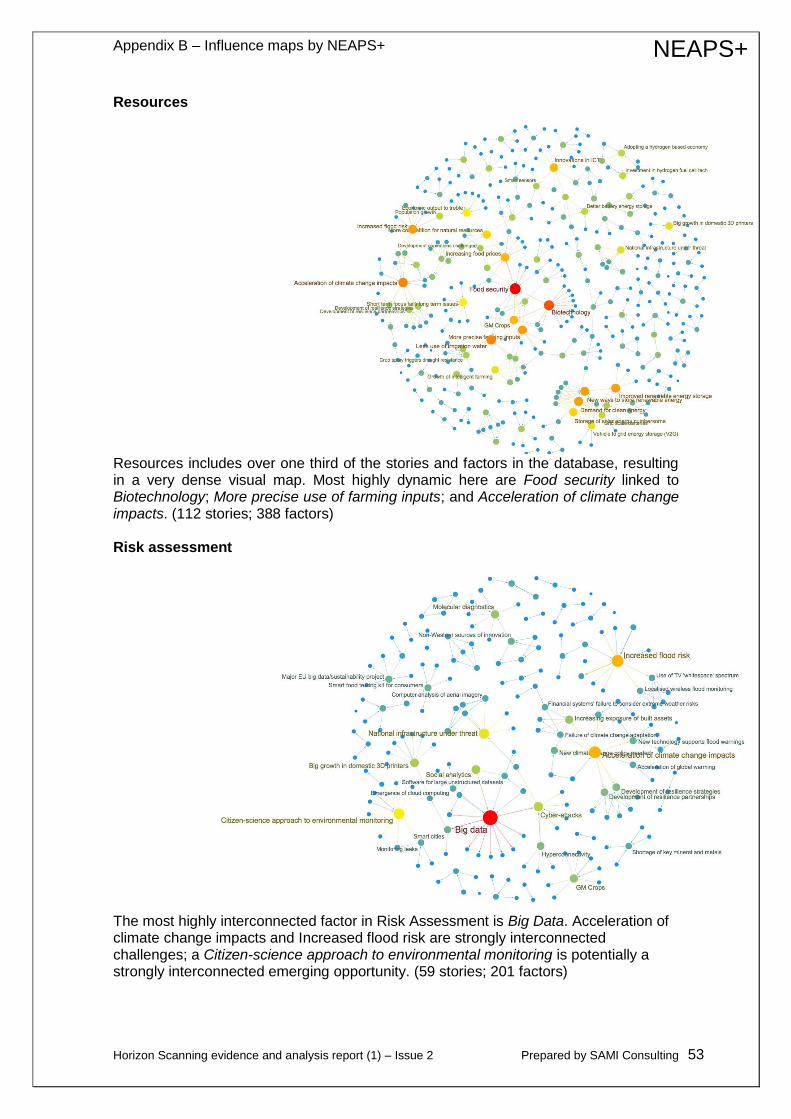
Appendix B – Influence maps by NEAPS+
Horizon Scanning evidence and analysis report (1) – Issue 2 Prepared by SAMI Consulting 53
NEAPS+
Resources
Resources includes over one third of the stories and factors in the database, resulting in a very dense visual map. Most highly dynamic here are Food security linked to Biotechnology; More precise use of farming inputs; and Acceleration of climate change impacts. (112 stories; 388 factors) Risk assessment
The most highly interconnected factor in Risk Assessment is Big Data. Acceleration of climate change impacts and Increased flood risk are strongly interconnected challenges; a Citizen-science approach to environmental monitoring is potentially a strongly interconnected emerging opportunity. (59 stories; 201 factors)
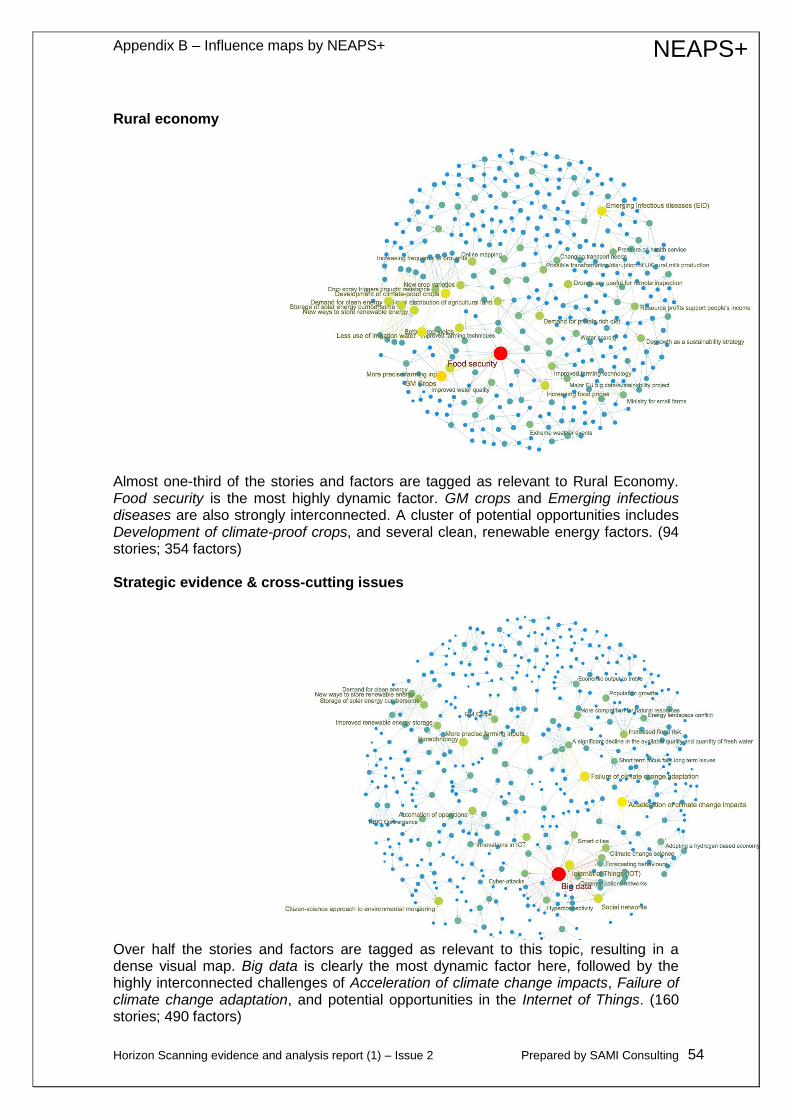
Appendix B – Influence maps by NEAPS+
Horizon Scanning evidence and analysis report (1) – Issue 2 Prepared by SAMI Consulting 54
NEAPS+
Rural economy
Almost one-third of the stories and factors are tagged as relevant to Rural Economy. Food security is the most highly dynamic factor. GM crops and Emerging infectious diseases are also strongly interconnected. A cluster of potential opportunities includes Development of climate-proof crops, and several clean, renewable energy factors. (94 stories; 354 factors) Strategic evidence & cross-cutting issues
Over half the stories and factors are tagged as relevant to this topic, resulting in a dense visual map. Big data is clearly the most dynamic factor here, followed by the highly interconnected challenges of Acceleration of climate change impacts, Failure of climate change adaptation, and potential opportunities in the Internet of Things. (160 stories; 490 factors)
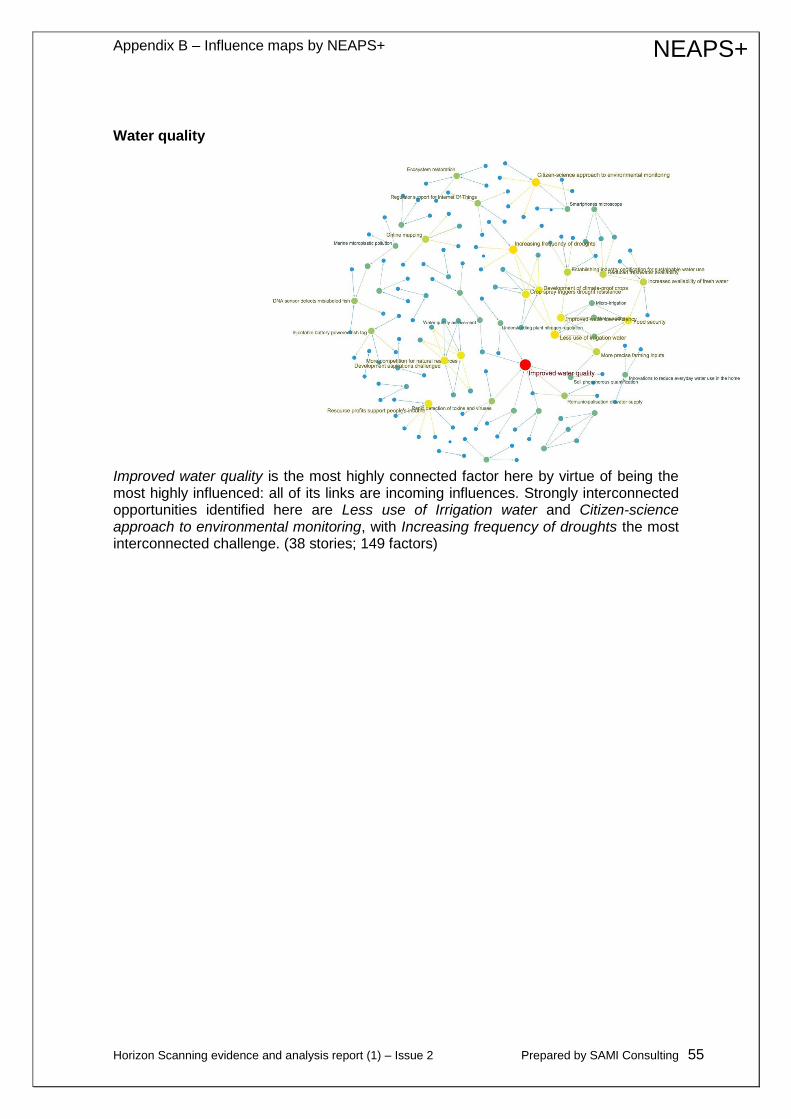
Appendix B – Influence maps by NEAPS+
Horizon Scanning evidence and analysis report (1) – Issue 2 Prepared by SAMI Consulting 55
NEAPS+
Water quality
Improved water quality is the most highly connected factor here by virtue of being the most highly influenced: all of its links are incoming influences. Strongly interconnected opportunities identified here are Less use of Irrigation water and Citizen-science approach to environmental monitoring, with Increasing frequency of droughts the most interconnected challenge. (38 stories; 149 factors)

Horizon Scanning evidence and analysis report (1) – Issue 2 Prepared by SAMI Consulting 56
Appendix C - Comparative table of issues/NEAPS, Cranfield 2013 key factors, our stories and
Appendix D – Expert Panel comments are published separately.


![Horizon Scanning in Government[1]](https://img.pdfslide.us/doc/110x75/5527edc94a7959d83d8b45a1/horizon-scanning-in-government1.jpg)