Embed Size (px)
Citation preview
Strategic Capital Budgeting
Planning for the future, playing the long game
Bob Broyden
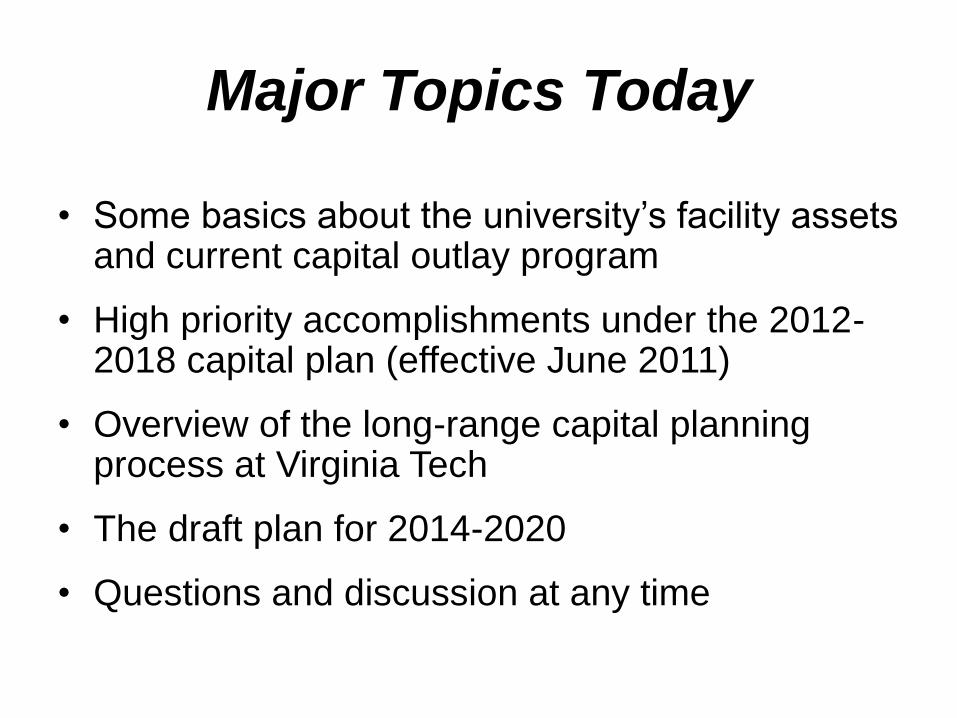
Major Topics Today
• Some basics about the university’s facility assets and current capital outlay program
• High priority accomplishments under the 2012-2018 capital plan (effective June 2011)
• Overview of the long-range capital planning process at Virginia Tech
• The draft plan for 2014-2020
• Questions and discussion at any time

Before thinking about what we need, we take stock of what we have and
how well that positions the university for the future

University’s Facility Inventory (owned buildings)
• Total number of buildings 461
• Total amount of square feet ~10 million
• Average Age 42
• Buildings over 20 years 347
• Buildings over 50 years 183
• Average FCI 30%

Owned, Major Buildings
• Total number of buildings 160
• Total amount of square feet ~9 million
• Average Age 41
• Buildings over 20 years 104
• Buildings over 50 years 53
• Average FCI 30%
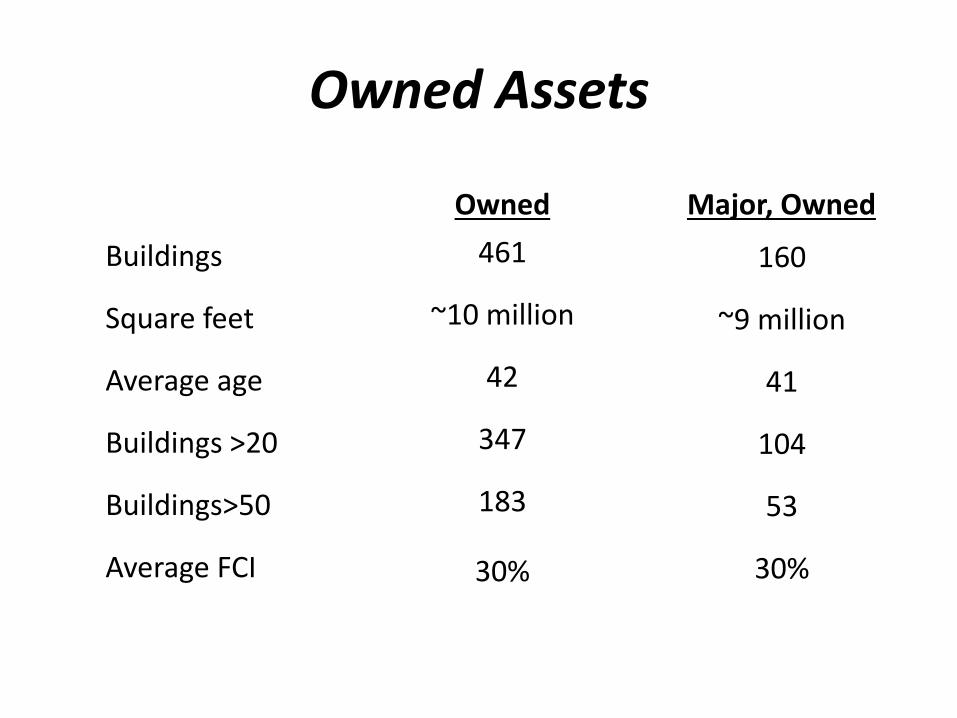
Owned Assets
Owned
461
~10 million
42
347
183
30%
Major, Owned
160
~9 million
41
104
53
30%
Buildings
Square feet
Average age
Buildings >20
Buildings>50
Average FCI
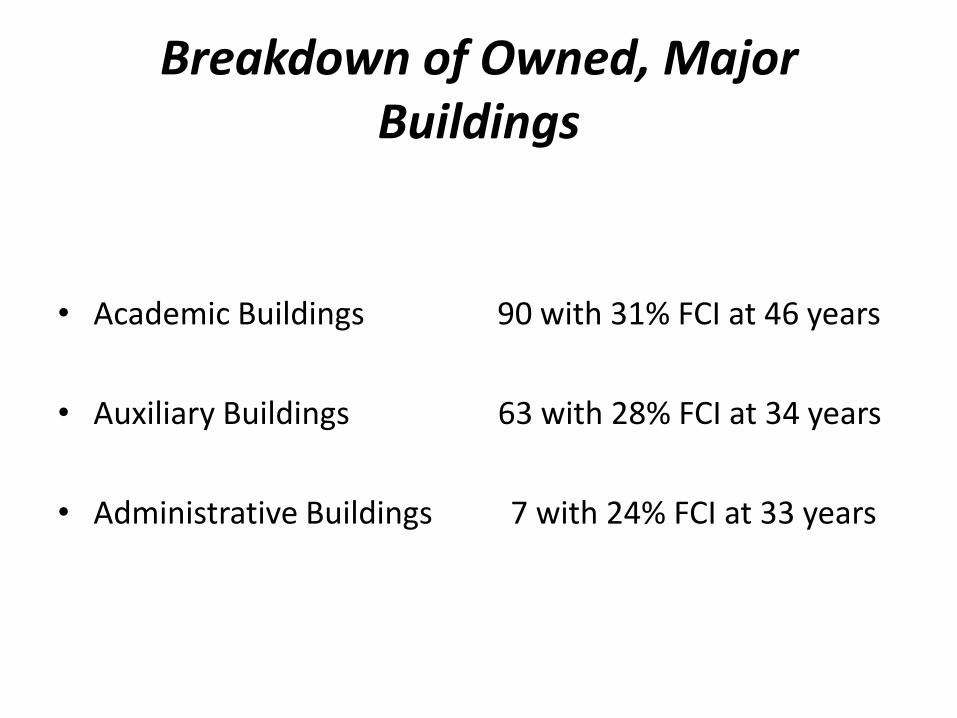
Breakdown of Owned, Major Buildings
• Academic Buildings 90 with 31% FCI at 46 years
• Auxiliary Buildings 63 with 28% FCI at 34 years
• Administrative Buildings 7 with 24% FCI at 33 years
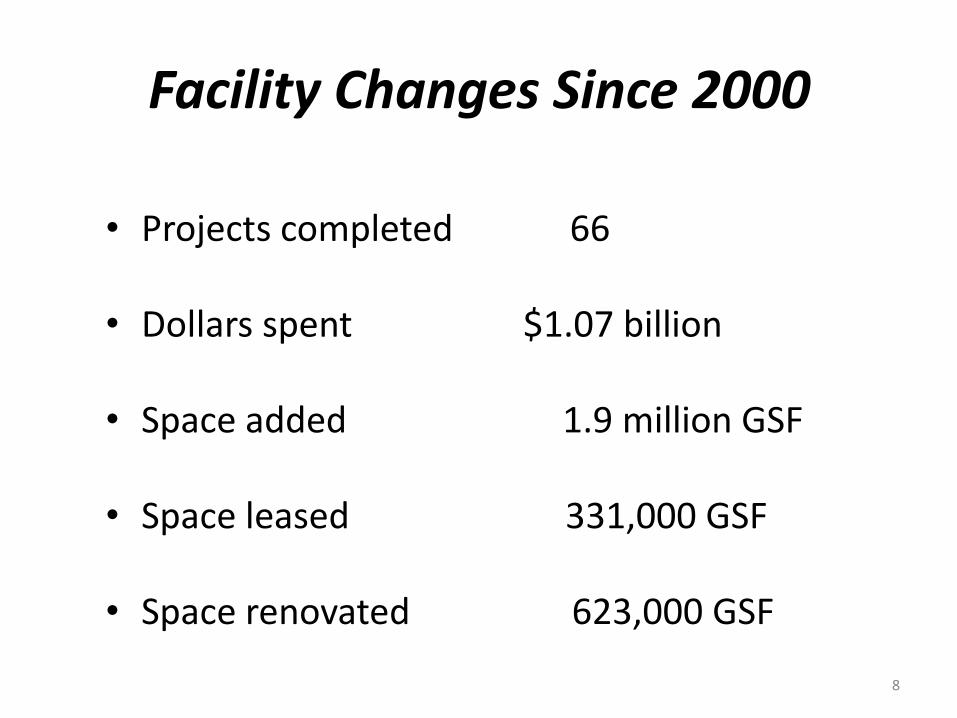
Facility Changes Since 2000
• Projects completed 66
• Dollars spent $1.07 billion
• Space added 1.9 million GSF • Space leased 331,000 GSF • Space renovated 623,000 GSF
8

9
$-
$20,000
$40,000
$60,000
$80,000
$100,000
$120,000
$140,000
$160,000
$180,000
2001 2002 2003 2004 2005 2006 2007 2008 2009 2010 2011 2012
$'s
in T
ho
usa
nd
s All Capital Projects
Trend of Expenditures by Fund Source for Fiscal Years 2001-2012 General Fund Nongeneral Fund Total
High priority accomplishments under the
2012-2018 Capital Plan
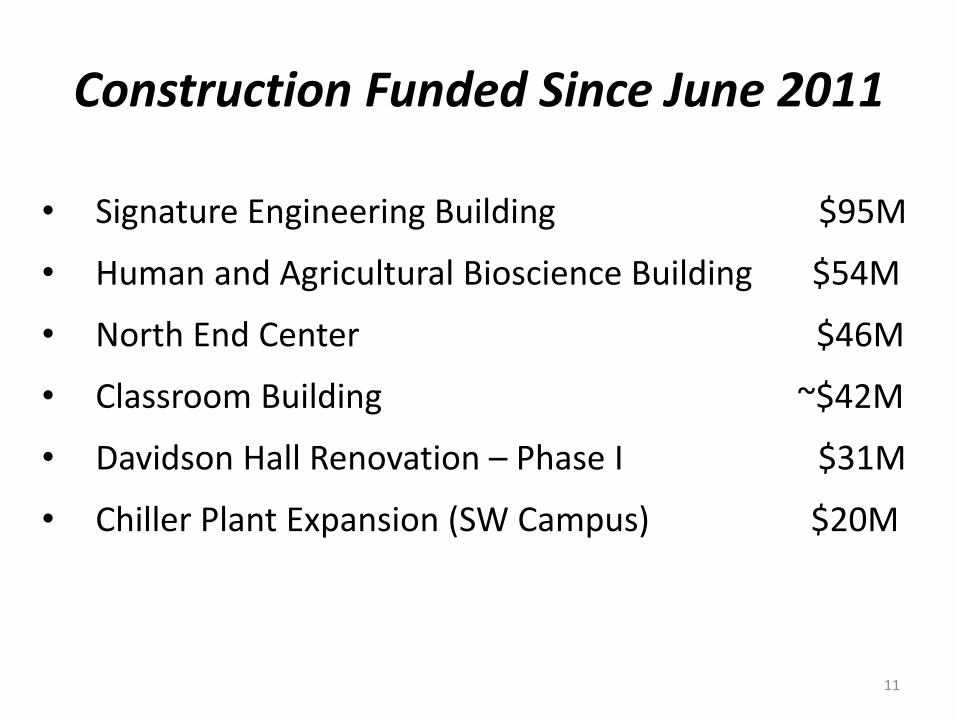
Construction Funded Since June 2011
• Signature Engineering Building $95M
• Human and Agricultural Bioscience Building $54M
• North End Center $46M
• Classroom Building ~$42M
• Davidson Hall Renovation – Phase I $31M
• Chiller Plant Expansion (SW Campus) $20M
11
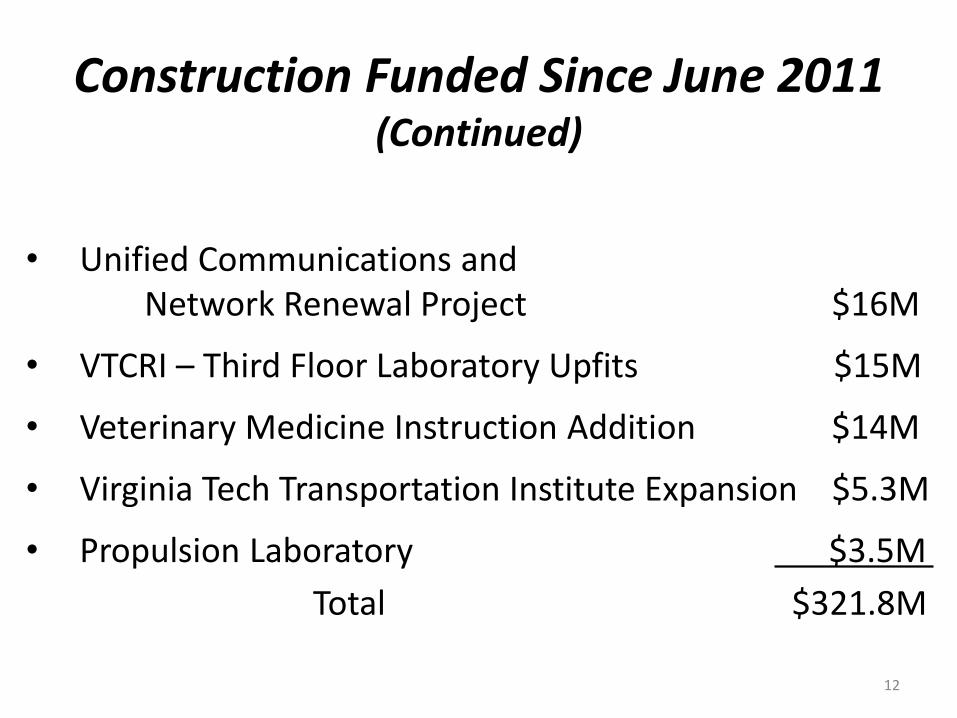
Construction Funded Since June 2011 (Continued)
• Unified Communications and Network Renewal Project $16M
• VTCRI – Third Floor Laboratory Upfits $15M
• Veterinary Medicine Instruction Addition $14M
• Virginia Tech Transportation Institute Expansion $5.3M
• Propulsion Laboratory $3.5M
Total $321.8M
12
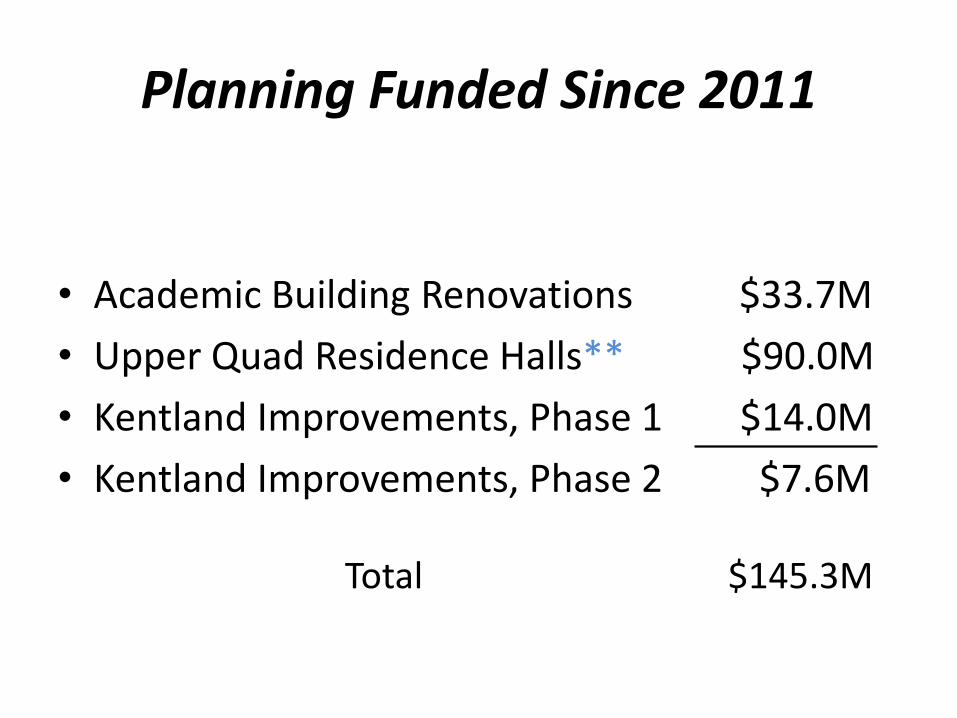
Planning Funded Since 2011
• Academic Building Renovations $33.7M
• Upper Quad Residence Halls** $90.0M
• Kentland Improvements, Phase 1 $14.0M
• Kentland Improvements, Phase 2 $7.6M Total $145.3M
Overview of the long-range
capital planning process at
Virginia Tech
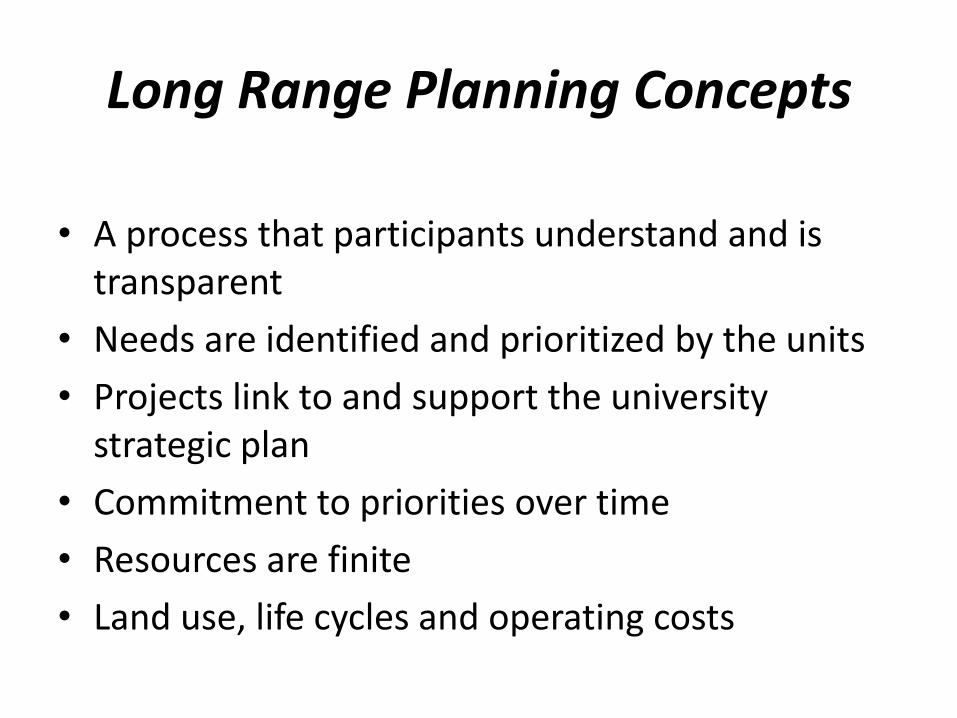
Long Range Planning Concepts
• A process that participants understand and is transparent
• Needs are identified and prioritized by the units
• Projects link to and support the university strategic plan
• Commitment to priorities over time
• Resources are finite
• Land use, life cycles and operating costs
Draft capital outlay plan for
2014-2020
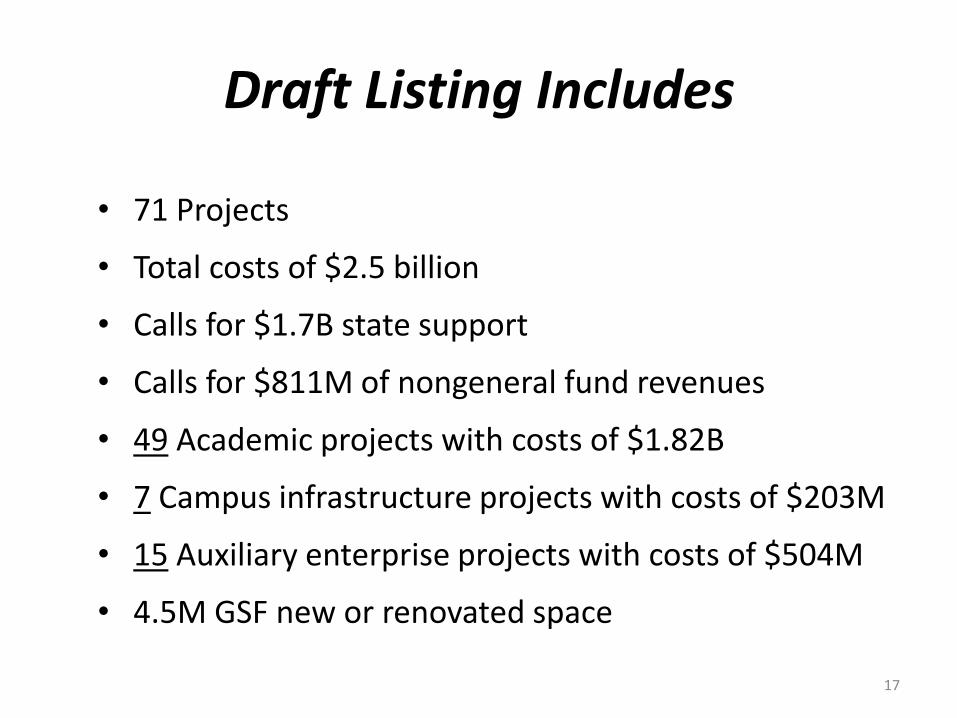
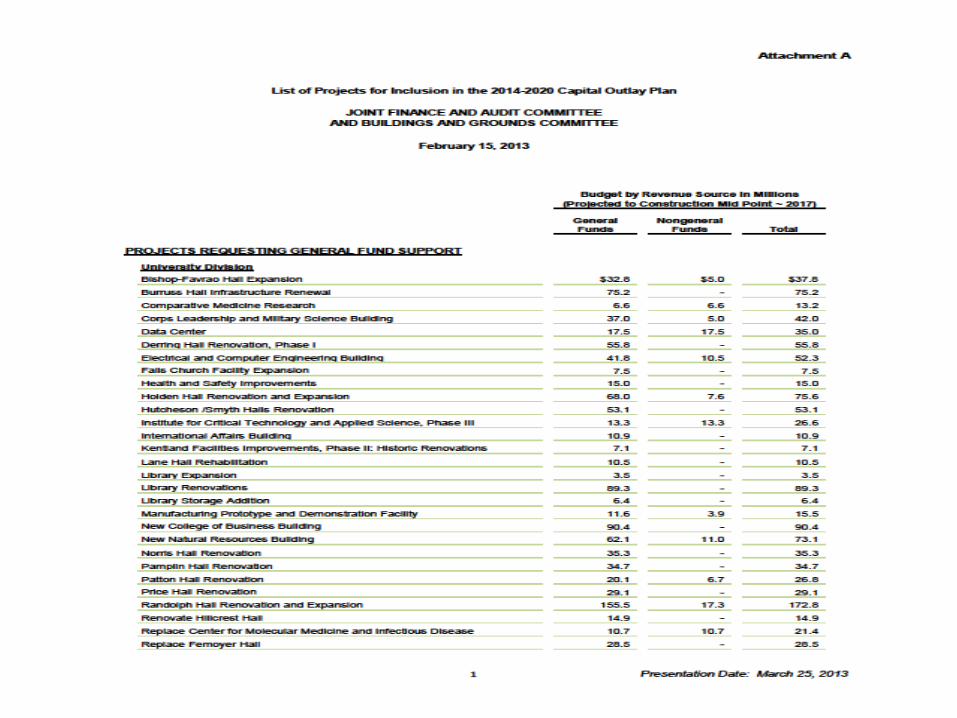
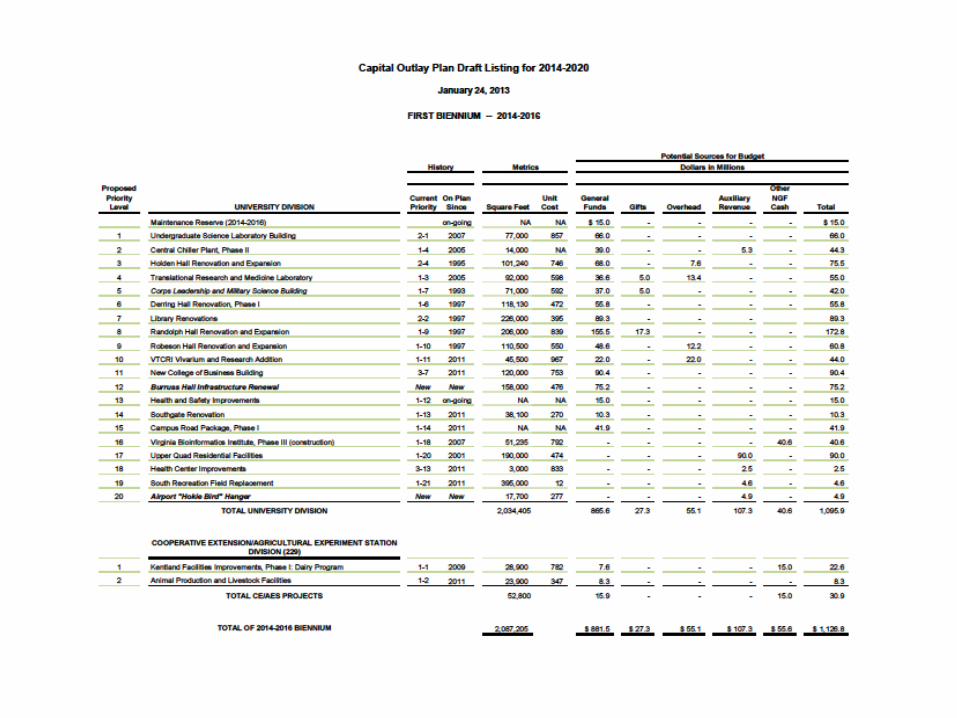
Draft Listing Includes
• 71 Projects
• Total costs of $2.5 billion
• Calls for $1.7B state support
• Calls for $811M of nongeneral fund revenues
• 49 Academic projects with costs of $1.82B
• 7 Campus infrastructure projects with costs of $203M
• 15 Auxiliary enterprise projects with costs of $504M
• 4.5M GSF new or renovated space
17

Thank You
20

Backup Slides
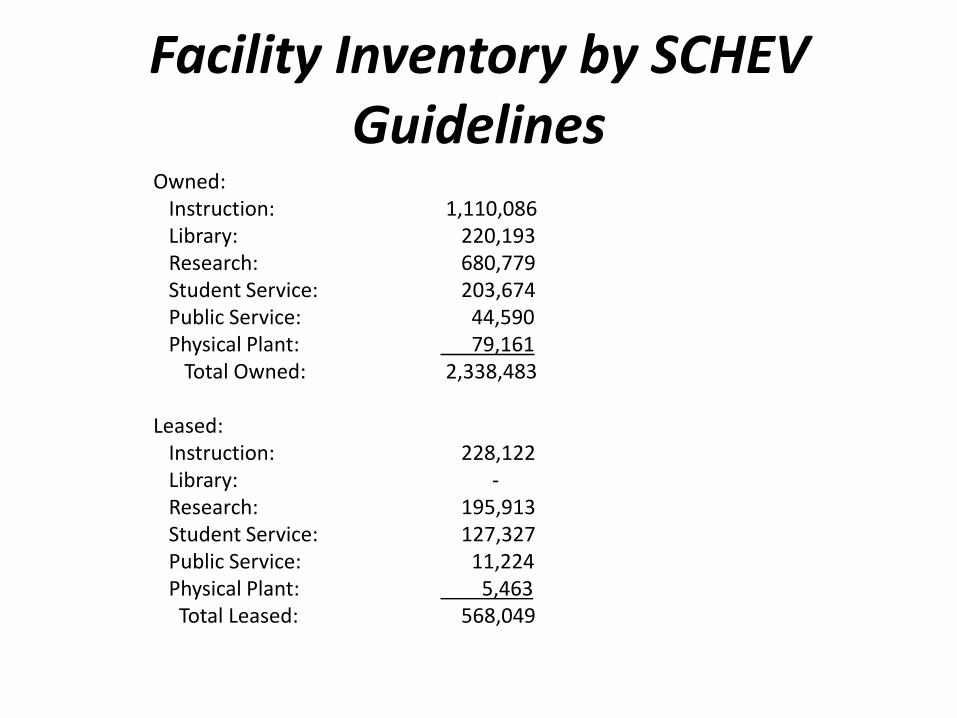
Facility Inventory by SCHEV Guidelines
Owned: Instruction: 1,110,086 Library: 220,193 Research: 680,779 Student Service: 203,674 Public Service: 44,590 Physical Plant: 79,161 Total Owned: 2,338,483 Leased: Instruction: 228,122 Library: - Research: 195,913 Student Service: 127,327 Public Service: 11,224 Physical Plant: 5,463 Total Leased: 568,049
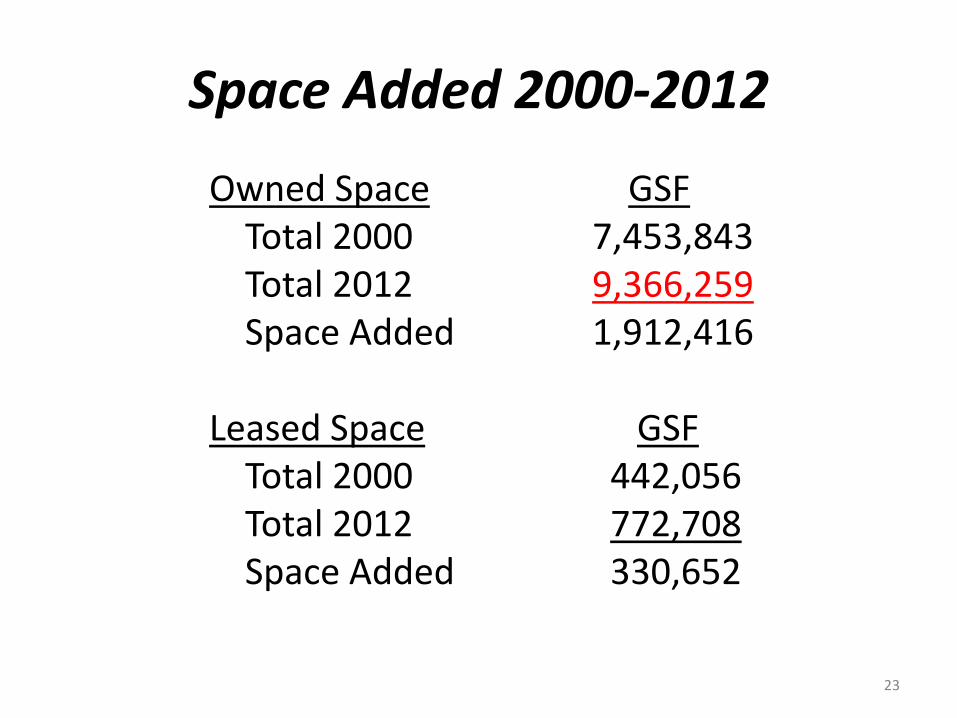
Space Added 2000-2012
Owned Space GSF Total 2000 7,453,843 Total 2012 9,366,259 Space Added 1,912,416
Leased Space GSF Total 2000 442,056 Total 2012 772,708 Space Added 330,652
23
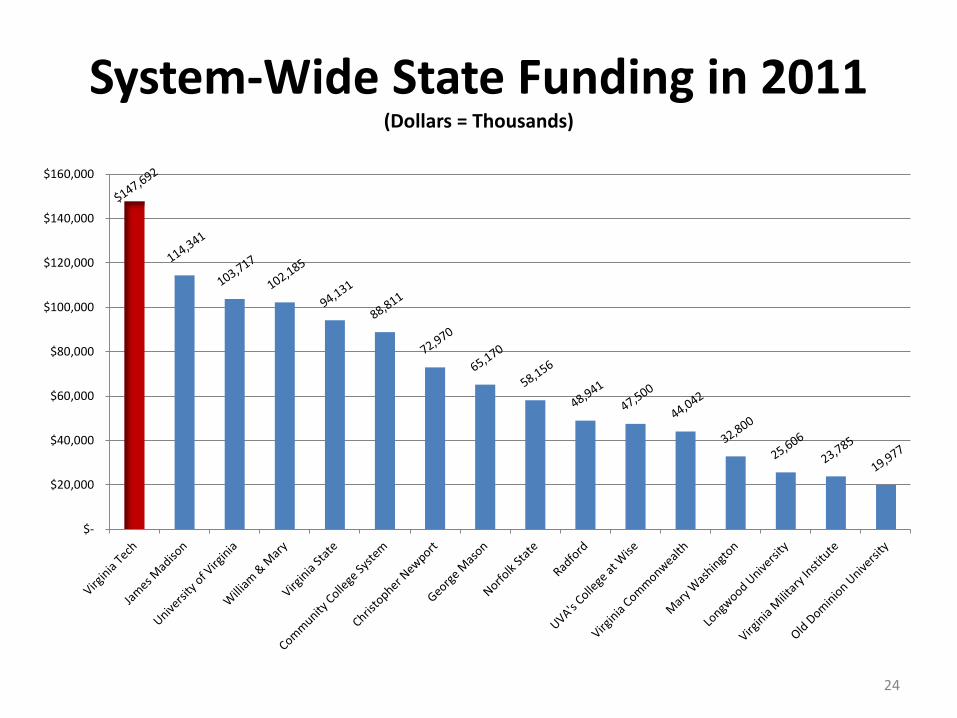
System-Wide State Funding in 2011 (Dollars = Thousands)
24
$-
$20,000
$40,000
$60,000
$80,000
$100,000
$120,000
$140,000
$160,000
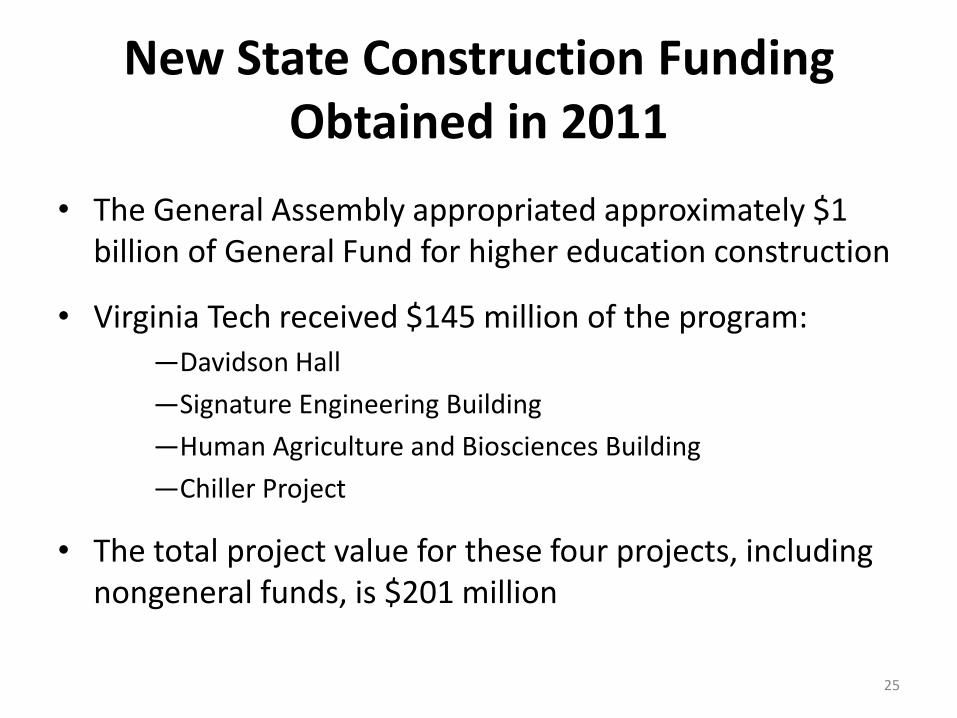
New State Construction Funding Obtained in 2011
• The General Assembly appropriated approximately $1 billion of General Fund for higher education construction
• Virginia Tech received $145 million of the program:
—Davidson Hall
—Signature Engineering Building
—Human Agriculture and Biosciences Building
—Chiller Project
• The total project value for these four projects, including nongeneral funds, is $201 million
25
State Funding University Actions to Position Projects
• University representatives work with Executives and Legislative Branch representation, including members of the Six-Year Capital Outlay Advisory Committee, about university projects
• The President meets with members of the legislature to discuss priorities
• Goals: – Ensure that the state recognizes and addresses the
university’s highest priority projects – Ensure the university receives historical share of funding
from the state
26
General Fund
• For projects listed in the state capital plan
• Pay as you go – utilized when General Fund resources are adequate (not so much recently)
• Debt issues – utilized when General Fund resources are not sufficient
– State has specific guidelines addressing annual debt limitations, 5 percent ratio in support of its AAA bond rating
– Stated priority for specific types of capital projects
• State capital outlay for non-transportation -- debt allocation generally limited to $250-$350 million annually, based on long-range projections
• VT obtained about $520M since 2000, consistently one of the top allocations for the period
• State funding has not followed a consistent/predictable pattern 27
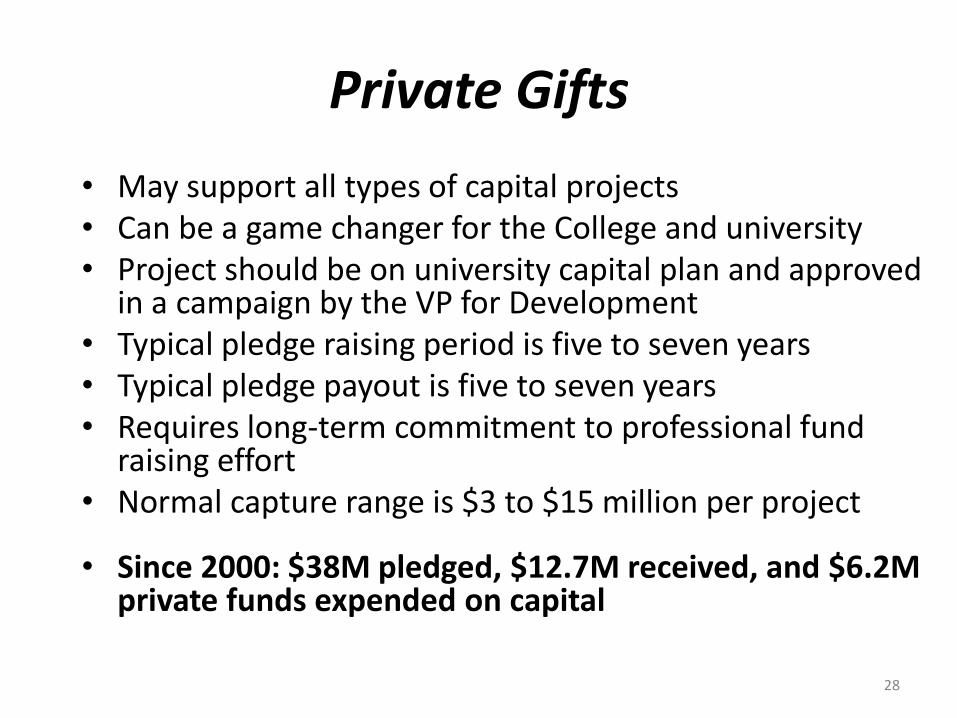
Private Gifts
• May support all types of capital projects • Can be a game changer for the College and university • Project should be on university capital plan and approved
in a campaign by the VP for Development • Typical pledge raising period is five to seven years • Typical pledge payout is five to seven years • Requires long-term commitment to professional fund
raising effort • Normal capture range is $3 to $15 million per project
• Since 2000: $38M pledged, $12.7M received, and $6.2M private funds expended on capital
28
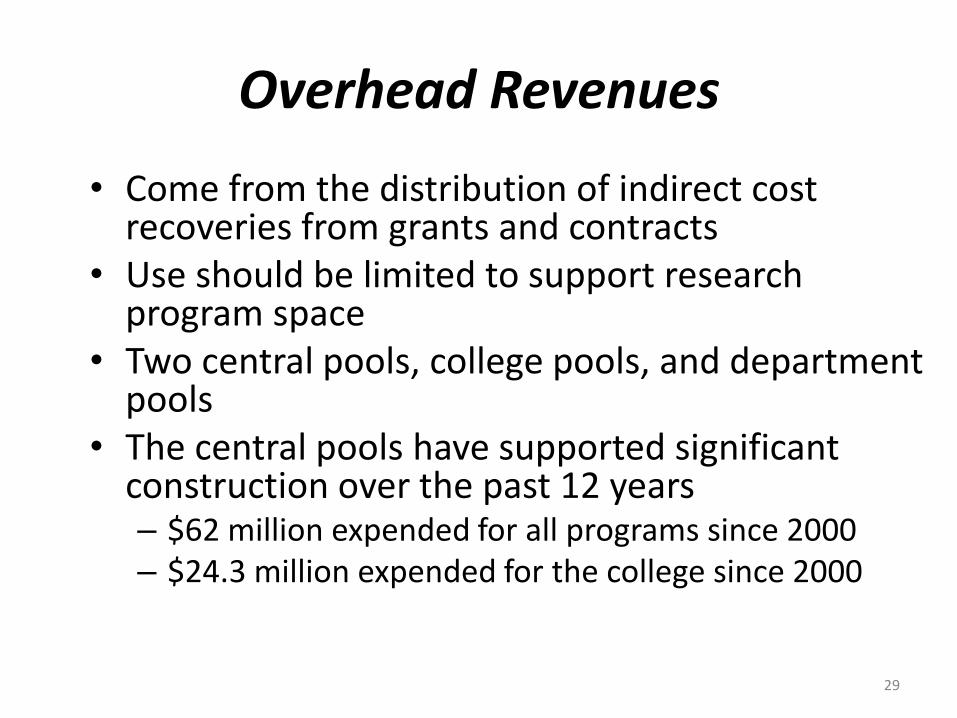
Overhead Revenues
• Come from the distribution of indirect cost recoveries from grants and contracts
• Use should be limited to support research program space
• Two central pools, college pools, and department pools
• The central pools have supported significant construction over the past 12 years – $62 million expended for all programs since 2000 – $24.3 million expended for the college since 2000
29

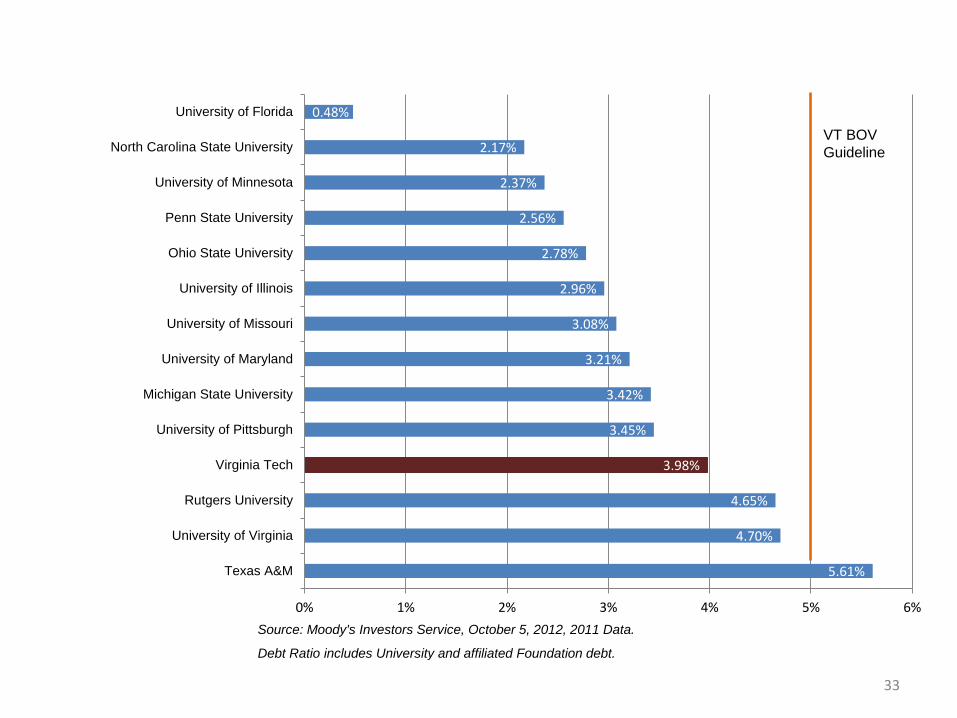
University Debt Capacity
• Debt is an important financial tool to support the large costs of projects
• Board approved debt ratio guideline of 5 percent in support of maintaining at least a AA- bond rating
• University debt ratio as of June 30, 2011 was 3.44 percent
• Projected ratio, including approved capital projects, anticipates reaching 4.99 percent in FY2015
• Debt capacity, as influenced by projected rate of expenditure growth, is limited through FY2016
• Funding debt service restricts future revenues
30
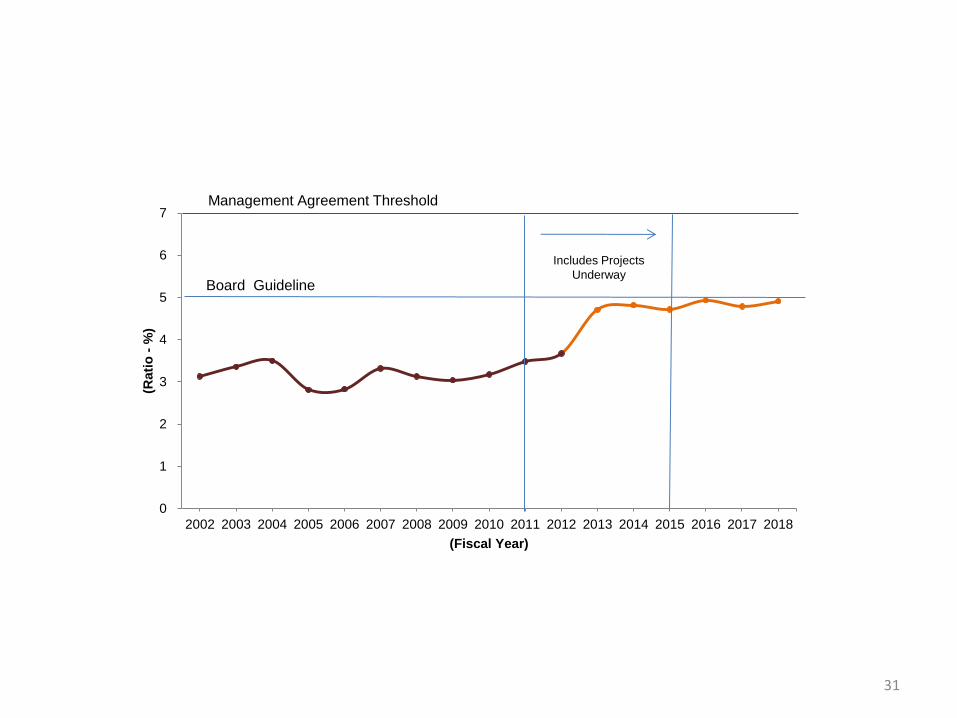
31
0
1
2
3
4
5
6
7
2002 2003 2004 2005 2006 2007 2008 2009 2010 2011 2012 2013 2014 2015 2016 2017 2018
(Rati
o -
%)
(Fiscal Year)
Includes Projects
Underway Board Guideline
Management Agreement Threshold
32
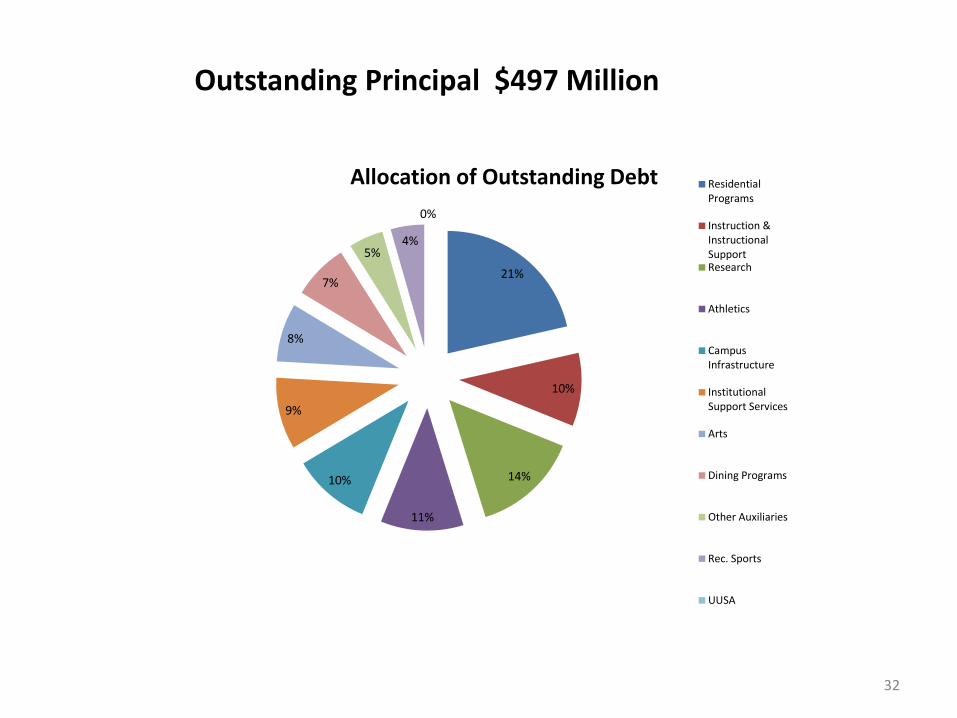
21%
10%
14%
11%
10%
9%
8%
7%
5% 4%
0%
Allocation of Outstanding Debt ResidentialPrograms
Instruction &InstructionalSupportResearch
Athletics
CampusInfrastructure
InstitutionalSupport Services
Arts
Dining Programs
Other Auxiliaries
Rec. Sports
UUSA
Outstanding Principal $497 Million
33
5.61%
4.70%
4.65%
3.98%
3.45%
3.42%
3.21%
3.08%
2.96%
2.78%
2.56%
2.37%
2.17%
0.48%
0% 1% 2% 3% 4% 5% 6%
Texas A&M
University of Virginia
Rutgers University
Virginia Tech
University of Pittsburgh
Michigan State University
University of Maryland
University of Missouri
University of Illinois
Ohio State University
Penn State University
University of Minnesota
North Carolina State University
University of Florida
VT BOV
Guideline
Source: Moody's Investors Service, October 5, 2012, 2011 Data.
Debt Ratio includes University and affiliated Foundation debt.
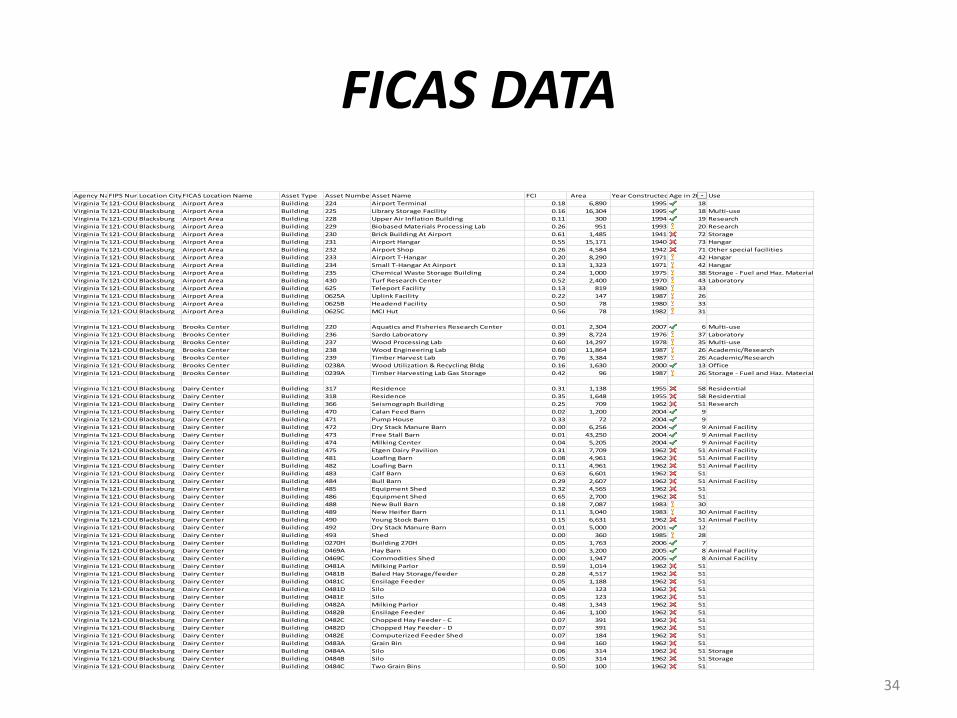
FICAS DATA
34
Agency NameFIPS Number *Location CityFICAS Location Name Asset Type Asset NumberAsset Name FCI Area Year ConstructedAge in 2013Use
Virginia Tech121-COUNTY OF MONTGOMERYBlacksburg Airport Area Building 224 Airport Terminal 0.18 6,890 1995 18
Virginia Tech121-COUNTY OF MONTGOMERYBlacksburg Airport Area Building 225 Library Storage Facility 0.16 16,304 1995 18 Multi-use
Virginia Tech121-COUNTY OF MONTGOMERYBlacksburg Airport Area Building 228 Upper Air Inflation Building 0.11 300 1994 19 Research
Virginia Tech121-COUNTY OF MONTGOMERYBlacksburg Airport Area Building 229 Biobased Materials Processing Lab 0.26 951 1993 20 Research
Virginia Tech121-COUNTY OF MONTGOMERYBlacksburg Airport Area Building 230 Brick Building At Airport 0.61 1,485 1941 72 Storage
Virginia Tech121-COUNTY OF MONTGOMERYBlacksburg Airport Area Building 231 Airport Hangar 0.55 15,171 1940 73 Hangar
Virginia Tech121-COUNTY OF MONTGOMERYBlacksburg Airport Area Building 232 Airport Shop 0.26 4,584 1942 71 Other special facilities
Virginia Tech121-COUNTY OF MONTGOMERYBlacksburg Airport Area Building 233 Airport T-Hangar 0.20 8,290 1971 42 Hangar
Virginia Tech121-COUNTY OF MONTGOMERYBlacksburg Airport Area Building 234 Small T-Hangar At Airport 0.13 1,323 1971 42 Hangar
Virginia Tech121-COUNTY OF MONTGOMERYBlacksburg Airport Area Building 235 Chemical Waste Storage Building 0.24 1,000 1975 38 Storage - Fuel and Haz. Materials
Virginia Tech121-COUNTY OF MONTGOMERYBlacksburg Airport Area Building 430 Turf Research Center 0.52 2,400 1970 43 Laboratory
Virginia Tech121-COUNTY OF MONTGOMERYBlacksburg Airport Area Building 625 Teleport Facility 0.13 819 1980 33
Virginia Tech121-COUNTY OF MONTGOMERYBlacksburg Airport Area Building 0625A Uplink Facility 0.22 147 1987 26
Virginia Tech121-COUNTY OF MONTGOMERYBlacksburg Airport Area Building 0625B Headend Facility 0.50 78 1980 33
Virginia Tech121-COUNTY OF MONTGOMERYBlacksburg Airport Area Building 0625C MCI Hut 0.56 78 1982 31
Virginia Tech121-COUNTY OF MONTGOMERYBlacksburg Brooks Center Building 220 Aquatics and Fisheries Research Center 0.01 2,304 2007 6 Multi-use
Virginia Tech121-COUNTY OF MONTGOMERYBlacksburg Brooks Center Building 236 Sardo Laboratory 0.39 8,724 1976 37 Laboratory
Virginia Tech121-COUNTY OF MONTGOMERYBlacksburg Brooks Center Building 237 Wood Processing Lab 0.60 14,297 1978 35 Multi-use
Virginia Tech121-COUNTY OF MONTGOMERYBlacksburg Brooks Center Building 238 Wood Engineering Lab 0.60 11,864 1987 26 Academic/Research
Virginia Tech121-COUNTY OF MONTGOMERYBlacksburg Brooks Center Building 239 Timber Harvest Lab 0.76 3,384 1987 26 Academic/Research
Virginia Tech121-COUNTY OF MONTGOMERYBlacksburg Brooks Center Building 0238A Wood Utilization & Recycling Bldg 0.16 1,630 2000 13 Office
Virginia Tech121-COUNTY OF MONTGOMERYBlacksburg Brooks Center Building 0239A Timber Harvesting Lab Gas Storage 0.42 96 1987 26 Storage - Fuel and Haz. Materials
Virginia Tech121-COUNTY OF MONTGOMERYBlacksburg Dairy Center Building 317 Residence 0.31 1,138 1955 58 Residential
Virginia Tech121-COUNTY OF MONTGOMERYBlacksburg Dairy Center Building 318 Residence 0.35 1,648 1955 58 Residential
Virginia Tech121-COUNTY OF MONTGOMERYBlacksburg Dairy Center Building 366 Seismograph Building 0.25 709 1962 51 Research
Virginia Tech121-COUNTY OF MONTGOMERYBlacksburg Dairy Center Building 470 Calan Feed Barn 0.02 1,200 2004 9
Virginia Tech121-COUNTY OF MONTGOMERYBlacksburg Dairy Center Building 471 Pump House 0.33 72 2004 9
Virginia Tech121-COUNTY OF MONTGOMERYBlacksburg Dairy Center Building 472 Dry Stack Manure Barn 0.00 6,256 2004 9 Animal Facility
Virginia Tech121-COUNTY OF MONTGOMERYBlacksburg Dairy Center Building 473 Free Stall Barn 0.01 43,250 2004 9 Animal Facility
Virginia Tech121-COUNTY OF MONTGOMERYBlacksburg Dairy Center Building 474 Milking Center 0.04 5,205 2004 9 Animal Facility
Virginia Tech121-COUNTY OF MONTGOMERYBlacksburg Dairy Center Building 475 Etgen Dairy Pavilion 0.31 7,709 1962 51 Animal Facility
Virginia Tech121-COUNTY OF MONTGOMERYBlacksburg Dairy Center Building 481 Loafing Barn 0.08 4,961 1962 51 Animal Facility
Virginia Tech121-COUNTY OF MONTGOMERYBlacksburg Dairy Center Building 482 Loafing Barn 0.11 4,961 1962 51 Animal Facility
Virginia Tech121-COUNTY OF MONTGOMERYBlacksburg Dairy Center Building 483 Calf Barn 0.63 6,601 1962 51
Virginia Tech121-COUNTY OF MONTGOMERYBlacksburg Dairy Center Building 484 Bull Barn 0.29 2,607 1962 51 Animal Facility
Virginia Tech121-COUNTY OF MONTGOMERYBlacksburg Dairy Center Building 485 Equipment Shed 0.32 4,565 1962 51
Virginia Tech121-COUNTY OF MONTGOMERYBlacksburg Dairy Center Building 486 Equipment Shed 0.65 2,700 1962 51
Virginia Tech121-COUNTY OF MONTGOMERYBlacksburg Dairy Center Building 488 New Bull Barn 0.18 7,087 1983 30
Virginia Tech121-COUNTY OF MONTGOMERYBlacksburg Dairy Center Building 489 New Heifer Barn 0.11 3,040 1983 30 Animal Facility
Virginia Tech121-COUNTY OF MONTGOMERYBlacksburg Dairy Center Building 490 Young Stock Barn 0.15 6,631 1962 51 Animal Facility
Virginia Tech121-COUNTY OF MONTGOMERYBlacksburg Dairy Center Building 492 Dry Stack Manure Barn 0.01 5,000 2001 12
Virginia Tech121-COUNTY OF MONTGOMERYBlacksburg Dairy Center Building 493 Shed 0.00 360 1985 28
Virginia Tech121-COUNTY OF MONTGOMERYBlacksburg Dairy Center Building 0270H Building 270H 0.05 1,763 2006 7
Virginia Tech121-COUNTY OF MONTGOMERYBlacksburg Dairy Center Building 0469A Hay Barn 0.00 3,200 2005 8 Animal Facility
Virginia Tech121-COUNTY OF MONTGOMERYBlacksburg Dairy Center Building 0469C Commodities Shed 0.00 1,947 2005 8 Animal Facility
Virginia Tech121-COUNTY OF MONTGOMERYBlacksburg Dairy Center Building 0481A Milking Parlor 0.59 1,014 1962 51
Virginia Tech121-COUNTY OF MONTGOMERYBlacksburg Dairy Center Building 0481B Baled Hay Storage/feeder 0.28 4,517 1962 51
Virginia Tech121-COUNTY OF MONTGOMERYBlacksburg Dairy Center Building 0481C Ensilage Feeder 0.05 1,188 1962 51
Virginia Tech121-COUNTY OF MONTGOMERYBlacksburg Dairy Center Building 0481D Silo 0.04 123 1962 51
Virginia Tech121-COUNTY OF MONTGOMERYBlacksburg Dairy Center Building 0481E Silo 0.05 123 1962 51
Virginia Tech121-COUNTY OF MONTGOMERYBlacksburg Dairy Center Building 0482A Milking Parlor 0.48 1,343 1962 51
Virginia Tech121-COUNTY OF MONTGOMERYBlacksburg Dairy Center Building 0482B Ensilage Feeder 0.46 1,100 1962 51
Virginia Tech121-COUNTY OF MONTGOMERYBlacksburg Dairy Center Building 0482C Chopped Hay Feeder - C 0.07 391 1962 51
Virginia Tech121-COUNTY OF MONTGOMERYBlacksburg Dairy Center Building 0482D Chopped Hay Feeder - D 0.07 391 1962 51
Virginia Tech121-COUNTY OF MONTGOMERYBlacksburg Dairy Center Building 0482E Computerized Feeder Shed 0.07 184 1962 51
Virginia Tech121-COUNTY OF MONTGOMERYBlacksburg Dairy Center Building 0483A Grain Bin 0.94 160 1962 51
Virginia Tech121-COUNTY OF MONTGOMERYBlacksburg Dairy Center Building 0484A Silo 0.06 314 1962 51 Storage
Virginia Tech121-COUNTY OF MONTGOMERYBlacksburg Dairy Center Building 0484B Silo 0.05 314 1962 51 Storage
Virginia Tech121-COUNTY OF MONTGOMERYBlacksburg Dairy Center Building 0484C Two Grain Bins 0.50 100 1962 51