Embed Size (px)
Citation preview
1
Strategic Business Modeling: Representation and
Reasoning
JENNIFER HORKOFF1, DANIELE BARONE
1, LEI JIANG
1, ERIC YU
2, DANIEL AMYOT
3,
ALEX BORGIDA4, JOHN MYLOPOULOS
1
1Department of Computer Science, University of Toronto, Canada
{jenhork, barone, leijiang, jm}@cs.toronto.edu 2Faculty of Information, University of Toronto, Canada
[email protected] 3EECS, University of Ottawa, Canada
[email protected] 4Department of Computer Science, Rutgers University, USA
Keywords: Business intelligence, Business model, Conceptual modeling
languages, Influence diagrams, Goal, Situation, Key performance indicators,
Strategic planning.
Abstract. Business Intelligence (BI) offers tremendous potential for business organizations to gain
insights into their day-to-day operations, as well as longer term opportunities and threats.
However, most of today's BI tools are based on models that are too much data-oriented from the
point of view of business decision makers. We propose an enterprise modeling approach to bridge
the business-level understanding of the enterprise with its representations in databases and data
warehouses. The Business Intelligence Model (BIM) offers concepts familiar to business decision
making - such as goals, strategies, processes, situations, influences, and indicators. Unlike many
enterprise models which are meant to be used to derive, manage, or align with IT system
implementations, BIM aims to help business users organize and make sense of the vast amounts of
data about the enterprise and its external environment. In this paper, we present core BIM
concepts, focusing especially on reasoning about situations, influences, and indicators. Such
reasoning supports strategic analysis of business objectives in light of current enterprise data,
allowing analysts to explore scenarios and find alternative strategies. We describe how goal
reasoning techniques from conceptual modeling and requirements engineering have been applied
to BIM. Techniques are also provided to support reasoning with indicators linked to business
metrics, including cases where specifications of indicators are incomplete. Evaluation of the
proposed modelling and reasoning framework includes an on-going prototype implementation, as
well as case studies.
1 Introduction
Business Intelligence (BI) offers tremendous potential for business organizations
to gain insights into their day-to-day operations, as well as longer term
opportunities and threats. The past decade has seen unprecedented interest in BI
technologies and services, and a corresponding growth of the BI market. By now,
most large organizations worldwide have a significant investment in BI. However,
most BI systems are closely linked to the structure of available data, providing
detailed statistics that may be hard to understand with respect to overall business
strategy. A recent survey indicates that BI system users are less satisfied with
system flexibility and the ability to manage risk than they are with the system as a
whole [1]. However, the flexibility required to modify BI queries, posing what-if
2
analysis questions exploring risk factors, often requires technical knowledge
concerning the structure of available data. Even state-of-the-art systems that raise
the abstraction level of BI systems require detailed knowledge of queries and data
dimensions (e.g., [2]). This need for technical knowledge poses a serious
conceptual obstacle for most business users, who are interested in having their
business data analyzed in their terms: strategic objectives, business models1 and
strategies, business processes, markets, trends and risks. BI data and statistics
often focus on specific measures of current operations, without providing a clear
link to how these measures affect business strategies, or how they facilitate
planning and decision making. Consequently, the gap between the world of
business and the world of IT-supplied data remains one of the greatest barriers to
the adoption of BI technologies [3].
As in the broader area of enterprise modeling, there is a need to provide modeling
support at the strategic business level, so that data residing in databases and data
warehouses can be interpreted and understood in business terms, thereby
facilitating reasoning over strategic decisions. To bridge this business-data gap in
BI, we have proposed a strategic business modeling approach that makes use of
concepts from existing modeling approaches or methodologies familiar to
business decision makers (e.g., Strategy Maps [4], SWOT Analysis [5], the
Business Motivation Model [6]). The Business Intelligence Model (BIM) [7], [8]
is a business modeling language that offers concepts such as goals, strategies,
processes, situations, influences, and indicators, and techniques for reasoning
about them. Unlike many enterprise models meant to be used to derive, manage,
or align with IT system implementations, BIM aims to help business users
organize and make sense of the vast amounts of data about the enterprise and its
external environment. An enterprise model such as BIM may be viewed as the
business-level counterpart to conceptual data models (e.g., entity-relationships
models), so that strategic objectives, business processes, risks and trends can all
be represented in a BIM model, for purposes of analysis and monitoring.
Consider for example, a consumer electronics retailer with vast amounts of data
from diverse sources available for analysis through BI tools. Business analysts
and strategists want to be able to pose a variety of analysis questions, without
being constrained by the structure of current BI reports and queries, which are
often technically-oriented and difficult to modify. Instead, they want to pose
questions at the business level, facilitating reasoning over and comparison of
potential business strategies. For example: Should we develop technology in-
house or acquire technology through acquisition? Which option is better for
maintaining revenue growth and reducing risks? Given the state of the business
according to current data, will we be able to maintain revenue growth without
new strategic partnerships or technology acquisitions?
In this paper, we build on existing work to show how construction and analysis of
BIM models (also called schemas, by analogy to database schemas) could allow
organizations to answer such questions. We capture the necessary business
objectives, risks, and measures by focusing on three key concepts in BIM:
situation, influence and indicator. BIM models can also be used to reason about
strategic objectives, such as “increase sales volume” or “maintain revenue
growth”, by estimating the degree to which they are achieved, or the probability
that they will be achieved. Reasoning over BIM models can use current business
1 We use the terms “enterprise model” and “business model” in a conceptual modeling sense, i.e.,
a collection of elements and relationships typically having a graphical representation, and not in
the business sense of how an organization creates, delivers, and captures value.
3
data from indicators, or can use hypothetical data in “what if?” scenarios,
facilitating both exploration and monitoring of business objectives. Although
reasoning over BIM can allow analysts to formulate questions at the level of
business strategies, it is challenging to completely elicit or specify all necessary
links to business data (indicators, business metrics). Accordingly, our proposed
techniques support reasoning even if BIM models are incomplete, missing
information regarding indicators, business metrics, or probabilistic information,
especially during intermediate stages of model development. Supporting
reasoning over incomplete indicators requires use of qualitative reasoning
techniques, which come with different information requirements.
Our previous work has introduced elements of the BIM language, describing key
concepts and applications of reasoning techniques [8–10]. Further work describes
BIM reasoning with indicator values from business data [11], [12]. The work
presented in this paper is an extension, improvement and integration of our
published work, combining existing BIM papers into one consistent description of
language concepts and reasoning. Specifically, we build on existing work by:
Offering a more precise and detailed account of core BIM concepts;
Using a consistent running example from real-world analysis reports to
demonstrate all concepts and reasoning techniques;
Describing in more detail a methodology for constructing BIM models;
Providing an overview of BIM reasoning techniques, summarizing
information requirements and linking them to our proposed methodology;
Providing more detail concerning the use of existing reasoning approaches
for BIM, including details concerning the mapping of BIM to existing
languages and tools;
Extending and revising the description of reasoning with indicators,
including composite indicators;
Describing how to reason with incomplete indicators using a hybrid
reasoning approach;
Consolidating the description of tool support for BIM, including use of
existing model reasoning tools and custom-build BIM prototypes.
Summarizing ongoing studies applying BIM to real-world cases, including
a consideration of model scalability.
This research is conducted in the context of the Business Intelligence Network, a
Canada-wide strategic research network with academic and industry partners.
The rest of the paper is organized as follows. Section 2 introduces BIM concepts.
Section 3 presents alternative reasoning techniques for BIM models. Some of
these are based on existing proposals. Others are novel, such as the indicator
reasoning techniques that depend on the availability of indicator and probabilistic
information. Section 4 describes use of existing tool support as well as in-progress
implementations of prototype tools. We summarize the results of ongoing case
studies using BIM in Section 5. Section 6 discusses related work, while Section 7
provides conclusions and outlines future work.
2 Strategic Business Models
In this section, we provide a description of the key components of the Business
Intelligence Model, including goal, situation, influence, and indicator. A version
of the metamodel linking these concepts can be found in [7], [8]. A running
example is introduced to illustrate these concepts and the reasoning techniques
proposed in later sections.
4
2.1 Running Example: BestTech
The example presents the viewpoint of BestTech, a generic company developing
and selling consumer electronics. Model contents have been extracted from real-
world analysis reports, published by DataMonitor, a company that specializes in
industry analysis for a number of industry sectors. The example, presented
incrementally in the following sections (Figures 1, 2, and 3), contains an
interrelated network of goals, situations, processes, indicators, and domain
assumptions relevant to BestTech.
2.2 BIM Concepts and Relationships
This section describes BIM’s key concepts and relationships – Goal, Situation,
Influence, and Indicator – in detail, using our running example for illustration.
This section is an expansion and consolidation of the BIM description in [8–12].
2.2.1 Goal
The concept of goal has a long history as part of enterprise modeling (e.g. [13],
[14]) and requirements analysis (e.g., [15–18]). A goal represents an objective of a
business. Goals may be (AND/OR) refined into sub-goals so that their satisfaction
depends on that of their sub-goals. Moreover, a goal may be satisfied in multiple
ways if it or its sub-goals are OR-refined, in which case a choice needs to be made
among alternatives. In addition, a goal’s satisfaction may be affected by that of
goals other than its sub-goals. Using typical goal model syntax such as in [15],
[17], [18] goal-oriented elicitation within an enterprise produces a goal model
consisting of an AND/OR refinement graph including positive/negative
contributions.
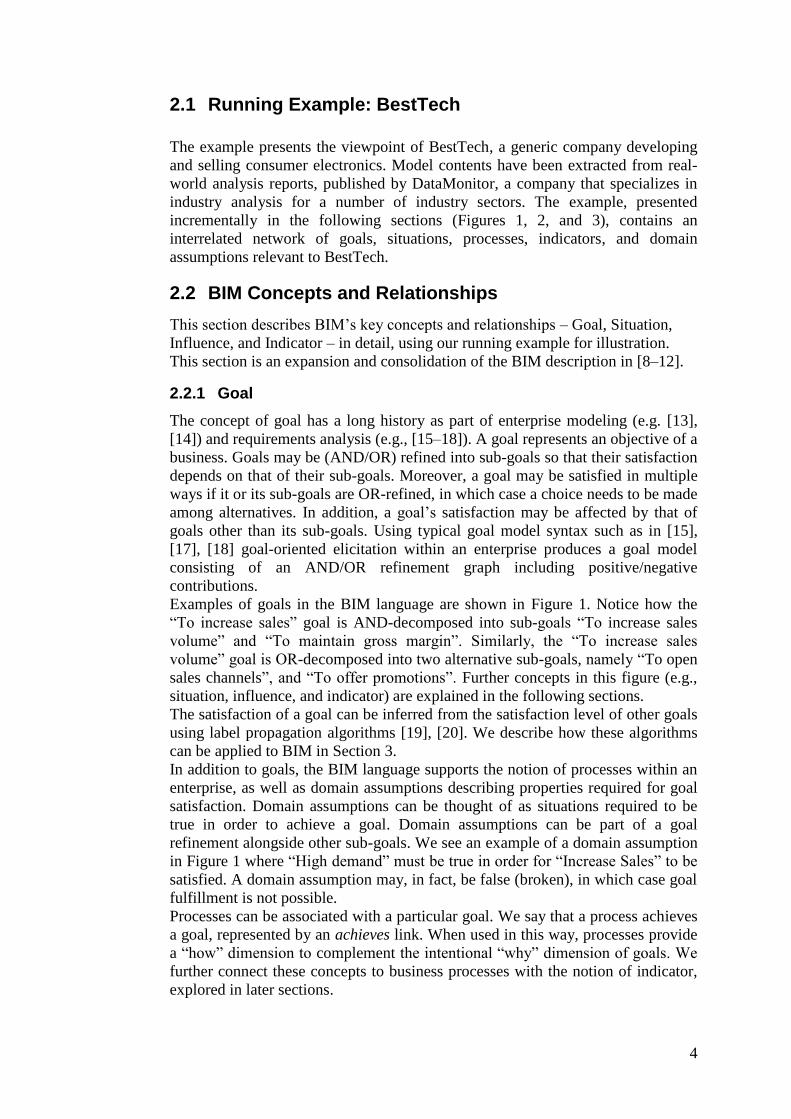
Examples of goals in the BIM language are shown in Figure 1. Notice how the
“To increase sales” goal is AND-decomposed into sub-goals “To increase sales
volume” and “To maintain gross margin”. Similarly, the “To increase sales
volume” goal is OR-decomposed into two alternative sub-goals, namely “To open
sales channels”, and “To offer promotions”. Further concepts in this figure (e.g.,
situation, influence, and indicator) are explained in the following sections.
The satisfaction of a goal can be inferred from the satisfaction level of other goals
using label propagation algorithms [19], [20]. We describe how these algorithms
can be applied to BIM in Section 3.
In addition to goals, the BIM language supports the notion of processes within an
enterprise, as well as domain assumptions describing properties required for goal
satisfaction. Domain assumptions can be thought of as situations required to be
true in order to achieve a goal. Domain assumptions can be part of a goal
refinement alongside other sub-goals. We see an example of a domain assumption
in Figure 1 where “High demand” must be true in order for “Increase Sales” to be
satisfied. A domain assumption may, in fact, be false (broken), in which case goal
fulfillment is not possible.
Processes can be associated with a particular goal. We say that a process achieves
a goal, represented by an achieves link. When used in this way, processes provide
a “how” dimension to complement the intentional “why” dimension of goals. We
further connect these concepts to business processes with the notion of indicator,
explored in later sections.
5
Legend
Goal
Indicator
Process
Situation
To open sales
channels
To increase
sales
Increased
competition
High
demand
To increase
sales volume
To maintain
gross margin-
To offer
promotions
+
To reduce
costs
-
-
-
Total sales
Sales
volume
Gross
margin
Economic
SlowdownLow cost
financing
-
++
AND
OR
Evaluates
Domain
Assumption
AND
Refinement
OR
+
Influence
Achieves
Figure 1 Example of Goals, Situations, and Influences for BestTech
2.2.2 Situation
During strategic planning, SWOT analysis [5] is often used to identify internal
and external factors that may influence the fulfillment, favorable or unfavorable,
of strategic goals. SWOT stands for Strengths (internal, favorable), Weaknesses
(internal, unfavorable), Opportunities (external, favorable), and Threats (external,
unfavorable). We propose to model these in terms of the notion of situation.
Intuitively, a situation defines a partial state of affairs (partial model of the world)
in terms of things that exist in that state, their properties, and interrelations [21].
Since we are interested in strategic business models, we focus on organizational
situations. The same situation may be favourable for some organizational goals,
represented via positive influence links on model concepts, but unfavourable for
others, represented via negative influence. In our example, the situation
“Increased competition” constitutes a threat to the goal “To open sales channels”),
while “low cost financing” is an opportunity for “Healthy balance sheet” and
therefore “Sufficient Funds”, and “economic slowdown” is a threat for “High
Demand”.
Analogously to satisfaction levels for goals, we have occurrence levels for
situations, which denote the degree to which a situation occurs in the current state-
of-affairs.
6
2.2.3 Influence
To express the influence of situations on strategic goals and other situations, we
extend the contribution relation from goals to situations. In order to support both
reasoning over goal satisfaction/denial and reasoning using conditional
probabilities, BIM supports two types of influence links: logical and probabilistic.
Quantitative logical influence links are an estimation of the positive or negative
influence of an object on another, while probabilistic influence links estimate the
probability of an object being satisfied (denied) given the satisfaction (denial) of
another object. In either case, influence links can have varying strengths specified
in qualitative or quantitative terms.
Logical Influence. As in many goal modeling approaches (e.g, [15], [17], [18]),
one goal influences another if its satisfaction/denial implies (partial)
satisfaction/denial of the other. Such relations also hold between situations and
goals. We call this type of influence logical.
The influence strength is modeled using qualitative values: + (weak positive), ++
(strong positive), - (weak negative), and -- (strong negative)), as in existing goal
modeling frameworks. When logical qualitative values are not expressive enough
to capture the difference between influence strengths, quantitative logical values
in some standard range (e.g., [-1, 1]) can be used. For example, + may correspond
to 0.5 and ++ to 1.0. If the modeller wants to express a strength in between, a
number (e.g., 0.7) may be used, instead of further qualitative values.
Figure 1 shows some examples of influences from situations to goals, e.g., the
“Increased competition” situation, representing an external threat for the
company, influences negatively the “To open sales channels” goal. Similarly, the
situation “Economic slowdown” negatively influences the domain assumption
“High demand”. An example of influence among goals can be seen in the negative
link from “To offer promotions” to “To maintain gross margins”.
Probabilistic Influences. To support probabilistic reasoning, we also support
probabilistic influences among situations, goals and domain assumptions. In this
case influence links represent the conditional probability of satisfaction. For
example, in Figure 1, if the partial positive influence link between “To reduce
costs” and “To maintain gross margins” had a probabilistic type with a strength of
0.7, it would mean that the probability of “To maintain gross margin” occurring
given the satisfaction of “To reduce costs” is 0.7 (P(To reduce costs | To maintain
gross margin) = 0.7). These strengths can be quantitative (e.g., 0.7, 70% chance
of satisfaction) or quantitative (e.g., high chance of satisfaction). In Section 3.3,
we show how this type of influence is used to support decision-theoretic analysis.
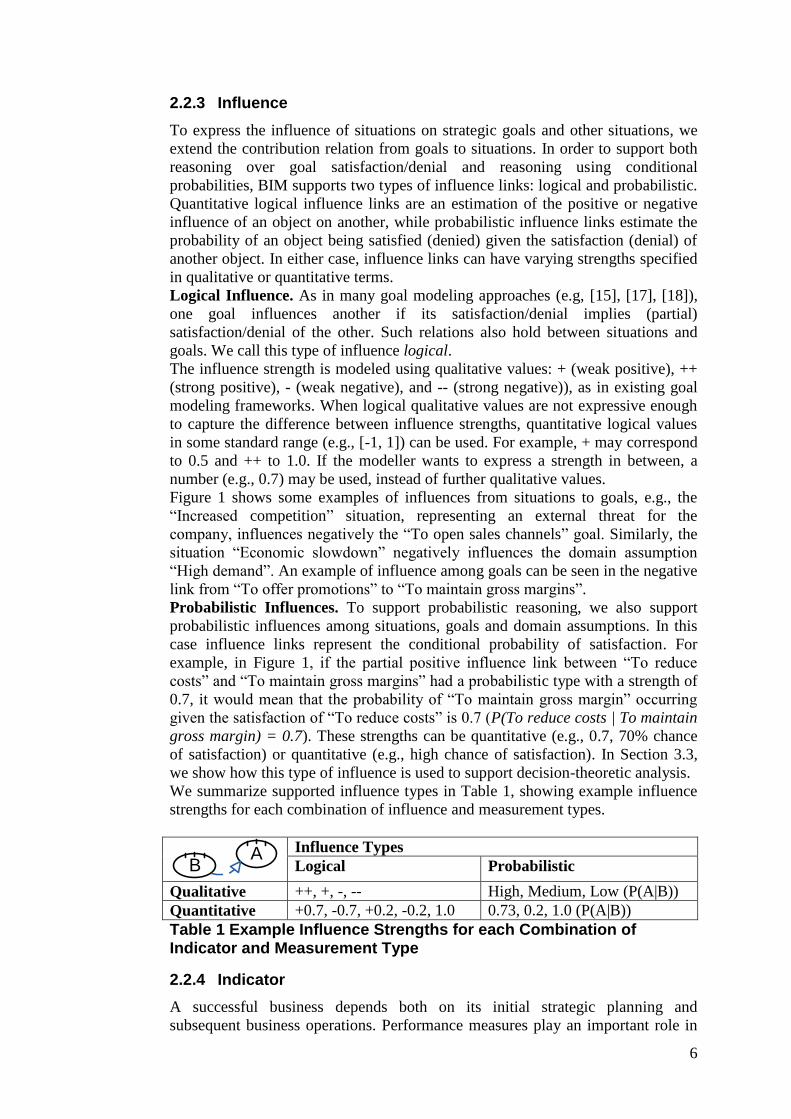
We summarize supported influence types in Table 1, showing example influence
strengths for each combination of influence and measurement types.
Influence Types
Logical Probabilistic
Qualitative ++, +, -, -- High, Medium, Low (P(A|B))
Quantitative +0.7, -0.7, +0.2, -0.2, 1.0 0.73, 0.2, 1.0 (P(A|B))
Table 1 Example Influence Strengths for each Combination of Indicator and Measurement Type
2.2.4 Indicator
A successful business depends both on its initial strategic planning and
subsequent business operations. Performance measures play an important role in
BA
7
helping businesses align their daily activities with their strategic objectives.
Generally speaking, performance measures quantify various aspects of business
activities, including their input, execution and output, for monitoring, control and
improvement purposes [22]. We model performance measures through indicators.
An indicator (or in some cases, a Key Performance Indicator) is a metric that
evaluates performance with respect to some objective, be it the degree of
fulfillment for a strategic goal, or the quality of a business process or product.
Such metrics can be directly derived from data, or can use a formula to combine
values. In BIM, indicators constitute a conceptual bridge connecting a BIM model
to enterprise data found in a variety of data sources.
In BIM, each indicator is associated with a particular model element (e.g., goal,
situation). Indicators associated with a goal are also associated with a process
which achieves the goal. Associating an indicator with a goal provides the “why”
dimension, motivating the need for a specific measure, while association with a
process provides the “how” dimension, linking the indicator to a concrete business
process. We say that an indicator evaluates a particular goal (or situation) while it
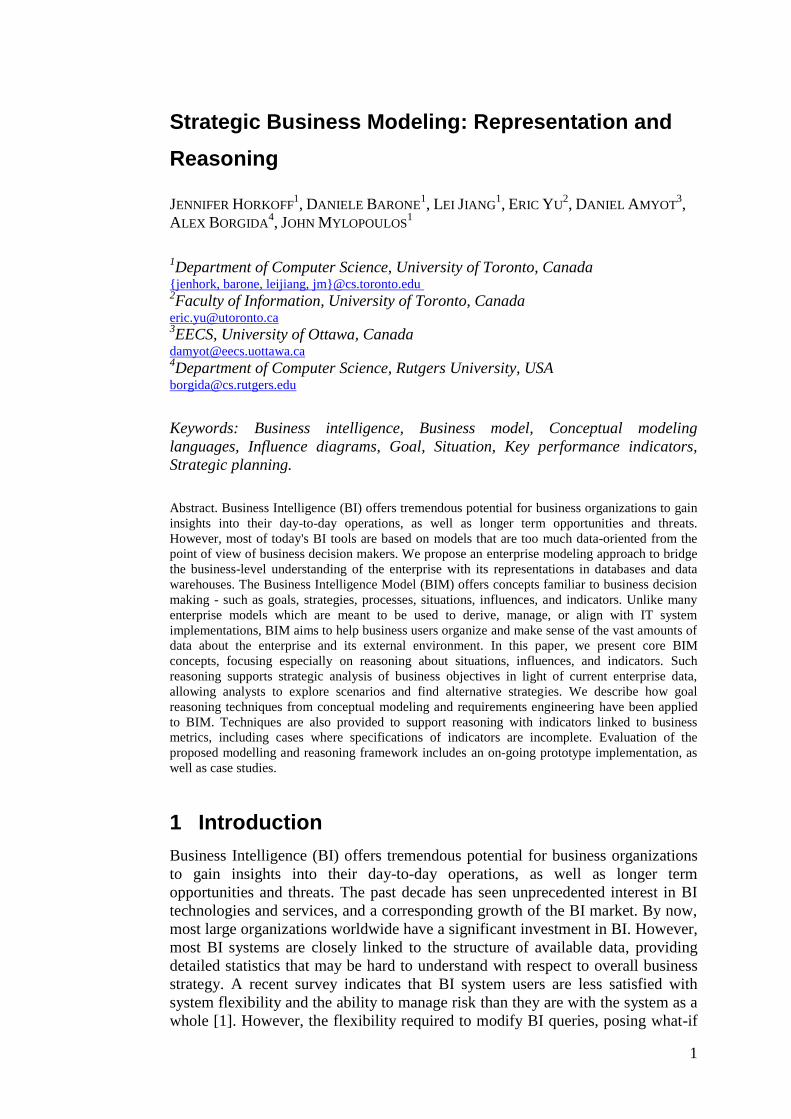
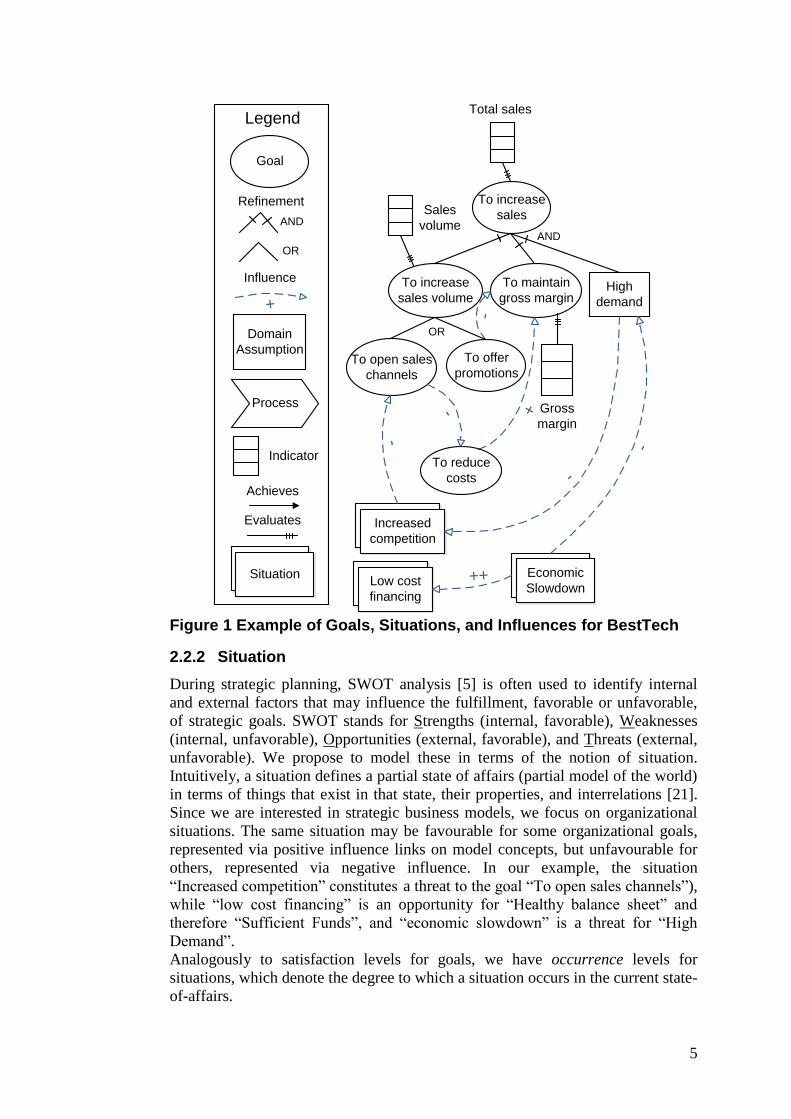
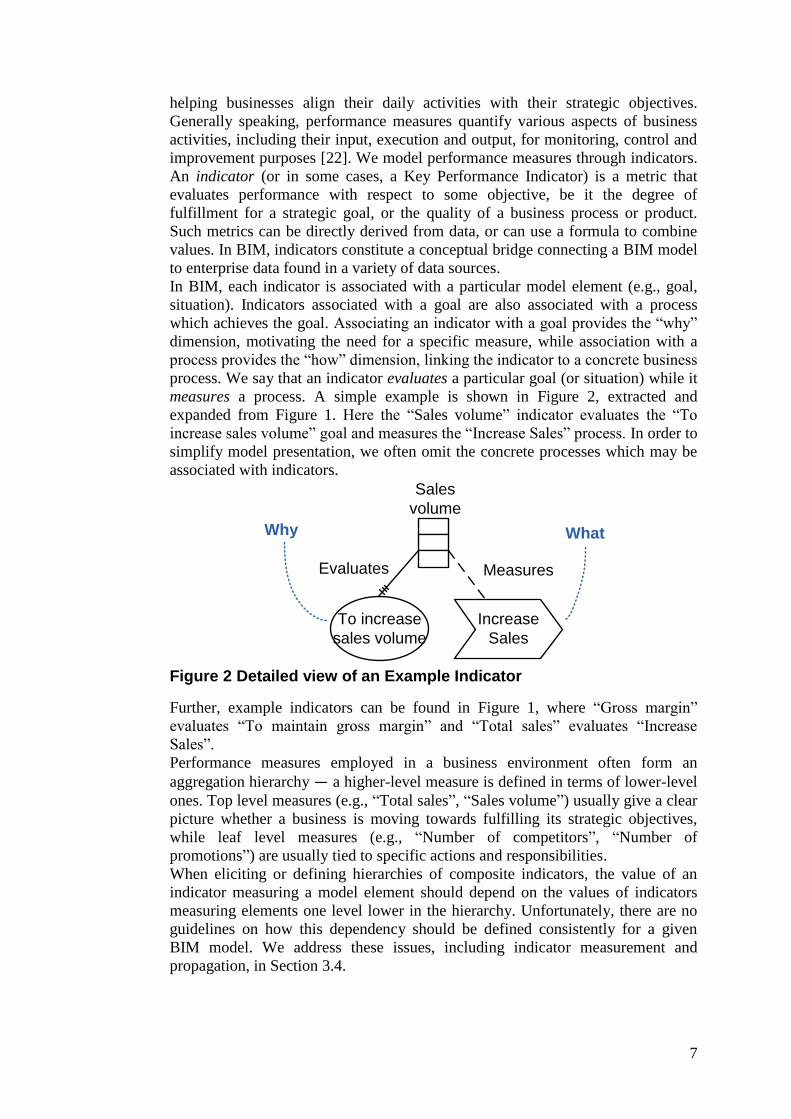
measures a process. A simple example is shown in Figure 2, extracted and
expanded from Figure 1. Here the “Sales volume” indicator evaluates the “To
increase sales volume” goal and measures the “Increase Sales” process. In order to
simplify model presentation, we often omit the concrete processes which may be
associated with indicators.
To increase
sales volume
Sales
volume
Increase
Sales
Evaluates Measures
Why What
Figure 2 Detailed view of an Example Indicator
Further, example indicators can be found in Figure 1, where “Gross margin”
evaluates “To maintain gross margin” and “Total sales” evaluates “Increase
Sales”.
Performance measures employed in a business environment often form an
aggregation hierarchy ― a higher-level measure is defined in terms of lower-level
ones. Top level measures (e.g., “Total sales”, “Sales volume”) usually give a clear
picture whether a business is moving towards fulfilling its strategic objectives,
while leaf level measures (e.g., “Number of competitors”, “Number of
promotions”) are usually tied to specific actions and responsibilities.
When eliciting or defining hierarchies of composite indicators, the value of an
indicator measuring a model element should depend on the values of indicators
measuring elements one level lower in the hierarchy. Unfortunately, there are no
guidelines on how this dependency should be defined consistently for a given
BIM model. We address these issues, including indicator measurement and
propagation, in Section 3.4.
8
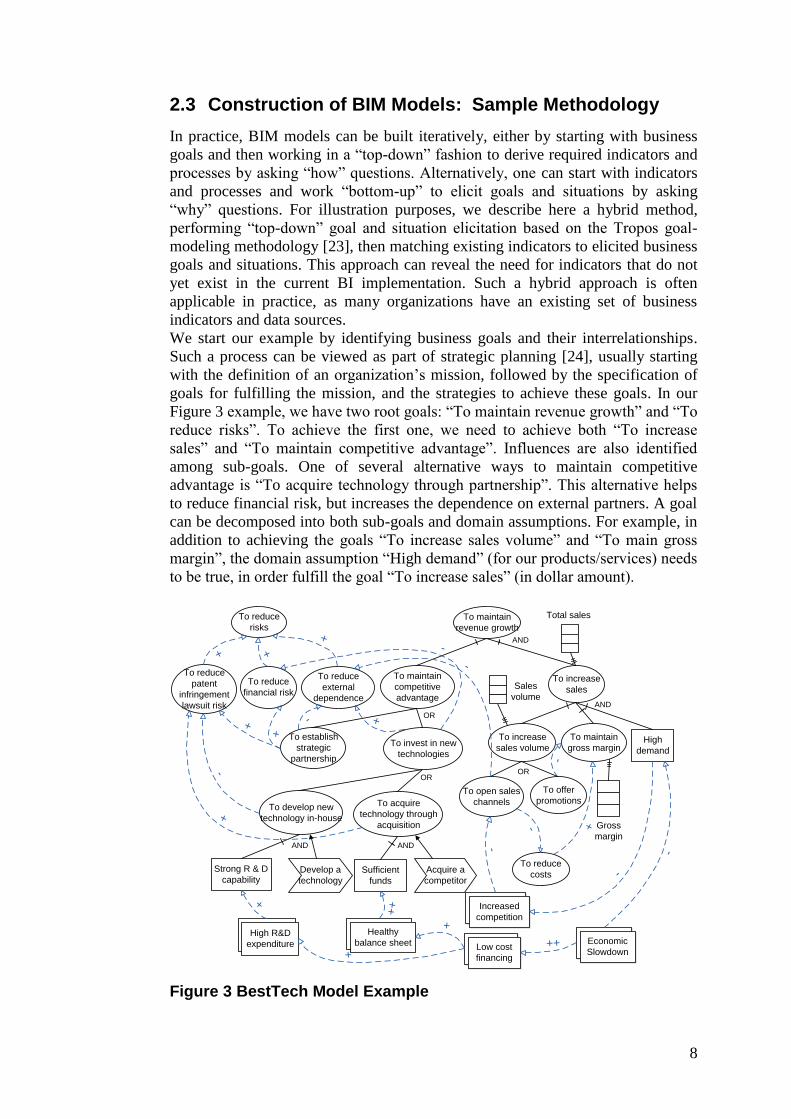
2.3 Construction of BIM Models: Sample Methodology
In practice, BIM models can be built iteratively, either by starting with business
goals and then working in a “top-down” fashion to derive required indicators and
processes by asking “how” questions. Alternatively, one can start with indicators
and processes and work “bottom-up” to elicit goals and situations by asking
“why” questions. For illustration purposes, we describe here a hybrid method,
performing “top-down” goal and situation elicitation based on the Tropos goal-
modeling methodology [23], then matching existing indicators to elicited business
goals and situations. This approach can reveal the need for indicators that do not
yet exist in the current BI implementation. Such a hybrid approach is often
applicable in practice, as many organizations have an existing set of business
indicators and data sources.
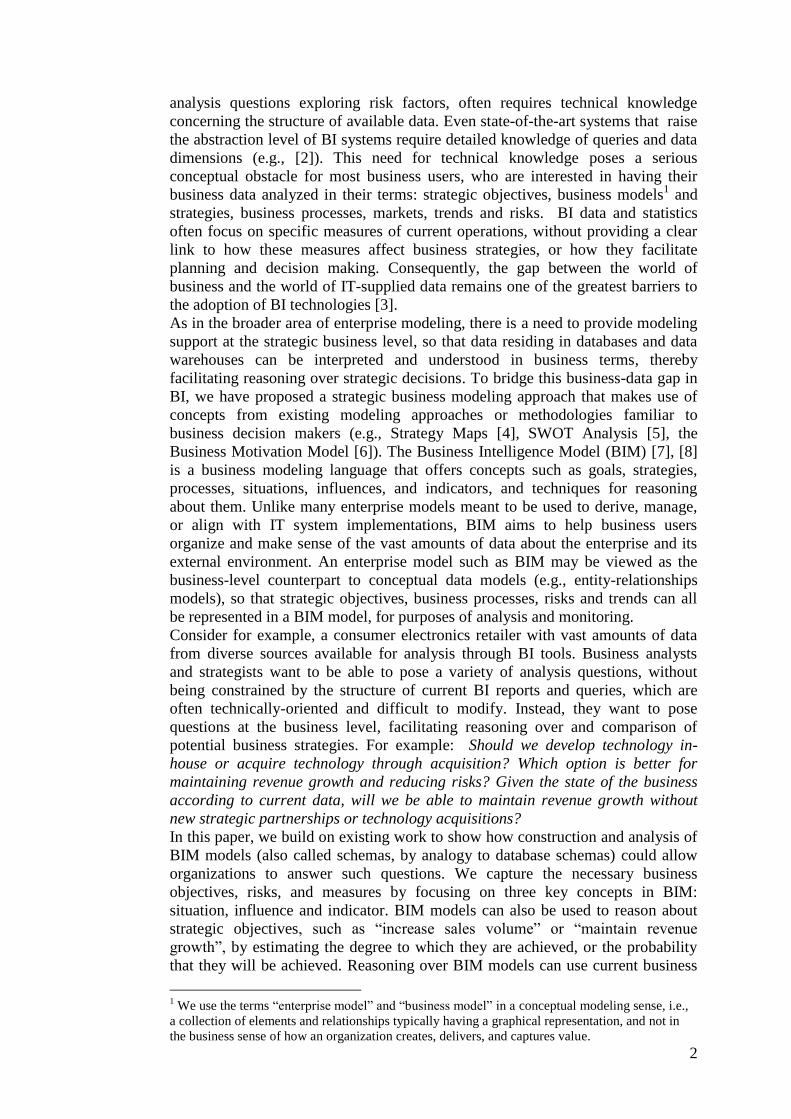
We start our example by identifying business goals and their interrelationships.
Such a process can be viewed as part of strategic planning [24], usually starting
with the definition of an organization’s mission, followed by the specification of
goals for fulfilling the mission, and the strategies to achieve these goals. In our
Figure 3 example, we have two root goals: “To maintain revenue growth” and “To
reduce risks”. To achieve the first one, we need to achieve both “To increase
sales” and “To maintain competitive advantage”. Influences are also identified
among sub-goals. One of several alternative ways to maintain competitive
advantage is “To acquire technology through partnership”. This alternative helps
to reduce financial risk, but increases the dependence on external partners. A goal
can be decomposed into both sub-goals and domain assumptions. For example, in
addition to achieving the goals “To increase sales volume” and “To main gross
margin”, the domain assumption “High demand” (for our products/services) needs
to be true, in order fulfill the goal “To increase sales” (in dollar amount).
To open sales
channels
To increase
sales
Increased
competition
To acquire
technology through
acquisition
To develop new
technology in-house
To reduce
risks
To reduce
patent
infringement
lawsuit risk
To reduce
external
dependence
To establish
strategic
partnership
-
To reduce
financial risk
+
+
To invest in new
technologies
-
To maintain
competitive
advantage
+
+
Acquire a
competitor
Develop a
technology
+
++
Sufficient
funds
Strong R & D
capability
High
demand
To maintain
revenue growth
To increase
sales volume
To maintain
gross margin
-
To offer
promotions
-
+
To reduce
costs
-
-
-
Total sales
Sales
volume
Gross
margin
-
Economic
Slowdown
Healthy
balance sheet High R&D
expenditure Low cost
financing
+++
+
+
-
++
AND
ANDAND
AND
OR
OR
OR
Figure 3 BestTech Model Example
9
After goal modeling, we identify the internal and external factors that may
influence fulfillment of the goals identified previously. Specifically, we start with
domain assumptions in the model, and ask the question: what observable evidence
could potentially support or challenge these assumptions. In our example, “High
R&D expenditure” (strength) positively contributes to the domain assumption
“Strong R&D capability”, while “Healthy balance sheet” (strength) suggests with
a high degree of certainty that there are “Sufficient funds” available to make
strategic investment. Situations may also influence goals directly. For example,
the fact “Increased competition” (threat) may hinder the fulfillment of the goal
“To open sales channels”. Influences may also occur among situations. For
example, “Low cost financing” (opportunity), caused by “Economic slowdown”,
positively contributes to “High R&D expenditure” and “Healthy balance sheet”.
To choose the right indicators for a given object, be it a goal, process or product,
one must have a good understanding of what is important to the organization.
Moreover, this importance is generally contextual. For instance, indicators useful
to a finance team may be inappropriate for a sales force. Because of the need to
develop a good understanding of what is important, performance indicators are
closely associated with techniques for assessing the present state of the business.
A very common method for choosing indicators is to apply a management
framework such as the Balanced Scorecard [25], whereby indicators measure a
range of factors in a business, rather than a single one (e.g., profits). Approaches
such as Basili’s Goal-Question-Metric [26] are also available to help identify and
validate indicators measuring goal satisfaction.
In our example, some indicators are associated with the goals under “To increase
sales”. Note that these indicators are composite indicators, and may be further
decomposed. For example, “Gross margin” may be broken down by
product/service categories, fiscal periods, or geographical locations. Also notice
that although not shown, “Total sales” (in dollar amount) can be mathematically
determined by “Sales volume” and “Gross margin”, entailing a hierarchical
relation among these indicators. We return to the topic of composite indicators,
including further examples, in Section 3.4.
Elicitation of business goals, relevant situations, and current indicators can be
accomplished through a series of interviews, focus groups, or a review of
available strategy documentation. Ideally, model construction would be iterative
and participatory, involving business stakeholders at varying levels of the
organization (e.g., management, technical personnel) in a process of model
construction and validation. In practice, the number of relevant business goals and
indicators may be large. Our Figure 3 example is kept relatively simple for
illustrative purposes, not reflecting realistic complexity. Uses of BIM in practice,
including suggestions for modularization of BIM models to allow for scalability,
are described in Section 5.
3 Reasoning with BIM Models
Although the construction of a BIM model is useful as a means to clarify and
communicate business objectives, strategies, and organizational situations, much
of the benefits of BIM models come from the capability to support reasoning.
Reasoning with BIM allows an organization to answer strategic or monitoring
questions. For example, BestTech may want to pose the following questions:
10
Should we develop technology in-house or acquire technology through
acquisition? Which option is better for maintaining revenue growth and
reducing risks?
Is it possible to maintain revenue growth while reducing risks? What
strategies can achieve these goals?
Given business metrics and target values, what increase in sales volume
can be expected from the current number of sales channels and new
promotions?
Given the state of the business according to current data, will we be able
to maintain revenue growth without new strategic partnerships or
technology acquisitions?
In order to support a variety of analysis questions over BIM models, several types
of reasoning approaches can be applied, including existing reasoning approaches
for similar types of models and approaches making using of business metrics and
indicators. The selection of a reasoning approach depends on the types of analysis
questions posed, the methodological phase, and the availability of specific
information. An end-user may prefer a reasoning approach over others depending
on the quantity of domain information that she/he possesses, or on the available
time she/he has for encoding such information into the model. Table 2
summarizes the types of reasoning described in this paper, including a summary
of the information required for each procedure, and the paper section in which the
reasoning approach is described. Earlier descriptions of each of the first three
types of reasoning were provided in [10–12]. We provide an overview of each
type of reasoning in the next section.
Reasoning Technique Required Information Described in
Section
Goal Model Reasoning Initial Reasoning Values 3.2 Probabilistic Decision
Analysis Conditional Probability Tables,
Utility Functions 3.3
Reasoning with
Indicators Atomic Indicator Values, Business
Formulae, Unit conversion factors 3.4
Hybrid Reasoning (Reasoning with
Incomplete Indicators)
Atomic Indicator Values,
(Optional) Business Formulae,
(Optional) Unit conversion factors,
(Optional) Initial Reasoning Values
3.4.7
Table 2 Reasoning Techniques applied to BIM including Required Information and Corresponding Paper Section
3.1 Overview of Reasoning Approaches
Goal Model Reasoning. If a BIM model is constructed in a top-down manner,
eliciting relevant goals and strategies before deriving or eliciting indicators,
reasoning must operate in the absence of indicator values. Such models, used as
part of strategic planning, often results in alternative strategies. It is important to
be able to analyze and comparing strategies at a high-level. Techniques that
facilitate strategic analysis using enterprise goals have long been used as part of
goal-oriented analysis [15], [19], [27–30]. These procedures propagate either
qualitative or quantitative evidence through links in the model in order to evaluate
11
the satisfaction of goals in the model given a particular strategy or target.
Although quantitative propagation is supported, most techniques for goal model
reasoning operate in the absence of concrete business measures, making them
appropriate for high-level, strategic analysis in the absence of indicators. These
approaches are suitable when the user is interested in an early analysis of the
domain, exploring and improving the model while it may not yet be sufficiently
complete or correct [29].
In this work, we select a particular goal reasoning technique (introduced by
Giorgini et al. and described in [19], [20], [31]) and demonstrate how this
technique can be used to analyze alternative strategies in BIM models. Other
procedures, such as those described in [15], [27–29] could be similarly adapted.
Probabilistic Decision Analysis. In some cases it may be possible to derive
probabilistic information concerning the likelihood of goal achievement given the
achievement of other model elements. This information can be collected from
business experts, depending on their level of expertise and confidence, or from
past statistical data. If such information is available, probabilistic decision
analysis can be applied to BIM models, providing an alternative method for
choosing among business strategies. During strategic planning, a strategy is
normally produced by making decisions at a number of decision points. At each
point, a decision option is chosen from a pool of available options. Probabilistic
decision analysis facilitates automated decision making, selecting strategies, using
conditional probabilities and utility functions.
Reasoning with Indicators. If BIM model construction is performed in a bottom-
up manner, indicators and their data sources will be derived or elicited from the
business. In this case, reasoning techniques must support reasoning over
indicators, using current values to calculate composite indicators, indicators
whose values are obtained from those of their components. These components
themselves may also be composite, leading to an aggregation hierarchy of
indicators. In order to support indicator reasoning, we wish to propagate values of
indicators from a lower level in a hierarchy to ones higher up. In some cases, a
business metric or mathematical function may exist to combine composite
indicator values. Such formulae may or may not include unit conversion factors.
We describe methods which calculate composite indicator values using either
available unit conversion factors or unit normalization, allowing for optional
indicator weights.
In other cases, there is no well-defined mathematical function that relates atomic
indicators to a composite one. This might simply be due to lack of knowledge
about the indicators, or the intrinsic nature of the indicators at hand. We adapt
existing techniques for goal model reasoning for reasoning with indicators,
deriving values of composite indicators, even when the relationship between a
composite indicator and its components cannot be fully described using well-
defined mathematical functions.
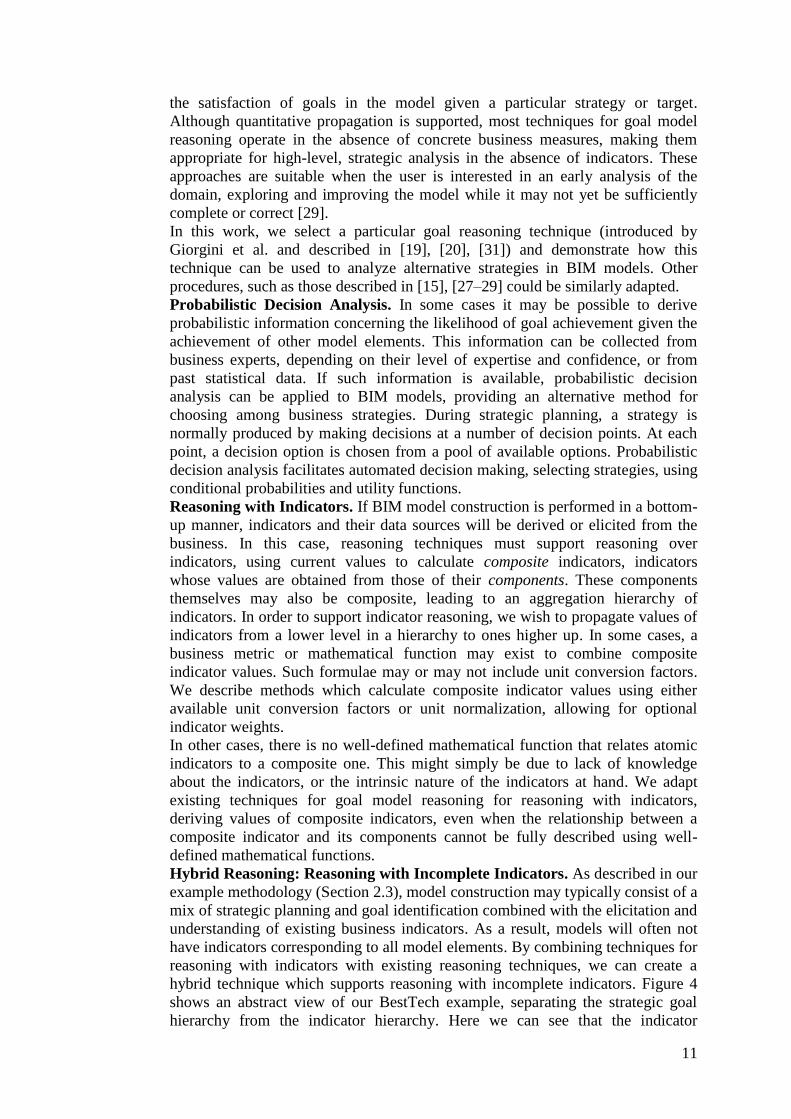
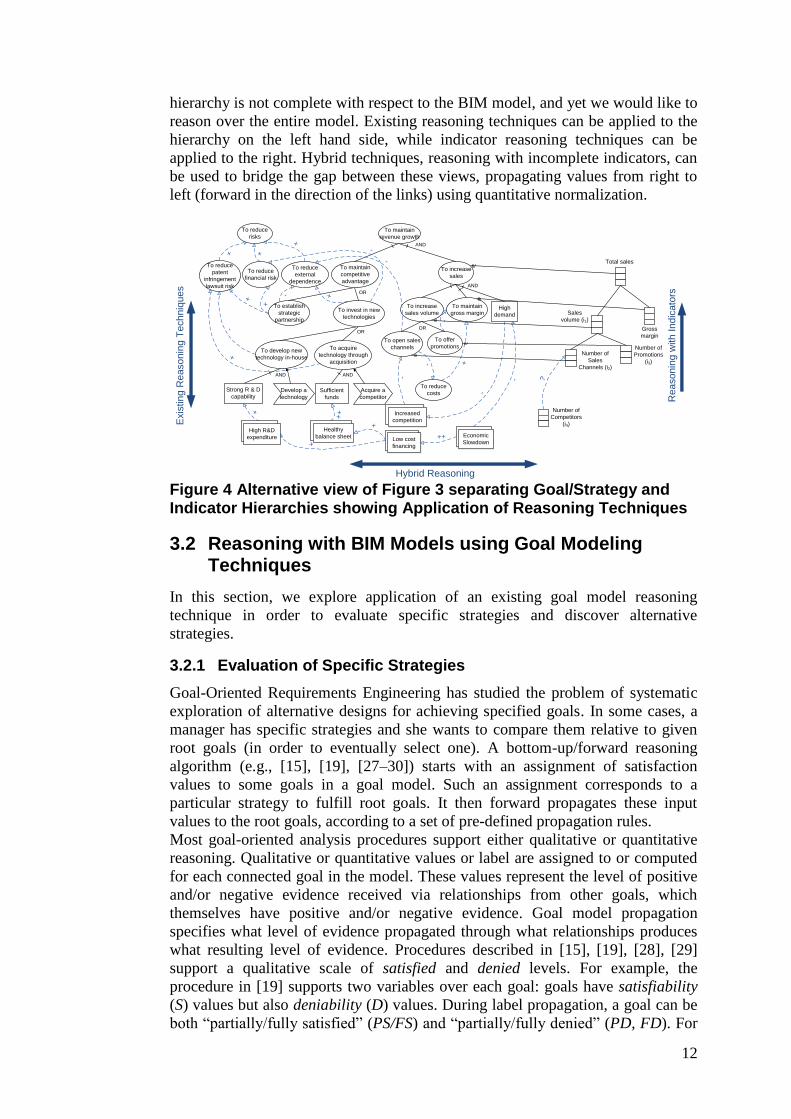
Hybrid Reasoning: Reasoning with Incomplete Indicators. As described in our
example methodology (Section 2.3), model construction may typically consist of a
mix of strategic planning and goal identification combined with the elicitation and
understanding of existing business indicators. As a result, models will often not
have indicators corresponding to all model elements. By combining techniques for
reasoning with indicators with existing reasoning techniques, we can create a
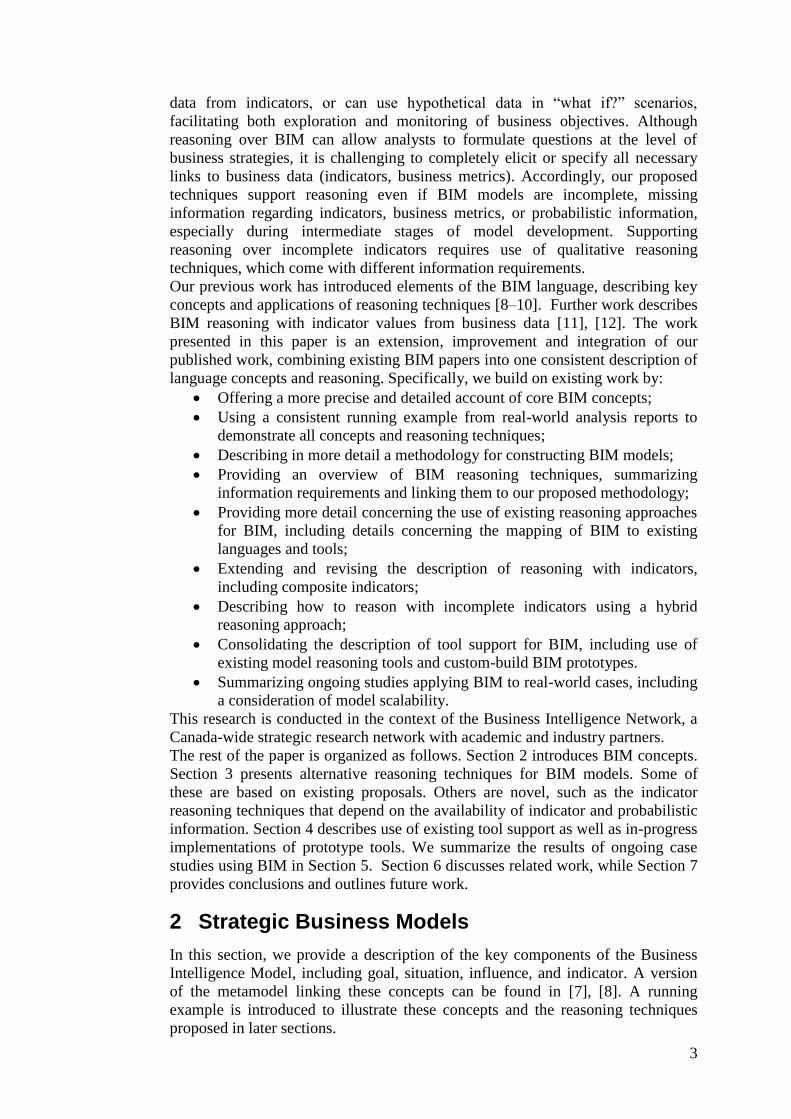
hybrid technique which supports reasoning with incomplete indicators. Figure 4
shows an abstract view of our BestTech example, separating the strategic goal
hierarchy from the indicator hierarchy. Here we can see that the indicator
12
hierarchy is not complete with respect to the BIM model, and yet we would like to
reason over the entire model. Existing reasoning techniques can be applied to the
hierarchy on the left hand side, while indicator reasoning techniques can be
applied to the right. Hybrid techniques, reasoning with incomplete indicators, can
be used to bridge the gap between these views, propagating values from right to
left (forward in the direction of the links) using quantitative normalization.
To open sales
channels
To increase
sales
Increased
competition
To acquire
technology through
acquisition
To develop new
technology in-house
To reduce
risks
To reduce
patent
infringement
lawsuit risk
To reduce
external
dependence
To establish
strategic
partnership
-
To reduce
financial risk
+
+
To invest in new
technologies
-
To maintain
competitive
advantage
+
+
Acquire a
competitor
Develop a
technology
+
++
Sufficient
funds
Strong R & D
capability
High
demand
To maintain
revenue growth
To increase
sales volume
To maintain
gross margin
-To offer
promotions
-
+
To reduce
costs
-
--
Total sales
Gross
margin
-
Economic
Slowdown
Healthy
balance sheet High R&D
expenditure Low cost
financing+
++
+
+
-
++
AND
ANDAND
AND
OR
OR
OR
Sales
volume (i1)
Number of
Sales
Channels (i2)
Number of
Promotions
(i3)
Number of
Competitors
(i4)
?
Re
aso
nin
g w
ith
In
dic
ato
rs
Exis
tin
g R
ea
so
nin
g T
ech
niq
ue
s
Hybrid Reasoning Figure 4 Alternative view of Figure 3 separating Goal/Strategy and Indicator Hierarchies showing Application of Reasoning Techniques
3.2 Reasoning with BIM Models using Goal Modeling Techniques
In this section, we explore application of an existing goal model reasoning
technique in order to evaluate specific strategies and discover alternative
strategies.
3.2.1 Evaluation of Specific Strategies
Goal-Oriented Requirements Engineering has studied the problem of systematic
exploration of alternative designs for achieving specified goals. In some cases, a
manager has specific strategies and she wants to compare them relative to given
root goals (in order to eventually select one). A bottom-up/forward reasoning
algorithm (e.g., [15], [19], [27–30]) starts with an assignment of satisfaction
values to some goals in a goal model. Such an assignment corresponds to a
particular strategy to fulfill root goals. It then forward propagates these input
values to the root goals, according to a set of pre-defined propagation rules.
Most goal-oriented analysis procedures support either qualitative or quantitative
reasoning. Qualitative or quantitative values or label are assigned to or computed
for each connected goal in the model. These values represent the level of positive
and/or negative evidence received via relationships from other goals, which
themselves have positive and/or negative evidence. Goal model propagation
specifies what level of evidence propagated through what relationships produces
what resulting level of evidence. Procedures described in [15], [19], [28], [29]
support a qualitative scale of satisfied and denied levels. For example, the
procedure in [19] supports two variables over each goal: goals have satisfiability
(S) values but also deniability (D) values. During label propagation, a goal can be
both “partially/fully satisfied” (PS/FS) and “partially/fully denied” (PD, FD). For
13
a goal, G1, these values are recorded by functions Sat(g1) and Den(g1),
respectively. Sat and Den values belong to the set {N, P, F} (none, partial, full).
For simplicity, the same information can be recorded using predicates FS, PS, PD,
and FD, over goals, to represent their level of satisfaction or denial (e.g., PS(g)
being true corresponds to Sat(g)=’P’). Typically, predicate labels are written on
models as shorthand representing the level of satisfaction or denial in analysis
results.
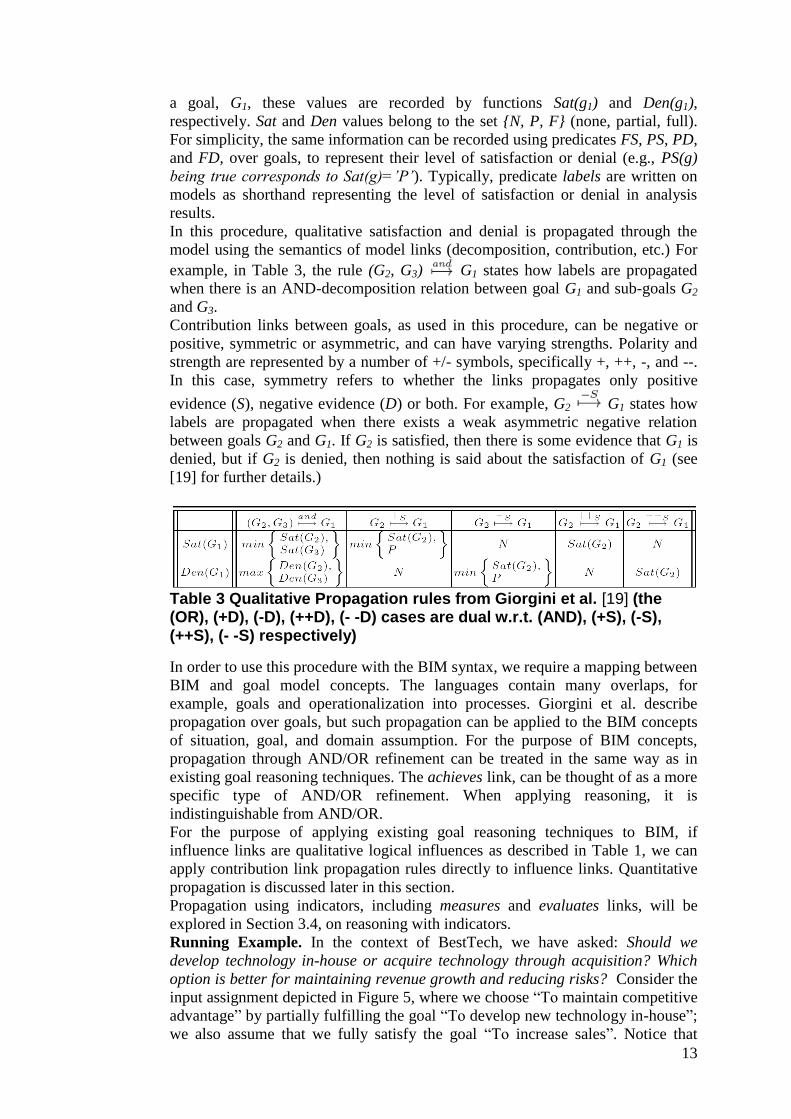
In this procedure, qualitative satisfaction and denial is propagated through the
model using the semantics of model links (decomposition, contribution, etc.) For
example, in Table 3, the rule (G2, G3) G1 states how labels are propagated
when there is an AND-decomposition relation between goal G1 and sub-goals G2
and G3.
Contribution links between goals, as used in this procedure, can be negative or
positive, symmetric or asymmetric, and can have varying strengths. Polarity and
strength are represented by a number of +/- symbols, specifically +, ++, -, and --.
In this case, symmetry refers to whether the links propagates only positive
evidence (S), negative evidence (D) or both. For example, G2 G1 states how
labels are propagated when there exists a weak asymmetric negative relation
between goals G2 and G1. If G2 is satisfied, then there is some evidence that G1 is
denied, but if G2 is denied, then nothing is said about the satisfaction of G1 (see
[19] for further details.)
Table 3 Qualitative Propagation rules from Giorgini et al. [19] (the (OR), (+D), (-D), (++D), (- -D) cases are dual w.r.t. (AND), (+S), (-S), (++S), (- -S) respectively)
In order to use this procedure with the BIM syntax, we require a mapping between
BIM and goal model concepts. The languages contain many overlaps, for
example, goals and operationalization into processes. Giorgini et al. describe
propagation over goals, but such propagation can be applied to the BIM concepts
of situation, goal, and domain assumption. For the purpose of BIM concepts,
propagation through AND/OR refinement can be treated in the same way as in
existing goal reasoning techniques. The achieves link, can be thought of as a more
specific type of AND/OR refinement. When applying reasoning, it is
indistinguishable from AND/OR.
For the purpose of applying existing goal reasoning techniques to BIM, if
influence links are qualitative logical influences as described in Table 1, we can
apply contribution link propagation rules directly to influence links. Quantitative
propagation is discussed later in this section.
Propagation using indicators, including measures and evaluates links, will be
explored in Section 3.4, on reasoning with indicators.
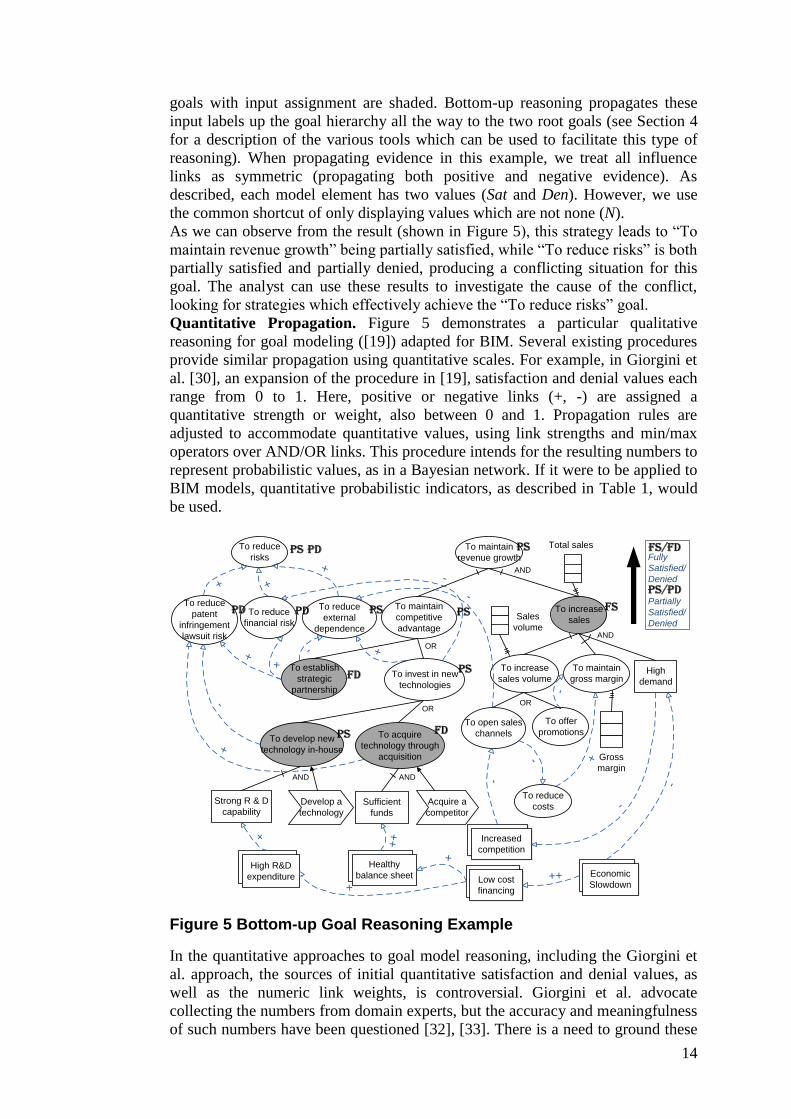
Running Example. In the context of BestTech, we have asked: Should we
develop technology in-house or acquire technology through acquisition? Which
option is better for maintaining revenue growth and reducing risks? Consider the
input assignment depicted in Figure 5, where we choose “To maintain competitive
advantage” by partially fulfilling the goal “To develop new technology in-house”;
we also assume that we fully satisfy the goal “To increase sales”. Notice that
14
goals with input assignment are shaded. Bottom-up reasoning propagates these
input labels up the goal hierarchy all the way to the two root goals (see Section 4
for a description of the various tools which can be used to facilitate this type of
reasoning). When propagating evidence in this example, we treat all influence
links as symmetric (propagating both positive and negative evidence). As
described, each model element has two values (Sat and Den). However, we use
the common shortcut of only displaying values which are not none (N).
As we can observe from the result (shown in Figure 5), this strategy leads to “To
maintain revenue growth” being partially satisfied, while “To reduce risks” is both
partially satisfied and partially denied, producing a conflicting situation for this
goal. The analyst can use these results to investigate the cause of the conflict,
looking for strategies which effectively achieve the “To reduce risks” goal.
Quantitative Propagation. Figure 5 demonstrates a particular qualitative
reasoning for goal modeling ([19]) adapted for BIM. Several existing procedures
provide similar propagation using quantitative scales. For example, in Giorgini et
al. [30], an expansion of the procedure in [19], satisfaction and denial values each
range from 0 to 1. Here, positive or negative links (+, -) are assigned a
quantitative strength or weight, also between 0 and 1. Propagation rules are
adjusted to accommodate quantitative values, using link strengths and min/max
operators over AND/OR links. This procedure intends for the resulting numbers to
represent probabilistic values, as in a Bayesian network. If it were to be applied to
BIM models, quantitative probabilistic indicators, as described in Table 1, would
be used.
To open sales
channels
To increase
sales
Increased
competition
To acquire
technology through
acquisition
To develop new
technology in-house
To reduce
risks
To reduce
patent
infringement
lawsuit risk
To reduce
external
dependence
To establish
strategic
partnership
-
To reduce
financial risk
+
+
To invest in new
technologies
-
To maintain
competitive
advantage
+
+
Acquire a
competitor
Develop a
technology
+
++
Sufficient
funds
Strong R & D
capability
High
demand
To maintain
revenue growth
To increase
sales volume
To maintain
gross margin
-
To offer
promotions
-
+
To reduce
costs
-
-
-
Total sales
Sales
volume
Gross
margin
-
Economic
Slowdown
Healthy
balance sheet High R&D
expenditure Low cost
financing
+++
+
+
-
++
AND
ANDAND
AND
OR
OR
OR
PSPD
FD
PS FSPD PD PS
PS
FDPS
PS
Fully
Satisfied/
Denied
Partially
Satisfied/
Denied
FS/FD
PS/PD
Figure 5 Bottom-up Goal Reasoning Example
In the quantitative approaches to goal model reasoning, including the Giorgini et
al. approach, the sources of initial quantitative satisfaction and denial values, as
well as the numeric link weights, is controversial. Giorgini et al. advocate
collecting the numbers from domain experts, but the accuracy and meaningfulness
of such numbers have been questioned [32], [33]. There is a need to ground these
15
numbers in realistic business measures. We address this issue by attaching
indicators to goals and other model elements, grounding quantitative data in real
data. We describe the use of indicators in BIM reasoning in Section 3.4.
3.2.2 Discovering Alternative Strategies
In other cases, a manager may be interested in finding possible viable alternatives
within a model, given certain constraints. Given a goal model and an assignment
of desired satisfaction values (either qualitative or quantitative) to its root goals, a
top-down/backward reasoning algorithm [30], [34] can look for an assignment
(strategies) to leaf goals, processes and domain assumptions that lead to the
desired satisfaction values of those root goals.
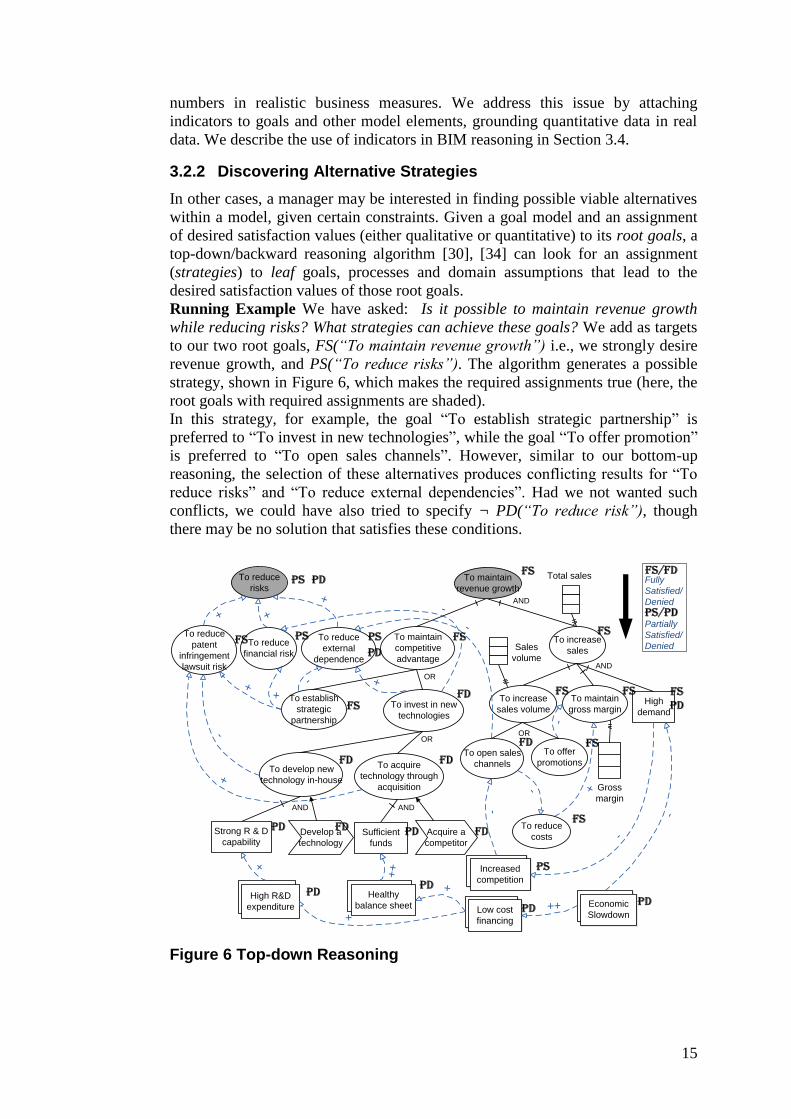
Running Example We have asked: Is it possible to maintain revenue growth
while reducing risks? What strategies can achieve these goals? We add as targets
to our two root goals, FS(“To maintain revenue growth”) i.e., we strongly desire
revenue growth, and PS(“To reduce risks”). The algorithm generates a possible
strategy, shown in Figure 6, which makes the required assignments true (here, the
root goals with required assignments are shaded).
In this strategy, for example, the goal “To establish strategic partnership” is
preferred to “To invest in new technologies”, while the goal “To offer promotion”
is preferred to “To open sales channels”. However, similar to our bottom-up
reasoning, the selection of these alternatives produces conflicting results for “To
reduce risks” and “To reduce external dependencies”. Had we not wanted such
conflicts, we could have also tried to specify ¬ PD(“To reduce risk”), though
there may be no solution that satisfies these conditions.
To open sales
channels
To increase
sales
Increased
competition
To acquire
technology through
acquisition
To develop new
technology in-house
To reduce
risks
To reduce
patent
infringement
lawsuit risk
To reduce
external
dependence
To establish
strategic
partnership
-
To reduce
financial risk
+
+
To invest in new
technologies
-
To maintain
competitive
advantage
+
+
Acquire a
competitor
Develop a
technology
+
++
Sufficient
funds
Strong R & D
capability
High
demand
To maintain
revenue growth
To increase
sales volume
To maintain
gross margin
-
To offer
promotions
-
+
To reduce
costs
-
-
-
Total sales
Sales
volume
Gross
margin
-
Economic
Slowdown
Healthy
balance sheet High R&D
expenditure Low cost
financing
+++
+
+
-
++
AND
ANDAND
AND
OR
OR
OR
FSPS
FS
FS
FSFs
FS
Fs
FSFS PS
PD
FD
FD
FDFD
PS
PD
Fully
Satisfied/
Denied
Partially
Satisfied/
Denied
FS/FD
PS/PD
FS
PD
PS
PD
FDFD
PDPD
PD
PD PD
Figure 6 Top-down Reasoning
16
3.3 Probabilistic Evaluation of Strategies
Decision analysis techniques rest on an empirically verified assumption that
humans are capable of framing a decision problem, listing possible decision
options, and quantifying uncertainty, but are rather weak in combining
information into a rational decision. An influence diagram [35] is a decision
model that supports decision-making by computing the expected utility value of
each decision option; the option with the highest utility value is optimal and
should be chosen by the decision maker. Influence diagrams include: decision
nodes for specifying decision options, chance nodes for quantifying uncertainty,
and value nodes for quantifying user preferences using utility functions.
To carry out decision analysis, a BIM model needs to be projected into an
influence diagram. Such projections require a set of translation rules. We
summarize these rules here:
Goals, processes, domain assumptions and situations are translated to
Chance Nodes, meaning that they are they represent uncertain quantities
relevant to the decision problem; the uncertainties quantified by
conditional probability distributions.
Each AND-Decomposition link is translated into an influence link if the
target node is a Goal; it is removed if the target is a Domain Assumption
(since its truth value is not influenced by whether the parent goal is been
pursued or not). Also notice, an AND-Decomposition is not really a
decision problem; however its translation is necessary in case it belongs to
an OR-Decomposed sub-tree.
Each OR-Decomposition link in BIM is translated into a Decision Node.
Influence links among Domain Assumptions and Situations, as well as
those having goals as the source or target node, are translated into
Influence links. Note that the strength of the original influence link will
not be used in the Influence Diagram; instead the user needs to define the
conditional probability table for the source and target nodes.
Running Example. We outline how probabilistic reasoning would work for a
BIM model using a subset of our example. In Figure 7, we focus on a subset of
the goal model rooted at the goal “To increase sales”. The nodes directly involved
in the decision analysis are shaded. In particular, to pursue the goal “To increase
sales volume”, two decision options are available (according to the OR
decomposition in the original goal model): pursue either the goal “To open sales
channels” or “To offer promotions”. We have previously asked: Should we
develop technology in-house or acquire technology through acquisition? Here we
show an alternative means to answer this analysis question. Notice that the goal
“To maintain gross margin” and the domain assumption “High demand” are
involved in this analysis through influence links. A decision analysis amounts to
answering the question: which of these two sub-goals should be pursued in order
to maximize expected gain for the indicators “Sales volume” and “Gross margin”
(which could then be combined into “Total sales”)?
To reason with an influence diagram, we need to estimate conditional
probabilities of various events, such as high demand (domain assumption) for a
certain product given economic slowdown (its parent node), or high sales volume
given that we open a sales channel vs. we offer a promotion; these events directly
or indirectly affect the outcome of a decision. The possible outcome of a chance
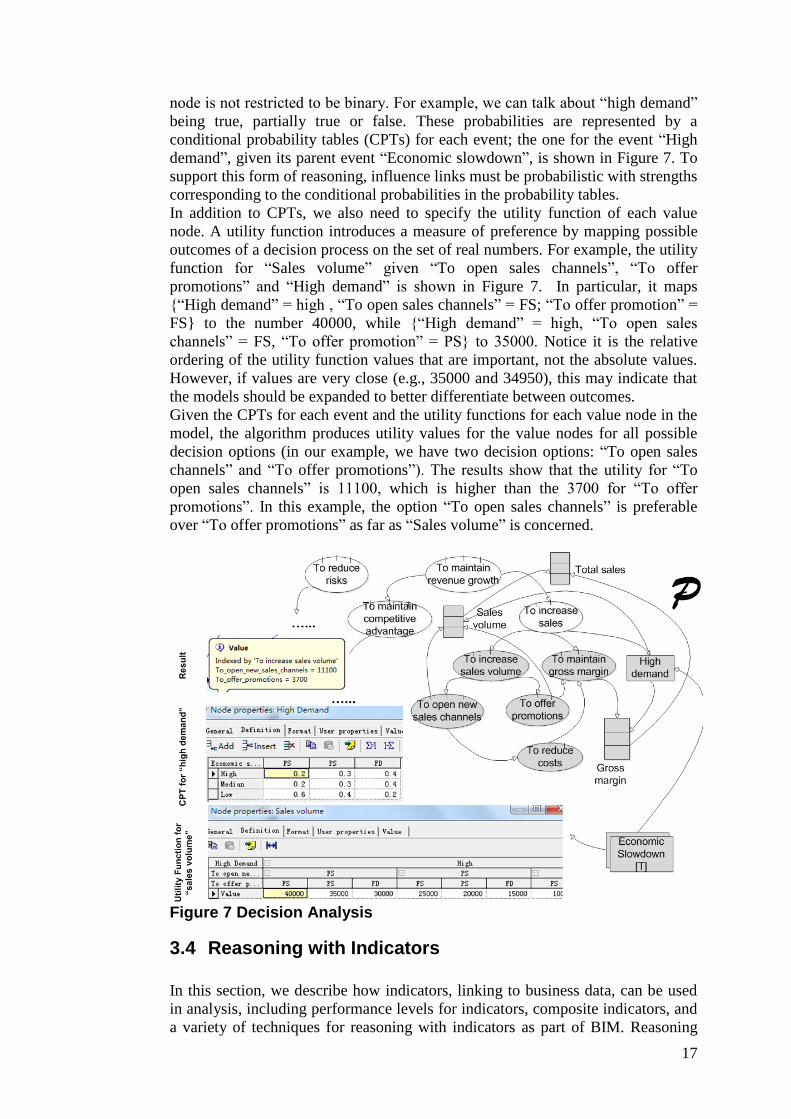
17
node is not restricted to be binary. For example, we can talk about “high demand”
being true, partially true or false. These probabilities are represented by a
conditional probability tables (CPTs) for each event; the one for the event “High
demand”, given its parent event “Economic slowdown”, is shown in Figure 7. To
support this form of reasoning, influence links must be probabilistic with strengths
corresponding to the conditional probabilities in the probability tables.
In addition to CPTs, we also need to specify the utility function of each value
node. A utility function introduces a measure of preference by mapping possible
outcomes of a decision process on the set of real numbers. For example, the utility
function for “Sales volume” given “To open sales channels”, “To offer
promotions” and “High demand” is shown in Figure 7. In particular, it maps
{“High demand” = high , “To open sales channels” = FS; “To offer promotion” =
FS} to the number 40000, while {“High demand” = high, “To open sales
channels” = FS, “To offer promotion” = PS} to 35000. Notice it is the relative
ordering of the utility function values that are important, not the absolute values.
However, if values are very close (e.g., 35000 and 34950), this may indicate that
the models should be expanded to better differentiate between outcomes.
Given the CPTs for each event and the utility functions for each value node in the
model, the algorithm produces utility values for the value nodes for all possible
decision options (in our example, we have two decision options: “To open sales
channels” and “To offer promotions”). The results show that the utility for “To
open sales channels” is 11100, which is higher than the 3700 for “To offer
promotions”. In this example, the option “To open sales channels” is preferable
over “To offer promotions” as far as “Sales volume” is concerned.
Figure 7 Decision Analysis
3.4 Reasoning with Indicators
In this section, we describe how indicators, linking to business data, can be used
in analysis, including performance levels for indicators, composite indicators, and
a variety of techniques for reasoning with indicators as part of BIM. Reasoning
18
techniques include use of mathematical equations derived from business metrics
to propagation rules derived from model structure, making use of unit conversion
or normalization when needed. This section is an expansion and reorganization of
material presented in [11], [12].
3.4.1 Indicator Performance Levels As described in Section 2.2.4, an indicator is a measure, quantitative or
qualitative, of the progress or degree of fulfillment of organization goals. The
subject of an indicator is a particular feature or quality of an element in the
business environment, e.g., the workload of an employee, or the compliance of an
internal process with respect to external regulations. To express why an indicator
is needed, we rely on the evaluates relation. For example, the indicator “Sales
volume” is needed (why) to evaluate the goal “To increase sales volume”.
Each indicator, has a current value (cv) which is evaluated against a set of
parameters: target (value), threshold (value) and worst (value) [22]. The result of
such an evaluation is a normalized value (ranging in [ ] ℝ), which is often
referred to as the performance level for an indicator.
Note that a current value can be assigned by: i) extracting it at run-time from
back-end data sources, (dimensions and levels [22] can be used to filter data from
data warehouses); or ii) supplied by users to explore “what-if” scenarios; or iii)
calculated by a metric expression in the case of composite indicators, as explored
in Section 3.4.4.
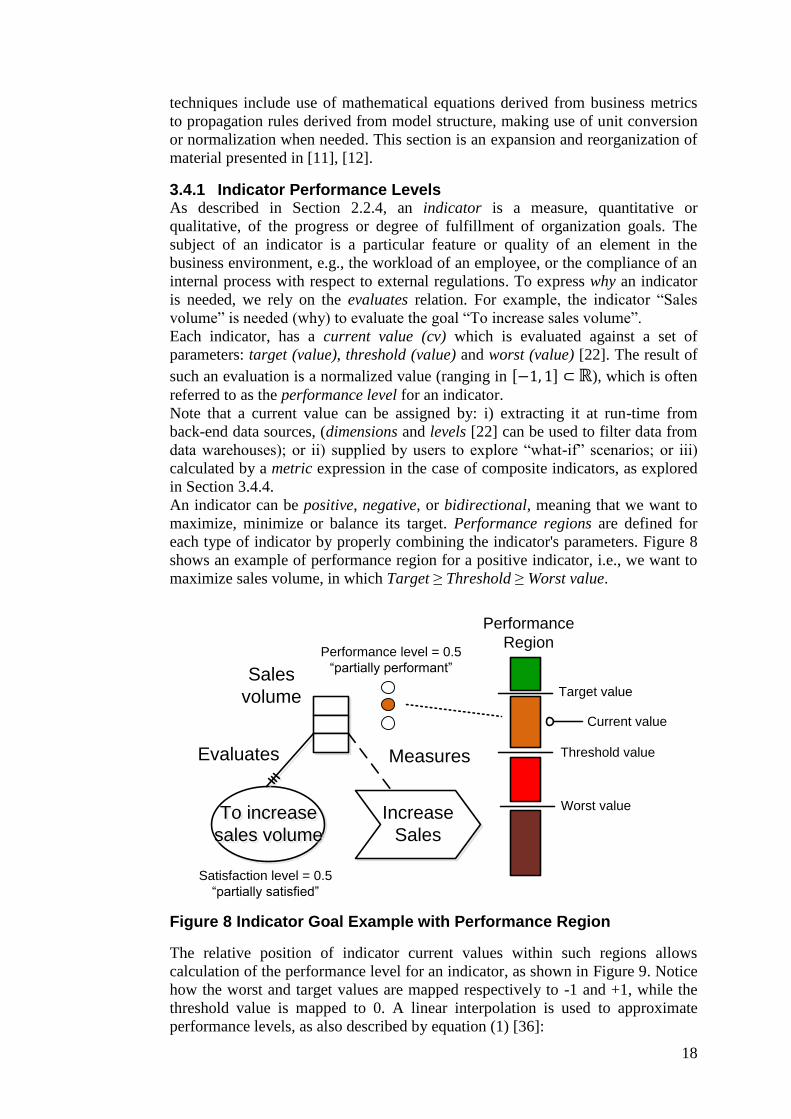
An indicator can be positive, negative, or bidirectional, meaning that we want to
maximize, minimize or balance its target. Performance regions are defined for
each type of indicator by properly combining the indicator's parameters. Figure 8
shows an example of performance region for a positive indicator, i.e., we want to
maximize sales volume, in which Target ≥ Threshold ≥ Worst value.
To increase
sales volume
To increase
sales volume
Sales
volume
Increase
Sales
Evaluates Measures
Performance
Region
Target value
Current value
Threshold value
Worst value
Performance level = 0.5
“partially performant”
Satisfaction level = 0.5
“partially satisfied”
Figure 8 Indicator Goal Example with Performance Region
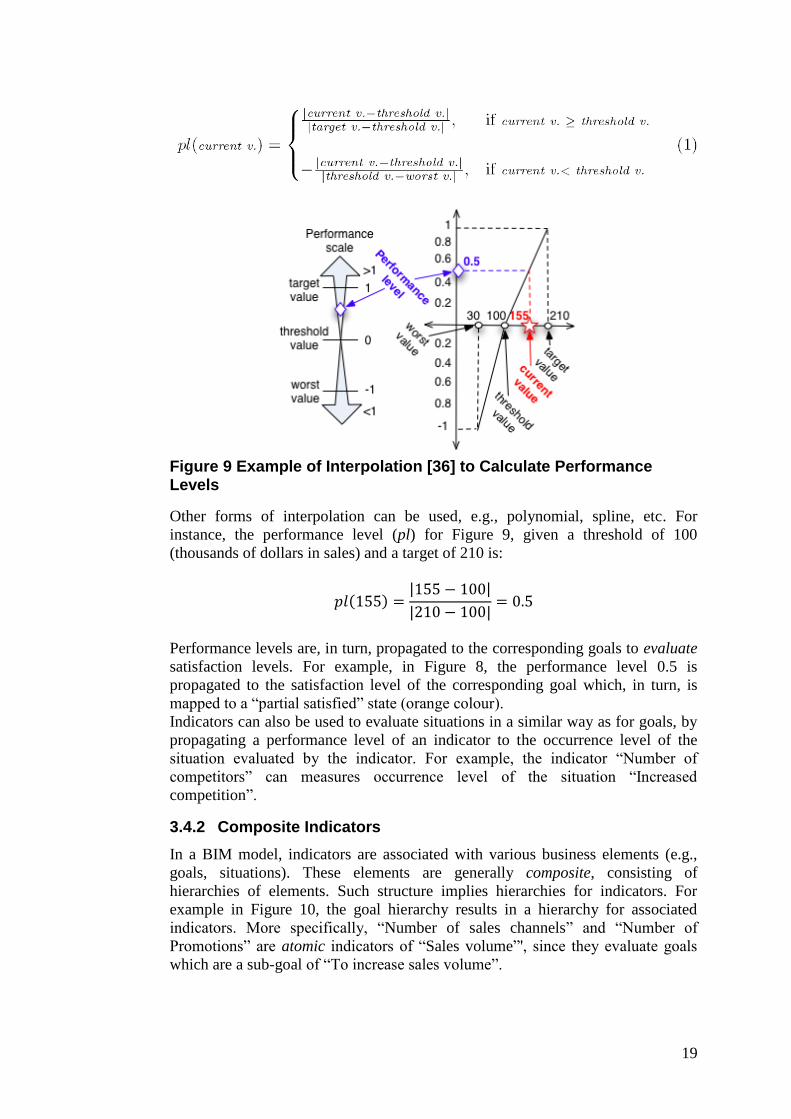
The relative position of indicator current values within such regions allows
calculation of the performance level for an indicator, as shown in Figure 9. Notice
how the worst and target values are mapped respectively to -1 and +1, while the
threshold value is mapped to 0. A linear interpolation is used to approximate
performance levels, as also described by equation (1) [36]:
19
Figure 9 Example of Interpolation [36] to Calculate Performance Levels
Other forms of interpolation can be used, e.g., polynomial, spline, etc. For
instance, the performance level (pl) for Figure 9, given a threshold of 100
(thousands of dollars in sales) and a target of 210 is:
( ) | |
| |
Performance levels are, in turn, propagated to the corresponding goals to evaluate
satisfaction levels. For example, in Figure 8, the performance level 0.5 is
propagated to the satisfaction level of the corresponding goal which, in turn, is
mapped to a “partial satisfied” state (orange colour).
Indicators can also be used to evaluate situations in a similar way as for goals, by
propagating a performance level of an indicator to the occurrence level of the
situation evaluated by the indicator. For example, the indicator “Number of
competitors” can measures occurrence level of the situation “Increased
competition”.
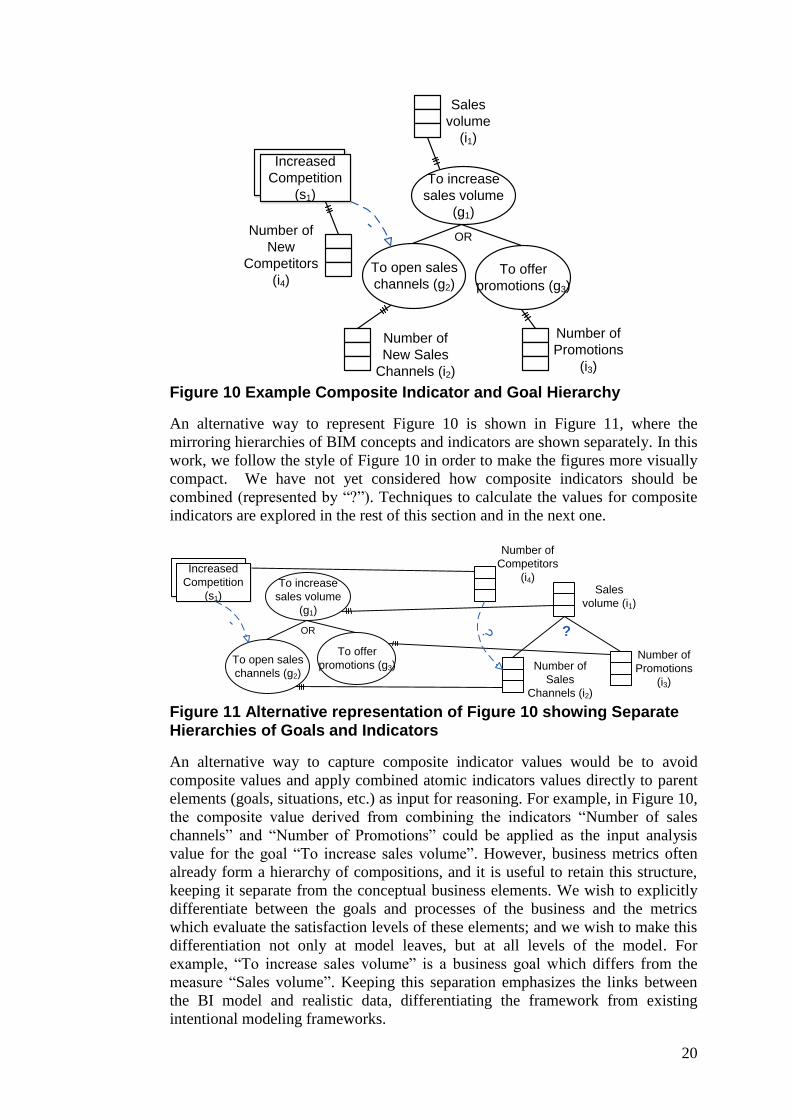
3.4.2 Composite Indicators
In a BIM model, indicators are associated with various business elements (e.g.,
goals, situations). These elements are generally composite, consisting of
hierarchies of elements. Such structure implies hierarchies for indicators. For
example in Figure 10, the goal hierarchy results in a hierarchy for associated
indicators. More specifically, “Number of sales channels” and “Number of
Promotions” are atomic indicators of “Sales volume”', since they evaluate goals
which are a sub-goal of “To increase sales volume”.
20
To open sales
channels (g2)
To increase
sales volume
(g1)
To offer
promotions (g3)
Sales
volume
(i1)
OR
Number of
New Sales
Channels (i2)
Number of
Promotions
(i3)
Increased
Competition
(s1)
-
Number of
New
Competitors
(i4)
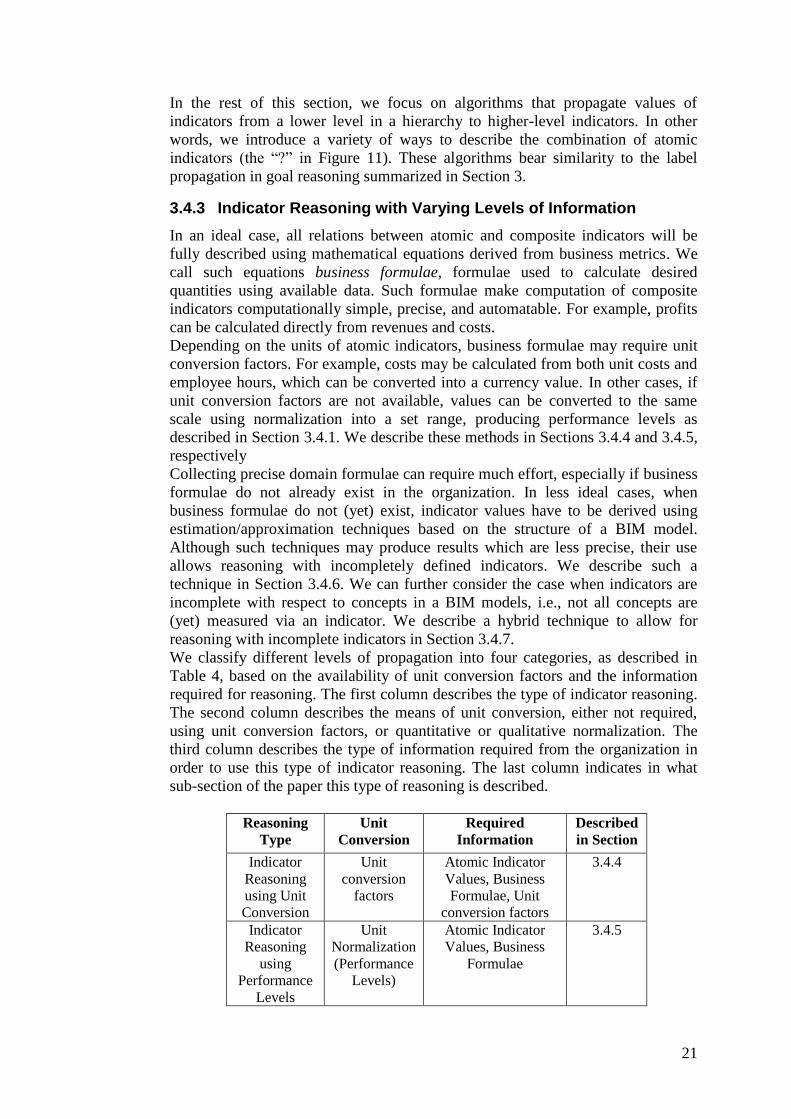
Figure 10 Example Composite Indicator and Goal Hierarchy
An alternative way to represent Figure 10 is shown in Figure 11, where the
mirroring hierarchies of BIM concepts and indicators are shown separately. In this
work, we follow the style of Figure 10 in order to make the figures more visually
compact. We have not yet considered how composite indicators should be
combined (represented by “?”). Techniques to calculate the values for composite
indicators are explored in the rest of this section and in the next one.
To open sales
channels (g2)
To increase
sales volume
(g1)
Sales
volume (i1)
OR
Number of
Sales
Channels (i2)
Number of
Promotions
(i3)
Increased
Competition
(s1)
-
Number of
Competitors
(i4)
? ?
To offer
promotions (g3)
Figure 11 Alternative representation of Figure 10 showing Separate Hierarchies of Goals and Indicators
An alternative way to capture composite indicator values would be to avoid
composite values and apply combined atomic indicators values directly to parent
elements (goals, situations, etc.) as input for reasoning. For example, in Figure 10,
the composite value derived from combining the indicators “Number of sales
channels” and “Number of Promotions” could be applied as the input analysis
value for the goal “To increase sales volume”. However, business metrics often
already form a hierarchy of compositions, and it is useful to retain this structure,
keeping it separate from the conceptual business elements. We wish to explicitly
differentiate between the goals and processes of the business and the metrics
which evaluate the satisfaction levels of these elements; and we wish to make this
differentiation not only at model leaves, but at all levels of the model. For
example, “To increase sales volume” is a business goal which differs from the
measure “Sales volume”. Keeping this separation emphasizes the links between
the BI model and realistic data, differentiating the framework from existing
intentional modeling frameworks.
21
In the rest of this section, we focus on algorithms that propagate values of
indicators from a lower level in a hierarchy to higher-level indicators. In other
words, we introduce a variety of ways to describe the combination of atomic
indicators (the “?” in Figure 11). These algorithms bear similarity to the label
propagation in goal reasoning summarized in Section 3.
3.4.3 Indicator Reasoning with Varying Levels of Information
In an ideal case, all relations between atomic and composite indicators will be
fully described using mathematical equations derived from business metrics. We
call such equations business formulae, formulae used to calculate desired
quantities using available data. Such formulae make computation of composite
indicators computationally simple, precise, and automatable. For example, profits
can be calculated directly from revenues and costs.
Depending on the units of atomic indicators, business formulae may require unit
conversion factors. For example, costs may be calculated from both unit costs and
employee hours, which can be converted into a currency value. In other cases, if
unit conversion factors are not available, values can be converted to the same
scale using normalization into a set range, producing performance levels as
described in Section 3.4.1. We describe these methods in Sections 3.4.4 and 3.4.5,
respectively
Collecting precise domain formulae can require much effort, especially if business
formulae do not already exist in the organization. In less ideal cases, when
business formulae do not (yet) exist, indicator values have to be derived using
estimation/approximation techniques based on the structure of a BIM model.
Although such techniques may produce results which are less precise, their use
allows reasoning with incompletely defined indicators. We describe such a
technique in Section 3.4.6. We can further consider the case when indicators are
incomplete with respect to concepts in a BIM models, i.e., not all concepts are
(yet) measured via an indicator. We describe a hybrid technique to allow for
reasoning with incomplete indicators in Section 3.4.7.
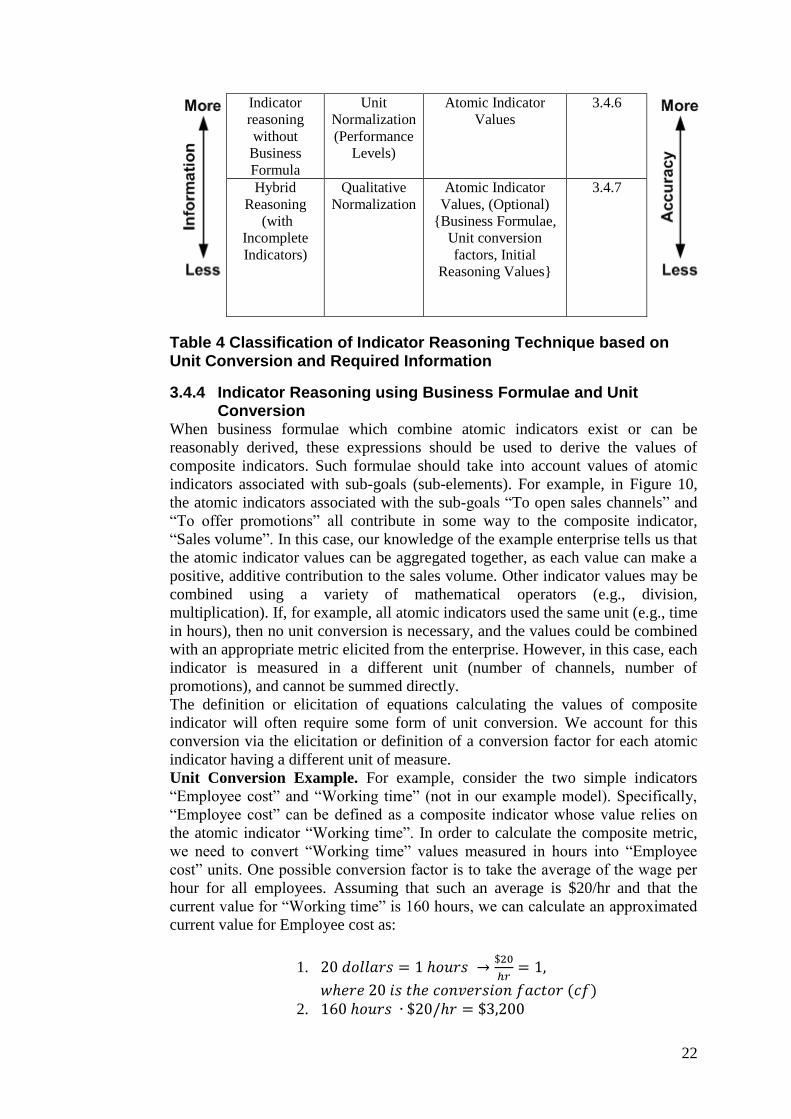
We classify different levels of propagation into four categories, as described in
Table 4, based on the availability of unit conversion factors and the information
required for reasoning. The first column describes the type of indicator reasoning.
The second column describes the means of unit conversion, either not required,
using unit conversion factors, or quantitative or qualitative normalization. The
third column describes the type of information required from the organization in
order to use this type of indicator reasoning. The last column indicates in what
sub-section of the paper this type of reasoning is described.
Reasoning
Type Unit
Conversion Required
Information Described
in Section
Indicator
Reasoning
using Unit
Conversion
Unit
conversion
factors
Atomic Indicator
Values, Business
Formulae, Unit
conversion factors
3.4.4
Indicator
Reasoning
using
Performance
Levels
Unit
Normalization
(Performance
Levels)
Atomic Indicator
Values, Business
Formulae
3.4.5
22
Indicator
reasoning
without
Business
Formula
Unit
Normalization
(Performance
Levels)
Atomic Indicator
Values 3.4.6
Hybrid
Reasoning (with
Incomplete
Indicators)
Qualitative
Normalization Atomic Indicator
Values, (Optional)
{Business Formulae,
Unit conversion
factors, Initial
Reasoning Values}
3.4.7
Table 4 Classification of Indicator Reasoning Technique based on Unit Conversion and Required Information
3.4.4 Indicator Reasoning using Business Formulae and Unit Conversion
When business formulae which combine atomic indicators exist or can be
reasonably derived, these expressions should be used to derive the values of
composite indicators. Such formulae should take into account values of atomic
indicators associated with sub-goals (sub-elements). For example, in Figure 10,
the atomic indicators associated with the sub-goals “To open sales channels” and
“To offer promotions” all contribute in some way to the composite indicator,
“Sales volume”. In this case, our knowledge of the example enterprise tells us that
the atomic indicator values can be aggregated together, as each value can make a
positive, additive contribution to the sales volume. Other indicator values may be
combined using a variety of mathematical operators (e.g., division,
multiplication). If, for example, all atomic indicators used the same unit (e.g., time
in hours), then no unit conversion is necessary, and the values could be combined
with an appropriate metric elicited from the enterprise. However, in this case, each
indicator is measured in a different unit (number of channels, number of
promotions), and cannot be summed directly.
The definition or elicitation of equations calculating the values of composite
indicator will often require some form of unit conversion. We account for this
conversion via the elicitation or definition of a conversion factor for each atomic
indicator having a different unit of measure.
Unit Conversion Example. For example, consider the two simple indicators
“Employee cost” and “Working time” (not in our example model). Specifically,
“Employee cost” can be defined as a composite indicator whose value relies on
the atomic indicator “Working time”. In order to calculate the composite metric,
we need to convert “Working time” values measured in hours into “Employee
cost” units. One possible conversion factor is to take the average of the wage per
hour for all employees. Assuming that such an average is $20/hr and that the
current value for “Working time” is 160 hours, we can calculate an approximated
current value for Employee cost as:
1.
( ) 2.
23
We will refer to a conversion factor using a function that maps the indicator being
converted to the composite indicator using the conversion: cf(source, destination).
Notice that in many cases a conversion factor is an estimate based on previous
experience or statistics. For example, the average wage per hour could be $30
instead of $20 for a different company.
Running Example. In our Figure 10 example, elicitation in the particular
enterprise could reveal that during a certain time period each sales channel
produces, on average, an additional $20,000 in sales, and that each promotion
produces, on average, $7,000 in sales. Thus, if sales volume is measured in
thousands of dollars, the conversion factors for each sub-goal are 20 and 7,
respectively. Potentially, an indicator could have multiple conversion factors, if,
for example, it influences or is a refinement in more than one expression
measuring a composite indicator. The conversion factors (cf) for our example
subgoals are cf(i2, i1) = 20 and cf(i3, i1) = 7, respectively.
When conversions are impossible, e.g., converting gallons to square feet, we have
to fall back to a “normalized” approach or to a “qualitative” one; these are
presented, respectively, in Sections 3.4.5 and 3.4.6.
Once the conversion factors have been determined, the expression representing
the business metric can be constructed. In this case, “Sales volume” is calculated
by:
( ) ( ) ( ) ( ) ( ) ( )
where cv(i) is the current value of an indicator, i, derived from data sources. In
addition to factors from indicators associated with sub-goals, we must consider
other business elements such as goals or situations that influence the goal. In the
previous example, we have the situation “Increased competition”, which
influences negatively the “To open sales channels” goal. The “Increased
competition” situation is evaluated by the indicator “Number of competitors”. We
can use a mathematic expression to capture the influence of the situation on the
goal by expressing how the indicator associated with the situation (i4) affects the
value for the indicator associated with the goal (i2). Elicitation within the
enterprise could reveal that each competitor reduces the number of sales channels
by, on average, 2 channels (cf(i4, i2) = 2). This parameter must be chosen
accurately by the designer who must rely on her/his domain experience and/or
estimates of historical data. We can express the combined effect of situation s1 on
goal g2 using the following expression:
( ) ( ) ( ) ( ) ( )
In particular, i4 is the current value of the indicator “Number of competitors”, and
cf(i4, i2) is the conversion factor (in this case, 2) used to convert the indicator
value into a number of sales channels (the unit of i2).
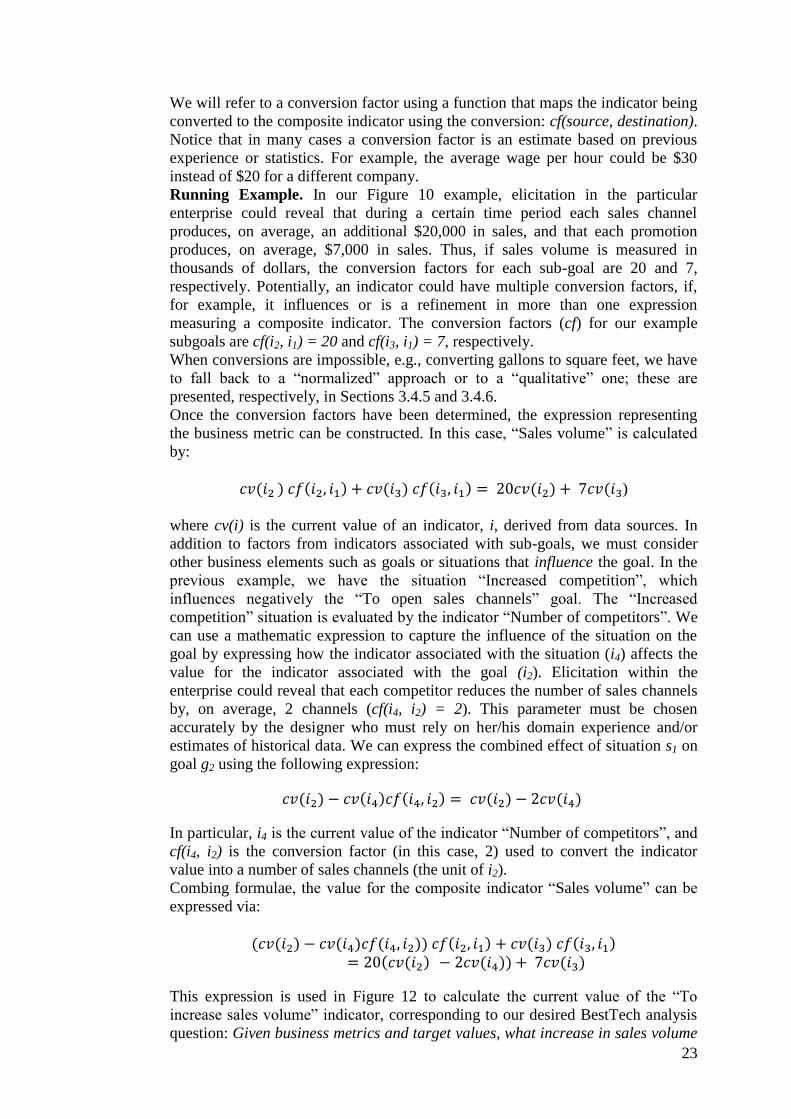
Combing formulae, the value for the composite indicator “Sales volume” can be
expressed via:
( ( ) ( ) ( )) ( ) ( ) ( ) ( ( ) ( )) ( )
This expression is used in Figure 12 to calculate the current value of the “To
increase sales volume” indicator, corresponding to our desired BestTech analysis
question: Given business metrics and target values, what increase in sales volume
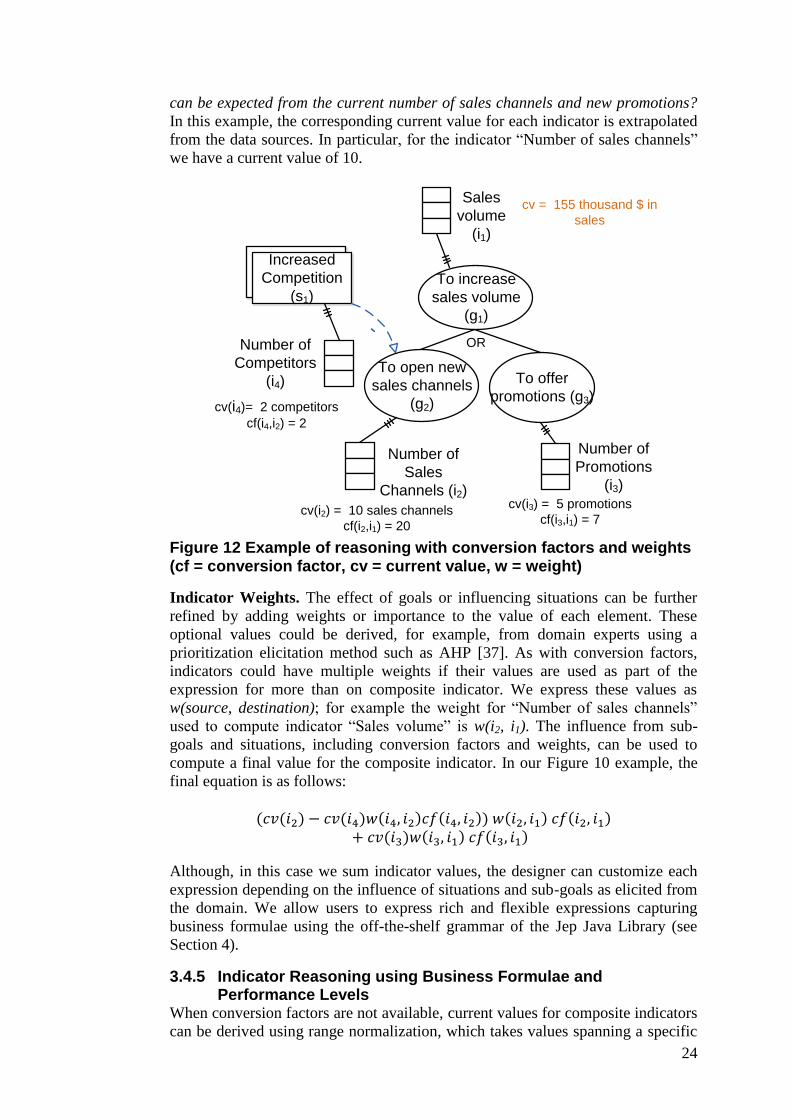
24
can be expected from the current number of sales channels and new promotions?
In this example, the corresponding current value for each indicator is extrapolated
from the data sources. In particular, for the indicator “Number of sales channels”
we have a current value of 10.
To open new
sales channels
(g2)
To increase
sales volume
(g1)
To offer
promotions (g3)
Sales
volume
(i1)
OR
Number of
Sales
Channels (i2)
Number of
Promotions
(i3)
Increased
Competition
(s1)
-
Number of
Competitors
(i4)
cv(i3) = 5 promotions
cf(i3,i1) = 7cv(i2) = 10 sales channels
cf(i2,i1) = 20
cv(i4)= 2 competitors
cf(i4,i2) = 2
cv = 155 thousand $ in
sales
Figure 12 Example of reasoning with conversion factors and weights (cf = conversion factor, cv = current value, w = weight)
Indicator Weights. The effect of goals or influencing situations can be further
refined by adding weights or importance to the value of each element. These
optional values could be derived, for example, from domain experts using a
prioritization elicitation method such as AHP [37]. As with conversion factors,
indicators could have multiple weights if their values are used as part of the
expression for more than on composite indicator. We express these values as
w(source, destination); for example the weight for “Number of sales channels”
used to compute indicator “Sales volume” is w(i2, i1). The influence from sub-
goals and situations, including conversion factors and weights, can be used to
compute a final value for the composite indicator. In our Figure 10 example, the
final equation is as follows:
( ( ) ( ) ( ) ( )) ( ) ( ) ( ) ( ) ( )
Although, in this case we sum indicator values, the designer can customize each
expression depending on the influence of situations and sub-goals as elicited from
the domain. We allow users to express rich and flexible expressions capturing
business formulae using the off-the-shelf grammar of the Jep Java Library (see
Section 4).
3.4.5 Indicator Reasoning using Business Formulae and Performance Levels
When conversion factors are not available, current values for composite indicators
can be derived using range normalization, which takes values spanning a specific
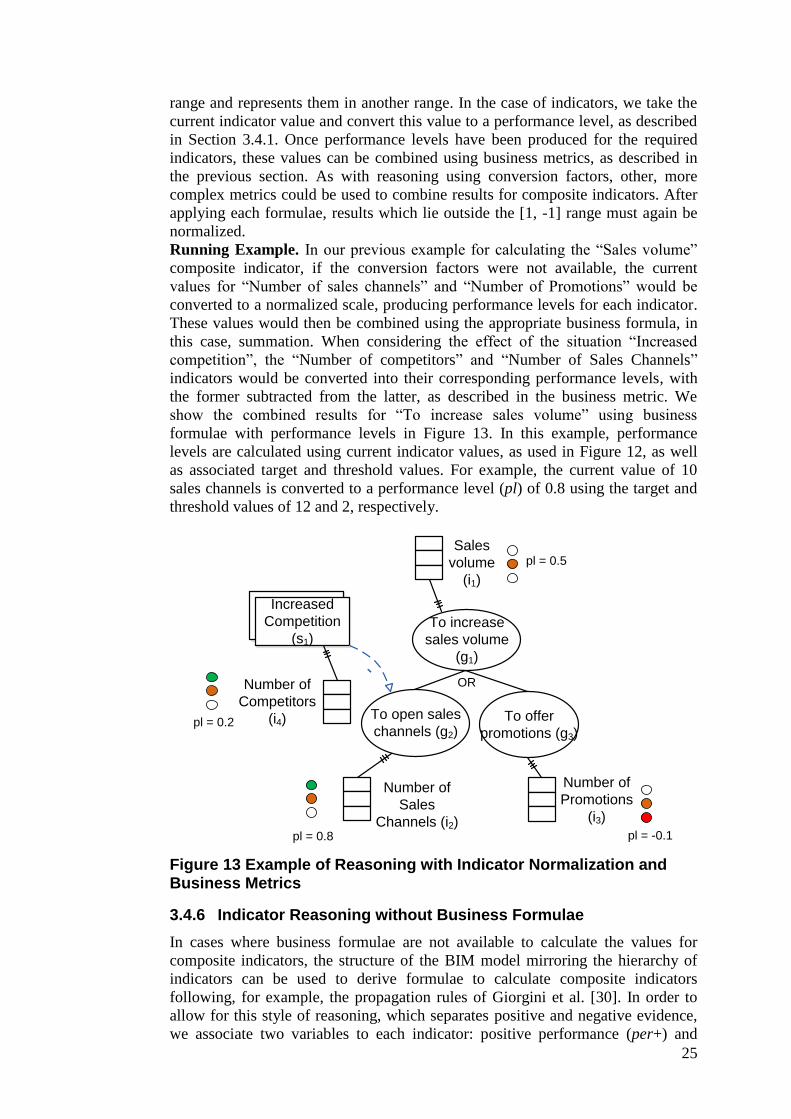
25
range and represents them in another range. In the case of indicators, we take the
current indicator value and convert this value to a performance level, as described
in Section 3.4.1. Once performance levels have been produced for the required
indicators, these values can be combined using business metrics, as described in
the previous section. As with reasoning using conversion factors, other, more
complex metrics could be used to combine results for composite indicators. After
applying each formulae, results which lie outside the [1, -1] range must again be
normalized.
Running Example. In our previous example for calculating the “Sales volume”
composite indicator, if the conversion factors were not available, the current
values for “Number of sales channels” and “Number of Promotions” would be
converted to a normalized scale, producing performance levels for each indicator.
These values would then be combined using the appropriate business formula, in
this case, summation. When considering the effect of the situation “Increased
competition”, the “Number of competitors” and “Number of Sales Channels”
indicators would be converted into their corresponding performance levels, with
the former subtracted from the latter, as described in the business metric. We
show the combined results for “To increase sales volume” using business
formulae with performance levels in Figure 13. In this example, performance
levels are calculated using current indicator values, as used in Figure 12, as well
as associated target and threshold values. For example, the current value of 10
sales channels is converted to a performance level (pl) of 0.8 using the target and
threshold values of 12 and 2, respectively.
To open sales
channels (g2)
To increase
sales volume
(g1)
To offer
promotions (g3)
Sales
volume
(i1)
OR
Number of
Sales
Channels (i2)
Number of
Promotions
(i3)
Increased
Competition
(s1)
-
Number of
Competitors
(i4)
pl = -0.1pl = 0.8
pl = 0.2
pl = 0.5
Figure 13 Example of Reasoning with Indicator Normalization and Business Metrics
3.4.6 Indicator Reasoning without Business Formulae
In cases where business formulae are not available to calculate the values for
composite indicators, the structure of the BIM model mirroring the hierarchy of
indicators can be used to derive formulae to calculate composite indicators
following, for example, the propagation rules of Giorgini et al. [30]. In order to
allow for this style of reasoning, which separates positive and negative evidence,
we associate two variables to each indicator: positive performance (per+) and
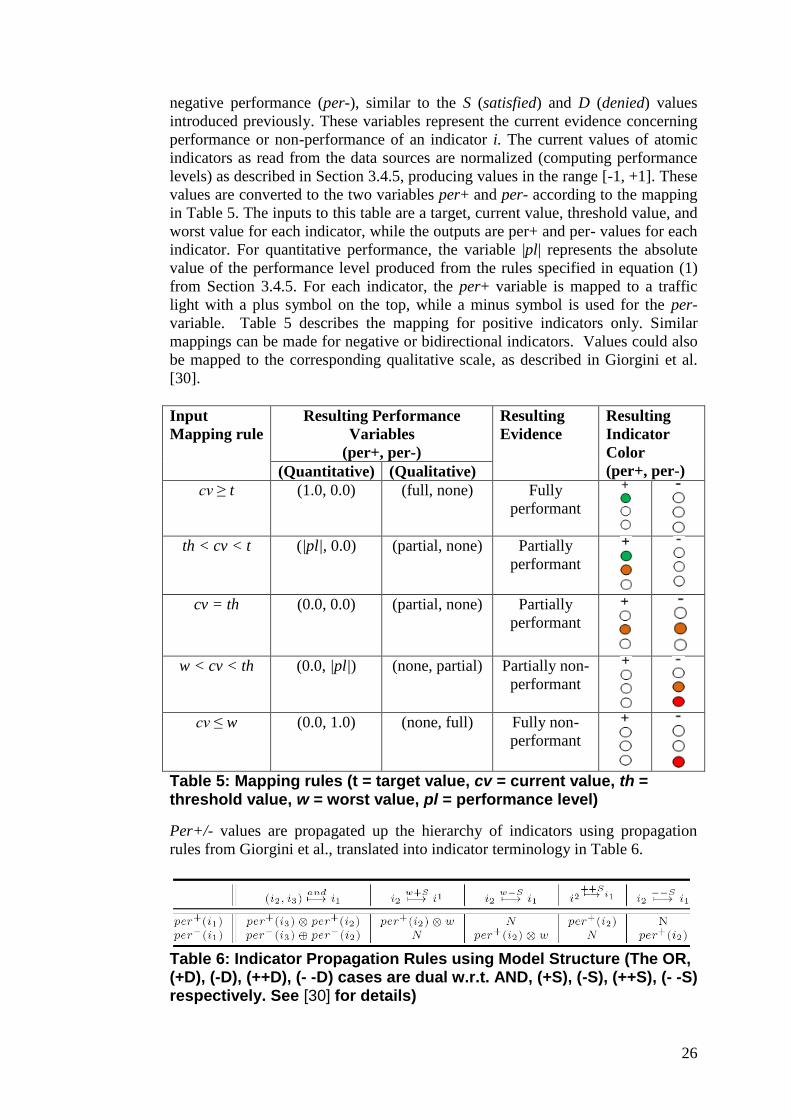
26
negative performance (per-), similar to the S (satisfied) and D (denied) values
introduced previously. These variables represent the current evidence concerning
performance or non-performance of an indicator i. The current values of atomic
indicators as read from the data sources are normalized (computing performance
levels) as described in Section 3.4.5, producing values in the range [-1, +1]. These
values are converted to the two variables per+ and per- according to the mapping
in Table 5. The inputs to this table are a target, current value, threshold value, and
worst value for each indicator, while the outputs are per+ and per- values for each
indicator. For quantitative performance, the variable |pl| represents the absolute
value of the performance level produced from the rules specified in equation (1)
from Section 3.4.5. For each indicator, the per+ variable is mapped to a traffic
light with a plus symbol on the top, while a minus symbol is used for the per-
variable. Table 5 describes the mapping for positive indicators only. Similar
mappings can be made for negative or bidirectional indicators. Values could also
be mapped to the corresponding qualitative scale, as described in Giorgini et al.
[30].
Input
Mapping rule
Resulting Performance
Variables
(per+, per-)
Resulting
Evidence
Resulting
Indicator
Color
(per+, per-) (Quantitative) (Qualitative)
cv ≥ t (1.0, 0.0) (full, none) Fully
performant
th < cv < t (|pl|, 0.0) (partial, none) Partially
performant
cv = th (0.0, 0.0) (partial, none) Partially
performant
w < cv < th (0.0, |pl|) (none, partial) Partially non-
performant
cv ≤ w (0.0, 1.0) (none, full) Fully non-
performant
Table 5: Mapping rules (t = target value, cv = current value, th = threshold value, w = worst value, pl = performance level)
Per+/- values are propagated up the hierarchy of indicators using propagation
rules from Giorgini et al., translated into indicator terminology in Table 6.
Table 6: Indicator Propagation Rules using Model Structure (The OR, (+D), (-D), (++D), (- -D) cases are dual w.r.t. AND, (+S), (-S), (++S), (- -S) respectively. See [30] for details)
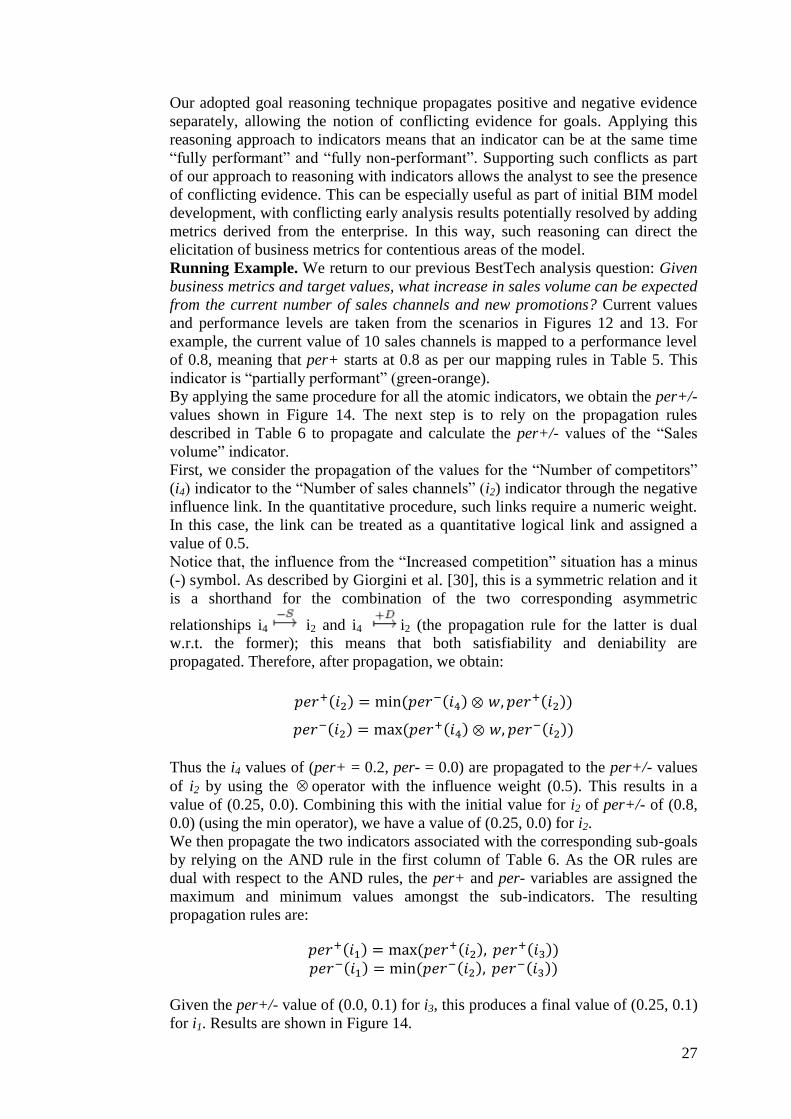
27
Our adopted goal reasoning technique propagates positive and negative evidence
separately, allowing the notion of conflicting evidence for goals. Applying this
reasoning approach to indicators means that an indicator can be at the same time
“fully performant” and “fully non-performant”. Supporting such conflicts as part
of our approach to reasoning with indicators allows the analyst to see the presence
of conflicting evidence. This can be especially useful as part of initial BIM model
development, with conflicting early analysis results potentially resolved by adding
metrics derived from the enterprise. In this way, such reasoning can direct the
elicitation of business metrics for contentious areas of the model.
Running Example. We return to our previous BestTech analysis question: Given
business metrics and target values, what increase in sales volume can be expected
from the current number of sales channels and new promotions? Current values
and performance levels are taken from the scenarios in Figures 12 and 13. For
example, the current value of 10 sales channels is mapped to a performance level
of 0.8, meaning that per+ starts at 0.8 as per our mapping rules in Table 5. This
indicator is “partially performant” (green-orange).
By applying the same procedure for all the atomic indicators, we obtain the per+/-
values shown in Figure 14. The next step is to rely on the propagation rules
described in Table 6 to propagate and calculate the per+/- values of the “Sales
volume” indicator.
First, we consider the propagation of the values for the “Number of competitors”
(i4) indicator to the “Number of sales channels” (i2) indicator through the negative
influence link. In the quantitative procedure, such links require a numeric weight.
In this case, the link can be treated as a quantitative logical link and assigned a
value of 0.5.
Notice that, the influence from the “Increased competition” situation has a minus
(-) symbol. As described by Giorgini et al. [30], this is a symmetric relation and it
is a shorthand for the combination of the two corresponding asymmetric
relationships i4 i2 and i4 i2 (the propagation rule for the latter is dual
w.r.t. the former); this means that both satisfiability and deniability are
propagated. Therefore, after propagation, we obtain:
( ) ( ( ) ⊗ ( ))
( ) ( ( ) ⊗ ( ))
Thus the i4 values of (per+ = 0.2, per- = 0.0) are propagated to the per+/- values
of i2 by using the operator with the influence weight (0.5). This results in a
value of (0.25, 0.0). Combining this with the initial value for i2 of per+/- of (0.8,
0.0) (using the min operator), we have a value of (0.25, 0.0) for i2.
We then propagate the two indicators associated with the corresponding sub-goals
by relying on the AND rule in the first column of Table 6. As the OR rules are
dual with respect to the AND rules, the per+ and per- variables are assigned the
maximum and minimum values amongst the sub-indicators. The resulting
propagation rules are:
( ) ( ( )
( )) ( ) (
( ) ( ))
Given the per+/- value of (0.0, 0.1) for i3, this produces a final value of (0.25, 0.1)
for i1. Results are shown in Figure 14.
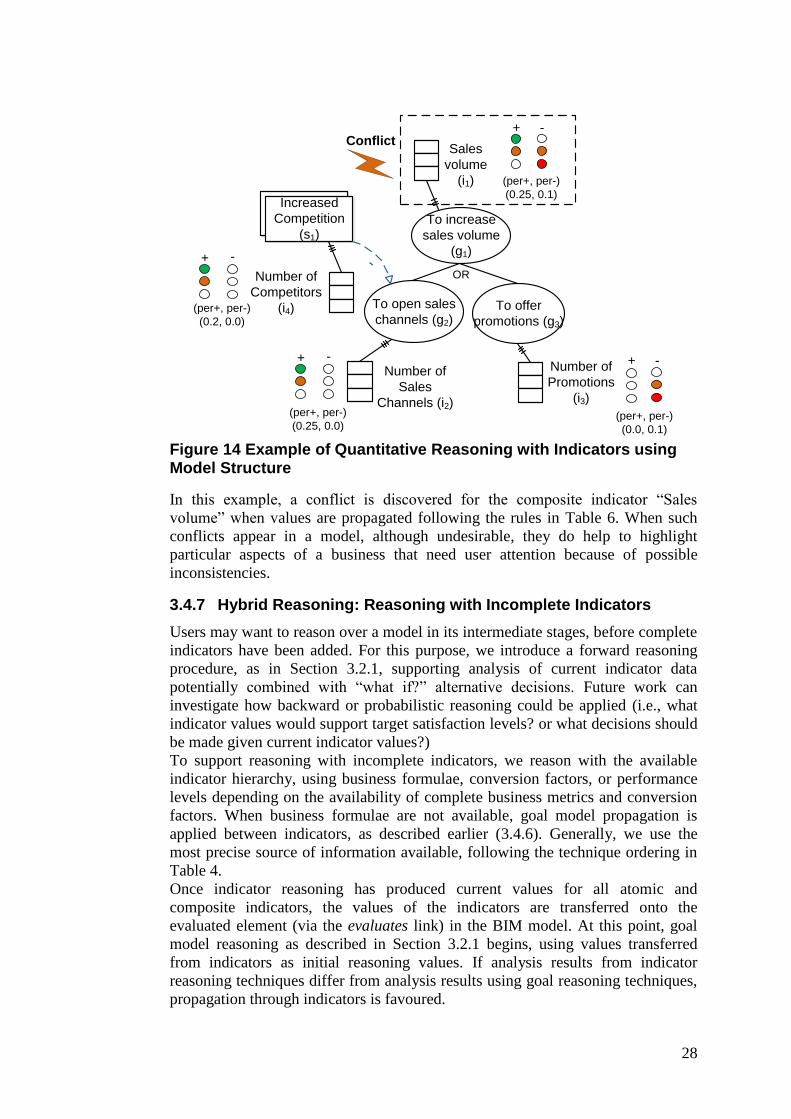
28
To open sales
channels (g2)
To increase
sales volume
(g1)
To offer
promotions (g3)
Sales
volume
(i1)
OR
Number of
Sales
Channels (i2)
Number of
Promotions
(i3)
Increased
Competition
(s1)
-
Number of
Competitors
(i4)(per+, per-)
(0.2, 0.0)
-
(per+, per-)
(0.25, 0.0)(per+, per-)
(0.0, 0.1)
(per+, per-)
(0.25, 0.1)
+
-+
+ -
+ -Conflict
Figure 14 Example of Quantitative Reasoning with Indicators using Model Structure
In this example, a conflict is discovered for the composite indicator “Sales
volume” when values are propagated following the rules in Table 6. When such
conflicts appear in a model, although undesirable, they do help to highlight
particular aspects of a business that need user attention because of possible
inconsistencies.
3.4.7 Hybrid Reasoning: Reasoning with Incomplete Indicators
Users may want to reason over a model in its intermediate stages, before complete
indicators have been added. For this purpose, we introduce a forward reasoning
procedure, as in Section 3.2.1, supporting analysis of current indicator data
potentially combined with “what if?” alternative decisions. Future work can
investigate how backward or probabilistic reasoning could be applied (i.e., what
indicator values would support target satisfaction levels? or what decisions should
be made given current indicator values?)
To support reasoning with incomplete indicators, we reason with the available
indicator hierarchy, using business formulae, conversion factors, or performance
levels depending on the availability of complete business metrics and conversion
factors. When business formulae are not available, goal model propagation is
applied between indicators, as described earlier (3.4.6). Generally, we use the
most precise source of information available, following the technique ordering in
Table 4.
Once indicator reasoning has produced current values for all atomic and
composite indicators, the values of the indicators are transferred onto the
evaluated element (via the evaluates link) in the BIM model. At this point, goal
model reasoning as described in Section 3.2.1 begins, using values transferred
from indicators as initial reasoning values. If analysis results from indicator
reasoning techniques differ from analysis results using goal reasoning techniques,
propagation through indicators is favoured.
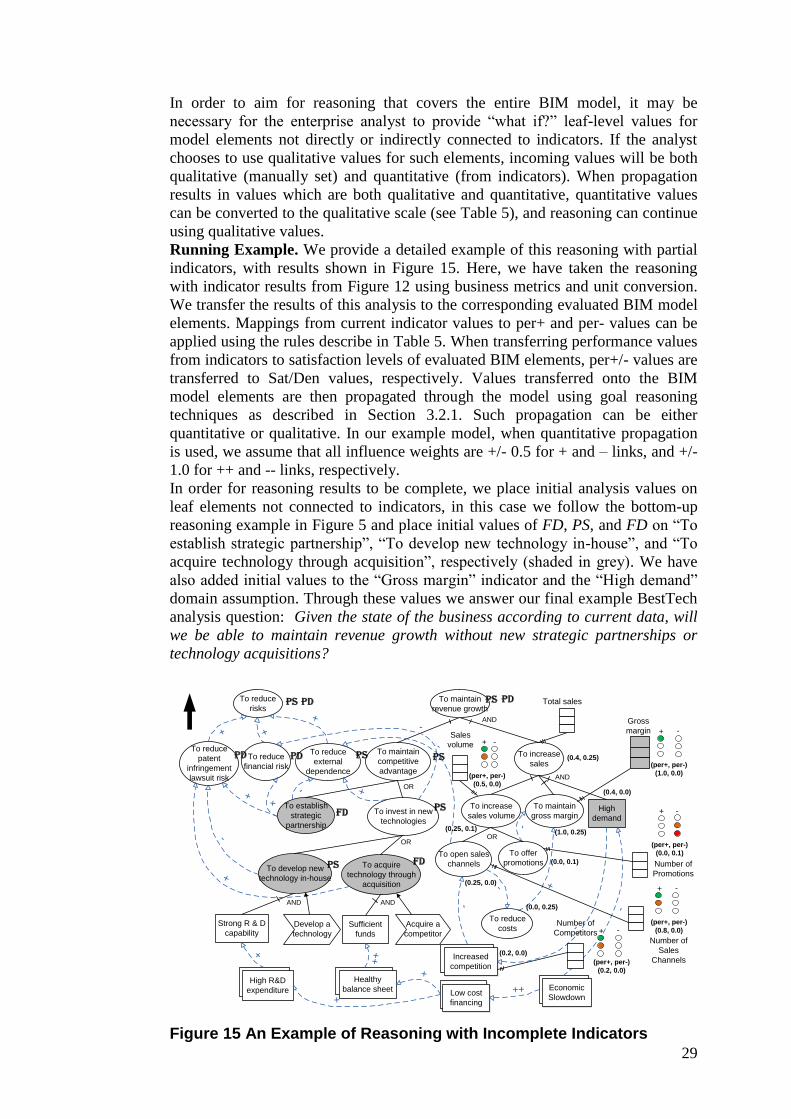
29
In order to aim for reasoning that covers the entire BIM model, it may be
necessary for the enterprise analyst to provide “what if?” leaf-level values for
model elements not directly or indirectly connected to indicators. If the analyst
chooses to use qualitative values for such elements, incoming values will be both
qualitative (manually set) and quantitative (from indicators). When propagation
results in values which are both qualitative and quantitative, quantitative values
can be converted to the qualitative scale (see Table 5), and reasoning can continue
using qualitative values.
Running Example. We provide a detailed example of this reasoning with partial
indicators, with results shown in Figure 15. Here, we have taken the reasoning
with indicator results from Figure 12 using business metrics and unit conversion.
We transfer the results of this analysis to the corresponding evaluated BIM model
elements. Mappings from current indicator values to per+ and per- values can be
applied using the rules describe in Table 5. When transferring performance values
from indicators to satisfaction levels of evaluated BIM elements, per+/- values are
transferred to Sat/Den values, respectively. Values transferred onto the BIM
model elements are then propagated through the model using goal reasoning
techniques as described in Section 3.2.1. Such propagation can be either
quantitative or qualitative. In our example model, when quantitative propagation
is used, we assume that all influence weights are +/- 0.5 for + and – links, and +/-
1.0 for ++ and -- links, respectively.
In order for reasoning results to be complete, we place initial analysis values on
leaf elements not connected to indicators, in this case we follow the bottom-up
reasoning example in Figure 5 and place initial values of FD, PS, and FD on “To
establish strategic partnership”, “To develop new technology in-house”, and “To
acquire technology through acquisition”, respectively (shaded in grey). We have
also added initial values to the “Gross margin” indicator and the “High demand”
domain assumption. Through these values we answer our final example BestTech
analysis question: Given the state of the business according to current data, will
we be able to maintain revenue growth without new strategic partnerships or
technology acquisitions?
To open sales
channels
To increase
sales
Increased
competition
To acquire
technology through
acquisition
To develop new
technology in-house
To reduce
risks
To reduce
patent
infringement
lawsuit risk
To reduce
external
dependence
To establish
strategic
partnership
-
To reduce
financial risk
+
+
To invest in new
technologies
-
To maintain
competitive
advantage
+
+
Acquire a
competitor
Develop a
technology
+
++
Sufficient
funds
Strong R & D
capability
High
demand
To maintain
revenue growth
To increase
sales volume
To maintain
gross margin
-
To offer
promotions
-
+
To reduce
costs
-
-
-
Total sales
Sales
volume
Gross
margin-
Economic
Slowdown
Healthy
balance sheet High R&D
expenditure Low cost
financing
+++
+
+
-
++
AND
ANDAND
AND
OR
OR
OR
PSPD
FD
PSPD PD PS
PS
FDPS
PS
(0.4, 0.0)
-
(per+, per-)
(1.0, 0.0)
+
(0.0, 0.25)
(1.0, 0.25)
(0.0, 0.1)
(0.25, 0.0)
(0.2, 0.0)
Number of
Competitors
(per+, per-)
(0.2, 0.0)
-+Number of
Sales
Channels
-
(per+, per-)
(0.8, 0.0)
+
Number of
Promotions
(per+, per-)
(0.0, 0.1)
+ -
(0.4, 0.25)
(0.25, 0.1)
(per+, per-)
(0.5, 0.0)
+ -
PD
Figure 15 An Example of Reasoning with Incomplete Indicators
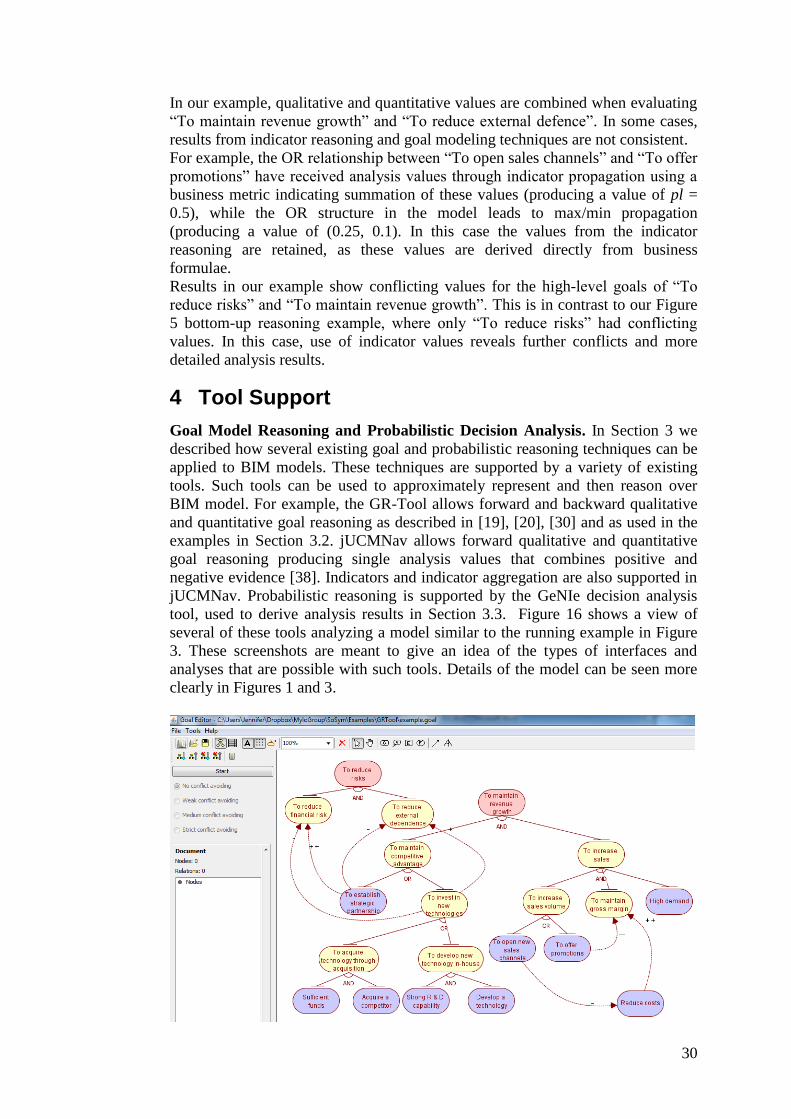
30
In our example, qualitative and quantitative values are combined when evaluating
“To maintain revenue growth” and “To reduce external defence”. In some cases,
results from indicator reasoning and goal modeling techniques are not consistent.
For example, the OR relationship between “To open sales channels” and “To offer
promotions” have received analysis values through indicator propagation using a
business metric indicating summation of these values (producing a value of pl =
0.5), while the OR structure in the model leads to max/min propagation
(producing a value of (0.25, 0.1). In this case the values from the indicator
reasoning are retained, as these values are derived directly from business
formulae.
Results in our example show conflicting values for the high-level goals of “To
reduce risks” and “To maintain revenue growth”. This is in contrast to our Figure
5 bottom-up reasoning example, where only “To reduce risks” had conflicting
values. In this case, use of indicator values reveals further conflicts and more
detailed analysis results.
4 Tool Support
Goal Model Reasoning and Probabilistic Decision Analysis. In Section 3 we
described how several existing goal and probabilistic reasoning techniques can be
applied to BIM models. These techniques are supported by a variety of existing
tools. Such tools can be used to approximately represent and then reason over
BIM model. For example, the GR-Tool allows forward and backward qualitative
and quantitative goal reasoning as described in [19], [20], [30] and as used in the
examples in Section 3.2. jUCMNav allows forward qualitative and quantitative
goal reasoning producing single analysis values that combines positive and
negative evidence [38]. Indicators and indicator aggregation are also supported in
jUCMNav. Probabilistic reasoning is supported by the GeNIe decision analysis
tool, used to derive analysis results in Section 3.3. Figure 16 shows a view of
several of these tools analyzing a model similar to the running example in Figure
3. These screenshots are meant to give an idea of the types of interfaces and
analyses that are possible with such tools. Details of the model can be seen more
clearly in Figures 1 and 3.
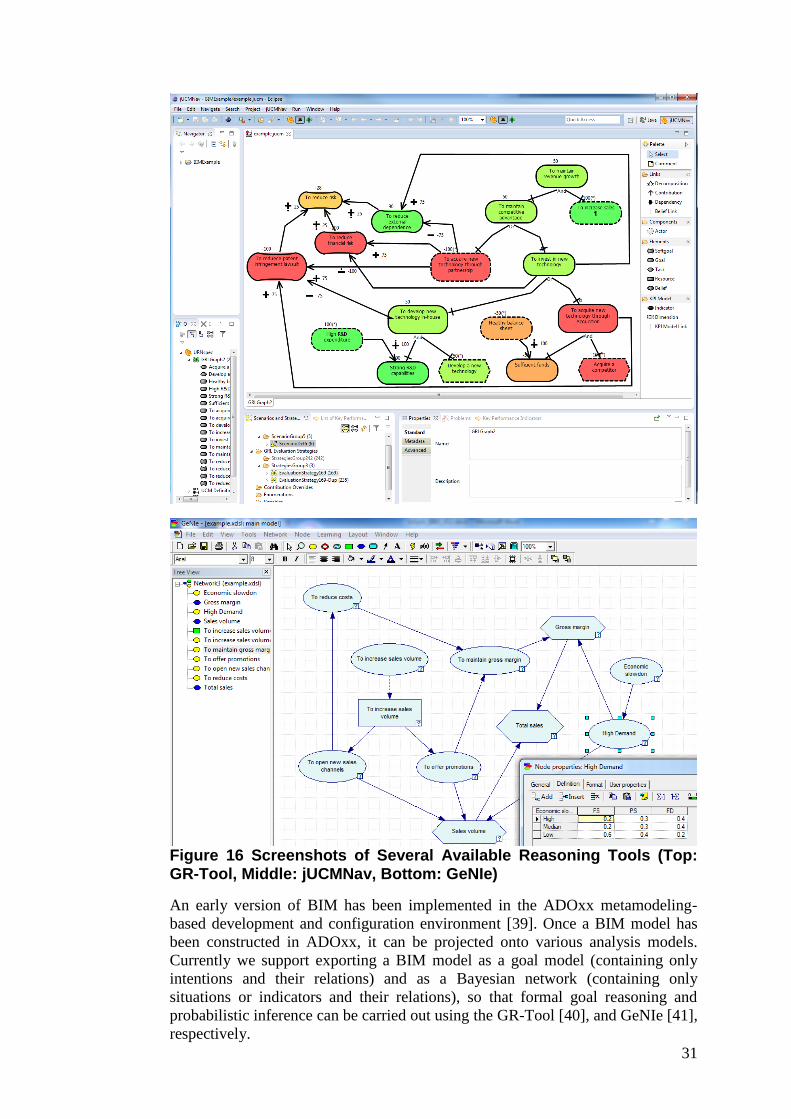
31
Figure 16 Screenshots of Several Available Reasoning Tools (Top: GR-Tool, Middle: jUCMNav, Bottom: GeNIe)
An early version of BIM has been implemented in the ADOxx metamodeling-
based development and configuration environment [39]. Once a BIM model has
been constructed in ADOxx, it can be projected onto various analysis models.
Currently we support exporting a BIM model as a goal model (containing only
intentions and their relations) and as a Bayesian network (containing only
situations or indicators and their relations), so that formal goal reasoning and
probabilistic inference can be carried out using the GR-Tool [40], and GeNIe [41],
respectively.
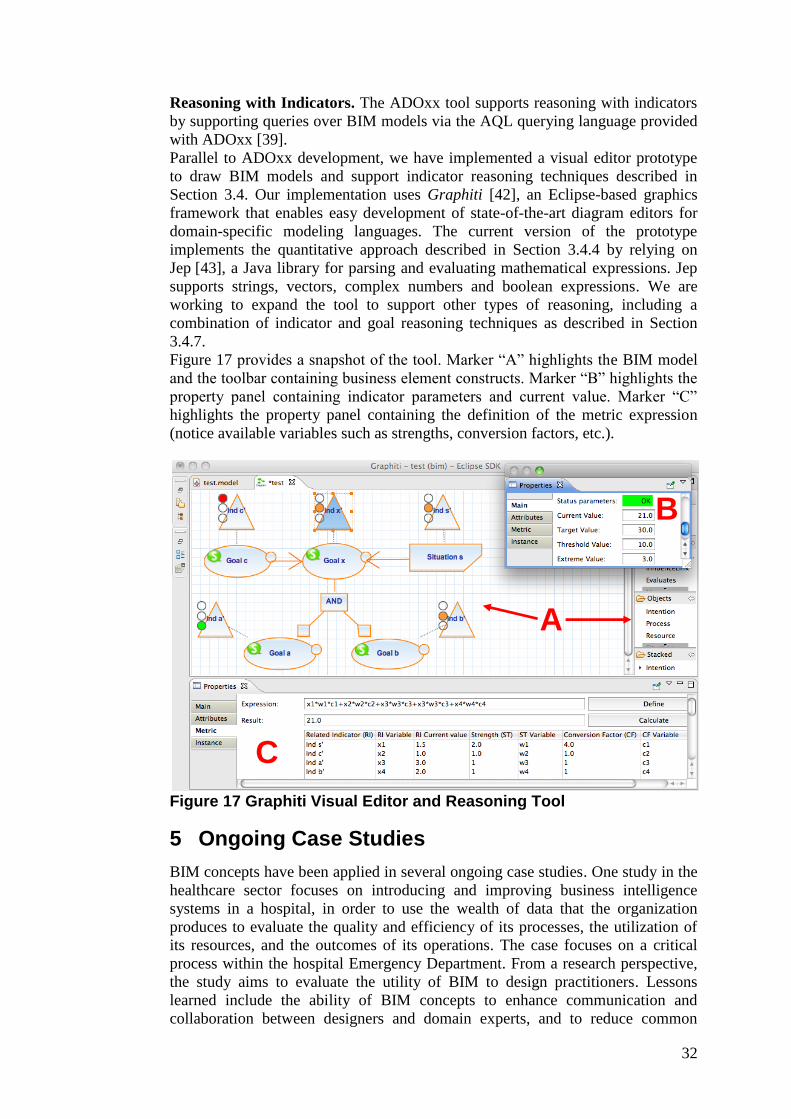
32
Reasoning with Indicators. The ADOxx tool supports reasoning with indicators
by supporting queries over BIM models via the AQL querying language provided
with ADOxx [39].
Parallel to ADOxx development, we have implemented a visual editor prototype
to draw BIM models and support indicator reasoning techniques described in
Section 3.4. Our implementation uses Graphiti [42], an Eclipse-based graphics
framework that enables easy development of state-of-the-art diagram editors for
domain-specific modeling languages. The current version of the prototype
implements the quantitative approach described in Section 3.4.4 by relying on
Jep [43], a Java library for parsing and evaluating mathematical expressions. Jep
supports strings, vectors, complex numbers and boolean expressions. We are
working to expand the tool to support other types of reasoning, including a
combination of indicator and goal reasoning techniques as described in Section
3.4.7.
Figure 17 provides a snapshot of the tool. Marker “A” highlights the BIM model
and the toolbar containing business element constructs. Marker “B” highlights the
property panel containing indicator parameters and current value. Marker “C”
highlights the property panel containing the definition of the metric expression
(notice available variables such as strengths, conversion factors, etc.).
Figure 17 Graphiti Visual Editor and Reasoning Tool
5 Ongoing Case Studies
BIM concepts have been applied in several ongoing case studies. One study in the
healthcare sector focuses on introducing and improving business intelligence
systems in a hospital, in order to use the wealth of data that the organization
produces to evaluate the quality and efficiency of its processes, the utilization of
its resources, and the outcomes of its operations. The case focuses on a critical
process within the hospital Emergency Department. From a research perspective,
the study aims to evaluate the utility of BIM to design practitioners. Lessons
learned include the ability of BIM concepts to enhance communication and
collaboration between designers and domain experts, and to reduce common
A
B
C
33
project risk factors that a BI solution may face during its lifecycle. BIM models
functioned effectively both as communication tool and design blueprint. Case
study outputs include a methodology for designing dimensional BIM models,
relating to existing or new data sources. The study developed an approach to
modular creation of BIM models in order to deal with the scale of a real-world
problem. Specifically, BIM concepts were organized into separate views:
Goal/Strategy Map, Indicator Map, Process Map, Process Workflow, Resource
Map, Actor Map, and individual Actor Goal Indicator Object Graphs (AGIO).
Views could be combined as needed. The AGIO graphs focused on individual
combinations of a single goal, indicator and actor, and were created using
corresponding AGIO sheets (tables). An in-depth description of intermediate case
study results and methods can be found in [44].
An additional study focused on using an earlier version of BIM in a large teaching
hospital in order to manage an organizational transformation initiative to Reduce
Antibiotic Resistant Infections (RARI) by changing the use of antibiotics. This
approach used BIM along with Conceptual Integration Models in order to more
explicitly describe the mapping between BIM business concepts and the structure
of existing data, providing examples of how current indicator values can be
derived through queries over available data. A more detailed description of the
method and study can be found in [9].
A further case study, currently in its early stages, is using BIM models as part of a
framework to design, deploy, and build an infrastructure for organizational
innovation in the Ericsson Corporation. In this context, BIM is intended to make
the goals behind innovation efforts explicit, capture barriers to innovation through
situations, and monitor the readiness and success of innovation efforts using
indicators.
6 Related work
BIM. Previous work has introduced early versions of the BIM language,
describing concepts and usage scenarios [8–12]. We have consolidated and
expanded this work, providing a more detailed and consistent description of BIM
concepts and relationships. We describe more explicitly an example model
construction methodology. Existing work has described how reasoning can be
performed with BIM models by mapping BIM to existing modeling languages for
which reasoning techniques have been provided [10]. Further work has described
reasoning using indicator values from business data [11], [12]. In this work, we
have gone beyond previous work by introducing a hybrid reasoning procedure
that combines indicator and goal modeling approaches in the presence of
incomplete indicators (Section 3.4.7). We improve and expand on analysis
descriptions, using a consistent running example, and providing an overall view of
analysis approaches, including information requirements and how each method
may be used as part of a BIM modeling and analysis methodology (Section 3.1).
BIM is in the same spirit as other enterprise modeling languages (e.g., Archimate
[45]), which bridges the business-data gap but with a different intent, e.g., for
enterprise architecture. A longer term objective is to reconcile or combine these
enterprise modeling approaches.
BI Surveys. Work in [3] surveys approaches for Information Requirements
Analysis, approaches specifically for the development of BI-type analytical
information systems. Conclusions include the potential to enhance existing
approaches by models and documentation that can be easily understood by IT,
34
without losing precision. BIM fits these requirements by using a broad set of
concepts taken from business analysis approaches.
Surveys of BI users have shown that although users are generally satisfied with BI
capabilities, they are less satisfied with the flexibility of BI systems or their ability
to provide risk management [1]. BIM addresses the need for more flexibility by
allowing users to ask analysis questions using business terms instead of more
technical queries over specific data structures. Enhanced risk management can be
facilitated both by allowing users to ask “what if?” analysis questions and by
explicitly capturing risk using situations.
Commercial BI. Existing software tools, such as IBM Cognos [2], have begun to
raise the level of abstraction of data schemas used in BI, adding a layer that
combines existing data sources. Although these advances are useful and
necessary, they still only support concepts arising from the data, failing to capture
top-down strategic planning aspects included such as objectives and situations, as
included in BIM. In essence, BIM complements well these commercial products.
Business Modeling. The use of business-level concepts, such as business objects,
rules and processes, has been researched extensively for more than a decade [46–
48], and is already practiced to some extent in both Data Engineering and
Software Engineering. These efforts have more recently resulted in standards,
such as the Business Process Modeling Notation (BPMN) [49]. These proposals
focus on modeling business objects and processes, with little attention paid to
business objectives. One exception is the Business Motivation Model (BMM) [6],
which proposes an extensive vocabulary for modeling business objectives (among
other things). BMM includes several intentional concepts, such as vision, goal and
objective; in our case, all these are modeled as goals. Similarly, our BIM models
can capture concepts commonly found in Strategy Maps [4] and Balanced
Scorecards [50] (e.g., Strategic Goals, Performance Measures, Initiatives).
However, BIM goes beyond these concepts by including the concept of situation,
a fundamental concept for supporting SWOT analysis. BIM moves beyond the
capabilities of Strategy Maps, Balanced Scorecards, and BMM by supporting
reasoning (goal, probabilistic, and indicator) over models.
Situation Modeling. Modeling of situations, especially unfavorable ones (e.g.,
weaknesses or threats), has received much attention in Security Engineering under
the topic of vulnerability. For example, Elahi et al. [51] proposed a vulnerability-
centric modeling ontology. More specifically, it identified the basic concepts for
modeling and analyzing vulnerabilities, and proposed criteria to compare and
evaluate security frameworks based on vulnerabilities. Inspired by SWOT
analysis, our proposal supports a more comprehensive classification of situations,
covering both favorable and unfavorable ones, also internal or external to an
organization.
Goal Models. Modeling of goals has a long tradition within Requirements
Engineering (e.g., i* [17], URN/GRL [18] and KAOS [16], [33]). The goal
concept has also been used in enterprise modeling, for example [13] and [14].
From these approaches, we have adopted intentional and social concepts.
However, these models lack primitive constructs for situation, influence and
indicator which are important to Business Intelligence applications.
Indicators in RE. Several proposals have used indicators as part of Requirements
Engineering (RE). For example, van Lamsweerde [33] uses indicators to evaluate
the degree of goal fulfillment. Recent proposals have extended URN to include
indicators [36], [52]. We share ideas with these works; however: i) our approach
pays special attention to methods for the construction of indicator hierarchies; ii)
35
we provide more guidelines to distinguish “what” is measured and “why” it is
measured; and iii) our indicators can be used to evaluate situations which, from
our perspective, are fundamental for strategic reasoning. In [53], the authors
propose a formal framework for modelling goals (and for evaluating their
satisfaction) based on performance indicators. Our work shares similar intentions
but focuses more on the concept of composite indicator, ways to define metric
expressions to calculate their values, and reasoning with incomplete indicators.
Indicators have also been used in work focusing on self-adaptive software systems
(e.g., [54]). Here they serve as monitored variables that determine whether a
system is doing well relative to its mandate, or whether it should adapt its
behaviour.
A further approach has extended goal (i*) models for use in designing and
monitoring data warehouse systems, defining awareness requirements over
KPIs [55]. This approach allows for queries to be mapped to decomposed
awareness requirements using OCL expressions translated to a query language
(MDX). Our work goes beyond this approach by including concepts such as
situation and indicator, and specifying how data query results captured by
indicators can be linked to analysis of the entire goal model.
7 Conclusions and Future Work
As a first step towards bridging the gap between the worlds of business and data
in the adoption of BI technologies, we have provided business modeling support
so that business data can be interpreted and understood in business terms. In this
paper, we have expanded and extended previous descriptions of BIM language
and reasoning. Our expanded description of BIM has focused on key concepts for
building BIM models (goal, situation, influence, indicator), intended to capture
the internal and external factors that affect the strategic goals of an organization,
as well as the performance measures on their fulfillment. We have expanded
previous narrative to provide a sample model creation methodology, combining
“top-down” and “bottom-up” approaches.
We have presented a model-based approach to design and reason about an
organization's business environment and strategies, with a focus on indicators and
indicator composition in the context of the Business Intelligence Model language.
BIM concepts have been used to facilitate several forms of reasoning over
business data and objectives, supporting different analysis questions. We have
shown how existing goal and probabilistic analysis techniques facilitating the
analysis and discovery of alternative strategies can be applied to BIM models. We
provided techniques to analyze the impact of strategies on organization goals, by
relying on different types of knowledge measured through indicators. Using
expressions based on the structure of the BIM model and performance levels,
indicator reasoning approaches can be applied even when business metrics or unit
conversions are incomplete. Also new to this paper, we have combined indicator
reasoning techniques with existing goal reasoning techniques, allowing reasoning
over an entire model even if the indicators do not yet have associated business
metrics or are incomplete with respect to the BIM model. Facilitating reasoning
with complete information makes the approach more realistically applicable, and
allows reasoning over incomplete models as part of BIM model development. We
argue that the indicators and composition mechanisms proposed here are more
flexible and powerful than what is commonly found in related work, allowing
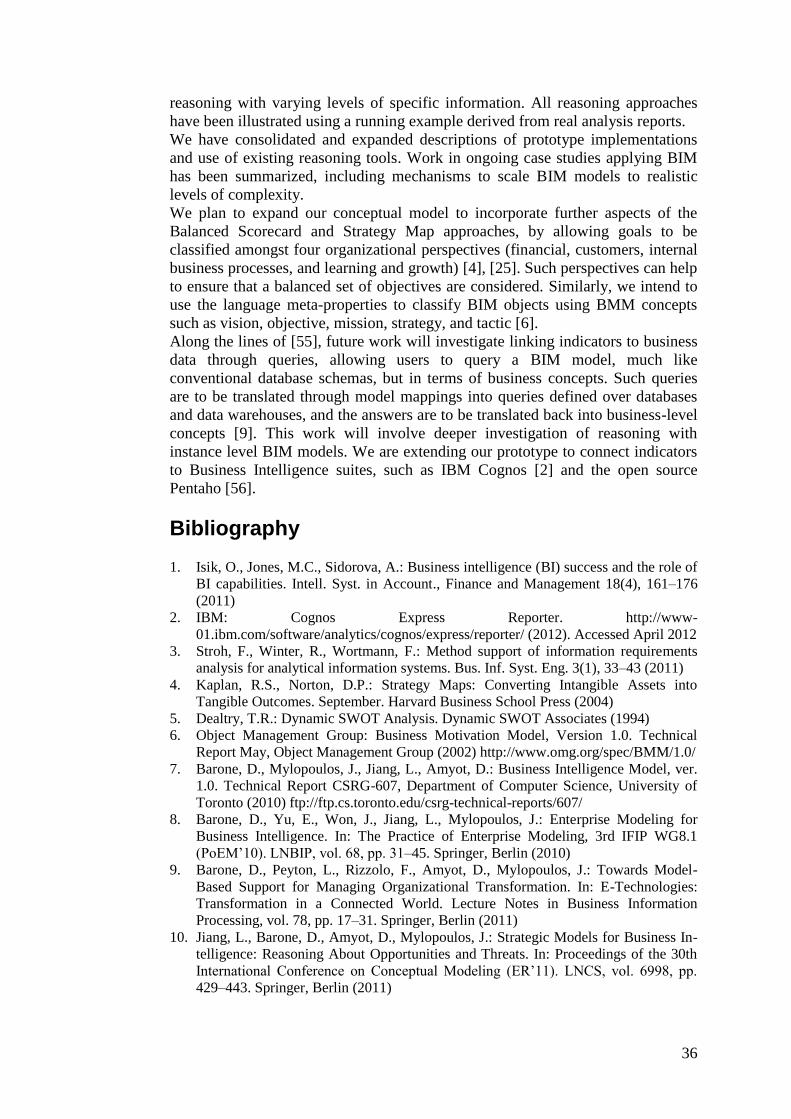
36
reasoning with varying levels of specific information. All reasoning approaches
have been illustrated using a running example derived from real analysis reports.
We have consolidated and expanded descriptions of prototype implementations
and use of existing reasoning tools. Work in ongoing case studies applying BIM
has been summarized, including mechanisms to scale BIM models to realistic
levels of complexity.
We plan to expand our conceptual model to incorporate further aspects of the
Balanced Scorecard and Strategy Map approaches, by allowing goals to be
classified amongst four organizational perspectives (financial, customers, internal
business processes, and learning and growth) [4], [25]. Such perspectives can help
to ensure that a balanced set of objectives are considered. Similarly, we intend to
use the language meta-properties to classify BIM objects using BMM concepts
such as vision, objective, mission, strategy, and tactic [6].
Along the lines of [55], future work will investigate linking indicators to business
data through queries, allowing users to query a BIM model, much like
conventional database schemas, but in terms of business concepts. Such queries
are to be translated through model mappings into queries defined over databases
and data warehouses, and the answers are to be translated back into business-level
concepts [9]. This work will involve deeper investigation of reasoning with
instance level BIM models. We are extending our prototype to connect indicators
to Business Intelligence suites, such as IBM Cognos [2] and the open source
Pentaho [56].
Bibliography 1. Isik, O., Jones, M.C., Sidorova, A.: Business intelligence (BI) success and the role of
BI capabilities. Intell. Syst. in Account., Finance and Management 18(4), 161–176
(2011)
2. IBM: Cognos Express Reporter. http://www-
01.ibm.com/software/analytics/cognos/express/reporter/ (2012). Accessed April 2012
3. Stroh, F., Winter, R., Wortmann, F.: Method support of information requirements
analysis for analytical information systems. Bus. Inf. Syst. Eng. 3(1), 33–43 (2011)
4. Kaplan, R.S., Norton, D.P.: Strategy Maps: Converting Intangible Assets into
Tangible Outcomes. September. Harvard Business School Press (2004)
5. Dealtry, T.R.: Dynamic SWOT Analysis. Dynamic SWOT Associates (1994)
6. Object Management Group: Business Motivation Model, Version 1.0. Technical
Report May, Object Management Group (2002) http://www.omg.org/spec/BMM/1.0/
7. Barone, D., Mylopoulos, J., Jiang, L., Amyot, D.: Business Intelligence Model, ver.
1.0. Technical Report CSRG-607, Department of Computer Science, University of
Toronto (2010) ftp://ftp.cs.toronto.edu/csrg-technical-reports/607/
8. Barone, D., Yu, E., Won, J., Jiang, L., Mylopoulos, J.: Enterprise Modeling for
Business Intelligence. In: The Practice of Enterprise Modeling, 3rd IFIP WG8.1
(PoEM’10). LNBIP, vol. 68, pp. 31–45. Springer, Berlin (2010)
9. Barone, D., Peyton, L., Rizzolo, F., Amyot, D., Mylopoulos, J.: Towards Model-
Based Support for Managing Organizational Transformation. In: E-Technologies:
Transformation in a Connected World. Lecture Notes in Business Information
Processing, vol. 78, pp. 17–31. Springer, Berlin (2011)
10. Jiang, L., Barone, D., Amyot, D., Mylopoulos, J.: Strategic Models for Business In-
telligence: Reasoning About Opportunities and Threats. In: Proceedings of the 30th
International Conference on Conceptual Modeling (ER’11). LNCS, vol. 6998, pp.
429–443. Springer, Berlin (2011)
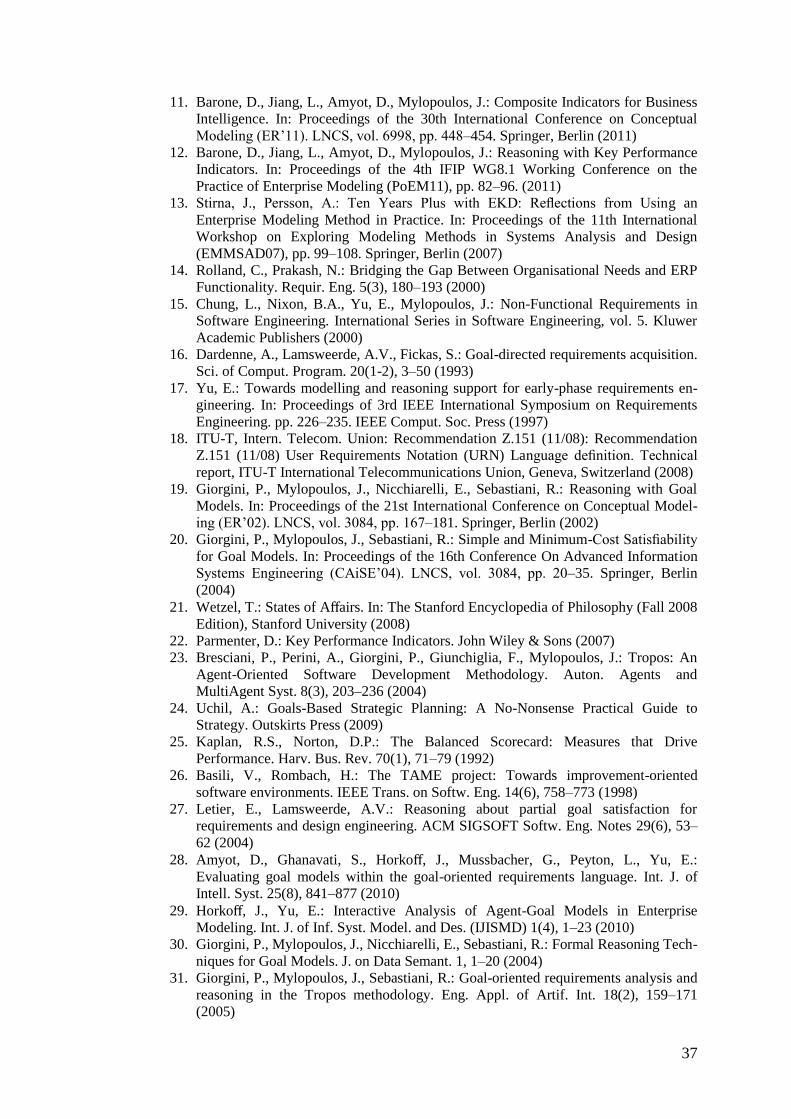
37
11. Barone, D., Jiang, L., Amyot, D., Mylopoulos, J.: Composite Indicators for Business
Intelligence. In: Proceedings of the 30th International Conference on Conceptual
Modeling (ER’11). LNCS, vol. 6998, pp. 448–454. Springer, Berlin (2011)
12. Barone, D., Jiang, L., Amyot, D., Mylopoulos, J.: Reasoning with Key Performance
Indicators. In: Proceedings of the 4th IFIP WG8.1 Working Conference on the
Practice of Enterprise Modeling (PoEM11), pp. 82–96. (2011)
13. Stirna, J., Persson, A.: Ten Years Plus with EKD: Reflections from Using an
Enterprise Modeling Method in Practice. In: Proceedings of the 11th International
Workshop on Exploring Modeling Methods in Systems Analysis and Design
(EMMSAD07), pp. 99–108. Springer, Berlin (2007)
14. Rolland, C., Prakash, N.: Bridging the Gap Between Organisational Needs and ERP
Functionality. Requir. Eng. 5(3), 180–193 (2000)
15. Chung, L., Nixon, B.A., Yu, E., Mylopoulos, J.: Non-Functional Requirements in
Software Engineering. International Series in Software Engineering, vol. 5. Kluwer
Academic Publishers (2000)
16. Dardenne, A., Lamsweerde, A.V., Fickas, S.: Goal-directed requirements acquisition.
Sci. of Comput. Program. 20(1-2), 3–50 (1993)
17. Yu, E.: Towards modelling and reasoning support for early-phase requirements en-
gineering. In: Proceedings of 3rd IEEE International Symposium on Requirements
Engineering. pp. 226–235. IEEE Comput. Soc. Press (1997)
18. ITU-T, Intern. Telecom. Union: Recommendation Z.151 (11/08): Recommendation
Z.151 (11/08) User Requirements Notation (URN) Language definition. Technical
report, ITU-T International Telecommunications Union, Geneva, Switzerland (2008)
19. Giorgini, P., Mylopoulos, J., Nicchiarelli, E., Sebastiani, R.: Reasoning with Goal
Models. In: Proceedings of the 21st International Conference on Conceptual Model-
ing (ER’02). LNCS, vol. 3084, pp. 167–181. Springer, Berlin (2002)
20. Giorgini, P., Mylopoulos, J., Sebastiani, R.: Simple and Minimum-Cost Satisfiability
for Goal Models. In: Proceedings of the 16th Conference On Advanced Information
Systems Engineering (CAiSE’04). LNCS, vol. 3084, pp. 20–35. Springer, Berlin
(2004)
21. Wetzel, T.: States of Affairs. In: The Stanford Encyclopedia of Philosophy (Fall 2008
Edition), Stanford University (2008)
22. Parmenter, D.: Key Performance Indicators. John Wiley & Sons (2007)
23. Bresciani, P., Perini, A., Giorgini, P., Giunchiglia, F., Mylopoulos, J.: Tropos: An
Agent-Oriented Software Development Methodology. Auton. Agents and
MultiAgent Syst. 8(3), 203–236 (2004)
24. Uchil, A.: Goals-Based Strategic Planning: A No-Nonsense Practical Guide to
Strategy. Outskirts Press (2009)
25. Kaplan, R.S., Norton, D.P.: The Balanced Scorecard: Measures that Drive
Performance. Harv. Bus. Rev. 70(1), 71–79 (1992)
26. Basili, V., Rombach, H.: The TAME project: Towards improvement-oriented
software environments. IEEE Trans. on Softw. Eng. 14(6), 758–773 (1998)
27. Letier, E., Lamsweerde, A.V.: Reasoning about partial goal satisfaction for
requirements and design engineering. ACM SIGSOFT Softw. Eng. Notes 29(6), 53–
62 (2004)
28. Amyot, D., Ghanavati, S., Horkoff, J., Mussbacher, G., Peyton, L., Yu, E.:
Evaluating goal models within the goal-oriented requirements language. Int. J. of
Intell. Syst. 25(8), 841–877 (2010)
29. Horkoff, J., Yu, E.: Interactive Analysis of Agent-Goal Models in Enterprise
Modeling. Int. J. of Inf. Syst. Model. and Des. (IJISMD) 1(4), 1–23 (2010)
30. Giorgini, P., Mylopoulos, J., Nicchiarelli, E., Sebastiani, R.: Formal Reasoning Tech-
niques for Goal Models. J. on Data Semant. 1, 1–20 (2004)
31. Giorgini, P., Mylopoulos, J., Sebastiani, R.: Goal-oriented requirements analysis and
reasoning in the Tropos methodology. Eng. Appl. of Artif. Int. 18(2), 159–171
(2005)
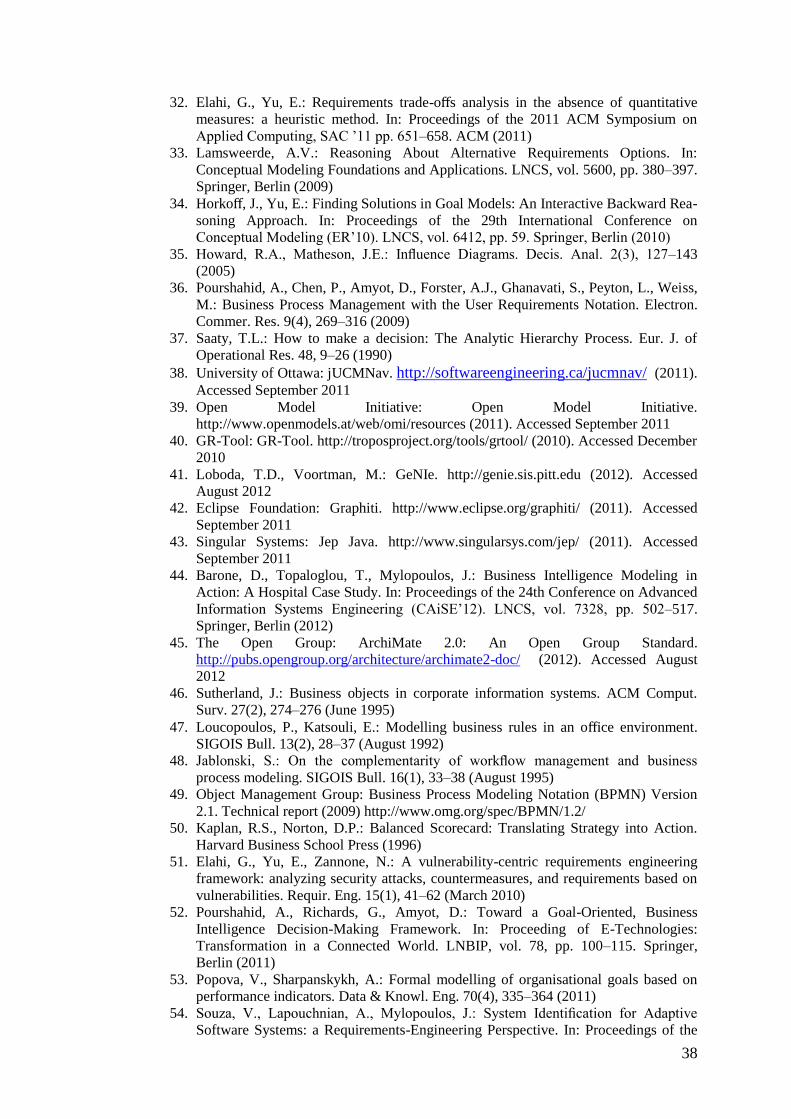
38
32. Elahi, G., Yu, E.: Requirements trade-offs analysis in the absence of quantitative
measures: a heuristic method. In: Proceedings of the 2011 ACM Symposium on
Applied Computing, SAC ’11 pp. 651–658. ACM (2011)
33. Lamsweerde, A.V.: Reasoning About Alternative Requirements Options. In:
Conceptual Modeling Foundations and Applications. LNCS, vol. 5600, pp. 380–397.
Springer, Berlin (2009)
34. Horkoff, J., Yu, E.: Finding Solutions in Goal Models: An Interactive Backward Rea-
soning Approach. In: Proceedings of the 29th International Conference on
Conceptual Modeling (ER’10). LNCS, vol. 6412, pp. 59. Springer, Berlin (2010)
35. Howard, R.A., Matheson, J.E.: Influence Diagrams. Decis. Anal. 2(3), 127–143
(2005)
36. Pourshahid, A., Chen, P., Amyot, D., Forster, A.J., Ghanavati, S., Peyton, L., Weiss,
M.: Business Process Management with the User Requirements Notation. Electron.
Commer. Res. 9(4), 269–316 (2009)
37. Saaty, T.L.: How to make a decision: The Analytic Hierarchy Process. Eur. J. of
Operational Res. 48, 9–26 (1990)
38. University of Ottawa: jUCMNav. http://softwareengineering.ca/jucmnav/ (2011).
Accessed September 2011
39. Open Model Initiative: Open Model Initiative.
http://www.openmodels.at/web/omi/resources (2011). Accessed September 2011
40. GR-Tool: GR-Tool. http://troposproject.org/tools/grtool/ (2010). Accessed December
2010
41. Loboda, T.D., Voortman, M.: GeNIe. http://genie.sis.pitt.edu (2012). Accessed
August 2012
42. Eclipse Foundation: Graphiti. http://www.eclipse.org/graphiti/ (2011). Accessed
September 2011
43. Singular Systems: Jep Java. http://www.singularsys.com/jep/ (2011). Accessed
September 2011
44. Barone, D., Topaloglou, T., Mylopoulos, J.: Business Intelligence Modeling in
Action: A Hospital Case Study. In: Proceedings of the 24th Conference on Advanced
Information Systems Engineering (CAiSE’12). LNCS, vol. 7328, pp. 502–517.
Springer, Berlin (2012)
45. The Open Group: ArchiMate 2.0: An Open Group Standard.
http://pubs.opengroup.org/architecture/archimate2-doc/ (2012). Accessed August
2012
46. Sutherland, J.: Business objects in corporate information systems. ACM Comput.
Surv. 27(2), 274–276 (June 1995)
47. Loucopoulos, P., Katsouli, E.: Modelling business rules in an office environment.
SIGOIS Bull. 13(2), 28–37 (August 1992)
48. Jablonski, S.: On the complementarity of workflow management and business
process modeling. SIGOIS Bull. 16(1), 33–38 (August 1995)
49. Object Management Group: Business Process Modeling Notation (BPMN) Version
2.1. Technical report (2009) http://www.omg.org/spec/BPMN/1.2/
50. Kaplan, R.S., Norton, D.P.: Balanced Scorecard: Translating Strategy into Action.
Harvard Business School Press (1996)
51. Elahi, G., Yu, E., Zannone, N.: A vulnerability-centric requirements engineering
framework: analyzing security attacks, countermeasures, and requirements based on
vulnerabilities. Requir. Eng. 15(1), 41–62 (March 2010)
52. Pourshahid, A., Richards, G., Amyot, D.: Toward a Goal-Oriented, Business
Intelligence Decision-Making Framework. In: Proceeding of E-Technologies:
Transformation in a Connected World. LNBIP, vol. 78, pp. 100–115. Springer,
Berlin (2011)
53. Popova, V., Sharpanskykh, A.: Formal modelling of organisational goals based on
performance indicators. Data & Knowl. Eng. 70(4), 335–364 (2011)
54. Souza, V., Lapouchnian, A., Mylopoulos, J.: System Identification for Adaptive
Software Systems: a Requirements-Engineering Perspective. In: Proceedings of the

39
30th International Conference on Conceptual Modeling (ER’11). LNCS, vol. 6998,
pp. 346–361. (2011)
55. Souza, V., Mazón, J.N., Garrigós, I., Trujillo, J., Mylopoulos, J.: Monitoring
Strategic Goals in Data Warehouses with Awareness Requirements. In: Proceedings
of the 27th ACM Symposium on Applied Computing, pp. 1075–1082. (2012)
56. Pentaho Corporation: Pentaho: Open Source Business Intelligence.
http://www.pentaho.com/ (2011). Accessed September 2011