Embed Size (px)
Citation preview

Acta of Bioengineering and Biomechanics Original paperVol. 13, No. 2, 2011
Strain-rate sensitivity of porcine and ovine corneas
AHMED ELSHEIKH1*, WAEL KASSEM2, STEPHEN W. JONES1
1 School of Engineering, University of Liverpool, UK.2 Division of Civil Engineering, University of El-Minia, El-Minia, Egypt.
Knowledge of strain-rate sensitivity of corneal tissue is important for improving the understanding of the tissue’s response to me-chanical actions and the accurate numerical simulation of corneal biomechanical behaviour under the effects of disease and surgery. Inthe study, fresh and well-preserved porcine and ovine corneal buttons were subjected to uniaxial tension loads with seven different strainrates ranging between 0.8 and 420% per minute. All specimens exhibited increased stiffness (as measured by the tangent modulus) withhigher strain rates. However, clear differences in their behaviour were observed. While ovine corneas showed gradual, consistent andmostly statistically significant increases in stiffness with all elevations in strain rate, porcine corneas’ response was significant over onlya limited range of low strain rates. The effect of strain rate on the material’s stress-strain behaviour was considered in the formation ofthree sets of constitutive models including: (i) a model based on a simple exponential stress–strain relationship, (ii) the Ogden model thatconsiders the tissue’s hyperelasticity but not anisotropy, and (iii) a third model by Holzapfel, Gasser and Ogden that considers bothhyperelasticity and anisotropy. The three models are introduced to enable consideration of the strain rate effects in simulations employ-ing finite element programs with varying capabilities or in modelling applications in corneal biomechanics which may or may not requireconsideration of mechanical anisotropy.
Key words: cornea, mechanical behaviour, strain-rate effects, experimental testing
1. Introduction
The cornea is a load-bearing tissue whose primaryfunction is to focus light on the retina. The mechanicalproperties of the cornea are important in maintainingthis function under the effect of actions such as intra-ocular pressure (IOP), eyelid movement and externalimpacts. Significant advances have been made in un-derstanding the cornea’s instantaneous response tomechanical actions [1]–[3] and the long-term stress–relaxation and creep behaviour [4], [5]. Littleprogress, however, has been made in quantifying thecornea’s dependence on strain rate that, in line withmost other biological tissues, can make the corneastiffer under higher strain rates.
Recent experimental studies confirmed the cor-nea’s nonlinear behaviour under loading, with in-
creasing tangent modulus (measure of mechanicalstiffness) under higher stresses [1], [6], [7]. Thestudies used both animal and human tissue testedunder either uniaxial tension or inflation conditions,and resulted in constitutive models, or stress–strainrelationships, in forms suitable for use in numericalsimulations of ocular behaviour [4], [8]. However, inmost of the studies, their experimental tests wereconducted under a particular load or strain rate, andalthough the potential effects of strain-rate depend-ence were mentioned, they were not quantified. Thismakes the material’s constitutive models suitableonly for the strain-rates under which they were de-veloped, and knowledge is currently unavailable onhow to consider the effect of changing the strain rateon the material’s behaviour.
This study is intended to address this need throughan experimental assessment of the strain-rate depend-
______________________________
* Corresponding author: Ahmed Elsheikh, School of Engineering, University of Liverpool, Liverpool L69 3GH, UK. Tel: 0044 1517944833, e-mail: [email protected]
Received: March 2nd, 2011Accepted for publication: May 16th, 2011

A. ELSHEIKH et al.26
ence of corneal tissue. In preparation for work onhuman corneas, the study starts with porcine (pig) andovine (sheep) tissues because of their wide availabilityand as they offer a degree of mechanical and micro-structural similarity to human corneas [4], [9], [10].Porcine, ovine and human corneas have been reportedto have similar interfibrillar Bragg spacing (58.6, 60.4and 55.3 nm), fibril diameter (36.9, 37.0 and 30.8 nm),intermolecular Bragg spacing (1.57, 1.59 and 1.63 nm)and number of molecules per fibril cross-section (378,380 and 263) [11]. Therefore, although the behaviourof human corneas is expected to be somewhat dif-ferent from that reported in this study, the behav-iour trends and the techniques used are likely to besimilar.
Further, the strain-rate dependence of porcine andovine corneal tissue, as determined experimentally,has been considered in the development of constitu-tive models that describe tissue behaviour in numeri-cal simulations. Three constitutive model types that
consider material hyper-elasticity and anisotropy havebeen adopted in this part of the study.
2. Materials and methods
Eight porcine and eight ovine eyes from animalsaged between 4 and 6 months were obtained fresh froma local abattoir and prepared for tests within 6–9 hourspost-mortem. Only one eye per animal was used in thestudy. The vertical (superior–inferior) anatomical di-rection was identified using the location of the opticnerve and the clear difference between the cornea’svertical and horizontal diameters. A corneal buttonwith 3–4 mm scleral ring was extracted from each eyeusing a pair of curved scissors, and the iris, lens andciliary body were removed. Following extraction,corneas were placed in preservation medium Eusol-C
Prespex tube
Preservation medium
Specimen
Upper clamp
Lower clamp
Rubber ring
Fig. 1. Test setup showing a specimen connected to two end clamps while being preserved in Eusol-C
Fig. 2. Strain-controlled loading regime

Strain-rate sensitivity of porcine and ovine corneas 27
(Alchima, Padova, Italy), then taken out and preparedfor testing one by one. The specimens were not frozenat any stage.
A strip specimen with 4.4 mm width was obtainedfrom the central region of each cornea in the verticaldirection using a double-blade tool. The specimens wereconnected to mechanical clamps with rough surfaces toprevent slippage, see figure 1. The clamps held the 3 mmlong end strips of scleral tissue in addition to about 1–2-mm length of corneal tissue in the limbal region, leavingabout 12 mm of corneal tissue between clamp edges.The thickness of each specimen was measured using anultrasound pachymeter (Pachmate 55, DGH Technolo-gies, Exton, Pa). Three measurements were performedat the cornea strip’s centre and close to the clamps, andthe results used in later analysis. The average and stan-dard deviations of thickness values were 971.5 ± 75.7 μmand 1013.1 ± 67.8 μm at the centre and edge of porcinecorneas, respectively, and 828.6 ± 127.5 μm and 882.3± 87.2 μm for ovine corneas.
Before the start of a test, a perspex tube wasplaced around the specimen and filled with Eusol-C tomaintain stromal hydration during the tests. Oncetesting was complete, Eusol-C was drained and thespecimen removed for visual inspection. Testing wasperformed at room temperature, 21 °C, on an Instron3366 materials testing machine (Instron, Norwood,MA) equipped with a 10 N capacity load cell.
Specimens were subjected to an initial set of tencycles of loading and unloading between 0 and 5 N(which was sufficient to go beyond the hyperelasticbehaviour stage in all tests) with a low strain rate of8% per minute to condition the tissue, stabilise itsmechanical behaviour and ensure a reproducible re-sponse to uniaxial testing, figure 2. This was followedby seven sets of three load cycles with different strainrates: 0.8, 8, 25, 42, 83, 210 and 420% per minute(min–1). Each of the seven sets included two initialcycles to condition the tissue at a particular strain ratebefore considering the results in a third cycle as repre-sentative of the cornea’s biomechanical behaviourunder that rate. Between each two sets of cycles, thespecimens were allowed to recover their initial lengthto reduce the dependence of the behaviour on the strainhistory of preconditioning cycles [12]. This processtook between 4 and 7 minutes in all cases. The maxi-mum stress adopted (1.2–1.35 MPa), although higherthan would be expected under normal intraocular pres-sure values, was selected to ensure coverage of thewhole nonlinear stage of corneal behaviour.
The lowest strain rate considered was close to thatexperienced under an intraocular pressure (IOP) changefrom standing or seated to supine position – reported to
be about 6 mm Hg taking place in a few seconds [13],while the highest rate was above that expected underabnormal eye rubbing [14], but lower than those associ-ated with impacts or non-contact tonometry [15].
The test output comprised the axial tension load Tin Newtons and the specimen elongation δ in mm.These values were stored every 0.1 sec for later analy-sis. T and δ were converted into values of stress σ andstrain ε, following a mathematical process explainedearlier [8], [16], which took into account the variablespecimen thickness.
2.1. Constitutive models
Constitutive models have been used to demon-strate the effect of strain rate on the material’s stress–strain behaviour as obtained experimentally. In orderto enable application of different methods to numeri-cal simulation, three types of constitutive model havebeen adopted, the first of which is based on a simpleexponential relationship between stress and strain thathas been found suitable in earlier studies [17]:
)1( −= εbeaσ , (1)
where a and b are constants. This form enables the quickgeneration of stress–strain behaviour, which can be inputdirectly into a number of finite element (FE) packages orfurther manipulated to generate other stress–strain rela-tionship forms such as those included below.
The second type of the constitutive model adoptedis the strain energy function developed by Ogden,which has been widely used to describe the nonlinearhyperelastic behaviour of biological materials [18],[19]. This model, which is primarily suitable for iso-tropic materials, is adopted here as a useful approxi-mation since the more appropriate anisotropic strainenergy functions (one of which is considered below)are not yet available in several commercial FE pack-ages, which are commonly used in the predictiveanalysis of nonlinear corneal behaviour. According toOgden’s function, the strain energy density per unitvolume W is calculated as:
,)1(1
)3(2
1
2
12
∑
∑
=
=
−+
−++=
N
i i
αz
αy
αx
N
i i
i
JD
αμW iii λλλ
(2)
where kλ are the deviatoric principal stretches =J–1/3 × λk (k = x, y, z); λx, λy, λz the principal stretches inthe three main Cartesian directions along specimen

A. ELSHEIKH et al.28
width, thickness and length, respectively; J = λx .λy.λ z ;α i and μ i (i = 1 ... N) are material parameters denotingthe strain hardening exponent and the shear modulus,respectively; and N is the function order. As cornealtissue can be approximated as an almost incompressi-ble material [20], [21], the product of stretch in allthree directions, J = λ x .λy.λ z = 1, therefore the secondterm of equation (2) can be omitted, and the equationcan be written in terms of stress as:
)(2 2/11
1
iizz
N
i i
iz λλ
αμσ αα −−−
=
−=∑ . (3)
The values of material parameters α i and μ i can bedetermined by fitting the function to the experimentalstress–strain results through an error minimisationprocess:
Σ abs(σequation – σexperiment) = minimum.
As described in section 3, the fit with a first-orderequation was not satisfactory in most cases, and a sec-ond order (N = 2) or a third order (N = 3) would berecommended.
Finally, the micro-structural and mechanical anisot-ropy of the cornea [8], [22] could be considered by a de-velopment of the hyperelastic constitutive model de-scribed above, in which anisotropy has been introduced.This has been done by considering the strain energy func-tion proposed by Holzapfel, Gasser and Ogden [23], [24]:
,)1(
ln2
11)3(
12
1
2
110
22∑
=
−+
⎟⎟⎠
⎞⎜⎜⎝
⎛−
−+−=
Nf
α
Ek αekk
JJD
ICW
(4)
where C10, D, k1, k2, and Ēα are material parameters;Nf is the number of the families of fibres (Nf ≤ 3);Ī1 the first invariant of the deviatoric part of the leftCauchy–Green deformation tensor; Ī1 = J–2/3 × I1, andI1 = 2
1λ + 22λ + 2
3λ , where λi are the principalstretches. The first two terms in equation (4) repre-sent the distortional and volumetric contributions ofthe non-collagenous isotropic extracellular matrixof the stroma, and the third term represents thecontributions from the different families of collagenfibres. With corneal tissue considered to be incom-pressible, J = 1, and as a result the second term canbe omitted. Another basic assumption of the modelis that collagen fibres can support tension only andwould buckle under compressive loading. There-fore, the anisotropic contribution in the strain en-ergy function appears only when the strain of thefibres is positive.
Ēα is a Green–Lagrange strain-like quantity whichcharacterises for each family of fibres the strain in thedirection of the mean orientation of the fibres. Ēα isreplaced by
κ (Ī1 – 3) + (1 – 3κ) (Ī4 – 1),where Ī4 is a tensor invariant equal to the square of thestretch (λ2) in the mean direction of the fibre family.The parameter κ describes the level of dispersion inthe fibre directions and is given by the formula:
∫=π
dθθθρκ0
3sin)(41 ,
where ρ(θ) is the distribution function that character-ises the orientation density of the fibres in terms ofradial angle θ with respect to the main direction.
(a) (b)
Fig. 3. The angular distribution function of one family of fibres (a),and both families of fibres along with the combined distribution of the two families (b)

Strain-rate sensitivity of porcine and ovine corneas 29
The model assumes that there are two families ofcollagen fibres (Nf = 2) with mean preferred verticaland horizontal directions, respectively. Within eachfamily, the fibres are dispersed with rotational sym-metry about the mean direction. Earlier microstruc-tural studies [22], [25], [26] indicated that 2/3 of allstromal collagen fibres are positioned in, and sharedequally between, the 45° sectors surrounding thevertical and horizontal directions, with the remaining1/3 shared equally between the 45° sectors sur-rounding the 45° and 135° directions. Splitting thefibres into two families means that for each family1/3 of all fibres are oriented between ± 22.5° aroundthe main direction, and 1/12 within each of the adja-cent 45° sectors. This distribution was smoothed andapproximated using the following distribution func-tion (figure 3):
.
πto4π3for
12cos1
42
4π3to
4πfor
)12(44)1sin3(2
4πto0for
12cos1
42
)(
⎪⎪⎪
⎭
⎪⎪⎪
⎬
⎫
⎪⎪⎪
⎩
⎪⎪⎪
⎨
⎧
=−
−
=−
−+
=−
−
=
θθ
θθ
θθ
θρ (5)
Using this distribution function, the value of κ isobtained from
∫=π
dθθθρκ0
3sin)(41
as 0.242, which is within the limits of 0 (perfectalignment) ≤ κ ≤ 0.33 (random distribution). Thisleaves only three material parameters (C10, k1 and
k2) to be determined for each set of tests from fit-ting equation (4) to the average experimental resultsof the set while minimising the error Σ abs(σequation
– σexperiment).
2.2. Statistical analysis
The tests of statistical differences for compari-sons between specimen groups were performed withthe Chi-square test. The significance of associationsbetween strain rate and mechanical stiffness (asmeasured by the tangent modulus) was assessed bySpearman rank correlation. Analyses were per-formed in SPSS 17.0 (SPSS Inc., Illinois). P < 0.05was considered an indication of statistical signifi-cance.
3. Results
3.1. Experimental behaviour
An example set of results for a porcine specimen isshown in figure 4 including the load–elongation be-haviour under different strain rates, the correspondingstress–strain behaviour and the variation of the tan-gent modulus E (measure of material stiffness) withstress. Specimens exhibited nonlinear load–elongationand stress–strain behaviour with an initial low tangentmodulus increasing gradually under higher stresses.The transition from low to high stiffness was gradualas can be seen in figure 4b, although it was faster at
(a) (b) (c)
Fig. 4. Example results of a porcine cornea including the load–elongation behaviour under different strain rates (a),the corresponding stress–strain behaviour (b), and the tangent modulus–stress behaviour (c)

A. ELSHEIKH et al.30
low stress levels. This form of behaviour persistedregardless of the strain rate employed and was validfor both porcine and ovine corneas.
Converting the stress–strain results to E–σ behav-iour, as in figure 4c, showed a linear relationship cov-ering most of the test stress range. This could be re-lated to the fact that the stress–strain results fittedclosely an exponential relationship of the form:
)1( −= εbeaσ , which when differentiated produceda linear E–σ behaviour:
E = dσ / dε = a b . eb.ε = b . (σ + a).
Figure 5 further shows example results of thevariation of material stiffness (as measured by thetangent modulus E) with the progression of load cy-cles. After considerable stiffening in the first (andsometimes the second) cycle, the E–σ behaviour ap-peared to have stabilised. Subsequent changes in the
strain rate required further conditioning but the corre-sponding changes in E were limited to below 5%. Thisfinding justified using the results of the last cyclewithin each test stage as representative of the speci-mens’ stable behaviour. Although the results shown infigures 4 and 5 were for a porcine cornea, they weretypical of most specimens tested, including those ob-tained from ovine corneas.
3.2. Strain-rate effects
The average stress–strain behaviour of porcine andovine corneas is shown in figure 6. In both cases,there was gradual stiffening with increases in strainrate. The results show a large and statistically signifi-cant (P < 0.05) increase in stress with increasing thestrain rate from 0.8% min–1 to 25% min–1 in porcinecorneas. Further increases in stress followed with
0
4
8
12
16
20
24
0.0 0.2 0.4 0.6 0.8
Tang
ent m
odul
us (M
Pa)
Stress (MPa)
Cycle 1Cycle 2Cycle 3Cycle 4Cycle 10
a)
(b)
Fig. 5. A typical example results of the effect of conditioning in stabilising the mechanical behaviour of a porcine cornea.The results show the variation of E-stress behaviour over the first 10 cycles of loading (since the behaviour change
between cycles 4 and 10 was negligible, results for cycles 5 to 9 were omitted for clarity) (a),and the variation of E at different stress levels with the progression of load cycles (b)
Strain-rate sensitivity of porcine and ovine corneas 31
higher strain rates, but the stepped changes were sta-tistically insignificant. On the other hand, ovine cor-neas continued to demonstrate statistically significant(P < 0.05) increases in stress with most changes instrain rate.
Figure 7 presents the average and standard devia-tion of the tangent modulus at two intermediate stresslevels over the seven strain rates considered. The figureshows that porcine corneas experienced large (40.2%on average) and statistically significant (P < 0.05)increases in E with changes in strain rate from 0.8to 8% min–1. Subsequent increases in strain rate ledto much lower, and statistically insignificant, increases
in E. On average, E at 420% min–1 strain rate was only26.1% higher than that in the tests conducted at8% min–1, and the difference in E results between thetwo groups was not statistically significant (P = 0.46).Ovine corneas demonstrated markedly different be-haviour with gradual and mostly statistically significantincreases in E between each two consecutive strainrates. Compared to E at 0.8% min–1, E at the fasterstrain rates were higher by 15.4 ± 11.1%, 40.8± 16.9%, 71.1 ± 21.2%, 100.6 ± 33.0%, 109.7 ± 36.9%and 208.7 ± 63.8%, respectively.
The stiffening of porcine and ovine corneas underhigher stresses and their response to variations in strain
(a) (b)
Fig. 6. Average behaviour of porcine (a) and ovine (b) corneas at different strain rates.Only the behaviour associated with 4 strain rates is shown for clarity
0
10
20
30
40
50
60
0.8 8 25 42 83 210 420
Tang
ent m
odul
us (M
Pa)
Strain rate (% per minute)
Stress = 0.3 MPaStress = 0.6 MPa
0
10
20
30
40
50
60
0.8 8 25 42 83 210 420
Tang
ent m
odul
us (M
Pa)
Strain rate (% per minute)
Stress = 0.3 MPaStress = 0.6 MPa
(a) (b)
Fig. 7. Effect of strain rate on the values of tangent modulus of porcine corneas (a), and ovine corneas (b)at two intermediate stress levels of 0.3 and 0.6 MPa

A. ELSHEIKH et al.32
rate are compared in figure 8. The figure presents com-parisons of E values of porcine and ovine corneas atdifferent stress levels and three strain rates, including thelowest (0.8% min–1), the highest (420% min–1) and anintermediate value (25% min–1). In all cases, E in-creased with stress, as would be expected with thematerial’s collagenous content. However, it is evidentthat the difference between the E values for porcineand ovine corneas changed considerably – was smallat 0.8% min–1 (32% on average – range = 14–69%)and increased gradually to 42% (20–49%) with25% min–1 and 133% (46–176%) under 420% min–1
rate. The large difference under 420% min–1 strain ratereflects the difference in behaviour between porcine andovine corneas, where the former experienced stable be-haviour with strain rates above 8% min–1 while the lattercontinued to undergo large increases in E with all addi-tions to the strain rate (figure 7).
3.3. Strain-rate material parameters
For most of the behaviour observed, both porcineand ovine corneas closely followed an exponentialstress–strain relationship of the form )1( −= εbeaσ ,where a and b were constants. Beyond a certain highstress, the σ–ε relationship became almost linear; σ =c.ε + d, with c and d being two more constants. Figure 9presents a schematic description of the physicalmeaning of parameters a–d and the two stages of hy-perelastic and elastic material behaviour.
Fitting the two equation forms to each averagestress–strain behaviour, and finding the stress levelthat separated the exponential and linear behaviourstages, and the values of constants a–d were con-ducted while minimising the sum of absolute errors;Σ abs(σequation – σexperiment). The values of the constants
0
10
20
30
40
50
0.0 0.2 0.4 0.6
Tang
ent m
odul
us (M
Pa)
Stress (MPa)
Porcine corneasOvine corneas
0
10
20
30
40
50
0.0 0.2 0.4 0.6Ta
ngen
t mod
ulus
(M
Pa)
Stress (MPa)
Porcine corneasOvine corneas
0
10
20
30
40
50
0.0 0.2 0.4 0.6
Tang
ent m
odul
us (
MPa
)
Stress (MPa)
Porcine corneasOvine corneas
(a) (b) (c)
Fig. 8. Tangent modulus values of porcine and ovine corneas at 0.8% min–1 strain rate (a),25% min–1 rate (b) and 420% min–1 rate (c)
Stre
ss (
)σ
Strain ( )ε
Hyperelasticbehaviour
σ = a (ebε-1)
Linear behaviourσ ε= c. + d
σ`
ε` σ`
Tang
ent m
odul
us (E
)
Stress ( )σ
Constant ELinear increase in EE = cE = b (σ + a)
a.bb
c
(a) (b)
Fig. 9. Typical behaviour of corneal tissue including stress–strain behaviour (a),and tangent modulus–stress relationship (b)

Strain-rate sensitivity of porcine and ovine corneas 33
for tests with different strain rates on porcine andovine corneas are listed in table 1. With these values,the average error: Σ abs(σequation – σexperiment) per eachbehaviour point remained below 0.01 MPa. The tableshows gradual increases in the values of a and b indi-cating both higher initial E values (= a.b) and fasterincreases in E with stress (dependent on b) with higherstrain rates. There was also a gradual increase in c withstrain rate, meaning higher E values within the finallinear stage of a specimen’s stress–strain behaviour.
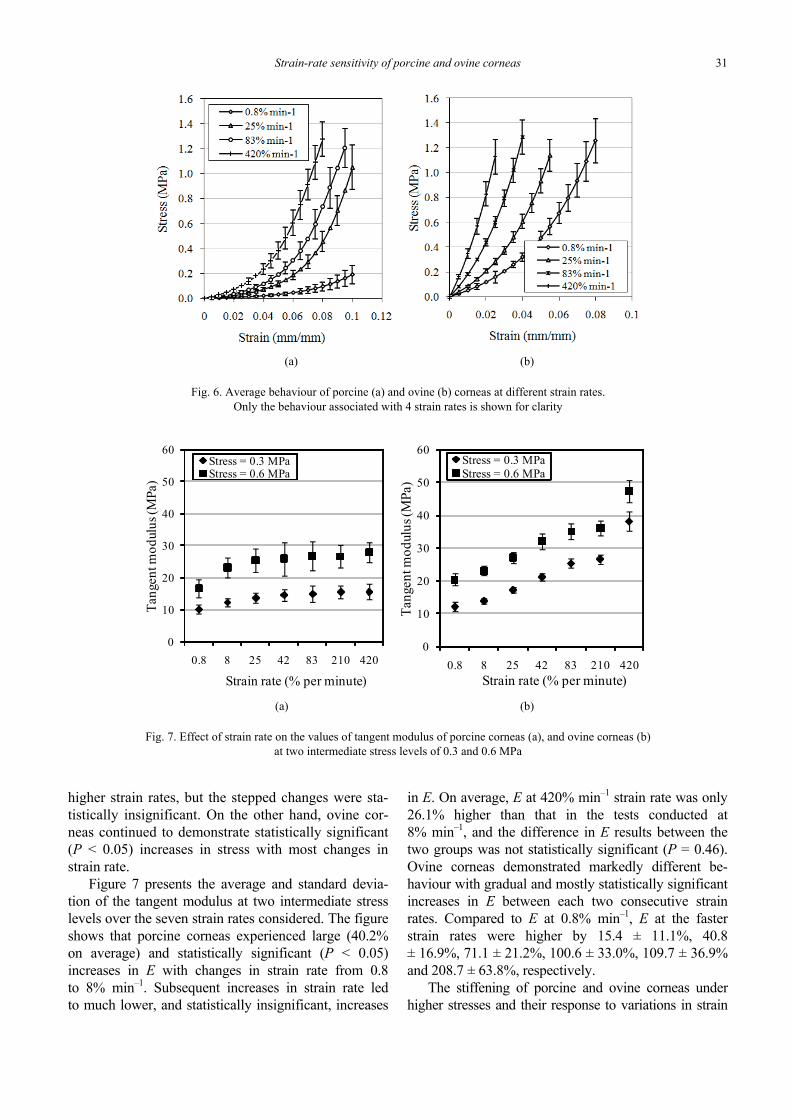
The effect of varying the strain rate on the valuesof α and μ parameters of the Ogden strain energyfunction (equation (3)) is illustrated in table 2. Theresults include those obtained from fitting the averageexperimental results of each strain rate to the Ogdenfunction of the third order (N = 3). The average abso-lute errors (Σ abs(σpredicted – σexperimental) / n, where n isthe number of data points) reduced significantly withincreasing the function order, as illustrated in table 3.In most cases, the improvement of the quality of fitcontinued with increasing the function order, and it wasnecessary to adopt N = 3 to achieve a close match withthe experimental results. However, attempting N = 4produced little further improvement in accuracy. Anexample of the close fit with the experimental resultsachieved with N = 3 is illustrated in figure 10.
Fig. 10. Average stress–strain behaviouras obtained experimentally for porcine corneas subjected to
a strain rate of 25% min–1 and the Ogden curve fit result
The results in table 2 show gradual increases in μ1and considerably smaller, less consistent increases inα1. Together, these trends indicate that higher strainrates were associated with increases in stress for thesame strain, according to equation (3), and increasesin tangent modulus for the same stress. Variations inparameters μ2, μ3, α2 and α3 were much less influen-tial and only helped improve the fit with the experi-mental data.
Table 1. Values of equation parameters a, b, c and d that provide the best fit within each group of tests,and the stress σ separating the exponential and linear behaviour stages
Porcine specimens Ovine specimensStrain rate
a b c d σ a b c d σ0.8% min–1 0.01 34.12 5.80 –0.39 0.36 0.15 27.12 31.24 –1.38 1.218% min–1 0.01 39.54 18.55 –1.39 0.46 0.15 30.55 48.07 –1.54 1.4225% min–1 0.01 40.47 23.67 –1.53 0.57 0.22 32.88 50.74 –1.67 1.3242% min–1 0.02 41.40 28.78 –1.67 0.67 0.29 35.46 57.29 –1.64 1.3283% min–1 0.03 41.67 31.41 –1.78 0.73 0.36 36.00 73.86 –1.88 1.39210% min–1 0.05 41.72 38.86 –1.79 0.85 0.38 39.00 72.50 –1.47 1.48420% min–1 0.05 41.90 38.75 –1.82 0.87 0.54 43.97 78.94 –1.90 1.45
Table 2. Parameters of third-order Ogden’s strain energy function (equation (3))that provided the best fit with the experimental results
Porcine specimens Ovine specimensStrain rate
μ1 α1 μ2 α2 μ3 α3 μ1 α1 μ2 α2 μ3 α3
0.8% min–1 –2.36 43.28 2.48 43.08 –0.04 43.98 –2.21 48.97 3.95 43.80 –0.54 –43.628% min–1 –2.34 43.10 2.49 43.26 –0.02 43.98 –2.61 53.97 4.60 48.71 –0.57 –45.61
25% min–1 –2.21 43.05 2.61 43.29 –0.22 43.98 –4.33 54.47 7.62 48.71 –0.57 –45.6142% min–1 –2.44 50.96 3.27 48.73 –0.91 41.19 –6.04 54.47 10.79 48.71 –0.57 –104.3283% min–1 –2.54 52.94 3.49 50.30 –1.00 40.78 –8.25 54.47 14.51 48.71 –0.57 –104.32210% min–1 –2.83 55.52 4.36 51.46 –1.43 40.31 –8.26 54.73 14.84 48.71 –0.57 –104.32420% min–1 –2.86 55.69 4.54 51.28 –1.31 40.31 –12.15 54.73 21.22 48.71 –0.57 –104.32
A. ELSHEIKH et al.34
The parameters of the hyperelastic anisotropicfunction (equation (4)) are finally presented in table4. The optimisation of the function parameters wasbased on the assumptions of material incompressi-bility and two preferred directions (vertical andhorizontal) with moderate fibre scatter. The resultsof the optimisation exercise, which was based onfitting the function to the experimental results,show gradual increases in the values of all parame-ters with rises in strain rate. Together, these trendsindicate higher stresses for the same strain andhigher E for the same stress, as has been observedexperimentally. The average absolute errors are alsoincluded in table 4 and have been found to remainbelow 0.04 MPa per data point, which was signifi-cantly small when considering the stress range of thetests (0–1.2 MPa for porcine corneas and 0–1.35 MPafor ovine corneas).
4. Discussion
Determining the sensitivity of the cornea’s stress–strain behaviour to strain-rate changes is of great impor-tance for the numerical simulation of corneal response toslow mechanical actions such as intraocular pressurevariation with posture change [13] and contact tonome-try, and fast actions including eye rubbing [14], [27],sports’ and accidental impacts [28] and non-contact to-nometry [15]. The strain rates associated with these me-chanical actions range widely over several orders ofmagnitude and may go beyond the range considered inthis study (0.8 to 420% per minute). Identifying the ef-fect of strain-rate on the stress–strain response of cornealtissue is essential to ensure that the material constitutivemodel used in simulation is compatible with the ex-pected strain rate of the mechanical action.
Table 3. Average absolute error per point (in kPa) associated with using Ogden’s strain energy function (equation (3))with N = 1, 2 or 3. Percentage values depict the errors of fit compared with the cases with N = 1
Porcine specimens Ovine specimensStrain rate
N = 1 N = 2 N = 3 N = 1 N = 2 N = 30.56 0.56 0.00 22.90 1.45 0.01
0.8% min–1
(100%) (100.0%) (0.01%) (100.0%) (6.3%) (0.1%)0.37 0.37 0.00 38.50 38.26 0.59
8% min–1
(100.0%) (100.0%) (0.02%) (100.0%) (99.4%) (1.5%)2.82 2.82 0.01 92.18 33.06 0.34
25% min–1
(100.0%) (99.9%) (0.28%) (100.0%) (35.9%) (0.4%)15.91 15.89 0.11 123.94 58.83 0.63
42% min–1
(100.0%) (99.9%) (0.69%) (100.0%) (47.5%) (0.5%)20.95 20.91 0.14 148.40 69.25 0.80
83% min–1
(100.0%) (99.8%) (0.67%) (100.0%) (46.7%) (0.5%)44.61 31.38 0.14 149.23 70.91 0.74
210% min–1
(100.0%) (70.34%) (0.32%) (100.0%) (47.5%) (0.5%)50.02 10.32 0.08 124.48 73.51 0.54
420% min–1
(100.0%) (20.63%) (0.15%) (100.0%) (59.1%) (0.4%)
Table 4. Parameters of the anisotropic hyperelastic energy function (equation (4))that provide the best fit with the experimental results
Porcine specimens Ovine specimensStrain rate
C10 k1 k2
Error/point(MPa) C10 k1 k2
Error/point(MPa)
0.8% min–1 0.00464 0.90 211 0.00 0.00255 9.44 283 0.038% min–1 0.00464 0.90 411 0.03 0.00255 13.89 283 0.02
25% min–1 0.00255 4.45 211 0.04 0.00255 25.00 283 0.0142% min–1 0.00255 4.45 280 0.04 0.00255 25.00 750 0.0383% min–1 0.00255 6.50 280 0.03 0.00255 30.00 1000 0.04210% min–1 0.00255 10.00 280 0.03 0.00255 40.00 1000 0.03420% min–1 0.00255 10.00 322 0.03 0.00255 70.00 1000 0.01

Strain-rate sensitivity of porcine and ovine corneas 35
In preparation for work on human corneas, thestudy started with porcine and ovine tissues becauseof their wide availability and reasonable similarity inmechanical behaviour and microstructural composi-tion to human corneas [4], [9], [10]. Both porcine andovine corneas demonstrated strain-rate dependentbehaviour with stiffening associated with higher strainrates. This finding is compatible with the known ef-fect of strain rate on collagen fibres, which dominatethe cornea’s mechanical performance. Similar effectof strain rate on behaviour has been reported before inocular sclera [29], skin [30]–[32], placenta [33], braintissue [34], kidney capsular membrane [35] and otherbiological tissues. The studies further observed in-creased fracture stresses [36] and decreased fracturestrains [35] with higher strain rates.
While in general agreement with earlier findings,the current study revealed considerable differencesbetween porcine and ovine corneas in their responseto strain-rate changes. Most notably, while ovine cor-neas continued to experience increased stiffening (highertangent modulus) with higher strain rates throughout thefull experimental range, porcine corneas’ response wassignificant over only a limited range of low rates. Thishas been demonstrated, for example, by the small andstatistically insignificant increases in tangent modulus ofporcine corneas between 25% min–1 and 83% min–1 andbetween 83% min–1 and 420% min–1, which were 4.1± 5.7% and 7.2±13.0%, respectively. These weremuch lower than the corresponding average tangentmodulus increases in ovine corneas; 15.5 ± 10.7% and42.7 ± 15.8%, the latter of which was statisticallysignificant.
A number of theories exist to explain the tissue’ssensitivity to strain rate. LANIR believed that much ofthe sensitivity was attributed to the aligning and un-coiling movement of collagen fibrils in the directionof applied stress [37], while others argued that it wasdue to decoran proteoglycans and anionic glycosami-noglycan (AGAG) interfibrillar bridges acting as mo-lecular springs in connecting the fibrils together [37]–[39]. However, while available theories may helpexplain the sensitivity of the tissue to strain rate, theyare still unable to reconcile significant differences inbehaviour such as those observed in this study be-tween porcine and ovine corneal tissue.
The strip extensometry testing used in this studyhas a number of well-documented limitations causedby the initially curved form of the specimen and thetermination of fibrils along the specimen sides [16],[40]. The straightening of the specimens from theircurved form results in initial strains that affect thebehaviour under subsequent loading. The relatively
large specimen thickness poses a difficulty with thepotential of unequal clamping of external and inter-nal tissue layers. The uniaxial loading adopted instrip testing is also different from the biaxial loadingexpected in intact eye globes, possibly leading tochanges in obtained behaviour. Further, since uni-axial testing conditioning is required to establisha recoverable reference state, the repeated loadingand unloading are expected to remodel the tissue’smicro-structure, aligning collagen fibres more in thedirection of load, and affecting the accuracy of theresults’ representation of real behaviour. Althoughthese limitations affect the technique’s suitability toobtain the global properties of corneal tissue, thetechnique remains viable for comparative studiessimilar to the present one where the focus is on thevariation in tissue behaviour caused by changes instrain rate.
The limitations associated with uniaxial strip test-ing could be overcome with the use of inflation testingwhere the tissue is kept intact and loaded with a poste-rior pressure that closely simulates the intraocular pres-sure. However, current inflation experimental facilitiesonly allow control of pressure application rates ratherthan strain rates [1], [7] and would therefore be un-suitable for the current study. This particular limita-tion has further made it difficult to validate the strain-rate dependent constitutive models presented in thispaper.
Validation of the constitutive models is consideredessential since the quantification of the models’ pa-rameters was based on macroscopic mechanical testsrather than on histological investigations identifyingthe anisotropy of the tissue’s micro-structure. An idealvalidation of the constitutive models would be tocompare their performance in whole globe numericalmodels subjected to intraocular pressure elevationagainst the experimental behaviour of eye globes in-flated under strain-controlled conditions. Modifica-tions are currently being introduced to the authors’inflation test rig to enable a strain-controlled loadingmethod, which could be used in future studies to pro-vide relevant inflation behaviour suitable for validat-ing the constitutive models of this study.
References
[1] ELSHEIKH A., WANG D., BROWN M., RAMA P., CAMPANELLI M.,PYE D., Assessment of corneal biomechanical properties andtheir variation with age, Curr. Eye Res., 2007, 32(1), 11–19.
[2] BRYANT M.R., McDONNELL P.J., Constitutive laws for biome-chanical modeling of refractive surgery, J. Biomech. Eng.,1996, 118(4), 473–481.

A. ELSHEIKH et al.36
[3] LEONARDI M., LEUENBERGER P., BERTRAND D., BERTSCH A.,RENAUD P., First steps toward noninvasive intraocular pres-sure monitoring with a sensing contact lens, Invest. Oph-thalmol. Vis. Sci., 2004, 45(9), 3113–3117.
[4] ELSHEIKH A., ALHASSO D., RAMA P., Biomechanical proper-ties of human and porcine corneas, Exp. Eye Res., 2008,86(5), 783–790.
[5] BERTSCH A., LEONARDI M., RENAUD P., The sensing contactlens, Med. Device Technol., 2006, 17(5), 19–21.
[6] ELSHEIKH A., WANG D., RAMA P., CAMPANELLI M.,GARWAY-HEATH D., Experimental assessment of human cor-neal hysteresis, Curr. Eye Res., 2008, 33(3), 205–213.
[7] BOYCE B.L., GRAZIER J.M., JONES R.E., NGUYEN T.D., Full-field deformation of bovine cornea under constrained infla-tion conditions, Biomaterials, 2008, 29(28), 3896–3904.
[8] ELSHEIKH A., ALHASSO D., Mechanical anisotropy of porcinecornea and correlation with stromal microstructure, Exp.Eye Res., 2009, 88(6), 1084–1091.
[9] LEONARDI M., PITCHON E.M., BERTSCH A., RENAUD P.,MERMOUD A., Wireless contact lens sensor for intraocularpressure monitoring: assessment on enucleated pig eyes,Acta Ophthalmol., 2009, 87(4), 433–437.
[10] HAYES S., BOOTE C., LEWIS J., SHEPPARD J., ABAHUSSIN M.,QUANTOCK A.J., PURSLOW C., VOTRUBA M., MEEK K.M.,Comparative study of fibrillar collagen arrangement in thecorneas of primates and other mammals, Anat. Rec.(Hoboken), 2007, 290(12), 1542–1550.
[11] MEEK K.M., LEONARD D.W., Ultrastructure of the cornealstroma: a comparative study, Biophys. J., 1993, 64(1), 273–280.
[12] CAREW E.O., BARBER J.E., VESELY I., Role of precondition-ing and recovery time in repeated testing of aortic valve tis-sues: validation through quasilinear viscoelastic theory,Ann. Biomed. Eng., 2000, 28(9), 1093–1100.
[13] KOTHE A.C., The effect of posture on intraocular pressureand pulsatile ocular blood flow in normal and glaucomatouseyes, Surv. Ophthalmol., 1994, 38, S191–197.
[14] McMONNIES C.W., BONEHAM G.C., Experimentally in-creased intraocular pressure using digital forces, Eye Con-tact Lens, 2007, 33(3), 124–129.
[15] LUCE D.A., Determining in vivo biomechanical properties ofthe cornea with an ocular response analyzer, J. Cataract. Re-fract. Surg., 2005, 31(1), 156–162.
[16] ELSHEIKH A., ANDERSON K., Comparative study of cornealstrip extensometry and inflation tests, J. R. Soc. Interface,2005, 2(3), 177–185.
[17] WOO S.L., KOBAYASHI A.S., SCHLEGEL W.A., LAWRENCE C.,Nonlinear material properties of intact cornea and sclera,Exp. Eye Res., 1972, 14(1), 29–39.
[18] SHAW A.J., COLLINS M.J., DAVIS B.A., CARNEY L.G., Eyelidpressure and contact with the ocular surface, Invest. Oph-thalmol. Vis. Sci., 2010, 51(4), 1911–1917.
[19] SHAW A.J., DAVIS B.A., COLLINS M.J., CARNEY L.G., A tech-nique to measure eyelid pressure using piezoresistive sensors,IEEE Trans. Biomed. Eng., 2009, 56(10), 2512–2517.
[20] SHAW A.J., COLLINS M.J., DAVIS B.A., CARNEY L.G., Eyelidpressure: inferences from corneal topographic changes,Cornea, 2009, 28(2), 181–188.
[21] KAMPMEIER J., RADT B., BIRNGRUBER R., BRINKMANN R.,Thermal and biomechanical parameters of porcine cornea,Cornea, 2000, 19(3), 355–363.
[22] MEEK K.M., BOOTE C., The use of X-ray scattering tech-niques to quantify the orientation and distribution of colla-
gen in the corneal stroma, Prog. Retin. Eye Res., 2009,28(5), 369–392.
[23] BOYCE B.L., JONES R.E., NGUYEN T.D., GRAZIER J.M.,Stress-controlled viscoelastic tensile response of bovine cor-nea, J. Biomech., 2007, 40(11), 2367–2376.
[24] ZENG Y., YANG J., HUANG K., LEE Z., LEE X., A comparisonof biomechanical properties between human and porcinecornea, J. Biomech., 2001, 34(4), 533–537.
[25] BOOTE C., DENNIS S., HUANG Y., QUANTOCK A.J., MEEKK.M., Lamellar orientation in human cornea in relation tomechanical properties, J. Struct. Biol., 2005, 149(1), 1–6.
[26] MEEK K.M., BOOTE C., The organization of collagen in thecorneal stroma, Exp. Eye Res., 2004, 78(3), 503–512.
[27] McMONNIES C.W., Abnormal rubbing and keratectasia, EyeContact Lens, 2007, 33(6), 265–271.
[28] UCHIO E., OHNO S., KUDOH J., AOKI K., KISIELEWICZ L.T.,Simulation model of an eyeball based on finite elementanalysis on a supercomputer, Br. J. Ophthalmol., 1999,83(10), 1106–1111.
[29] DOWNS J.C., BURGOYNE C.F., THOMAS K.A., THOMPSONH.W., HART R.T., Effects of strain rate on the mechanicalproperties of posterior rabbit sclera, [in:] Proceedings of thefirst joint BMES/EMBS Conference Serving Humanity, Ad-vancing Technology, Atlana, GA, USA, 1999.
[30] ZHOU B., XU F., CHEN C.Q., LU T.J., Strain rate sensitivity ofskin tissue under thermomechanical loading, PhilosophicalTransactions of the Royal Society A: Mathematical, Physicaland Engineering Sciences, 2010, 368(1912), 679–690.
[31] POTTS R.O., CHRISMAN D.A. Jr, BURAS E.M. Jr, The dynamicmechanical properties of human skin in vivo, Journal ofBiomechanics, 1983, 16(6), 365–372.
[32] DALY C.H., Biomechanical properties of dermis, J. Invest.Dermatol., 1982, 79, Suppl 1, 17s–20s.
[33] MANOOGIAN S.J., Effect of strain rate on the tensile materialproperties of human placenta, Journal of Biomechanical En-gineering-Transactions of the ASME, 2009, 131(9).
[34] SACK I., BEIERBACH B., WUERFEL J., KLATT D., HAMHABERU., PAPAZOGLOU S., MARTUS P., BRAUN J., The impact ofaging and gender on brain viscoelasticity, NeuroImage,2009, 46(3), 652–657.
[35] SNEDEKER J.G., NIEDERER P., SCHMIDLIN F.R., FARSHAD M.,DEMETROPOULOS C.K., LEE J.B., YANG K.H., Strain–rate de-pendent material properties of the porcine and human kidneycapsule, Journal of Biomechanics, 2005, 38(5), 1011–1021.
[36] SHERGOLD O.A., FLECK N.A., RADFORD D., The uniaxialstress versus strain response of pig skin and silicone rubberat low and high strain rates, International Journal of ImpactEngineering, 2006, 32(9), 1384–1402.
[37] LANIR Y., The rheological behaviour of the skin: experi-mental results and a structural model, Biorheology, 1979,16(3), 191–202.
[38] SCOTT J.E., Elasticity in extracellular matrix “shape mod-ules” of tendon, cartilage, etc. A sliding proteoglycan-filament model, J. Physiol., 2003, 553(Pt 2), 335–343.
[39] HAVERKAMP R.G., WILLIAMS M.A., SCOTT J.E., Stretchingsingle molecules of connective tissue glycans to characterizetheir shape-maintaining elasticity, Biomacromolecules,2005, 6(3), 1816–1818.
[40] HOELTZEL D.A., ALTMAN P., BUZARD K., CHOE K., Stripextensiometry for comparison of the mechanical response ofbovine, rabbit, and human corneas, J. Biomech. Eng., 1992,114(2), 202–215.

![Species Identification of Bovine, Ovine and Porcine Type 1 ......Int. J. Mol. Sci. 2016, 17, 445 2 of 17 processed animal by-products during the 1990s [6], the ability to discriminate](https://img.pdfslide.us/doc/110x75/5f445b8b150efd632a7dad98/species-identification-of-bovine-ovine-and-porcine-type-1-int-j-mol.jpg)