Embed Size (px)
Citation preview
Strain Rate Effect on Development Length of Steel Reinforcement Using Shock Tube Testing
by
Lauren Toikka
A thesis submitted to the Faculty o f Graduate and Postdoctoral Affairs in partial fulfillment o f the requirements for the degree o f
Master o f Applied Science
in
Civil Engineering
Carleton University
Ottawa, Ontario
© 2012 , Lauren Toikka

1+1Library and Archives Canada
Published Heritage Branch
Bibliotheque et Archives Canada
Direction du Patrimoine de I'edition
395 Wellington Street Ottawa ON K1A0N4 Canada
395, rue Wellington Ottawa ON K1A 0N4 Canada
Your file Votre reference
ISBN: 978-0-494-94288-8
Our file Notre reference
ISBN: 978-0-494-94288-8
NOTICE:
The author has granted a nonexclusive license allowing Library and Archives Canada to reproduce, publish, archive, preserve, conserve, communicate to the public by telecommunication or on the Internet, loan, distrbute and sell theses worldwide, for commercial or noncommercial purposes, in microform, paper, electronic and/or any other formats.
AVIS:
L'auteur a accorde une licence non exclusive permettant a la Bibliotheque et Archives Canada de reproduire, publier, archiver, sauvegarder, conserver, transmettre au public par telecommunication ou par I'lnternet, preter, distribuer et vendre des theses partout dans le monde, a des fins commerciales ou autres, sur support microforme, papier, electronique et/ou autres formats.
The author retains copyright ownership and moral rights in this thesis. Neither the thesis nor substantial extracts from it may be printed or otherwise reproduced without the author's permission.
L'auteur conserve la propriete du droit d'auteur et des droits moraux qui protege cette these. Ni la these ni des extraits substantiels de celle-ci ne doivent etre imprimes ou autrement reproduits sans son autorisation.
In compliance with the Canadian Privacy Act some supporting forms may have been removed from this thesis.
While these forms may be included in the document page count, their removal does not represent any loss of content from the thesis.
Conformement a la loi canadienne sur la protection de la vie privee, quelques formulaires secondaires ont ete enleves de cette these.
Bien que ces formulaires aient inclus dans la pagination, il n'y aura aucun contenu manquant.
Canada

Abstract
Research is currently underway to study the effects o f both accidental and
premeditated explosions on concrete infrastructure systems with an ultimate goal of
minimizing infrastructure damage and saving lives. In reinforced concrete design, it is
desirable to dissipate energy through yielding and essential to preclude non-ductile
failure modes such as bond failure. There currently exists a limited amount o f data for the
strain rate effects caused by blast loads on concrete-reinforcement bond strength. An
experimental program was therefore designed to investigate bond characteristics in
reinforced concrete beams subject to blast loads using the shock tube at the University of
Ottawa. Static and dynamic strain profiles at yield were developed from the experimental
data along the bond length to determine the effect o f increased strain on the bond
characteristics in reinforced concrete beams. The test results showed that the
development length required for load transfer at high strain rates was lower than that
required under static loading. Thus the development length requirement for reinforced
concrete beams under static loading in accordance with the Canadian Standards
Association standard for design of concrete structures is sufficient for reinforced concrete
beams subject to high strain rate such as under blast loading.

Acknowledgments
I cannot thank my supervisor, Dr. Abass Braimah, enough for his support over the
last two years. Without his guidance, encouragement, enthusiasm, and passion for
teaching and mentoring his students, completing my thesis would have been an incredibly
difficult or near-impossible task.
1 would like to acknowledge Dr. Murat Saatcioglu o f University o f Ottawa and
Dr. Ghani Razaqpur o f McMaster University for their support and also making this
research project possible. I would also like to acknowledge Carleton University and OGS
for their financial support, which allowed me to concentrate on my studies.
The support of my colleagues was also critical to my success in the laboratory. I
would like to thank Alan Lloyd and Eric Jacques for being incredible mentors throughout
this process. Not only did they teach me everything I needed to know in the lab, but they
also provided me with guidance on understanding my experimental results and writing
my thesis. I also want to express my gratitude to Ben Riley for all o f his help in the
laboratory. Without the long hours he put in and his genuine interest in my research
subject, I would not have been able to complete my lab work with as much ease and
success.
Finally I would like to thank my parents for their incredible support throughout all
my years o f study at Carleton University. Both my family and friends provided me with
the encouragement and reassurance that 1 needed to get me through the completion o f this
degree.
ii
Table of Contents
Abstract.............................................................................................................................................. i
Acknowledgments............................................................................................................................. ii
List of Figures.................................................................................................................................vii
List of Tables..................................................................................................................................xvi
Nomenclature...............................................................................................................................xviii
1 Chapter: Introduction.............................................................................................................. 1
1.1 Need for Blast Resistant Buildings...............................................................................1
1.2 Objective of Experimental Program.............................................................................2
1.3 Organization of Thesis..................................................................................................3
2 Chapter: Literature Review......................................................................................................5
2.1 Concrete-Reinforcement Bond Behaviour....................................................................7
2.1.1 Transfer of Forces from Steel Reinforcement to Surrounding Concrete.................7
2.1.2 Theoretical and Experimental Determination of Development Length..................8
2.1.3 Factors that Affect the Bond of Concrete to Reinforcing Steel........................... 11
2.1.4 Failure Mechanisms of Reinforced Concrete Beams............................................ 14
2.2 Blast Load Effect on Structures..................................................................................15
2.3 High strain rate Effect on the Compressive and Tensile Strength of Concrete 18
2.4 Numerical models for Concrete under Dynamic Loading..........................................21
2.5 DIF for Concrete in Current Practice........................................................................ 22
2.6 High Strain Rate Effect on Reinforcing Steel............................................................ 23
2.7 Derivations of Numerical Models for Steel Reinforcement Under High -Strain Rate
Loading...................................................................................................................................26
2.7.1 Soroushian and Choi (1987): Steel Mechanical Properties at Different StrainRates 27
2.7.2 Malvar and Crawford (1998): Dynamic Increase Factors for Steel ReinforcingBars 29
2.7.3 Comite Euro-International du Beton (CEB): Concrete Structures Under Impactand Impulsive Loading (1988)......................................................................................... 30
2.7.4 Unified Facilities Criteria (2008)......................................................................... 31
2.8 The Effect of Dynamic Loads on Bond of Reinforcing Steel to Concrete.................33
3 Chapter: Experimental Program............................................................................................37
3.1 General.......................................................................................................................37
3.2 Description of Test Specimens...................................................................................37
3.3 Material Properties......................................................................................................38
3.3.1 Concrete.................................................................................................................38
3.3.2 Steel.......................................................................................................................38
3.4 Construction of test specimens...................................................................................39
3.4.1 Longitudinal reinforcement and strain gauge application.....................................39
3.4.2 Transverse Reinforcement..................................................................................... 40
3.4.3 Formwork...............................................................................................................41
3.4.4 Casting and Curing................................................................................................ 41
3.5 Static Testing.............................................................................................................. 42
3.5.1 Data Acquisition for Static Tests........................................................................... 43
3.6 Dynamic Testing Using Shock Tube..........................................................................44
3.6.1 Dynamic Test Setup...............................................................................................45
3.6.1.1 Data Acquisition.......................................................................................... 46
4 Chapter: Experimental Results.............................................................................................62
4.1 Ancillary Testing........................................................................................................ 62
4.1.1 Tensile Strength of Steel Reinforcement............................................................... 62
4.1.2 Compressive Strength of Concrete Cylinders....................................................... 64
4.2 Static Results 73
4.2.1 Beam SB-15M-1................................................................................................... 73
4.2.2 Beam SB-15M-2................................................................................................... 75
4.2.3 Beam SB-20M-1................................................................................................... 76
4.2.4 Beam SB-20M-2................................................................................................... 77
4.2.5 Beam SB-25M-1................................................................................................... 79
4.2.6 Beam SB-25M-2....................................................................................................80
4.3 Dynamic Test Results................................................................................................98
4.3.1 DB-15M Beams..................................................................................................... 98
4.3.1.1 Beam DB-15M-1........................................................................................... 99
4.3.1.2 Beam DB-15M-2 and DB-15M-3............................................................... 104
4.3.2 DB-20M Beams....................................................................................................110
4.3.2.1 Beam DB-20M-1......................................................................................... 110
4.3.2.2 Beam DB-20M-2 and DB-20M-3............................................................. 114
4.3.3 DB-25M Beams....................................................................................................119
4.3.3.1 BeamDB-25M-l Beam.............................................................................. 120
4.3.3.2 Beam DB-25M-2 and DB-25M-3............................................................... 124
4.4 Comparison of Static and Dynamic Results........................................................... 192
4.4.1 Comparison of SB-15M and DB-15M Beams..................................................193
4.4.1.1 Elastic Region.............................................................................................193
4.4.1.2 Yield Strain.................................................................................................. 194
4.4.1.3 Post-Yield Region........................................................................................ 194
4.4.2 Comparison of SB-20M and DB-20M Beams..................................................194
4.4.2.1 Elastic Region.............................................................................................195
4.4.2.2 Yield Strain.................................................................................................. 195
4.4.2.3 Post-Yield Region........................................................................................ 196
v
4.4.3 Comparison of SB-25M and DB-25M Beams.................................................... 196
4.4.3.1 Elastic Region............................................................................................. 196
4.4.3.2 Yield Strain................................................................................................. 197
4.4.3.3 Post-Yield Region.......................................................................................197
4.5 Summary of Results................................................................................................. 206
4.6 Sources of Error....................................................................................................... 207
4.6.1 Construction of Specimens...................................................................................207
4.6.2 Installation of Specimen on Shock tube or Static Loading Apparatus............... 209
4.6.3 Data Acquisition Installation and Operation....................................................... 209
5 Chapter: Analytical Work..................................................................................................212
5.1 Determination of Bond Strength from Strain Gauge Readings................................212
5.2 Empirical Formulas for Bond Strength................................................................... 212
6 Chapter: Conclusions......................................................................................................... 218
6.1 Summary...................................................................................................................218
6.2 Conclusions............................................................................................................. 219
6.3 Recommendations.................................................................................................... 220
vi
List of Figures
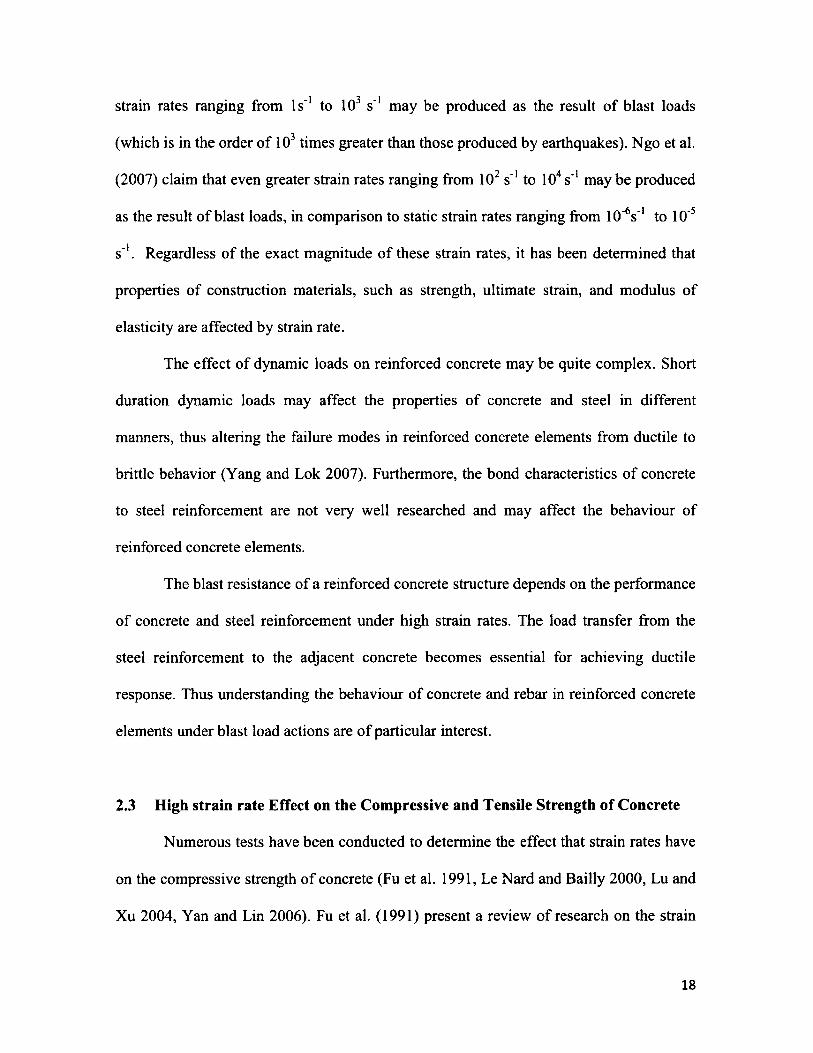
Figure 2-1: Blast wave parameters (Ngo et al. 2007)............................................................ 16
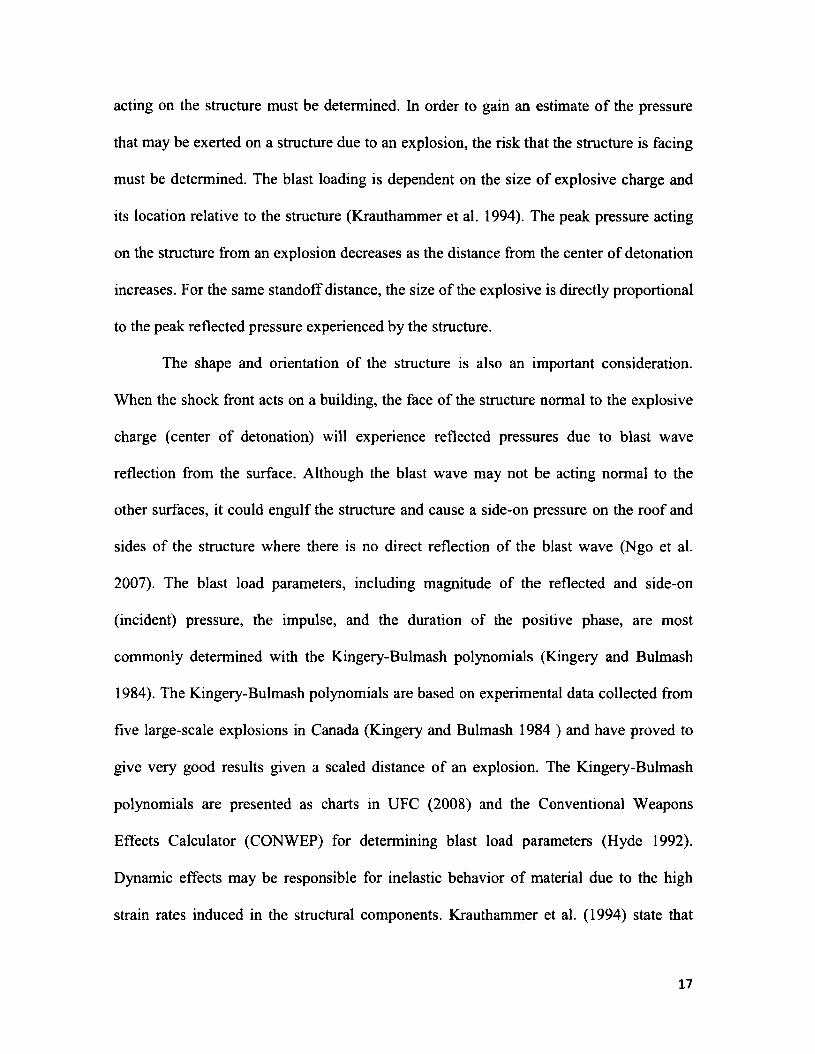
Figure 2-2: Effect of Strain Rate on Concrete Strength (ASCE 1997).............................. 19
Figure 2-3: Effect of Strain Rate on Steel Strength (ASCE 1997)......................................24
Figure 3-1: Debonded Region in Concrete Beam................................................................... 48
Figure 3-2: Beam Cross-Sectional A rea................................................................................... 48
Figure 3-3: Strain Gauge Application....................................................................................... 49
Figure 3-4: Soldering o f Strain Gauge Lead W ires................................................................ 49
Figure 3-5: Strain Gauge Locations Along Length o f Reinforcement................................ 50
Figure 3-6: Construction o f Cages for Transverse Reinforcement.......................................50
Figure 3-7: Steel Reinforcement Protruding Through Formwork....................................... 51
Figure 3-8: Concrete Gauge Installation and Preformed Crack........................................... 51
Figure 3-9: Caulking o f Vinyl Pipe for Debonded Region.................................................... 52
Figure 3-10: Concrete Gauge Locations................................................................................... 52
Figure 3-11: Concrete Gauges in Form work........................................................................... 53
Figure 3-12: Placement o f Steel Cages, Longitudinal Reinforcement, and Concrete
Gauges Prior to Casting o f Concrete.........................................................................................54
Figure 3-13: Concrete Cylinders................................................................................................ 54
Figure 3-14: Casting of Concrete Beams.................................................................................. 55
Figure 3-15: Location o f Load Points in Static T ests.............................................................55
Figure 3-16: Static Test Setup.....................................................................................................56
Figure 3-17: Midspan and Load-Point Gauges........................................................................ 56
vii
Figure 3-18: Beam End Wire G auge.........................................................................................57
Figure 3-19: Load Transfer Device at Shock Tube Opening.................................................57
Figure 3-20: Angle View of Load Transfer Device................................................................ 58
Figure 3-21: Placement o f Concrete Beam of Shock Tube Using Forklift..........................58
Figure 3-22: Welded Rod to Achieve Simply Supported Conditions.................................. 59
Figure 3-23: Concrete Beam Setup on Shock Tube................................................................ 59
Figure 3-24: Anchor Bolt Installation for Connection to LVDT.......................................... 60
Figure 3-25: Installation of Welded Member Used for Bottom LVDT............................... 60
Figure 3-26: Placement o f Bottom LVDT in Welded Member............................................ 61
Figure 3-27: Beam Setup on Shock Tube.................................................................................61
Figure 4-1: Stress-strain curve for 15M reinforcement..........................................................71
Figure 4-2: Stress-strain curve for 20M reinforcement..........................................................71
Figure 4-3: Stress-strain curve for 25M reinforcement..........................................................72
Figure 4-4: Load vs. Deflection o f Beam SB-15M -1.............................................................83
Figure 4-5: Steel Strains in Beam SB-15M-1.......................................................................... 83
Figure 4-6: Strain Profile at Yield in Beam SB-15M-1..........................................................84
Figure 4-7: Concrete Strains in Beam SB-15M-1................................................................... 84
Figure 4-8: Beam SB-15M-1 After Loading........................................................................... 85
Figure 4-9: Load vs. Deflection o f Beam SB-15M -2.............................................................85
Figure 4-10: Strains in Beam SB-15M-2..................................................................................86
Figure 4-11: Strain Profile at Yield in Beam SB-15M-2....................................................... 86
Figure 4-12: Concrete Strains in Beam SB-15M-2................................................................. 87
Figure 4-13: Beam SB-15M-2 After Loading.........................................................................87
viii
Figure 4-14: Load vs. Deflection of Beam SB-20M-1.........................................................88
Figure 4-15: Strains in Beam SB-20M-1..................................................................................88
Figure 4-16: Strain Profile at Yield in Beam SB-20M-1....................................................... 89
Figure 4-17: Beam SB-20M-1 After Loading......................................................................... 89
Figure 4-18: Load vs. Deflection o f Beam SB-20M -2...........................................................90
Figure 4-19: Strains in Beam SB-20M-2..................................................................................90
Figure 4-20: Strain Profile at Yield in Beam SB-20M-2....................................................... 91
Figure 4-21: Concrete Strains in Beam SB-20M-2................................................................. 91
Figure 4-22: Beam SB-20M-2 After Loading.........................................................................92
Figure 4-23: Load vs. Deflection o f Beam SB-20M -2...........................................................92
Figure 4-24: Strains in Beam SB-25M-1..................................................................................93
Figure 4-25: Strain Profile at Yield in Beam SB-25M-1....................................................... 93
Figure 4-26: Concrete Strains in Beam SB-25M-1................................................................. 94
Figure 4-27: Beam SB-25M-1 After Loading.........................................................................94
Figure 4-28: Load vs. Deflection o f Beam SB-25M -2...........................................................95
Figure 4-29: Strains in Beam SB-25M-2.................................................................................95
Figure 4-30: Strain Profile at Yield in Beam SB-25M-2....................................................... 96
Figure 4-31: Concrete Strains in Beam SB-25M-2................................................................. 96
Figure 4-32: Beam SB-25M-2 After Loading.........................................................................97
Figure 4-33: Pressure and Impulse Time History for Test DB-15M -1-1.......................... 134
Figure 4-34: Pressure and Displacement Time History for Test DB-15M -1-1................ 134
Figure 4-35: Strains in Steel for Test DB-15M-1-1.............................................................. 135
Figure 4-36: Strains in Concrete for Test DB-15M-1-1.....................................................135
Figure 4-37: Crack Pattern After Test DB-15M-1-1.......................................................... 136
Figure 4-38: Pressure and Impulse Time History for Test DB-15M-1-2.......................... 136
Figure 4-39: Pressure and Displacement Time History for Test DB-15M-1-2................ 137
Figure 4-40: Crack Pattern After Test DB-15M -1-2............................................................ 137
Figure 4-41: Pressure and Impulse Time History for Test DB-15M-1-3.......................... 138
Figure 4-42: Pressure and Displacement Time History for Test DB-15M-1-3................ 138
Figure 4-43: Strain in Steel for Test DB-15M -1-3................................................................139
Figure 4-44: Strain in Concrete for Test DB-15M-1-3.........................................................139
Figure 4-45: Crack Pattern After Test DB-15M -1-3............................................................ 140
Figure 4-46: Pressure and Impulse Time History for Test DB-15M-1-4.......................... 140
Figure 4-47: Pressure and Displacement Time History for Test DB-15M-1-4................ 141
Figure 4-48: Strains in Steel for Test DB-15M-1-4.............................................................. 141
Figure 4-49: Crack Pattern After Test DB-15M -1-4............................................................ 142
Figure 4-50: Pressure and Impulse Time History for Test DB-15M-2-1.......................... 142
Figure 4-51: Pressure and Displacement History for Test DB-15M-2-1........................... 143
Figure 4-52: Strains in Steel for Test DB-15M-2-1.............................................................. 143
Figure 4-53: Strain Profile at Yield for Test DB-15M-2-1.................................................. 144
Figure 4-54: Strains in Concrete for Test DB-15M -2-1.......................................................144
Figure 4-55: Crack Pattern After Test DB-15M -2-1............................................................ 145
Figure 4-56: Pressure and Impulse Time History for Test DB-15M-2-2.......................... 145
Figure 4-57: Pressure and Displacement Time History for Test DB-15M-2-2................ 146
Figure 4-58: Strains in Steel for Test DB-15M-2-2.............................................................. 146
Figure 4-59: Strain Profile at Yield for Test DB-15M-2-2.................................................147
x
Figure 4-60: Strains in Concrete for Test DB-15M-2-2.....................................................147
Figure 4-61: Crack Pattern After Test DB-15M -2-2............................................................ 148
Figure 4-62: Pressure and Impulse Time History for Test DB-15M-3-1.......................... 148
Figure 4-63: Pressure and Displacement Time History for Test DB-15M -3-1................ 149
Figure 4-64: Strains in Steel for Test DB-15M-3-1.............................................................. 149
Figure 4-65: Strain Profile at Yield for Test DB-15M-3-1.................................................. 150
Figure 4-66: Strains in Concrete for Test DB-15M -3-1.......................................................150
Figure 4-67: Crack Pattern After Test DB-15M -3-1............................................................ 151
Figure 4-68: Pressure and Impulse Time History for Test DB-15M-3-2.......................... 151
Figure 4-69: Pressure and Displacement Time History for Test DB-15M -3-2................ 152
Figure 4-70: Strains in Steel for Test DB-15M-3-2.............................................................. 152
Figure 4-71: Strain Profile at Yield for Test DB-15M-3-2.................................................. 153
Figure 4-72: Crack Pattern After Test DB-15M -3-2............................................................ 153
Figure 4-73: Pressure and Impulse Time History for Test DB-20M-1-1.......................... 154
Figure 4-74: Pressure and Displacement Time History for Test DB-20M -1-1................ 154
Figure 4-75: Strains in Steel for Test DB-20M-1-1.............................................................. 155
Figure 4-76: Strains in Concrete for Test DB-20M -1-1.......................................................155
Figure 4-77: Crack Pattern After Test DB-20M -1-1............................................................ 156
Figure 4-78: Pressure and Impulse Time History for Test DB-20M-1-2.......................... 156
Figure 4-79: Pressure and Displacement Time History for Test DB-20M -1-2................ 157
Figure 4-80: Strains in Steel for Test DB-20M-1-2.............................................................. 157
Figure 4-81: Crack Pattern After Test DB-20M -1-2............................................................ 158
Figure 4-82: Pressure and Impulse Time History for Test DB-20M-1-3......................... 158
xi
Figure 4-83: Pressure and Displacement Time History for Test DB-20M-1-3................159
Figure 4-84: Strains in Steel for Test DB-20M-1-3.............................................................. 159
Figure 4-85: Crack Pattern After Test DB-20M -1-3............................................................ 160
Figure 4-86: Pressure and Impulse Time History for Test DB-20M-2-1.......................... 160
Figure 4-87: Pressure and Displacement Time History for Test DB-20M -2-1................ 161
Figure 4-88: Strains in Steel for Test DB-20M-2-1.............................................................. 161
Figure 4-89: Strain Profile at Yield for Test DB-20M-2-1.................................................. 162
Figure 4-90: Strains in Concrete for Test DB-20M -2-1.......................................................162
Figure 4-91: Crack Pattern After Test DB-20M -2-1............................................................ 163
Figure 4-92: Pressure and Impulse Time History for Test DB-20M-2-2.......................... 163
Figure 4-93: Pressure and Displacement Time History for Test DB-20M -2-2................ 164
Figure 4-94: Strains in Steel for Test DB-20M-2-2.............................................................. 164
Figure 4-95: Strain Profile at Yield for Test DB-20M-2-2.................................................. 165
Figure 4-96: Strains in Concrete for Test DB-20M -2-2.......................................................165
Figure 4-97: Crack Pattern After Test DB-20M -2-2............................................................ 166
Figure 4-98: Pressure and Impulse Time History for Test DB-20M-3-1.......................... 166
Figure 4-99: Pressure and Displacement Time History for Test DB-20M -3-1................ 167
Figure 4-100: Strains in Steel for Test DB-20M-3-1............................................................ 167
Figure 4-101: Strain Profile at Yield for Test DB-20M-3-1................................................ 168
Figure 4-102: Strains in Concrete for Test DB-20M -3-1.................................................... 168
Figure 4-103: Crack Pattern After Test DB-20M -3-1..........................................................169
Figure 4-104: Pressure and Impulse Time History for Test DB-20M-3-2........................ 169
Figure 4-105: Pressure and Displacement Time History for Test DB-20M-3-2..............170
xii
Figure 4-106: Strains in Steel for Test DB-20M-3-2.......................................................... 170
Figure 4-107: Strain Profile at Yield for Test DB-20M-3-2................................................ 171
Figure 4-108: Crack Pattern After Test DB-20M -3-2.......................................................... 171
Figure 4-109: Pressure and Impulse Time History for Test DB-25M -1-1........................172
Figure 4-110: Pressure and Displacement Time History for Test DB-25M -1-1..............172
Figure 4-111: Strain in Steel for Test DB-25M -1-1............................................................. 173
Figure 4-112: Strains in Concrete for Test DB-25M -1-1.....................................................173
Figure 4-113: Crack Pattern After Test DB-25M -1-1..........................................................174
Figure 4-114: Pressure and Impulse Time History for Test DB-25M -1-2........................174
Figure 4-115: Pressure and Displacement Time History for Test DB-25M -1-2..............175
Figure 4-116: Strains in Steel for Test DB-25M-1-2............................................................ 175
Figure 4-117: Strains in Concrete for Test DB-25M -1-2.................................................... 176
Figure 4-118: Crack Pattern After Test DB-25M -1-2..........................................................176
Figure 4-119: Pressure and Impulse Time History for Test DB-25M -1-3........................177
Figure 4-120: Pressure and Displacement Time History for Test DB-25M -1-3..............177
Figure 4-121: Strains in Steel for Test DB-25M-1-3............................................................ 178
Figure 4-122: Strains in Concrete for Test DB-25M -1-3.................................................... 178
Figure 4-123: Crack Pattern After Test DB-25M -1-3.......................................................... 179
Figure 4-124: Pressure and Impulse Time History for Test DB-25M -2-1........................179
Figure 4-125: Pressure and Displacement Time History for Test DB-25M -2-1.............. 180
Figure 4-126: Strains in Steel for Test DB-25M-2-1............................................................ 180
Figure 4-127: Strain Profile at Maximum Strain for Test DB-25M -2-1........................... 181
Figure 4-128: Strains in Concrete for Test DB-25M-2-1...................................................181
xiii
Figure 4-129: Crack Pattern After Test DB-25M-2-1........................................................182
Figure 4-130: Pressure and Impulse Time History for Test DB-25M -2-2........................182
Figure 4-131: Pressure and Displacement Time History for Test DB-25M -2-2..............183
Figure 4-132: Strains in Steel for Test DB-25M-2-2............................................................ 183
Figure 4-133: Strain Profile at Yield for Test DB-25M-2-2................................................ 184
Figure 4-134: Strains in Concrete for Test DB-25M -2-2.....................................................184
Figure 4-135: Crack Pattern After Test DB-25M -2-1..........................................................185
Figure 4-136: Pressure and Impulse Time History for Test DB-25M -3-1........................185
Figure 4-137: Pressure and Displacement Time History for Test DB-25M -3-1..............186
Figure 4-138: Strains in Steel for Test DB-25M-3-1............................................................ 186
Figure 4-139: Strain Profile at Maximum Strain for Test DB-25M -3-1........................... 187
Figure 4-140: Strains in Concrete for Test DB-25M -3-1.................................................... 187
Figure 4-141: Crack Pattern After Test DB-25M -3-1..........................................................188
Figure 4-142: Pressure and Impulse Time History for Test DB-25M -3-2........................188
Figure 4-143: Pressure and Displacement Time History for Test DB-25M -3-2..............189
Figure 4-144: Strains in Steel for Test DB-25M-3-2............................................................ 189
Figure 4-145: Strain Profile at Yield for Test DB-25M-3-2................................................190
Figure 4-146: Strains in Concrete for Test DB-25M -3-2.................................................... 190
Figure 4-147: Crack Pattern After Test DB-25M -3-2..........................................................191
Figure 4-148: Strain Profile at 1500 microstrain in Debonded Region for 15M
Reinforcement.............................................................................................................................201
Figure 4-149: Strain Profile at Yield Strain in Debonded Region for 15M Reinforcement
201
xiv
Figure 4-150: Strain Profile Post-Yield Strain in Debonded Region for 15M
Reinforcement.............................................................................................................................202
Figure 4-151: Strain Profile at 1500 microstrain in Debonded Region for 20M
Reinforcement.............................................................................................................................202
Figure 4-152: Strain Profile at Yield Strain in Debonded Region for 20M Reinforcement
.......................................................................................................................................................203
Figure 4-153: Strain Profile at Post-Yield Strain in Debonded Region for 20M
Reinforcement.............................................................................................................................203
Figure 4-154: Strain Profile at 1500 microstrain in Debonded Region for 25M
Reinforcement.............................................................................................................................204
Figure 4-155: Strain Profile at Yield Strain in Debonded Region for 25M Reinforcement
.......................................................................................................................................................204
Figure 4-156: Strain Profile Post-Yield Strain in Debonded Region for 25M
Reinforcement.............................................................................................................................205
xv
List of Tables
Table 2-1: Dynamic Increase Factors for Concrete (UFC 2008)..........................................23
Table 2-2: Yield Strength increase of Steel Subject to Rapid Loading Rates (Keenan and
Feldman 1960, Flathau. 1971, ACI Committee 439 1969)....................................................25
Table 2-3: Dynamic Increase Factors for Steel Reinforcement (UFC 2008)..................... 32
Table 4-1: Strength values for static steel tests........................................................................66
Table 4-2: Strength values for steel tests conducted at a rate o f 0.1 strain/s...................... 66
Table 4-3: Strength values for steel tests conducted at a rate o f 0.2 strain/s...................... 67
Table 4-4: Dynamic Increase Factor for Steel Reinforcement............................................. 67
Table 4-5: Strain values for static steel tests............................................................................ 68
Table 4-6: Strain values for steel tests conducted at a rate o f 0.1 strain/s...........................68
Table 4-7: Strain values for steel tests conducted at a rate o f 0.2 strain/s...........................69
Table 4-8: Increase in Strain Values for Steel Reinforcement at High Strain R ates 69
Table 4-9: Strengths of concrete cylinders...............................................................................70
Table 4-10: Summary of Static Results.................................................................................... 82
Table 4-11: Pressure, impulse, displacement, support rotation and crack width data for
beams DB-15M-1, DB-20M-1, and DB-25M -1....................................................................130
Table 4-12: Strain and displacement data for beams DB-15M-1, DB-20M-1, and DB-
25M-1........................................................................................................................................... 131
Table 4-13: Pressure, impulse, displacement, support rotation and crack width data for
beams DB-15M-2, DB-15M-3, DB-20M-2, DB-20M-3, DB-25M-2, and DB-25M-3.. 132
xvi
Table 4-14: Strain and displacement data for beams DB-15M-2, DB-15M-3, DB-20M-2,
DB-20M-3, DB-25M-2, and DB-25M -3................................................................................ 133
Table 4-15: Average Strain Gauge Values for SB-15M Beam s........................................ 198
Table 4-16: Average Strain Gauge Values for DB-15M B eam s.............................. 198
Table 4-17: Average Strain Gauge Values for SB-20M Beam s............................... 199
Table 4-18: Average Strain Gauge Values for DB-20M B eam s.............................. 199
Table 4-19: Average Strain Gauge Values for SB-25M Beam s...............................200
Table 4-20: Average Strain Gauge Values for DB-25M B eam s..............................200
Table 5-1: Bond Stress in 15M Reinforcing Steel................................................................ 213
Table 5-2: Bond Stress in 20M Reinforcing Steel................................................................ 213
Table 5-3: Bond Stress in 25M Reinforcing Steel................................................................ 213
Table 5-4: Variables used to calculate bond strength...........................................................217
Table 5-5: Bond strengths calculated from various empirical formulas............................ 218

Nomenclature
A b - area o f reinforcing bar
Atr - area o f transverse reinforcement
c - smallest o f either the reinforcement spacing or concrete cover dimension
Cmax - greater o f the clear bottom cover to the longitudinal reinforcement or the side
to the longitudinal reinforcement
c min - smaller of the clear bottom cover to the longitudinal reinforcement or the side
cover to the longitudinal reinforcement
db - diameter of the reinforcing bar
DIF- dynamic increase factor
di - load point displacement
dm - midspan displacement
Eb - mean slope of the strain-hardening region in the static stress-strain diagram
Es - modulus o f elasticity o f steel
f c ’ - concrete compressive strength
fdc ’ - dynamic compressive strength o f concrete
fdu - dynamic ultimate strength o f steel
fd y - dynamic yield strength o f steel
f s - stress in reinforcing bar
f u -ultimate strength o f steel
f y - yield strength o f steel
f y, - yield stress of transverse reinforcement
Ir - reflected impulse

kj - bar location factor
k2 - coating factor
ks - concrete density factor
k4 -bar size factor
K,r - transverse reinforcement index
Id - development length
n - number of longitudinal bars being developed
N - number o f stirrups within the development length
Pd - driver pressure
Pr - reflected pressure
Rr— relative rib area o f the reinforcement
s - spacing o f transverse reinforcement
SIF - strength increase factor
T -b o n d force
td - positive phase duration
tmax - time to maximum displacement
tr - factor representing the effect o f the relative rib area on the steel contribution to the
bond force
td - factor representing the effect o f the bar size on the steel contribution to the bond
force
U - bond force per unit length
wCf - final width of preformed crack
wci - initial width o f preformed crack
xix
a - exponent for D IF o f steel (section 2.7.2)
a/u - exponent for DIF o f yield strength of steel (section 2.7.2)
a.fy- exponent for DIF o f yield strength o f steel (section 2.7.2)
as - exponent in equation for DIF o f concrete in compression (see section 2.4)
P - factor in equation for D IF o f concrete in compression (see section 2.4)
ys - factor in equation for DIF o f concrete in compression (see section 2.4)
5 - exponent in equation for D IF o f concrete in compression (see section 2.4)
A / - change in length
AT - change in tensile force in the reinforcing steel
e - dynamic strain rate
Edu ~ dynamic ultimate strain in steel
e0 - quasi static strain rate
es - static strain rate
es - strain in steel
9max - maximum support rotation
fx - bond stress
xx
1 Chapter: Introduction
1.1 Need for Blast Resistant Buildings
In recent years, the occurrence o f both accidental and premeditated explosions has
raised concern about the integrity o f critical infrastructures and their ability to protect
people from the effects of explosions. The Oklahoma City bombing in 1995 and the
September 11, 2001 attacks on the twin towers in New York City have raised concerns
about the ability o f buildings designed for aesthetic and economy to resist extreme
loading from terrorist attacks. Damage from explosive effects is not limited to terrorist
action alone. Accidental explosions may have similar detrimental effects. For example,
The Halifax explosion that occurred in 1917, from the accidental collision involving a
cargo ship carrying explosives resulted in many fatalities, collapsed or severely damaged
buildings within a 25-km radius from the centre o f explosion (MacDonald 2005). There
are however, methods available for mitigating some o f the damaging effects o f
explosions and improving the integrity o f building infrastructure. These include
mitigating window glass hazard and strengthening the exterior fa9ade o f buildings to
increase their blast resistance.
Reinforced concrete is the most common building material used in blast resistant
infrastructure due to its ability to absorb energy produced by explosions. The detailing o f
reinforcing steel within concrete elements is the key to achieving increased structural
integrity and ductility. Thus, it is important to attain high-quality bond of reinforcing
steel to concrete in structural elements through the development o f reinforcing steel.
1
While the current level of knowledge on the bond o f reinforcing steel to concrete
in beams is quite advanced, most o f this knowledge is on the effect of static or low-cycle
dynamic loading on bond. The effect o f dynamic loads, such as impact and blast, on
bond of reinforcement to concrete is a subject that has not been thoroughly explored. It is
a well-known fact that dynamic loads affect both steel and concrete properties, but it is
the interaction between these two materials that is o f particular importance for bond
characteristics.
1.2 Objective of Experimental Program
In order to advance the current level o f knowledge in blast design and mitigation,
the current experimental research program was designed to determine the bond strength
o f rebar in reinforced concrete beams under short duration dynamic loads such as those
produced by a blast; using the shock tube at the University of Ottawa. The bond strength
was investigated using concrete beams with three different sizes of reinforcement and at
different strain rates. The results o f the experimental program make it possible to
determine how the loading rate affects the bond between the steel reinforcement and
concrete. The goal is to develop code specifications for anchorage of steel reinforcement
in concrete beams for the recently published “Design and Assessment o f Buildings
Subjected to Blast Loads” (CSA S850-12 2012). Studying the behavior o f steel
reinforcement bond with concrete will lead to safer infrastructure design against blast
loading through the use o f proven design methodologies, economic building practices,
and reinforcement detailing for the protection o f Canada’s infrastructure.
2
1.3 Organization of Thesis
Chapter 2 o f this thesis presents a comprehensive literature review on the current
level o f knowledge on the factors that affect bond o f reinforcing steel to concrete in
beams, and derivations of bond and development length equations through experimental
and theoretical work. The effect o f blast loads on structures, the effects o f dynamic
loading on properties o f reinforcing steel and concrete and the effects o f dynamic loading
on bond between concrete and steel reinforcement are also discussed.
Chapter 3 describes the experimental program. The construction of 15 reinforced
concrete beams with 3 different sizes o f reinforcement (15M, 20M, and 25M) is
presented. The procedure for completing ancillary testing to determine the properties of
concrete and steel reinforcement are described. Furthermore, a description o f the static
and dynamic test procedure o f reinforced concrete beams to determine static and dynamic
characteristics and behaviour o f steel reinforcement- concrete bond is provided.
Chapter 4 presents a discussion o f the results obtained from the experimental
work. This includes the concrete and steel strengths from ancillary testing, the behaviour
of reinforced concrete beams, including reinforcement and concrete strains in bonded
region, under static loading, and the behaviour o f reinforced concrete beams under shock
tube testing. Strain profiles obtained in steel reinforcement under both static and dynamic
loading are also presented and discussed.
Chapter 5 analyzes the differences in bond behaviour from static and dynamic
tests in the elastic range, at the yield strain, and the post-yield range. The bond force
calculated from experimental results and compared to the empirical data is also presented
in Chapter 5.
3

Chapter 6 presents conclusions drawn from the experimental program and
recommendations for future work.
4
2 Chapter: Literature Review
In recent years, the occurrence of both accidental and premeditated explosions
close to building structures and other infrastructure systems has raised concern about the
integrity of buildings and infrastructure systems and their ability to protect the occupants,
processes, and critical systems. The London underground bombing o f 2005, the
September 11th attacks o f 2001 in the USA, the, and the Oklahoma City Bombing of
1995, to name only a few, have forever changed the way buildings are designed (Bangash
2006), especially those deemed critical or o f national significance.
Even though the driving force behind the new interest in blast resistant design is
the numerous premeditated attacks on buildings, explosion damage is not limited to only
events o f a terrorist attack. Accidental explosions could have similar detrimental effects
on buildings and infrastructure systems close to the center o f explosion. The Halifax
explosion of 1917 from the accidental collision involving a cargo ship carrying about
2400 metric tonnes o f explosives resulted in the loss o f many lives and collapse of
buildings within a 25-km radius o f Halifax Harbour (MacDonald 2005). In 1944, another
accidental explosion occurred in Port Chicago while munitions that were being loaded
onto a vessel detonated. This resulted in many deaths as well as damage to businesses and
about 90 percent o f the homes in the town (Allen 2006). Only a few years later, in 1947,
a fire was discovered aboard the Grandchamp in Texas City (Stephens 1997). After failed
attempts to put out the fire, the ammonium nitrate fertilizer aboard the ship exploded,
which later caused a second explosion on the High Flyer, another ship in the port carrying
ammonium nitrate. These two explosions destroyed over 500 homes and resulted in total
property losses o f $600 million including $500 million in petroleum products from the
5

Monsanto Chemical Company plant (Stephens 1997). In 1974, another chemical plant
was destroyed in Flixborough, England as a result o f a rupture in the bypass system,
which caused cyclohexane to leak from the reactor. Once the cyclohexane was ignited, a
large explosion took place, resulting in the death o f many workers and damage to the
surrounding properties (HSE 2012). More recently, in Cyprus at the Evangelos Florakis
Naval Base near the village o f Zygi, 98 containers o f explosives which were exposed to
high outdoor temperatures for over two years detonated (Psyllides 2011). A power station
in the vicinity was severely damaged leaving almost half of Cyprus without electricity.
Almost every home in a small town in Cyprus sustained damaged. The above examples
highlight only a few accidental explosions and their attendant damage to infrastructures
and human fatalities. Regardless of the source o f blast loading, whether accidental or
premeditated, human casualties and the damage to buildings and infrastructure systems
can be substantial. Thus, buildings with a high probability o f exposure to blast loading
must be designed to mitigate or limit the explosion hazard to occupants and critical
systems.
Today, reinforced concrete is the most common building material used in blast
resistant infrastructure design. Its ability to absorb energy produced by explosions is a
quality that makes reinforced concrete suitable for blast resistant design. The detailing of
reinforcing steel within concrete elements is the key to achieving structural integrity and
ductility.
6
2.1 Concrete-Reinforcement Bond Behaviour
The design o f structures subjected to extreme loading such as blast, impact, and
earthquake loads depends on ductility to dissipate energy. The ductility also ensures that
even though the structure could sustain extensive damage its stability is not
compromised. Ductility is the capacity o f a reinforced concrete member to achieve
deformations without considerably reducing its flexural capacity (Park and Ruitong
1988). When a reinforced concrete member is undergoing deformation, the steel
reinforcement stress is transferred into the concrete through the reinforcement-concrete
bond. The minimum bond length required to transfer the yield stress o f steel is termed the
development length (Park and Paulay 1975). Upon loading o f a simply-supported beam,
the yielding o f reinforcement will be initiated towards the midspan where cracks in
concrete are present. A strong bond between the tension reinforcing steel and the
surrounding concrete is essential to achieve a ductile failure mode.
The development length requirements o f reinforcement in concrete beams are
derived through sectional analysis. There are many research works in the literature
devoted to studying the development length o f reinforced and prestressed concrete under
static loading conditions. The following section briefly presents the theoretical and
experimental derivation of the development length equation for reinforced concrete
beams under static loads.
2.1.1 Transfer of Forces from Steel Reinforcement to Surrounding Concrete
In order to understand the bond length required to develop the yield strength in
steel reinforcement, it is imperative to understand how forces are transferred from one
7
material to the other. The resistance o f reinforced concrete structures to loads depends
greatly on the transfer of forces between concrete and steel reinforcement. ACI
Committee 408 (2003) recognized that transfer o f forces between reinforcement and
concrete in a reinforced concrete beam may take the form of:
• adhesion of concrete to steel reinforcement,
• friction between steel reinforcement and concrete,
• aggregate interlock between concrete aggregate and steel reinforcement ribs.
Alsiwat and Saatcioglu (1992) explain that when a reinforcing bar is stressed up
to its cutoff point (the point at which the reinforcing steel is terminated), the embedded
rebar will slip with respect to the surrounding concrete. When this happens, adhesion o f
the materials to one another is lost. Beyond this point, the friction at the interface o f the
steel and concrete, and the interlocking o f the rebar’s ribs with the concrete aggregate are
responsible for the transfer o f forces. As these forces become large, bond strength is
reduced. The concrete may begin to crack or crush in areas adjacent to the rebar and can
lead to the eventual failure o f the concrete element. It is also important to note that
because the transfer o f forces occurs on the contact area between the rebar and concrete,
an increase in length o f the bar increases the strength o f the bond (ACI Committee 408
2003).
2.1.2 Theoretical and Experimental Determination of Development Length
The development length o f reinforcement is based on the ability o f the bond
between reinforcing steel and concrete to transfer forces present in the steel to the
8
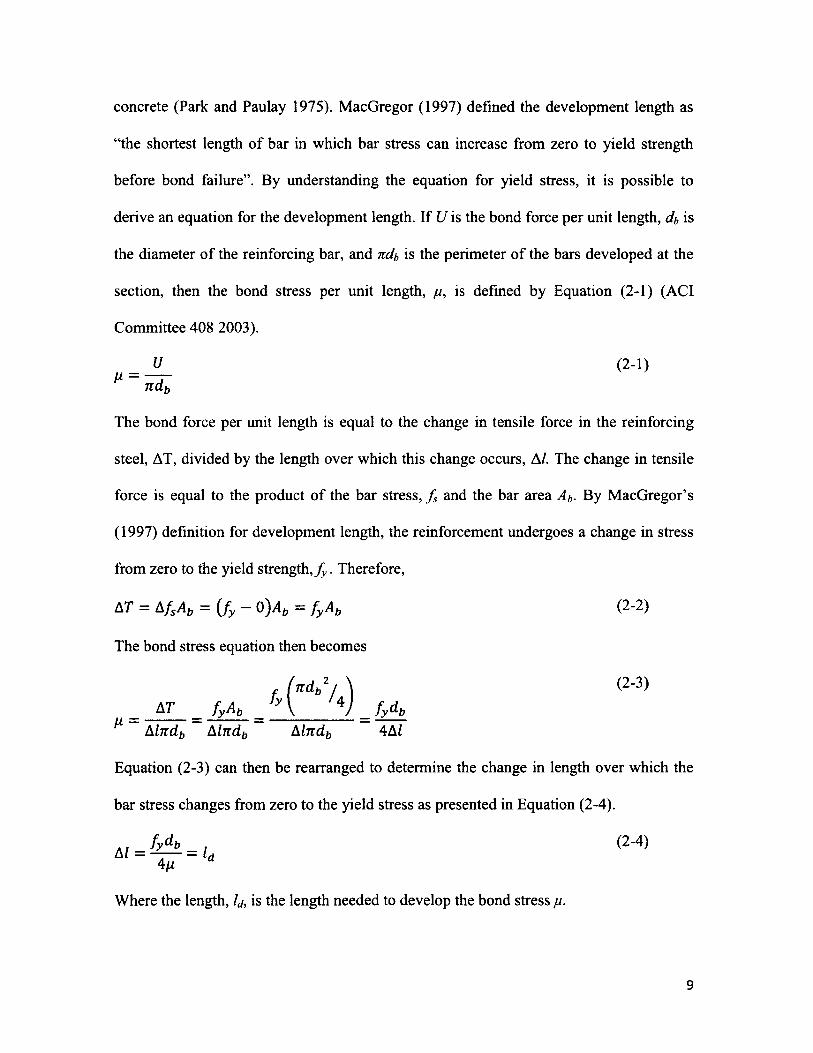
concrete (Park and Paulay 1975). MacGregor (1997) defined the development length as
“the shortest length o f bar in which bar stress can increase from zero to yield strength
before bond failure”. By understanding the equation for yield stress, it is possible to
derive an equation for the development length. If U is the bond force per unit length, db is
the diameter o f the reinforcing bar, and ndb is the perimeter o f the bars developed at the
section, then the bond stress per unit length, pi, is defined by Equation (2-1) (ACI
Committee 408 2003).
„ ~ L (2-‘>ndb
The bond force per unit length is equal to the change in tensile force in the reinforcing
steel, AT, divided by the length over which this change occurs, A/. The change in tensile
force is equal to the product o f the bar stress, f s and the bar area Ab. By MacGregor’s
(1997) definition for development length, the reinforcement undergoes a change in stress
from zero to the yield s tren g th ,^ . Therefore,
AT = Af sAb = ( fy - 0)A b = f yAb (2-2)
The bond stress equation then becomes
r K 2/ ) ( 2 ' 3 )
= _ M _ = ____ V f , d bA lndb Alndb M ndb 4AI
Equation (2-3) can then be rearranged to determine the change in length over which the
bar stress changes from zero to the yield stress as presented in Equation (2-4).
A (2'4)4/r
Where the length, Id, is the length needed to develop the bond stress pi.
9
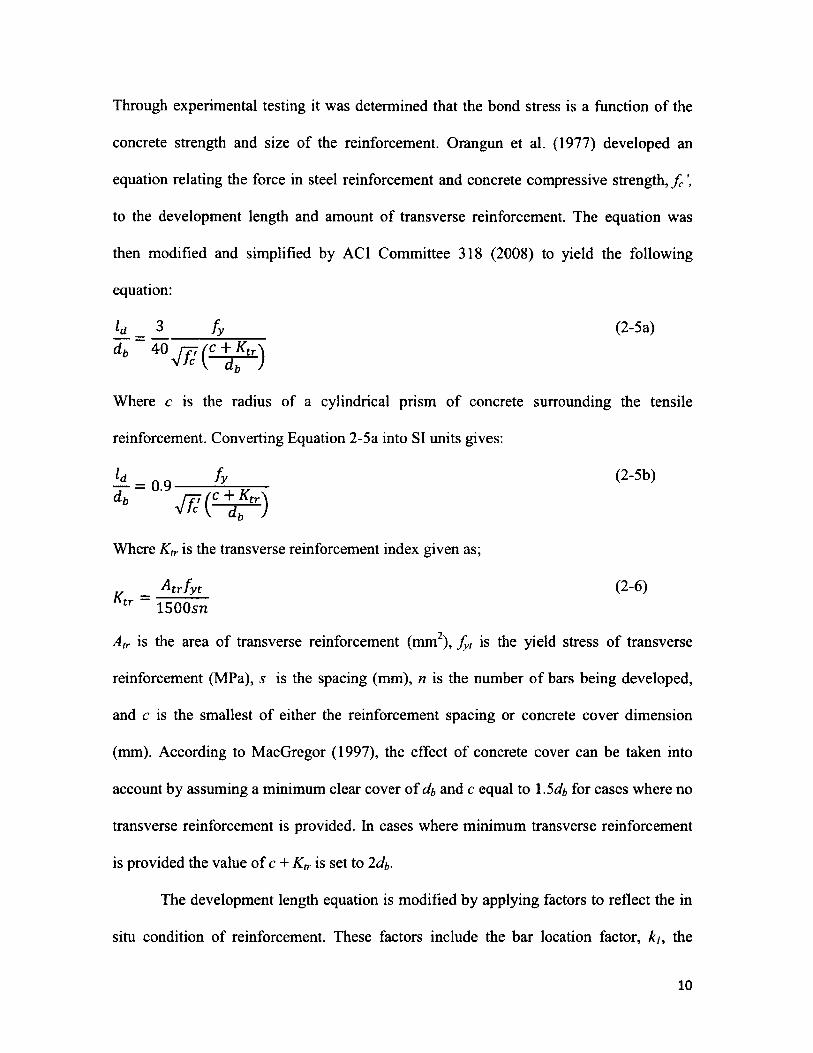
Through experimental testing it was determined that the bond stress is a function o f the
concrete strength and size o f the reinforcement. Orangun et al. (1977) developed an
equation relating the force in steel reinforcement and concrete compressive strength, f c
to the development length and amount o f transverse reinforcement. The equation was
then modified and simplified by ACI Committee 318 (2008) to yield the following
equation:
_ 3 fy (2-5a)
Where c is the radius of a cylindrical prism o f concrete surrounding the tensile
reinforcement. Converting Equation 2-5a into SI units gives:
fy (2-5b)dt ' rrrfc + K,-
Where Ktr is the transverse reinforcement index given as;
Atr fy t (2-6)K tr = 1500STI
Atr is the area o f transverse reinforcement (mm2), f y, is the yield stress o f transverse
reinforcement (MPa), s is the spacing (mm), n is the number o f bars being developed,
and c is the smallest o f either the reinforcement spacing or concrete cover dimension
(mm). According to MacGregor (1997), the effect o f concrete cover can be taken into
account by assuming a minimum clear cover of db and c equal to 1.5db for cases where no
transverse reinforcement is provided. In cases where minimum transverse reinforcement
is provided the value o f c + Klr is set to 2db-
The development length equation is modified by applying factors to reflect the in
situ condition o f reinforcement. These factors include the bar location factor, ki, the
10
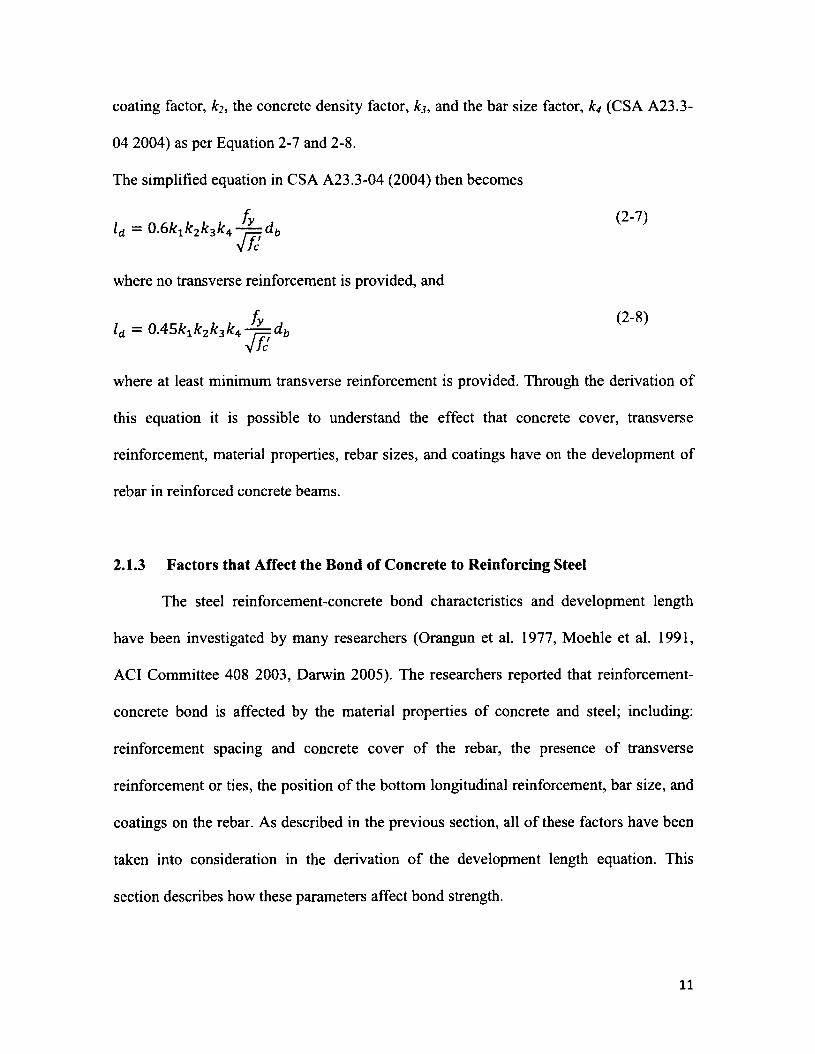
coating factor, k2, the concrete density factor, k3, and the bar size factor, k4 (CSA A23.3-
04 2004) as per Equation 2-7 and 2-8.
The simplified equation in CSA A23.3-04 (2004) then becomes
where at least minimum transverse reinforcement is provided. Through the derivation o f
this equation it is possible to understand the effect that concrete cover, transverse
reinforcement, material properties, rebar sizes, and coatings have on the development of
rebar in reinforced concrete beams.
2.1.3 Factors that Affect the Bond of Concrete to Reinforcing Steel
The steel reinforcement-concrete bond characteristics and development length
have been investigated by many researchers (Orangun et al. 1977, Moehle et al. 1991,
ACI Committee 408 2003, Darwin 2005). The researchers reported that reinforcement-
concrete bond is affected by the material properties o f concrete and steel; including:
reinforcement spacing and concrete cover of the rebar, the presence o f transverse
reinforcement or ties, the position o f the bottom longitudinal reinforcement, bar size, and
coatings on the rebar. As described in the previous section, all o f these factors have been
taken into consideration in the derivation o f the development length equation. This
section describes how these parameters affect bond strength.
V /c(2-7)
where no transverse reinforcement is provided, and
(2-8)
11
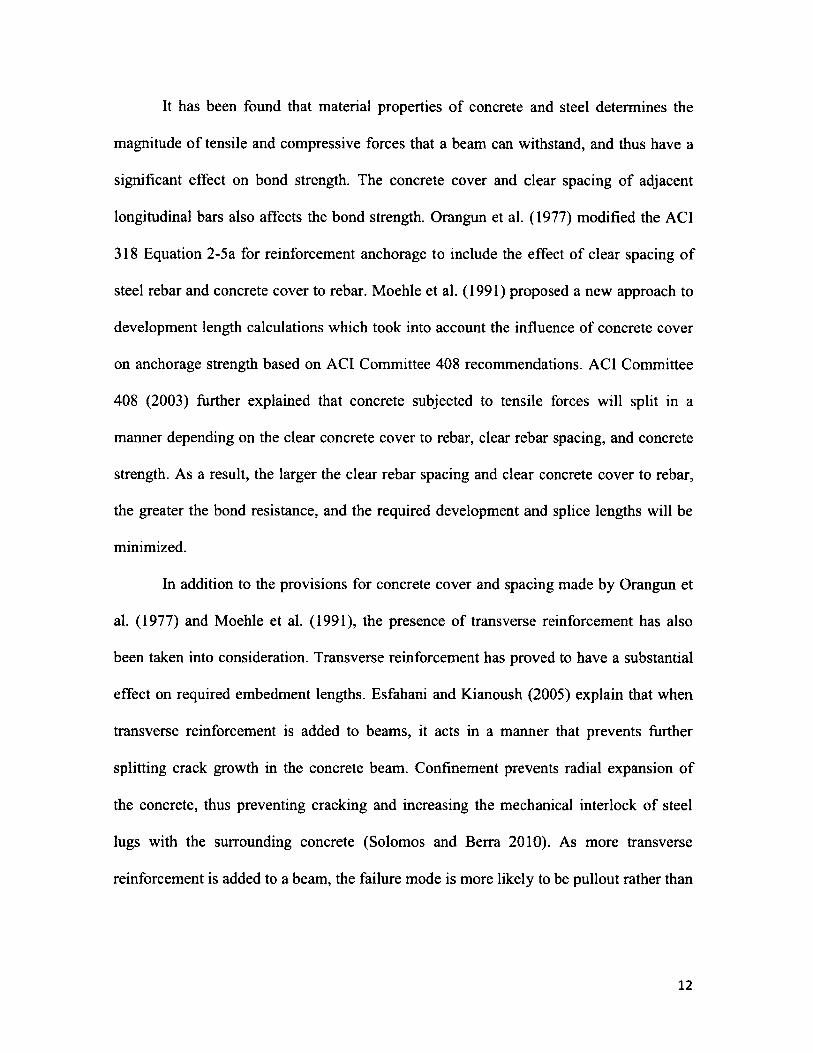
It has been found that material properties o f concrete and steel determines the
magnitude o f tensile and compressive forces that a beam can withstand, and thus have a
significant effect on bond strength. The concrete cover and clear spacing of adjacent
longitudinal bars also affects the bond strength. Orangun et al. (1977) modified the ACI
318 Equation 2-5 a for reinforcement anchorage to include the effect o f clear spacing o f
steel rebar and concrete cover to rebar. Moehle et al. (1991) proposed a new approach to
development length calculations which took into account the influence o f concrete cover
on anchorage strength based on ACI Committee 408 recommendations. ACI Committee
408 (2003) further explained that concrete subjected to tensile forces will split in a
manner depending on the clear concrete cover to rebar, clear rebar spacing, and concrete
strength. As a result, the larger the clear rebar spacing and clear concrete cover to rebar,
the greater the bond resistance, and the required development and splice lengths will be
minimized.
In addition to the provisions for concrete cover and spacing made by Orangun et
al. (1977) and Moehle et al. (1991), the presence o f transverse reinforcement has also
been taken into consideration. Transverse reinforcement has proved to have a substantial
effect on required embedment lengths. Esfahani and Kianoush (2005) explain that when
transverse reinforcement is added to beams, it acts in a manner that prevents further
splitting crack growth in the concrete beam. Confinement prevents radial expansion o f
the concrete, thus preventing cracking and increasing the mechanical interlock of steel
lugs with the surrounding concrete (Solomos and Berra 2010). As more transverse
reinforcement is added to a beam, the failure mode is more likely to be pullout rather than
12
concrete splitting failure, which leads to greater bond resistance (Esfahani and Kianoush
2005).
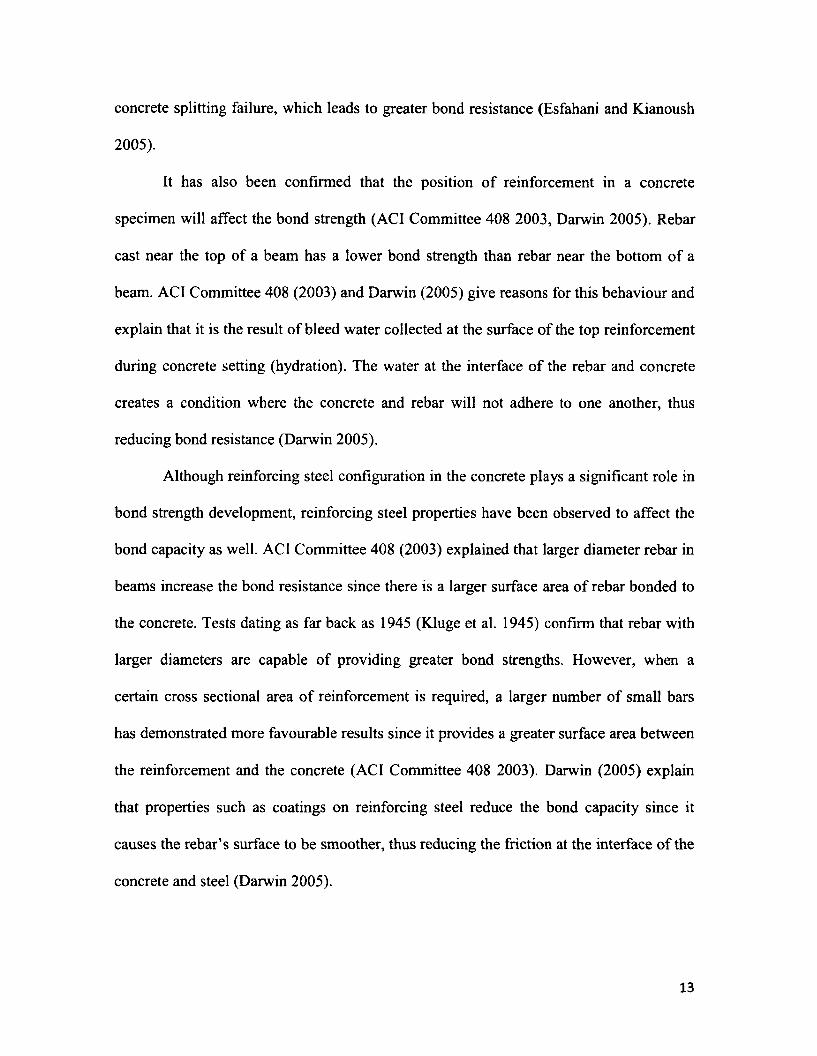
It has also been confirmed that the position o f reinforcement in a concrete
specimen will affect the bond strength (ACI Committee 408 2003, Darwin 2005). Rebar
cast near the top o f a beam has a lower bond strength than rebar near the bottom o f a
beam. ACI Committee 408 (2003) and Darwin (2005) give reasons for this behaviour and
explain that it is the result o f bleed water collected at the surface o f the top reinforcement
during concrete setting (hydration). The water at the interface o f the rebar and concrete
creates a condition where the concrete and rebar will not adhere to one another, thus
reducing bond resistance (Darwin 2005).
Although reinforcing steel configuration in the concrete plays a significant role in
bond strength development, reinforcing steel properties have been observed to affect the
bond capacity as well. ACI Committee 408 (2003) explained that larger diameter rebar in
beams increase the bond resistance since there is a larger surface area o f rebar bonded to
the concrete. Tests dating as far back as 1945 (Kluge et al. 1945) confirm that rebar with
larger diameters are capable o f providing greater bond strengths. However, when a
certain cross sectional area o f reinforcement is required, a larger number o f small bars
has demonstrated more favourable results since it provides a greater surface area between
the reinforcement and the concrete (ACI Committee 408 2003). Darwin (2005) explain
that properties such as coatings on reinforcing steel reduce the bond capacity since it
causes the rebar’s surface to be smoother, thus reducing the friction at the interface o f the
concrete and steel (Darwin 2005).
13
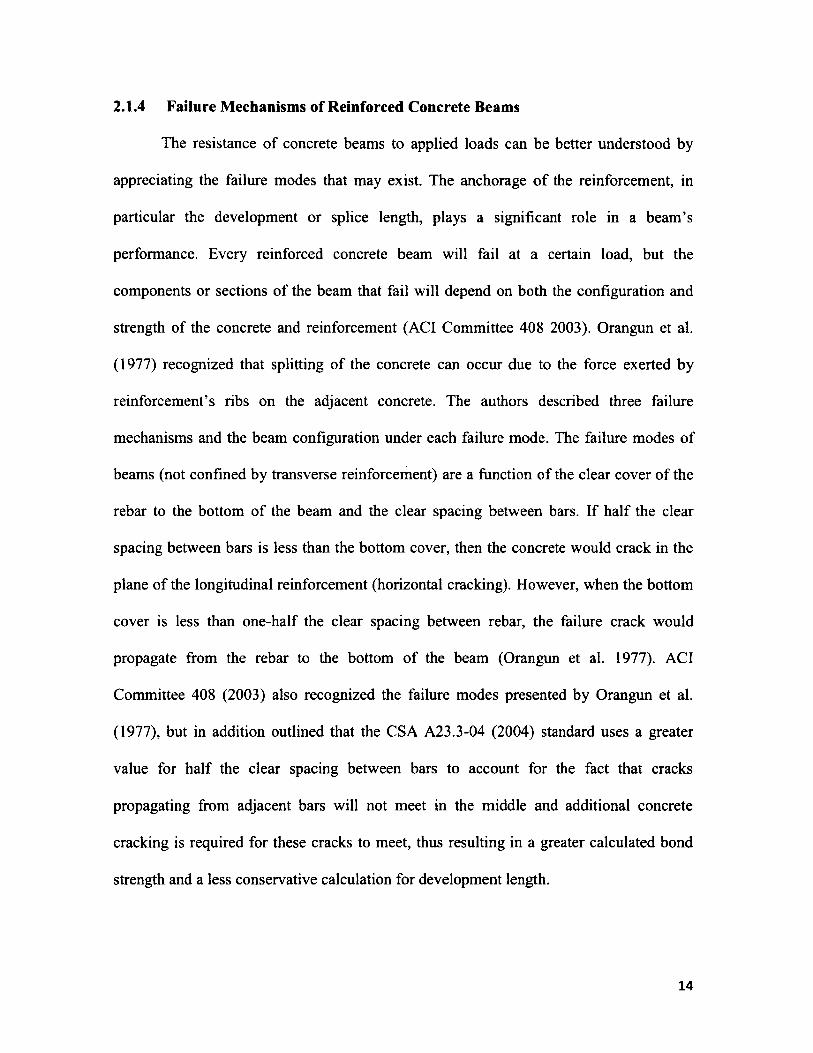
2.1.4 Failure Mechanisms of Reinforced Concrete Beams
The resistance o f concrete beams to applied loads can be better understood by
appreciating the failure modes that may exist. The anchorage o f the reinforcement, in
particular the development or splice length, plays a significant role in a beam’s
performance. Every reinforced concrete beam will fail at a certain load, but the
components or sections o f the beam that fail will depend on both the configuration and
strength of the concrete and reinforcement (ACI Committee 408 2003). Orangun et al.
(1977) recognized that splitting of the concrete can occur due to the force exerted by
reinforcement’s ribs on the adjacent concrete. The authors described three failure
mechanisms and the beam configuration under each failure mode. The failure modes of
beams (not confined by transverse reinforcement) are a function o f the clear cover o f the
rebar to the bottom of the beam and the clear spacing between bars. If half the clear
spacing between bars is less than the bottom cover, then the concrete would crack in the
plane o f the longitudinal reinforcement (horizontal cracking). However, when the bottom
cover is less than one-half the clear spacing between rebar, the failure crack would
propagate from the rebar to the bottom o f the beam (Orangun et al. 1977). ACI
Committee 408 (2003) also recognized the failure modes presented by Orangun et al.
(1977), but in addition outlined that the CSA A23.3-04 (2004) standard uses a greater
value for half the clear spacing between bars to account for the fact that cracks
propagating from adjacent bars will not meet in the middle and additional concrete
cracking is required for these cracks to meet, thus resulting in a greater calculated bond
strength and a less conservative calculation for development length.
14
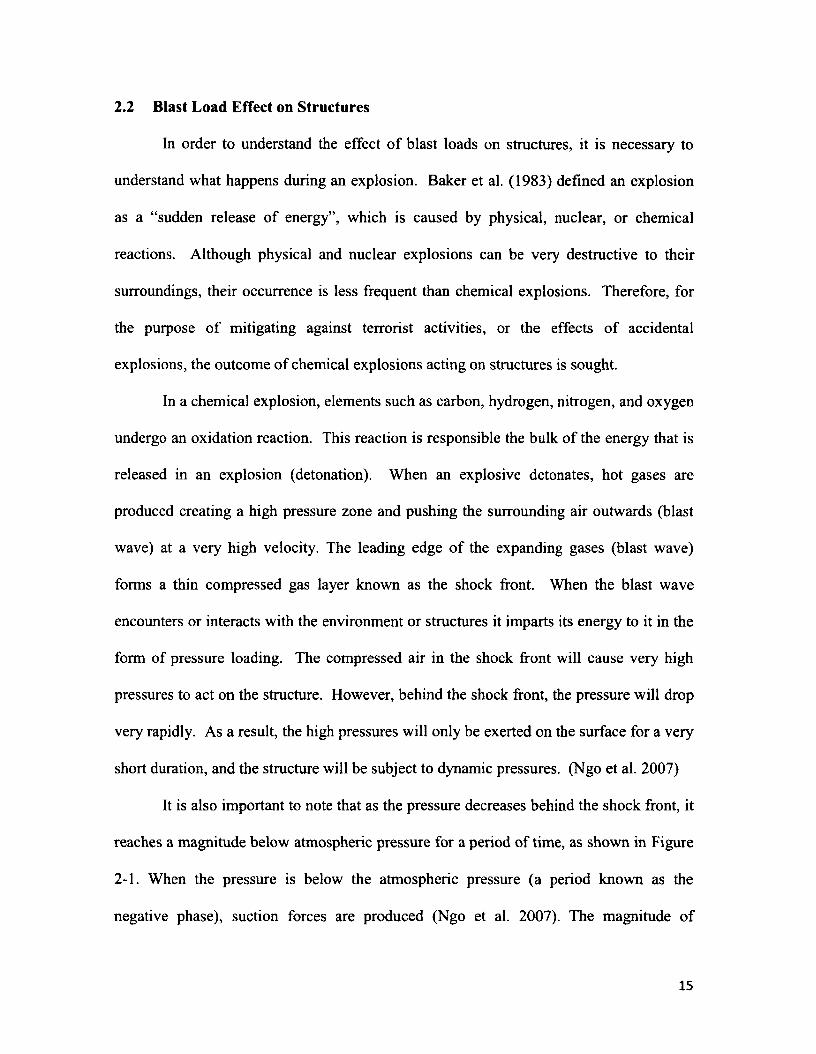
2.2 Blast Load Effect on Structures
In order to understand the effect o f blast loads on structures, it is necessary to
understand what happens during an explosion. Baker et al. (1983) defined an explosion
as a “sudden release of energy”, which is caused by physical, nuclear, or chemical
reactions. Although physical and nuclear explosions can be very destructive to their
surroundings, their occurrence is less frequent than chemical explosions. Therefore, for
the purpose o f mitigating against terrorist activities, or the effects o f accidental
explosions, the outcome o f chemical explosions acting on structures is sought.
In a chemical explosion, elements such as carbon, hydrogen, nitrogen, and oxygen
undergo an oxidation reaction. This reaction is responsible the bulk o f the energy that is
released in an explosion (detonation). When an explosive detonates, hot gases are
produced creating a high pressure zone and pushing the surrounding air outwards (blast
wave) at a very high velocity. The leading edge o f the expanding gases (blast wave)
forms a thin compressed gas layer known as the shock front. When the blast wave
encounters or interacts with the environment or structures it imparts its energy to it in the
form of pressure loading. The compressed air in the shock front will cause very high
pressures to act on the structure. However, behind the shock front, the pressure will drop
very rapidly. As a result, the high pressures will only be exerted on the surface for a very
short duration, and the structure will be subject to dynamic pressures. (Ngo et al. 2007)
It is also important to note that as the pressure decreases behind the shock front, it
reaches a magnitude below atmospheric pressure for a period o f time, as shown in Figure
2-1. When the pressure is below the atmospheric pressure (a period known as the
negative phase), suction forces are produced (Ngo et al. 2007). The magnitude o f
15
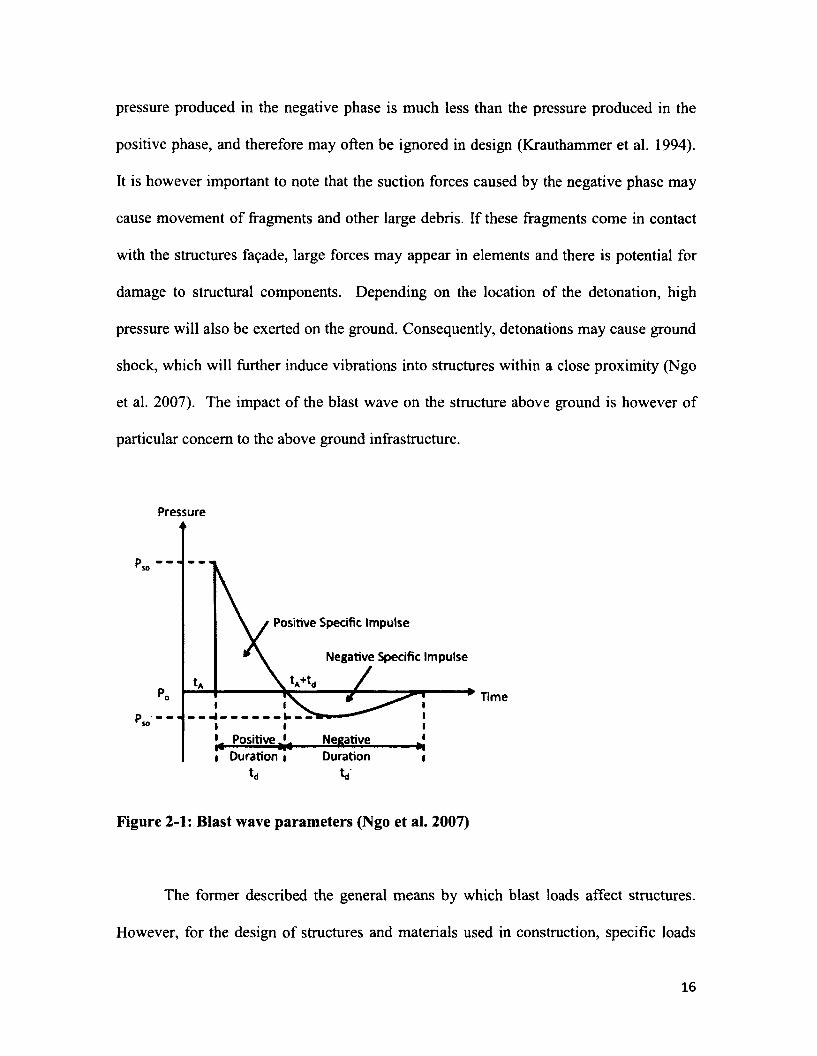
pressure produced in the negative phase is much less than the pressure produced in the
positive phase, and therefore may often be ignored in design (Krauthammer et al. 1994).
It is however important to note that the suction forces caused by the negative phase may
cause movement o f fragments and other large debris. If these fragments come in contact
with the structures facade, large forces may appear in elements and there is potential for
damage to structural components. Depending on the location of the detonation, high
pressure will also be exerted on the ground. Consequently, detonations may cause ground
shock, which will further induce vibrations into structures within a close proximity (Ngo
et al. 2007). The impact o f the blast wave on the structure above ground is however of
particular concern to the above ground infrastructure.
Pressurei >
P.SO
Positive Specific Impulse
Negative Specific Impulse
C+t,Time
jg P ositive^ i Duration i
td
NegativeDuration
V
Figure 2-1: Blast wave parameters (Ngo et al. 2007)
The former described the general means by which blast loads affect structures.
However, for the design o f structures and materials used in construction, specific loads
16
acting on the structure must be determined. In order to gain an estimate o f the pressure
that may be exerted on a structure due to an explosion, the risk that the structure is facing
must be determined. The blast loading is dependent on the size o f explosive charge and
its location relative to the structure (Krauthammer et al. 1994). The peak pressure acting
on the structure from an explosion decreases as the distance from the center of detonation
increases. For the same standoff distance, the size o f the explosive is directly proportional
to the peak reflected pressure experienced by the structure.
The shape and orientation o f the structure is also an important consideration.
When the shock front acts on a building, the face o f the structure normal to the explosive
charge (center o f detonation) will experience reflected pressures due to blast wave
reflection from the surface. Although the blast wave may not be acting normal to the
other surfaces, it could engulf the structure and cause a side-on pressure on the roof and
sides of the structure where there is no direct reflection of the blast wave (Ngo et al.
2007). The blast load parameters, including magnitude o f the reflected and side-on
(incident) pressure, the impulse, and the duration of the positive phase, are most
commonly determined with the Kingery-Bulmash polynomials (Kingery and Bulmash
1984). The Kingery-Bulmash polynomials are based on experimental data collected from
five large-scale explosions in Canada (Kingery and Bulmash 1984 ) and have proved to
give very good results given a scaled distance o f an explosion. The Kingery-Bulmash
polynomials are presented as charts in UFC (2008) and the Conventional Weapons
Effects Calculator (CONWEP) for determining blast load parameters (Hyde 1992).
Dynamic effects may be responsible for inelastic behavior o f material due to the high
strain rates induced in the structural components. Krauthammer et al. (1994) state that
17
strain rates ranging from Is '1 to 103 s '1 may be produced as the result o f blast loads
(which is in the order o f 103 times greater than those produced by earthquakes). Ngo et al.
(2007) claim that even greater strain rates ranging from 102 s '1 to 104 s '1 may be produced
as the result o f blast loads, in comparison to static strain rates ranging from 1 0 'V to 10'5
s '1. Regardless o f the exact magnitude of these strain rates, it has been determined that
properties o f construction materials, such as strength, ultimate strain, and modulus o f
elasticity are affected by strain rate.
The effect of dynamic loads on reinforced concrete may be quite complex. Short
duration dynamic loads may affect the properties o f concrete and steel in different
manners, thus altering the failure modes in reinforced concrete elements from ductile to
brittle behavior (Yang and Lok 2007). Furthermore, the bond characteristics o f concrete
to steel reinforcement are not very well researched and may affect the behaviour of
reinforced concrete elements.
The blast resistance o f a reinforced concrete structure depends on the performance
o f concrete and steel reinforcement under high strain rates. The load transfer from the
steel reinforcement to the adjacent concrete becomes essential for achieving ductile
response. Thus understanding the behaviour o f concrete and rebar in reinforced concrete
elements under blast load actions are o f particular interest.
2.3 High strain rate Effect on the Compressive and Tensile Strength of Concrete
Numerous tests have been conducted to determine the effect that strain rates have
on the compressive strength o f concrete (Fu et al. 1991, Le Nard and Bailly 2000, Lu and
Xu 2004, Yan and Lin 2006). Fu et al. (1991) present a review o f research on the strain
18
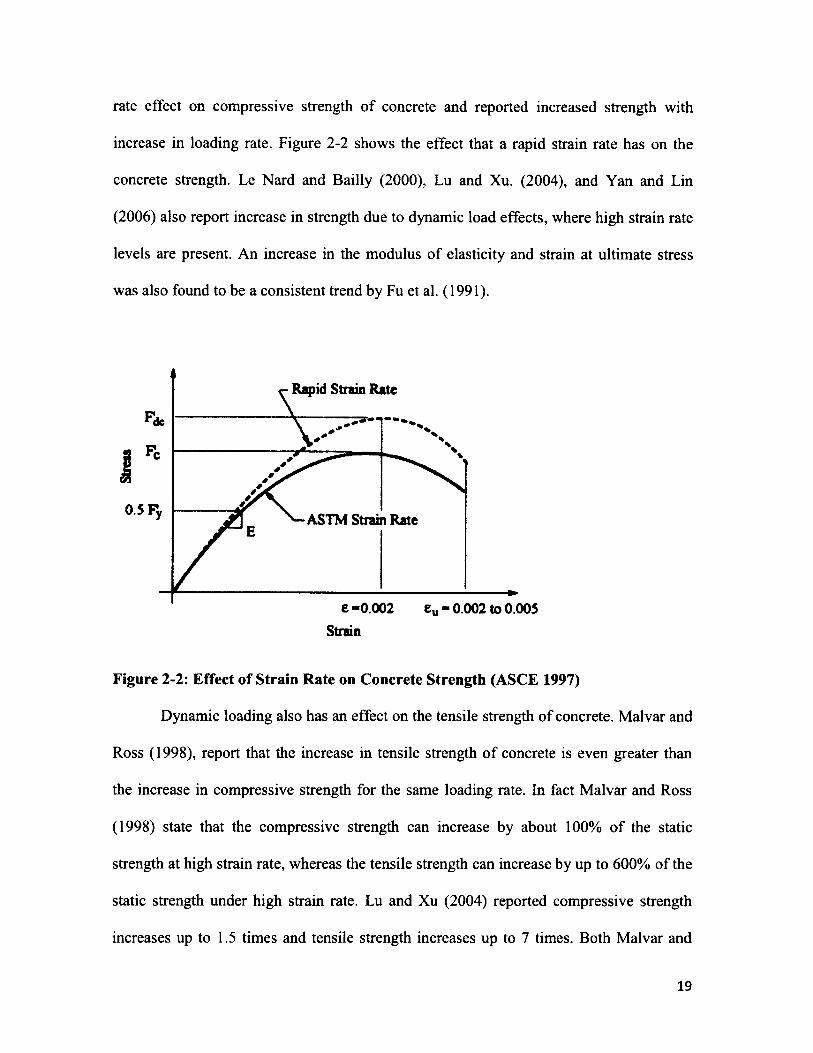
rate effect on compressive strength of concrete and reported increased strength with
increase in loading rate. Figure 2-2 shows the effect that a rapid strain rate has on the
concrete strength. Le Nard and Bailly (2000), Lu and Xu. (2004), and Yan and Lin
(2006) also report increase in strength due to dynamic load effects, where high strain rate
levels are present. An increase in the modulus o f elasticity and strain at ultimate stress
was also found to be a consistent trend by Fu et al. (1991).
Rapid Strain Rate
0.5 P, ASTM Strain Rate
e -0.002 Strain
0.002 to 0.005
Figure 2-2: Effect of Strain Rate on Concrete Strength (ASCE 1997)
Dynamic loading also has an effect on the tensile strength o f concrete. Malvar and
Ross (1998), report that the increase in tensile strength o f concrete is even greater than
the increase in compressive strength for the same loading rate. In fact Malvar and Ross
(1998) state that the compressive strength can increase by about 100% of the static
strength at high strain rate, whereas the tensile strength can increase by up to 600% of the
static strength under high strain rate. Lu and Xu (2004) reported compressive strength
increases up to 1.5 times and tensile strength increases up to 7 times. Both Malvar and
19
Ross (1998), and Yan and Lin (2006) suggested that a dynamic increase factor (DIF) may
be applied to the static strengths to account for material strength increases due to high
strain rates. The DIF is defined as the ratio o f dynamic-to-static strength o f the material.
Formulas derived to determine the D IF o f concrete are discussed later in this chapter.
Although increase in the compressive and tensile strength o f concrete is
established by various researchers, there is some discrepancy in the actual magnitude of
this increase between the researchers. Concrete properties and failure modes considered
can have a major impact on the increase in strength. The moisture content of concrete
specimens is one o f the reasons there exists variation in reported DIF values (Fu et al.
1991). The moisture content can have a substantial effect on the increase in concrete
strength under dynamic loading as the concrete will not have enough time for the pore
water pressure to dissipate under high strain rate as is the case under static loading. Thus
Fu et al. (1991) concluded that saturated concrete is much more sensitive to strain rate
effects than is dry concrete. The strength o f concrete also affects the magnitude of the
increase in strength under high strain rates. Yan and Lin (2006) explained that lower
strength concrete contains more voids which allow the concrete to resist more
deformation, thus giving low strength concrete a greater DIF. Fu et al. (1991) also
discuss that flexure tests by Zech and Wittman (1979) confirmed that higher strength
concretes are less susceptible to strength increases under dynamic loading. Other
properties that can have an effect on the strength increase in concrete under high strain
rates is the “aggregate type, curing conditions, age at testing, geometry, rate and type of
loading” (Fu et al. 1991).
20
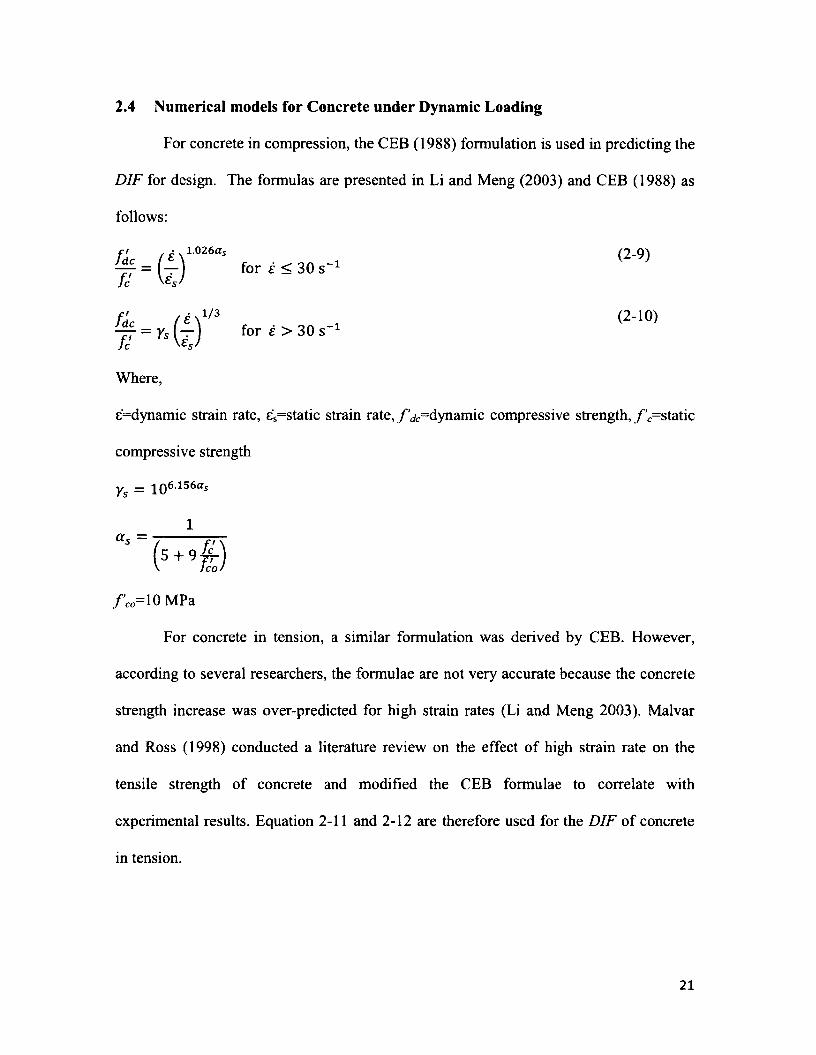
2.4 Numerical models for Concrete under Dynamic Loading
For concrete in compression, the CEB (1988) formulation is used in predicting the
DIF for design. The formulas are presented in Li and Meng (2003) and CEB (1988) as
follows:
Where,
e=dynamic strain rate, e's=static strain rate, / ’*•=dynamic compressive strength, / ’C=static
compressive strength
Ys - 106156a*
f co= 10 MPa
For concrete in tension, a similar formulation was derived by CEB. However,
according to several researchers, the formulae are not very accurate because the concrete
strength increase was over-predicted for high strain rates (Li and Meng 2003). Malvar
and Ross (1998) conducted a literature review on the effect o f high strain rate on the
tensile strength of concrete and modified the CEB formulae to correlate with
experimental results. Equation 2-11 and 2-12 are therefore used for the D IF o f concrete
in tension.
1 .026 a ,
for i < 30 s 1(2-9)
f t pnVJ (2-10)for e > 30 s 1
1
21
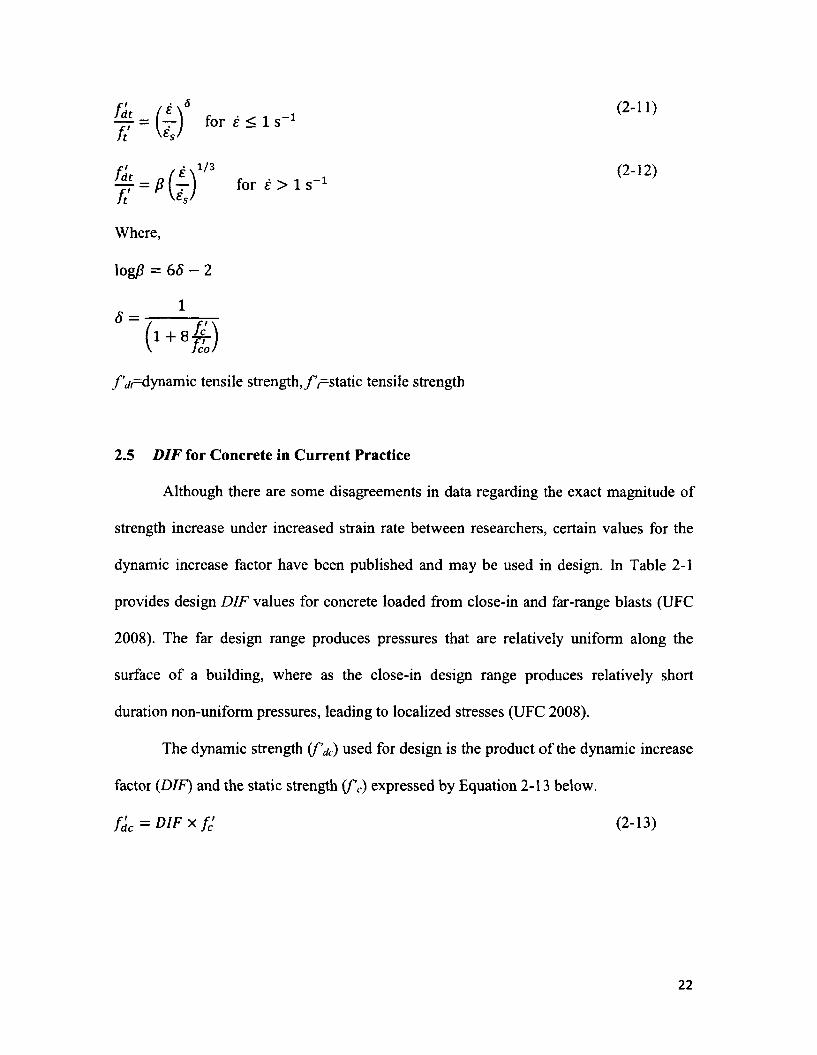
# = ( ! ) ' for £ < 1 s -1 f t ' £s '
(2-11)
for £ > 1 s 1(2- 12)
Where,
log/? = 6 5 - 2
f ’dt=dynamic tensile streng th ,/’ static tensile strength
2.5 D IF for Concrete in Current Practice
Although there are some disagreements in data regarding the exact magnitude of
strength increase under increased strain rate between researchers, certain values for the
dynamic increase factor have been published and may be used in design. In Table 2-1
provides design D IF values for concrete loaded from close-in and far-range blasts (UFC
2008). The far design range produces pressures that are relatively uniform along the
surface o f a building, where as the close-in design range produces relatively short
duration non-uniform pressures, leading to localized stresses (UFC 2008).
The dynamic strength ( f ’jc) used for design is the product o f the dynamic increase
factor (DIF) and the static strength (f'c) expressed by Equation 2-13 below.
f ’dc = DIF x U (2-13)
22
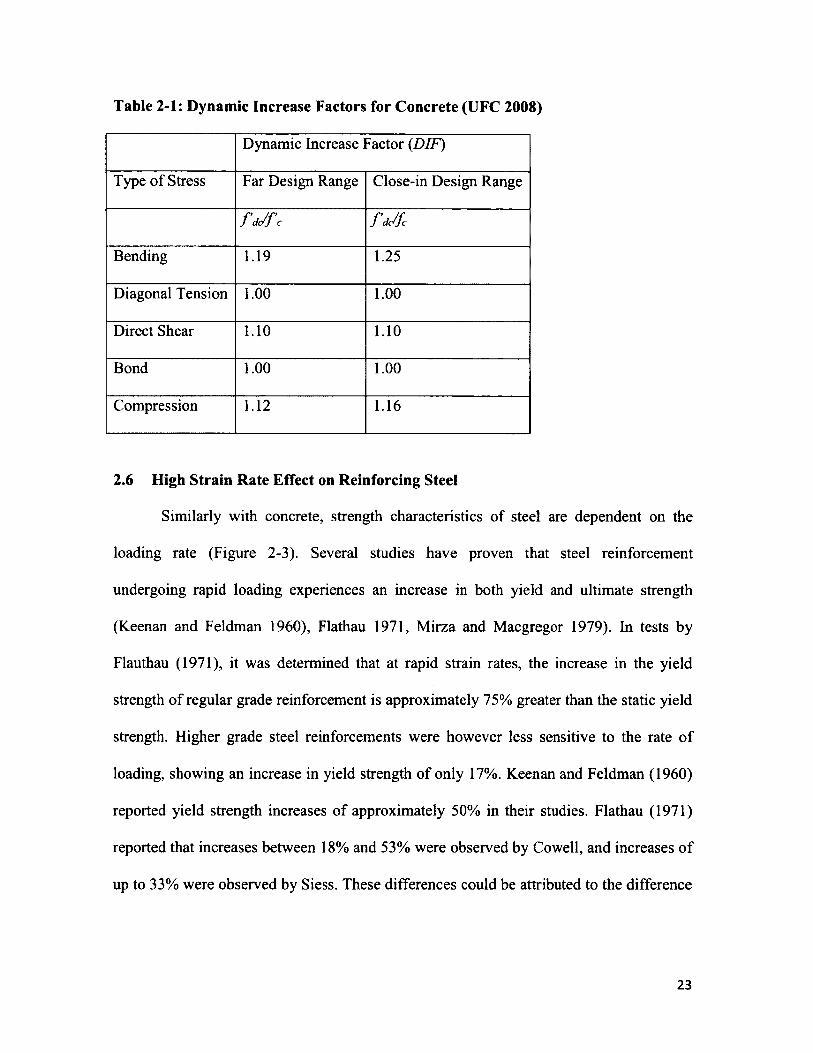
Table 2-1: Dynamic Increase Factors for Concrete (UFC 2008)
Dynamic Increase Factor (D I F )
Type of Stress Far Design Range Close-in Design Range
f d c / f c f d c / f c
Bending 1.19 1.25
Diagonal Tension 1.00 1.00
Direct Shear 1.10 1.10
Bond 1.00 1.00
Compression 1.12 1.16
2.6 High Strain Rate Effect on Reinforcing Steel
Similarly with concrete, strength characteristics o f steel are dependent on the
loading rate (Figure 2-3). Several studies have proven that steel reinforcement
undergoing rapid loading experiences an increase in both yield and ultimate strength
(Keenan and Feldman 1960), Flathau 1971, Mirza and Macgregor 1979). In tests by
Flauthau (1971), it was determined that at rapid strain rates, the increase in the yield
strength o f regular grade reinforcement is approximately 75% greater than the static yield
strength. Higher grade steel reinforcements were however less sensitive to the rate o f
loading, showing an increase in yield strength of only 17%. Keenan and Feldman (1960)
reported yield strength increases of approximately 50% in their studies. Flathau (1971)
reported that increases between 18% and 53% were observed by Cowell, and increases o f
up to 33% were observed by Siess. These differences could be attributed to the difference
23
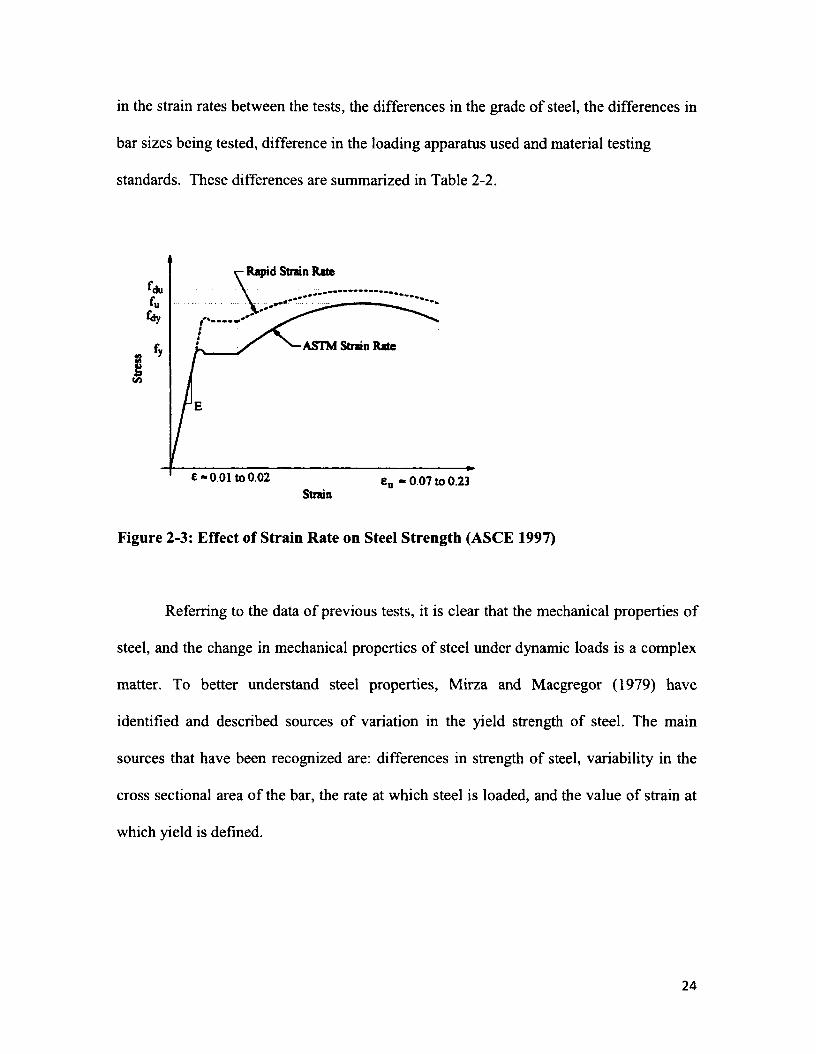
in the strain rates between the tests, the differences in the grade o f steel, the differences in
bar sizes being tested, difference in the loading apparatus used and material testing
standards. These differences are summarized in Table 2-2.
Rapid Strain Rate
ASTM Strain Rate
c - 0 0 1 to 0.02 e„ « 0 07 to 0.23Strain
Figure 2-3: Effect of Strain Rate on Steel Strength (ASCE 1997)
Referring to the data o f previous tests, it is clear that the mechanical properties of
steel, and the change in mechanical properties o f steel under dynamic loads is a complex
matter. To better understand steel properties, Mirza and Macgregor (1979) have
identified and described sources o f variation in the yield strength o f steel. The main
sources that have been recognized are: differences in strength o f steel, variability in the
cross sectional area o f the bar, the rate at which steel is loaded, and the value o f strain at
which yield is defined.
24
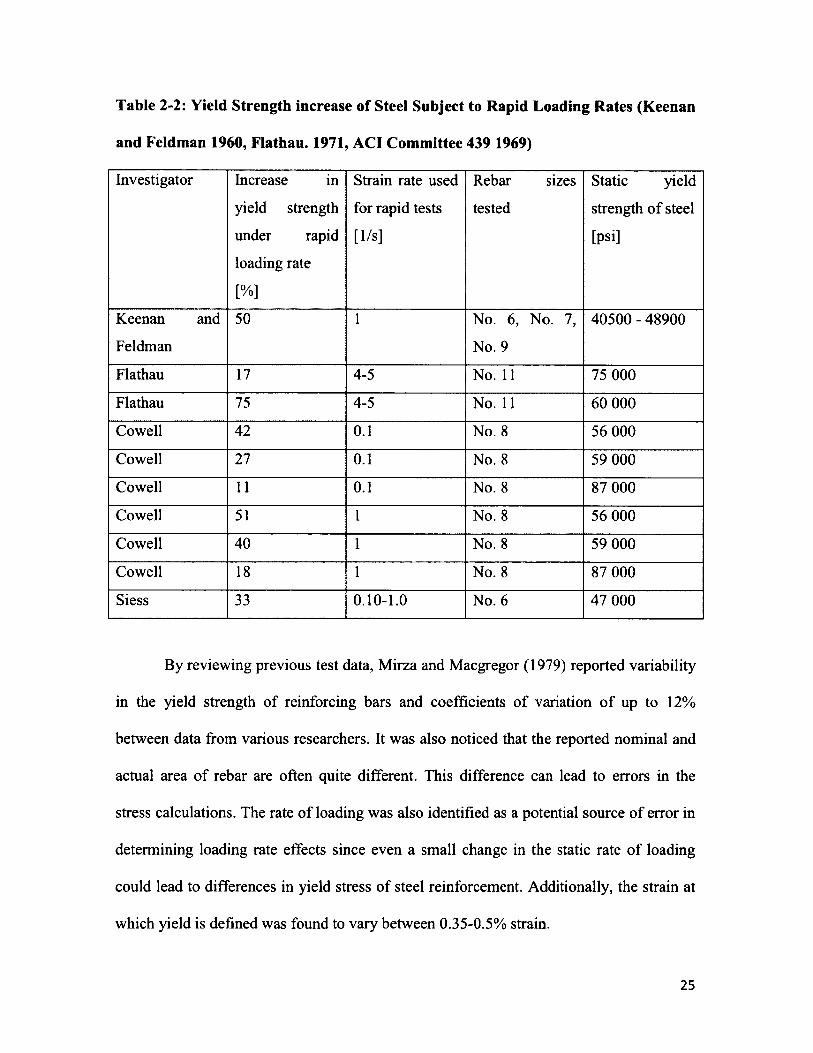
Table 2-2: Yield Strength increase of Steel Subject to Rapid Loading Rates (Keenan
and Feldman 1960, Flathau. 1971, ACI Committee 439 1969)
Investigator Increase in
yield strength
under rapid
loading rate
[%]
Strain rate used
for rapid tests
[1/s]
Rebar sizes
tested
Static yield
strength o f steel
[psi]
Keenan and
Feldman
50 1 No. 6, No. 7,
No. 9
40500 - 48900
Flathau 17 4-5 No. 11 75 000
Flathau 75 4-5 No. 11 60 000
Cowell 42 0.1 No. 8 56 000
Cowell 27 0.1 No. 8 59 000
Cowell 11 0.1 No. 8 87 000
Cowell 51 1 No. 8 56 000
Cowell 40 1 No. 8 59 000
Cowell 18 1 No. 8 87 000
Siess 33 0.10-1.0 No. 6 47 000
By reviewing previous test data, Mirza and Macgregor (1979) reported variability
in the yield strength o f reinforcing bars and coefficients o f variation o f up to 12%
between data from various researchers. It was also noticed that the reported nominal and
actual area o f rebar are often quite different. This difference can lead to errors in the
stress calculations. The rate of loading was also identified as a potential source o f error in
determining loading rate effects since even a small change in the static rate o f loading
could lead to differences in yield stress o f steel reinforcement. Additionally, the strain at
which yield is defined was found to vary between 0.35-0.5% strain.
25
Although the factors affecting the steel reinforcement yield strength have been
identified and listed above, many o f them can be controlled to some extent to obtain more
consistent results. The effect o f loading rate (strain rate) on yield strength was established
and showed a consistent increase with significant variation between researchers. The
factors affecting strength increase will be discussed in the following sections.
2.7 Derivations of Numerical Models for Steel Reinforcement Under High -Strain
Rate Loading
The results o f dynamic testing on steel reinforcement has shown that steel
reinforcement subjected to high strain rates exhibit greater yield and ultimate strengths in
comparison with steel reinforcement under static strain rates. Furthermore, steels with
lower strengths are more sensitive to increases at high strain rates than high strength
steels. While many properties o f steel change under high strain rates, the modulus of
elasticity o f steel remains relatively constant.
Understanding the trends that steel undergoes due to dynamic effects is crucial
in predicting the strain-rate effects on reinforcing steel. In order to predict the changes in
mechanical properties, Soroushian and Choi (1987), Malvar and Crawford (1998), and
the Comite Euro-International du Beton (1988) derived equations to predict the strain rate
effects on certain strengths of steel. These derivations make it possible to quantify the
changes in properties o f steel due to dynamic effects and are discussed in subsequent
sections.
26
2.7.1 Soroushian and Choi (1987): Steel Mechanical Properties at Different Strain
Rates
Soroushian and Choi (1987) compared dynamic test results conducted by a
variety o f investigators and plotted the effect o f strain rate on the yield strength and
ultimate strength o f steel reinforcement. The test results showed some large deviations
when compared to one another, however the trends observed were all similar; the yield
strength increased with strain rate and the upper yield strength was observed to be more
strain rate sensitive than the lower yield strength. In addition, the ultimate strength
increased with strain rates in all test results, but appears to be less sensitive to increases in
strain rate than the yield strength. In view o f the fact that the results from the various tests
were based on strain rate effects on rebars o f different shapes and yield strengths, it made
sense that there was some variability in the results. Soroushian and Choi (1987)
determined that this variability was primarily due to the assortment o f steel yield
strengths used in the investigations. Consequently, examining the effect that the static
yield strength has on the sensitivity o f steel properties to increased strain rates is
practical.
Soroushian and Choi (1987) proposed several equations for determining the
DIF o f steel. Equation 2-14 provides the DIF o f yield strength of steel as a function o f
strain rate ( e ):
& = (-0 .4 5 1 x 10"6/y + 1-46) + ( -9 .2 0 x 10_7/y + 0.0927) log10 e fy
Where fdy is the dynamic yield strength, and f y is the static yield strength. Similarly, the
ratio of dynamic ultimate strength (fdU) to static ultimate strength (fu) was given by
Equation 2-15.
27
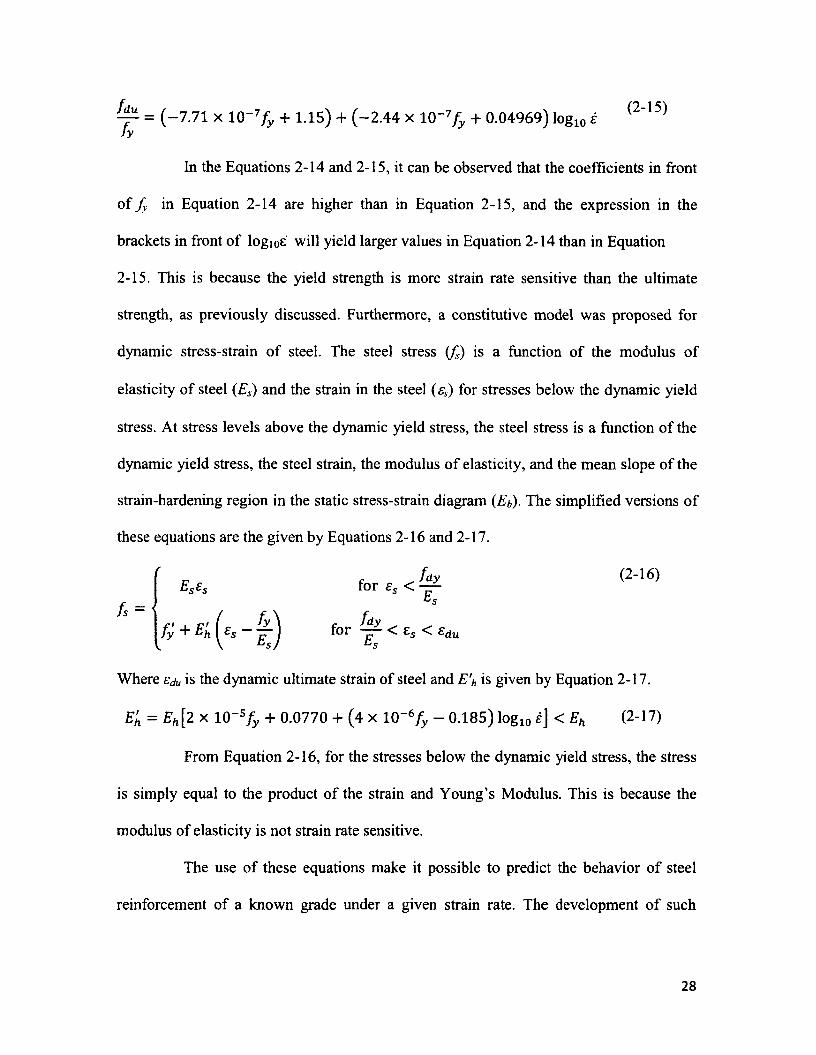
^ = ( -7 .7 1 x 10~7fy + 1.15) + ( -2 .4 4 x l 0 " 7/ y + 0.04969) log10 e
In the Equations 2-14 and 2-15, it can be observed that the coefficients in front
o f f y in Equation 2-14 are higher than in Equation 2-15, and the expression in the
brackets in front o f logioe will yield larger values in Equation 2-14 than in Equation
2-15. This is because the yield strength is more strain rate sensitive than the ultimate
strength, as previously discussed. Furthermore, a constitutive model was proposed for
dynamic stress-strain o f steel. The steel stress (fs) is a function o f the modulus o f
elasticity of steel (Es) and the strain in the steel (£i) for stresses below the dynamic yield
stress. At stress levels above the dynamic yield stress, the steel stress is a function o f the
dynamic yield stress, the steel strain, the modulus o f elasticity, and the mean slope o f the
strain-hardening region in the static stress-strain diagram (Eb)■ The simplified versions o f
these equations are the given by Equations 2-16 and 2-17.
Where eju is the dynamic ultimate strain o f steel and E \ is given by Equation 2-17.
E'h = Eh[2 x 10~5fy + 0.0770 + (4 x 10~6f y - 0.185) log10 i] < Eh (2-17)
is simply equal to the product o f the strain and Young’s Modulus. This is because the
modulus o f elasticity is not strain rate sensitive.
The use o f these equations make it possible to predict the behavior o f steel
reinforcement o f a known grade under a given strain rate. The development o f such
(2-16)
From Equation 2-16, for the stresses below the dynamic yield stress, the stress
28
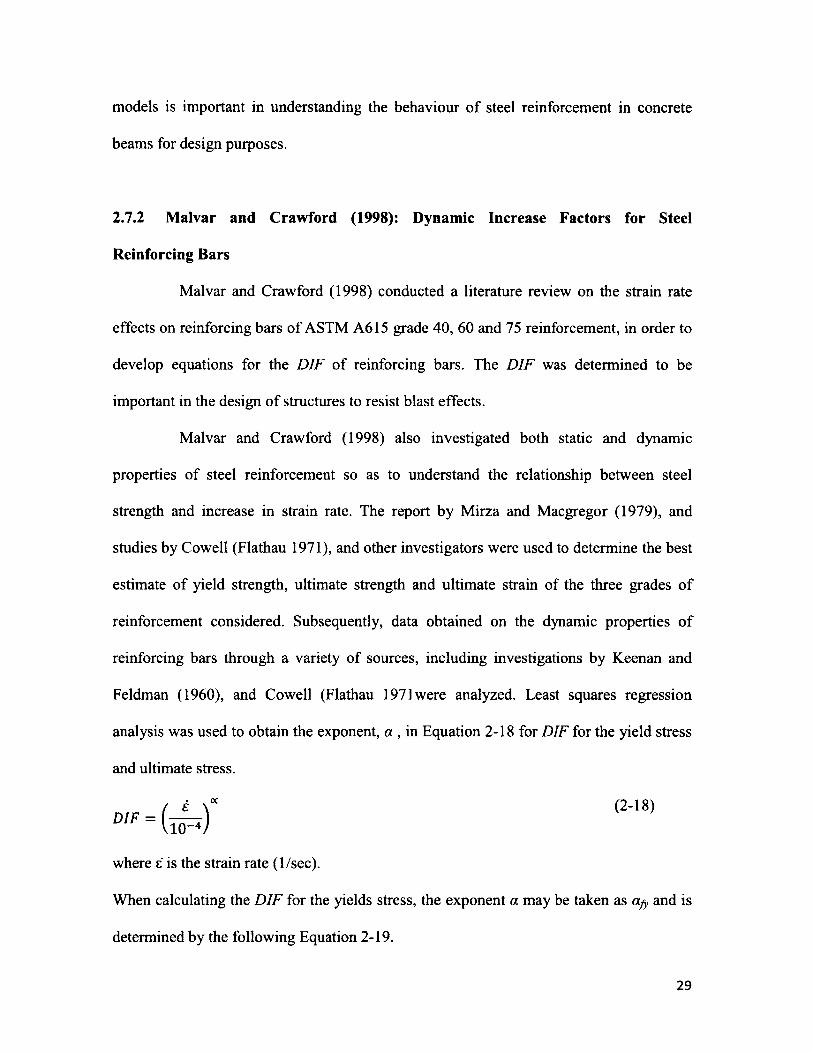
models is important in understanding the behaviour o f steel reinforcement in concrete
beams for design purposes.
2.7.2 Malvar and Crawford (1998): Dynamic Increase Factors for Steel
Reinforcing Bars
Malvar and Crawford (1998) conducted a literature review on the strain rate
effects on reinforcing bars o f ASTM A615 grade 40, 60 and 75 reinforcement, in order to
develop equations for the DIF o f reinforcing bars. The DIF was determined to be
important in the design o f structures to resist blast effects.
Malvar and Crawford (1998) also investigated both static and dynamic
properties of steel reinforcement so as to understand the relationship between steel
strength and increase in strain rate. The report by Mirza and Macgregor (1979), and
studies by Cowell (Flathau 1971), and other investigators were used to determine the best
estimate of yield strength, ultimate strength and ultimate strain of the three grades o f
reinforcement considered. Subsequently, data obtained on the dynamic properties o f
reinforcing bars through a variety of sources, including investigations by Keenan and
Feldman (1960), and Cowell (Flathau 1971 were analyzed. Least squares regression
analysis was used to obtain the exponent, a , in Equation 2-18 for DIF for the yield stress
and ultimate stress.
where s' is the strain rate (1/sec).
When calculating the D IF for the yields stress, the exponent a may be taken as afy and is
determined by the following Equation 2-19.
OC (2-18)
29
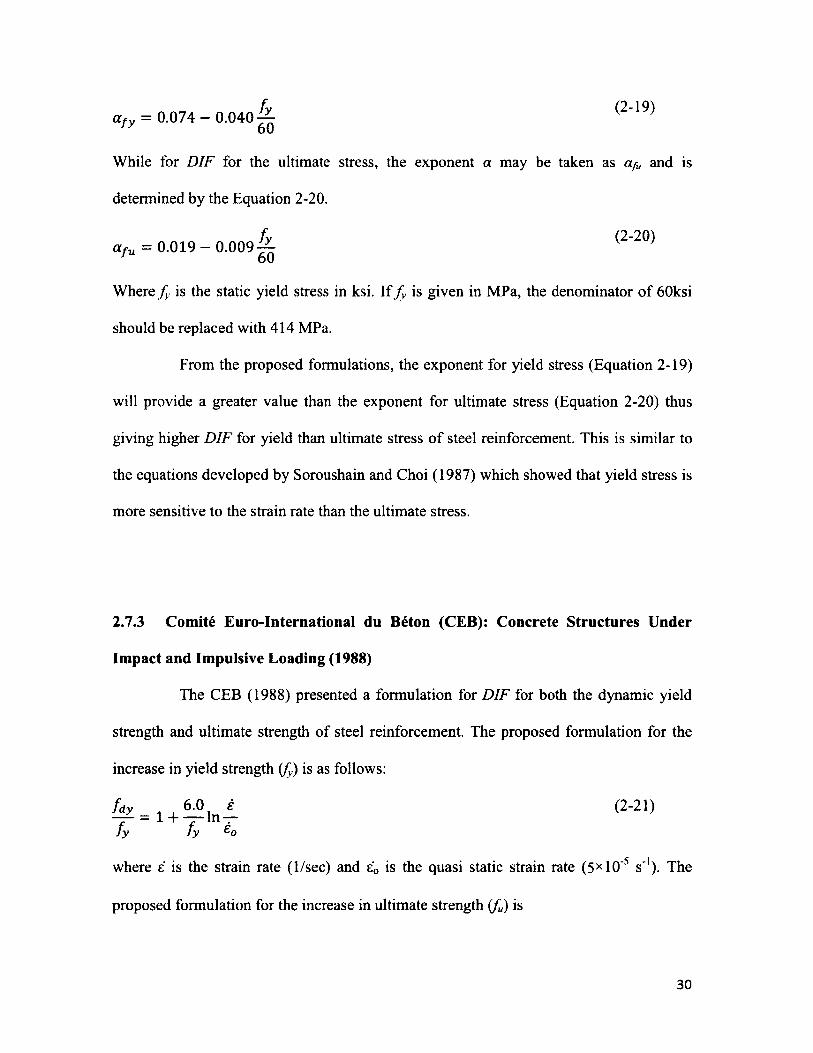
(2-19)
While for DIF for the ultimate stress, the exponent a may be taken as a/u and is
determined by the Equation 2-20.
Where f y is the static yield stress in ksi. If f y is given in MPa, the denominator o f 60ksi
should be replaced with 414 MPa.
From the proposed formulations, the exponent for yield stress (Equation 2-19)
will provide a greater value than the exponent for ultimate stress (Equation 2-20) thus
giving higher DIF for yield than ultimate stress o f steel reinforcement. This is similar to
the equations developed by Soroushain and Choi (1987) which showed that yield stress is
more sensitive to the strain rate than the ultimate stress.
2.7.3 Comite Euro-International du Beton (CEB): Concrete Structures Under
Impact and Impulsive Loading (1988)
The CEB (1988) presented a formulation for DIF for both the dynamic yield
strength and ultimate strength o f steel reinforcement. The proposed formulation for the
increase in yield strength (fy) is as follows:
/ d y _ i 6 ° , t (2-21)1 + . InJ y J y co
where e is the strain rate (1/sec) and e0 is the quasi static strain rate (5*1 O'5 s '1). The
proposed formulation for the increase in ultimate strength (fu) is
afu = 0.019 - 0.009 fy (2-20)60
30
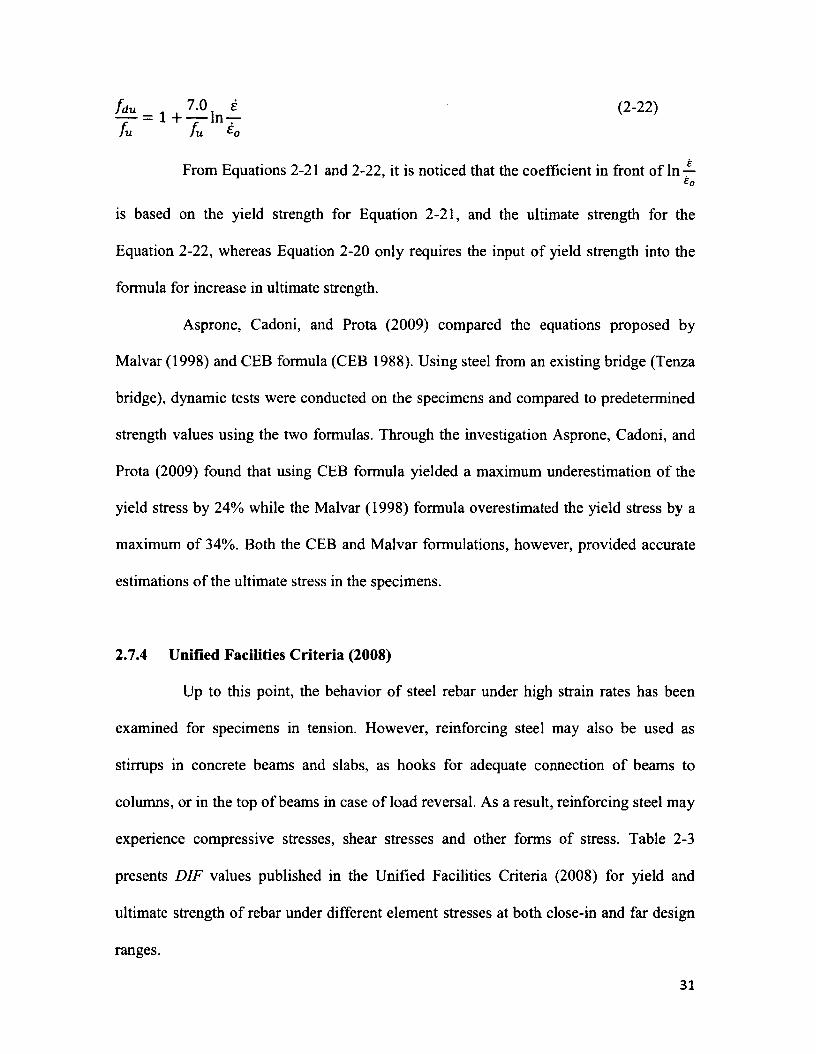
From Equations 2-21 and 2-22, it is noticed that the coefficient in front of In —
is based on the yield strength for Equation 2-21, and the ultimate strength for the
Equation 2-22, whereas Equation 2-20 only requires the input of yield strength into the
formula for increase in ultimate strength.
Asprone, Cadoni, and Prota (2009) compared the equations proposed by
Malvar (1998) and CEB formula (CEB 1988). Using steel from an existing bridge (Tenza
bridge), dynamic tests were conducted on the specimens and compared to predetermined
strength values using the two formulas. Through the investigation Asprone, Cadoni, and
Prota (2009) found that using CEB formula yielded a maximum underestimation o f the
yield stress by 24% while the Malvar (1998) formula overestimated the yield stress by a
maximum of 34%. Both the CEB and Malvar formulations, however, provided accurate
estimations o f the ultimate stress in the specimens.
2.7.4 Unified Facilities Criteria (2008)
Up to this point, the behavior o f steel rebar under high strain rates has been
examined for specimens in tension. However, reinforcing steel may also be used as
stirrups in concrete beams and slabs, as hooks for adequate connection o f beams to
columns, or in the top o f beams in case of load reversal. As a result, reinforcing steel may
experience compressive stresses, shear stresses and other forms o f stress. Table 2-3
presents D IF values published in the Unified Facilities Criteria (2008) for yield and
ultimate strength o f rebar under different element stresses at both close-in and far design
ranges.
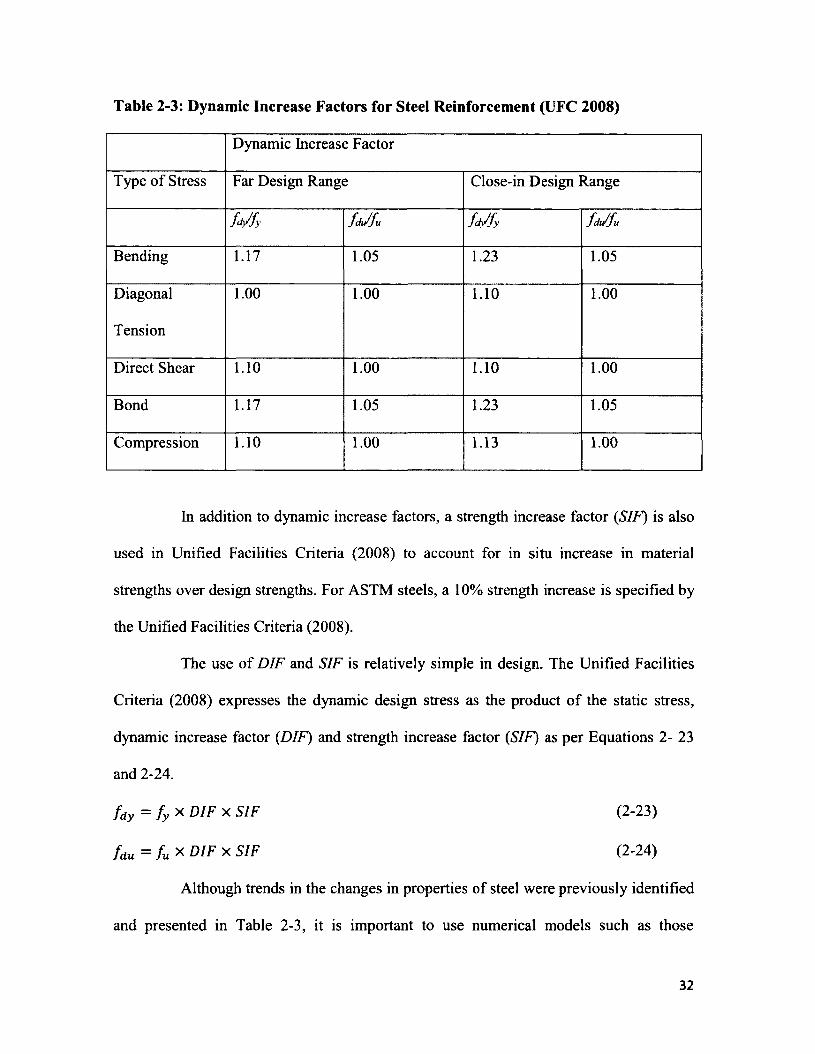
Table 2-3: Dynamic Increase Factors for Steel Reinforcement (UFC 2008)
Dynamic Increase Factor
Type o f Stress Far Design Range Close-in Design Range
M y M u M y M u
Bending 1.17 1.05 1.23 1.05
Diagonal
Tension
1.00 1.00 1.10 1.00
Direct Shear 1.10 1.00 1.10 1.00
Bond 1.17 1.05 1.23 1.05
Compression 1.10 1.00 1.13 1.00
In addition to dynamic increase factors, a strength increase factor (SIF) is also
used in Unified Facilities Criteria (2008) to account for in situ increase in material
strengths over design strengths. For ASTM steels, a 10% strength increase is specified by
the Unified Facilities Criteria (2008).
The use of D IF and SIF is relatively simple in design. The Unified Facilities
Criteria (2008) expresses the dynamic design stress as the product o f the static stress,
dynamic increase factor (DIF) and strength increase factor (SIF) as per Equations 2- 23
and 2-24.
f a y = f y X DIF x SIF (2-23)
fan = fu x DIF x SIF (2-24)
Although trends in the changes in properties of steel were previously identified
and presented in Table 2-3, it is important to use numerical models such as those
32
presented in this section. Use o f these equations will provide more accuracy in design of
reinforced concrete elements under the impact o f blast loads. Strain rates are normally not
constant, so using equations provides a more accurate method than using tabulated
values.
2.8 The Effect of Dynamic Loads on Bond of Reinforcing Steel to Concrete
While the effects o f dynamic loads on concrete and steel properties have been
thoroughly researched, the interaction between the two materials under dynamic loads is
much more convoluted. Although both materials demonstrate an increase in strength
under high loading rates such as produced by blast and impact loads, the rate o f increase
is different for both materials. As a result, predicting the interaction at the steel-concrete
interface becomes a very intricate problem involving many factors.
Some research has been conducted where pullout tests under high strain rates
have demonstrated that bond strength under dynamic loads is higher than under static
loads (Hansen and Liepens 1962, Shah 1963, Vos and Reinhardt 1982, Yan and Mindess
1991, Weathersby 2003, Solomos and Berra 2010). Although all tests show that bond
stress increases with loading rate, a number o f factors were identified to affect the rate of
bond stress increase.
The only case where the bond strength will not experience an increase under
increase loading rate is when smooth bars are used in lieu of deformed bars (Reinhardt
1982, Vos and Reinhardt 1982). This is because there are no lugs from the steel bearing
against the surrounding concrete and the bond strength is solely based on frictional and
adhesive forces. Vos and Reinhardt (1982) reported that adhesion and friction are
33
insensitive to loading rate. Since smooth bars are bonded to concrete by means o f these
two mechanisms (adhesion and friction), the loading rate will not affect the bond
strength.
The effect of concrete strength on the rate o f increase o f bond stress at high strain
may also be taken into consideration. Hansen and Liepens (1982) determined that the
ultimate bond strength under dynamic loading from pullout tests was equal to the
compressive strength ( f c). This is higher than the ultimate bond stress under static pull-
out testing (0 .75fc). Shah (1963) also found a similar trend; under static loading the
ultimate bond strength ranged from 0 .5 f c to 0 .6 f c , while under dynamic loading the
ultimate bond strength ranged from 0 .6 f c to 0 .9 f c. The reason for the difference in the
data obtained from different experiments is that the rate o f increase in bond strength
under dynamic loading depends on the concrete strength. Lower strength concretes
experience a greater increase in bond strength under dynamic loads than high strength
concretes (Shah 1963, Reinhardt 1982, Vos and Reinhardt 1982, Vos 1963, Solomos and
Berra 2009). Some authors report that the increase in bond strength is dependent on the
tensile strength o f concrete, however Vos and Reinhardt (1982) argue that it is more
reasonable for the bond stress to depend on concrete compressive strength since the ribs
o f the deformed bars exert a compressive force on the surrounding concrete.
Some investigators (Hansen and Liepens 1962, Shah 1963) report steel strength
and size as factors affecting the bond stress between steel reinforcement and concrete.
According to Hansen and Liepens (1962) the increase o f steel strength under high loading
rates is responsible for the higher bond stress at failure under dynamic loading. It was
also reported that the bond strength increase under dynamic loading is more pronounced
34
for smaller bars (Shah 1963). Although steel properties are reported to also have an
influence on bond strength increase under rapid loading, only the aforementioned
investigators have reported bond stress increase to be a function o f the steel strength or
reinforcement size to date.
Most research work investigating the strain rate effect on bond strength has used
pullout testing (Weathersby 2003, Shah 1963). Pullout tests cause a compressive force on
the concrete surrounding the reinforcement, thus leading to greater confinement and an
increase in the bond strength (Weathersby 2003). When dealing with beams in flexure,
the concrete surrounding the reinforcement is in tension and could also be in a cracked
state. Thus pullout test might not be representative o f bond behaviour in flexural elements
such as beams. According to Shah (1963), greater accuracy in bond strength tests could
be achieved by beam tests rather than using pullout tests.
In concrete beam design, it is essential to achieve ductile failure modes in order to
give warning o f an imminent collapse. To achieve this condition, non-ductile failure
modes such as shear and bond failures must be avoided. For blast design, where high
strain rates are introduced, the same conditions are desired. It is therefore important to
investigate bond under high strain rates to rule out the possibility of a bond failure in
blast design.
Existing literature on the effect of strain rate on bond strength in beams is limited.
While some investigators have shown little or no increase in bond strength at higher
loading rates from pullout tests, the conservatism of these test may be limited because of
the influence o f the high confining forces. A more accurate approach may be achieved by
conducting flexural tests, which provide more realistic measures o f bond strength in
35

reinforced beams. An experimental program was designed to determine the effect o f high
strain rates on bond in concrete beams and is described in the following chapter.
36
3 Chapter: Experimental Program
3.1 General
The experimental program was designed to study the effect of strain rate on the
bond between concrete and steel reinforcement. A total o f 15 concrete beams were
constructed and tested under third-point bending. Each beam was designed with one
reinforcing bar bonded to the concrete for the bar development length calculated in
accordance with CSA A23.3-04 (2004). The primary objective o f the experimental test
program was to determine whether the development length provided for static loading is
sufficient for beams under high strain rates. The following sections describe the
construction o f the reinforced concrete beams, material properties, instrumentation,
testing, and data acquisition used in the experimental test program.
3.2 Description of Test Specimens
The concrete beams used in this experimental program were designed to contain
one longitudinal reinforcement with the development length, specified by CSA A23.3-04
(2004), provided at each end. In order to achieve the required development length, the
reinforcement in the beams was debonded from the surrounding concrete at midspan.
Three different sizes o f longitudinal reinforcement were used in the experiment; 15M
bars, 20M bars, and 25M bars. Figure 3-1 and Figure 3-2 shows the debonded regions for
each size o f reinforcement size, and a cross-sectional view of the concrete beams used in
the experimental program. Five beams were constructed with each reinforcement size to
37
obtain a total o f 15 beams, constructed with each different size o f reinforcement to obtain
a total o f 15 beams.
3.3 Material Properties
3.3.1 Concrete
All 15 beams were cast from the same concrete mix. A 28-day strength of
concrete compressive strength of 30 MPa, and aggregate size o f 10mm were specified. A
local concrete supplier designed the concrete mix and supplied the concrete to cast the
beams. The concrete used limestone aggregate and had an average slump o f 125 mm,
fifteen (15) 152mm x 305mm concrete cylinders were cast with the beams and tested in
accordance with ASTM C873(2010) to obtain compressive strength o f concrete. The
concrete compression tests were performed at the time of testing and resulted in an
average compressive strength o f 37.0 MPa.
3.3.2 Steel
The steel reinforcements: 15M, 20M, and 25M were cut to a length of 2440 mm
using a hand saw and used as longitudinal reinforcement in the concrete beams. Steel
samples from each reinforcement size were cut and tested in tension in accordance with
ASTM A 370-lla (2011) to obtain the yield stress, ultimate stress and stress-strain
behaviour o f the reinforcement. From the tests results, the average yield strength o f 15M,
20M, and 25M bars was 465 MPa, 437 MPa, and 449 MPa respectively. The yield strain
of 15M, 20M, and 25M bars was 2584*10'6, 2408*10'6, 2448*10"6respectively.
38
3.4 Construction of test specimens
3.4.1 Longitudinal reinforcement and strain gauge application
The longitudinal reinforcement was strain gauged to monitor changes in strain
during testing. Predetermined locations along the length o f the reinforcement were treated
to create smooth surfaces for strain gauge installation The reinforcement ribs at the
predetermined locations were first ground with an electric grinder with 4.5" diameter
discs. Then a pneumatic grinder with 2" diameter discs was used to create a smooth
surface. Once all strain gauge locations were ground smooth, they were cleaned with a
water based acidic surface cleaner (M-Prep Conditioner A) to remove any dirt from the
surface. Then a water based alkaline surface cleaner (M-Prep Neutralizer A) was used to
further clean and neutralize the surface.
Once the surface was prepared for the application o f strain gauges, all-purpose
cyanoacrylate adhesive was applied to the back of the strain gauge and then placed on the
smooth clean surface o f the steel reinforcement. Pressure was then applied until the strain
gauge was bonded to the surface. Once the strain gauge was in place, the gauge leads
were slowly lifted from the surface to ensure they were not bonded to the reinforcement
as shown in Figure 3-3. Electrical tape was used to cover the gauge and wrapped around
the bar under the leads to isolate the leads from the rebar surface. The strain gauges used
in this experiment program were type FLA-6-350-11 manufactured by Tokyo Sokki
Kenkyujo Co. Ltd. The gauges were 6 mm in length and had a 350 Q gauge resistance.
In order to obtain data from the strain gauges, long cables were soldered to the
gauge leads and run along the rebar and out one end o f the beam. The cables were 600
volt type CMG Deca cables. Before soldering the cables to gauge leads they were cut to
39
length and wire strippers were used to remove the outer casing. The tip o f two inner
cables was then stripped so that their ends could be soldered to the gauge leads. Soldering
was done using a soldering iron (Figure 3-4), MG chemicals solder, and LA-CO regular
soldering flux paste. Electrical tape was used between wires to ensure that wires did not
touch. Once all gauges and cables were installed, a multimeter was used to ensure that a
350 Q gauge resistance reading was achieved across the ends o f the cables. The strain
gauge locations along the length o f the rebar were different for each size o f reinforcement
(Figure 3-5). In the debonded region two strain gauges were installed while four gauges
were installed on either side within the bonded region (Figure 3-5).
3.4.2 Transverse Reinforcement
The transverse reinforcement used in the concrete beams was 6.3-mm wire. First,
the wire was measured and cut to size using wire cutters. The wires were bent using a
hand bending jig; forming 90 degree angles at three comers and two 45 degree angles at
the wire ends to obtain rectangular stirrups as shown in the cross-sectional view in
Figure 3-2. Once all stirrups were formed, they were placed around 6.3-mm diameter
longitudinal wires. The ties were spaced at 100 mm at either end of the beam and at 150
mm around midspan. The stirrups were fastened to the longitudinal reinforcement using
loop tie wires and a hand tying tool with a hook to form transverse reinforcement cages
as shown in Figure 3-6.
40
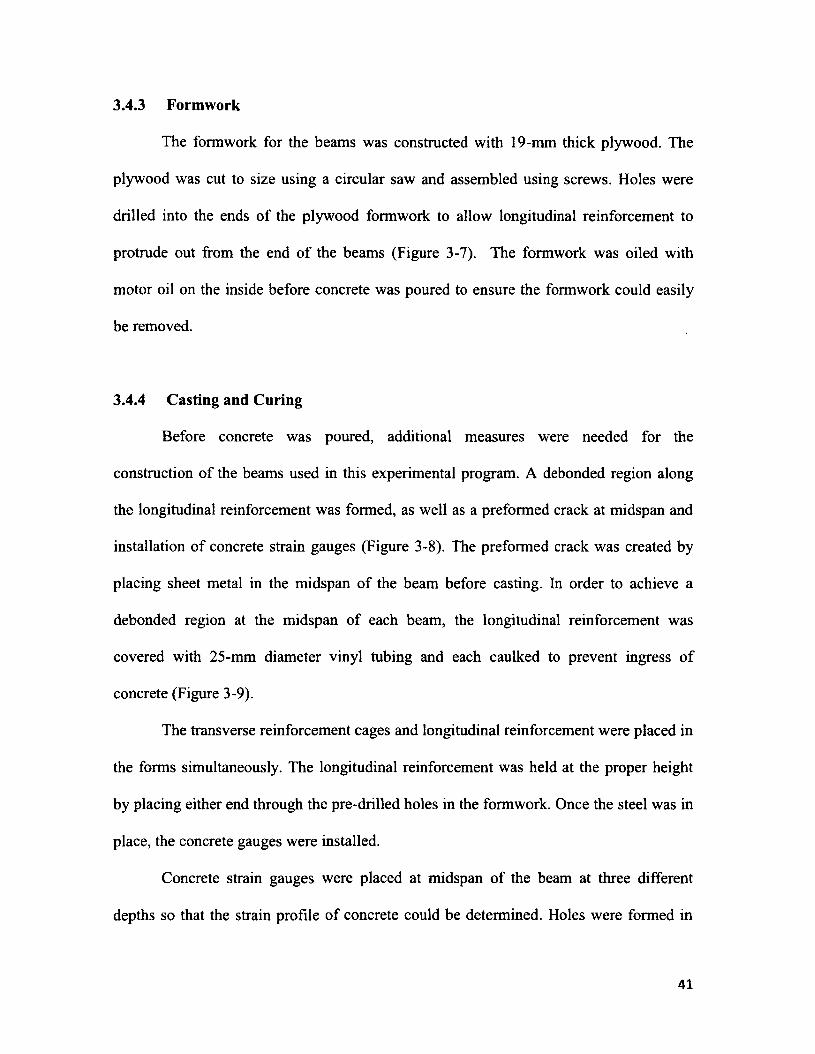
3.4.3 Formwork
The formwork for the beams was constructed with 19-mm thick plywood. The
plywood was cut to size using a circular saw and assembled using screws. Holes were
drilled into the ends o f the plywood formwork to allow longitudinal reinforcement to
protrude out from the end o f the beams (Figure 3-7). The formwork was oiled with
motor oil on the inside before concrete was poured to ensure the formwork could easily
be removed.
3.4.4 Casting and Curing
Before concrete was poured, additional measures were needed for the
construction o f the beams used in this experimental program. A debonded region along
the longitudinal reinforcement was formed, as well as a preformed crack at midspan and
installation o f concrete strain gauges (Figure 3-8). The preformed crack was created by
placing sheet metal in the midspan o f the beam before casting. In order to achieve a
debonded region at the midspan of each beam, the longitudinal reinforcement was
covered with 25-mm diameter vinyl tubing and each caulked to prevent ingress of
concrete (Figure 3-9).
The transverse reinforcement cages and longitudinal reinforcement were placed in
the forms simultaneously. The longitudinal reinforcement was held at the proper height
by placing either end through the pre-drilled holes in the formwork. Once the steel was in
place, the concrete gauges were installed.
Concrete strain gauges were placed at midspan of the beam at three different
depths so that the strain profile of concrete could be determined. Holes were formed in
41
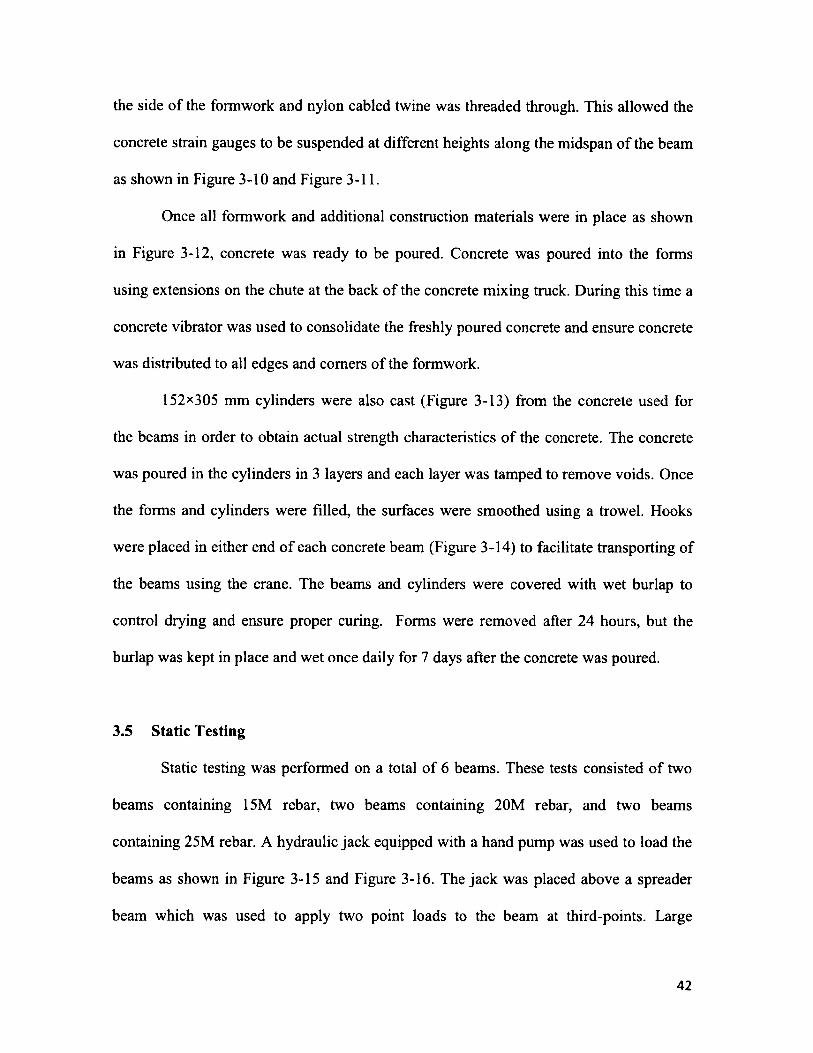
the side of the formwork and nylon cabled twine was threaded through. This allowed the
concrete strain gauges to be suspended at different heights along the midspan o f the beam
as shown in Figure 3-10 and Figure 3-11.
Once all formwork and additional construction materials were in place as shown
in Figure 3-12, concrete was ready to be poured. Concrete was poured into the forms
using extensions on the chute at the back of the concrete mixing truck. During this time a
concrete vibrator was used to consolidate the freshly poured concrete and ensure concrete
was distributed to all edges and comers of the formwork.
152x305 mm cylinders were also cast (Figure 3-13) from the concrete used for
the beams in order to obtain actual strength characteristics o f the concrete. The concrete
was poured in the cylinders in 3 layers and each layer was tamped to remove voids. Once
the forms and cylinders were filled, the surfaces were smoothed using a trowel. Hooks
were placed in either end o f each concrete beam (Figure 3-14) to facilitate transporting of
the beams using the crane. The beams and cylinders were covered with wet burlap to
control drying and ensure proper curing. Forms were removed after 24 hours, but the
burlap was kept in place and wet once daily for 7 days after the concrete was poured.
3.5 Static Testing
Static testing was performed on a total o f 6 beams. These tests consisted o f two
beams containing 15M rebar, two beams containing 20M rebar, and two beams
containing 25M rebar. A hydraulic jack equipped with a hand pump was used to load the
beams as shown in Figure 3-15 and Figure 3-16. The jack was placed above a spreader
beam which was used to apply two point loads to the beam at third-points. Large
42
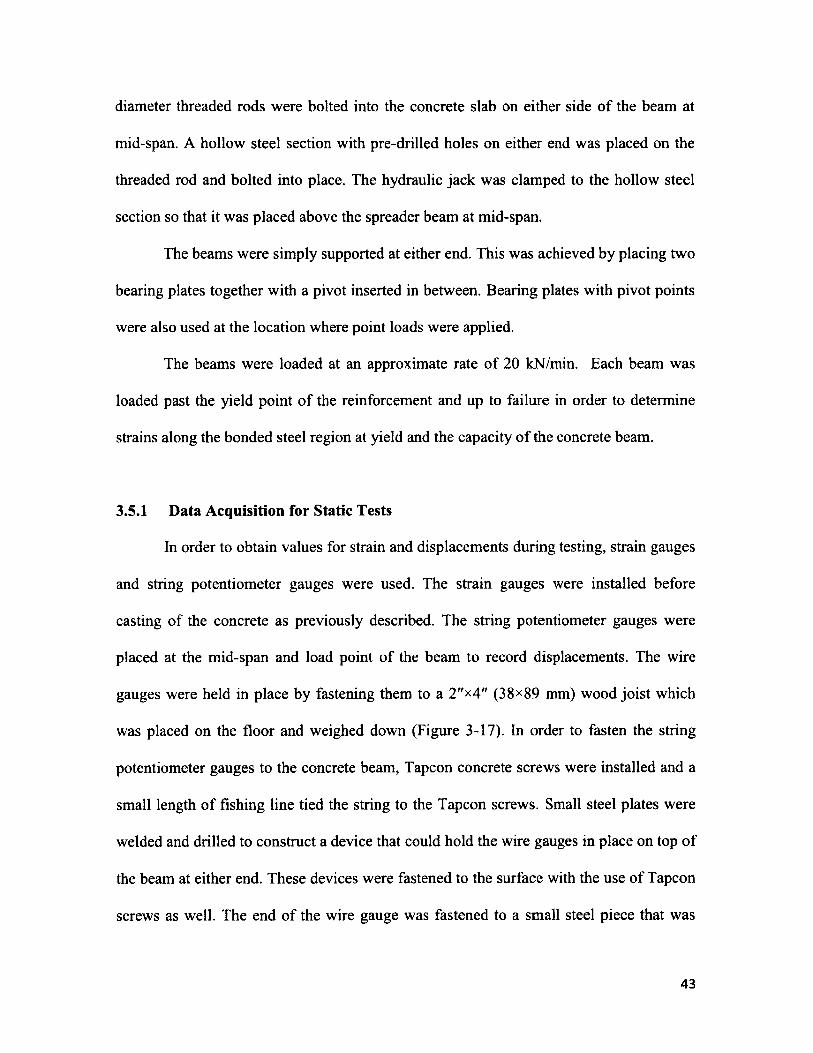
diameter threaded rods were bolted into the concrete slab on either side o f the beam at
mid-span. A hollow steel section with pre-drilled holes on either end was placed on the
threaded rod and bolted into place. The hydraulic jack was clamped to the hollow steel
section so that it was placed above the spreader beam at mid-span.
The beams were simply supported at either end. This was achieved by placing two
bearing plates together with a pivot inserted in between. Bearing plates with pivot points
were also used at the location where point loads were applied.
The beams were loaded at an approximate rate o f 20 kN/min. Each beam was
loaded past the yield point o f the reinforcement and up to failure in order to determine
strains along the bonded steel region at yield and the capacity o f the concrete beam.
3.5.1 Data Acquisition for Static Tests
In order to obtain values for strain and displacements during testing, strain gauges
and string potentiometer gauges were used. The strain gauges were installed before
casting of the concrete as previously described. The string potentiometer gauges were
placed at the mid-span and load point o f the beam to record displacements. The wire
gauges were held in place by fastening them to a 2"x4" (38x89 mm) wood joist which
was placed on the floor and weighed down (Figure 3-17). In order to fasten the string
potentiometer gauges to the concrete beam, Tapcon concrete screws were installed and a
small length o f fishing line tied the string to the Tapcon screws. Small steel plates were
welded and drilled to construct a device that could hold the wire gauges in place on top o f
the beam at either end. These devices were fastened to the surface with the use o f Tapcon
screws as well. The end o f the wire gauge was fastened to a small steel piece that was
43
welded perpendicular to the end o f the rebar protruding from both ends of the beam
(Figure 3-18). Once all gauges were in place and all wires from strain gauges and wire
gauges were connected to the data acquisition unit, the beam was ready for testing.
3.6 Dynamic Testing Using Shock Tube
The shock tube located in the University of Ottawa’s Structural Engineering
Laboratory was used to test the development length of reinforcement in concrete beams
subject to the effect o f blast loads. Unlike other loading devices, the shock tube can
induce high amplitude and short duration dynamic loads into structural elements. In fact,
the shock tube is capable o f simulating the effect o f real explosion from a given explosive
charge mass and standoff on structural elements. In order to understand how the shock
tube simulates blast loads, a brief description of its assembly and mechanisms is outlined
below.
The purpose o f the shock tube is to generate a high pressure wave, otherwise
known as a shock wave, that will act on the face o f a structural element. The shock tube
consists o f a driver, spool, and expansion sections. The driver is at the back of the shock
tube and has a variable length depending on the desired pressure and impulse. A longer
driver section will lead to a longer positive phase duration of the blast wave. Therefore
the driver length in this experimental program was selected to achieve the desired blast
wave parameters. Next to the driver section is a spool section, separated from the driver
section by double diaphragm firing mechanism which controls the pressure wave release
of the shock tube. The double diaphragm firing mechanism allows the driver and spool
sections to be pressurized to different values and balanced to ensure the diaphragm
4 4
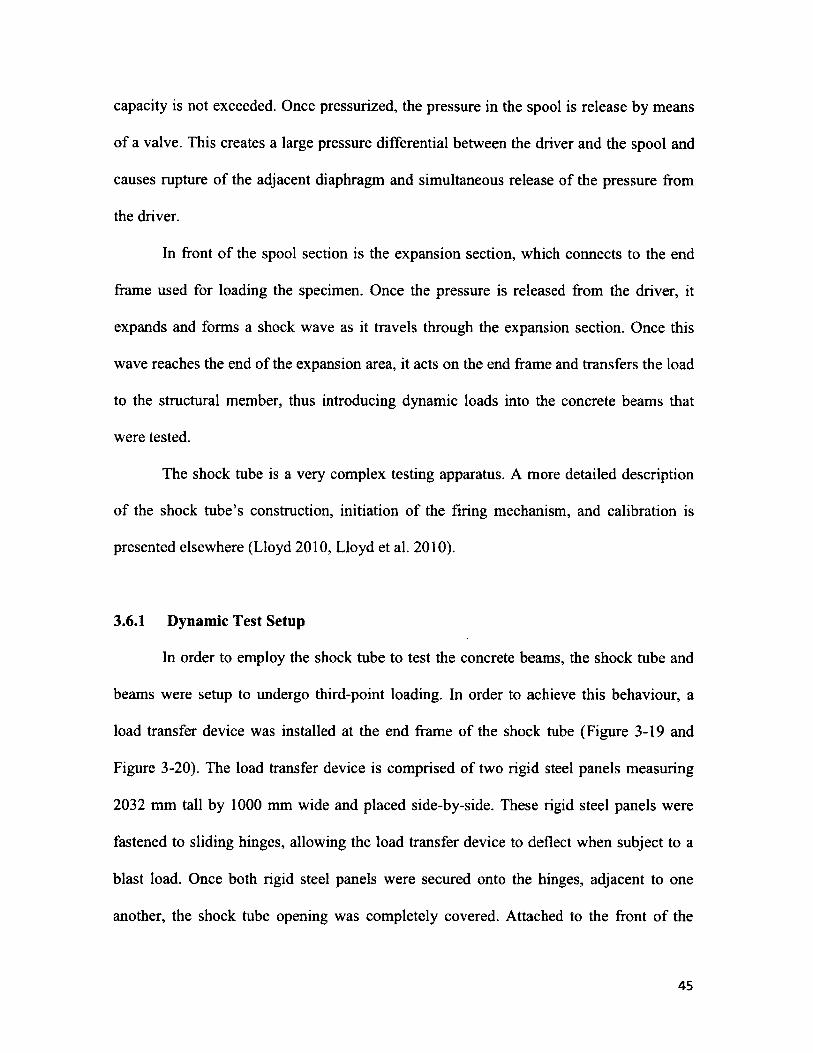
capacity is not exceeded. Once pressurized, the pressure in the spool is release by means
o f a valve. This creates a large pressure differential between the driver and the spool and
causes rupture of the adjacent diaphragm and simultaneous release o f the pressure from
the driver.
In front o f the spool section is the expansion section, which connects to the end
frame used for loading the specimen. Once the pressure is released from the driver, it
expands and forms a shock wave as it travels through the expansion section. Once this
wave reaches the end of the expansion area, it acts on the end frame and transfers the load
to the structural member, thus introducing dynamic loads into the concrete beams that
were tested.
The shock tube is a very complex testing apparatus. A more detailed description
o f the shock tube’s construction, initiation o f the firing mechanism, and calibration is
presented elsewhere (Lloyd 2010, Lloyd et al. 2010).
3.6.1 Dynamic Test Setup
In order to employ the shock tube to test the concrete beams, the shock tube and
beams were setup to undergo third-point loading. In order to achieve this behaviour, a
load transfer device was installed at the end frame o f the shock tube (Figure 3-19 and
Figure 3-20). The load transfer device is comprised of two rigid steel panels measuring
2032 mm tall by 1000 mm wide and placed side-by-side. These rigid steel panels were
fastened to sliding hinges, allowing the load transfer device to deflect when subject to a
blast load. Once both rigid steel panels were secured onto the hinges, adjacent to one
another, the shock tube opening was completely covered. Attached to the front o f the
45
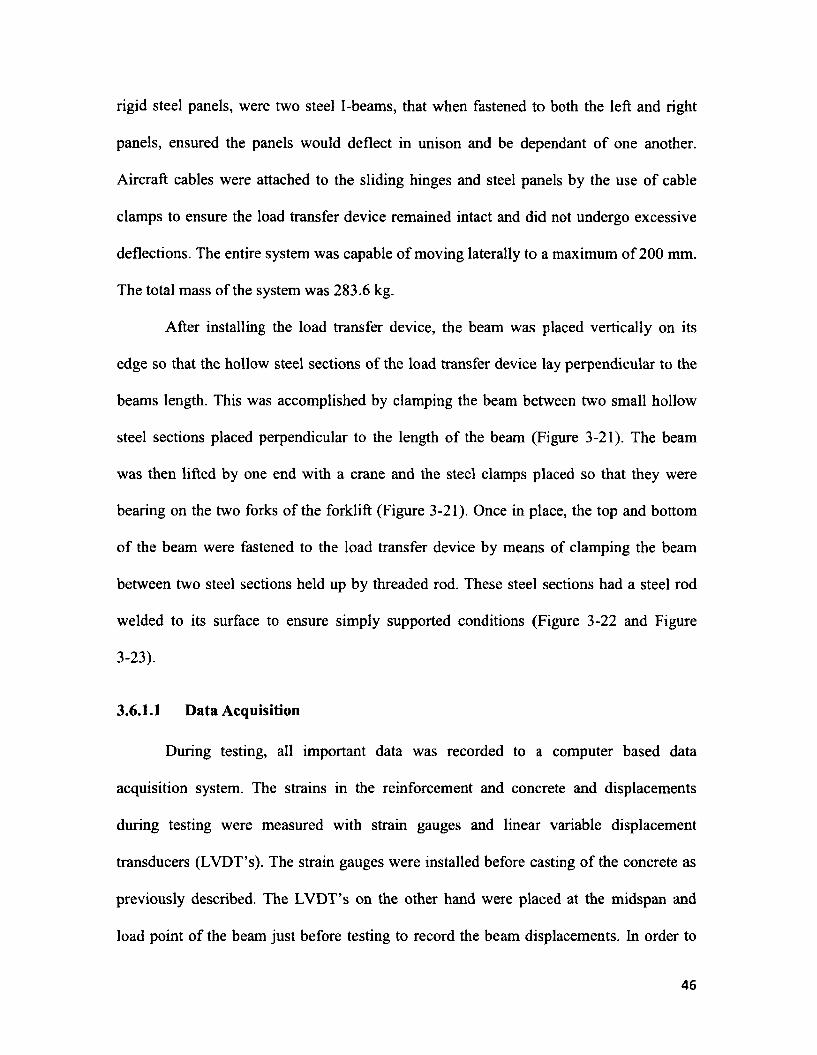
rigid steel panels, were two steel I-beams, that when fastened to both the left and right
panels, ensured the panels would deflect in unison and be dependant o f one another.
Aircraft cables were attached to the sliding hinges and steel panels by the use o f cable
clamps to ensure the load transfer device remained intact and did not undergo excessive
deflections. The entire system was capable o f moving laterally to a maximum of 200 mm.
The total mass of the system was 283.6 kg.
After installing the load transfer device, the beam was placed vertically on its
edge so that the hollow steel sections o f the load transfer device lay perpendicular to the
beams length. This was accomplished by clamping the beam between two small hollow
steel sections placed perpendicular to the length o f the beam (Figure 3-21). The beam
was then lifted by one end with a crane and the steel clamps placed so that they were
bearing on the two forks o f the forklift (Figure 3-21). Once in place, the top and bottom
o f the beam were fastened to the load transfer device by means of clamping the beam
between two steel sections held up by threaded rod. These steel sections had a steel rod
welded to its surface to ensure simply supported conditions (Figure 3-22 and Figure
3-23).
3.6.1.1 Data Acquisition
During testing, all important data was recorded to a computer based data
acquisition system. The strains in the reinforcement and concrete and displacements
during testing were measured with strain gauges and linear variable displacement
transducers (LVDT’s). The strain gauges were installed before casting o f the concrete as
previously described. The LVDT’s on the other hand were placed at the midspan and
load point o f the beam just before testing to record the beam displacements. In order to
46
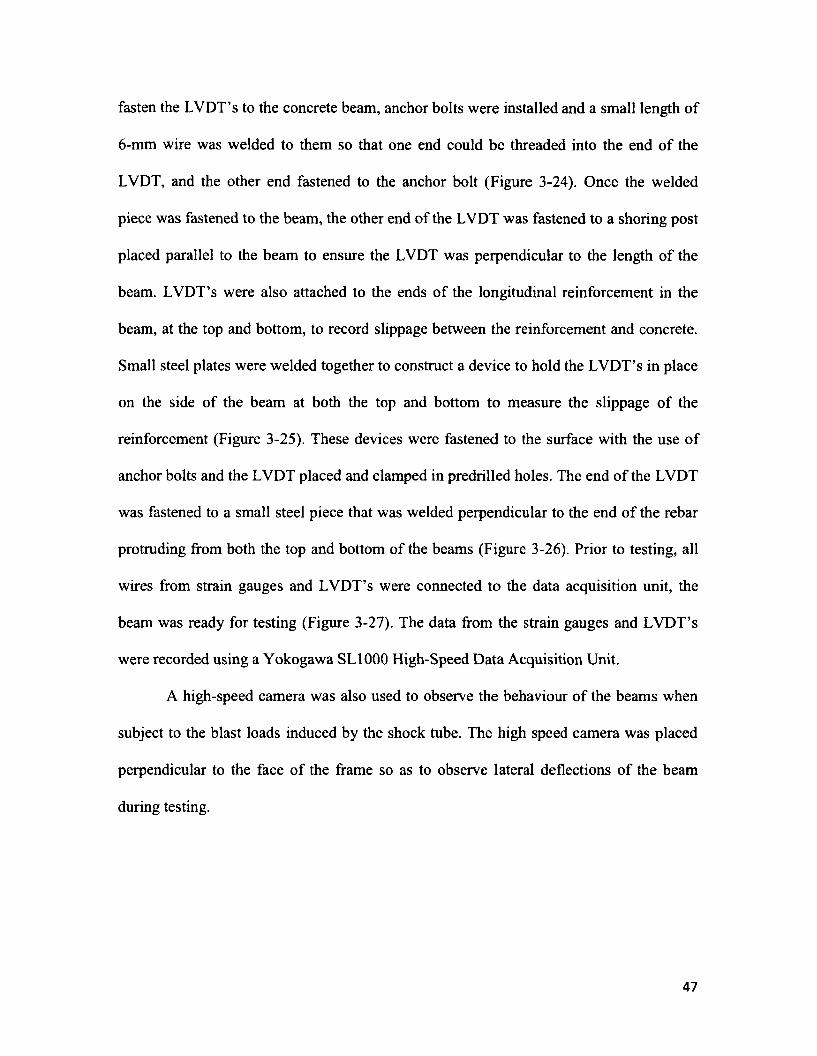
fasten the LVDT’s to the concrete beam, anchor bolts were installed and a small length o f
6-mm wire was welded to them so that one end could be threaded into the end o f the
LVDT, and the other end fastened to the anchor bolt (Figure 3-24). Once the welded
piece was fastened to the beam, the other end of the LVDT was fastened to a shoring post
placed parallel to the beam to ensure the LVDT was perpendicular to the length o f the
beam. LVDT’s were also attached to the ends o f the longitudinal reinforcement in the
beam, at the top and bottom, to record slippage between the reinforcement and concrete.
Small steel plates were welded together to construct a device to hold the LVDT’s in place
on the side of the beam at both the top and bottom to measure the slippage o f the
reinforcement (Figure 3-25). These devices were fastened to the surface with the use o f
anchor bolts and the LVDT placed and clamped in predrilled holes. The end o f the LVDT
was fastened to a small steel piece that was welded perpendicular to the end o f the rebar
protruding from both the top and bottom of the beams (Figure 3-26). Prior to testing, all
wires from strain gauges and LVDT’s were connected to the data acquisition unit, the
beam was ready for testing (Figure 3-27). The data from the strain gauges and LVDT’s
were recorded using a Yokogawa SL1000 High-Speed Data Acquisition Unit.
A high-speed camera was also used to observe the behaviour o f the beams when
subject to the blast loads induced by the shock tube. The high speed camera was placed
perpendicular to the face o f the frame so as to observe lateral deflections o f the beam
during testing.
47
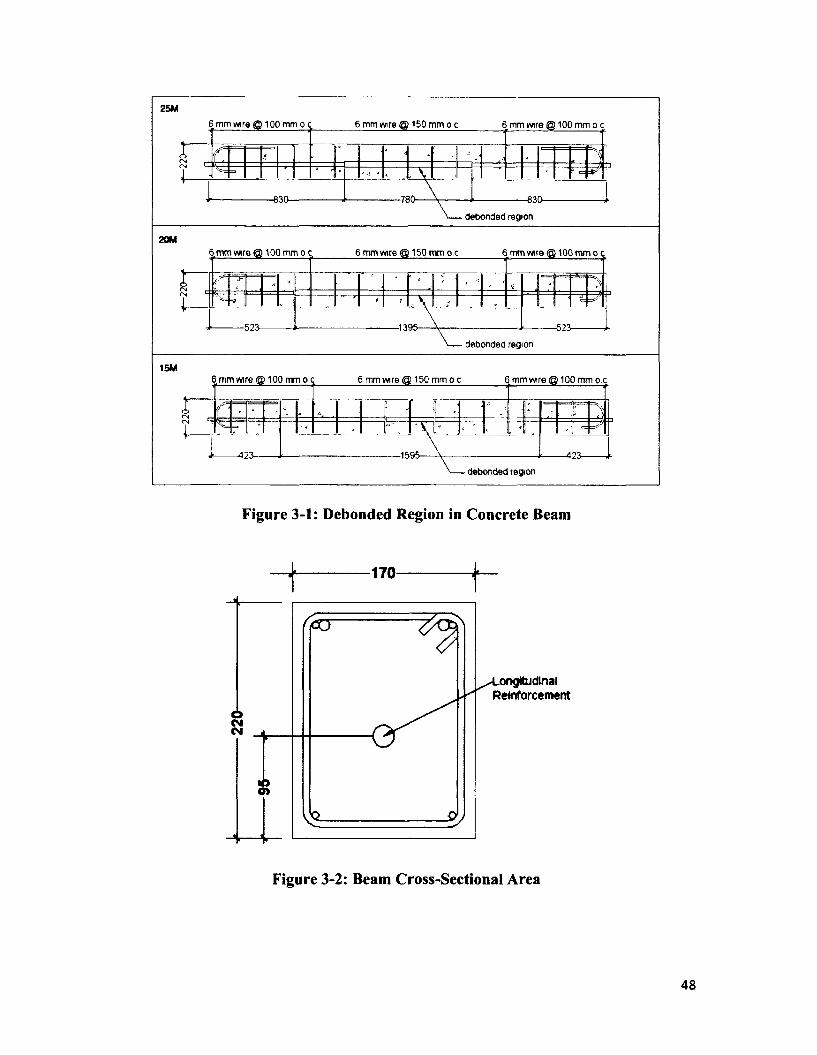
25M6m m wire @ 100 mm o 6 mm wire @ 150 mm o c 6 mm wire © 100 mm o c
-780■830 8 3 0
20M6 mm wire ® 100 mm o c wire @ 150 m tn o c 6 mm wire @ 100 mm o c
-523 -1395- -523
debonded region
15M6 mm wire @ 100 mm o c mm wire @ 150 mm o c mm wire @ 100 mm o c
-1595--423 4 2 3
Figure 3-1: Debonded Region in Concrete Beam
170
-LongitudinalReinforcement
CMCM
•Oat
Figure 3-2: Beam Cross-Sectional Area
48
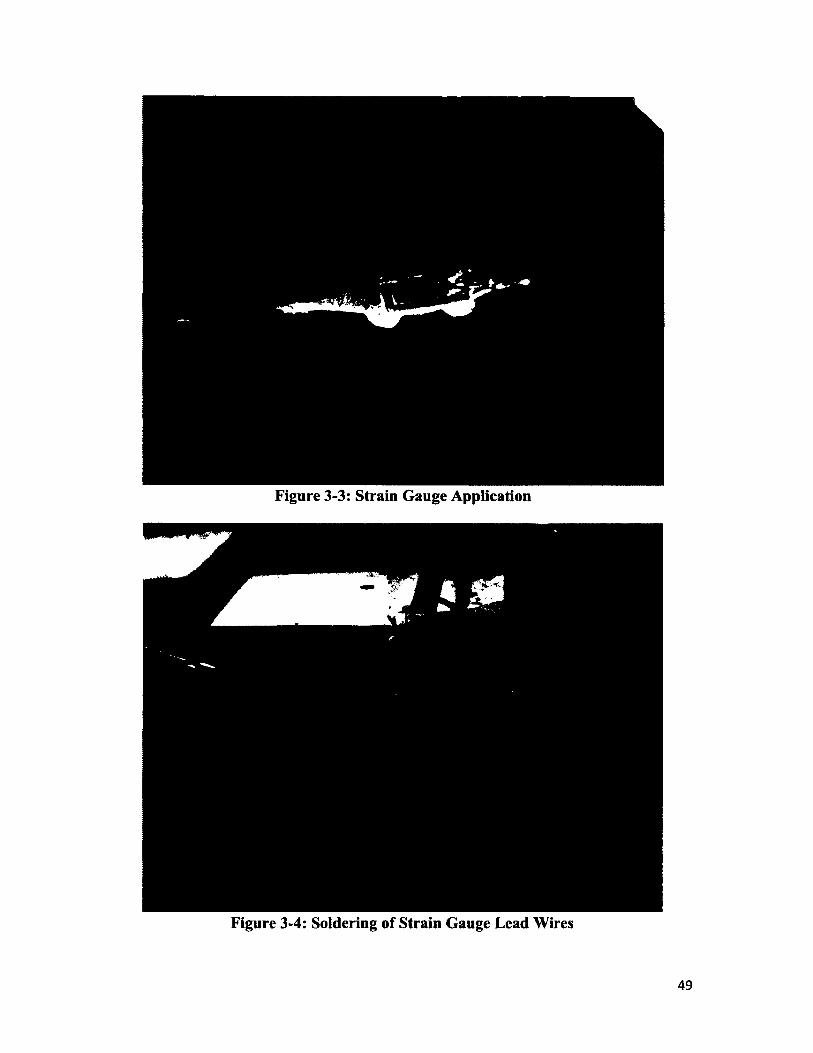
Figure 3-3: Strain Gauge Application
Figure 3-4: Soldering of Strain Gauge Lead Wires
49
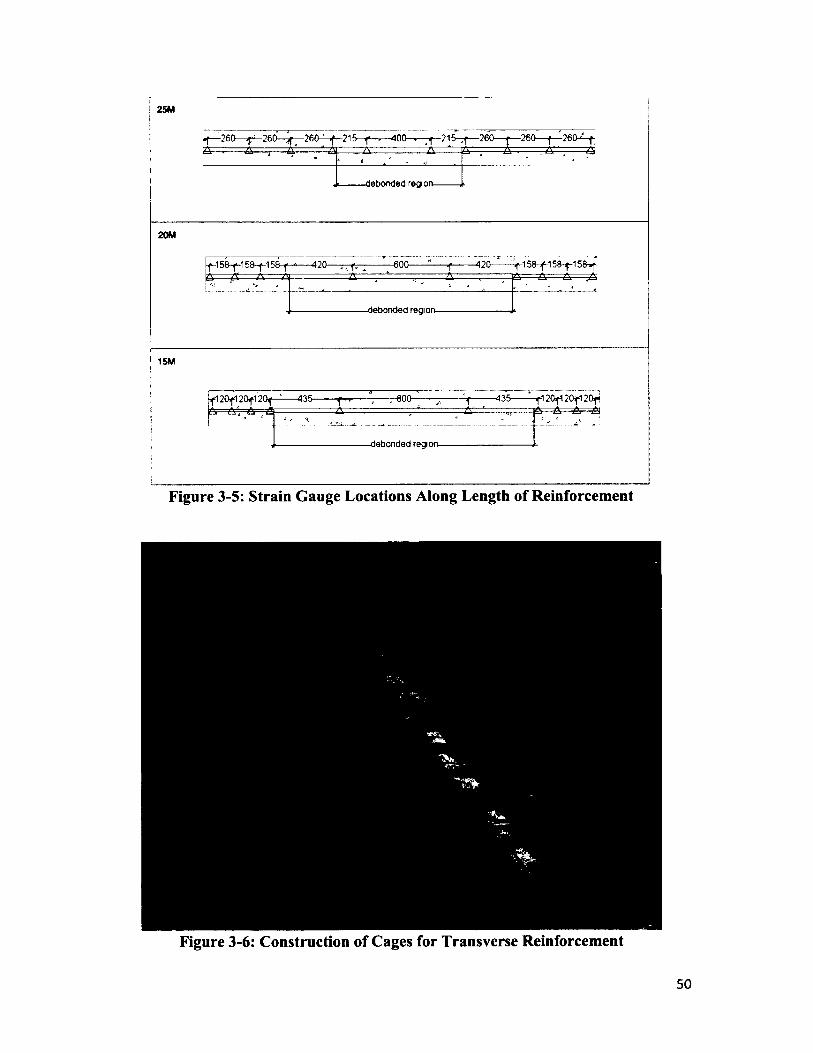
25M
* 1 * 1 1 1 1--- , /\ - /\------1 A': , ...
i------debonded region------,
20M
&-----^
--------------------------debonded region------------------------ ,
1SM
i-------------------------------debonded region--------------
-Vi •
Figure 3-5: Strain Gauge Locations Along Length of Reinforcement
.am.
■ ::fw.
Figure 3-6: Construction of Cages for Transverse Reinforcement
50
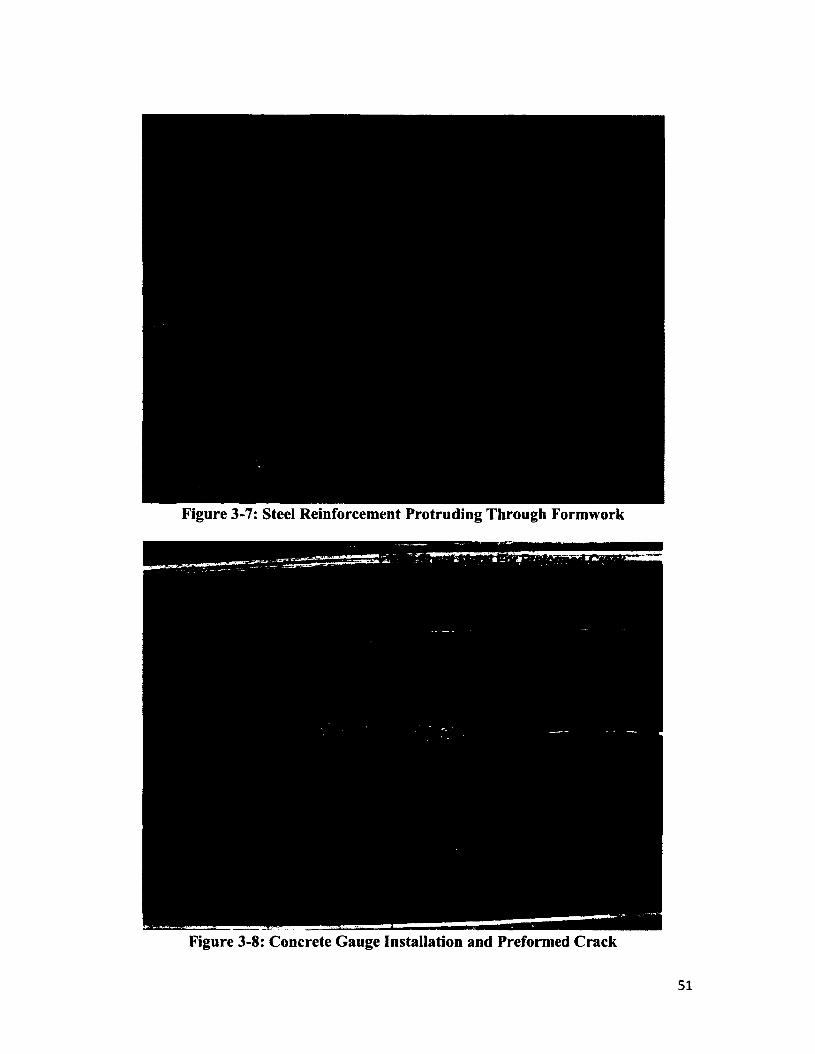
Figure 3-7: Steel Reinforcement Protruding Through Formwork
Figure 3-8: Concrete Gauge Installation and Preformed Crack
51
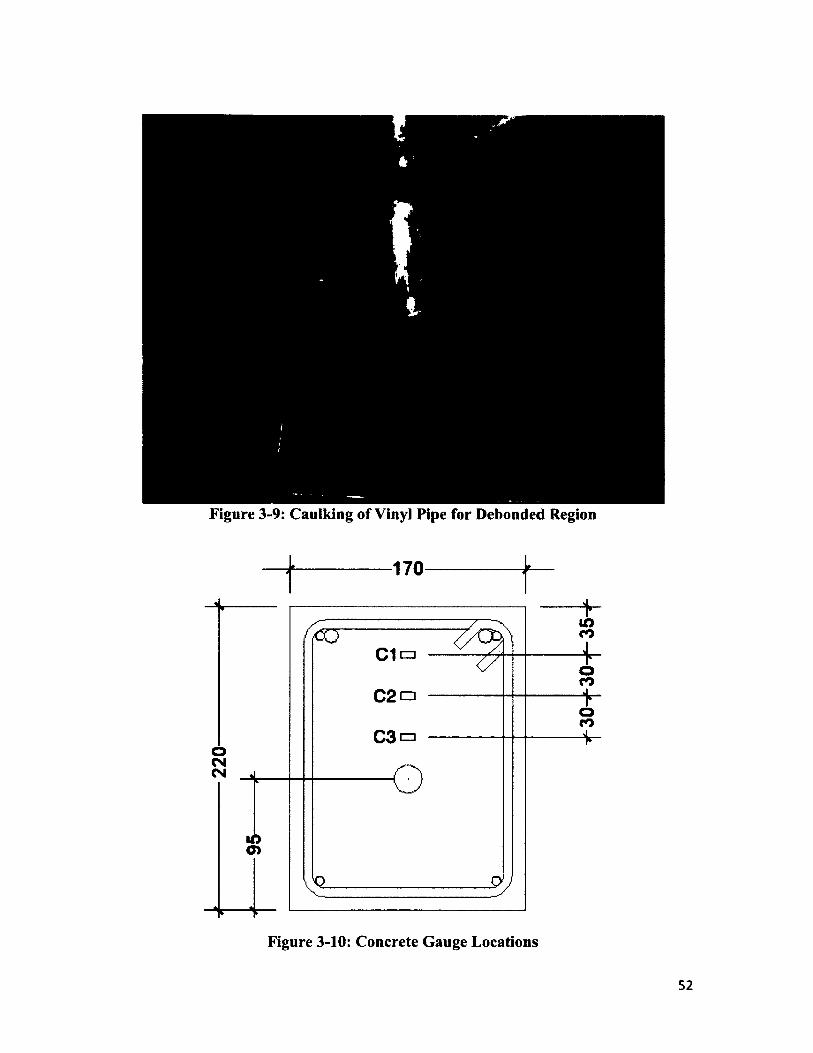
220
Figure 3-9: Caulking of Vinyl Pipe for Debonded Region
170---------------
ineoC1<=i
oco
oco
ino>
Figure 3-10: Concrete Gauge Locations
Figure 3-11: Concrete Gauges in Formwork
Figure 3-12: Placement of Steel Cages, Longitudinal Reinforcement, and ConcreteGauges Prior to Casting of Concrete
Figure 3-13: Concrete Cylinders
54
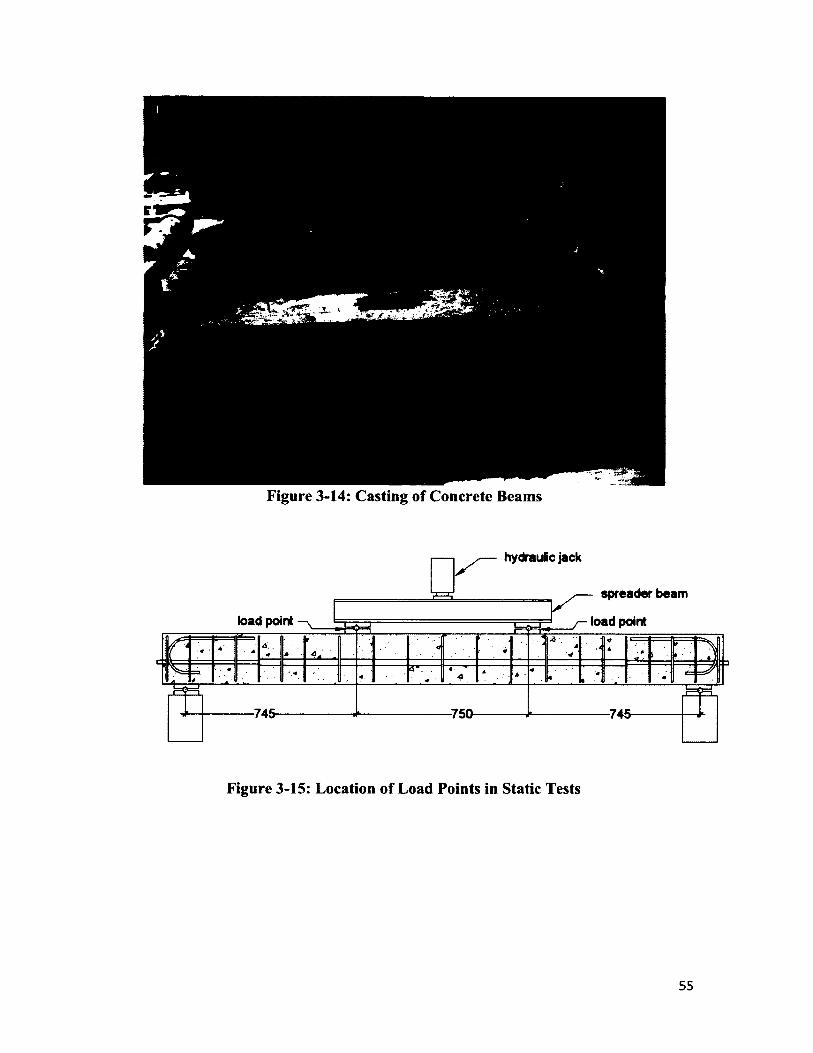
Figure 3-14: Casting of Concrete Beams
hydraulic jack
spreader beam
load point load point
745 -750 745
Figure 3-15: Location of Load Points in Static Tests
55
Figure 3-16: Static Test Setup
Figure 3-17: Midspan and Load-Point Gauges
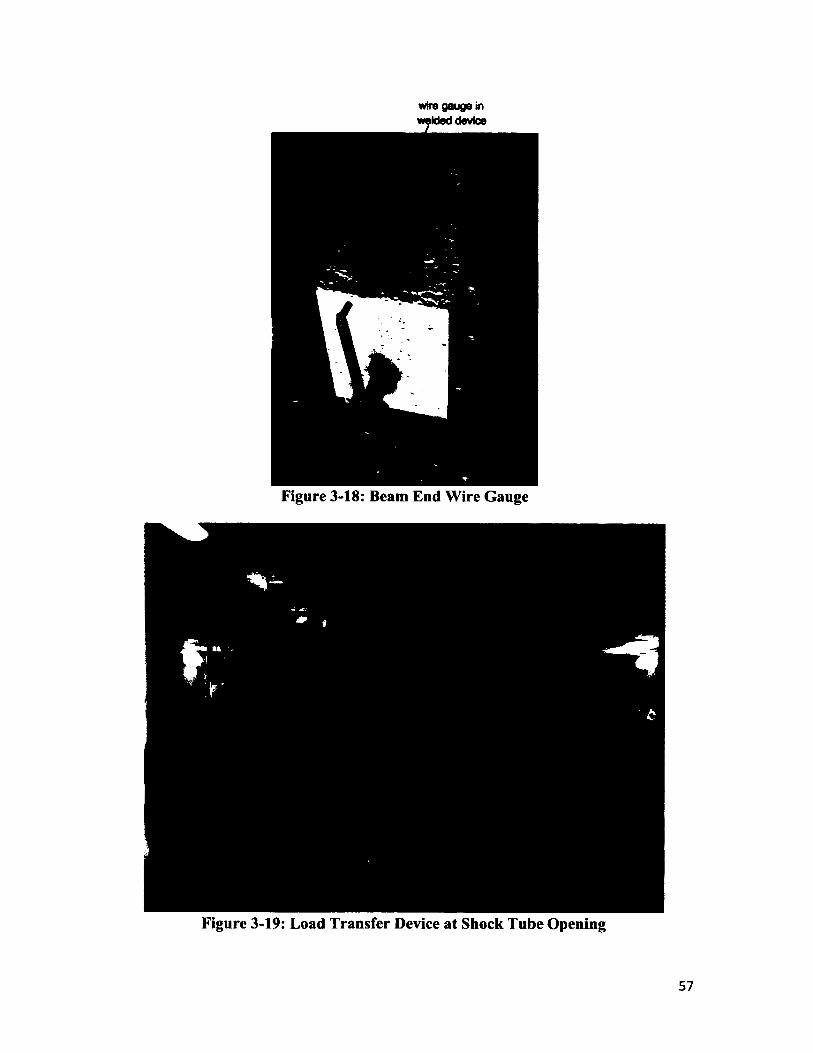
Figure 3-18: Beam End Wire Gauge
Figure 3-19: Load Transfer Device at Shock Tube Opening
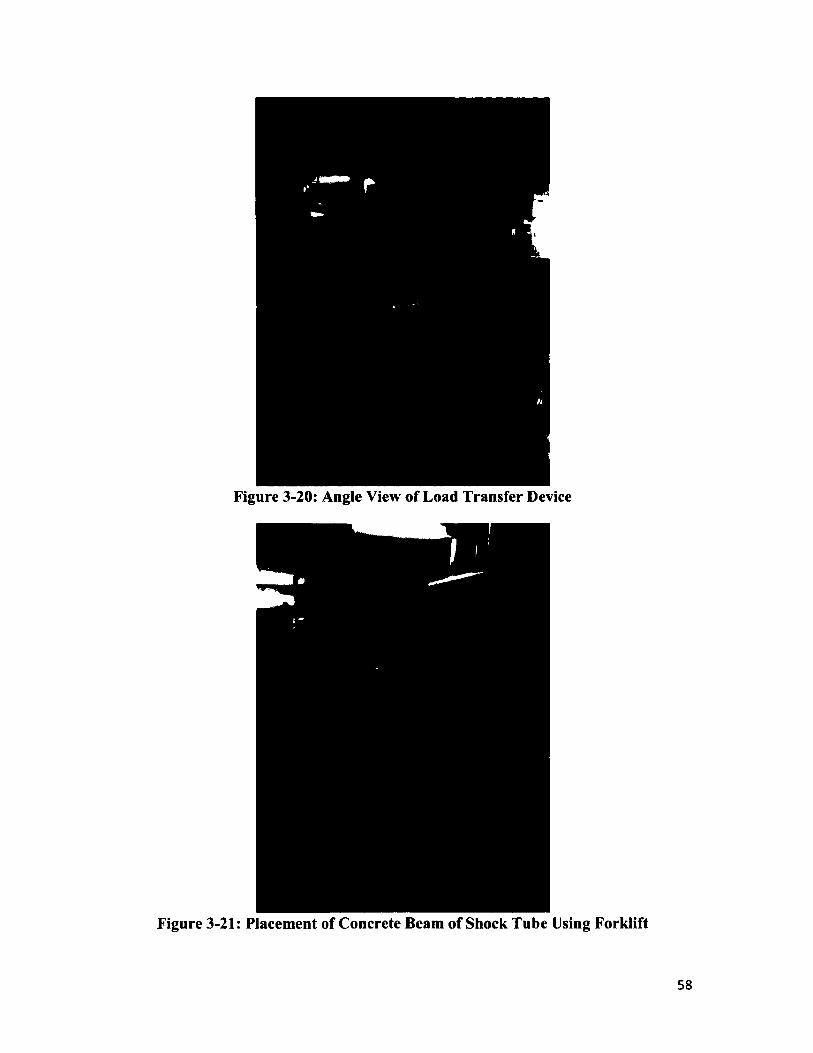
Figure 3-20: Angle View of Load Transfer Device
Figure 3-21: Placement of Concrete Beam of Shock Tube Using Forklift
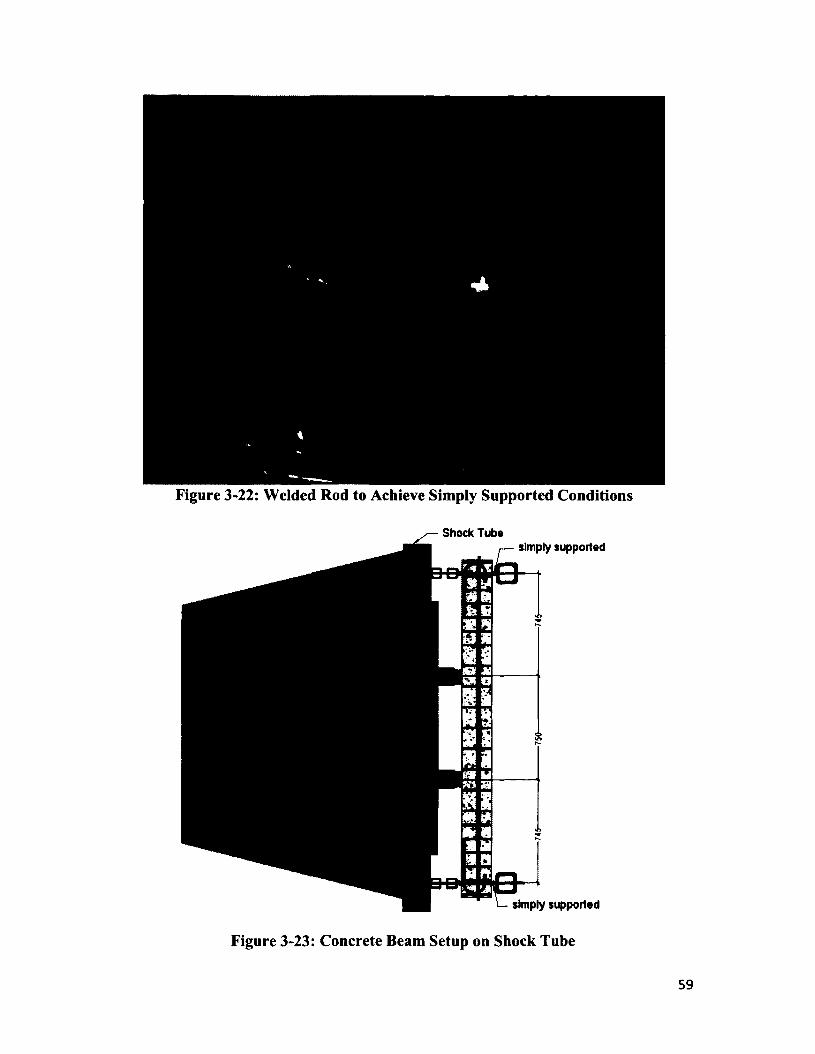
Figure 3-22: Welded Rod to Achieve Simply Supported Conditions
Shock Tubesimply supported
simply supported
Figure 3-23: Concrete Beam Setup on Shock Tube
59
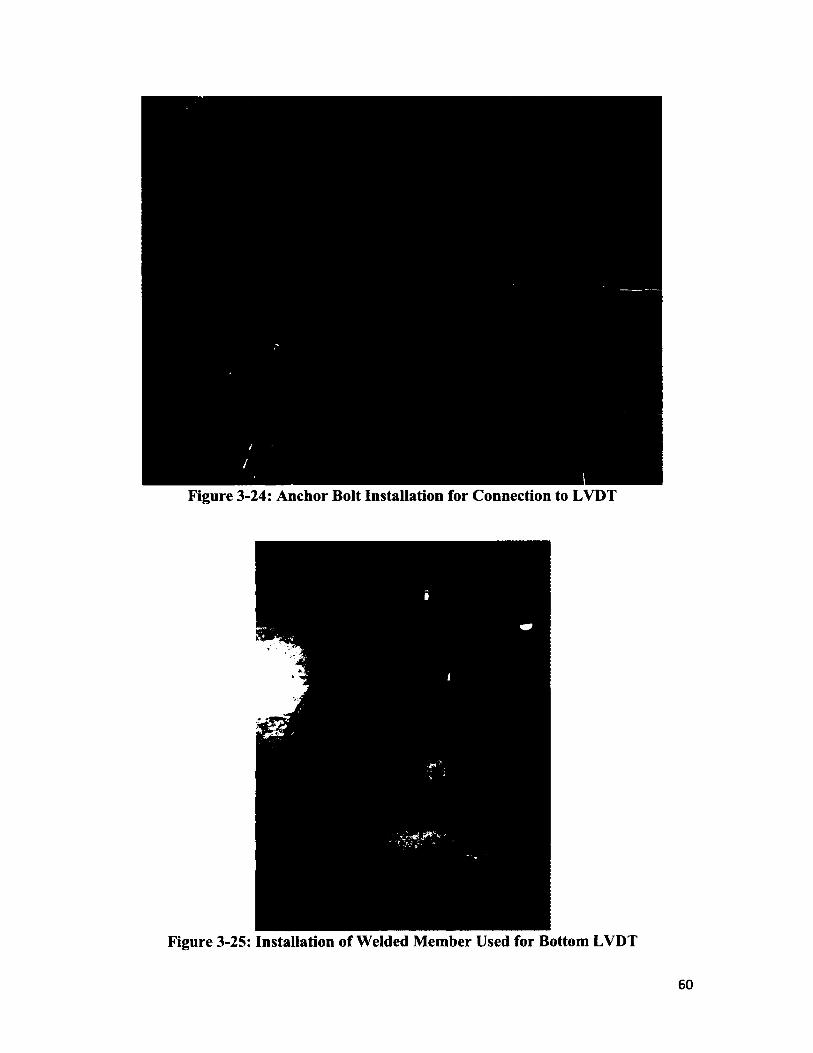
i/
Figure 3-24: Anchor Bolt Installation for Connection to LVDT
Figure 3-25: Installation of Welded Member Used for Bottom LVDT
60
Figure 3-26: Placement of Bottom LVDT in Welded Member
4 Chapter: Experimental Results
4.1 Ancillary Testing
4.1.1 Tensile Strength of Steel Reinforcement
All sizes o f reinforcement used in the construction o f the concrete beams were
tested in tension to obtain their strength and strain characteristics. The apparatus used to
test the steel specimens was a MTS 810 Material Testing System, equipped with MTS
FlexTests SE data acquisition software. A clip gauge placed on the steel specimen was
used to record strain values.
A minimum of three static tests each were completed for 15M, 20M and 25M
reinforcement. The tests were performed in accordance with ASTM A370-1 la (2011).
The static tests began at a strain rate o f 30 pstrain/s in load control mode until a strain of
0.005 was reached in the steel specimen. After this, the strain rate was increased to 950
ps train/s. The test mode was changed from load control to displacement control when the
maximum displacement o f the clip gauge was reached.
Once all tests were completed, the data was analyzed and stress-strain curves
were produced and used to obtain strength characteristics for each size o f reinforcement.
The upper yield strength, lower yield strength, strength in the yield plateau (before strain-
hardening occurs) and the ultimate strength were determined. Strain characteristics such
as strain at yield strength, strain at ultimate strength and strain of fracture were also
determined. The test data is presented in Table 4-1 and Table 4-5 including average
values for each size o f reinforcing steel. The size o f the reinforcing steel was determined
62
by taking 3 measurements with calipers along the length o f each steel reinforcement
specimen and determining the average diameter o f each bar. The average diameter o f all
bars was then determined.
Dynamic tests were also performed in order to gain an understanding
reinforcement behaviour under high strain rate (dynamic testing). The strain rate was
increased to approximately 6667 times the static strain rates for these tests which was the
maximum rate o f loading for the testing machine. For both 15M and 20M rebar a strain
rate o f 0.2 strain/s was used to determine the dynamic strength characteristics. For 25M
rebar, a strain rate o f 0.2 strain/s was attempted, but the specimen slipped from and failed
at the grips. Values o f strength and strain obtained in tests at 0.2 strain/s are reported in
Table 4-3 and Table 4-7.
Following the dynamic tests conducted at a rate of 0.2 strain/s, a second set o f
dynamic test were conducted using a strain o f 0.1 strain/s or approximately 3333 times
that o f the static tests. These tests were done for 15M, 20M and 25M size rebar. The
strength and strain characteristics obtained from all tests conducted at 0.1 strain/s are
reported in Table 4-2 and Table 4-6.
A comparison o f the stress-strain curves for different strain rates were also
produced and are shown in Figure 4-1, Figure 4-2, and Figure 4-3 for the 15M, 20M and
25M reinforcements respectively. The stress-strain curves show a significant increase in
strength at higher strains rates (0.2 s '1 and 0.1 s '1). The yield strength and ultimate
strength increases are presented in Table 4-4. For 15M rebar the yield strength increase
factor was 1.11 while the ultimate strength increase factor was 1.05 at 0.1 strain rate, and
the yield strength increase was 1.12 while the ultimate strength increase factor was 1.05
63
at 0.2 strain rate. For 20M rebar the yield strength increase factor and the ultimate
strength increase was 1.10 at 0.1 strain rate, and the yield strength increase was 1.09
while the ultimate strength increase was 1.11 at 0.2 strain rate. For 25M rebar the yield
strength increase was 1.10 while the ultimate strength increase was 1.05 at 0.1 strain rate.
No significant difference was observed between the response o f reinforcement tested at
0.1 s '1 and 0.2 s '1 for the 15M and 20M reinforcements.
Table 4-8 shows the strain values at yield for increased strain rates. For 15M rebar
the yield strain increase factor was 1.05 at 0.1 strain rate, and 1.07 at 0.2 strain rate. For
20M rebar the yield strain increase factor was 1.02 at 0.1 strain rate, and 1.18 at 0.2 strain
rate. For 25M rebar the yield strain increase factor was 1.29 at 0.1 strain rate. Figure 4-1,
Figure 4-2, and Figure 4-3 for the 15M, 20M and 25M reinforcements respectively show
the stress-strain curves at different strain rates. From the curves, it is apparent the strain
rate increase had very diminutive effects on the strain at ultimate strength and ultimate
strain for 15M rebar. However, when 20M and 25M rebar was loaded more rapidly, the
strain at ultimate strength was significantly lower than that in the static tests. No change
in the modulus o f elasticity o f the reinforcement was observed with increase in strain
rate.
4.1.2 Compressive Strength of Concrete Cylinders
During casting of concrete beams, concrete cylinders were also cast to determine
compressive strength o f concrete. The cylinders use had a diameter o f 152 mm and a
height o f 305 mm. The concrete was cast on January 23, 2012 and cured for over three
months. The period over which Shock Tube testing took place was approximately 2
64
weeks In order to determine the concrete strength during shock tube testing, 5 concrete
cylinders were tested at the onset o f Shock Tube testing and another 5 concrete cylinders
tested at the end o f Shock Tube testing. The average strength for the concrete tests on
these days were 36.54 MPa and 37.90 MPa respectively as shown in Table 4-9.
Once all shock tube testing was completed, the remaining beams were tested in
static conditions. At the end this testing another 5 concrete cylinders were tested. The
average strength o f concrete that was determined to be 37.50 MPa as shown in Table 4-9.
65
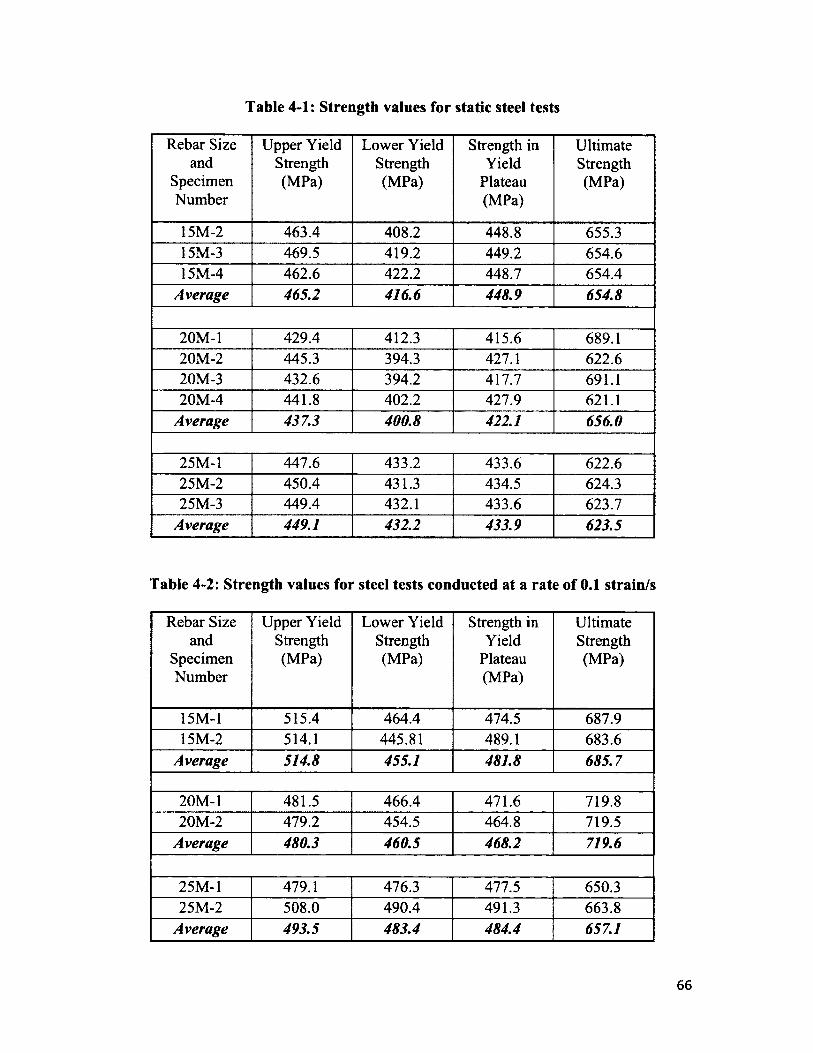
Table 4-1: Strength values for static steel tests
Rebar Size and
Specimen Number
Upper Yield Strength (MPa)
Lower Yield Strength (MPa)
Strength in Yield
Plateau (MPa)
UltimateStrength(MPa)
15M-2 463.4 408.2 448.8 655.315M-3 469.5 419.2 449.2 654.615M-4 462.6 422.2 448.7 654.4
Average 465.2 416.6 448.9 654.8
20M-1 429.4 412.3 415.6 689.120M-2 445.3 394.3 427.1 622.620M-3 432.6 394.2 417.7 691.120M-4 441.8 402.2 427.9 621.1
Average 437.3 400.8 422.1 656.0
25M-1 447.6 433.2 433.6 622.625M-2 450.4 431.3 434.5 624.325M-3 449.4 432.1 433.6 623.7
Average 449.1 432.2 433.9 623.5
Table 4-2: Strength values for steel tests conducted at a rate of 0.1 strain/s
Rebar Size and
Specimen Number
Upper Yield Strength (MPa)
Lower Yield Strength (MPa)
Strength in Yield
Plateau (MPa)
UltimateStrength(MPa)
15M-1 515.4 464.4 474.5 687.915M-2 514.1 445.81 489.1 683.6
Average 514.8 455.1 481.8 685.7
20M-1 481.5 466.4 471.6 719.820M-2 479.2 454.5 464.8 719.5
Average 480.3 460.5 468.2 719.6
25M-1 479.1 476.3 477.5 650.325M-2 508.0 490.4 491.3 663.8
Average 493.5 483.4 484.4 657.1
66
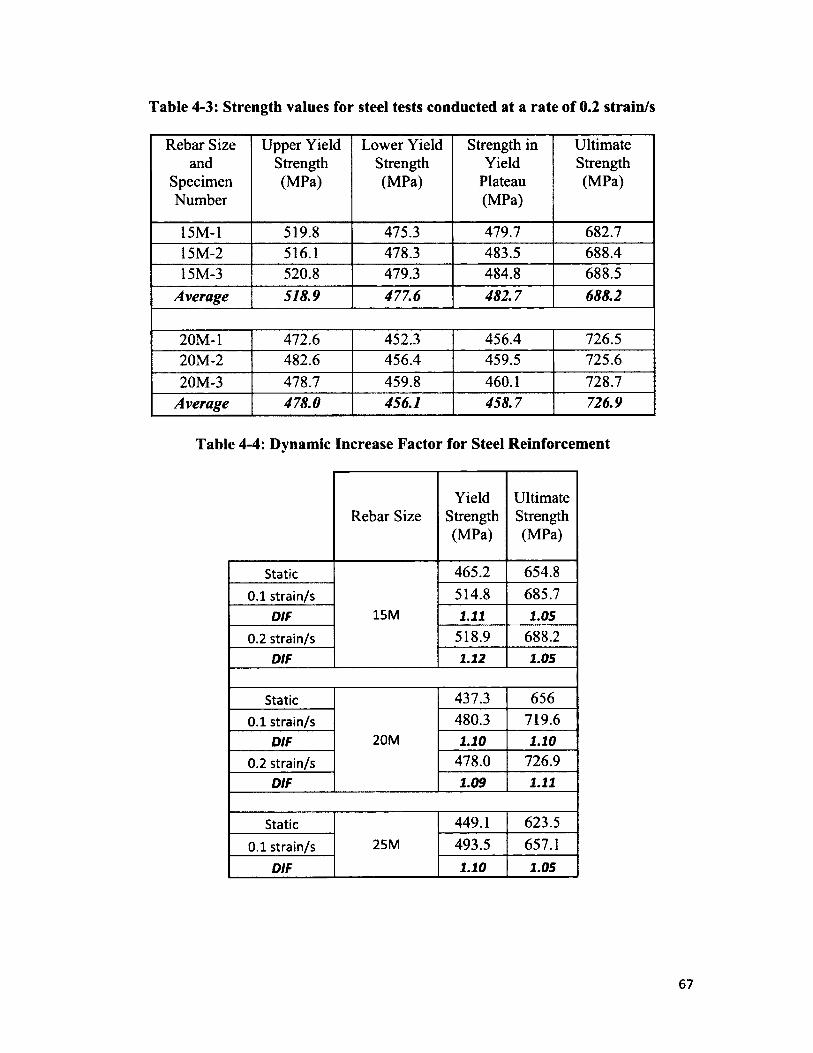
Table 4-3: Strength values for steel tests conducted at a rate of 0.2 strain/s
Rebar Size and
Specimen Number
Upper Yield Strength (MPa)
Lower Yield Strength (MPa)
Strength in Yield
Plateau (MPa)
UltimateStrength(MPa)
15M-1 519.8 475.3 479.7 682.715M-2 516.1 478.3 483.5 688.415M-3 520.8 479.3 484.8 688.5
Average 518.9 477.6 482.7 688.2
20M-1 472.6 452.3 456.4 726.520M-2 482.6 456.4 459.5 725.620M-3 478.7 459.8 460.1 728.7
Average 478.0 456.1 458.7 726.9
Table 4-4: Dynamic Increase Factor for Steel Reinforcement
Rebar SizeYield
Strength(MPa)
UltimateStrength(MPa)
Static
15M
465.2 654.80.1 strain/s 514.8 685.7
DIF 1.11 1.050.2 strain/s 518.9 688.2
DIF 1.12 1.05
Static
20M
437.3 6560.1 strain/s 480.3 719.6
DIF 1.10 1.100.2 strain/s 478.0 726.9
DIF 1.09 1.11
Static25M
449.1 623.50.1 strain/s 493.5 657.1
DIF 1.10 1.05
67
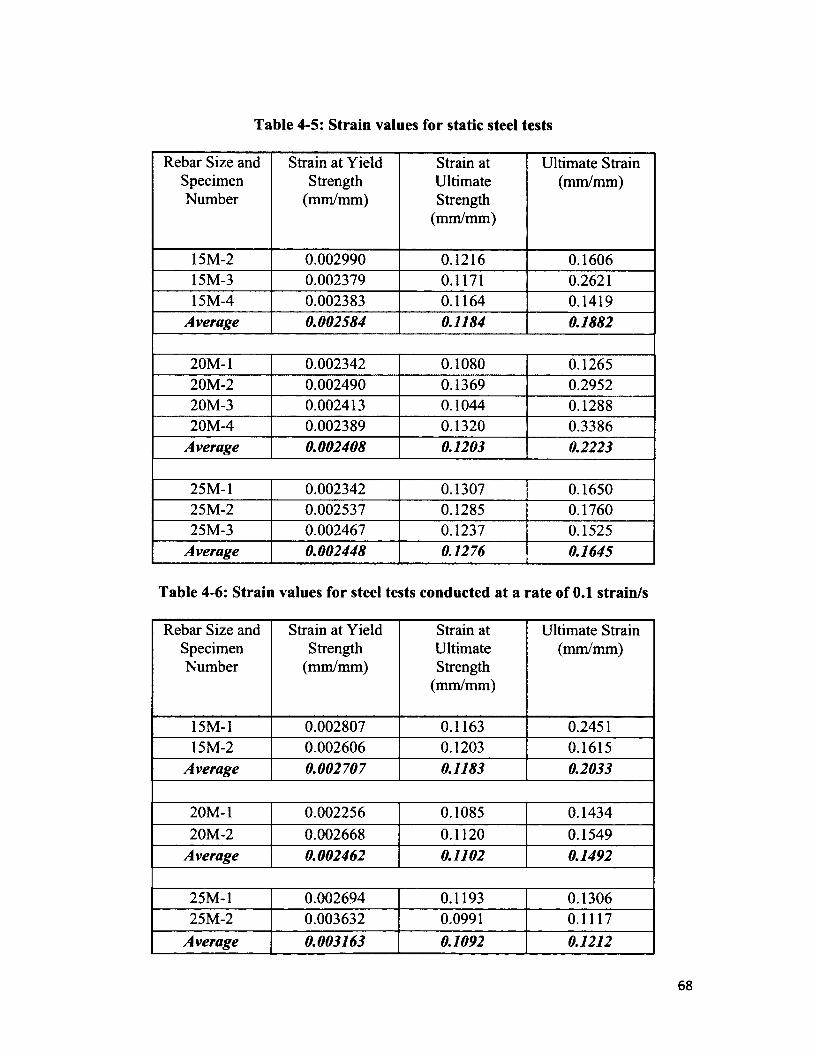
Table 4-5: Strain values for static steel tests
Rebar Size and Specimen Number
Strain at Yield Strength
(mm/mm)
Strain at Ultimate Strength
(mm/mm)
Ultimate Strain (mm/mm)
15M-2 0.002990 0.1216 0.160615M-3 0.002379 0.1171 0.262115M-4 0.002383 0.1164 0.1419
Average 0.002584 0.1184 0.1882
20M-1 0.002342 0.1080 0.126520M-2 0.002490 0.1369 0.295220M-3 0.002413 0.1044 0.128820M-4 0.002389 0.1320 0.3386
Average 0.002408 0.1203 0.2223
25M-1 0.002342 0.1307 0.165025M-2 0.002537 0.1285 0.176025M-3 0.002467 0.1237 0.1525
Average 0.002448 0.1276 0.1645
Table 4-6: Strain values for steel tests conducted at a rate of 0.1 strain/s
Rebar Size and Specimen Number
Strain at Yield Strength
(mm/mm)
Strain at Ultimate Strength
(mm/mm)
Ultimate Strain (mm/mm)
15M-1 0.002807 0.1163 0.245115M-2 0.002606 0.1203 0.1615
Average 0.002707 0.1183 0.2033
20M-1 0.002256 0.1085 0.143420M-2 0.002668 0.1120 0.1549
Average 0.002462 0.1102 0.1492
25M-1 0.002694 0.1193 0.130625M-2 0.003632 0.0991 0.1117
Average 0.003163 0.1092 0.1212
68
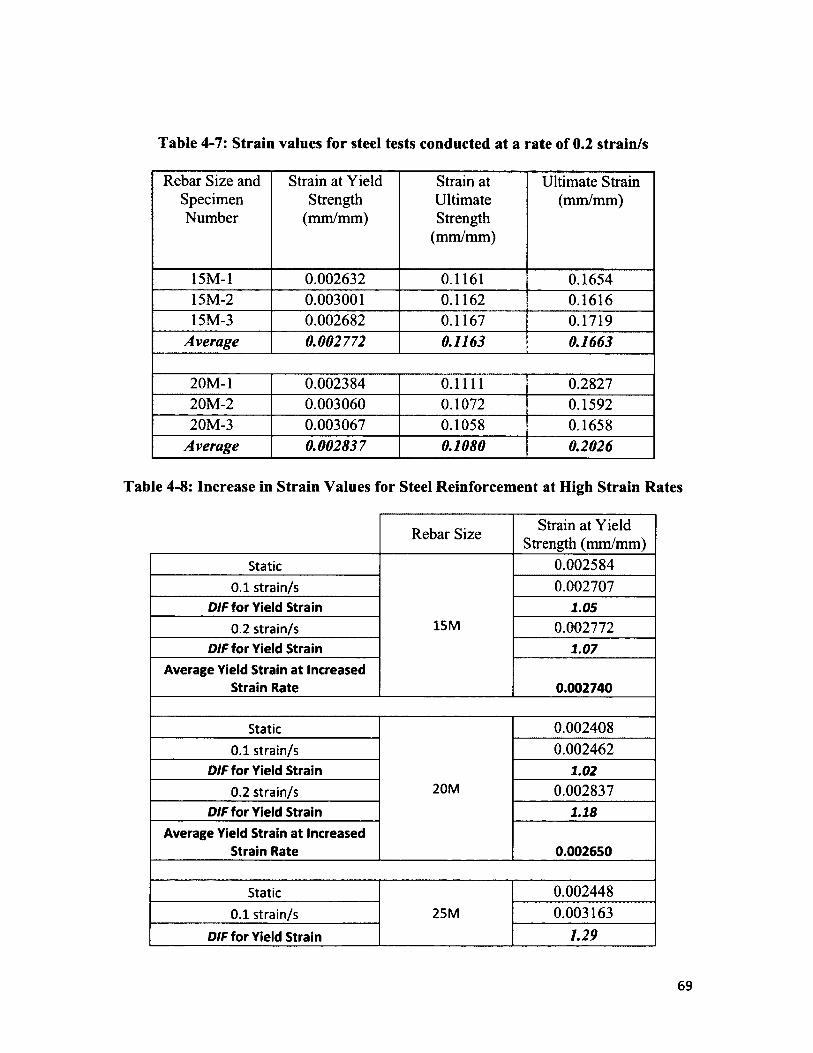
Table 4-7: Strain values for steel tests conducted at a rate of 0.2 strain/s
Rebar Size and Specimen Number
Strain at Yield Strength
(mm/mm)
Strain at Ultimate Strength
(mm/mm)
Ultimate Strain (mm/mm)
15M-1 0.002632 0.1161 0.165415M-2 0.003001 0.1162 0.161615M-3 0.002682 0.1167 0.1719
Average 0.002772 0.1163 0.1663
20M-1 0.002384 0.1111 0.282720M-2 0.003060 0.1072 0.159220M-3 0.003067 0.1058 0.1658
Average 0.002837 0.1080 0.2026
Table 4-8: Increase in Strain Values for Steel Reinforcement at High Strain Rates
Rebar Size Strain at Yield Strength (mm/mm)
Static
15M
0.0025840.1 strain/s 0.002707
DIF for Yield Strain 1 .05
0.2 strain/s 0.002772DIF for Yield Strain 1 .0 7
A verage Yield Strain at Increased Strain Rate 0 .002740
Static
20M
0.0024080.1 strain/s 0.002462
DIF for Yield Strain 1 .0 2
0.2 strain/s 0.002837DIF for Yield Strain 1 .1 8
A verage Yield Strain at Increased Strain Rate 0 .002650
Static25M
0.0024480.1 strain/s 0.003163
DIF for Yield Strain 1 .2 9
69
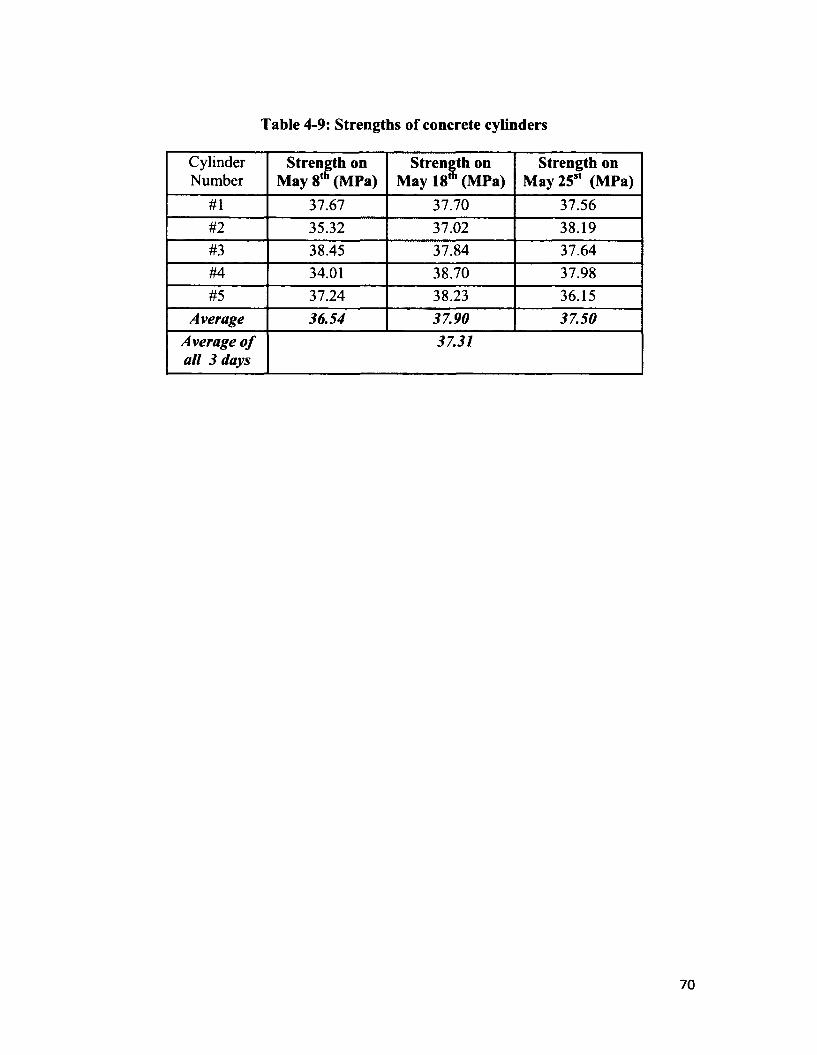
Table 4-9: Strengths of concrete cylinders
CylinderNumber
Strength on May 8th (MPa)
Strength on May 18S (MPa)
Strength on May 25st (MPa)
#1 37.67 37.70 37.56#2 35.32 37.02 38.19#3 38.45 37.84 37.64#4 34.01 38.70 37.98#5 37.24 38.23 36.15
Average 36.54 37.90 37.50Average o f all 3 days
37.31
70
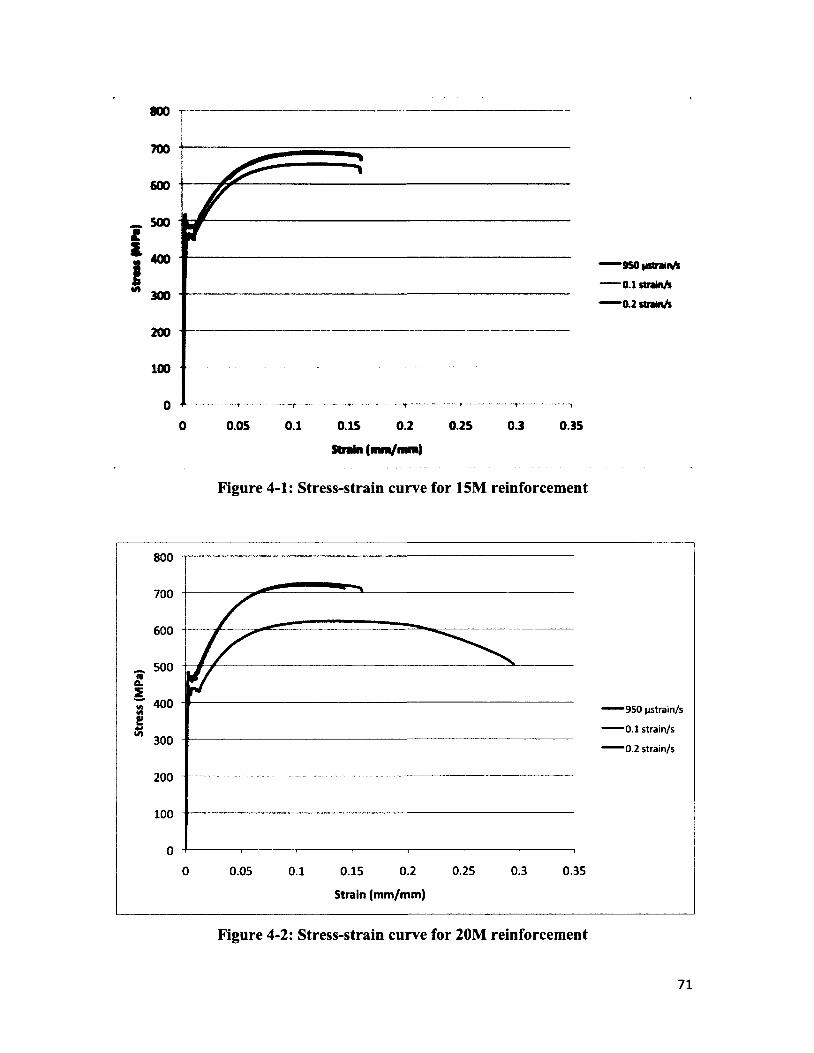
800
700
600
_ soo Ii 400
300
200
100
0.2 0.2S 0.3 0.350 0.05 0.1 0.15
S train (m m /m m )
Figure 4-1: Stress-strain curve for 15M reinforcement
800
700
600
500
400
300
200
100
00.2 0.25 0.3 0.350 0.05 0.1 0.15
Strain (mm/mm)
Figure 4-2: Stress-strain curve for 20M reinforcement
950 ystrainA
O.lrtralnA
0.2 ctraMt/i
950 (istrain/s
0.1 strain/s
0.2 strain/s
71
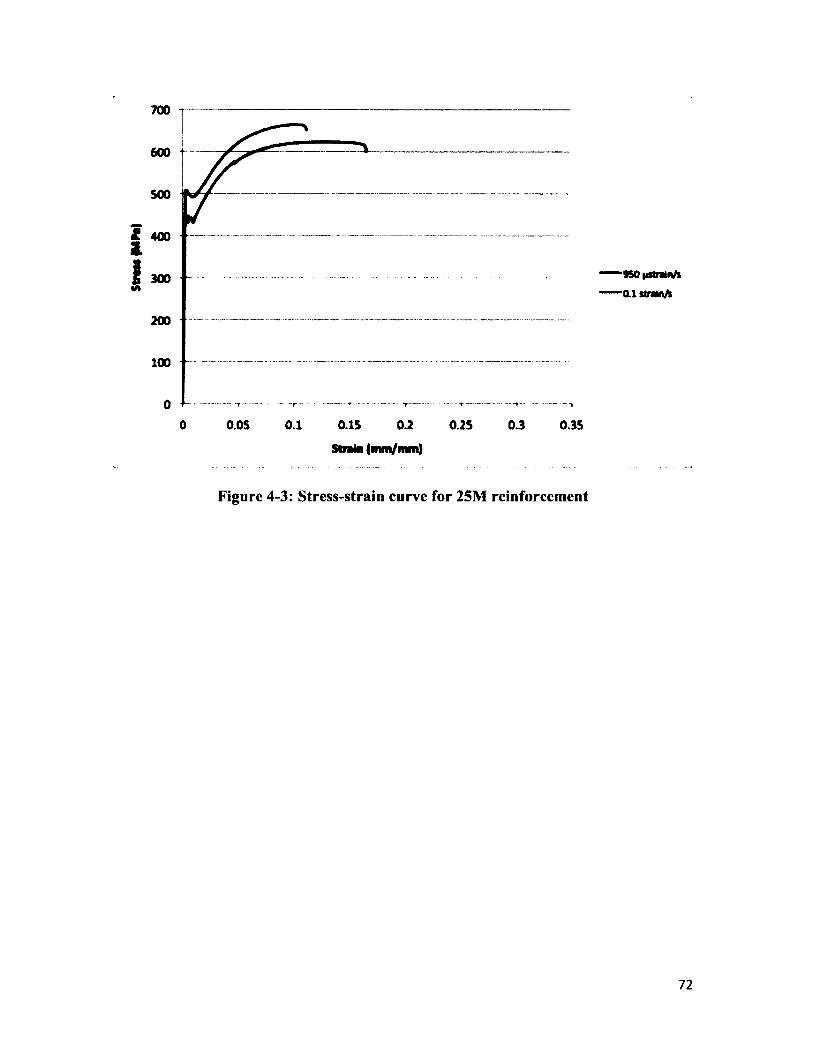
Straw
|M
N|
700
600
500
400
300
200
100
00 0.0S 0.1 0.15 0.2 0.25 0.3 0.35
Strata (mm/mm)
Figure 4-3: Stress-strain curve for 25M reinforcement
950 itftrali^k
Q-lstrMnA
72
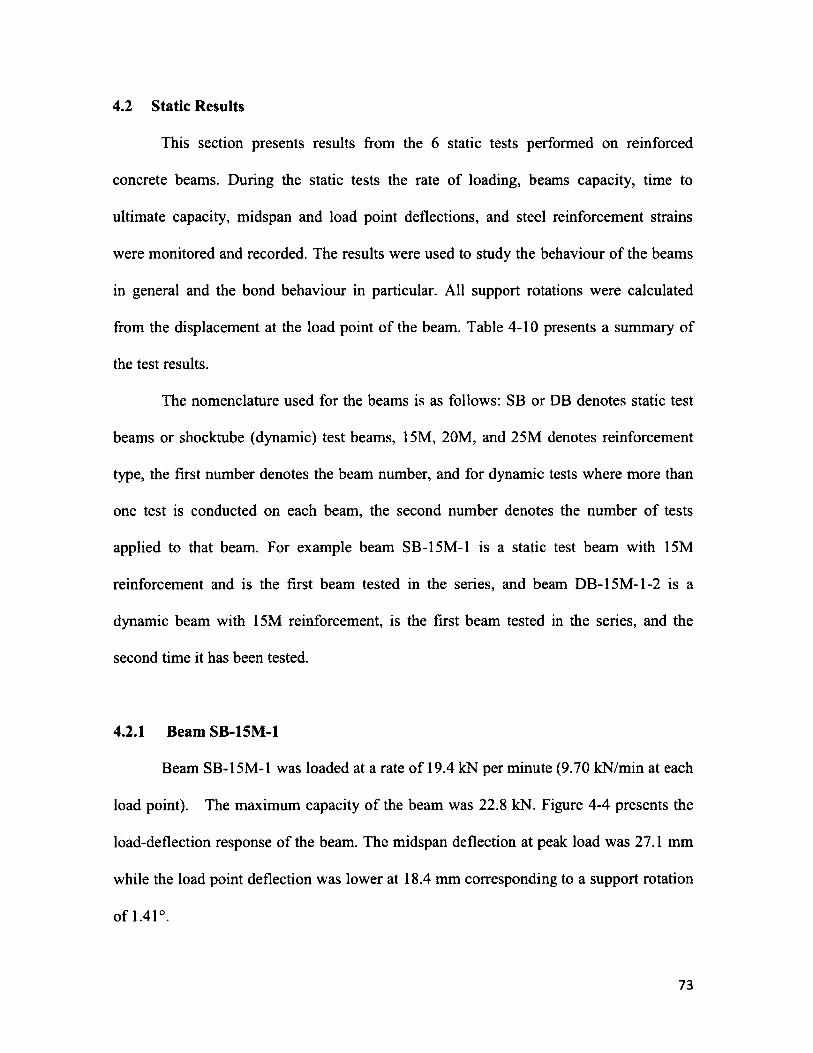
4.2 Static Results
This section presents results from the 6 static tests performed on reinforced
concrete beams. During the static tests the rate of loading, beams capacity, time to
ultimate capacity, midspan and load point deflections, and steel reinforcement strains
were monitored and recorded. The results were used to study the behaviour o f the beams
in general and the bond behaviour in particular. All support rotations were calculated
from the displacement at the load point o f the beam. Table 4-10 presents a summary o f
the test results.
The nomenclature used for the beams is as follows: SB or DB denotes static test
beams or shocktube (dynamic) test beams, 15M, 20M, and 25M denotes reinforcement
type, the first number denotes the beam number, and for dynamic tests where more than
one test is conducted on each beam, the second number denotes the number o f tests
applied to that beam. For example beam SB-15M-1 is a static test beam with 15M
reinforcement and is the first beam tested in the series, and beam DB-15M-1-2 is a
dynamic beam with 15M reinforcement, is the first beam tested in the series, and the
second time it has been tested.
4.2.1 Beam SB-15M-1
Beam SB-15M-1 was loaded at a rate o f 19.4 kN per minute (9.70 kN/min at each
load point). The maximum capacity o f the beam was 22.8 kN. Figure 4-4 presents the
load-deflection response o f the beam. The midspan deflection at peak load was 27.1 mm
while the load point deflection was lower at 18.4 mm corresponding to a support rotation
o f 1.41°.
73
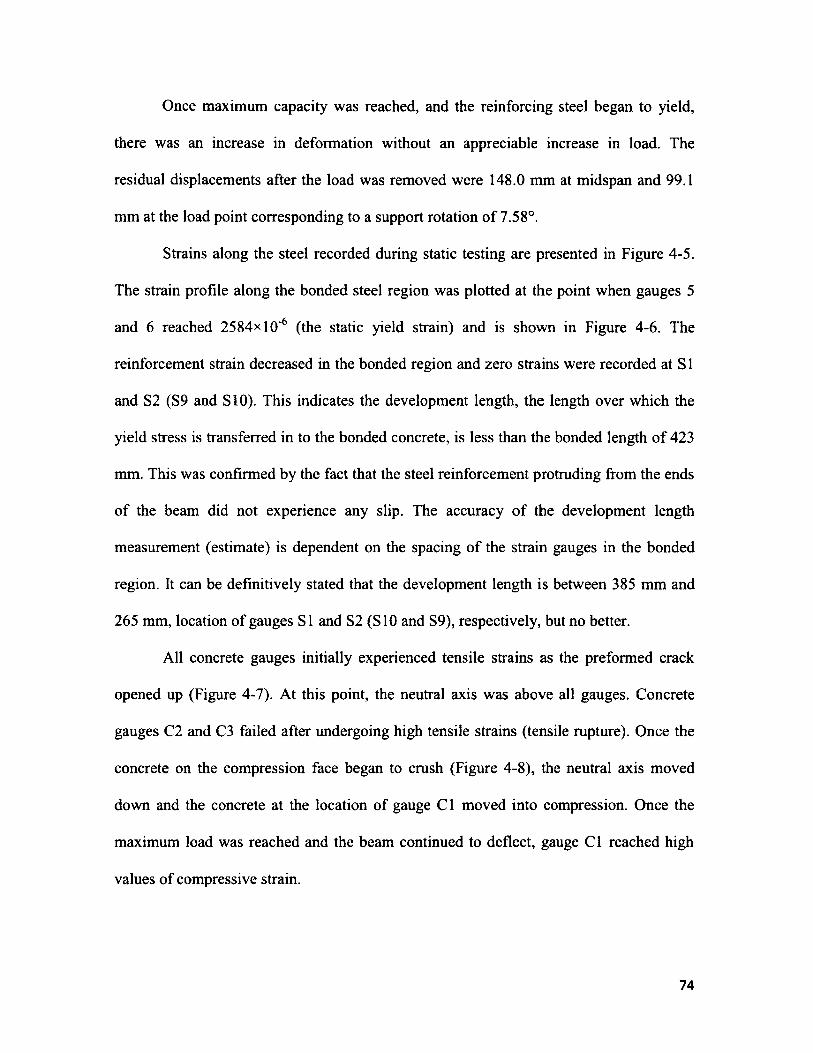
Once maximum capacity was reached, and the reinforcing steel began to yield,
there was an increase in deformation without an appreciable increase in load. The
residual displacements after the load was removed were 148.0 mm at midspan and 99.1
mm at the load point corresponding to a support rotation o f 7.58°.
Strains along the steel recorded during static testing are presented in Figure 4-5.
The strain profile along the bonded steel region was plotted at the point when gauges 5
and 6 reached 2584x10‘6 (the static yield strain) and is shown in Figure 4-6. The
reinforcement strain decreased in the bonded region and zero strains were recorded at SI
and S2 (S9 and S10). This indicates the development length, the length over which the
yield stress is transferred in to the bonded concrete, is less than the bonded length o f 423
mm. This was confirmed by the fact that the steel reinforcement protruding from the ends
o f the beam did not experience any slip. The accuracy o f the development length
measurement (estimate) is dependent on the spacing o f the strain gauges in the bonded
region. It can be definitively stated that the development length is between 385 mm and
265 mm, location o f gauges SI and S2 (S10 and S9), respectively, but no better.
All concrete gauges initially experienced tensile strains as the preformed crack
opened up (Figure 4-7). At this point, the neutral axis was above all gauges. Concrete
gauges C2 and C3 failed after undergoing high tensile strains (tensile rupture). Once the
concrete on the compression face began to crush (Figure 4-8), the neutral axis moved
down and the concrete at the location of gauge C l moved into compression. Once the
maximum load was reached and the beam continued to deflect, gauge C l reached high
values o f compressive strain.
74
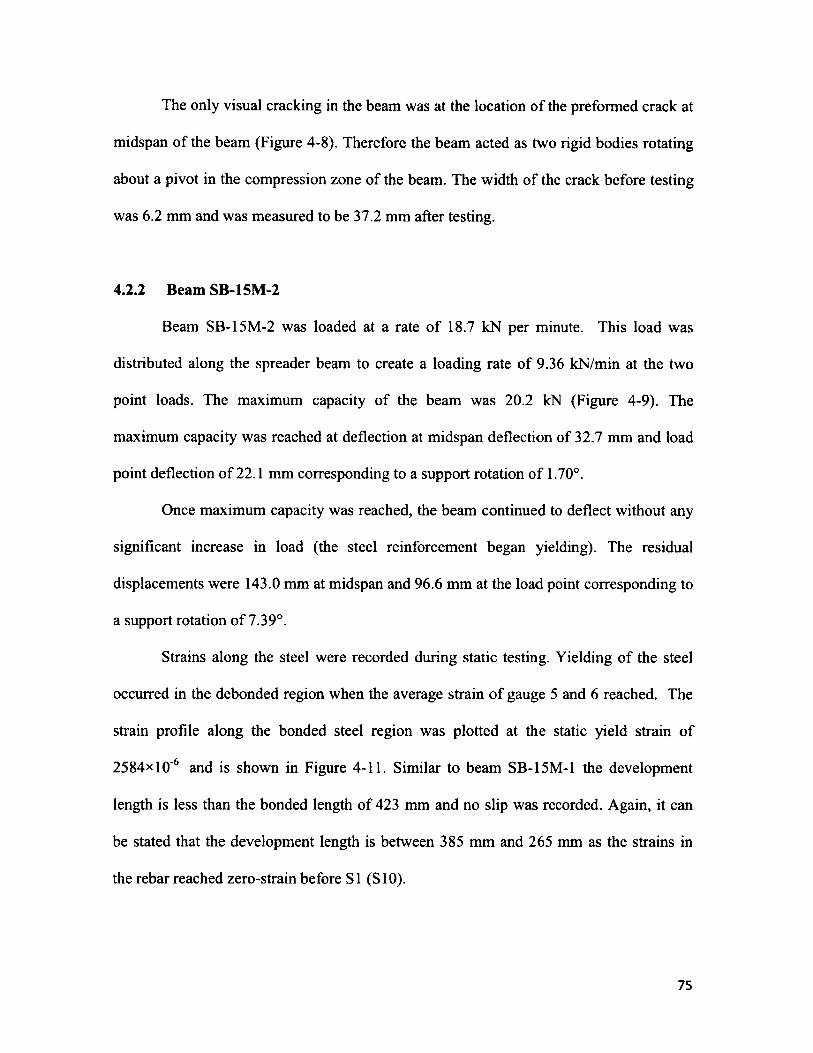
The only visual cracking in the beam was at the location o f the preformed crack at
midspan of the beam (Figure 4-8). Therefore the beam acted as two rigid bodies rotating
about a pivot in the compression zone of the beam. The width o f the crack before testing
was 6.2 mm and was measured to be 37.2 mm after testing.
4.2.2 Beam SB-15M-2
Beam SB-15M-2 was loaded at a rate o f 18.7 kN per minute. This load was
distributed along the spreader beam to create a loading rate o f 9.36 kN/min at the two
point loads. The maximum capacity o f the beam was 20.2 kN (Figure 4-9). The
maximum capacity was reached at deflection at midspan deflection of 32.7 mm and load
point deflection of 22.1 mm corresponding to a support rotation o f 1.70°.
Once maximum capacity was reached, the beam continued to deflect without any
significant increase in load (the steel reinforcement began yielding). The residual
displacements were 143.0 mm at midspan and 96.6 mm at the load point corresponding to
a support rotation o f 7.39°.
Strains along the steel were recorded during static testing. Yielding of the steel
occurred in the debonded region when the average strain o f gauge 5 and 6 reached. The
strain profile along the bonded steel region was plotted at the static yield strain o f
2584x1 O'6 and is shown in Figure 4-11. Similar to beam SB-15M-1 the development
length is less than the bonded length of 423 mm and no slip was recorded. Again, it can
be stated that the development length is between 385 mm and 265 mm as the strains in
the rebar reached zero-strain before SI (S10).
75
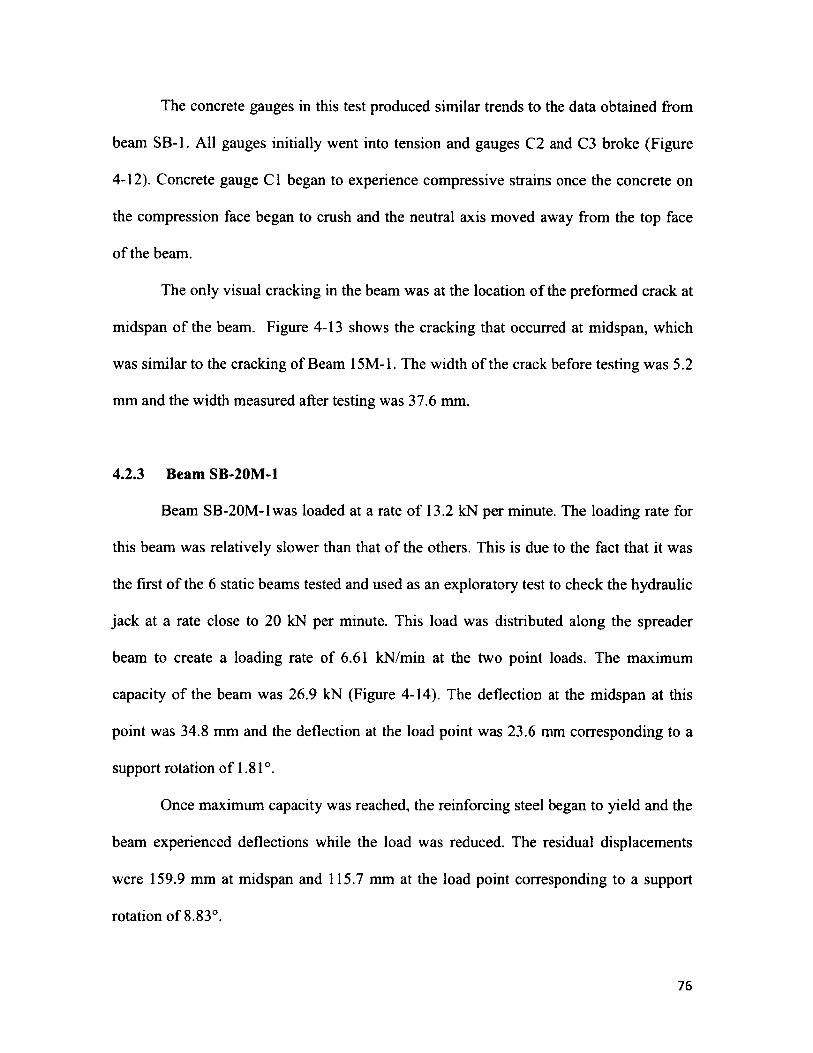
The concrete gauges in this test produced similar trends to the data obtained from
beam SB-1. All gauges initially went into tension and gauges C2 and C3 broke (Figure
4-12). Concrete gauge C l began to experience compressive strains once the concrete on
the compression face began to crush and the neutral axis moved away from the top face
o f the beam.
The only visual cracking in the beam was at the location of the preformed crack at
midspan o f the beam. Figure 4-13 shows the cracking that occurred at midspan, which
was similar to the cracking of Beam 15M-1. The width o f the crack before testing was 5.2
mm and the width measured after testing was 37.6 mm.
4.2.3 Beam SB-20M-1
Beam SB-20M-lwas loaded at a rate o f 13.2 kN per minute. The loading rate for
this beam was relatively slower than that o f the others. This is due to the fact that it was
the first o f the 6 static beams tested and used as an exploratory test to check the hydraulic
jack at a rate close to 20 kN per minute. This load was distributed along the spreader
beam to create a loading rate of 6.61 kN/min at the two point loads. The maximum
capacity o f the beam was 26.9 kN (Figure 4-14). The deflection at the midspan at this
point was 34.8 mm and the deflection at the load point was 23.6 mm corresponding to a
support rotation o f 1.81°.
Once maximum capacity was reached, the reinforcing steel began to yield and the
beam experienced deflections while the load was reduced. The residual displacements
were 159.9 mm at midspan and 115.7 mm at the load point corresponding to a support
rotation o f 8.83°.
76
Strains along the 20M reinforcement were recorded and shown in Figure 4-15.
Strain gauge 6 malfunctioned and is therefore not shown in Figure 4-15. The strain
profile along the bonded steel region was plotted at the point where the strain in
debonded region reached 2408x1 O'6 (the yield strain) and is shown in Figure 4-16. The
reinforcement strain decreased in the bonded region and zero strains were recorded at
gauges furthest from the debonded region. This indicates the development length is less
than the bonded length o f 523 mm. No slip was recorded. Due to the strain gauge
spacing, it can be concluded that the development length is between 500 mm and 340
mm.
Before the beam was dropped in the laboratory. While not much damage was
observed, all concrete gauges were damaged. As a result, no concrete strains were
recorded.
Similar to the beams containing 15M rebar, the only visual cracking was at
midspan of the beam. Figure 4-17 shows the cracking that occurred at midspan and how
the beam behaved as two rigid bodies. The width o f the crack before testing was 3.9 mm
and the width measured after testing was 47.2 mm.
4.2.4 Beam SB-20M-2
Beam SB-20M-2 was loaded at a rate o f 18.7 kN per minute. This load was
distributed along the spreader beam to create a loading rate o f 9.35 kN/min at the two
point loads. The maximum capacity o f the beam was 28.0 kN (Figure 4-18). The
deflection at the midspan at this point was 38.0 mm and the deflection at the load point
was 28.3 mm corresponding to a support rotation o f 2.18°.
77
Once the beam reached its maximum capacity, the reinforcing steel began to yield
and the beam continued to deflect while the load reduced. The residual displacements
when the load was removed were 114.9 mm at midspan and 85.4 mm at the load point
corresponding to a support rotation o f 6.54°.
Strains along the 20M reinforcement were also recorded and shown in Figure
4-19. No signal was received from strain gauges 6 and 10 during testing and they are
therefore not shown in Figure 4-19. Yielding as with the other beams was initiated in the
debonded region at strain gauge 5. Consequently, the highest strain readings were
recorded in the debonded region where gauge 5 is located. However, during testing o f
beam SB-4, the gauges in the bonded region adjacent to the debonded region (gauges 4
and 7) had the highest readings. This could be due to the fact that gauge 5 was not
properly bonded to the steel or zeroed before testing. The time o f yield in this beam was
therefore assumed to take place when strain gauge 4 and 7 reached an average strain
equal to that o f the yield strain o f 20M reinforcement. Yielding of the steel occurred
when the average strain in gauge 4 and 7 was 2010x1 O'6. The strain profile along the
bonded steel region was plotted at this point and is shown in Figure 4-20. Similar to beam
SB-20M-1 the development length is less than the bonded length o f 523 mm and no slip
was recorded. Again, the development length is between 500 mm and 340 mm.
Concrete strains behaved similarly to tests on beam SB-15M-1 and SB-15M-2.
All gauges initially go into tension. The tensile strain in gauge C l begins to reduce and
become compressive strain as the concrete on the compression face begins to crush
(Figure 4-21).
78
The beam behaved as two rigid bodies and the only visual cracking in the beam
occurred at midspan as depicted in Figure 4-22. The width of the crack before testing was
20.32 mm and the width o f the crack after testing was 35.05 mm.
4.2.5 Beam SB-25M-1
Beam SB-25M-1 was loaded at a rate o f 20.2 kN per minute. This load was
distributed along the spreader beam to create a loading rate o f 10.1 kN/min at the two
point loads. The maximum capacity o f the beam was 47.0 kN (Figure 4-23). The
deflection at the midspan at this point was 46.5 mm and the deflection at the load point
was 35.6 mm corresponding to a support rotation of 2.74°.
Once maximum capacity was reached, the reinforcing steel began to yield and the
beam experienced deflections while the load decreased. The residual displacements were
81.5 mm at midspan and 62.9 mm at the load point corresponding to a support rotation of
4.83°.
Strains along the 25M reinforcement were also recorded and shown in Figure
4-24. Strain gauge 7 was the only gauge not working in this test and is therefore not
shown in Figure 4-24. The strain profile along the bonded steel region was plotted at the
point where the debonded steel reached its yield strain (2448x1 O'6) in gauges 5 and 6 and
is shown in Figure 4-25. The reinforcement strain decreased in the bonded region and
zero strains were recorded at gauges furthest from the debonded region. This indicates the
development length is less than the bonded length o f 830 mm. No slip was recorded. Due
to the strain gauge spacing, it can be concluded that the development length is between
805 mm and 545 mm.
79
Concrete gauges C2 and C3 initially experienced tensile strains, while gauge C 1
initially experienced compressive strains. This indicates that the neutral axis is above
gauges C2 and C3 but below gauge C 1. Once the preformed crack continued to open and
crushing of concrete on the compression face took place, the neutral axis moved down
and gauge C2 began to experience compressive strains while gauge C3 broke (Figure
4-26).
Unlike the others beams that were tested under static loading, the beam containing
25M rebar had flexural cracking along its span. Figure 4-27 shows the cracking that
occurred along the beam’s length. Although cracking did occur in areas other than
midspan, the majority o f cracking still occurred at midspan. The width o f the crack before
testing was 5.13 mm and the width measured after testing was 23.8 mm.
4.2.6 Beam SB-25M-2
Beam SB-25M-2 had 25M longitudinal reinforcement and was loaded at a rate o f
18.7 kN per minute. This load was distributed along the spreader beam to create a loading
rate o f 9.34 kN/min at the two point loads. The maximum capacity of the beam was 49.4
kN (Figure 4-28). The deflection at the midspan at this point was 29.1 mm and the
deflection at the load point was 23.7 mm corresponding to a support rotation o f 1.82°.
Once the beam reached its maximum capacity, the reinforcing steel began to yield
and the beam continues to deflect without any increase in load. The residual
displacements were 51.41 mm at midspan and 41.39 mm at the load point corresponding
to a support rotation of 3.18°.
80
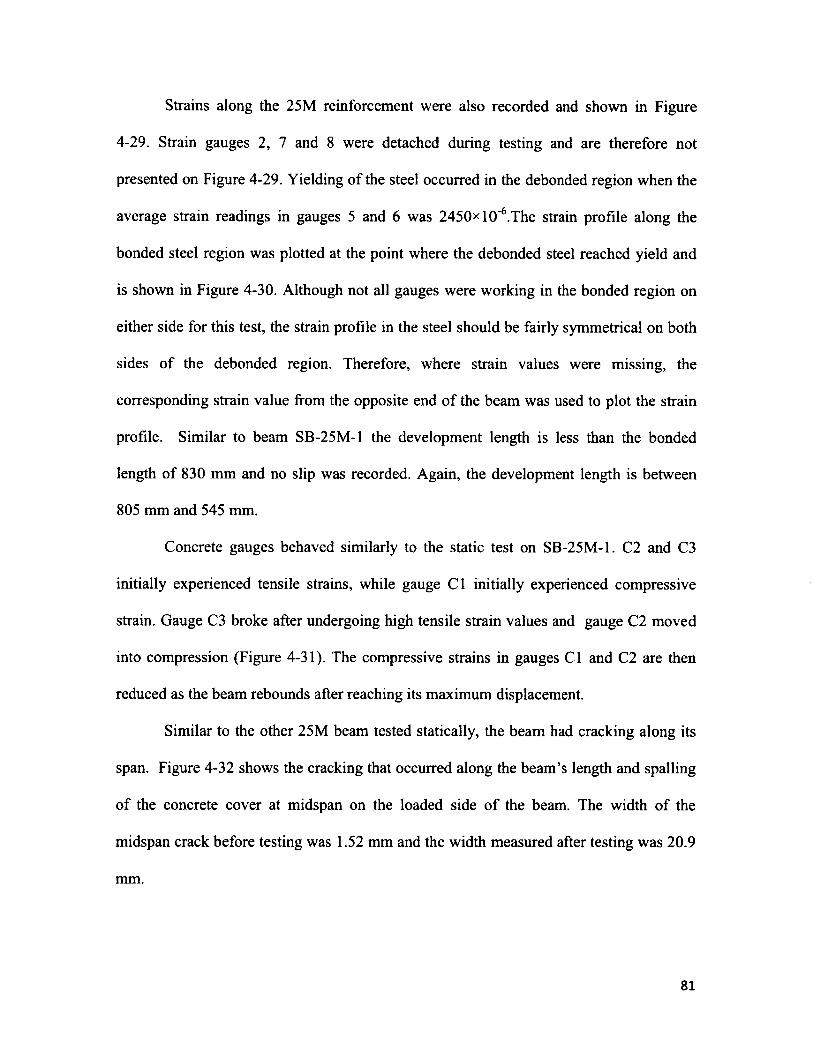
Strains along the 25 M reinforcement were also recorded and shown in Figure
4-29. Strain gauges 2, 7 and 8 were detached during testing and are therefore not
presented on Figure 4-29. Yielding of the steel occurred in the debonded region when the
average strain readings in gauges 5 and 6 was 2450x10‘6.The strain profile along the
bonded steel region was plotted at the point where the debonded steel reached yield and
is shown in Figure 4-30. Although not all gauges were working in the bonded region on
either side for this test, the strain profile in the steel should be fairly symmetrical on both
sides o f the debonded region. Therefore, where strain values were missing, the
corresponding strain value from the opposite end o f the beam was used to plot the strain
profile. Similar to beam SB-25M-1 the development length is less than the bonded
length o f 830 mm and no slip was recorded. Again, the development length is between
805 mm and 545 mm.
Concrete gauges behaved similarly to the static test on SB-25M-1. C2 and C3
initially experienced tensile strains, while gauge C l initially experienced compressive
strain. Gauge C3 broke after undergoing high tensile strain values and gauge C2 moved
into compression (Figure 4-31). The compressive strains in gauges C l and C2 are then
reduced as the beam rebounds after reaching its maximum displacement.
Similar to the other 25M beam tested statically, the beam had cracking along its
span. Figure 4-32 shows the cracking that occurred along the beam’s length and spalling
o f the concrete cover at midspan on the loaded side o f the beam. The width o f the
midspan crack before testing was 1.52 mm and the width measured after testing was 20.9
mm.
81
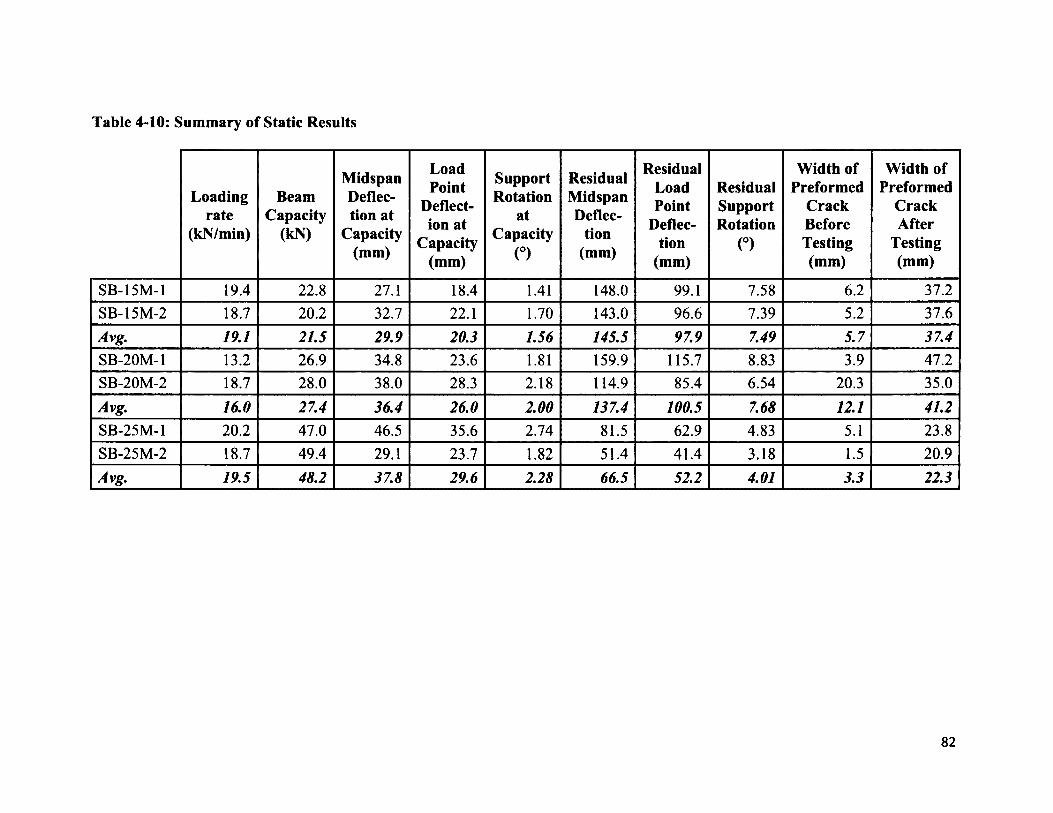
Table 4-10: Summary of Static Results
Loadingrate
(kN/min)
BeamCapacity
(kN)
Midspan Deflection at
Capacity (mm)
Load Point
Deflection at
Capacity (mm)
SupportRotation
atCapacity
(°)
ResidualMidspanDeflec
tion(mm)
ResidualLoadPoint
Deflection
(mm)
ResidualSupportRotation
(°)
Width of Preformed
Crack Before Testing (mm)
Width of Preformed
Crack After
Testing (mm)
SB-15M-1 19.4 22.8 27.1 18.4 1.41 148.0 99.1 7.58 6.2 37.2SB-15M-2 18.7 20.2 32.7 22.1 1.70 143.0 96.6 7.39 5.2 37.6Avg. 19.1 21.5 29.9 20.3 1.56 145.5 97.9 7.49 5.7 37.4SB-20M-1 13.2 26.9 34.8 23.6 1.81 159.9 115.7 8.83 3.9 47.2SB-20M-2 18.7 28.0 38.0 28.3 2.18 114.9 85.4 6.54 20.3 35.0Avg. 16.0 27.4 36.4 26.0 2.00 137.4 100.5 7.68 12.1 41.2SB-25M-1 20.2 47.0 46.5 35.6 2.74 81.5 62.9 4.83 5.1 23.8SB-25M-2 18.7 49.4 29.1 23.7 1.82 51.4 41.4 3.18 1.5 20.9Avg. 19.5 48.2 37.8 29.6 2.28 66.5 52.2 4.01 3.3 22.3
82
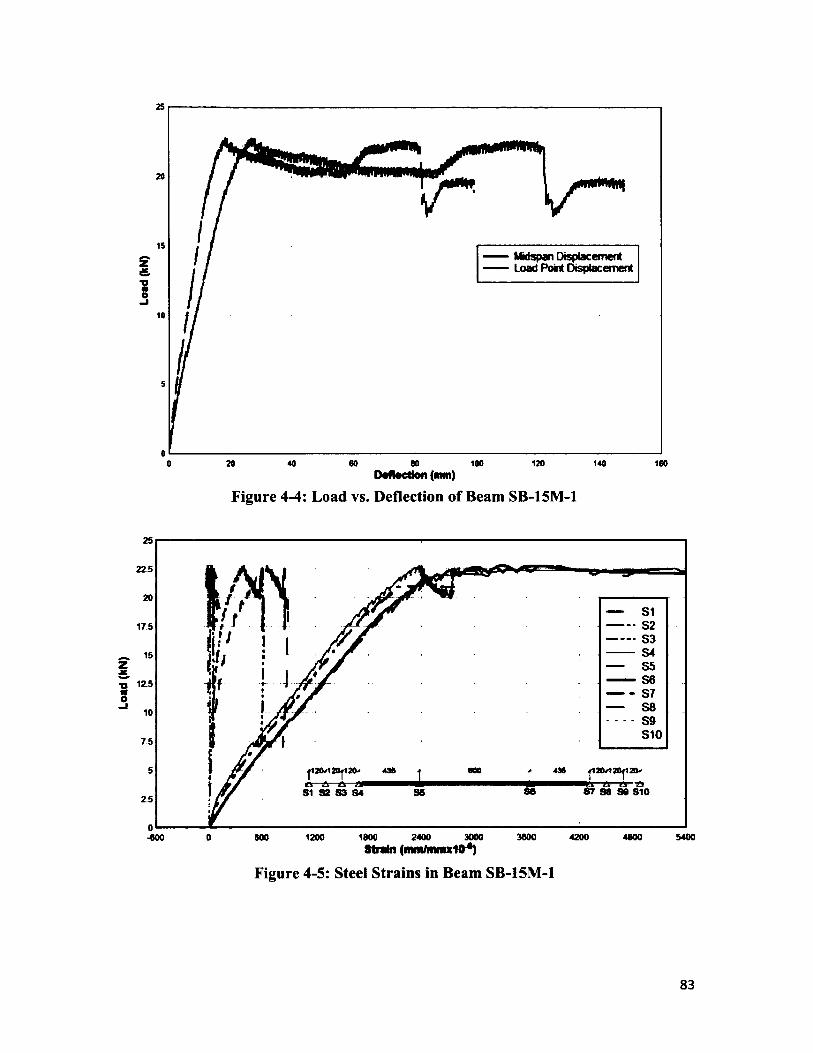
Load
(k
N)2S
20
1S Midspan Displacement Load Point Displacement
10
s
00 20 40 60 80 100 120 140 160
Deflection (mm)
Figure 4-4: Load vs. Deflection of Beam SB-15M-1
22.5
- S2- S3- S4
S5- S6- S7
S8- S9
S10
17.5
75
ji an 201 2(p a • a ^ - jaa 81 82 83 84
43ft 800 43ft
88862.5
1800 3000 3000 4800 54000 600 1200 2400 4200-600Strain (mm/mmxIO*)
Figure 4-5: Steel Strains in Beam SB-15M-I
83
Load
(k
N)3640
2900
c
1j
200 400 000 000 «0M 3400Dtstanca front and of B«am(mm)
Figure 4-6: Strain Profile at Yield in Beam SB-15M-1
25
C2C320
15
CWtcam
10
5
0•12500 -10000 -7500 -5000 -2500 0 2500 5000 7500 10000 12500 15000
Strain (mm/mmxIO-®)
Figure 4-7: Concrete Strains in Beam SB-15M-1
84
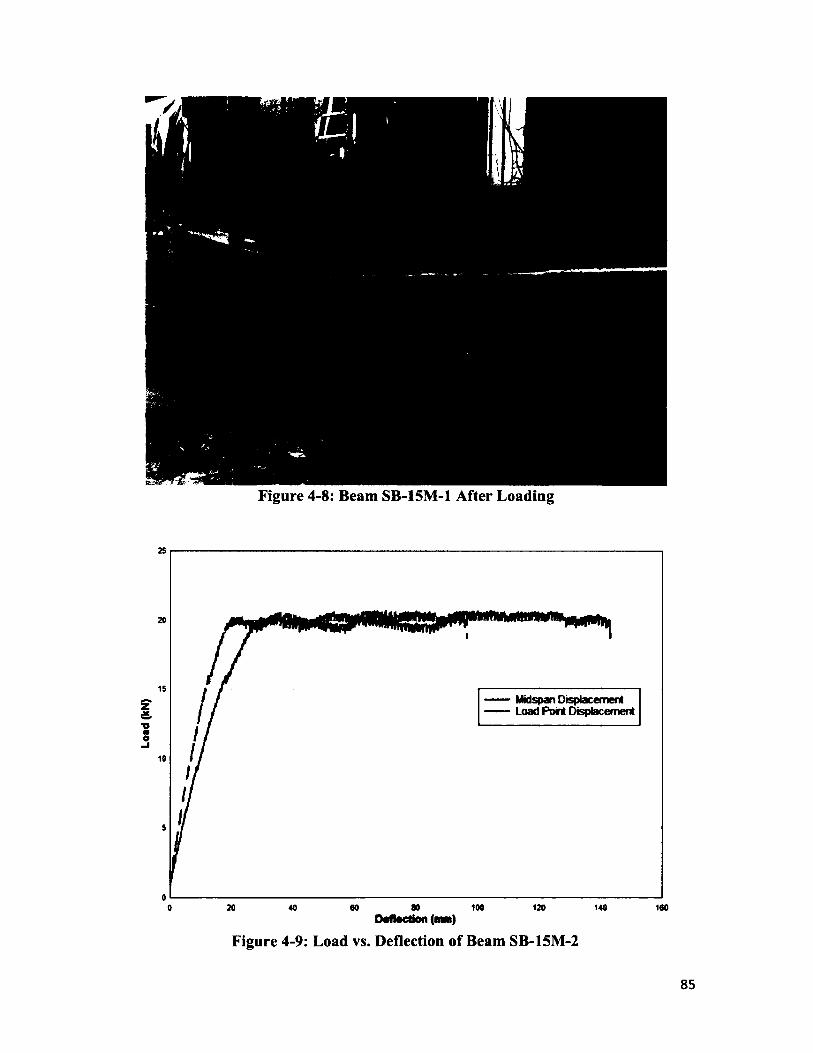
Load
(k
N)
Figure 4-8: Beam SB-15M-1 After Loading
25
20
15Midspan Displacement Load Point Displacement
10
s
020 60 80 100 120 140 1600 40
Deflection (mm)
Figure 4-9: Load vs. Deflection of Beam SB-15M-2
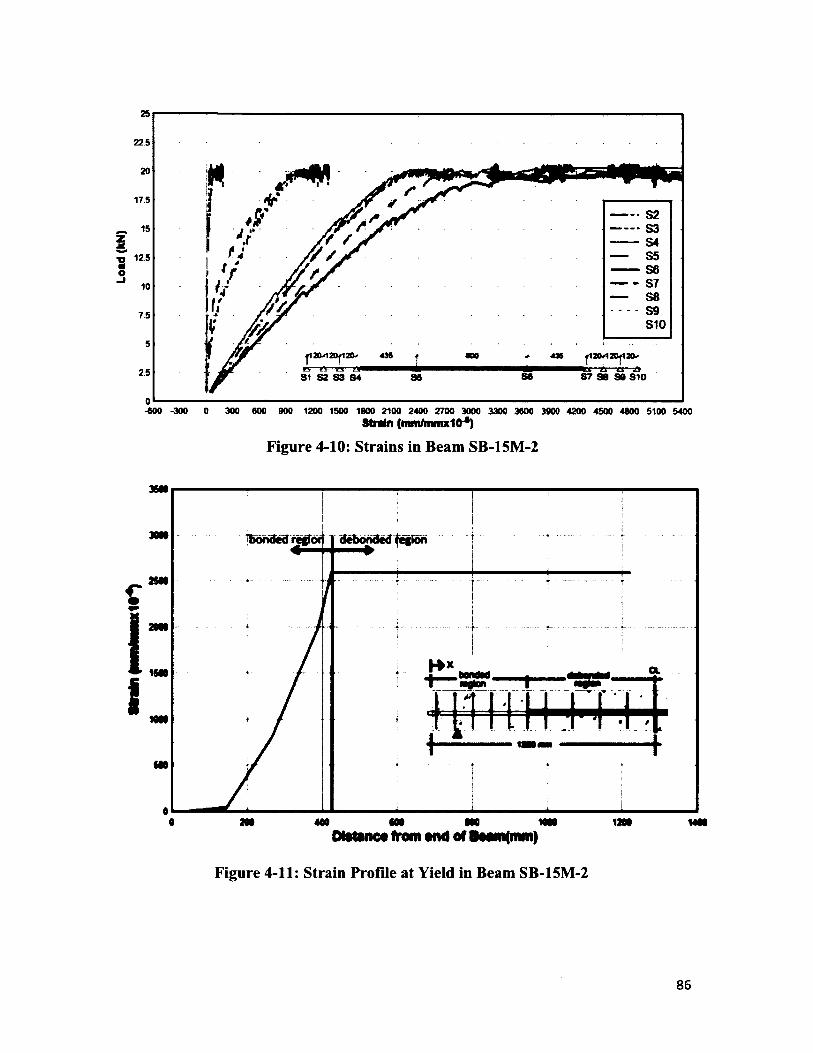
Load
(k
N)
25
225
20
17.5
15
12.5
10
7.5
5
2.5
0
. . . .
-------S2-------S3------ S4---- S5------ S6------ S7---- S8------ S9
S10
|12CM 20 120' 435 + 800 * 4)5 |120 20 120
81 82 S3 84 86 87 8 8 SO 810
-600 -300 0 300 600 900 1200 1500 1800 2100 2400 2700 3000 3300 3600 3900 4200 4500 4800 5100 5400Strain (mm/mmxIO'*)
Figure 4-10: Strains in Beam SB-15M-2
CLMOO .tfgagM,
<00
200 <00 1200Dlattnco from and of 1—w(mm)
Figure 4-11: Strain Profile at Yield in Beam SB-15M-2
86
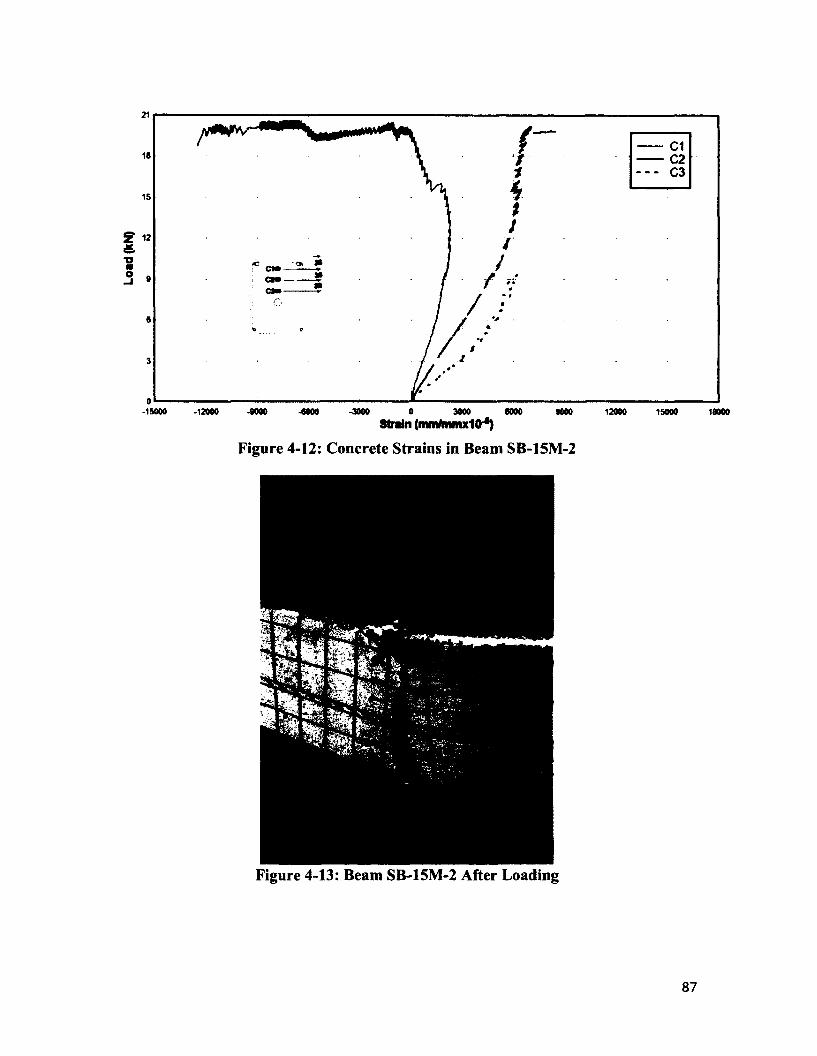
Load
(k
N)
21
C1 C2 C3
18
15
12
CMi
9
6
3
0-15000 -12000 -9000 -6000 -3000 0 3000 6000 9000 12000 15000 16000
Strain (mnWmmxKr*)
Figure 4-12: Concrete Strains in Beam SB-15M-2
Figure 4-13: Beam SB-15M-2 After Loading
87
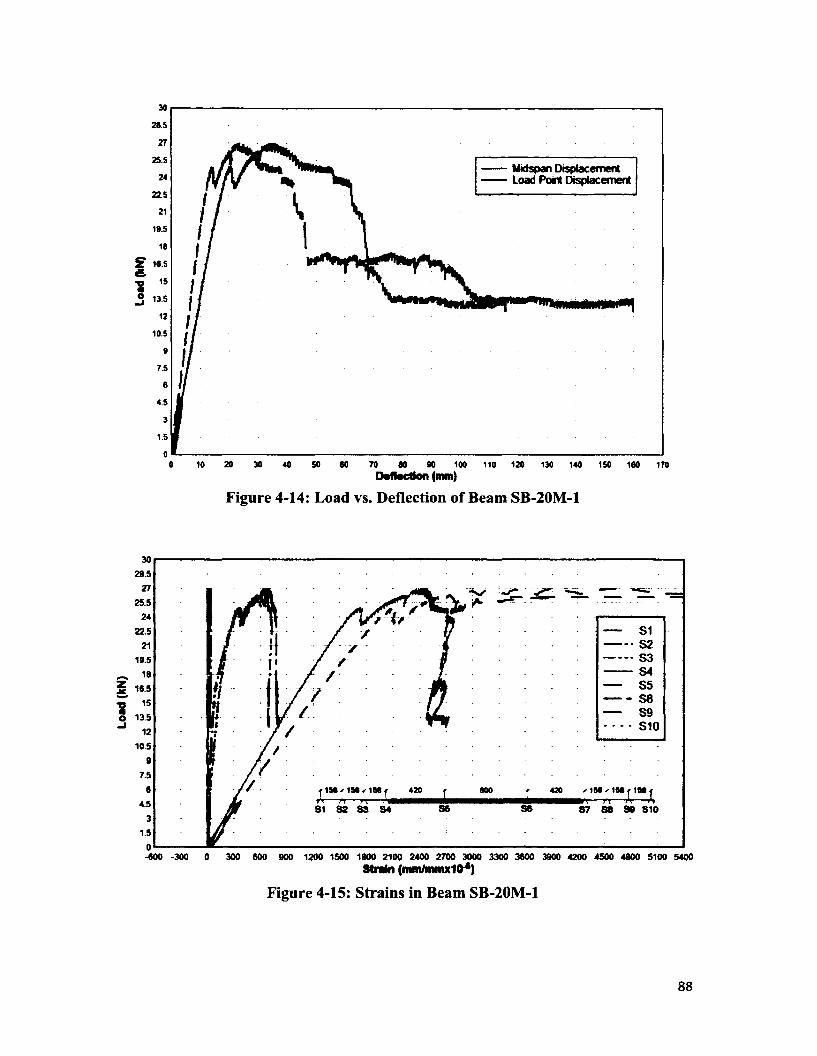
Load
(k
N)
285
25.5Midspan Displacement Load Point Displacement
225
19 5
2 16.5
13.5
10.5
7.5
4 5
1.5
0 20 50 60 70 90 100 110 120 130 140 150 160 17010 30 40 00Deflection (mm)
Figure 4-14: Load vs. Deflection of Beam SB-20M-1
28.5
25.5
525354555859 S10
19.5
16.5
13.5
10.5
7.5156 * 196 ✓ 186 420 000 420 156 ✓ 156 f 196
4 5 3836 3 8 S1037
1.5
-600 -300 0 300 600 900 1200 1500 1800 2100 2400 2700 3000 3300 3600 3900 4200 4500 4800 5100 5400Strain (mm/mmxIO4)
Figure 4-15: Strains in Beam SB-20M-1
88
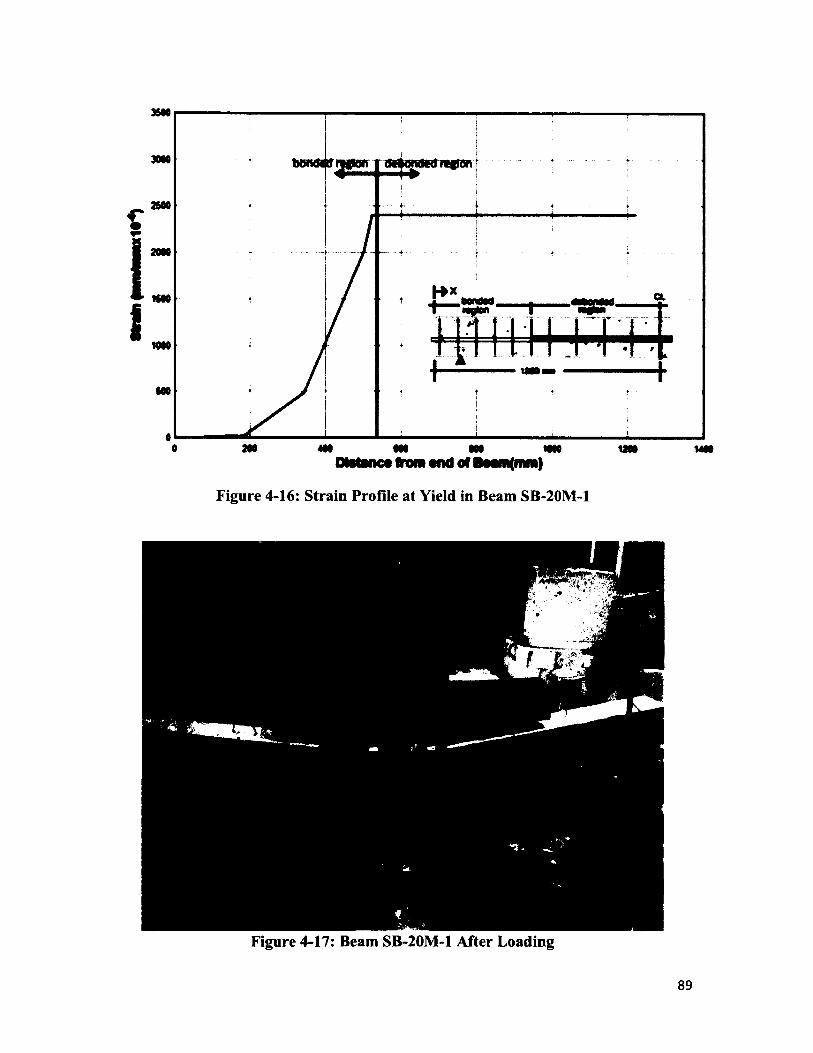
3M0
SON
am
20N
CL
0 MO m ON ON MN U N MNm t tnc* from ond of B om (niiii}
Figure 4-16: Strain Profile at Yield in Beam SB-20M-1
Figure 4-17: Beam SB-20M-1 After Loading
89
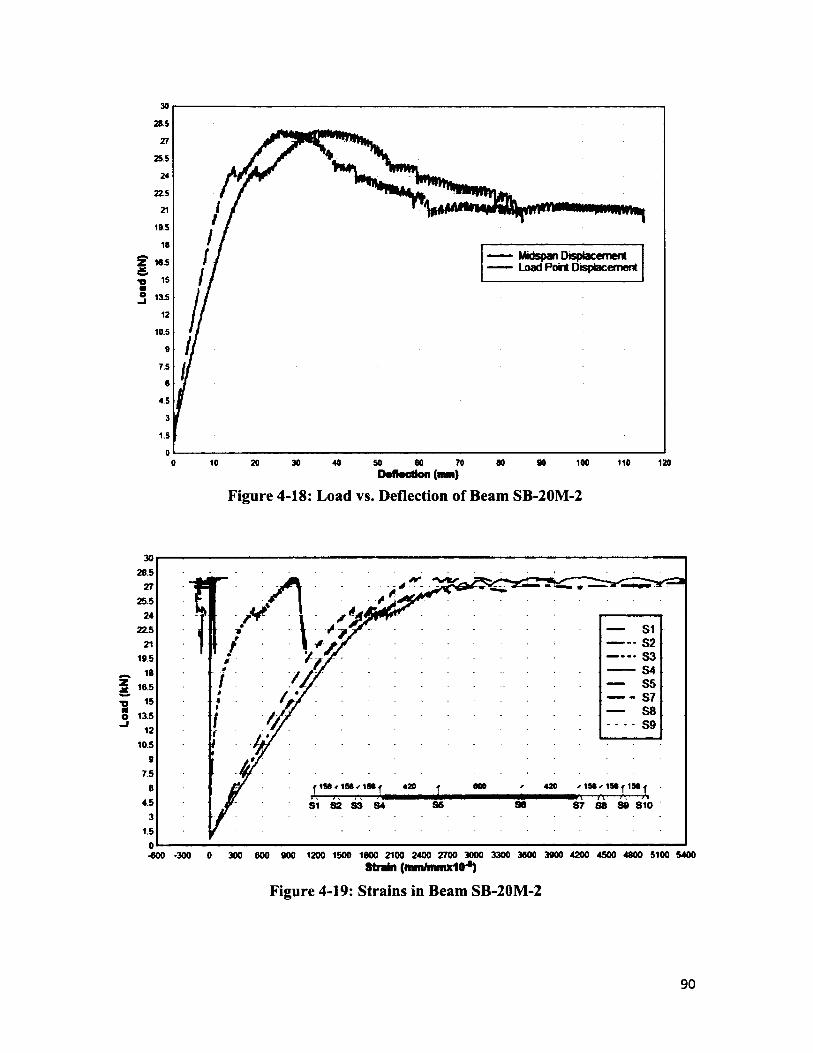
Load
(k
N)
28.5
255
22.5
18.5
Midspan Displacement Load Point DisplacementS' 1<5 *•O «
18.5
7.5
4 5
1.5
20 30 40 50 60 70 80 90 100 110 1200 10Deflection (aim)
Figure 4-18: Load vs. Deflection of Beam SB-20M-2
28.5
25.5
22.552535455575859
19.5
16.5
13.5
10.5
7.5s 1 S 6 '1 S 6 f 156156 * 156 v 156 420420
4.5 sa 87 88 S108 4
1.5
-600 -300 0 300 600 900 1200 1500 1800 2100 2400 2700 3000 3300 3600 3900 4200 4500 4800 5100 5400Strain (mm/nwitxKf*)
Figure 4-19: Strains in Beam SB-20M-2
90
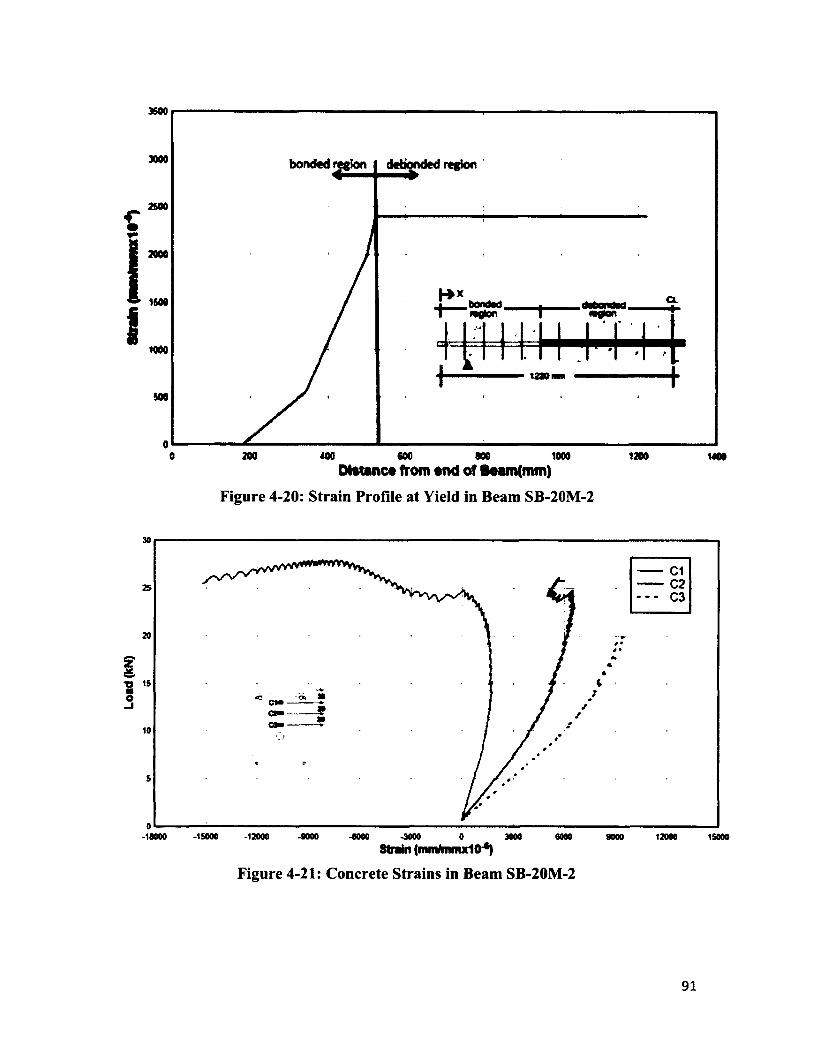
Load
(k
N)
3000 bonded region debonded region '
25004*mV
3000
CL
tOOO
500
300 400 <000 100 1000 1300Distance from end of Beam(mm)
Figure 4-20: Strain Profile at Yield in Beam SB-20M-2
30
20
15
10
cm
cam
-16000 -15000 -12000 -6000 -3000 0 3000Strain (mm/mmxIO4)
6000 9000 12000 15000
Figure 4-21: Concrete Strains in Beam SB-20M-2
91
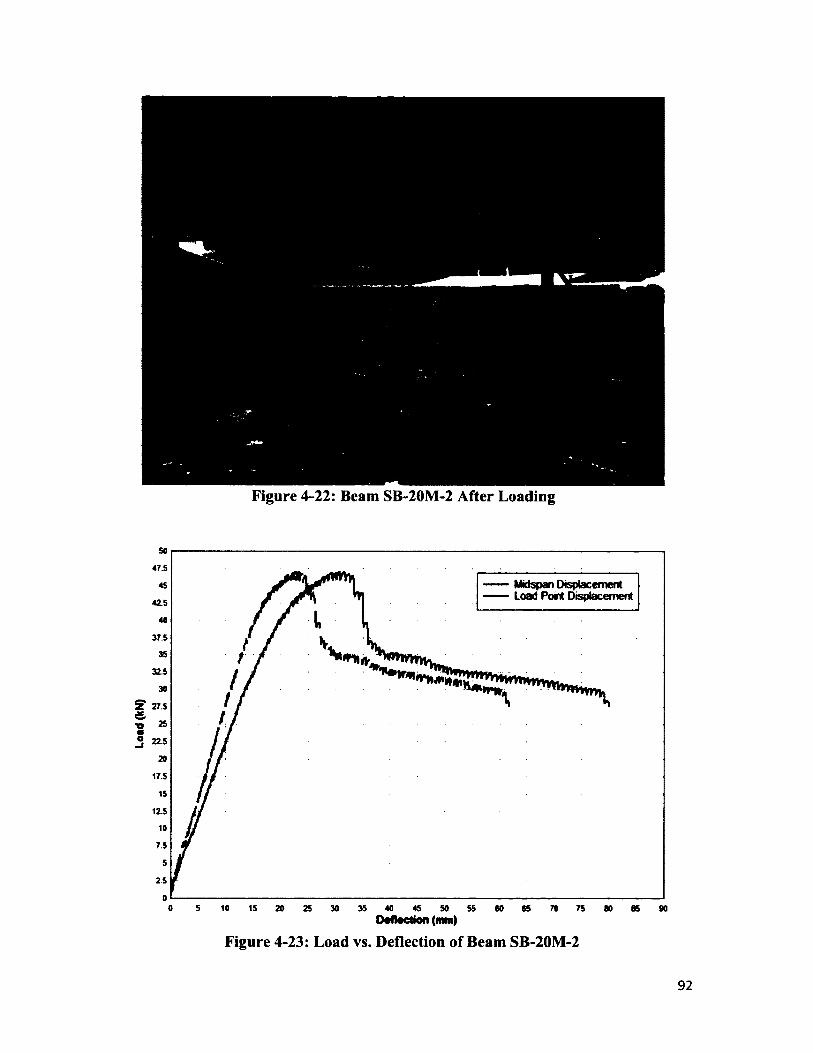
Load
(k
N)
Figure 4-22: Beam SB-20M-2 After Loading
47.5
—— Mdspan Displacement — Load Point Displacement42.5
37.5
32.5
27.5
17.5
12.5
7.5
2.5
0 5 10 15 20 35 40 45 SO25 30 55 60 65 70 75 80 85 90Deflection (mm)
Figure 4-23: Load vs. Deflection of Beam SB-20M-2
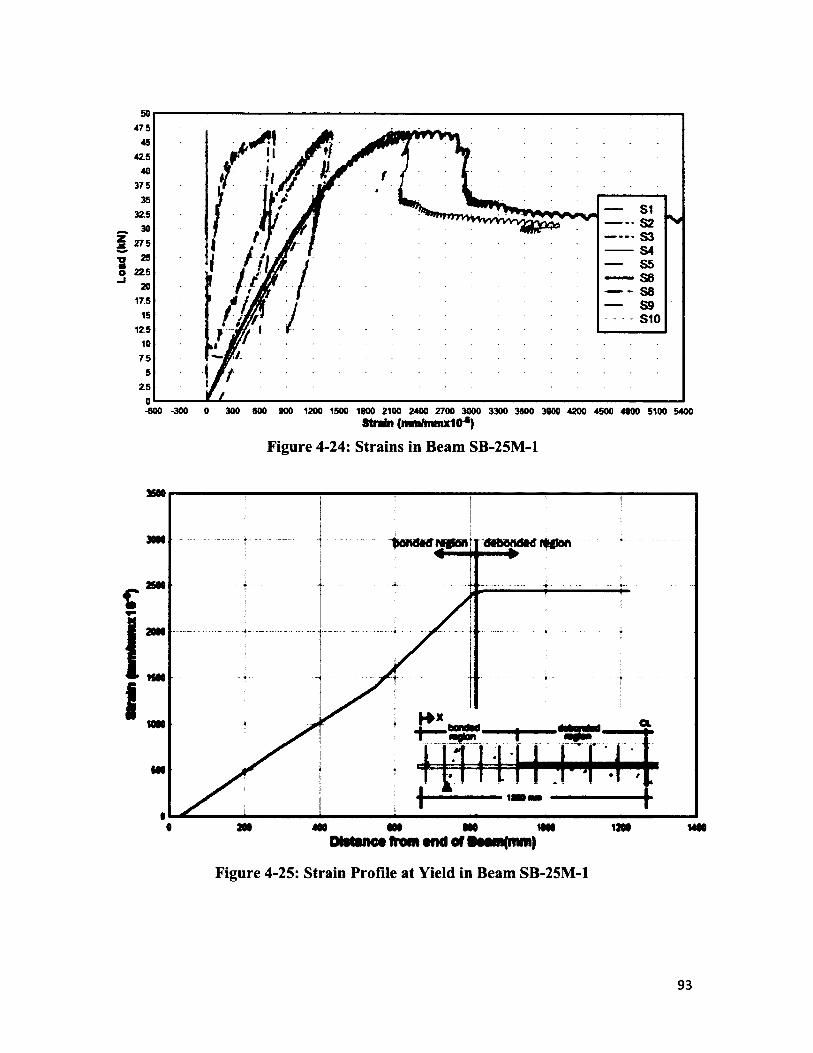
Load
(k
N)
475
42.5
375
• S2- S3- S4
S5- S6- S8
275
225
175
S10
75
25
-600 -300 0 300 800 900 1200 1500 1800 2100 2400 2700 3000 3300 3600 3900 4200 4500 4800 5100 5400Strain (mm/mmxIO4)
Figure 4-24: Strains in Beam SB-25M-1
C
1I
« •wMl 400 •00 MOODtstanc* from tnd of Beem(mm)
Figure 4-25: Strain Profile at Yield in Beam SB-25M-1
93
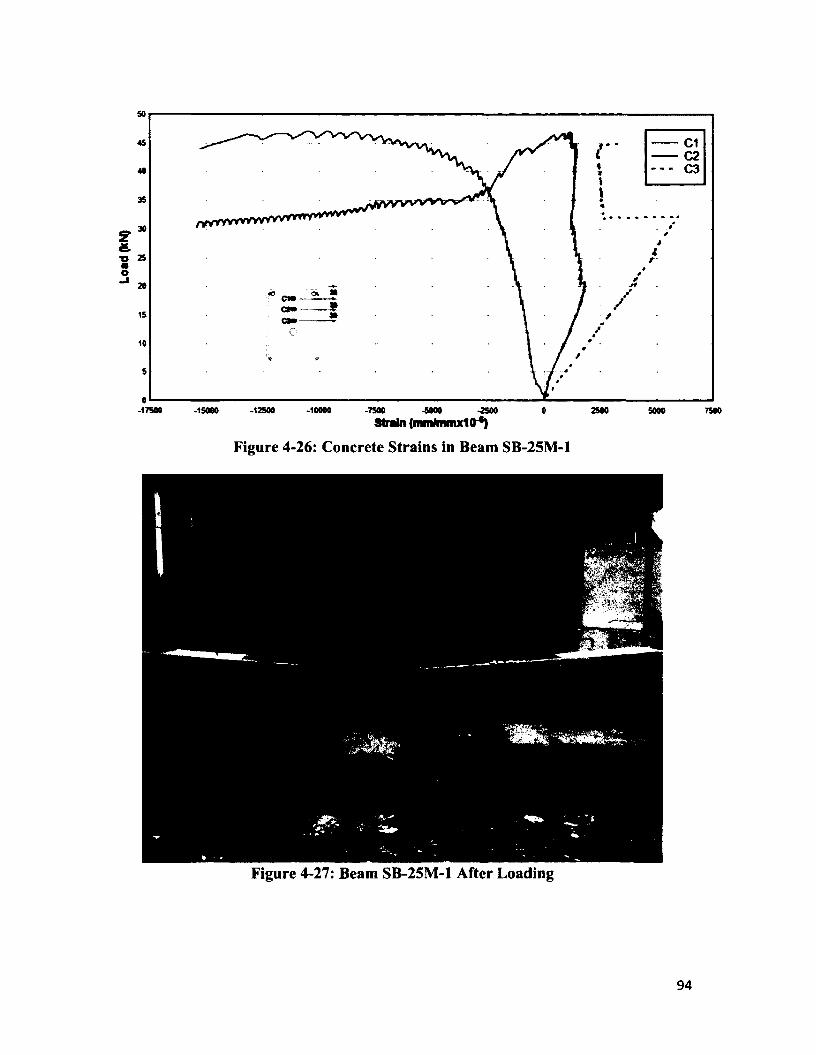
Load
(k
N)so
C1C2C3
45
40
35
30
25
20CW
15
10
S
0-17500 -15000 -12500 -10000 -7500 -5000 -2500 0 2500 5000 7500
Strain (mm/mmx1d~*)
Figure 4-26: Concrete Strains in Beam SB-25M-1
* - *
Figure 4-27: Beam SB-25M-1 After Loading
94
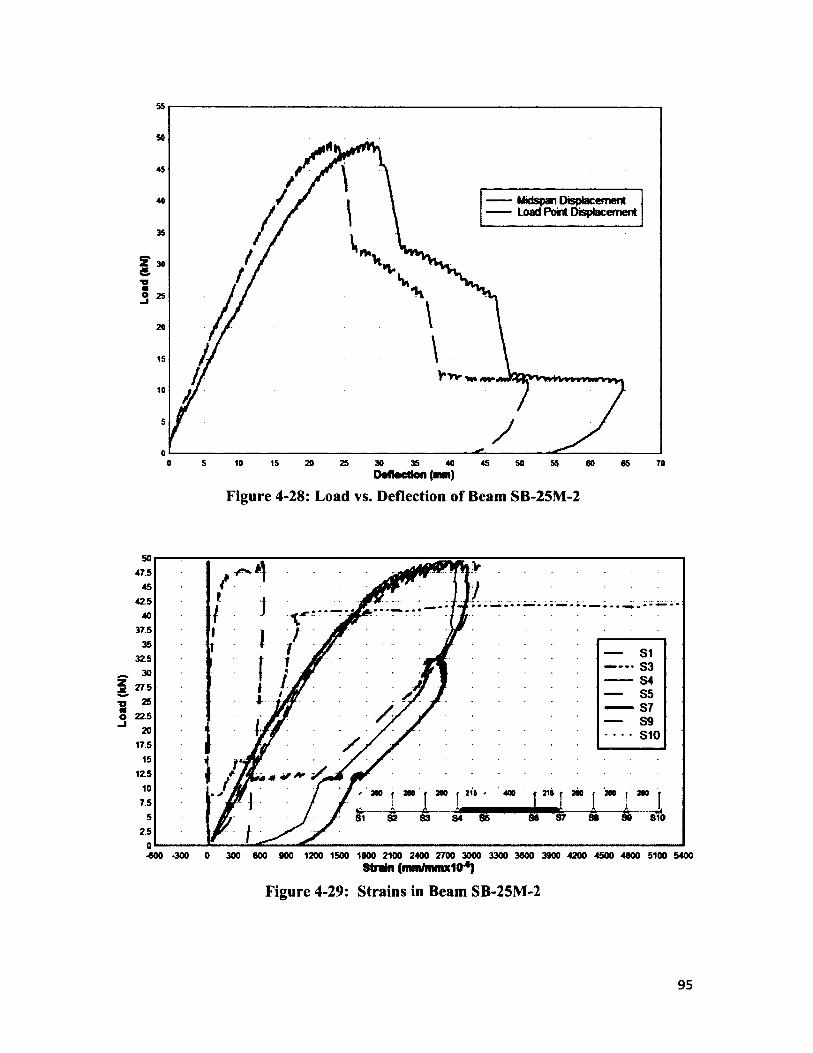
Load
(k
N)
Midspan Displacement Load Point Displacement
2* 30
© 25 • ***
5 30 350 10 15 20 25 40 45 50 55 60 65 70Detection (mm)
Figure 4-28: Load vs. Deflection of Beam SB-25M-2
47545
42.5 40
37.5
32.5535455 S7 S9 S10
27.5
225
17.5
- 260 260 200 216 210 200 260
A--- -S108784
2 5
-600 -300 0 300 600 900 1200 1500 1800 2100 2400 2700 3000 3300 3600 3900 4200 4500 4800 5100 5400Strain (mm/mrnxKT*)
Figure 4-29: Strains in Beam SB-25M-2
95
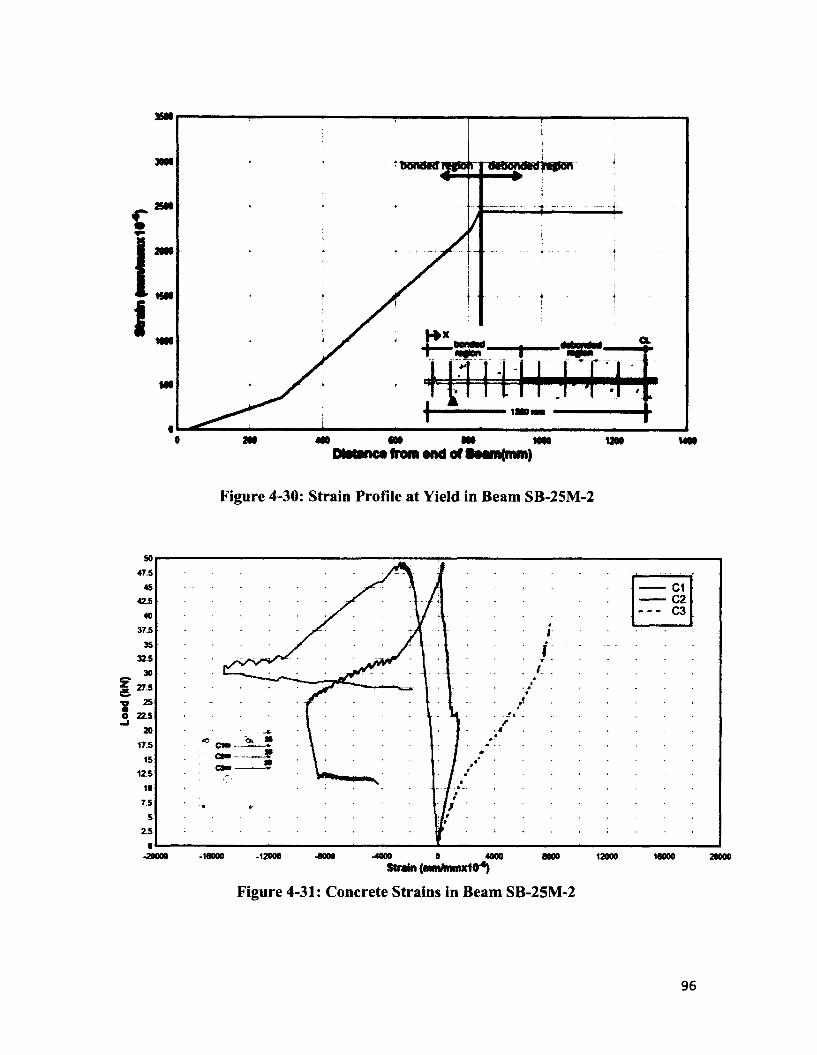
Load
(k
N)£00
f
iiwe
e m 400 000 100 woo MOOPIomwci from wid of l amftnm)
Figure 4-30: Strain Profile at Yield in Beam SB-25M-2
5047.5
4542.5
4037.5
35325
3027.5
2522.5
2017.5
151Z5
10
7.5 5
2.5 0
-20000
cm
-16000 -12000 -4000 0 4000Strain (mmAnrnxKT*)
8000 12000 16000
Figure 4-31: Concrete Strains in Beam SB-25M-2
20000
96
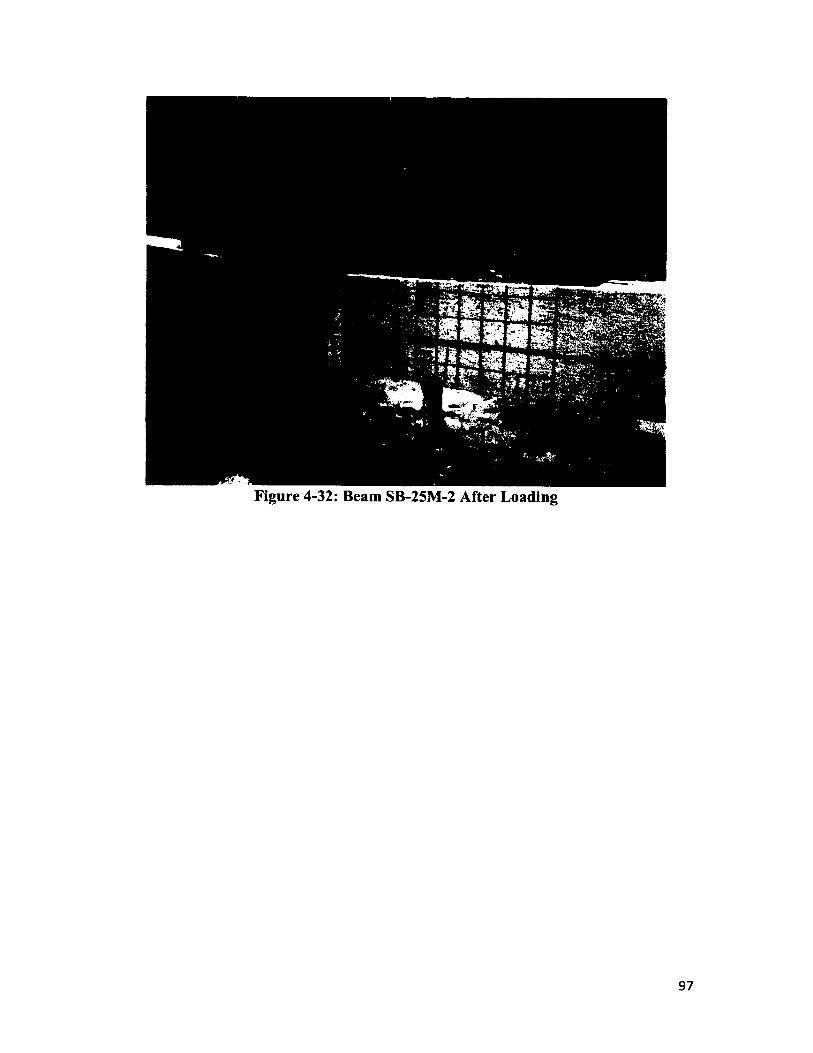
Figure 4-32: Beam SB-25M-2 After Loading
4.3 Dynamic Test Results
All dynamic tests were conducted using the Shock tube at the University o f
Ottawa. A driver length o f 1219 mm was used for all tests, while the driver pressure was
varied between tests. The results o f multiple shots on all 9 beams are discussed in this
chapter. The reflected pressure, reflected impulse, and positive phase duration resulting
from the driver length and driver pressure combination are presented. The maximum
displacements at the load point and midspan o f the beam during testing, the support
rotation at the maximum displacement and initial and final width of the preformed crack
are all discussed. Furthermore, the strains in the reinforcing steel and strains in the
concrete are reported along with explanations for unusual strain readings. All important
data from shock tube tests are reported in Table 4-11, Table 4-12, Table 4-13, and Table
4-14. Finally any visual damage caused to the beam during each test is discussed.
4.3.1 DB-15M Beams
Beam DB-15-1, DB-15M-2 and DB-15M-3 contained 15M rebar, with a bonded
length to concrete o f 423 mm on either side of the central debonded region. The beam
dimensions and strain gauge spacings are presented in Figure 3-1, Figure 3-2, and Figure
3-5. The yielding of 15M rebar under dynamic loads was experimentally determined
(from ancillary testing) and it was found that yielding occurred at a strain o f 2740*1 O'6.
This strain is the average of the yield strain at 0.1 strain/s and 0.2 strain/s (Table 4-8).
The average value was used since the increase in strength for both of the tests were very
close to one another. It is important to note that dynamic ancillary testing produced strain
98
rates very close to the strain rates produced by the shock tube. For all tests on these
beams, concrete gauges C2 and C3, at a depth of 65 mm and 95 mm from the
compression face, break during the first test on each beam. This is due to the fact that the
preformed crack on the tension side opens up very quickly causing the neutral axis to
shift towards the compression face. As a result, these gauges initially go into tension and
quickly rupture.
4.3.1.1 Beam DB-15M-1
Beam DB-15M-1 was the first o f all beams containing 15M rebar to be tested
using the shock tube. In order to determine a driver length and driver pressure
combination that would cause yielding o f the steel reinforcement, the beam was exposed
to a total o f four shots. Although the first couple o f shots did cause some damage to the
beam, this method of testing proved useful in finding a suitable driver pressure that
caused yielding o f the steel reinforcing bar in subsequent tests.
4.3.1.1.1 Test DB-15M-1-1
Test DB-15M-1-1 was conducted with a driver pressure of 55 kPa. This driver
pressure yielded a reflected pressure and reflected impulse o f 8.72 kPa and 55.8 kPa- ms
respectively and a positive phase duration o f 9.0 ms at the shock tube opening (Figure
4-33). The beam experienced a maximum midspan displacement of 5.46 mm and a load
point displacement o f 3.8 mm at 18.3 ms as shown in Figure 4-34. The maximum support
rotation was 0.28°. No slip was recorded at either end of the beam.
99
The strain rate in the reinforcing steel during this test was 0.0499 s '1. A maximum
strain o f 576x 10'6 occurred in the debonded region after at 17.4 ms in this test. This strain
is less than the dynamic yield strain o f 2740x1 O'6. Thus, no yielding occurred in the
longitudinal reinforcement under the blast loading from this test. The steel gauges
produced lots o f noise during this test. For example SI oscillates between 80x1 O'6 and
-60x1 O'6 strain. This made it difficult to determine the magnitude of strain in any o f the
gauges within the bonded region since these strains were quite small. It was however
quite clear that the strain in the steel did not reach yielding. Cables leading from the
shock tube to the data acquisition system were replaced and repaired to reduce the error
in future tests. All steel strains are shown in Figure 4-35.
Concrete strains were also recorded at three different depths as described in the
experimental program (Figure 4-36). Although gauges C2 and C3 provide very little
useful data since they fail very quickly, gauge C l provides information on the strain in
the concrete at a depth o f 35 mm from the compression face. At this location the concrete
experiences a maximum compressive strain o f 333x1 O'6. As the beam rebounds, the
compressive force on gauge C l is reduced. Gauge C l moves from compression to tension
after 46.96 ms and a maximum tensile strain o f 91 x 10'6 is recorded.
Visual inspection o f the beam surface after the test revealed no damage. The
preformed crack opened up slightly, but no significant residual displacement was
observed. A small longitudinal crack was formed at a depth o f approximately 60 mm
from the compression face o f the beam at midspan as shown in Figure 4-37. No other
cracking was observed during this first test.
100
4.3.1.1.2 Test DB-15M-1-2
The second shot on Beam DB-15M-1 used a driver pressure o f 110 kPa. This
yielded a reflected pressure o f 25.8 kPa and a reflected impulse o f 117.0 kPa-ms at the
shock tube opening (Figure 4-38). The duration o f the positive phase was 10.0 ms. The
beam experienced a maximum midspan displacement of 15.7 mm and a maximum load
point displacement o f 10.5 mm at 21.2 ms as shown in Figure 4-39. The maximum
support rotation calculated for this test was 0.80°. The crack at the midspan o f the beam
opened up to 8.38 mm. No slip was recorded at either end o f the beam.
Due to the large amount of noise in the gauges during the first test, an attempt was
made to filter out the noise to obtain more accurate data. Unfortunately, the method used
to do so did not work and no strain data was recorded for this test. As previously
mentioned, future tests were performed with repaired cables, which provided more
accurate results.
No additional cracks were formed along the tension face over the span of the
concrete beam during test DB-15M-1-2. The only visual damage observed was
propagation o f the longitudinal crack at midspan formed during the first test as shown in
Figure 4-40.
4.3.1.1.3 Test DB-15M-1-3
The third shot on beam DB-15M-1 used a driver pressure o f 166 kPa. This caused
a reflected pressure o f 33.8 kPa and reflected impulse of 168.3 kPa-ms at the shock tube
opening (Figure 4-41). The positive phase duration was 11.0 ms. This shock caused a
maximum midspan displacement o f 24.8 mm and a maximum load point displacement of
101
16.5 mm at 22.8 ms as shown in Figure 4-42. The maximum support rotation during the
test was 1.27°. The residual width o f the preformed crack measured 8.95 mm. No slip
was recorded at either end o f the beam.
The strain rate in the reinforcing steel during this test was 0.143 s '1. The
maximum strain readings in the debonded region were 2539*1 O'6 at 22.9 ms and
3299*1 O’6 at 23.8 ms in gauges S5 and S6 respectively. The strains in S5 and S6 should
theoretically be equal, but it is difficult to determine which gauge is giving more accurate
readings. It was found that yielding of the reinforcing steel in the debonded region
occurred at a time o f 20.7 ms, where the average strain calculated from S5 and S6 was
2740*1 O’6 (the average yield strain found during rapid tests on 15M rebar). Gauges SI
and S10, which are at the end of the bonded region (toward beam ends), experienced
almost no strain increase during testing. The oscillations observed in Figure 4-43 for
these gauges was likely due to the sensitivity of the gauges from small vibrations during
testing. As a result, it was found that the bar developed over a length less than the 423
mm provided in this test. The residual strain in S5 and S6 were 28*1 O'6 and 523*1 O'6
respectively. The residual strain in S5 seems very small and may be caused by the gauge
debonding from the steel surface. There was also a residual strain of 253*1 O'6 in gauge
S8, which was in the bonded region. Gauge S2 was not working and is therefore not
shown in the strain-time graph. All strains are shown in Figure 4-44.
During casting o f concrete, the sheet metal, which formed the preformed crack in
this beam, was bent. This caused the crack to propagate at an angle to the axis of the
rather than perpendicular through the midspan. Other visual damage observed during this
102
test was longitudinal cracks growth and spalling o f concrete on the compression face at
midspan (Figure 4-45).
4.3.1.1.4 Test DB-15M-1-4
The fourth test on Beam DB-15M-1 was performed with a driver pressure o f 303
kPa. This caused a reflected pressure o f 51.6 kPa and a reflected impulse o f 273.4 kPa-ms
o f the positive phase at the shock tube opening (Figure 4-46). The positive phase had a
duration o f 12.0 ms. The maximum displacement at midspan was 56.2 mm and the
maximum displacement at the load point was 37.2 mm at 49.6 ms. as shown in
Figure 4-47. The maximum support rotation during this test was 2.85°. The
preformed crack had a residual width after testing o f 15.50 mm. No slip was recorded at
either end o f the beam.
The strain rate in the reinforcing steel during this test was 0.323 s"1. During this
test, strain gauges S4 and S6 malfunctioned. The maximum strain in the debonded region,
determined from gauge S5 only was 4162* 10'6 at 72.5 ms. The maximum strains in
gauges S4 and S8 were 1971 *10'6 and 782* 10'6 respectively. It is important to note that
the steel had residuals strains before testing since it underwent plastic deformation in the
previous test. The residual strain in S5 after test DB-15M-1-4 was 3425x 1 O'6, while the
residual strain on S8 was 39*1 O'6 after this test. Due to the fact that this was the fourth
shot on the same beam, many o f the other gauges were damaged at this and no valuable
data was obtained. It is also important to note that while the yield strain o f steel in the
debonded region was surpassed, gauges SI, S2, S9, and S10 were not strained. Thus, the
103
steel was developed over a shorter length than 423 mm provided in the beam. All steel
strain responses are presented in Figure 4-48.
The concrete gauges were damaged during the first 3 tests on beam DB-15M-1.
Consequently, no concrete strains were successfully recorded during this test.
During this test, new cracks appeared on the tension face o f the beam fairly close
to the load points. Other cracks propagated and further opening o f the preformed crack at
midspan occurred as shown in Figure 4-49.
4.3.1.2 Beam DB-15M-2 and DB-15M-3
Only two shots were applied to Beam DB-15M-2 and DB-15M—3. For the first
test on each beam, a driver pressure that would result in yielding of the reinforcement
was used. By analyzing the results o f tests on beam D B-15M -1, it was determined that a
driver pressure o f 166 kPa caused yielding o f reinforcement. As a result, this pressure
was used for test DB-15M-2-1 and DB-15M-3-1. The second shots on Beam DB-15M-2
and D B-15M-3 were chosen to have a driver pressure of much greater magnitude than the
first shot.
4.3.1.2.1 Test DB-15M-2-1
The driver pressure, 165 kPa, for this test resulted in a reflected pressure o f 35.2
kPa and a reflected impulse o f 168.8 kPa-ms (Figure 4-50) and positive phase duration o f
11.0 ms. During the test, the beam experienced a maximum midspan displacement o f
23.2 mm and a maximum load point displacement of 15.9 mm at 23.2 ms as shown in
104
Figure 4-51. The corresponding maximum support rotation was 1.22°. The preformed
crack width increased from 9.63 mm to 12.10 mm during this test. No slip of the
reinforcement was recorded at either end o f the beam.
The strain rate in the reinforcing steel during this test was 0.167 s '1. The
maximum strain readings in the debonded region were 3339x 10'6 and 3091 xlO'6 at 24.6
ms in gauges S5 and S6 respectively. The strain values at these gauges (S5 and S6) were
higher than yield stress o f steel (2740*1 O'6). Yielding o f the steel reinforcement occurred
at a time of 19.9 ms. The residual strain readings in the debonded region were 574*1 O'6
from gauge S5 and 427*1 O'6 from gauge S6. Marginal strain increases were recorded at
S3 while SI, S9 showed no strain increase. Gauge S2 and S8 were observed to be
malfunctioning during the test and are therefore not shown in the strain-time history in
Figure 4-52. Figure 4-53 shows the strain profile when the steel in the debonded region
reaches its dynamic yield strain. The figure can be used to estimate the dynamic
development length o f the steel reinforcement. Whereas the spacing o f strain gauges in
the bonded region does not allow for accurate measurement o f the development length,
an estimate can be made. The dynamic development length was between 256 mm and
385 mm, less than the static development length calculated in accordance with CSA
A23.3-04 (2004).
During testing, concrete gauge C2 and C3 immediately experienced high tensile
strains exceeding their capacity and ruptured. The behaviour o f gauge C 1 was observed
up to the time of maximum displacement as shown in Figure 4-54. C l initially
experienced a compressive strain o f 92*1 O'6 at 4.57 ms. The neutral axis then moved
105
below gauge C 1 upon rebound and began to undergo tension. A maximum tensile strain
of 1143*10‘6 was then reached at 13.63 ms. The residual strain in gauge C l was 69*10'6.
During this test, a longitudinal crack was formed at midspan near the compression
face (Figure 4-55). A transverse crack was also formed near the top load point along the
tension face of the beam.
4.3.1.2.2 Test DB-15M-2-2
The second shot on beam DB-15M-2 used a driver pressure o f 379 kPa, which
resulted in a reflected pressure o f 61.1 kPa and a reflected impulse o f 316.8 kPa-ms
(Figure 4-56). The duration o f the positive phase was 12.1 ms. The resulting maximum
midspan displacement was 81.6 mm and the maximum load point displacement was 55.5
mm at 54.9 ms as shown in Figure 4-57. No displacement of the reinforcement relative to
the beam was recorded. The maximum support rotation was 4.26°. The residual width of
the preformed crack was 20.20 mm. No slip of the reinforcement was recorded at either
end of the beam.
The strain rate in the reinforcing steel during this test was 0.361 s’1. During the
test, gauges S5 and S6 reach their maximum capacity. As a result the maximum strain in
the debonded region could not be determined. However, after maximum strain was
reached, gauge S5 appears to record strain readings that appear to be within a reasonable
range. The residual strain in gauge S5 is 3509*1 O'6. Strain gauges S4 and S7 recorded
maximum strains o f 2453*1 O'6 and 3850*1 O'6 respectively. Gauge S7 had a residual
strain o f 228*1 O'6, while the residual strain in S4 was compressive. Gauges SI and S9 did
not undergo any significant strain during testing, only small vibrations. All steel strains
are show in Figure 4-58. Figure 4-59 shows the strain profile at the time when the steel
106
in the debonded region reaches its dynamic yield strain. The dynamic development length
was between 256 mm and 385 mm, which is less than the static development length of
423 mm.
Concrete gauges C2 and C3 were not working for this test. Gauge Cl initially
experiences a compressive strain o f 927*1 O'6 at 6.6 ms. The strain at C l then moved into
tension at 10.0 ms. As the crack continued to open up, C l reached a maximum tensile
force o f 1808x1 O'6 at 17.2 ms. At this point, the concrete spalled off on the compression
face and the strain in C l moved back into the compressive zone until maximum
displacement was reached (Figure 4-60). The residual tensile strain on gauge C l was
100x1 O'6.
Transverse cracks appeared near both load points and propagated through the
depth of the beam (Figure 4-61). Concrete spalled off the compressive face, exposing the
shear stirrup near the midspan of the beam, while additional longitudinal cracks were
formed at the midspan of the beam.
4.3.1.2.3 Test DB-15M-3-1
The first test on beam DB-15M-3-1 was similar to the first test performed on
DB-15M-2. The driver pressure was also 165 kPa resulting in a reflected pressure o f
30.4 kPa and a reflected impulse o f 160.1 kPa-ms (Figure 4-62). The duration o f the
positive phase was 11.3 ms. Dining this test, midspan displacements were not recorded
due to faulty cables to the data acquisition system. The midspan displacement was
therefore estimated by assuming rigid body rotation about a pivot in the concrete
compression zone. The midspan displacement was calculated by using the principle o f
107
similar triangles. The calculated maximum midspan displacement was 26.7 mm and the
measured maximum load point displacement was 17.8 mm at 24.9 ms as shown in
Figure 4-63. The maximum support rotation was 1.37°. The initial width of the
preformed crack was 5.92 mm and the final width after testing was 6.25 mm. No slip was
recorded at either end o f the beam.
The strain rate in the reinforcing steel during this test was 0.159 s '1. The
maximum strain in the debonded region was 2839x10"6 at 24.5 ms, as recorded by gauge
S5. The steel reached the yield strain at 22.4 ms. While gauges S3, S4 and S8
experienced maximum strains of 343x1 O'6, 2123x1 O'6 and 347x1 O'6 respectively, no
strains were recorded in S9 or S10 except for small oscillations about zero strain.
Residual strains o f 211xl0 '6 , 214xl0 '6 , 328xl0 '6 , and 347xl0 '6 were recorded at
gauges S3, S4, S5 and S8 respectively. All steel strains are shown in Figure 4-64. Figure
4-65 shows the strain profile at the time when the steel in the debonded region reached its
dynamic yield strain. From this figure, it can be concluded that he dynamic development
length was between 256 mm and 385 mm, less than the 423 mm provided.
Concrete gauge C2 and C3 broke almost immediately. Gauge C l reached a
compressive strain o f 283x1 O'6 at 7.5 ms. As the neutral axis moved towards the
compression fibre o f the section, C l transitioned into tension at 10.7 ms and reached a
tensile strain o f 347x 10'6 before the beam reached maximum displacement (Figure 4-66).
Two transverse cracks formed along the compression face near midspan (Figure
4-67), showing a potential area for concrete spalling in subsequent tests. The preformed
crack opened up, but no other visual damage occurred.
108
4.3.1.2.4 Test DB-15M-3-2
The driver pressure used in this test was 483 kPa, which caused a reflected
pressure o f 64.1 kPa and a reflected impulse o f 362.8 kPa-ms at the shock tube opening
(Figure 4-68). The positive phase duration was 12.6 ms The midspan LVDT detached
from the beam during this test, so the midpsan displacement was, as with the first test on
this beam, calculated from the load point displacement. The maximum midspan
displacement was 127.4 mm and the maximum load point displacement was 84.9 mm
which occurred at 57.4 ms as shown in Figure 4-69. The maximum support rotation was
6.49°. No slip was recorded at either end of the beam.
The strain rate in the reinforcing steel during this test was 0.357 s '1. During this
test, steel strains at S6 were not recorded while gauge S5 exceeded the maximum strain
limitation during testing. Therefore the maximum strain in the debonded region could not
be determined, but readings from gauge S5 indicated that yielding o f the steel occurred
after 10.9 ms. Maximum strains recorded in gauges S3, S4 and S8 were 601 *10'6,
2773x1 O’6, and 1006x1 O'6 respectively. The residual strains in gauges S3 and S8 were
234xl0 '6 and 233xl0 '6 respectively. The residual strain in S4 was -472xl0 '6. At the
location o f gauge S4, the steel underwent tensile strain and reached plastic deformation.
Since the tensile strain at S4 cannot be fully recovered, a compressive strain would not
occur in the steel and it is reasonable to assume that the gauge was damaged during
testing. All steel strains are show in Figure 4-70. Figure 4-71 shows the strain profile at
the time when the dynamic yield strain was reached. The dynamic development length
was between 256 mm and 385 mm.
109
Thus, the dynamic development length for all tests on 15M beams is less than the
development length provided in accordance with CSA A23.3-04 (2004).
Due to previous damage caused to the concrete gauges, no concrete strains were
recorded.
Transverse cracks appeared on the tensile surface of the beam near both load
points. These cracks were approximately 150 mm deep. Spalling o f concrete on the
compressive face also occurred during testing (Figure 4-72).
4.3.2 DB-20M Beams
The DB-20M beams contained 20M rebar developed for a length o f 523 mm on
either side o f the 1395 mm debonded region. The beam dimensions and strain gauge
spacings are described in the experimental program (Figure 3-1, Figure 3-2, and Figure
3-5). The yielding o f 20M size rebar under dynamic loads was experimentally determined
to occur at a strain o f 2650><10'6 as shown in Table 4-8. For all tests on these beams,
concrete gauges C2 and C3, at depths o f 65 mm and 95 mm from the compression face,
ruptured during the first test on each beam.
4.3.2.1 Beam DB-20M-1
This beam was the first of all DB-20M beams to be tested using the shock tube.
Similar to Beam DB-15M-1, several shots were made on beam DB-20M-1 to determine
the appropriate driver pressure for testing beams containing 20M rebar. A total o f 3 tests
were performed on this beam and a driver pressure that could cause yielding of the steel
110
reinforcing bar in subsequent tests was determined. The results o f these tests are
described in the following sections.
4.3.2.1.1 Test DB-20M-1-1
For the first shock on beam DB-20M-1, a driver pressure of 138 kPa was used.
The resulting reflected pressure was 29.3 kPa and the reflected impulse o f the positive
phase was 134.8 kPa-ms (Figure 4-73). The positive phase duration was 10.4 ms. The
LVDT at midspan for this test malfunctioned and thus no midspan displacement data was
available for this test. From calculations, it was determined that the measured maximum
displacement at midspan was 19.3 mm and the maximum displacement at the load point
was 12.7 mm which occurred at 21.2 ms as shown in Figure 4-74. The maximum support
rotation was 0.98°. The preformed crack before testing measured 5.99 mm and has a
residual width of 7.57 mm after testing. No slip o f the reinforcement was recorded at
either end of the beam.
The strain rate in the reinforcing steel during this test was 0.122 s '1. The
maximum strain in the debonded region was 1703x1 O'6 at 20.6 ms, as recorded by gauge
S6. S4 reached a maximum strain o f 1524x1 O'6, while S3 and S8 reached small strains of
155x1 O'6 and 188x1 O'6 respectively. The yield strain was not reached in this test and the
beam had very little residual displacement. The strain profile o f the reinforcement is
shown in Figure 4-75.
Concrete gauge C l reaches a maximum compressive strain of 182x1 O'6 at 11.1 ms
before crossing over into tension at 13.5 ms. The tensile strains then become very high
and the gauge is ruptured as shown in Figure 4-76. No residual strain was recorded in the
concrete.
I l l
During this test, the preformed crack opened up slightly and a small longitudinal
crack formed near midspan (Figure 4-77). There was no other visible damage caused to
the beam.
4.3.2.1.2 Test DB-20M-1-2
This test used a driver pressure o f 227 kPa, which resulted in a reflected pressure
o f 45.0 kPa and a reflected impulse o f the positive phase o f 219.7 kPa-ms (Figure 4-78).
The positive phase duration was 11.3 ms. A maximum midspan displacement o f 34.8 mm
and a maximum load point displacement o f 22.7 mm occurred at 24.4 ms as shown in
Figure 4-79. The maximum support rotation was 1.75°. The residual crack width was
5.59 mm. No reinforcement slip was recorded at either end of the beam.
The strain rate in the reinforcing steel during this test was 0.212 s '1. The
maximum strain in gauges S3 and S8 were 618><10'6 and 592* 10‘6 respectively. The
maximum strain in the debonded region recorded from gauge S6, which occurred at 23.5
ms was 2990x1 O'6. The yield strain was achieved at a time of 16.6 ms. Although the
maximum strain reading is expected be in the debonded region, gauge S4 had a higher
maximum recorded strain o f 3122xl0 '6. Gauge S4 is very close to the debonded region,
so it is possible that if there were voids in the concrete near the end of the debonded
region, gauge S4 would act very similarly to gauge S6. It is also possible that gauge S6
was not bonded properly to the steel surface and is not very accurate. The strain readings
show that the dynamic development length was between 340 mm and 500 mm, which is
less than 523 mm (the development length provided). The residual strains in gauges S3,
S4 and S8 were 395xl0 '6,4 5 0 x l0 '6 and 347xl0 '6 respectively, while the residual strain in
112
S6 was only 131xl0'6. All steel strains are shown in Figure 4-80. No concrete strain was
recorded in this test since the gauges all ruptured during Test DB-20M-1-1.
A transverse crack appeared near the top load point during this test on the tensile
side o f the beam (Figure 4-81). Longitudinal cracks also propagated at the midspan.
Although the preformed crack opened up during the test, the beam moved back to its
original position on rebound and the crack width was measured to be smaller than before
testing.
4.3.2.1.3 Test DB-20M-1-3
The driver pressure for the third test on beam DB-20M-1 was 586 kPa. This
resulted in a reflected pressure o f 90.8 kPa and a reflected impulse of the positive phase
of 451.5 kPa-ms (Figure 4-82). The positive phase duration was 13.6 ms. The maximum
midspan displacement was 201.8 mm and the maximum load point displacement was
142.7 mm which occurred at 71.6 ms as shown in Figure 4-83. The maximum support
rotation was 10.80°. The residual crack width was 34.80 mm. No reinforcement slip was
recorded at either end o f the beam.
The strain rate in the reinforcing steel during this test was 0.412 s’1. The
maximum strain in the debonded region could not be determined in this test since gauge
S6 appears to reach its maximum capacity. Gauge S4 also reaches its maximum value. A
maximum strain o f 823*1 O'6 was reach in gauge S3 before it failed, and a maximum
strain o f 749*1 O'6 was recorded in gauge S8. Although residual strains are recorded, it is
difficult to tell whether the strain readings are accurate after the gauges reach their
maximum capacity. It is however important to note that while gauges S4 and S6
113
experienced very high strains. Gauge S9 and S10 experienced no strain, thus confirming
that the dynamic development length was between 340 mm and 500 mm, which is less
than the 523 mm of bonded reinforcement provided. Gauges SI and S2 were not working
during this test. All steel strains are presented in Figure 4-84. All concrete gauges were
damaged at this point so no concrete strains were recorded.
Transverse cracking occurred at both load points on the tension face o f the beam.
The depth o f these cracks was greater than 150 mm. On the compression face, a large
mass o f concrete, with a depth o f approximately 50mm, was spalled off near midspan
(Figure 4-85).
4.3.2.2 Beam DB-20M-2 and DB-20M-3
Only two shots were applied to Beam DB-20M-2 and DB-20M-3. For the first test
on each beam, a driver pressure that estimated to yield the reinforcement was used. By
observing the results of tests on beam DB-20M-1, it was determined that a driver
pressure of 227 kPa caused yielding o f the 20M reinforcement. As a result, this pressure
was used for test DB-20M-2-1 and DB-20M-3-1. The second shot on Beam DB-20M-2
and DB-20M-3 was chosen to have a driver pressure o f much greater magnitude than for
the first shot.
4.3.2.2.1 Test DB-20M-2-1
The first shot on beam DB-20M-2 resulted in a reflected pressure o f 42.6 kPa and
a reflected impulse o f the positive phase o f 216.2 kPa-ms (Figure 4-86). The positive
114
phase duration from this shock was 11.5 ms. The maximum midspan displacement was
44.9 mm and the maximum load point displacement was 30.3 mm at 24.7 ms as shown in
Figure 4-87. The maximum was support rotation was 2.33°. Before testing the preformed
crack had a width o f 4.32 mm and after testing, the residual width was 4.60 mm. No
reinforcement slip was recorded at either end o f the beam.
The strain rate in the reinforcing steel during this test was 0.202 s '1. The
maximum strain in the debonded region was 2933><1 O'6 in gauge S5 at 23.6 ms. The yield
strain was reached at 18.8 ms. Gauge S3 and S8 each had a maximum strain o f 474xl0 '6.
The residual strains in S3 and S8 were 274x1 O'6 and 267x1 O'6 respectively. The residual
strain in S5 was 115x1 O'6. Gauges SI, S9, and S10 did not experience significant strains,
only small oscillations. Gauge S2 malfunctioned during the testing and hence not shown
with the strain profiles in Figure 4-88. Figure 4-89 shows the strain profile at the time
when the steel in the debonded region reaches the dynamic yield strain. The dynamic
development length was between 340 mm and 500 mm, which is less than 523 mm
provided.
Gauge C l initially went into compression, reaching a strain o f 417xl0"6 at 6.20
ms. The neutral axis then crossed gauge C l at 9.5 ms and C2 went into tension,
experiencing a maximum tensile strain o f 81 x 10'6 before the maximum displacement was
reached. Gauge C l does not appear to have any significant residual strains (Figure 4-90).
A longitudinal crack appeared at midspan at a depth o f approximately 40 mm
from the compression fibre o f the section, and propagated towards the top support o f the
beam. A small part o f concrete spalled off the edges of the beam near the compression
face at midpsan (Figure 4-91).
115
4.3.2.2.2 Test DB-20M-2-2
The second shot on beam DB-20M-2 used a driver pressure o f 586 kPa, which
resulted in a reflected pressure o f 90.4 kPa and a reflected positive phase impulse of
450.9 kPa-ms (Figure 4-92). The positive phase duration was 13.1 ms. The maximum
midspan displacement o f the beam was 186.6 mm and the maximum load point
displacement was 124.1 mm at 69.1 ms as shown in Figure 4-93. The maximum support
rotation was 9.46°. The final width o f the preformed crack measured 29.0 mm. No slip
was recorded at either end of the beam.
The strain rate in the reinforcing steel during this test was 0.401 s '1. The
maximum strain in the debonded region could not be determined for this test since gauge
S5 and S6 exceeded their maximum capacity. The yield strain o f the steel in the
debonded region was reached at 10.05 ms. The maximum strain in gages S3, and S8 were
447><1 O'6, and 433.17^1 O'6 respectively. Gauges S9 and S10 do not exhibit any strains,
only small oscillations about zero strain. Thus, the steel was developed over the provided
bond length. The strain readings show that the dynamic development length was between
340 mm and 500 mm, which is less than the bonded length o f 523 mm provided in the
beam. Gauges S3 and S6 ruptured during the test, but gauges S4, S5 and S8 show
residual strains o f 990xl0 '6, 3991 xlO'6 and 214xl0 '6 respectively. All steel strains are
shown in Figure 4-94. Figure 4-95 shows the strain profile at the time when the steel in
the debonded region reaches its dynamic yield strain.
The recorded concrete strains at gauge C 1 shows compressive strain with a peak
value o f 4360x 10'6 (Figure 4-96). The residual strain was 2340x 10'6.
116
After this test, there was cracking at the location of both load points. Concrete
was spalled off the compression face to a depth o f approximately 75 mm, and the
longitudinal wire used for the shear cage was buckled at midspan (Figure 4-97).
4.3.2.2.3 Test DB-20M-3-1
The first shot on beam DB-20M-3 resulted in a reflected pressure o f 38.6 kPa and
a positive phase reflected impulse o f 214.8 kPa-ms (Figure 4-98). The positive phase
duration was 11.6 ms. The maximum midspan displacement was 33.4 mm and the
maximum load point displacement was 22.1 mm at 24.9 ms as shown in Figure 4-99. The
maximum support rotation was 1.70°. The preformed crack initially measured 7.39 mm.
Once the beam was loaded, the crack opened up and the sheet metal fell out o f the
preformed crack. Upon rebound, the crack closed up and had a residual displacement of
5.18 mm. No reinforcement slip was recorded at either end of the beam.
The strain rate in the reinforcing steel during this test was 0.193 s '1. The
maximum strain in the steel in the debonded region occurred in gauge S5 at 25.2 ms and
measured 2867x1 O'6. Gauge S7 and S8 had maximum strains o f 1633x1 O'6 and 546x1 O'6
respectively. Gauges S2, S9 and S10 only experienced very small increases in strain.
Gauges S5 and S8 had residual strains o f 305x1 O'6 and 376x1 O'6 respectively. Gauge S7
has a residual compressive strain. While gauge S8 seems to have a very smooth strain
time curve, gauges S5 and S7 have randomly scattered peaks followed by continuous
waves. The random behaviour in this strain data is evidence o f malfunctioning gauges.
Thus, the values reported for gauges S5 and S7 have high uncertainty. All strain profiles
are shown in Figure 4-100. Figure 4-101 shows the strain profile at the time when the
117
steel in the debonded region reaches its dynamic yield strain and shows that the dynamic
development length was between 340 mm and 500 mm, which is less than the bonded
length o f 523 mm provided in the beam.
Gauge C l reached a maximum compressive strain of 1972x1 O'6 at 47.3 ms. As
the beam rebounds, the location o f the neural axis begins to move away from the
compression face and gauge C l goes into tension before rupturing (Figure 4-102).
While this test was performed, some longitudinal cracks were formed at midspan
(Figure 4-103). There was also some cracking and spalling of concrete off the
compression face at the location o f the preformed crack.
4.3.2.2.4 Test DB-20M-3-2
The second shot on beam DB-20M-3 had a driver pressure o f 586 kPa and
resulted in a positive phase reflected pressure and reflected impulse o f 68.2 kPa and
427.8 kPa-ms respectively (Figure 4-104). The duration o f the positive phase was 12.8
ms. The maximum midspan displacement measured 134.4 mm and the maximum load
point displacement measured 92.1 mm at 56.4 ms as shown in Figure 4-105. The
maximum support rotation was 7.05°. After the test was performed, the preformed crack
had a residual width o f 22.0 mm. No reinforcement slip was recorded at either end o f the
beam.
The strain rate in the reinforcing steel during this test was 0.287 s '. From the
data, it is difficult to determine the magnitude o f the maximum strain in the gauges due to
random peaks that appeared. These peaks seem as though they are noise in the gauges
rather than strain readings. However, since the gauges exhibit smooth curves before these
118
peaks occur, it is possible to determine the time to yield at 11.6 ms. Gages S5, S6, S7 and
S8 showed residual strains o f 3301 xlO-6, 5100><10'6, 3703* 10'6, and 350x l0 '6
respectively. Gauges S2, S9 and S10 did not show any strain changes. Gauge S4 was
hidden because it was not working properly. All strain profiles are presented in Figure
4-106. Figure 4-107 presents the strain profile at the time when the steel in the debonded
region reaches its dynamic yield strain. The dynamic development length was between
340 mm and 500 mm, which is less than the bonded length o f 523 mm provided in the
beam. No concrete strains were recorded during this test.
The damage caused to this beam was similar to test DB-20M-2-2. Cracks appear
at the location o f both load points. Spalling of the concrete at the midspan near the
compression face also took place (Figure 4-108).
4.3.3 DB-25M Beams
These three beams contained 25M rebar, which was developed for a length o f 830
mm on either side o f the 780 mm debonded region. The beam dimensions and strain
gauge spacings are described in the experimental program (Figure 3-1, Figure 3-2, and
Figure 3-5). The yielding o f 25M size rebar under dynamic loads was experimentally
determined by increasing strain rate to 0.1 strain/s and 0.2 strain/s, and it was found that
yielding would occur at a strain of 3163*1 O'6 (Table 4-8). To determine this yield strain,
only two tests were performed since the machine for tensile steel testing was unable to
load 25M rebar at high strain rates. The failure load of each test was very different from
one another and the average value obtained is likely an overestimation o f the yield
strength. This is due to the fact that the yield strain o f one o f the tests was very large in
119
comparison to all other steel testing. However, by observing the strain profile at an
overestimated steel strain, the results reported are conservative.
4.3.3.1 Beam DB-25M-1 Beam
Beam DB-25M-1 was the first o f all beams containing 25M rebar to be tested
using the shock tube. Similar to Beam DB-15M-1 and DB-20M-1, this beam was
exposed to several shock tube shots to determine the appropriate driver pressure for
testing DB-25M beams. A total o f 3 shots were made to this beam. The results o f these
tests are described in the following section.
4.3.3.1.1 Test DB-25M-1-1
The first shot on beam DB-25M-1 used a driver pressure o f 207 kPa. This caused
a positive phase reflected pressure o f 37.4 kPa and a reflected impulse o f 200.6 kPa-ms at
the shock tube opening (Figure 4-109). The positive phase duration was 11.5 ms. The
maximum midspan displacement was 22.1 mm and the maximum load point
displacement was 15.9 mm at 20.6 ms as shown in Figure 4-110. The maximum support
rotation was 1.22°. The width o f the preformed crack before testing was 7.37 mm. During
the test the crack opened up and returned to a width o f 7.37 mm. No reinforcement slip
was recorded at either end o f the beam.
The strain rate in the reinforcing steel during this test was 0.143 s '1. The
maximum strain in the debonded region from gauge S5 was 2025*1 O'6 at 18.67 ms. The
maximum strains in gauges S3, S4, and S8 were 1044x1 O'6, 1451 xlO'6, and 1001 xlO'6
respectively. Yielding in the debonded region was not achieved in this test. The residual
120
strains in gauges S3, S5 and S8 were 293* 10'6, 227xlO"6, and 592xlO"6 respectively.
Gauge S4 showed no residual strain. Gauge S9 only experienced small vibrations. All
strain profiles are shown in Figure 4-111.
Concrete gauge C l reached a maximum compressive strain o f 600x1 O'6 at 23.5
ms and gauge C2 reached a maximum tensile strain of 1428xl0‘6 at 16.33 ms during the
first cycle o f the beams displacement (Figure 4-112). Gauges C l and C3 fractured during
this test, while gauge C2 exhibited a residual strain o f 266x1 O'6.
During this test a longitudinal crack at a depth o f approximately 75 mm from the
compression face was formed. There were 3 transverse cracks that formed near the
location o f the top load point on the tension face and 2 transverse cracks that appear near
the bottom load point (Figure 4-113).
4.3.3.1.2 Test DB-25M-1-2
This test used a driver pressure o f 262 kPa and resulted in a positive phase
reflected pressure o f 43.2 kPa and a reflected impulse o f 238.8 kPa-ms at the shock tube
opening (Figure 4-114). The positive phase duration o f the blast load was 12.0 ms. The
maximum midspan displacement was 30.3 mm and the maximum load point
displacement was 20.8 mm at 21.5 ms as shown in Figure 4-115. The maximum support
rotation during the test was 1.60°. The residual displacement o f the preformed crack
measured 8.13 mm. No reinforcement slip was recorded at either end o f the beam.
The strain rate in the reinforcing steel during this test was 0.227 s '1. The
maximum strain in the debonded region recorded from gauges S5 and S6 was 3475x1 O'6
121
and 3397x1 O'6 respectively at 22.1 ms. The steel in this region reached the yield strain at
18.29 ms. Maximum strains recorded in gauges S3, S4 and S8 were 149x1 O'6 ,
2868xl0 '6 , and 1226xl0'6 respectively. The residual strains in the debonded region
were 1339xl0'6 at S5 and 1228x 10'6 at S6. The residual strain in S3 and S8 were
278xl0’6 and 382 xlO'6. Similar to the previous test, gauge S4 appears to go into
compression, thus making the strains recorded for this gauge o f questionable accuracy.
Gauge S8 also exhibits odd behaviour after the maximum strain is reached in this gauge.
Gauge S9 only experienced small vibrations. The strain readings show that the dynamic
development length was between 545 mm and 805 mm, which is less than the bonded
length of 830 mm provided in the beam. All strain profiles are shown in Figure 4-116.
Concrete gauges C l and C3 were not working during this test. Gauge C2 was
initially in tension due to the residual deflection o f the beam from Test DB-25M-1-1.
Gauge C2 first moved into compression reaching a maximum compressive strain o f
332xl0 '6 at 6.08 ms (Figure 4-117). The gauge then began moving back into tension and
the neutral axis crossed gauge C2 at 7.03 ms. After this point, gauge C2 reached a
maximum tensile strain of 1666xl0'6 at 18.45 ms. The residual tensile strain in gauge C2
was 182x1 O'6.
After this test, a diagonal crack appeared at the depth o f the longitudinal
reinforcement between the top support and top load point. An additional crack appeared
on the compression face approximately 200 mm above midspan. There were a total o f 4
transverse cracks below midspan and a total o f 3 transverse cracks above midspan
(Figure 4-118).
122
4.3.3.1.3 Test DB-25M-1-3
This test used a driver pressure o f 655 kPa. The resulting positive phase reflected
pressure and reflected impulse at the shock tube opening were 91.1 kPa and 508.0 kPa-
ms respectively (Figure 4-119). The positive phase duration o f the blast load was 14.1
ms. During testing the beam experienced a maximum midspan displacement o f 167.6 mm
and a maximum load point displacement o f 112.2 mm at 66.0 ms as shown in
Figure 4-120. The maximum support rotation was 8.57°. The preformed crack
measured 20.30 mm after testing. No reinforcement slip was recorded at either end of the
beam.
The strain rate in the reinforcing steel during this test was 0.307 s '1. The
maximum strain in the debonded region recorded in gauges S5 and S6 were 6878><10'6 at
12.94 ms and 8331 x 10"6 at 13.86 ms respectively. Gauges S3, S4 and S8 reached strains
of lOOOxlO'6, 3107><10’6, and 1997xl0'6 respectively. Although strains on gauges SI, S2,
S9, and S10 were not recorded in this test, the fact that no slipping of the rebar occurred
on either end is proof that the strain in the steel reached a value o f zero before the
reaching the end of the beam. All strain profiles are shown in Figure 4-121.
Concrete gauge C2, the only gauge not damages in previous tests, suffered
damage during this test, suffered damage during test DB-25M-1-3 (Figure 4-122).
During this third shot on Beam DB-7, major concrete spalling on the compression
face at midspan occurred (Figure 4-123). The cracks that were previously formed
continued to open up. The beam had a very large residual deflection.
123
4.3.3.2 Beam DB-25M-2 and DB-25M-3
Only two shots were applied to Beam DB-25M-2 and DB-25M-3. For the first test
on each beam, a driver pressure of 262.0 kPa was used since this caused yielding o f the
reinforcement in test DB-25M-1-2. Unfortunately for test DB-25M-2-1 and DB-25M-3-1,
this driver pressure did not result in yielding of the reinforcement. This is due to the fact
that the resistance of Beam DB-25M-1 was reduced from the previous Test DB-25M-1-1,
whereas the tests on Beam DB-25M-2 and DB-25M-3 using driver pressure o f 262.0 kPa
was on virgin samples. The second shot on Beam DB-25M-2 and DB-25M-3 was chosen
to have driver pressure of greater magnitude than what was used for the first shot.
4.3.3.2.1 Test DB-25M-2-1
The first shot on Beam DB-25M-2 caused a positive phase reflected pressure of
45.5 kPa and a reflected impulse o f 241.1 kPa-ms at the shock tube opening (Figure
4-124). The duration o f the positive phase was 11.9 ms. The maximum midspan
displacement was 25.8 mm and the maximum load point displacement was 19.9 mm at
21.8 ms as shown in Figure 4-125. The maximum support rotation was 1.53°. The
preformed crack at midspan opened up had an initial width o f 5.46 mm and a residual
width o f 5.74 mm. No reinforcement slip was recorded at either end of the beam.
The strain rate in the reinforcing steel during this test was 0.157 s '1. The
maximum strain in the debonded region recorded on gauges S5 and S6 were 2241 * 10'6 at
20.5 ms and 2486* 10'6 at 20.5 ms respectively. Gauges S7 and S8 experienced a
maximum strain o f 789*1 O'6 and 581*10'6 respectively. However, the data from gauge S8
is not very reliable since the gauge produces random peaks. It is possible that this gauge
debonded from the surface o f the steel but continued to provide strain readings. Gauges
124
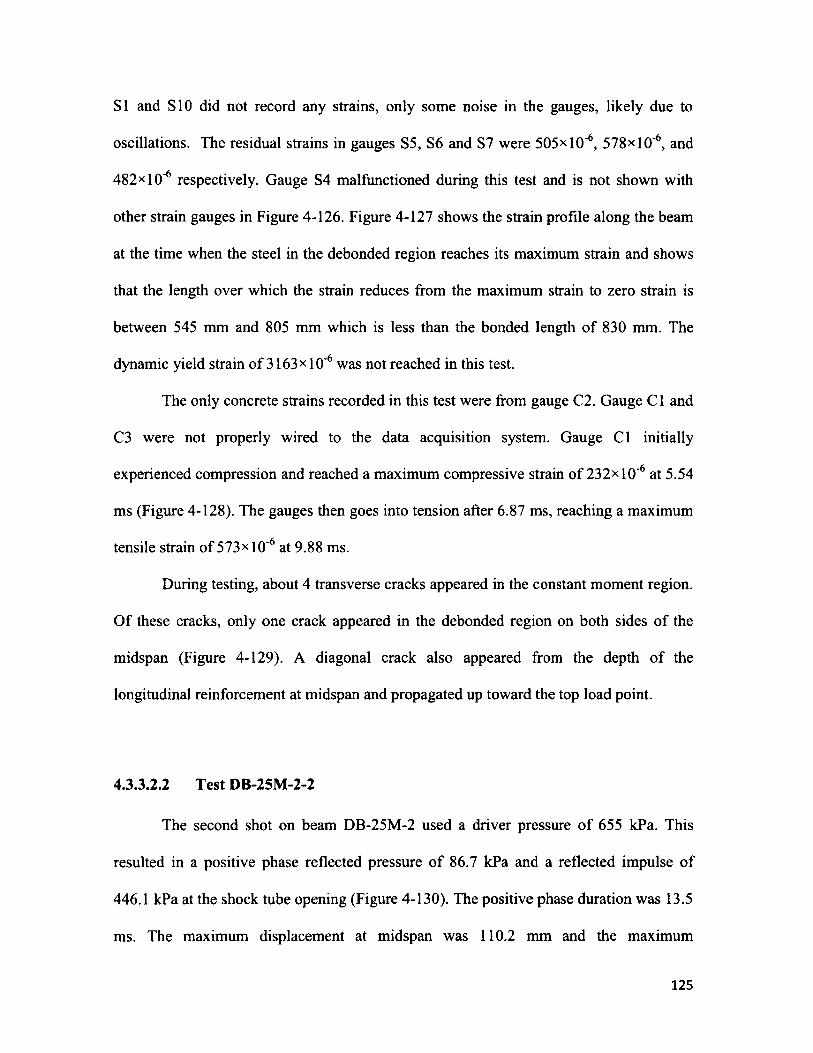
SI and S10 did not record any strains, only some noise in the gauges, likely due to
oscillations. The residual strains in gauges S5, S6 and S7 were 505x 10'6, 578* 10'6, and
482x1 O'6 respectively. Gauge S4 malfunctioned during this test and is not shown with
other strain gauges in Figure 4-126. Figure 4-127 shows the strain profile along the beam
at the time when the steel in the debonded region reaches its maximum strain and shows
that the length over which the strain reduces from the maximum strain to zero strain is
between 545 mm and 805 mm which is less than the bonded length o f 830 mm. The
dynamic yield strain o f 3163 x 10“6 was not reached in this test.
The only concrete strains recorded in this test were from gauge C2. Gauge C l and
C3 were not properly wired to the data acquisition system. Gauge C l initially
experienced compression and reached a maximum compressive strain o f 232X1 O'6 at 5.54
ms (Figure 4-128). The gauges then goes into tension after 6.87 ms, reaching a maximum
tensile strain o f 573x 10"6 at 9.88 ms.
During testing, about 4 transverse cracks appeared in the constant moment region.
O f these cracks, only one crack appeared in the debonded region on both sides of the
midspan (Figure 4-129). A diagonal crack also appeared from the depth of the
longitudinal reinforcement at midspan and propagated up toward the top load point.
4.3.3.2.2 Test DB-25M-2-2
The second shot on beam DB-25M-2 used a driver pressure o f 655 kPa. This
resulted in a positive phase reflected pressure o f 86.7 kPa and a reflected impulse o f
446.1 kPa at the shock tube opening (Figure 4-130). The positive phase duration was 13.5
ms. The maximum displacement at midspan was 110.2 mm and the maximum
125
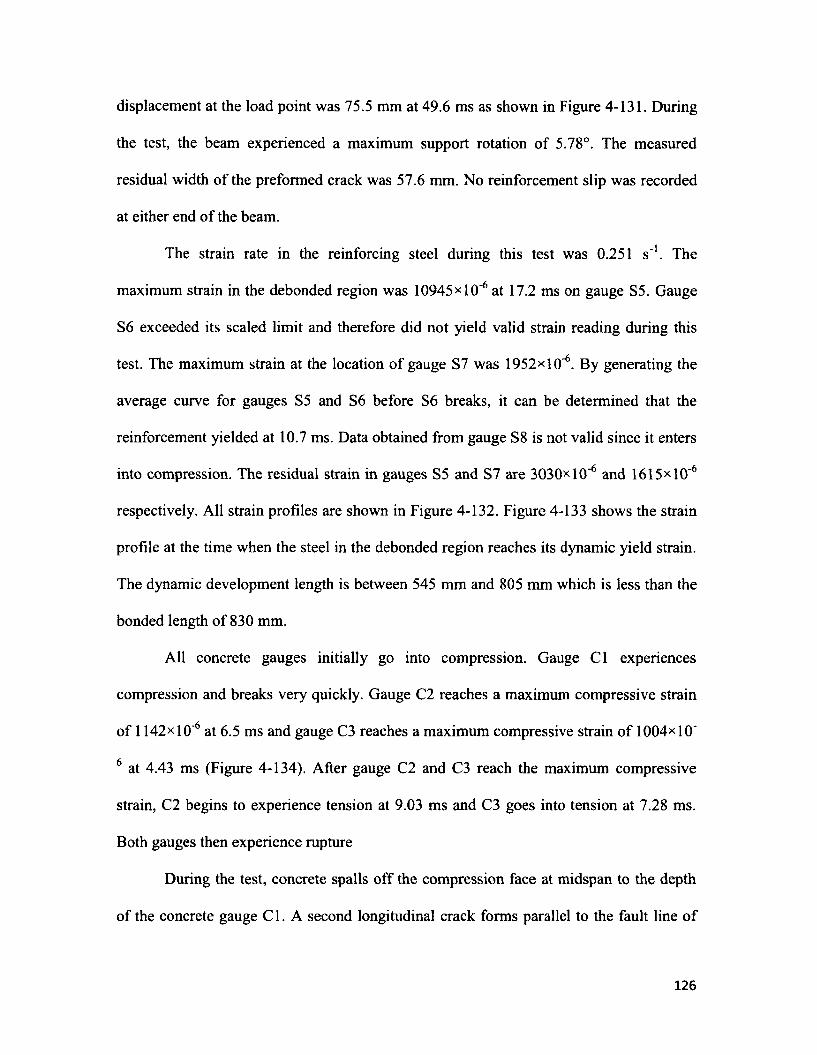
displacement at the load point was 75.5 mm at 49.6 ms as shown in Figure 4-131. During
the test, the beam experienced a maximum support rotation of 5.78°. The measured
residual width o f the preformed crack was 57.6 mm. No reinforcement slip was recorded
at either end o f the beam.
The strain rate in the reinforcing steel during this test was 0.251 s '1. The
maximum strain in the debonded region was 10945*10‘6 at 17.2 ms on gauge S5. Gauge
S6 exceeded its scaled limit and therefore did not yield valid strain reading during this
test. The maximum strain at the location o f gauge S7 was 1952*10‘6. By generating the
average curve for gauges S5 and S6 before S6 breaks, it can be determined that the
reinforcement yielded at 10.7 ms. Data obtained from gauge S8 is not valid since it enters
into compression. The residual strain in gauges S5 and S7 are 3030* 10"6 and 1615*10'6
respectively. All strain profiles are shown in Figure 4-132. Figure 4-133 shows the strain
profile at the time when the steel in the debonded region reaches its dynamic yield strain.
The dynamic development length is between 545 mm and 805 mm which is less than the
bonded length o f 830 mm.
All concrete gauges initially go into compression. Gauge C l experiences
compression and breaks very quickly. Gauge C2 reaches a maximum compressive strain
o f 1142* 10'6 at 6.5 ms and gauge C3 reaches a maximum compressive strain o f 1004*10'
6 at 4.43 ms (Figure 4-134). After gauge C2 and C3 reach the maximum compressive
strain, C2 begins to experience tension at 9.03 ms and C3 goes into tension at 7.28 ms.
Both gauges then experience rupture
During the test, concrete spalls off the compression face at midspan to the depth
o f the concrete gauge C 1. A second longitudinal crack forms parallel to the fault line o f
126
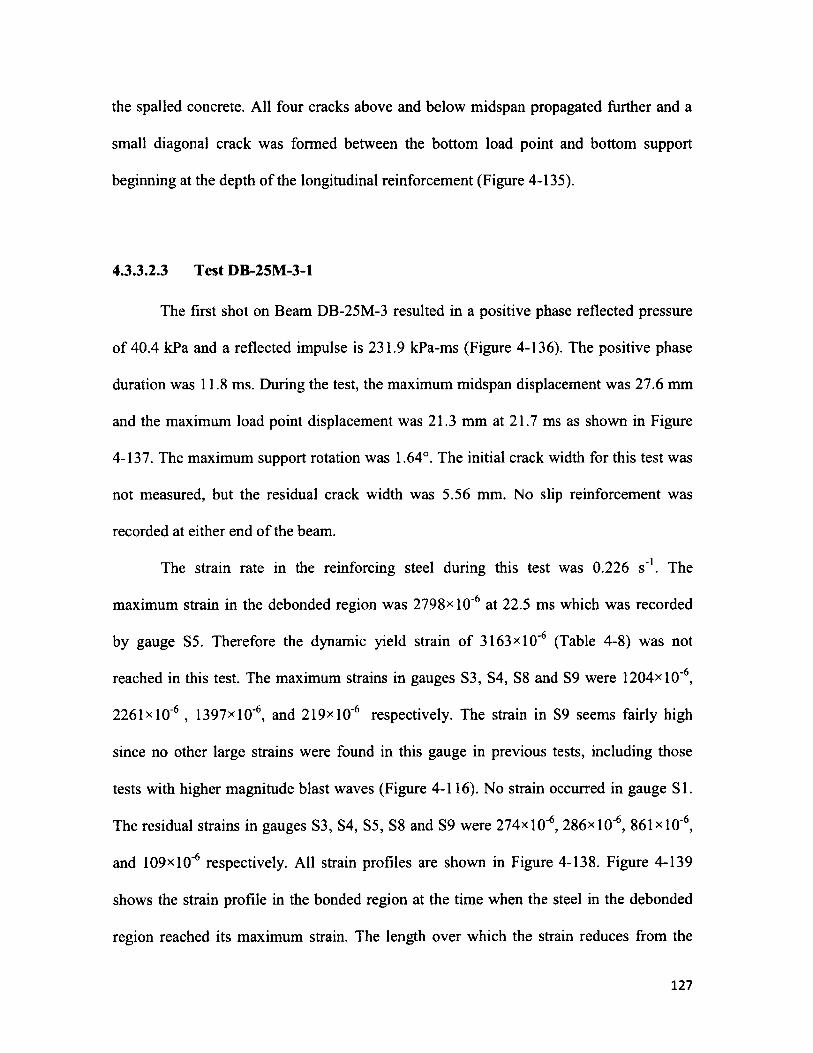
the spalled concrete. All four cracks above and below midspan propagated further and a
small diagonal crack was formed between the bottom load point and bottom support
beginning at the depth o f the longitudinal reinforcement (Figure 4-135).
4.3.3.2.3 Test DB-25M-3-1
The first shot on Beam DB-25M-3 resulted in a positive phase reflected pressure
o f 40.4 kPa and a reflected impulse is 231.9 kPa-ms (Figure 4-136). The positive phase
duration was 11.8 ms. During the test, the maximum midspan displacement was 27.6 mm
and the maximum load point displacement was 21.3 mm at 21.7 ms as shown in Figure
4-137. The maximum support rotation was 1.64°. The initial crack width for this test was
not measured, but the residual crack width was 5.56 mm. No slip reinforcement was
recorded at either end o f the beam.
The strain rate in the reinforcing steel during this test was 0.226 s '1. The
maximum strain in the debonded region was 2798xlO'6 at 22.5 ms which was recorded
by gauge S5. Therefore the dynamic yield strain o f 3163xl0 '6 (Table 4-8) was not
reached in this test. The maximum strains in gauges S3, S4, S8 and S9 were 1204x1 O'6,
2261xl0 '6 , 1397xl0'6, and 219xl0‘6 respectively. The strain in S9 seems fairly high
since no other large strains were found in this gauge in previous tests, including those
tests with higher magnitude blast waves (Figure 4-116). No strain occurred in gauge SI.
The residual strains in gauges S3, S4, S5, S8 and S9 were 274xl0 '6,2 8 6 x l0 '6, 861 xlO'6,
and 109x1 O'6 respectively. All strain profiles are shown in Figure 4-138. Figure 4-139
shows the strain profile in the bonded region at the time when the steel in the debonded
region reached its maximum strain. The length over which the strain reduces from the
127
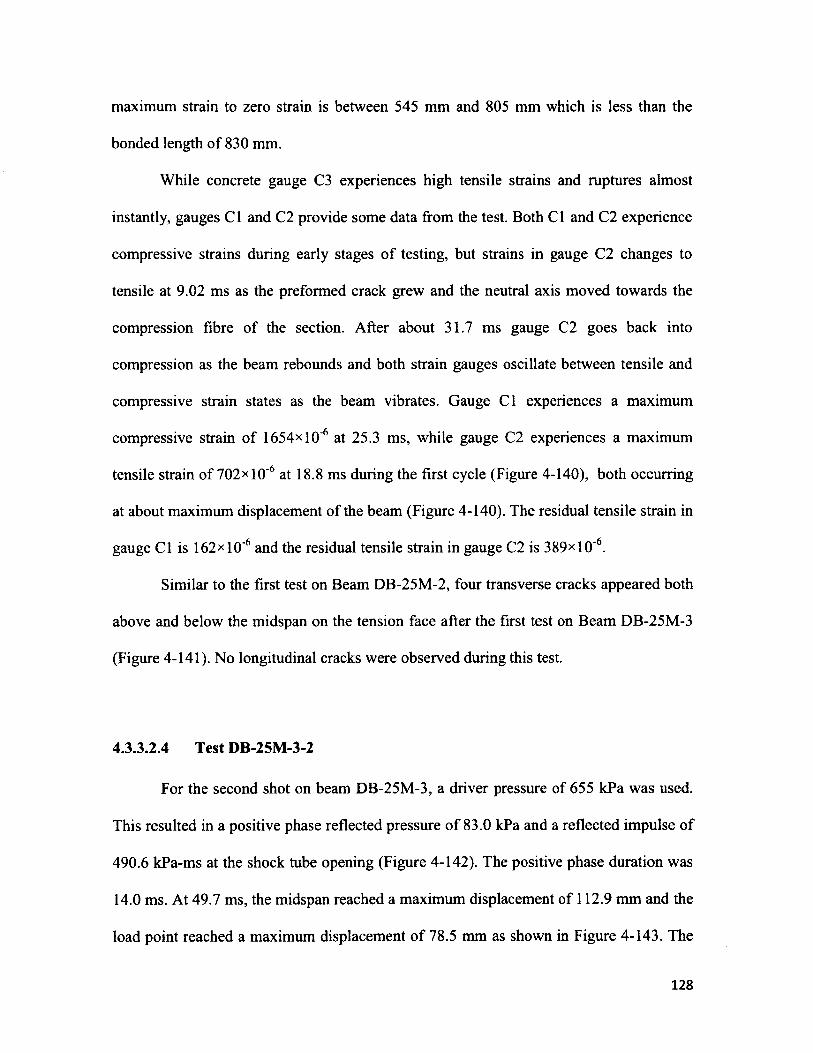
maximum strain to zero strain is between 545 mm and 805 mm which is less than the
bonded length o f 830 mm.
While concrete gauge C3 experiences high tensile strains and ruptures almost
instantly, gauges C l and C2 provide some data from the test. Both Cl and C2 experience
compressive strains during early stages o f testing, but strains in gauge C2 changes to
tensile at 9.02 ms as the preformed crack grew and the neutral axis moved towards the
compression fibre of the section. After about 31.7 ms gauge C2 goes back into
compression as the beam rebounds and both strain gauges oscillate between tensile and
compressive strain states as the beam vibrates. Gauge C l experiences a maximum
compressive strain o f 1654x1 O'6 at 25.3 ms, while gauge C2 experiences a maximum
tensile strain of 702xl0 '6 at 18.8 ms during the first cycle (Figure 4-140), both occurring
at about maximum displacement of the beam (Figure 4-140). The residual tensile strain in
gauge Cl is 162xl0 '6 and the residual tensile strain in gauge C2 is 389xl0‘6.
Similar to the first test on Beam DB-25M-2, four transverse cracks appeared both
above and below the midspan on the tension face after the first test on Beam DB-25M-3
(Figure 4-141). No longitudinal cracks were observed during this test.
4.3.3.2.4 Test DB-25M-3-2
For the second shot on beam DB-25M-3, a driver pressure of 655 kPa was used.
This resulted in a positive phase reflected pressure o f 83.0 kPa and a reflected impulse of
490.6 kPa-ms at the shock tube opening (Figure 4-142). The positive phase duration was
14.0 ms. At 49.7 ms, the midspan reached a maximum displacement of 112.9 mm and the
load point reached a maximum displacement o f 78.5 mm as shown in Figure 4-143. The
128
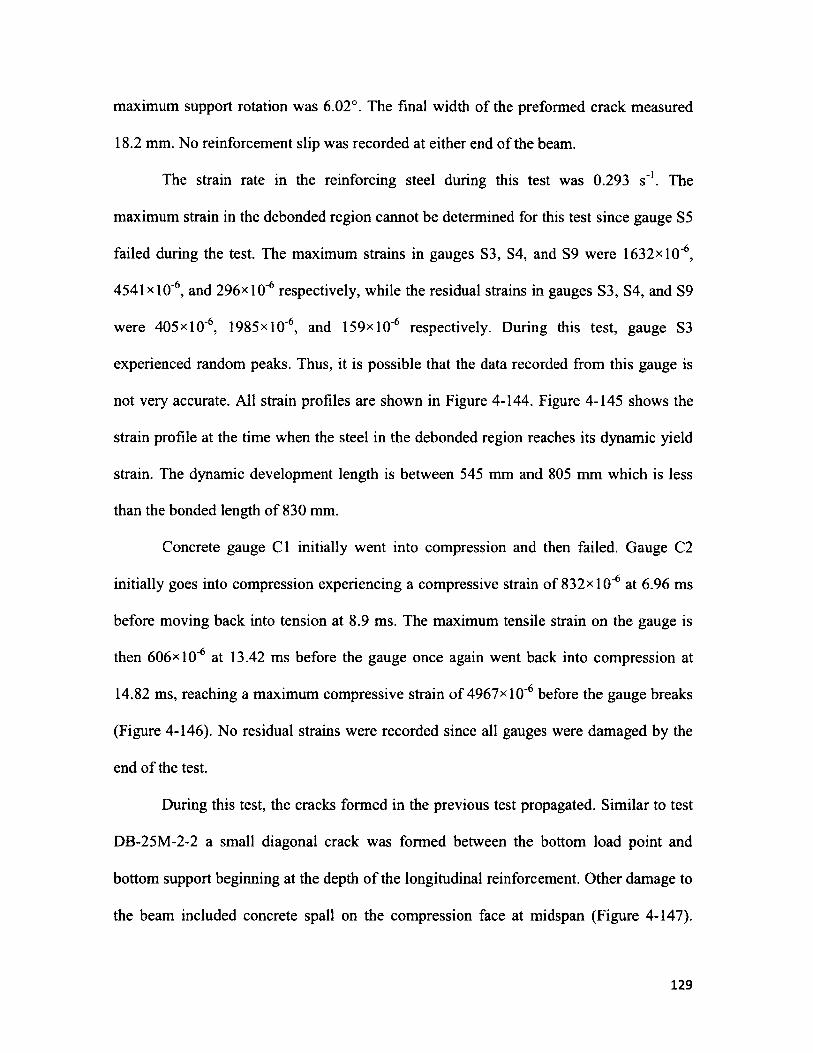
maximum support rotation was 6.02°. The final width of the preformed crack measured
18.2 mm. No reinforcement slip was recorded at either end o f the beam.
The strain rate in the reinforcing steel during this test was 0.293 s '1. The
maximum strain in the debonded region cannot be determined for this test since gauge S5
failed during the test. The maximum strains in gauges S3, S4, and S9 were 1632x1 O'6,
4541 xlO'6, and 296xl0 '6 respectively, while the residual strains in gauges S3, S4, and S9
were 405xl0‘6, 1985xl0’6, and 159xl0'6 respectively. During this test, gauge S3
experienced random peaks. Thus, it is possible that the data recorded from this gauge is
not very accurate. All strain profiles are shown in Figure 4-144. Figure 4-145 shows the
strain profile at the time when the steel in the debonded region reaches its dynamic yield
strain. The dynamic development length is between 545 mm and 805 mm which is less
than the bonded length o f 830 mm.
Concrete gauge C l initially went into compression and then failed. Gauge C2
initially goes into compression experiencing a compressive strain o f 832x1 O'6 at 6.96 ms
before moving back into tension at 8.9 ms. The maximum tensile strain on the gauge is
then 606x1 O’6 at 13.42 ms before the gauge once again went back into compression at
14.82 ms, reaching a maximum compressive strain o f 4967x1 O’6 before the gauge breaks
(Figure 4-146). No residual strains were recorded since all gauges were damaged by the
end o f the test.
During this test, the cracks formed in the previous test propagated. Similar to test
DB-25M-2-2 a small diagonal crack was formed between the bottom load point and
bottom support beginning at the depth o f the longitudinal reinforcement. Other damage to
the beam included concrete spall on the compression face at midspan (Figure 4-147).
129
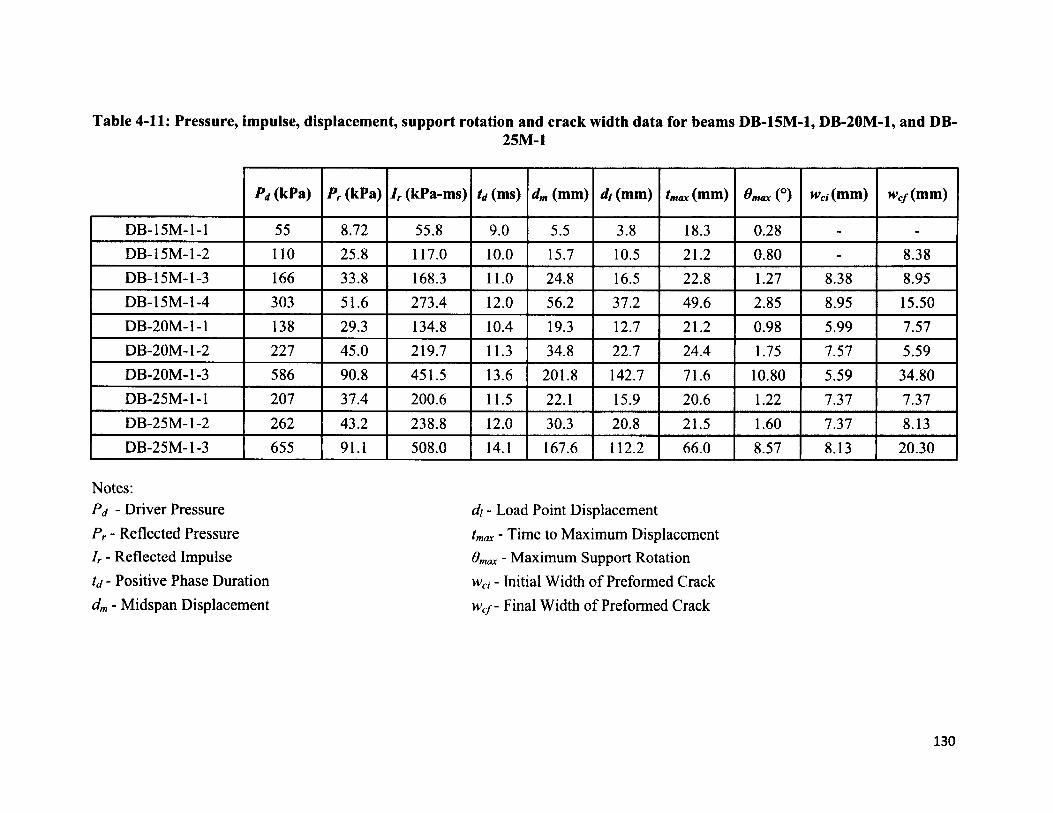
Table 4-11: Pressure, impulse, displacement, support rotation and crack width data for beams DB-15M-1, DB-20M-1, and DB-25M-1
Pd (kPa) Pr (kPa) I r (kPa-ms) td (ms) dm (mm) di (mm) tmax (mm) emax (°) H'ri(mm) wv/(mm)
DB-15M-1-1 55 8.72 55.8 9.0 5.5 3.8 18.3 0.28 - -
DB-15M-1-2 110 25.8 117.0 10.0 15.7 10.5 21.2 0.80 - 8.38DB-15M-1-3 166 33.8 168.3 11.0 24.8 16.5 22.8 1.27 8.38 8.95DB-15M-1-4 303 51.6 273.4 12.0 56.2 37.2 49.6 2.85 8.95 15.50DB-20M-1-1 138 29.3 134.8 10.4 19.3 12.7 21.2 0.98 5.99 7.57DB-20M-1-2 227 45.0 219.7 11.3 34.8 22.7 24.4 1.75 7.57 5.59DB-20M-1-3 586 90.8 451.5 13.6 201.8 142.7 71.6 10.80 5.59 34.80DB-25M-1-1 207 37.4 200.6 11.5 22.1 15.9 20.6 1.22 7.37 7.37DB-25M-1-2 262 43.2 238.8 12.0 30.3 20.8 21.5 1.60 7.37 8.13DB-25M-1-3 655 91.1 508.0 14.1 167.6 112.2 66.0 8.57 8.13 20.30
Notes:P d - Driver Pressure
P r - Reflected Pressure Ir - Reflected Impulse
td - Positive Phase Duration dm - Midspan Displacement
di - Load Point Displacement
tmax - Time to Maximum Displacement Omax - Maximum Support Rotation wci - Initial Width of Preformed Crack
wcf - Final Width o f Preformed Crack
130
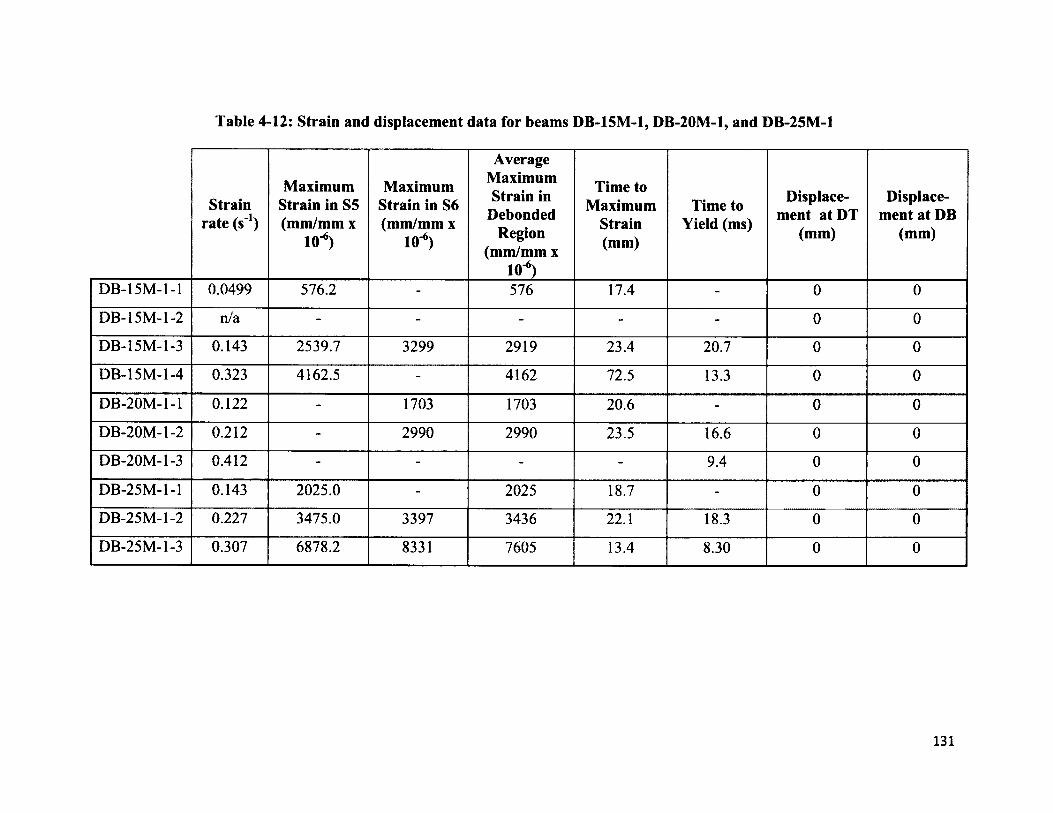
Table 4-12: Strain and displacement data for beams DB-15M-1, DB-20M-1, and DB-25M-1
Strain rate (s'1)
Maximum Strain in S5 (mm/mm x
10-*)
Maximum Strain in S6 (mm/mm x
lO"6)
Average Maximum Strain in
Debonded Region
(mm/mm x lO-6)
Time to Maximum
Strain (mm)
Time to Yield (ms)
Displacement atDT
(mm)
Displacement at DB
(mm)
DB-15M-1-1 0.0499 576.2 - 576 17.4 - 0 0
DB-15M-1-2 n/a - - - - - 0 0
DB-15M-1-3 0.143 2539.7 3299 2919 23.4 20.7 0 0
DB-15M-1-4 0.323 4162.5 - 4162 72.5 13.3 0 0
DB-20M-1-1 0.122 - 1703 1703 20.6 - 0 0
DB-20M-1 -2 0.212 - 2990 2990 23.5 16.6 0 0
DB-20M-1-3 0.412 - - - - 9.4 0 0
DB-25M-1-1 0.143 2025.0 - 2025 18.7 - 0 0
DB-25M-1-2 0.227 3475.0 3397 3436 22.1 18.3 0 0
DB-25M-1-3 0.307 6878.2 8331 7605 13.4 8.30 0 0
131
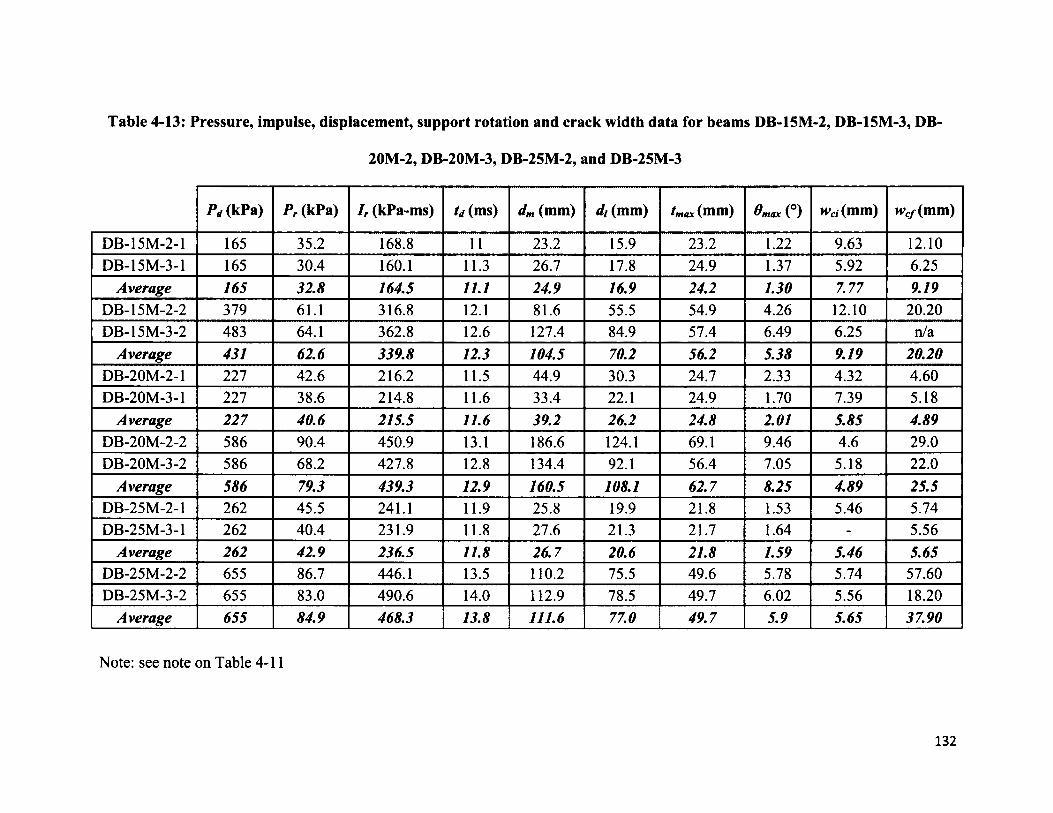
Table 4-13: Pressure, impulse, displacement, support rotation and crack width data for beams DB-15M-2, DB-15M-3, DB-
20M-2, DB-20M-3, DB-25M-2, and DB-25M-3
Pd (kPa) Pr (kPa) Ir (kPa-ms) td (ms) dm (mm) di (mm) tmax (mm) emax n wcl(mm) H>c/(m m )
DB-15M-2-1 165 35.2 168.8 11 23.2 15.9 23.2 1.22 9.63 12.10DB-15M-3-1 165 30.4 160.1 11.3 26.7 17.8 24.9 1.37 5.92 6.25
Average 165 32.8 164.5 11.1 24.9 16.9 24.2 1.30 7.77 9.19DB-15M-2-2 379 61.1 316.8 12.1 81.6 55.5 54.9 4.26 12.10 20.20DB-15M-3-2 483 64.1 362.8 12.6 127.4 84.9 57.4 6.49 6.25 n/a
Average 431 62.6 339.8 12.3 104.5 70.2 56.2 5.38 9.19 20.20DB-20M-2-1 227 42.6 216.2 11.5 44.9 30.3 24.7 2.33 4.32 4.60DB-20M-3-1 227 38.6 214.8 11.6 33.4 22.1 24.9 1.70 7.39 5.18
Average 227 40.6 215.5 11.6 39.2 26.2 24.8 2.01 5.85 4.89DB-20M-2-2 586 90.4 450.9 13.1 186.6 124.1 69.1 9.46 4.6 29.0DB-20M-3-2 586 68.2 427.8 12.8 134.4 92.1 56.4 7.05 5.18 22.0
Average 586 79.3 439.3 12.9 160.5 108.1 62.7 8.25 4.89 25.5DB-25M-2-1 262 45.5 241.1 11.9 25.8 19.9 21.8 1.53 5.46 5.74DB-25M-3-1 262 40.4 231.9 11.8 27.6 21.3 21.7 1.64 - 5.56
Average 262 42.9 236.5 11.8 26.7 20.6 21.8 1.59 5.46 5.65DB-25M-2-2 655 86.7 446.1 13.5 110.2 75.5 49.6 5.78 5.74 57.60DB-25M-3-2 655 83.0 490.6 14.0 112.9 78.5 49.7 6.02 5.56 18.20
Average 655 84.9 468.3 13.8 111.6 77.0 49.7 5.9 5.65 37.90
Note: see note on Table 4-11
132
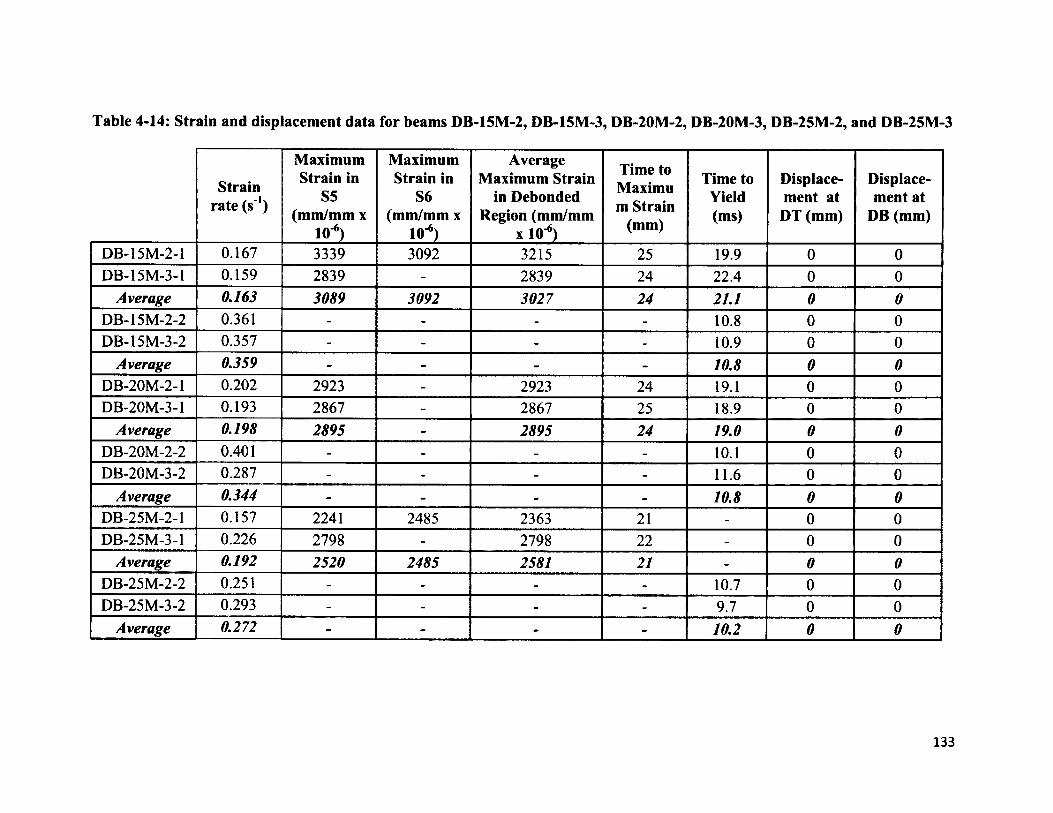
Table 4-14: Strain and displacement data for beams DB-15M-2, DB-15M-3, DB-20M-2, DB-20M-3, DB-25M-2, and DB-25M-3
Strain rate (s'1)
Maximum Strain in
S5(mm/mm x
ltT6)
Maximum Strain in
S6(mm/mm x
KT6)
Average Maximum Strain
in Debonded Region (mm/mm
x KT6)
Time to Maximu m Strain
(mm)
Time to Yield (ms)
Displacement at
DT (mm)
Displacement at
DB (mm)
DB-15M-2-1 0.167 3339 3092 3215 25 19.9 0 0DB-15M-3-1 0.159 2839 - 2839 24 22.4 0 0
Average 0.163 3089 3092 3027 24 21.1 0 0DB-15M-2-2 0.361 - - - - 10.8 0 0DB-15M-3-2 0.357 - - - - 10.9 0 0
Average 0.359 - - - - 10.8 0 0DB-20M-2-1 0.202 2923 - 2923 24 19.1 0 0DB-20M-3-1 0.193 2867 - 2867 25 18.9 0 0
Average 0.198 2895 - 2895 24 19.0 0 0DB-20M-2-2 0.401 - - - - 10.1 0 0DB-20M-3-2 0.287 - - - - 11.6 0 0
Average 0.344 - - - - 10.8 0 0DB-25M-2-1 0.157 2241 2485 2363 21 - 0 0DB-25M-3-1 0.226 2798 - 2798 22 - 0 0
Average 0.192 2520 2485 2581 21 - 0 0DB-25M-2-2 0.251 - - - - 10.7 0 0DB-25M-3-2 0.293 - - - - 9.7 0 0
Average 0.272 - - - - 10.2 0 0
133
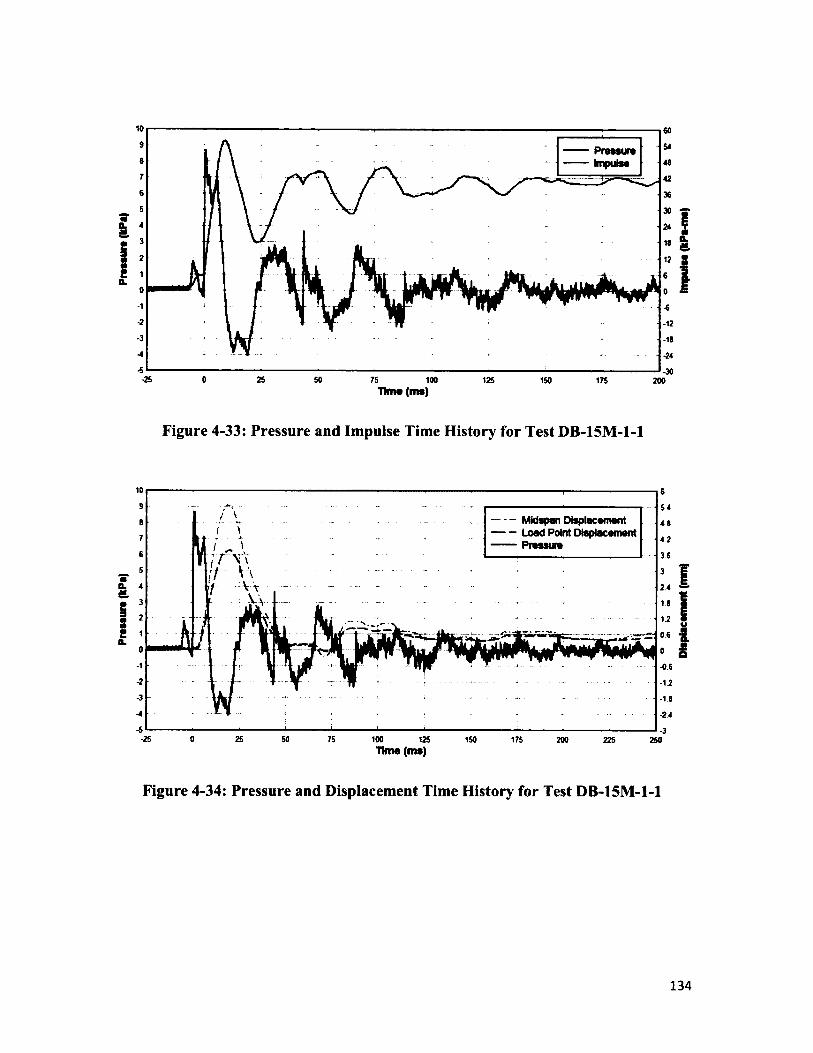
Praaa
ura
(kPa)
Praa
aura
(k
Pa)
109
87
654
3210■1-2 -12
-3 -18
4 -24
-30-25 0 25 50 75 100 125 150 175 200
Time (ms)
Figure 4-33: Pressure and Impulse Time History for Test DB-15M-1-1
109 54
- - Midspan Displacement- - Load Point Displacement- Pressure
6 4 8
7 4 2
6 36
5
4 2 4
3
21 06
0•1-2-3 - 1.8
4 -24
-5•25 0 25 50 75 100 125 150 175 200 225 250
Time (ms)
Figure 4-34: Pressure and Displacement Time History for Test DB-15M-1-1
134
Dtap
iacam
ant
(mm)
Im
pulaa
(k
Pa-rn
a)
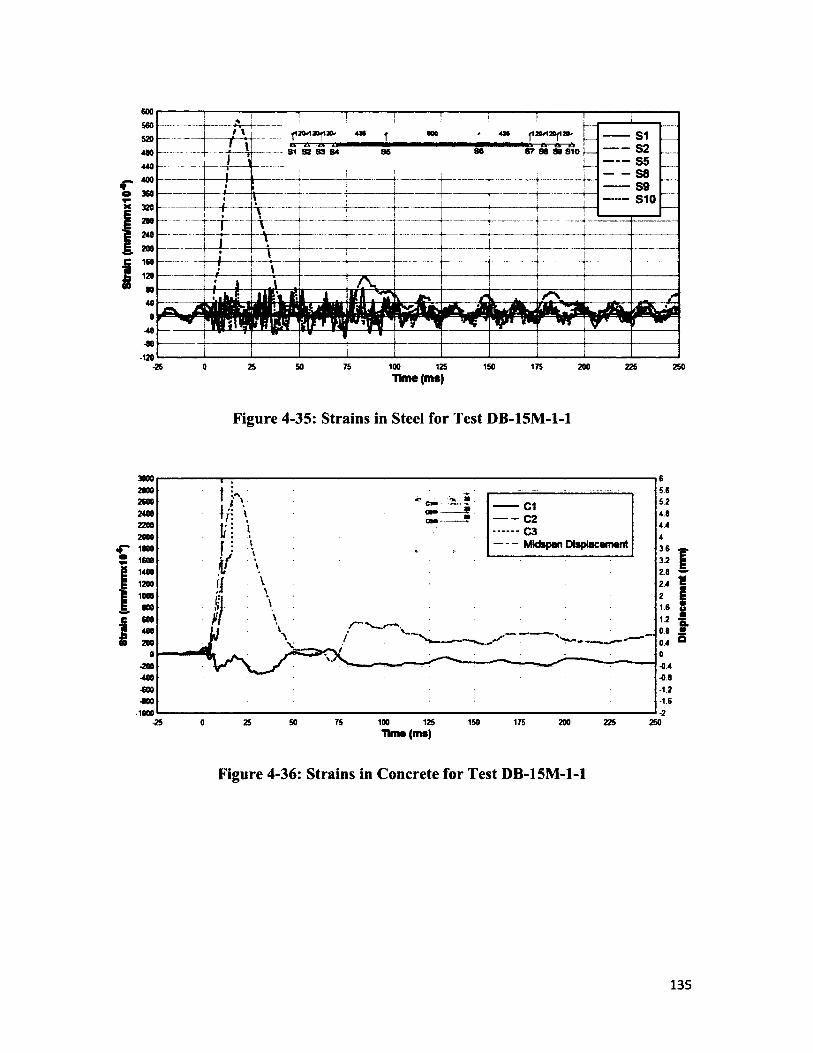
8traln
(m
nVm
mxI
O4)
|121M20f12 a —* —a —sm 31 82 83 84
-25 0 25 50 75 100 125 150 175 200 225 250Time (ms)
Figure 4-35: Strains in Steel for Test DB-15M-1-1
30002800 5.6
5.24.84.4
— C1- - C2
- C3- ~ Midspan Displacement
24002200200018001600140012001000800600
363.22.82.4
1.2080.4200
•200 •04 -0 8 -1.2 -1.6
•600•800
-1000175 225 250-25 25 SO 75 100 125 150 2000
Time (ms)
Figure 4-36: Strains in Concrete for Test DB-15M-1-1
135
DIsp
lacM
rant
(m
m)
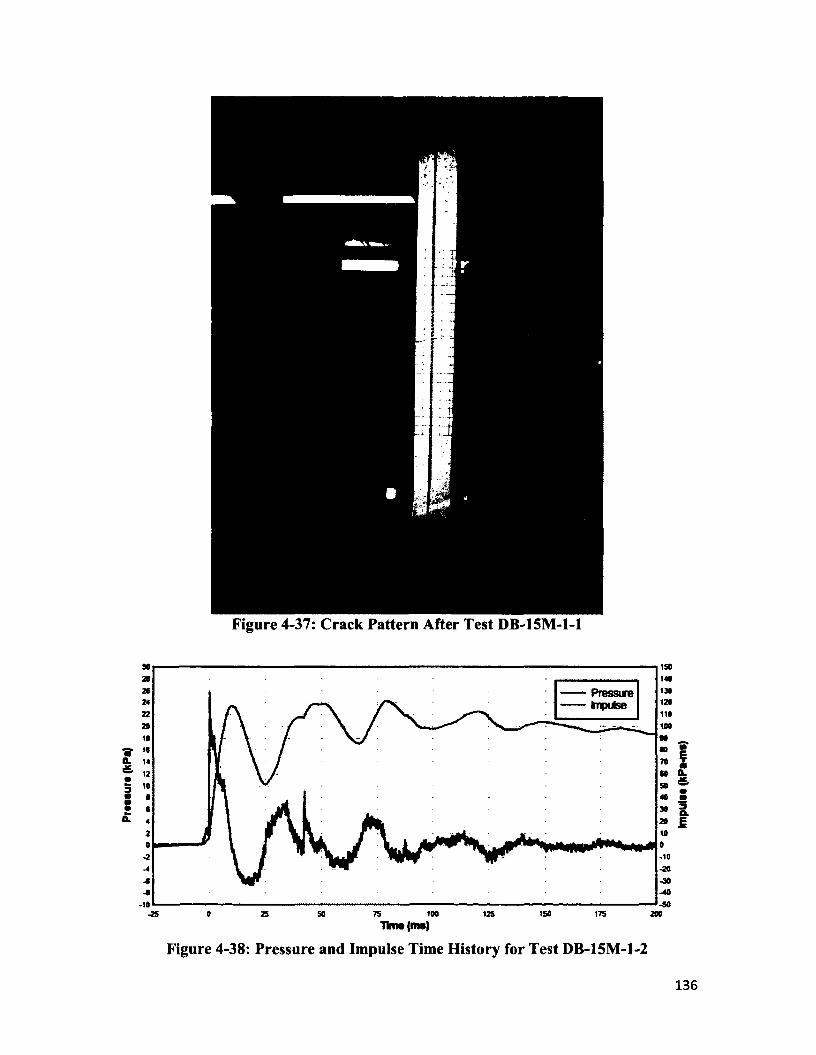
8 W
K 8
M a
Figure 4-37: Crack Pattern After Test DB-15M-1-1
ISO140130120110100
Pressurefrnputee
80
3
1500 25 SO 75 100 125 175 200-25
O.&
a .E
Tim* (ms)
Figure 4-38: Pressure and Impulse Time History for Test DB-15M-1-2
136
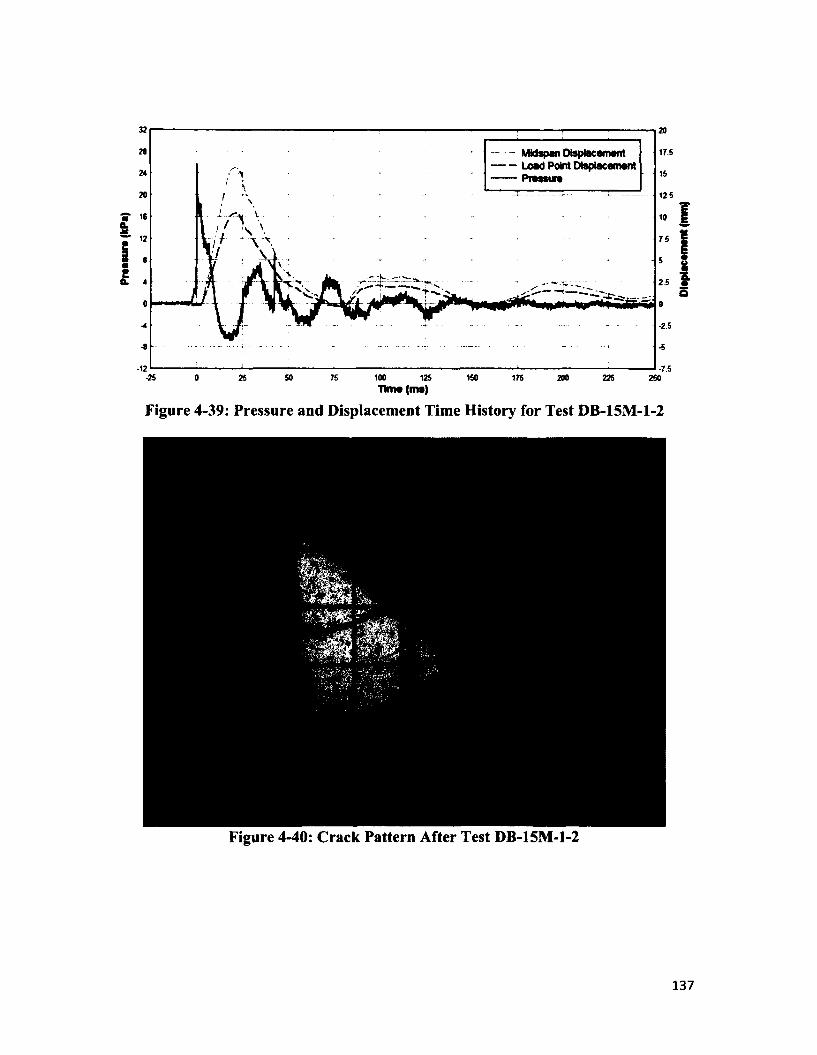
Praaa
ura
(kPa
)
■ Midapan Diaplacamant- Load Point Diaplacamant— Praaaura
17.5
12 5
7 5
2 5//"
-2.5
-12 -7.5-25 100 1500 26 50 75 125 175 200 225 250
Tima (ms)
Figure 4-39: Pressure and Displacement Time History for Test DB-15M-1-2
Figure 4-40: Crack Pattern After Test DB-15M-1-2
137
Diap
lacam
ant
(mm
)
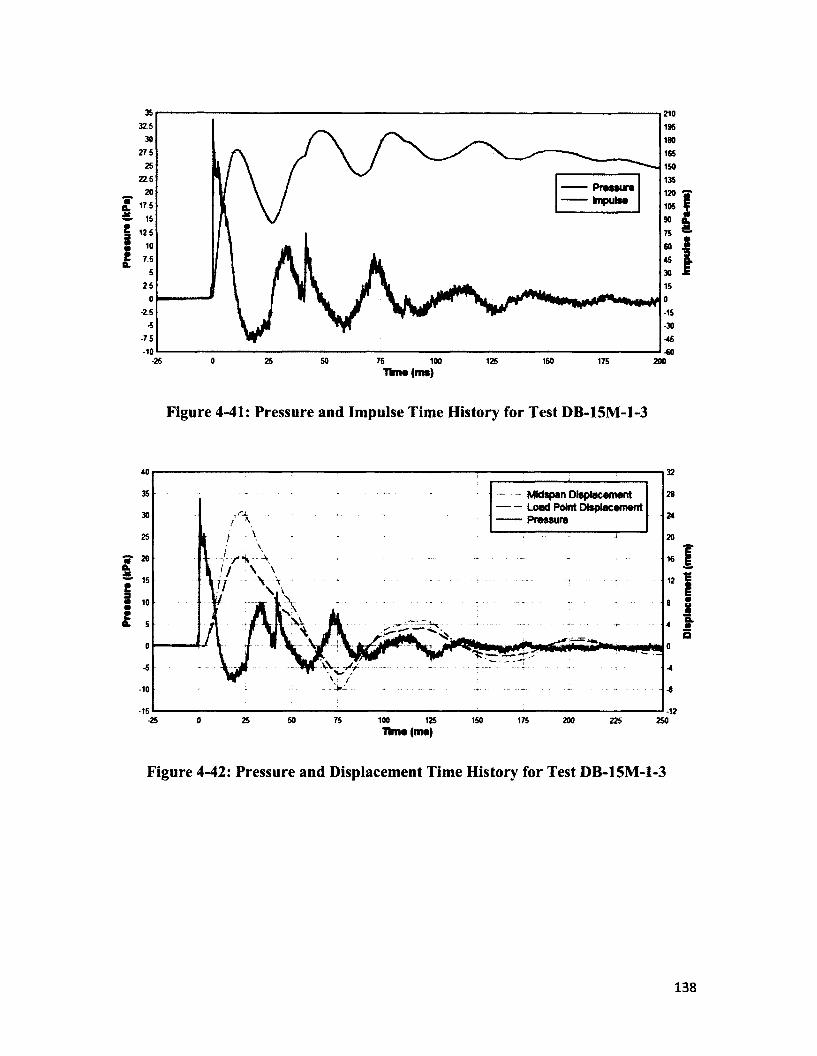
Praa
aura
(kP
a) Pr
aaau
ra (
kPa)
210195
180
165150
135
120105
325
275
225
175
2 5
-25 -15-30-45-60
-75-10
-25 0 25 50 75 100 150125 175 200Time (ms)
Figure 4-41: Pressure and Impulse Time History for Test DB-15M-1-3
Midspan Displacement Load Point Displacement Pressure
-10-15 -12
-25 0 25 50 75 100 125 150 200 225 250175Time (ms)
Figure 4-42: Pressure and Displacement Time History for Test DB-15M-1-3
138
Diap
lacam
ant
(mm)
Im
pul**
(k
Pa-m
a)
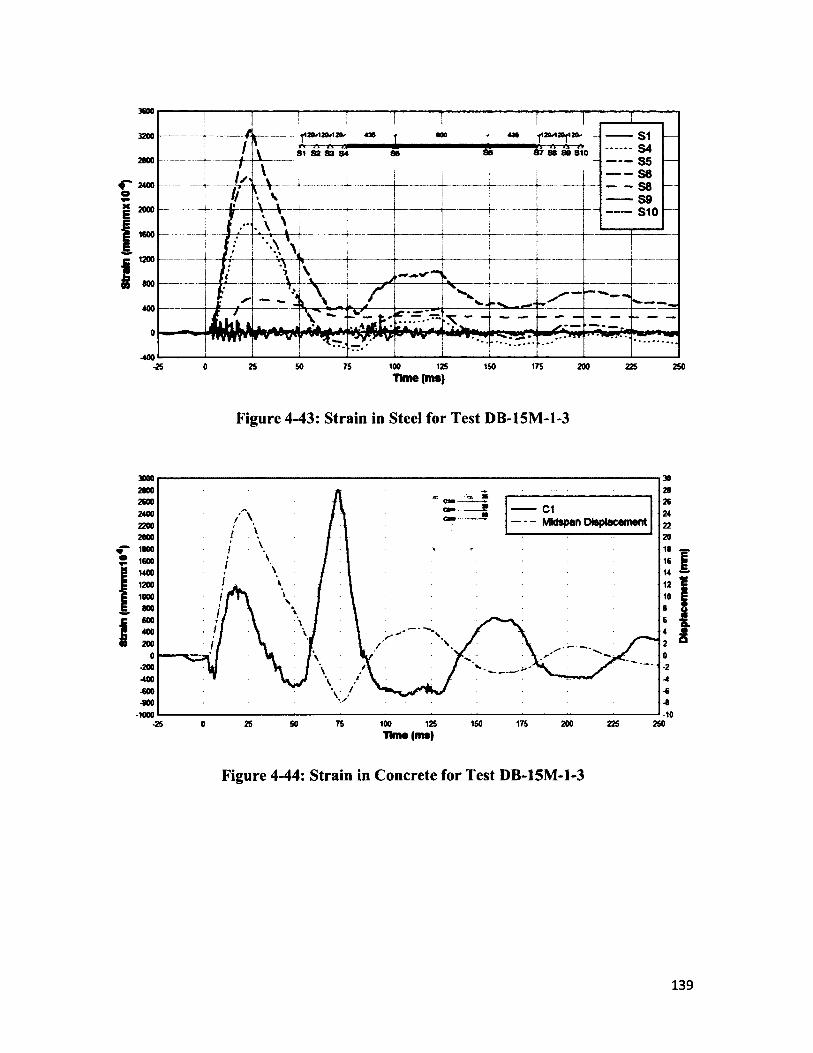
Strain
(m
mftn
mxI
O4)
jiaMaOflzO* 435 |f t A A £
435 -flSri&ftaO* a a A
8 7 88 8 0 91081 88 S3 84
100 126 Time (ms)
Figure 4-43: Strain in Steel for Test DB-15M-1-3
3000200026002400220020001800
cam Midspan Displacement
2 1600i uoo
1200 1000
_ 800 C 600
1 400 8 200
•200
-600-800
•1000 -1075 100 126 150 175 200 225 260
Tima (ms)
Figure 4-44: Strain in Concrete for Test DB-15M-1-3
139
Dltp
tacM
iwnt
(m
m)
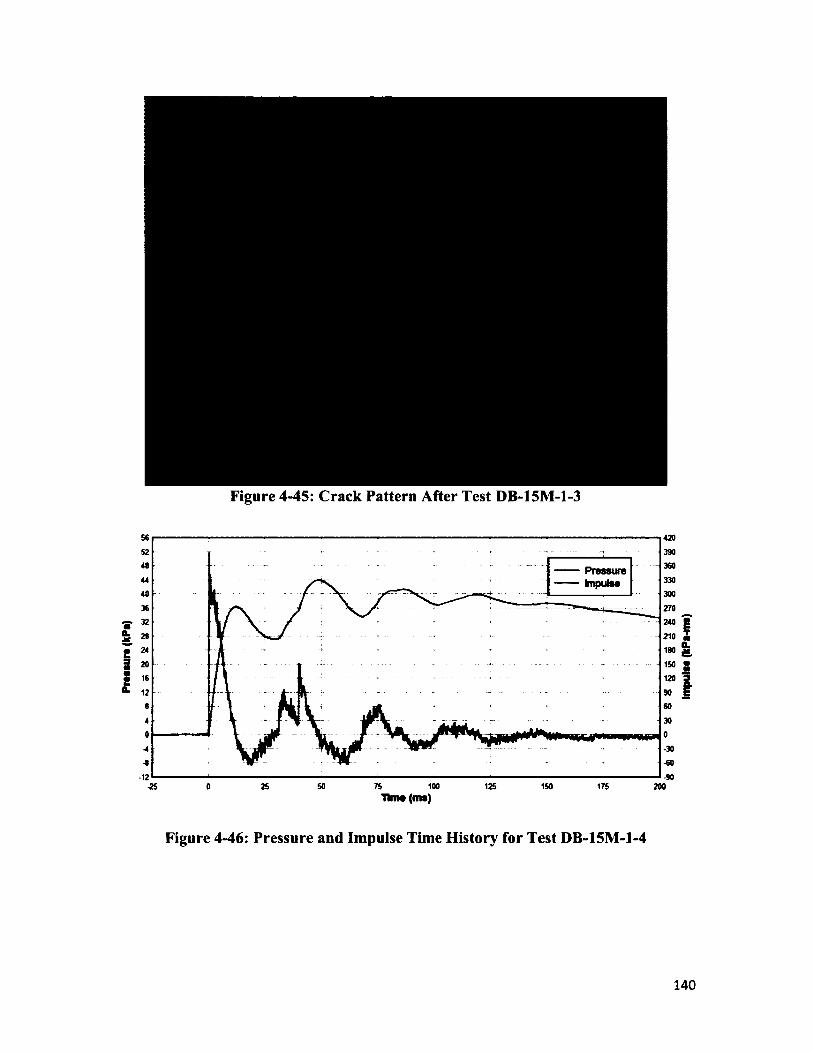
Pras
tun
(kPa
)
Figure 4-45: Crack Pattern After Test DB-15M-1-3
420
390
360
330
300
270
240
PressureImpulse
210 i 160 &
150 •
120 *5
-12 -9025 SO 75 100 125 150-25 0 175 200
Time (ms)
Figure 4-46: Pressure and Impulse Time History for Test DB-15M-1-4
140
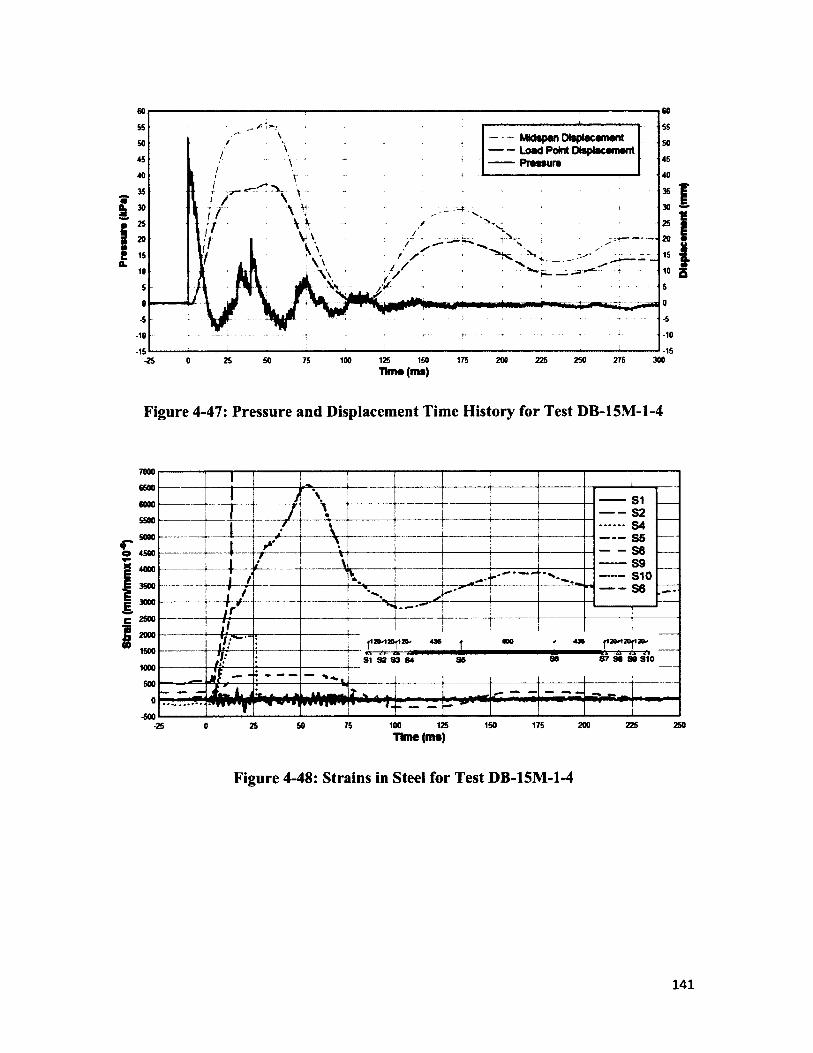
Strain
(m
m/m
mxI
O-*)
Praa
aura
(k
Pa)
- - Mkispan Diaplacamant- — Load Point Displacamam— Praaaura
-10-10
-15-15 275 300150 175 200 225 25025 50 75 100 125-25 0Tima (ms)
Figure 4-47: Pressure and Displacement Time History for Test DB-15M-1-4
fOOO5500
1 ......................... ' ..........7i1 ------ S1
------ S2........ S4------ S5------ S8------ S9------S10------ S6
5500 1 j \mI
f «\ ----4500 | * .........Y H
1T " '
V I ----3500
t ; I /
J / .... i ,2500 y [___-* ------- T----
L .................ii
1500|iaM20 12(P 436 | 600 * 436 |t20 t20|120
----S1 82 S3 84 SB 86 87 88 80 810
5000
-500
— — —, a : i. i — — -
25 0 25 SO 75 100 125 150 175 200 22S 2S0Time (ms)
Figure 4-48: Strains in Steel for Test DB-15M-1-4
141
Diap
lacam
ant
(mm
)
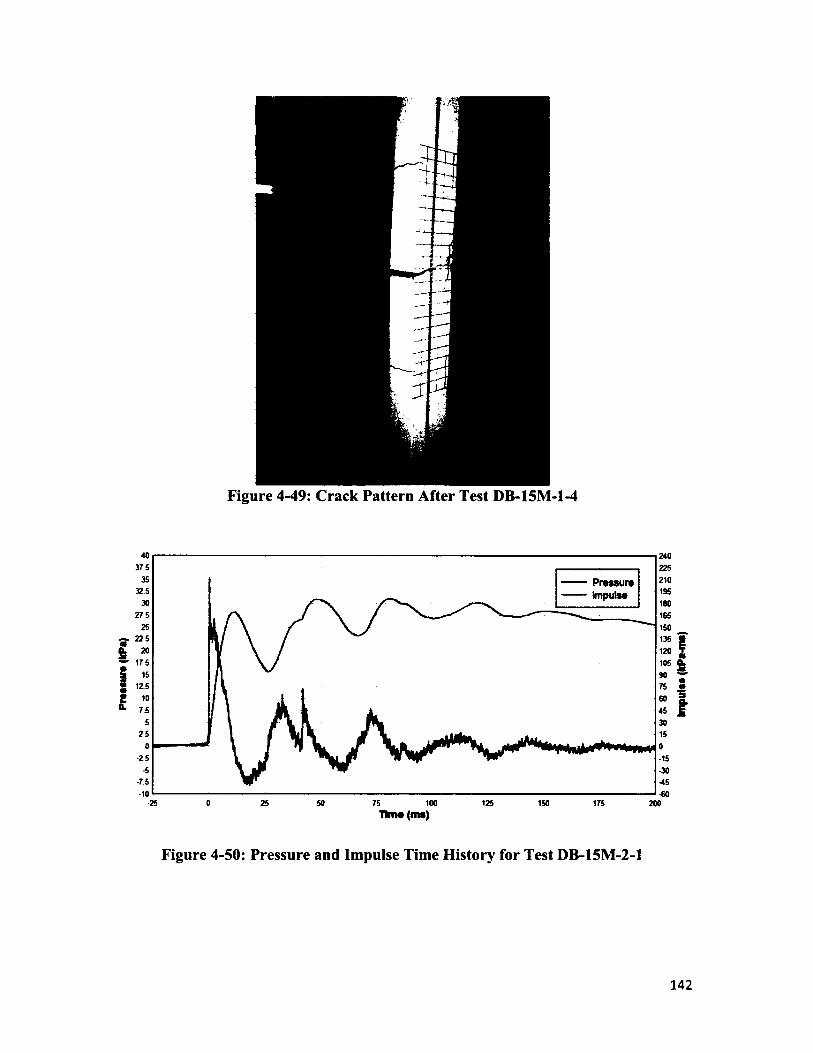
Prac
iur*
(k
Pa)
Figure 4-49: Crack Pattern After Test DB-15M-1-4
240226210196180165150135120105
375PressureImpulse325
275
225
175
12.5
75
25
-2 5 -15-30-45-60
-75-10
-25 0 25 50 75 100 125 150 175 200Time (ms)
Figure 4-50: Pressure and Impulse Time History for Test DB-15M-2-1
142
knpu
lM
(kPa
-ms)
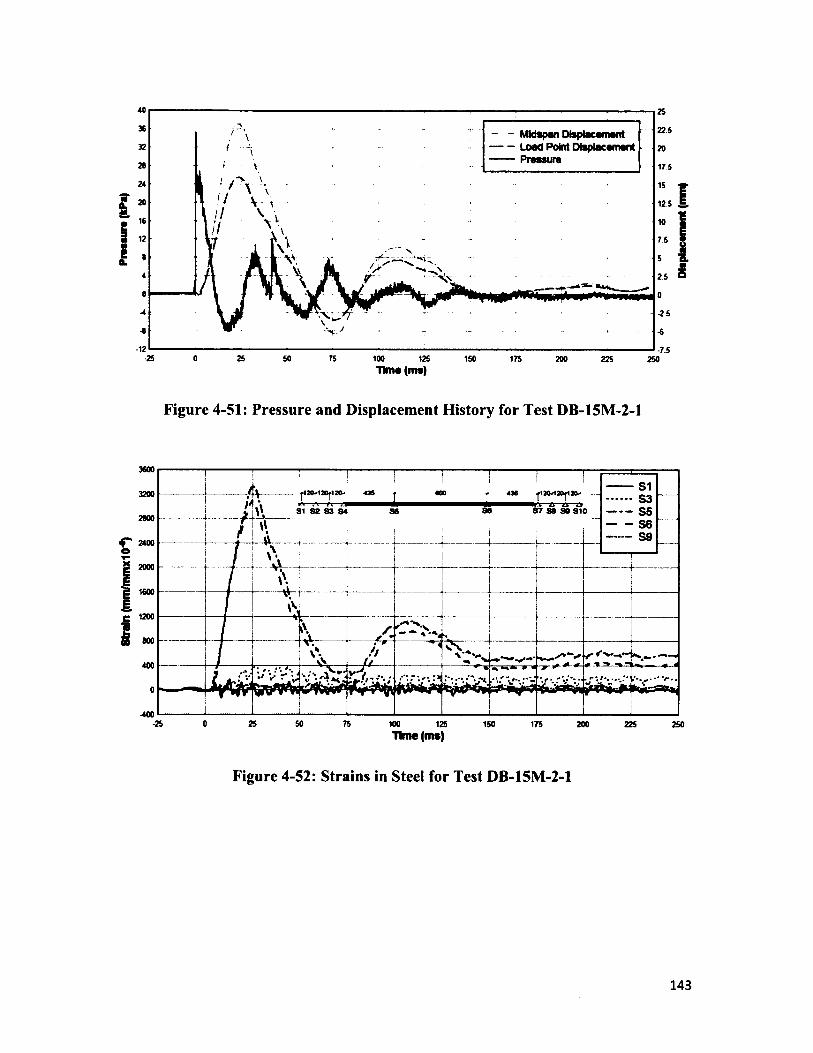
Strain
(m
m/m
mxH
r*)
Proo
ourt
(kPa
)225- MWapan Displacement
- Load Point Diaplacamant- Praaaura
175
12.5
75
25
-25
-12 -7.5-25 0 25 50 75 100 125 150 175 200 225 250
Tima (ms)
Figure 4-51: Pressure and Displacement History for Test DB-15M-2-1
436 436 20*12020*■ft a a a 87 88 aa 810
3200 S35556 S9
80SO2(00
2(00
2000
1600
1200
800
r r '~- -■»=»- •.t r -■ ■ry
400
-26 0 26 60 75 100 125 150 175 200 225 250Time (ms)
Figure 4-52: Strains in Steel for Test DB-15M-2-1
143
Dtep
tacM
iMnt
(m
m)
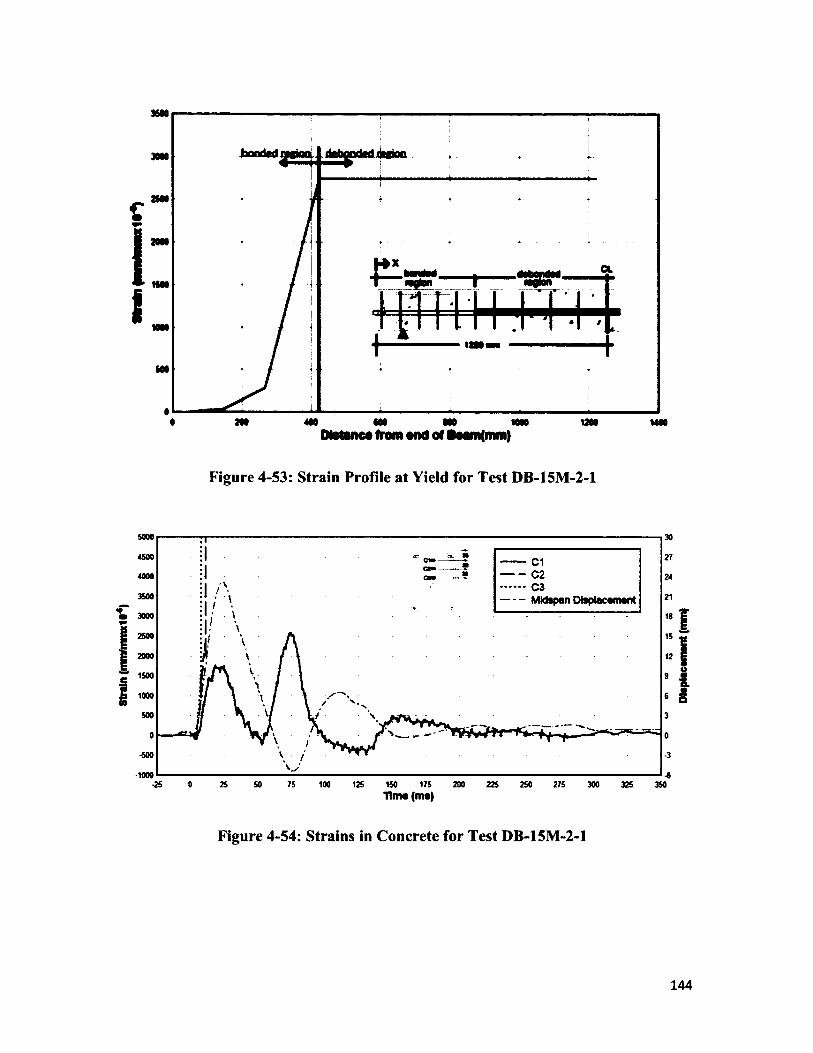
jggioa
C
1I
2M m 1JOODtetanca from *nd of lNm(mm)
Figure 4-53: Strain Profile at Yield for Test DB-15M-2-1
5000
4500 C1 C24000
C3Mfctapan Displacement3500
e 3000
2500
2000
1500
1000V .
500
-500
-1000-25 0 2S 50 75 100 125 150 175 200 225 250 275 300 325 350
Tim* (ms)
Figure 4-54: Strains in Concrete for Test DB-15M-2-1
144
Diap
lacam
ant
(mm
)
PrtM
ura
(kPa
)
Figure 4-55: Crack Pattern After Test DB-15M-2-1
520
480PressureImpulse 400
380320280240200
160120
40-10 •80
-25 0 25 50 75 100 125 150 175 200Time (ms)
Figure 4-56: Pressure and Impulse Time History for Test DB-15M-2-2
145
Impu
lse
(kPa
-fns)
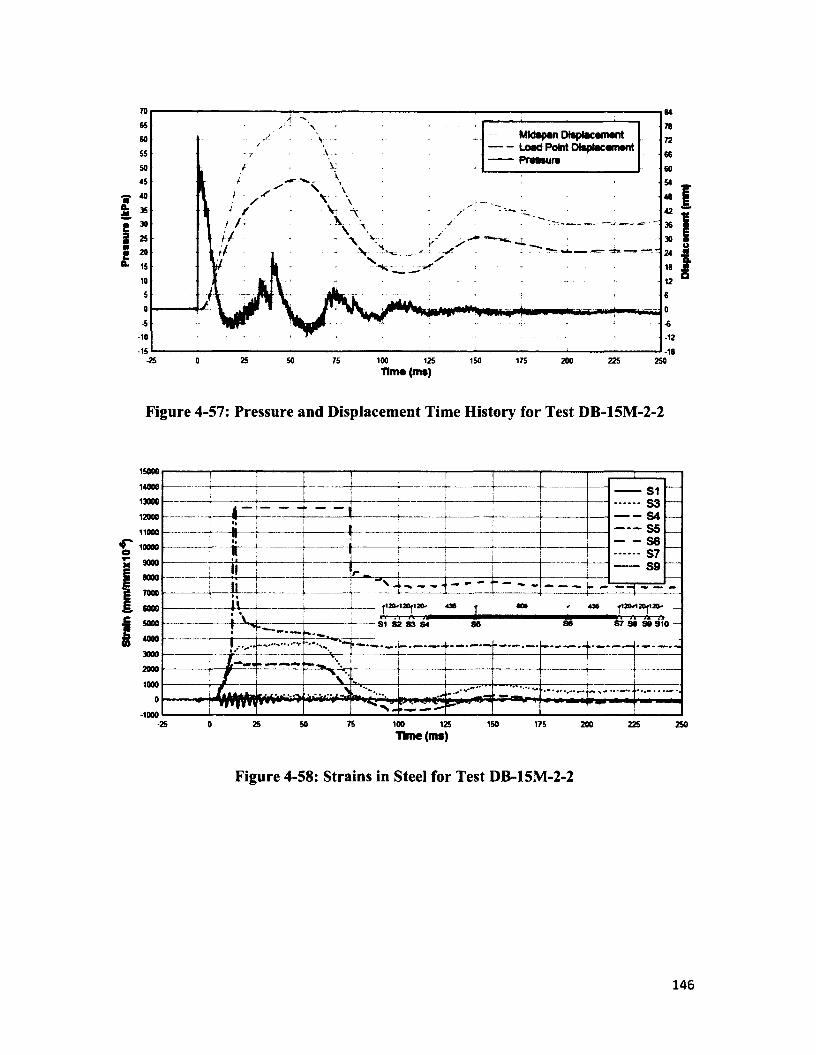
- - MWmpan Displacement Load Point Displacement Pressure
«a.M
1m
v ‘-ic
f t .
-10
-15
-12
-18-25 25 50 75 100 150 2250 125 175 200 250
Tim# (ms)
Figure 4-57: Pressure and Displacement Time History for Test DB-15M-2-2
15000 ------------------------------------- -i
! | ___ l____-----------S1
i |
12000 i !
m
: 1
1•i..........k..................................
T ! 1
__•i
J ■I ;......................4..... ...........+......................
[ -----------SB
.............. S7
----------S9 —o R
*«1
1 8000ii L !
ii ...............i...................... i .........r * * .......H 1 «12(M20r120' 430 « 400 430 f120*120f120*
■ \i l l l
o —£ 5000<
------— SI S2 S3 84 86 88 87 88 80 81
I , - ------------------ ------------------
ft‘v-
/ N \
0
-1000
■ ... ........... ...------------.
A -
-25 0 25 SO 75 100 125 150 175 200 225 250Time (ms)
Figure 4-58: Strains in Steel for Test DB-15M-2-2
146
Dlsp
lacsm
snt
(mm
)
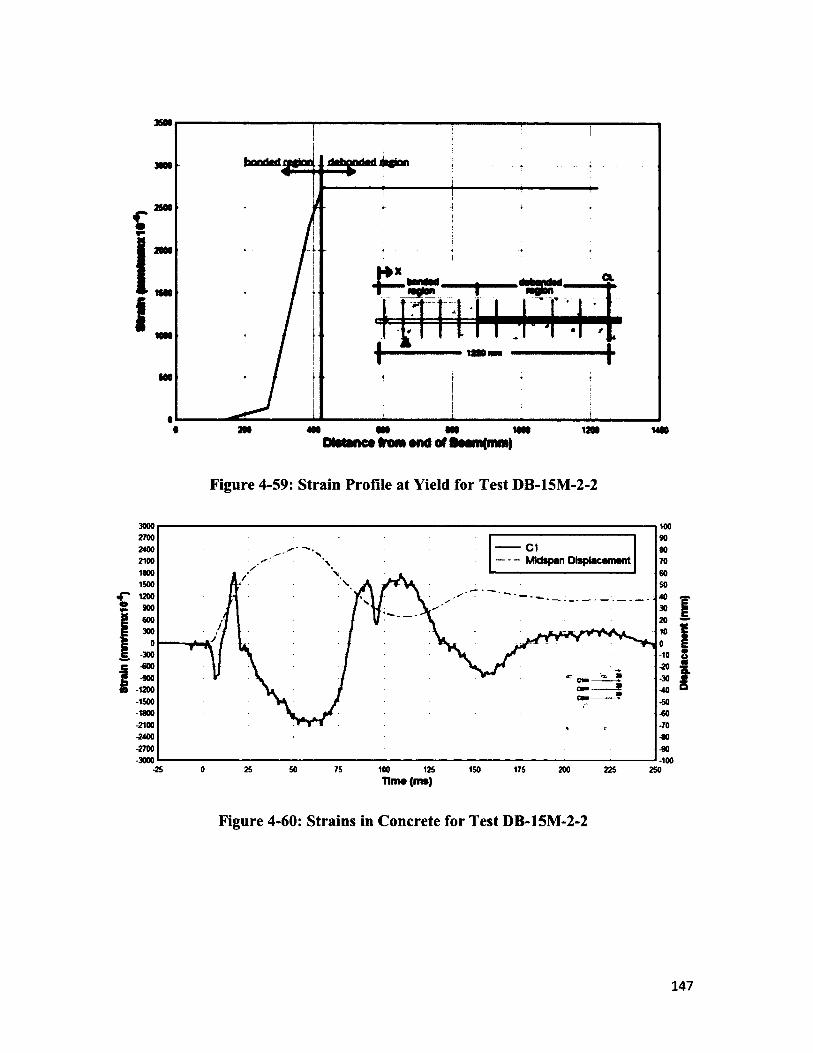
3000
_ 2SOO
C| .
• tsaoI
200 •N MO MN MMDtstanc* from ami of Boam(mm)
Figure 4-59: Strain Profile at Yield for Test DB-15M-2-2
3000270024002100100015001200900600300
— C1* - Midspan Displacement
-300-600-900
-1200-1500-1800-2100-2400-2700-3000
cm
-25 25 500 75 100 125 150 175 200 22S 250Time (me)
Figure 4-60: Strains in Concrete for Test DB-15M-2-2
147
kb
bk
kk
k
kk
ka
*2
ss
ss
as
sg
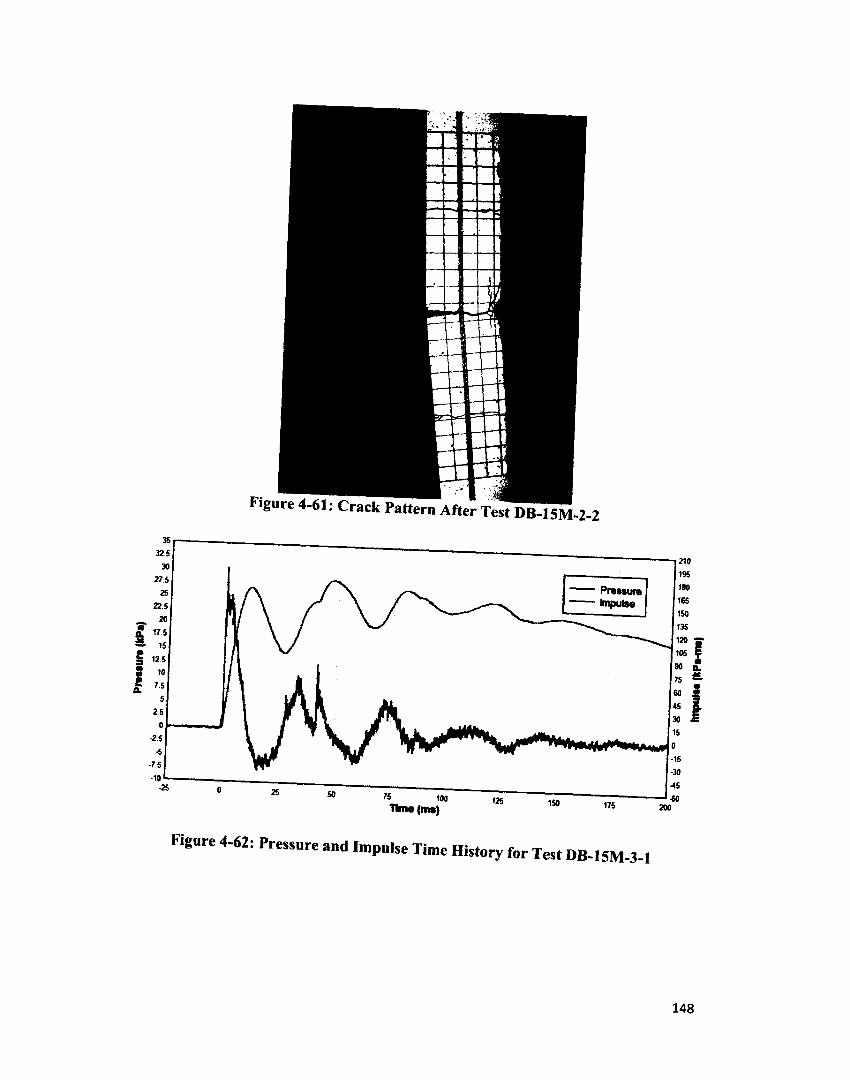
Press
ure
(kPa
)
Figure 4-61: Crack Pattern After Test DB-15M-2-2
21019527!
Pressure Impulse 165
150
135120105
22!
17,5
125
7.5
2 5
-25
-15
-30-75
-10-25
too 125 150 175 200
Figure 4-62: Pressure and Impulse Time History for Tes. DB-15M-3-I
148
■•"p
ulse
(kPa
-ms)
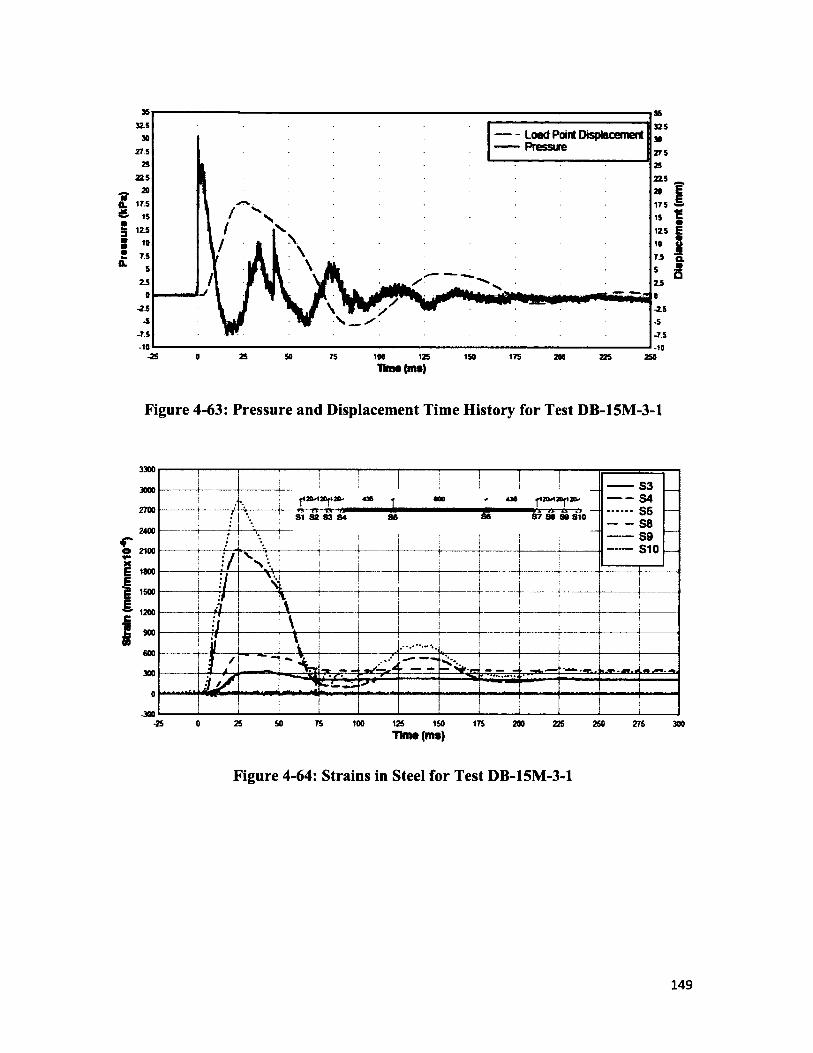
32.5 32.5Load Point Displacement Pressure27.5 2 7 5
2 2 5 2 2 5
flL 1 * 5 17.5
125
7.5
2 5
-7.5-10
-7 .5
-102 5 500 75 100 125 150 175 225 250
Tima (ms)
Figure 4-63: Pressure and Displacement Time History for Test DB-15M-3-1
3300r ................. [ ' ! ! !
! i i ------------S 3
2 700
2 400
434 « 400 436 ------------ 5 4
5 5
5 8
5 9
S 1 0
_.................. . I' .............. /\
S I S 2 S 3 8 4 S B SB 8 7 SB SO 8 1 0 1 !
!
1 1
i/*.
i i
X\ i
^ 1500
E^ 1200
\ 1
V .S j
.................. ~!
! i t
j. n
\
s
: / \
u 500 j •'»
I
300| 'J y / ? H ~ ~~
S i * M — 4- L .- B u r r ^ " : U R i J T i ! 1 * 1 ^ * **«
0
-300
= r j —
"1
•25 0 2 5 50 75 100 125 150 175 2 00 225 2 50 2 75 300
Time (ms)
Figure 4-64: Strains in Steel for Test DB-15M-3-1
149
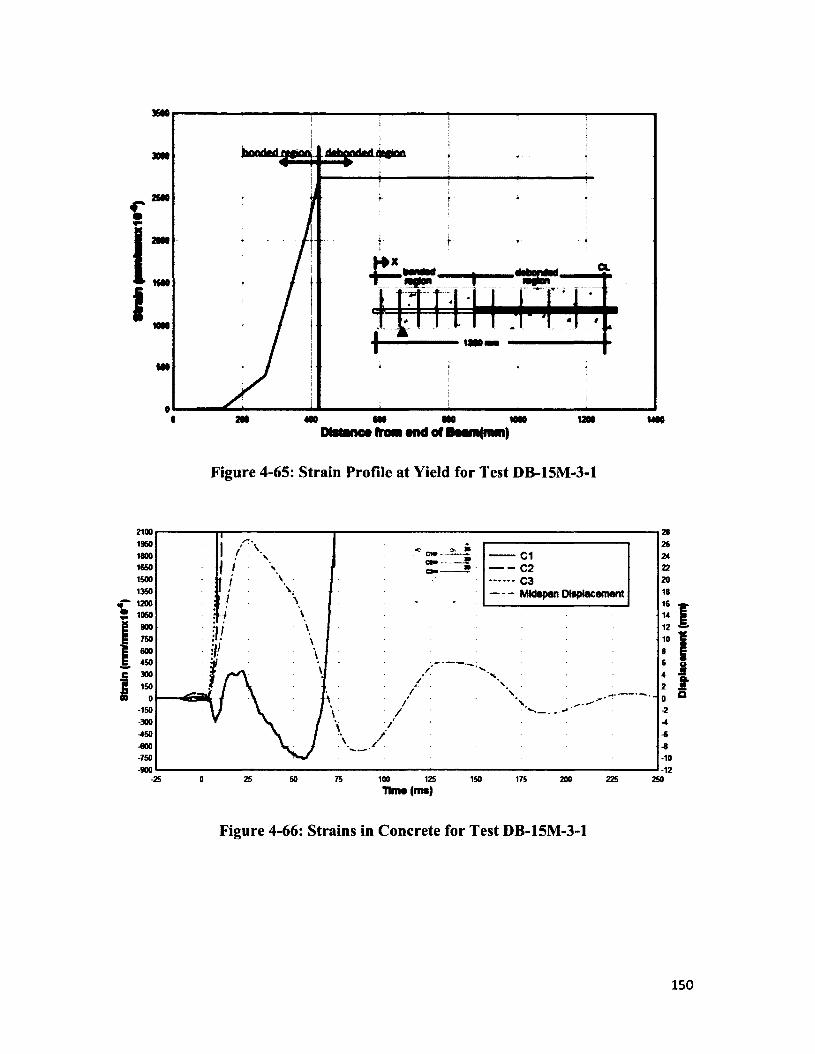
2M0cwII
a t MO 1MOMO CMDMano* from mmI of
Figure 4-65: Strain Profile at Yield for Test DB-15M-3-1
2100I960180016501500135012001050900750600450300150
— C1- - C2— C3— - Midspan Displacement
cm
-150-300450-600-750•900
•10-12
-25 25 50 75 1250 100 150 175 200 250Time (ms)
Figure 4-66: Strains in Concrete for Test DB-15M-3-1
150
Dlop
lacom
ont
(mm
)
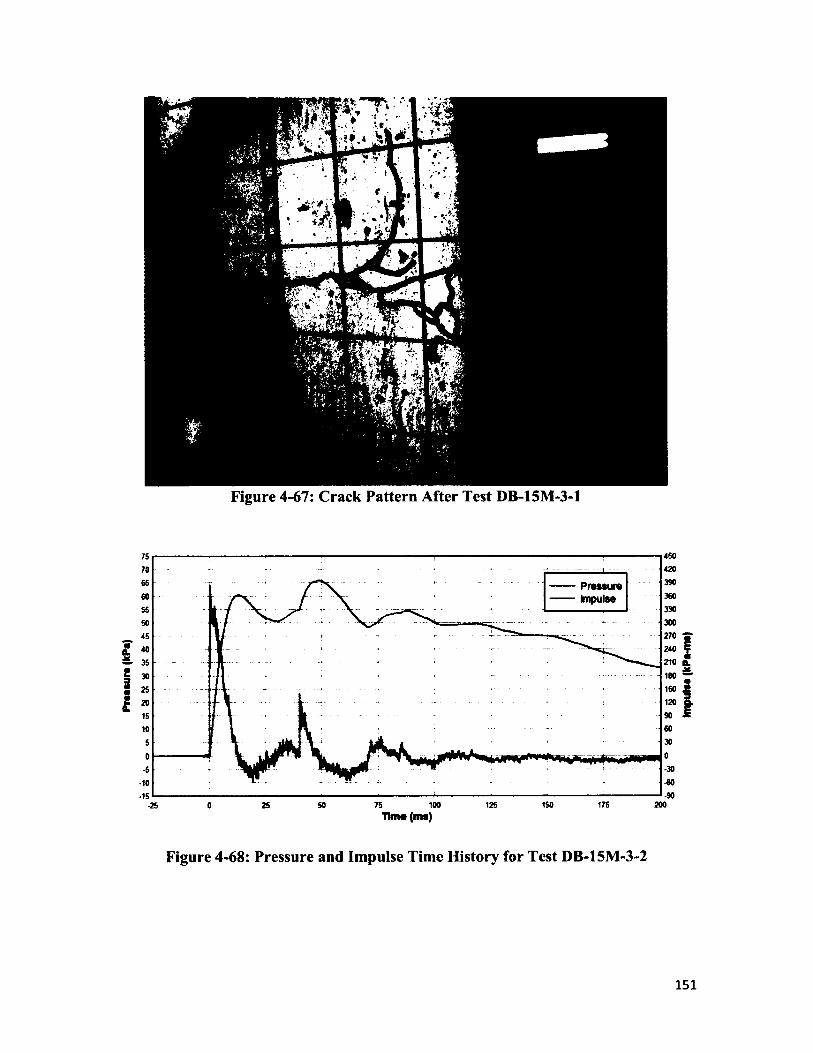
Praa
aura
(k
Pa)
Figure 4-67: Crack Pattern After Test DB-15M-3-1
75
70
65
60
555045
4035
30
252015
105
0-5
-10-15
Pressureimpulse
150 175 20025 SO 100 1250Tim# (ms)
Figure 4-68: Pressure and Impulse Time History for Test DB-15M-3-2
151
Impu
lse
(kPa
-ms)
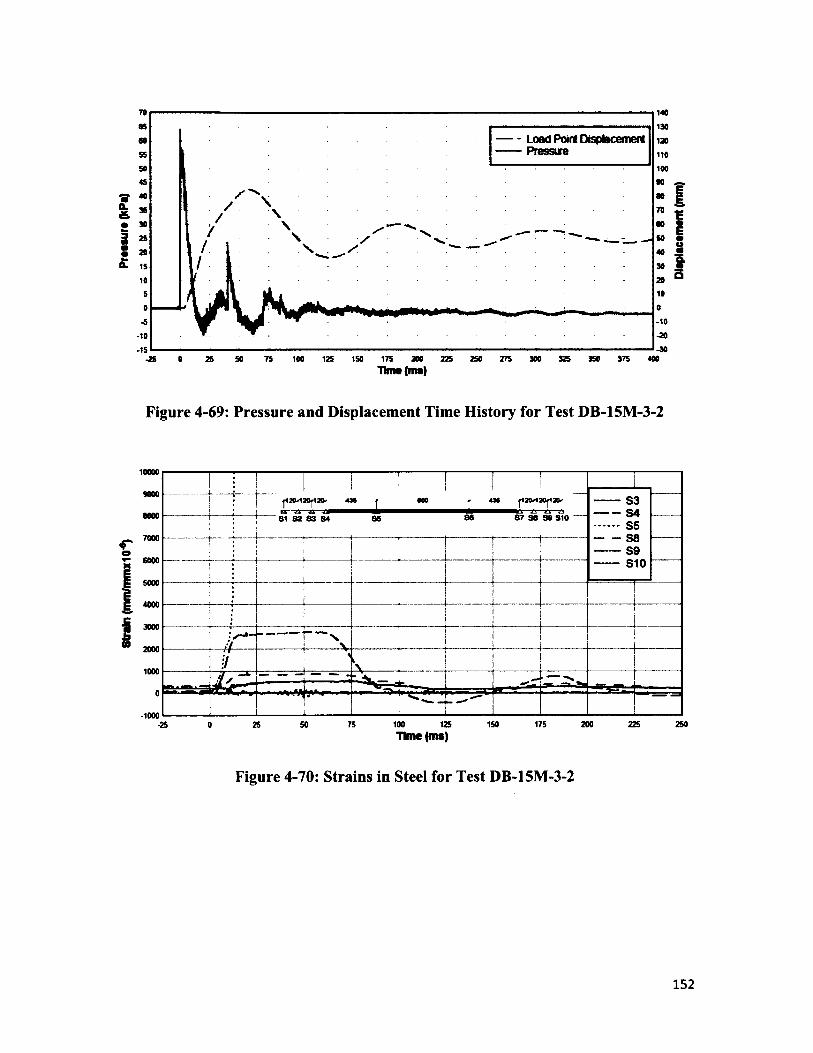
Strain
(m
mftn
mxI
O'6)
Pfwt
ura
(kP«
)140
130
120110100
-10-20-10-30-15
Load Point Displacement Pressure
-25 0 25 50 75 100 125 150 175 200 225 250 275 300 325 350 375 400Tima (mo)
Figure 4-69: Pressure and Displacement Time History for Test DB-15M-3-2
10000
9000
—— i■ ...... ........................ i...............i ■ i i
|12<M»|120- 435 j 500 < 436 |H<X120f120-!
-------------- S3
B000 ...... | ......81 82 83 84 86 86 87 SO SO 810--- O'......... s
*5B9
i------- s-------510
!T" " • • jij
« + —V
1............."~f • -H 11
1 !\ j
............ ...
0
-1000
________4 ' f ^
. — -
—I
2 - ^
-25 0 25 50 75 100 125 150 175 200 225 250Time (ms)
Figure 4-70: Strains in Steel for Test DB-15M-3-2
152
Ditp
laca
mtn
t (m
m)
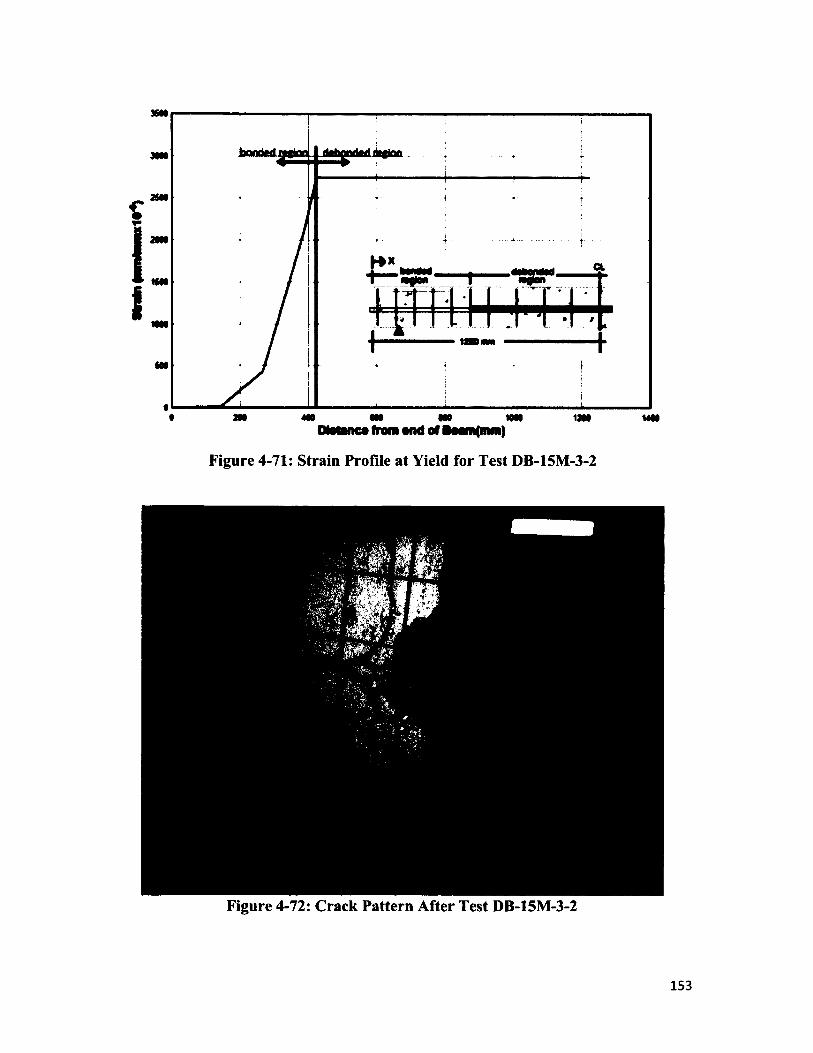
3SW
■ ■« ' >« — ......... - .....4.. - ..- ........ L* 2M MO MO NO MW 12M VMt
Df ttnca trow and of >oom<mm)
Figure 4-71: Strain Profile at Yield for Test DB-15M-3-2
Figure 4-72: Crack Pattern After Test DB-15M-3-2
153
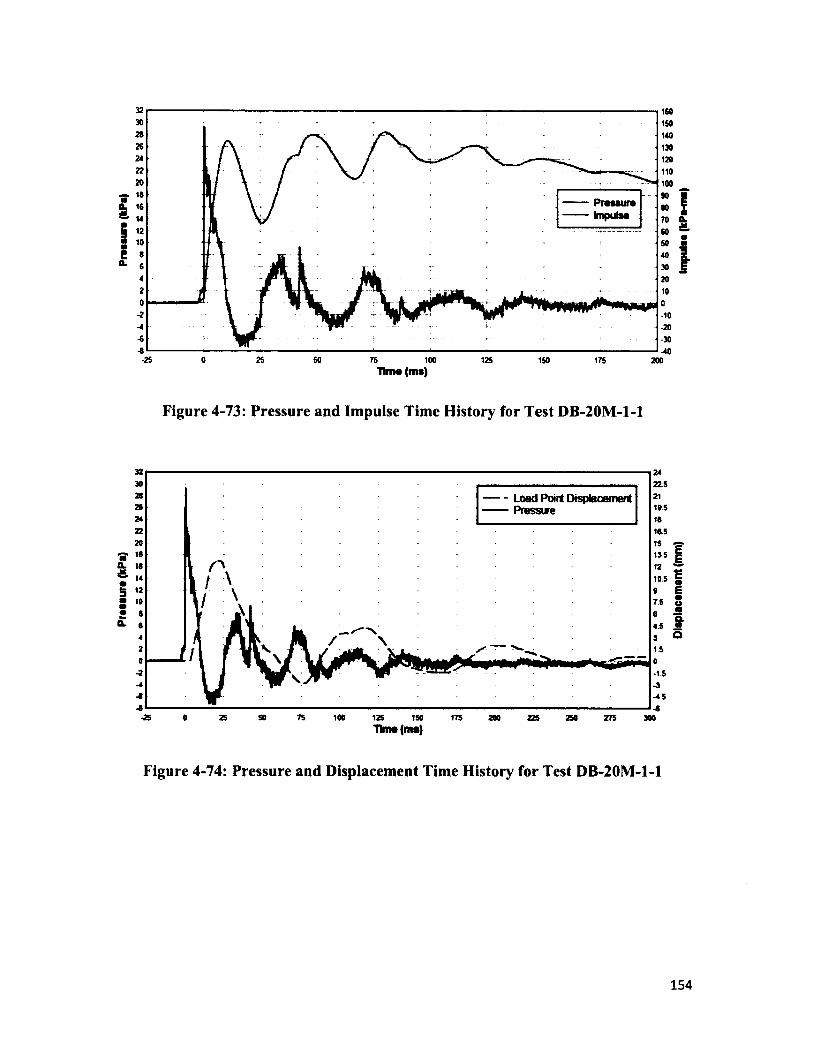
160150140130120110100
0 . 16
*10-20-3040
25 500 75 100 125 150 175 200Time (ms)
Figure 4-73: Pressure and Impulse Time History for Test DB-20M-1-1
22.5
Load Point Displacement Pressure 10.5
16.5
^ 16
10.5
0 25 SO 75 100 125 150 175 200 225 250 275 300
EE
8Q.
5
Tlnw (ms)
Figure 4-74: Pressure and Displacement Time History for Test DB-20M-1-1
154
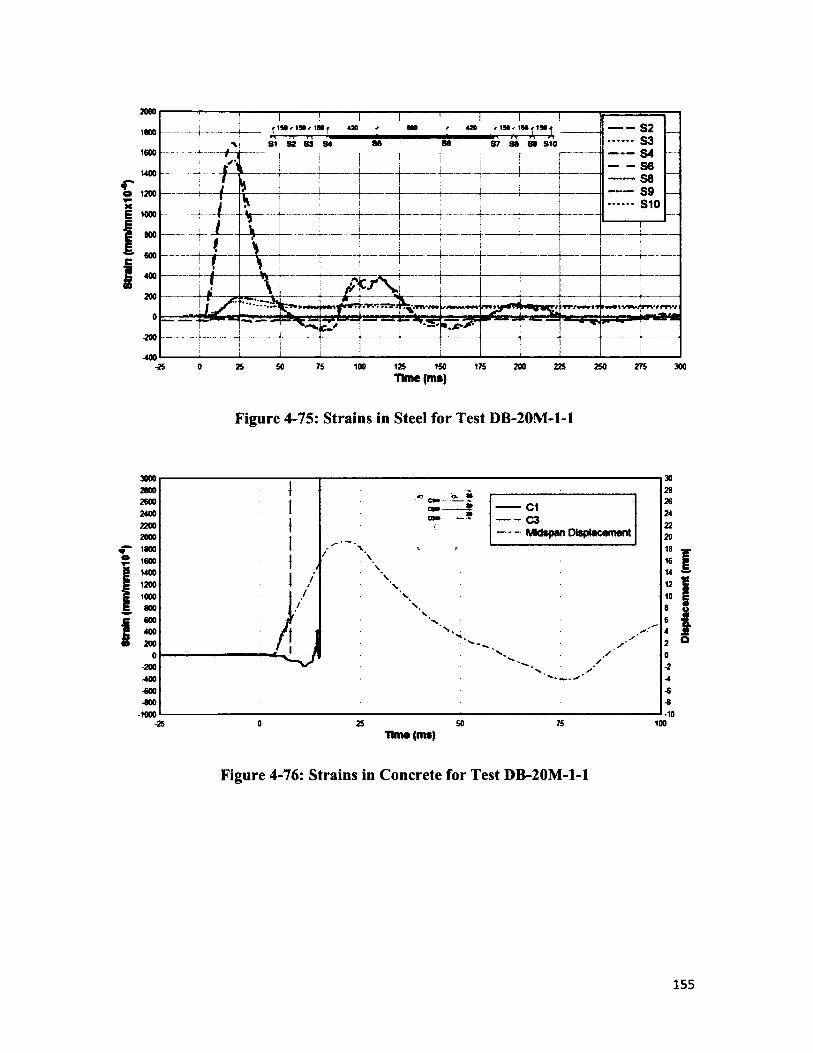
2000
525354 S6seS9S10
^1N /IN /1N | rr—n—n—rm 31 S2 83 84
420 420180086 80 87 88 80 810
1600
1400
1000
600
400
200
-200
SO 75 100 125 150 175 200 225 250 275 300-25 0 25Time (ms)
Figure 4-75: Strains in Steel for Test DB-20M-1-1
/-1000
Mtdspan Displacement
302826242220181614121086420-2-4-64-10
25 50Time (ms)
75 100
Figure 4-76: Strains in Concrete for Test DB-20M-1-1
155
Disp
lacem
ent
(mm
)
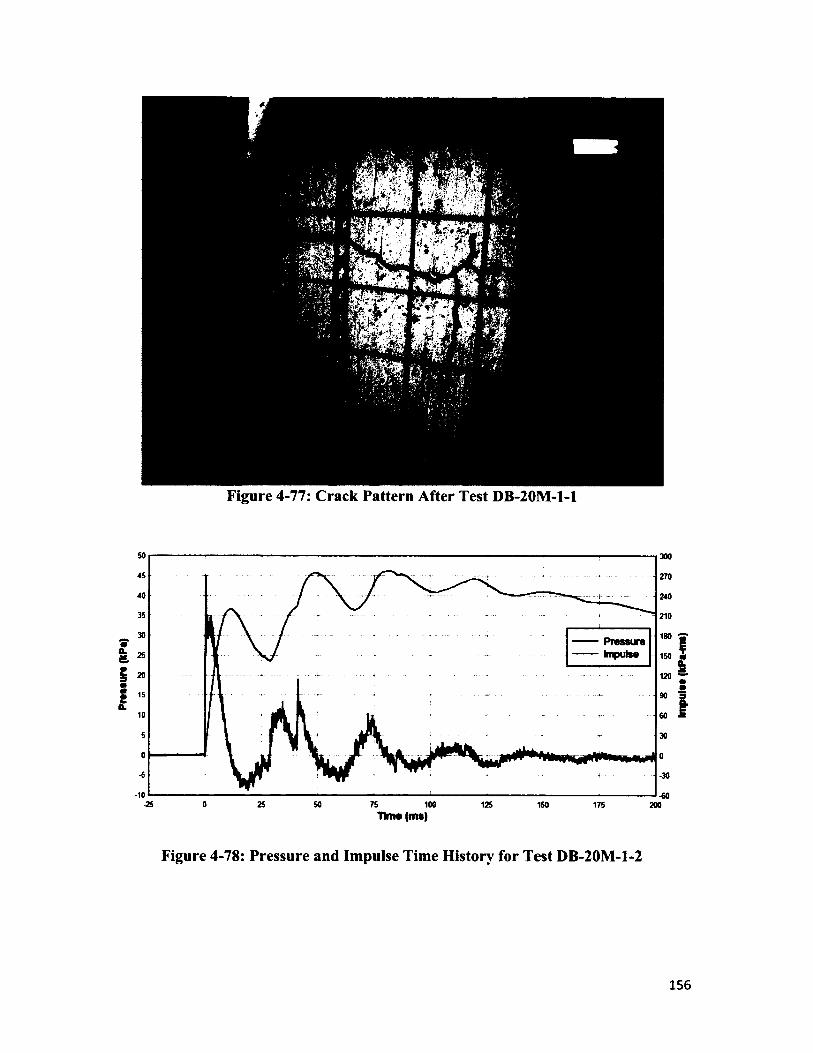
Figure 4-77: Crack Pattern After Test DB-20M-1-1
300
270
240
210180Pressure
Impulsema.M 150 *
e3mmI
120
•30
•10-25 0 25 50 75 100 125 150 175 200
Time (ms)
Figure 4-78: Pressure and Impulse Time History for Test DB-20M-1-2
156
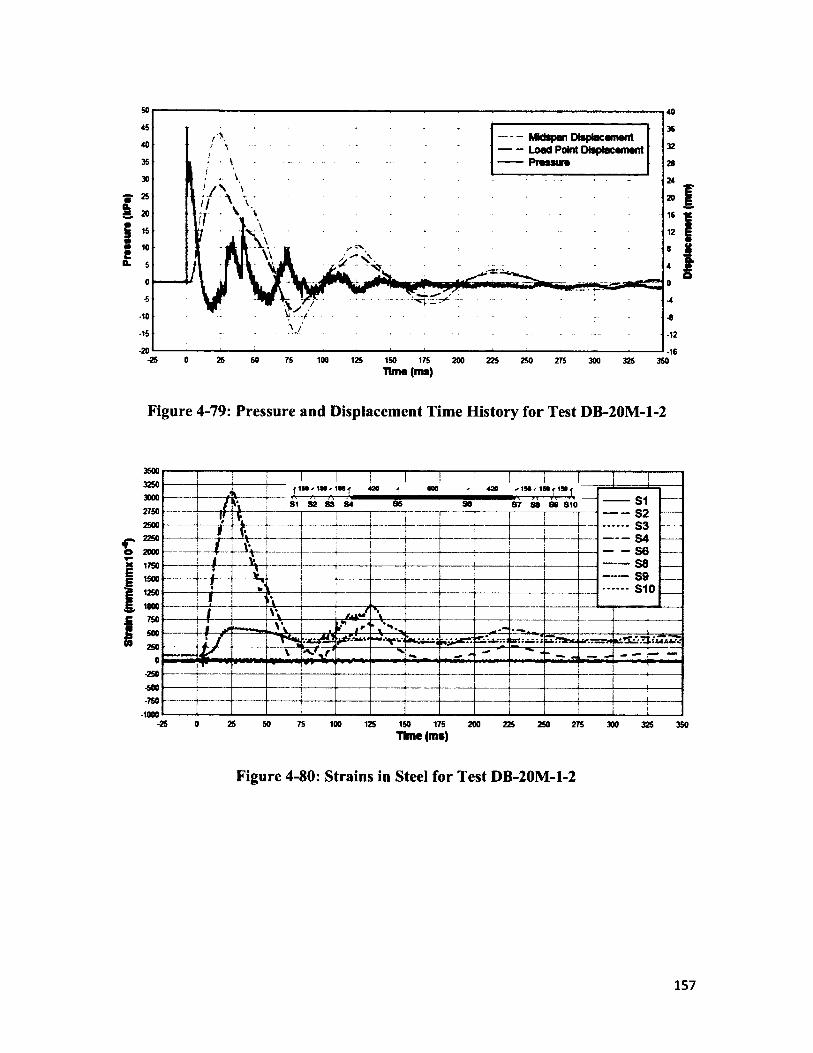
Strain
(m
m/m
mxI
O'*)
Pr
ossu
ro
(kPa
)- MWspan Displacement
- - Load Point Displacement— Pressure
-10
-15 -12
-25 0 25 50 75 100 125 150 175 200 225 250 275 300 325 350Tima (ms)
Figure 4-79: Pressure and Displacement Time History for Test DB-20M-1-2
3500! I I I ! I I
9 4 ' 194 * 194 f 420 • 404 420 / I S / t ) 4 < l ! 4 fr ..i ........ i
\ T’—
2750
25002250
Js i S2 S3 84 86 SS 8 7 8 0 SB S10 ----------S1
—Vt ------------
S21 k
1 —
i \ \OH
— CA
1750 i ----------S8
0
r.... i _ . . .. ---------- S9 —
12509* w’ I ........S1I ‘\
750
500
250
0
-250
-500-750
1000
/ ' \K
1 / ■■-111* . 1 '
. —
/ / ' t S . x J a S * 4 . 4 4 44 . . **
% . T l V 'k....... "“ V] 4^ - -*■ - — — —
26 0 26 SO 75 100 12S 150 175 200 225 2S0 275 300 325 350Tfene(mt)
Figure 4-80: Strains in Steel for Test DB-20M-1-2
157
Dtep
lacam
snt
(mm
)
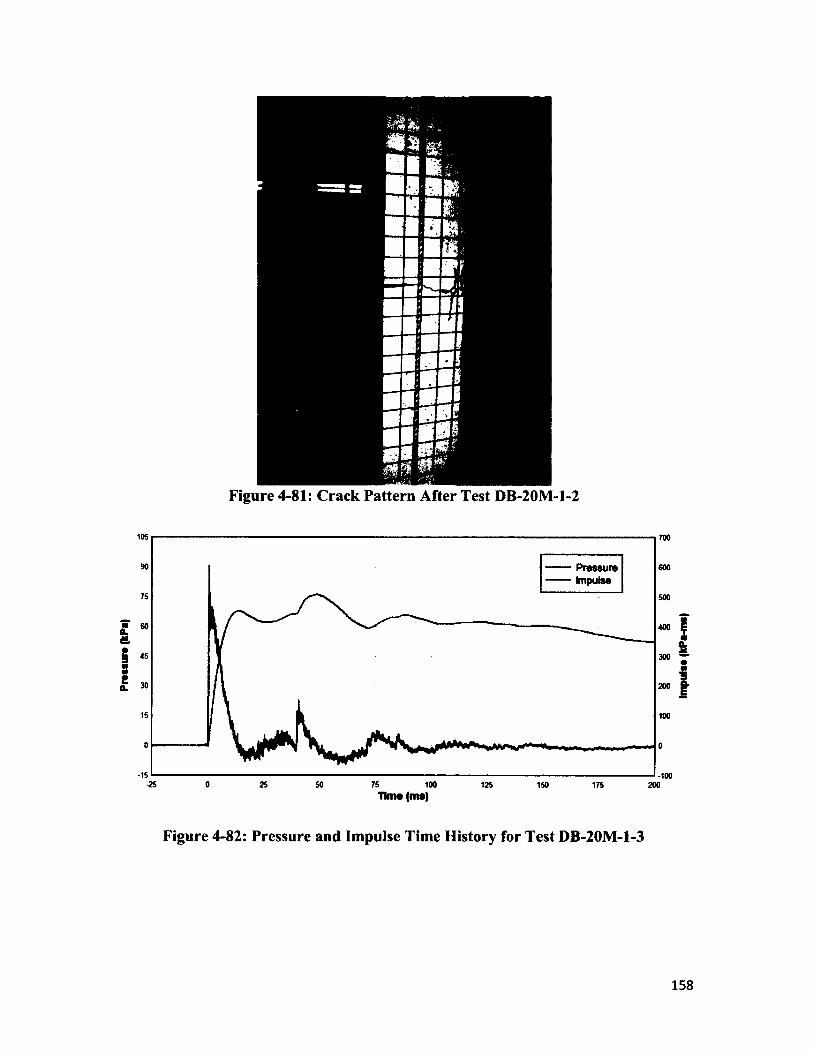
Praa
aura
(k
Pa)
Figure 4-81: Crack Pattern After Test DB-20M-1-2
106 700
Pressure Impulse
600
500
400
300
200
-15 -100-25 0 25 50 75 100 125 150 175 200
Time (me)
Figure 4-82: Pressure and Impulse Time History for Test DB-20M-1-3
158
hnpu
laa
(kPa
-ma)
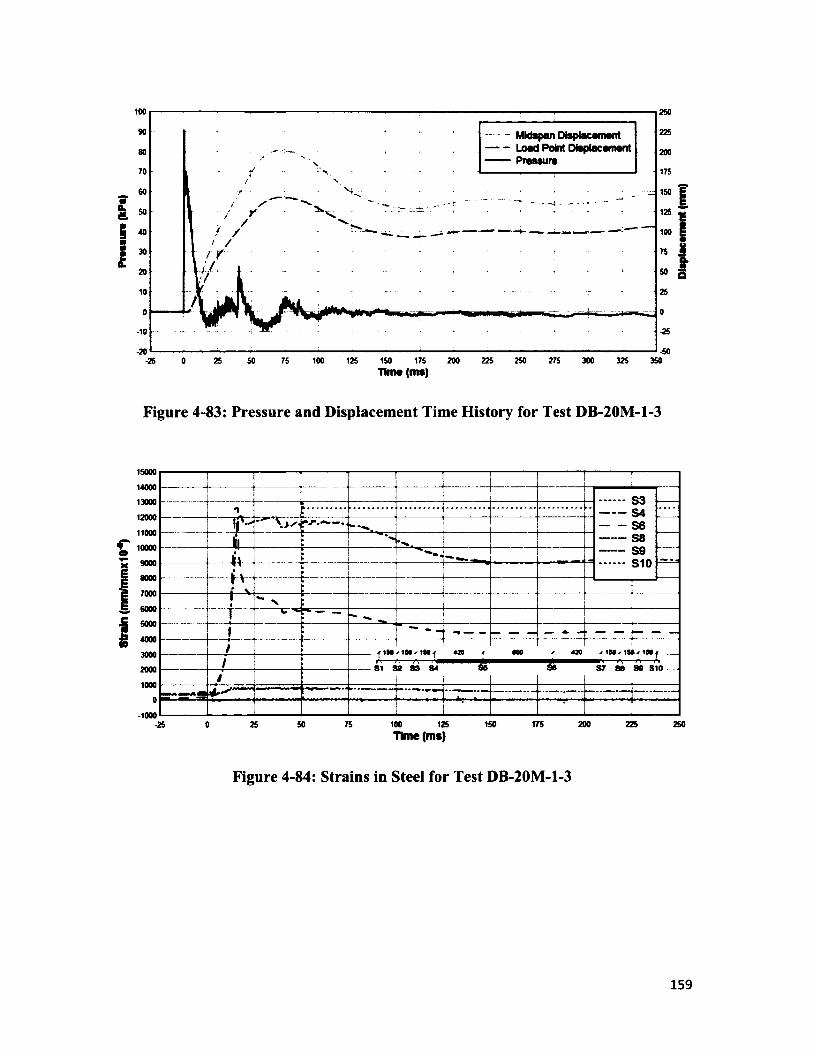
Stain
(m
m/m
mxu
r6) P
tmm
iti
(kP«)
100 2S0
225Midspan Displacsmsnt Load Point Displacement Pressure
200
175
150
125
100
-25-10-20 -50
125 150 175 200 225 250 275 300 325 350-25 0 25 50 75 100lima (ms)
Figure 4-83: Pressure and Displacement Time History for Test DB-20M-1-3
15000
14000
1300Q
12000
11000
10000
9000
8000
7000
*1i n - \ . . .
-H-
S3 S4 S6 S8 S9 S10
6000
5000
4000
3000
20001000
-a— rr- *"S I S 2 S 3 84
420 s ISO-' 1 9 0 / 1801■a— a— a— aS7 88 90 810 -
-1000-25 50 75 100 125
Time (m s)150 175 200 225 250
Figure 4-84: Strains in Steel for Test DB-20M-1-3
159
Dltp
lacM
Twnt
(m
m)

Press
ure
(kPa
)
Figure 4-85: Crack Pattern After Test DB-20M-1-3
300
270
240
210180
150
120
•30
-60-10150 200100 125 175SO 75•25 0 25
Him (ms)
Figure 4-86: Pressure and Impulse Time History for Test DB-20M-2-1
160
Impu
lss
(kPa
-ms)
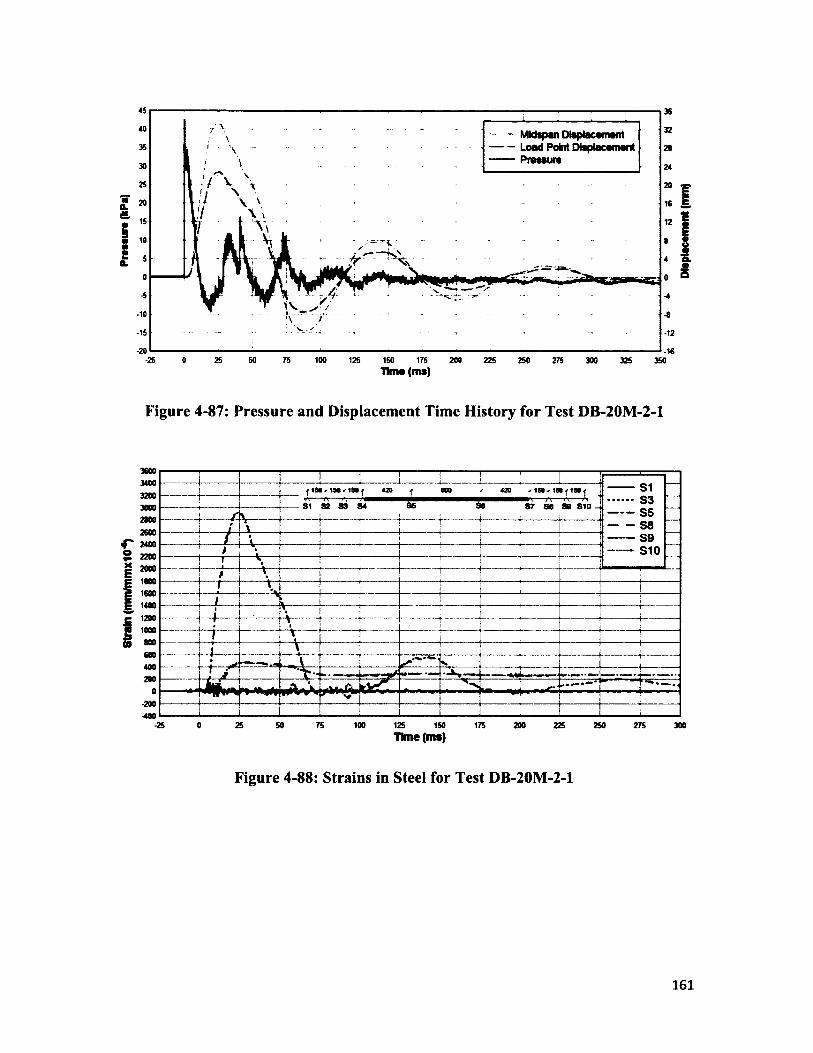
Strain
(m
ntfm
mxl
O'*)
Prass
ura
(IcPa
)-- MkHpan Displacement- — Load Point Displacement— Pressure
rs 0
-10-15 -12-20 -16
-25 0 25 SO 75 100 125 150 175 200 225 250 275 300 325 350Time (ms)
Figure 4-87: Pressure and Displacement Time History for Test DB-20M-2-1
36003400
................. ;...................i_ ! I ! ! " I " 1 1S 1S 3S S5 85 9
S 1 0
3200I
420 | 000 420 * 1S0v 1S0f — —
! 04 04 O i OK AS 04 04 OA S in
—300028002600
/ '
__i \ \ 1
_ _ X _TJ i ______
1 i r L ..........._L .....i... ........J — —
2400 ........... i / j •I- X l_... - __L........... J — —<—1
; *$a
: ' ! ————2200
20001800
- .................f.........T !h" —V.... ! ;t I”'...~V" H r ~i
1600I \
1400 ....i . .. .\
L................
12001I
%*>\I | i
1000800600
\ Ai
. 1 - . . . . ..... '
1400 k — i
J / . ----- - -— —--V - k — — 1 ■—— •Ms. _______.. 1. r , ------- _________. ate*..........200
0itd - i
1— -■*- - lA tlV-i %v<-------- i-----Mr-i-mr'Vij
•200-400 1
...'■--1i 1
---------
-25 0 25 50 75 100 125 150 175 200 225 250 275 300Time (ms)
Figure 4-88: Strains in Steel for Test DB-20M-2-1
161
Dlsp
tacs
mm
t (m
m)
c
ii CL
C M ) N « H I M MM U N MMO tSlM tC O I M H d f l f t — jW— |
Figure 4-89: Strain Profile at Yield for Test DB-20M-2-1
300027502500225020001750150012501000750500250
C2. . . . . . C3 Midspan Displacement
cm
•250-500-750
-1000-1250-1500-1750-2000
-12-15-18
175 250 275 325100 125 150 200 225 3000 25 50 75-25T im a (m s)
Figure 4-90: Strains in Concrete for Test DB-20M-2-1
162
Dlsp
laca
mnt
(m
m)
Pras
eure
(kP
a)
Figure 4-91: Crack Pattern After Test DB-20M-2-1
700105
PressureImpulse
600
500
400
300
200
100
•100-1525 50 75 176 2000 100 125 ISO-25
Time (ms)
Figure 4-92: Pressure and Impulse Time History for Test DB-20M-2-2
163
Impu
lse
(kPa
-ma)
8traln
(m
m/m
mxt
O'8)
Prat
tur*
(k
Pa)
100 200100Midspan Dtoptacamant
Load Point Displacement Pressure 160
140
120100
\
-10 -20-20 0 25 50 75 100 125 150 175 200 225 250 275 300 325 350 375 400
Tima (ms)
Figure 4-93: Pressure and Displacement Time History for Test DB-20M-2-2
15000
14000
- S3- S4- SS -- S6- S8- S9- S10
13000
12000138 * 15# ✓ 19 t 420 420 ^ 1 9 0 ^ 1 8 0 <13011000
86 868 4 S 7 8 6 9 6 S IO10000
7000
6000
5000
4000
3000
20001000
-1000-25 0 25 50 75 100 125 150 175 200 225 250
Time (ms)
Figure 4-94: Strains in Steel for Test DB-20M-2-2
164
Dlap
taCM
iwnt
(mm
)
T
DManc# from #nd of frMmfvvMt)
Figure 4-95: Strain Profile at Yield for Test DB-20M-2-2
5000 200— C1- - Midspan Displacement
4000 160
3000 1202000©1000
-1000 -40
-2000 -80
-3000 -1204000
-5000 -200-25 50 75 100 125 150 175 2000 25 225 250
H im (ms)
Figure 4-96: Strains in Concrete for Test DB-20M-2-2
165
Disp
lacem
ent
(mm
)
(•d>l) NIM
IUd
Figure 4-97: Crack Pattern After Test DB-20M-2-2
320300280260240220200180160140120100
375
PressureImpulse325
27 5
225
17.5
125
7.5
2 5
-25 -20-40•60-80
-7 5 -10
-25 0 25 50 75 100 126 150 175 200Time (ms)
Figure 4-98: Pressure and Impulse Time History for Test DB-20M-3-1
166
bnpu
lM
(kPa
-ma)
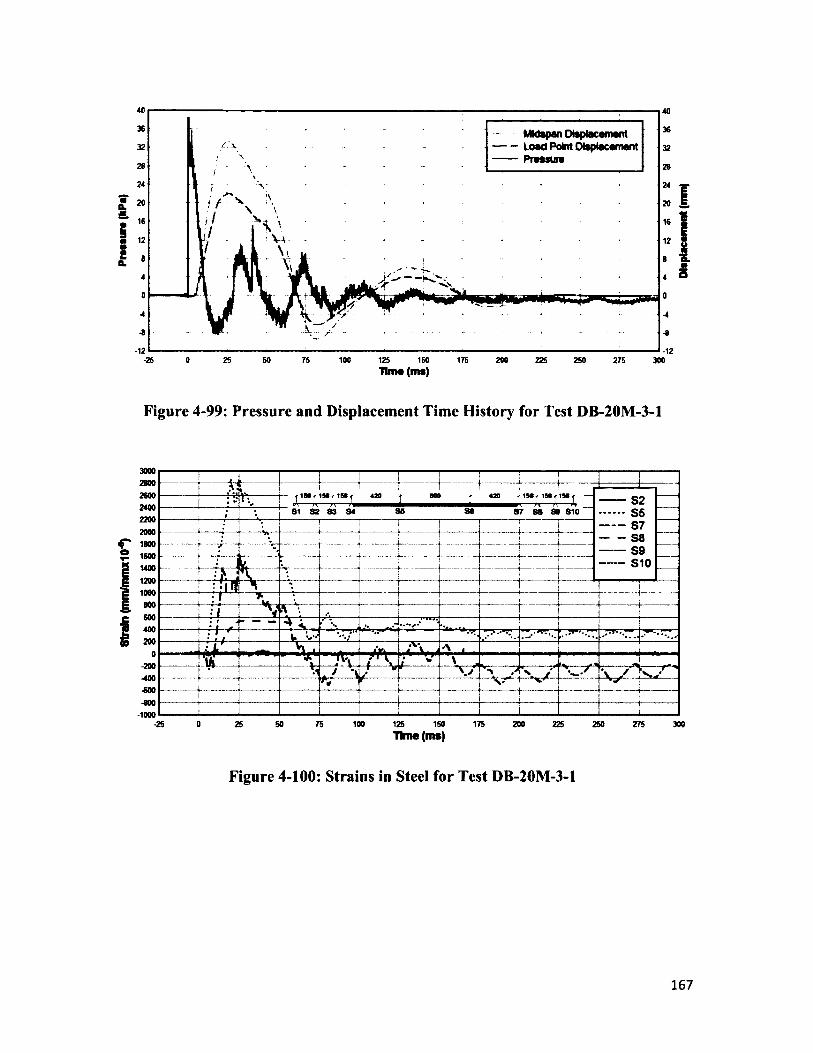
Strain
(m
mftn
mxI
O'6)
Press
ure
(UPa
)MWspan Displacement
- Load Point Displacement— Prassura
-12 -12-25 0 25 50 75 100 125 150 175 200 225 250 276 300
Tima (ms)
Figure 4-99: Pressure and Displacement Time History for Test DB-20M-3-1
3000 Ii ■ 4... ! 1 I ! T ! " - " r----I .....4------- i- - - - 1 ......... .. :::2600 * ■% ! I 1 1 1 ! IMslMf 420 4 000 420 * ISO ✓ 180 < 180 { —----- S2
...... S5----- S7----- S8----- S9-----S10
J »\ r t,s*'2400 r SI S2 S3 S4 SS SO 37 SO SB S10
*■ ------- 1------- zzm ___1800 ; **. —
\ i1200 • k j \! i t: I 'A *
L.Ji...- ’V \.*•.... i*,, r «200
0-200
: i f L ■•.••• .* *' *• ■•...Ji t •V* A , .
’ “/W i v_i % \ -V U...... v / '
-1000*25 0 25 50 75 100 125 150 175 200 225 250 275 300
Time (ms)
Figure 4-100: Strains in Steel for Test DB-20M-3-1
167
(Msp
lacem
snt
(mm
)
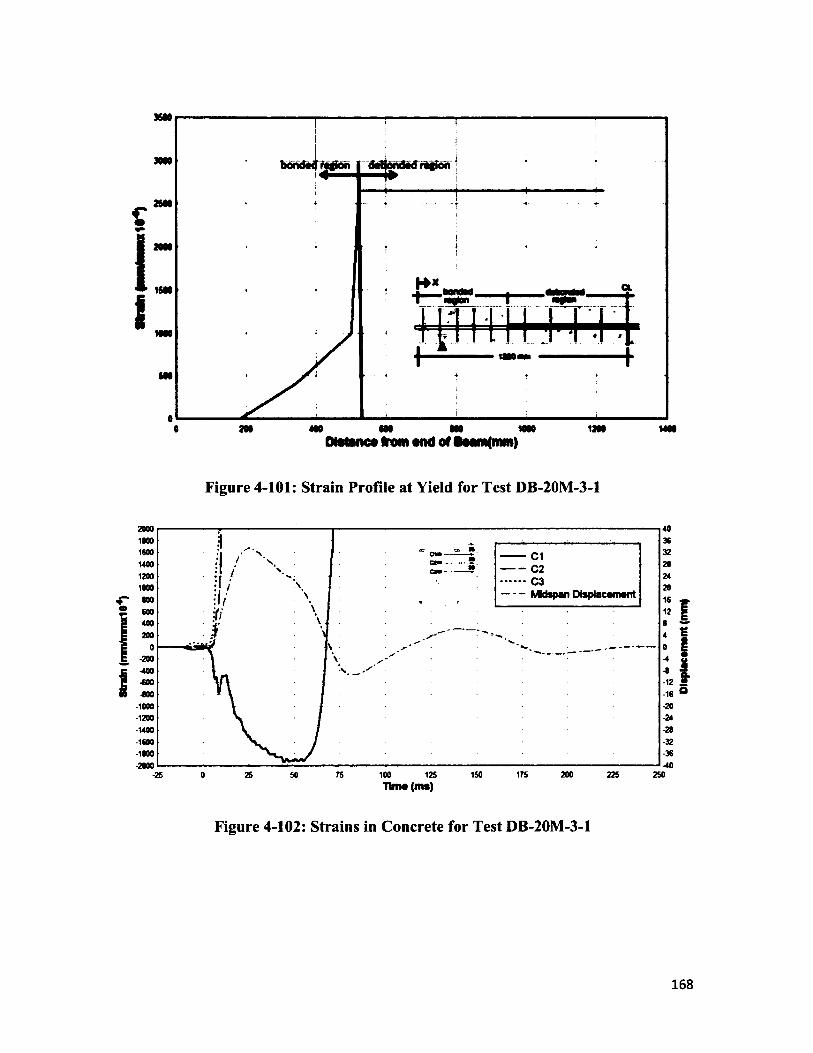
2SWt
1I
m uttDtstanc* from and of Baom(mm)
Figure 4-101: Strain Profile at Yield for Test DB-20M-3-1
200018001600140012001000800600400200
c t* -
- - C2— C3- - MkSspan Displacement
-200
-12-16-20-2428
-32-36
-600-800
-1000-1200-1400-1600-1800-2000
1S0 175 200 225 25025 50 75 100 125-25 0Time (ms)
Figure 4-102: Strains in Concrete for Test DB-20M-3-1
168
Dlip
lacam
ant
(mm
)
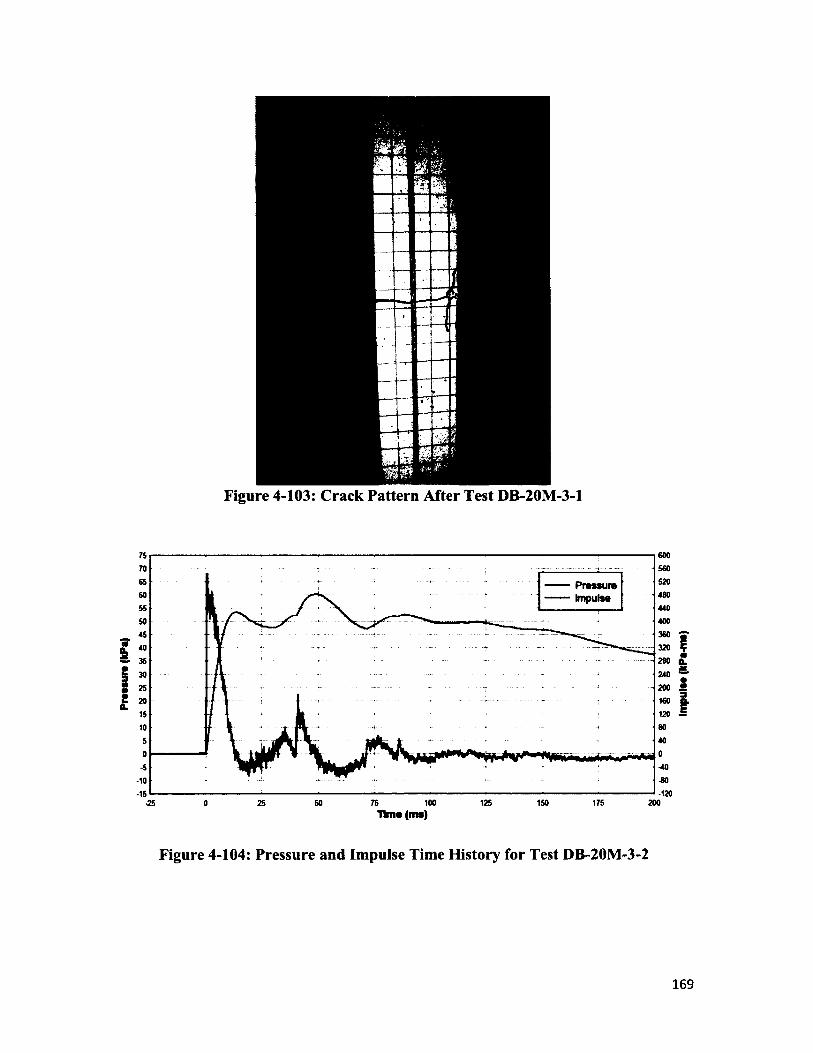
PressureImpulse
-10-15
75 100 125 150 175 200-25 0 25 50Time (ms)
Figure 4-104: P ressure and Im pulse Tim e H istory fo r Test DB-20M -3-2
169
Impul
M (k
Pa-rr
a)
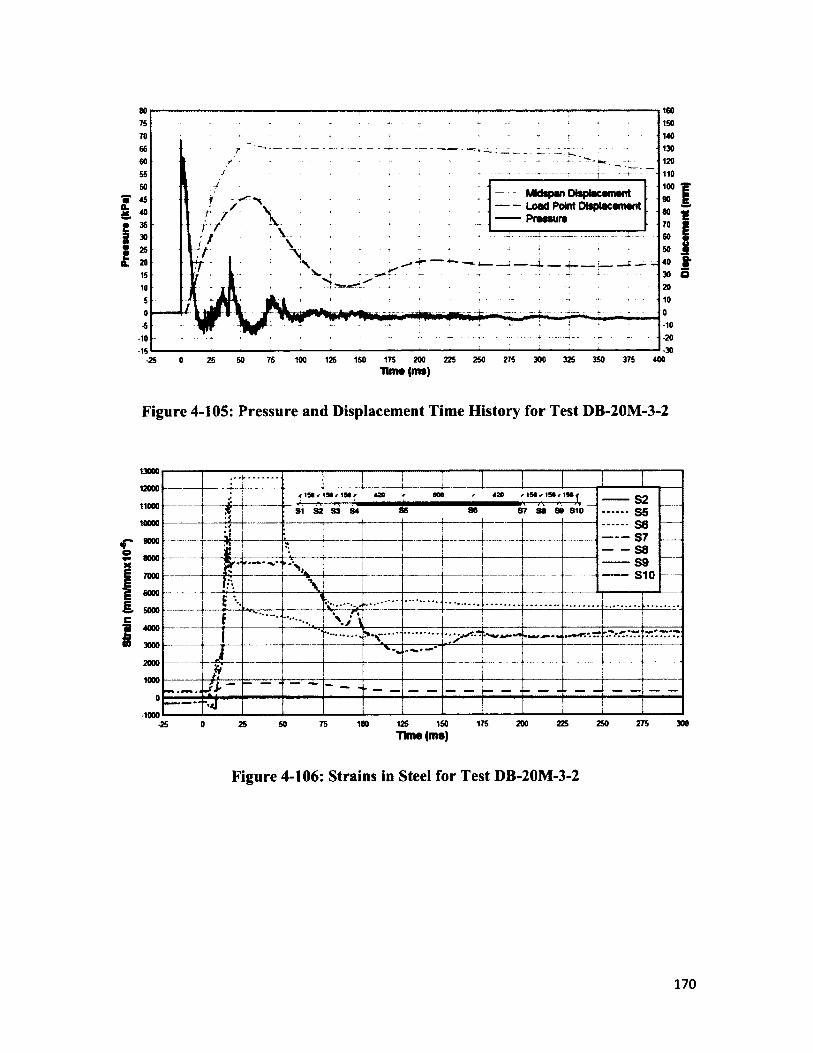
160150140130120110100Mkfepan Displacement
Load Point Displacement Pressure
ImaAa.
-10-20-30
-10-15
275 300 350 375 40050 75 100 125 150 175 200 225 250*25 0 25Tima (ms)
Figure 4-105: Pressure and Displacement Time History for Test DB-20M-3-2
13000 I! ' 1 ....
420 * 000 / 420---------S2 ---11000 .. r~ s i S 2 83 84 86 8 6 S 7 88 81 S10 ...... S 5
B7. i
j i............s-----s ---
S 8000X
$ -----S8‘ A
----- sc910 - - - -
VE E ••• 1 . IS 5000c f ....... r \ - . . . fr
\I —
■■ - ■ ■7 ■ ->1 4000
i, i
-----------------—
* 1 *Ja
0
-1000
j L - — - — -- - 1—
- ■ j " iL, .-1000 < * 1 » 1 1 * 1 1 1
-25 0 25 50 75 100 125 150 175 200 225 250 275 300Time (ms)
Figure 4-106: Strains in Steel for Test DB-20M-3-2
170
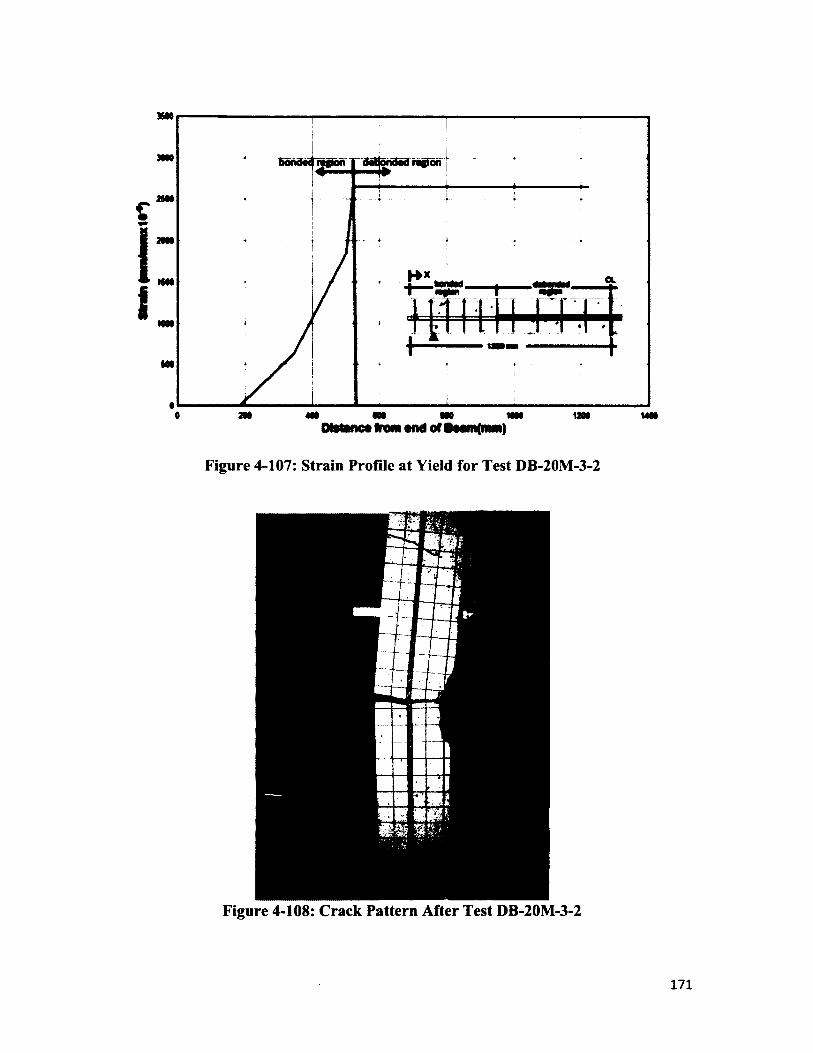
ISM
Ircgtoti
1' ~
.
I
« ............... * .................*......... I....—— ———■.- 0 2M 4M M* MO MM U N MM
A ^A A M ikM Ammmm m ju I ^M w ic v vrovn 9110 o r iN n i |n w i |
Figure 4-107: S train Profile a t Yield fo r Test DB-20M-3-2
Figure 4-108: Crack Pattern After Test DB-20M-3-2
171
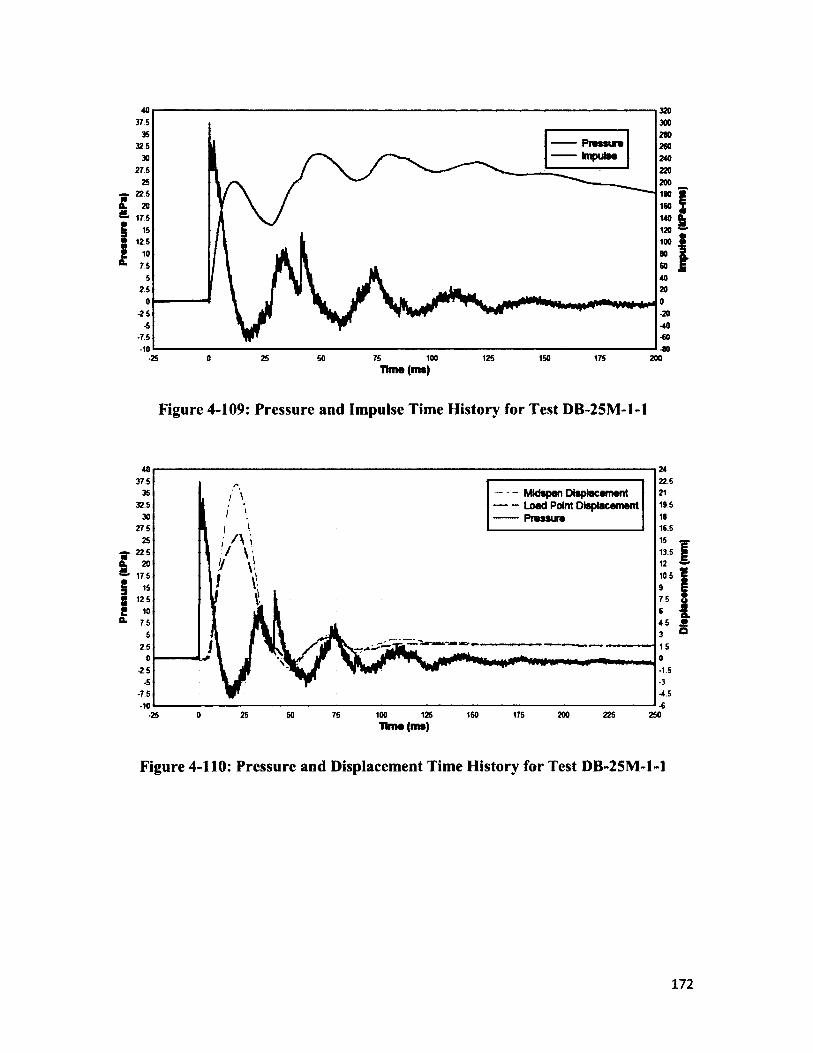
Praa
sura
(kPa)
Praa
auia
(kPa
)320300280260240220200180160140120100
375
325
275
225
175
125
75
2.5
•2 5 -20-40-60-80
-7.5-10
25 50 75 100 125 150 175 200•25 0time (ms)
Figure 4-109: Pressure and Impulse Time History for Test DB-25M-1-1
225375- Midspan Displacement- Load Point Displacement- Pressure
19.5325
16.5275
13.5225
10.5175
75125
4.57.5
2 5
-1.5-25
-75-10
4 .5
25 50 100 125 150 175 200 225 2500 75Time (ms)
Figure 4-110: Pressure and Displacement Time History for Test DB-25M-1-1
172
Dlap
taca
man
t (m
m|
hnpu
taa
(kPa
-ma)
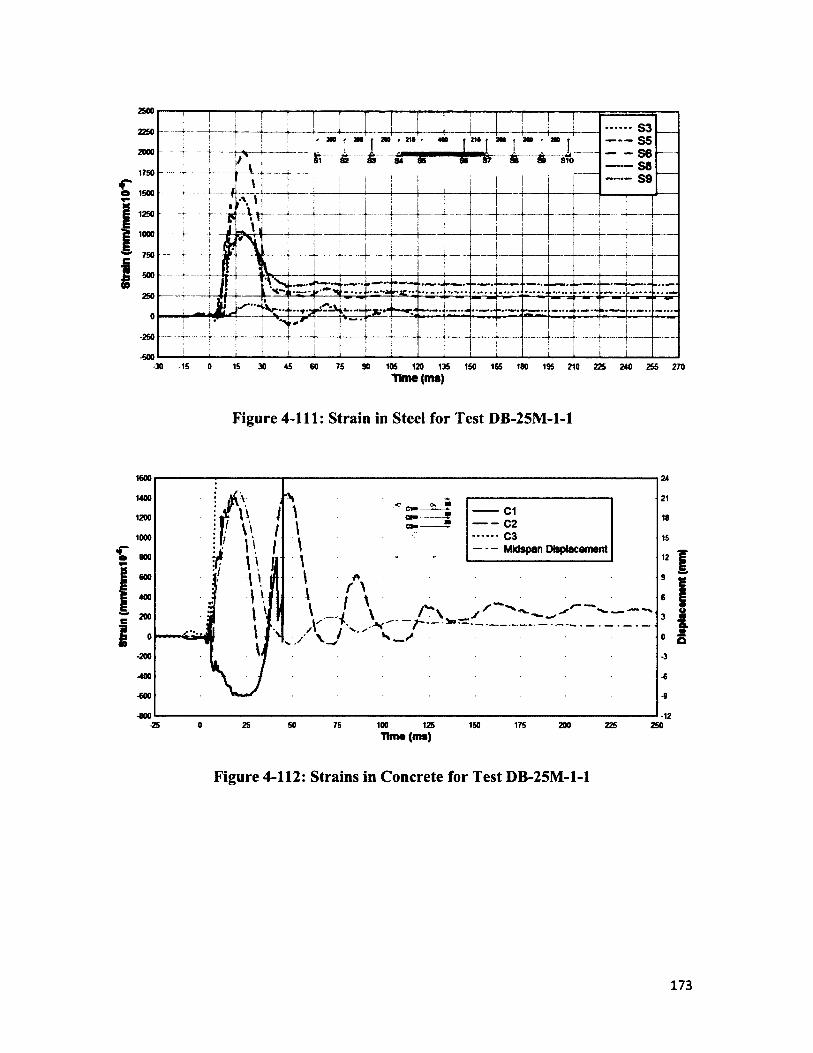
Strain
(m
mta
mx1
0'*|
Strata
(m
m/m
mxl
O'*)
2500
S35556 Sfl S9
2250m 400 210 200 300 200
2000 •tA” 8 7
1750
1250
1000
750
500
250
-250
-500-30 -15 0 15 30 45 60 75 90 105 120 135 150 165 180 195 210 225 240 255 270
Time (ms)
Figure 4-111: Strain in Steel for Test DB-25M-1-1
1600
1200- - C 2— 03- - Mklspan Displacement
1000
800
600
400
200
-400
-600
-12-25 0 25 50 75 100 125 150 175 200 225 250
Tim# (ms)
Figure 4-112: Strains in Concrete for Test DB-25M-1-1
173
Dlap
taca
man
t (m
m|
PrtM
ura
(kPa
)
Figure 4-113: Crack Pattern After Test DB-25M-1-1
400
360PressureImpulse 320
280
240
200
160
120
40
-10-25 0 25 50 75 100 125 150 175 200
Time (ms)
Figure 4-114: P ressure and Im pulse Tim e H istory for Test DB-25M -1-2
174
Impu
te*
(kPa
-tns)
Strain
(m
m/m
mxI
O4)
Prea
eure
(k
Pa)
Mkbpan Displacement Load Point Displacement Pressure
-10 -80 25 50 75 100 125 150 175 200 225 250Time (ms)
Figure 4-115: Pressure and Displacement Time History for Test DB-25M-1-2
36003400320030002800260024002200200018001600140012001000800600400200
535455565859
380 218 400
83 81084
•200400
25 50 75 100-25 0 125 150 175 200 225
Time (ms)
Figure 4-116: Strains in Steel for Test DB-25M-1-2
175
Diap
lacam
ent
(mm
)
20001800
1600 - - C2- - Midspan DlspSacsmsnt1400
1200
1000
800
600
400
200
-200
-600 -12-800 -16
-1000-25 750 25 50 100 125 150 175 200 225 250
Tima (ms)
Figure 4-117: Strains in Concrete for Test DB-25M-1-2
Figure 4-118: Crack Pattern After Test DB-25M-1-2
176
Dla
ptac
tmm
t (m
m)
Praa
aurt
(kPa)
Praa
aur*
(k
Pa)
106 700
600
500
400
300
200
100
-15 -100-25 0 25 50 75 100 125 150 175 200
Tima (ma)
Figure 4-119: Pressure and Impulse Time History for Test DB-25M-1-3
21010S
90 180Midspan Displacement Load Point Displacement Pressure75 150
GO 120
45
30
15
0
-15 -30SO 75 100 125 150 175 200 225 250 275 300 325 350 375 400-25 0 25Tkne(ms)
Figure 4-120: Pressure and Displacement Time History for Test DB-25M-1-3
177
Dlap
lacam
ant
(mm)
Im
pute*
(k
Pa-m
a)
Strain
(m
mftnm
xIO'
*)10000
9000 m- S3- S4- S5- S6- S8
8000 88 810-----
7000
6000
5000
4000
3000
2000
1000
•1000-25 0 25 50 75 100 125 150 175 200 225 250
Time (ms)
Figure 4-121: Strains in Steel for Test DB-25M-1-3
2000 2001800 180
C2Midspan Displacement1600 160
1400 140
1200 1201000 100800
600
400
200c m
•200 -20-400
•60
•800 -80
-1000 •1000 25 50 75 100 125 150 175 200 225 250-25Time (ms)
Figure 4-122: Strains in Concrete for Test DB-25M-1-3
178
Dlap
lacan
wnt (
mm)
Pmiu
m
(kPa
)
Figure 4-123: Crack Pattern After Test DB-25M-1-3
400
360PressureImpulse 320
280
240
200160
120
40
-10175 200100 125 15025 50 75-25 0
Time (ms)
Figure 4-124: Pressure and Impulse Time History for Test DB-25M-2-1
179
Impu
laa
(kPa
-ms)
8traln
(m
m/m
mx1
O'*)
Prta«
iire
(kPa
)- Mktepan Displacement- Load Point Displacement- Pressure
-10 o 25 50 75 100 125 150 175 200 225 250 275 300Time (ms)
Figure 4-125: Pressure and Displacement Time History for Test DB-25M-2-1
2600
240055565758 S10
2200810---2000
1800
1400
12001000
800
600
400
200
-200
-25 0 25 50 75 100 125 150 175 200 225 250Time (ms)
Figure 4-126: Strains in Steel for Test DB-25M-2-1
180
Disp
lacem
ent
(mm
)
Strain
(m
rrVm
mxI
D4)
36M
c
iiOL
toe
0 200 m •oe MO 1200weeM stutcs from « td of BMtn(mm)
Figure 4-127: Strain Profile at Maximum Strain for Test DB-25M-2-1
900 .....................r ....................? .................... ....... ........... r 1 11 " I I !800 ---------------- 1-----------------j----------------
i
------------- _ — .— —; ----------C ', 2
ilid s p a n D is p la c e m e n t
600
500
— i--------- *
f
i : \ Af o \ \ r J ■
\ i K * * * /
v l n............/ .... 1
j r '/***
v . “ 7 “ ... .../
100
0
•100
■■ - r ........ ..1
\ \ L a / v - — / j
........ j
Ji i f : ' /
L --------------- ►-------------- --------------- ---------- ---
1 \ i■ + t
V /t Tt 1 \ i « « * CM ♦
T 1 TI | \ / 1 c a m ---------m
500
-600
V - *
«1 L......... - i 1
•25 0 25 SO 75 100 125 150 175 200 225 250Time (ms)
Figure 4-128: Strains in Concrete for Test DB-25M-2-1
181
Disp
lacem
ent
(mm
)
Figure 4-129: Crack Pattern After Test DB-25M-2-1
700105
Pressure Impulse
600
500
400
300
200
100
-100175 200150100 12550 7525-25 0
Time (ms)
Figure 4-130: Pressure and Im pulse Time H istory for Test DB-25M-2-2
182
Impu
lM
(kPa
-m)
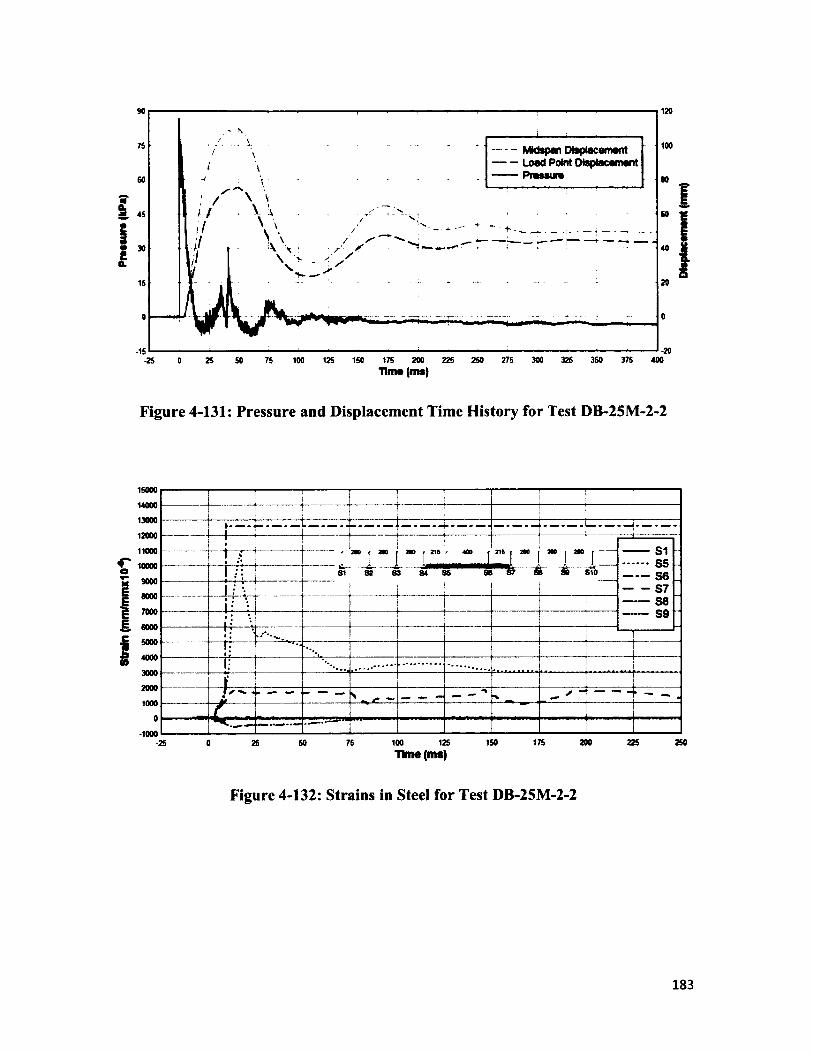
Strain
(m
m/m
mxI
O1*)
Praa
aura
(k
Pa)
120
100- Mklspan Displacement- — Load Point Dtsplacamant— Pressure
-20-15275 300 325 350 375 400125 175 200 225 25025 50 75 100-25 0
Tima (ms)
Figure 4-131: Pressure and Displacement Time History for Test DB-25M-2-2
15000
14000
13000
12000
11000
5556575859
S109000
8000
7000
6000
5000
4000
3000
20001000
-1000 200 225 250125 150 1750 25 50 75 100-25Time (ms)
Figure 4-132: Strains in Steel for Test DB-25M-2-2
183
Dlap
taca
man
t (m
m)
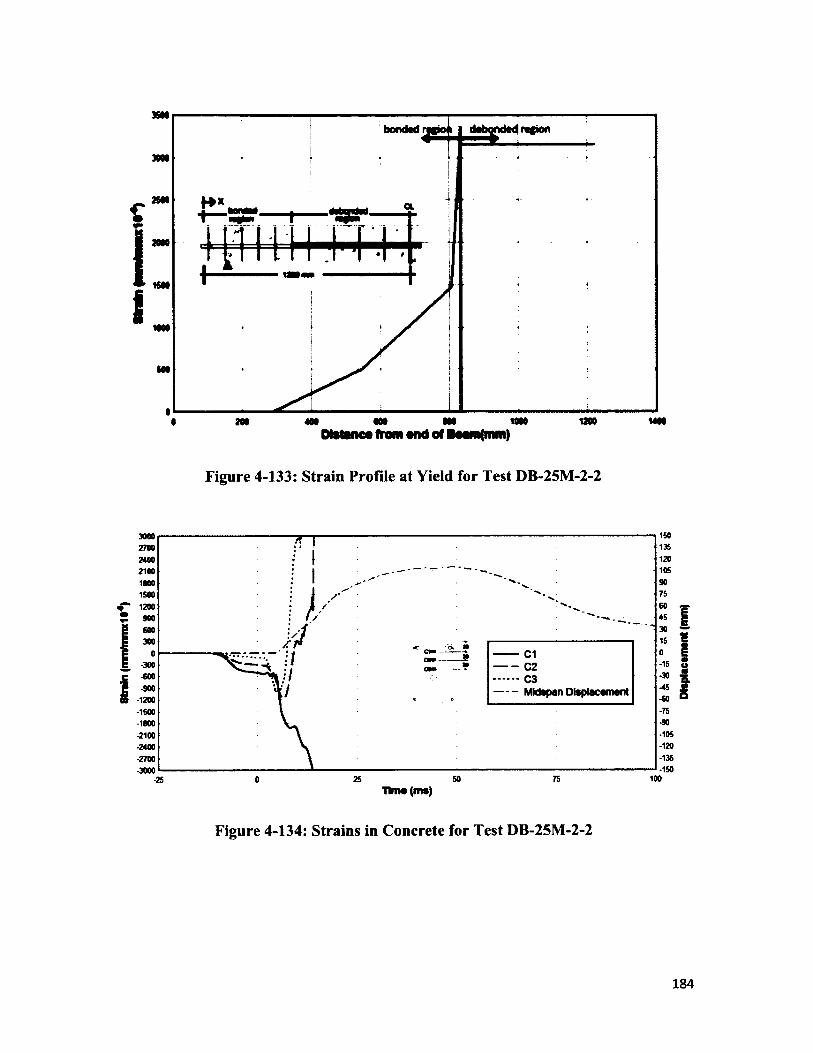
Stra
in3SM
JOOO
_ tm £8 2M0
* tSM
I
CL
m 1J00 MMM2M 4MDtstanca from tnd of
Figure 4-133: Strain Profile at Yield for Test DB-25M-2-2
150135120105
3000270024002100180015001200900600300
*
Cl C2 * C3 Mklspan Displacement
-15-30-45-60-75-90-105-120-135-150
-300-600-900
-1200-1500-1800-2100-2400-2700-3000 10050 75250-25
Tims (ms)
Figure 4-134: Strains in Concrete for Test DB-25M-2-2
184
Dlap
lacam
ant
(mm
)
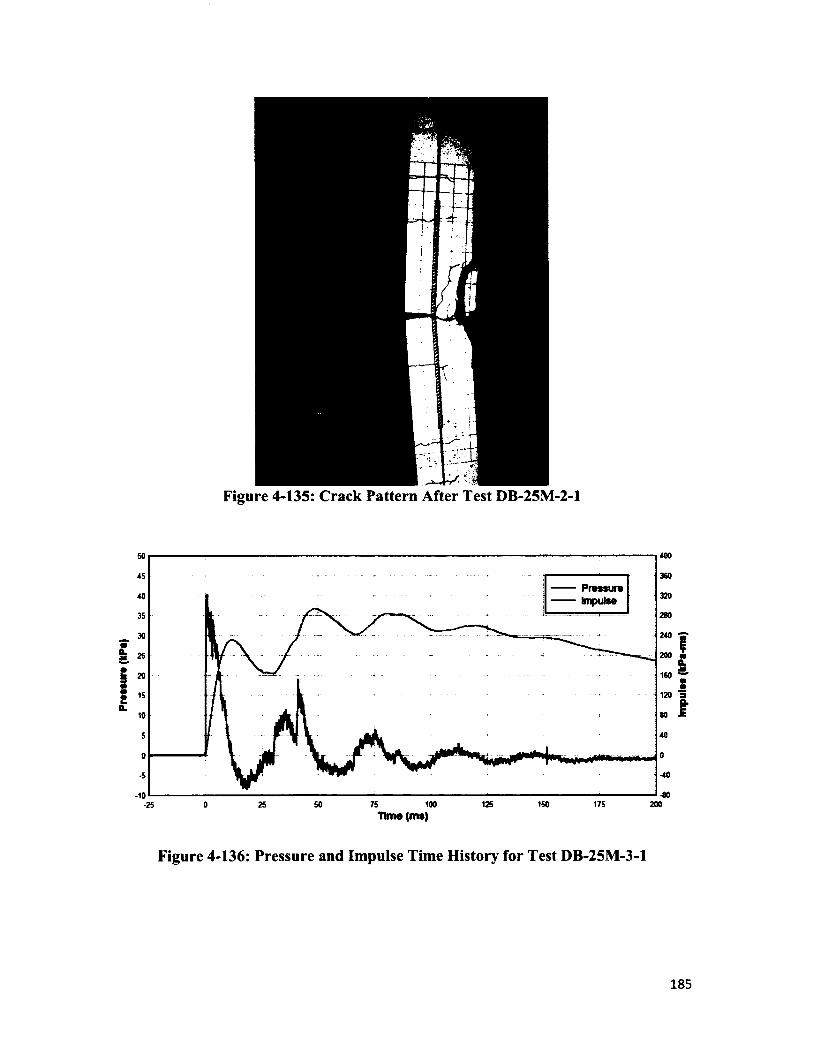
Pres
sure
(k
Pa)
Figure 4-135: Crack Pattern After Test DB-25M-2-1
400
360PressureImpulse 320
280
240
200160
120
•40
-80-10 12S 150 175 20050 75 1000 25•25Time (ms)
Figure 4-136: Pressure and Impulse Time History for Test DB-25M-3-1
185
Impu
lm
(kPa
-ms)
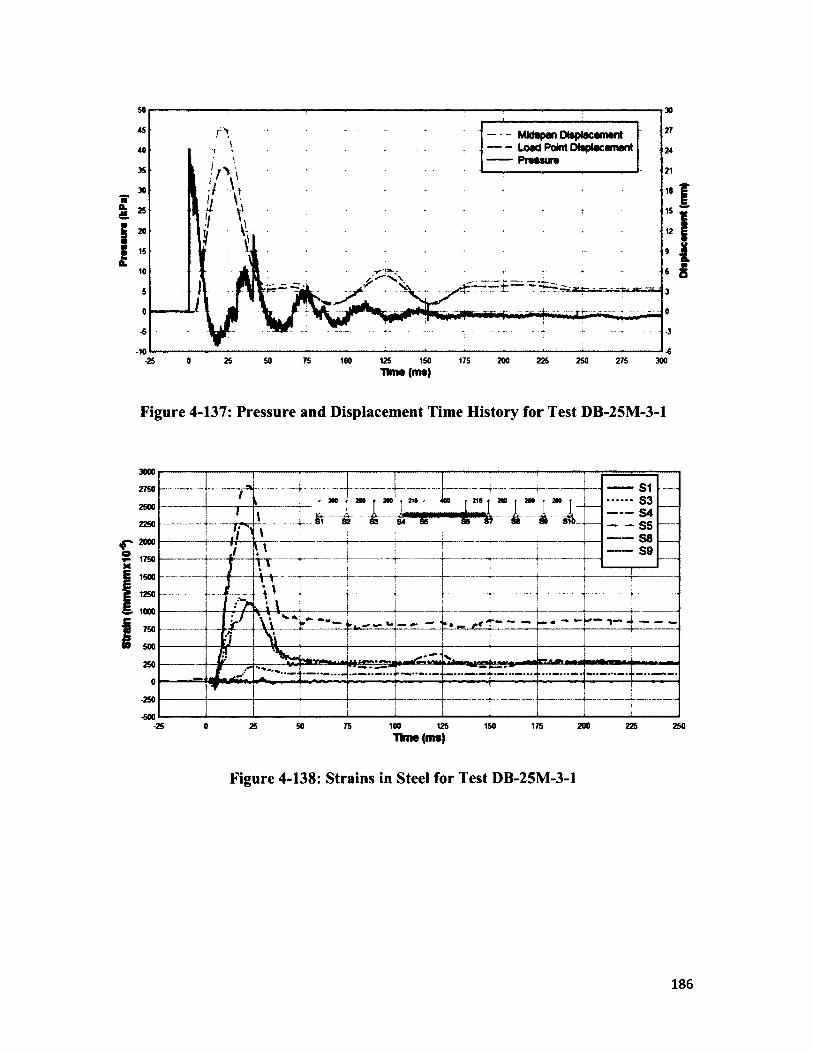
Strain
(rr
nn/m
mxl
0*)
Praw
ura
(M»«
)- Mktepan Dteptacamant- Load Point Displacement- Pressure
T \\
-1075 150 175 200 225 250 2750 25 50 100 125 300
Him (ms)
Figure 4-137: Pressure and Displacement Time History for Test DB-25M-3-1
3000
2750535455 Sfl S9
360 2802500
810_____2250
2000
1750
1500
1250
1000
750
500
250
-500-25 0 25 50 75 100 125 150 175 200 225 250
Time (ms)
Figure 4-138: Strains in Steel for Test DB-25M-3-1
186
Dtap
tocm
wnt
(mm
)
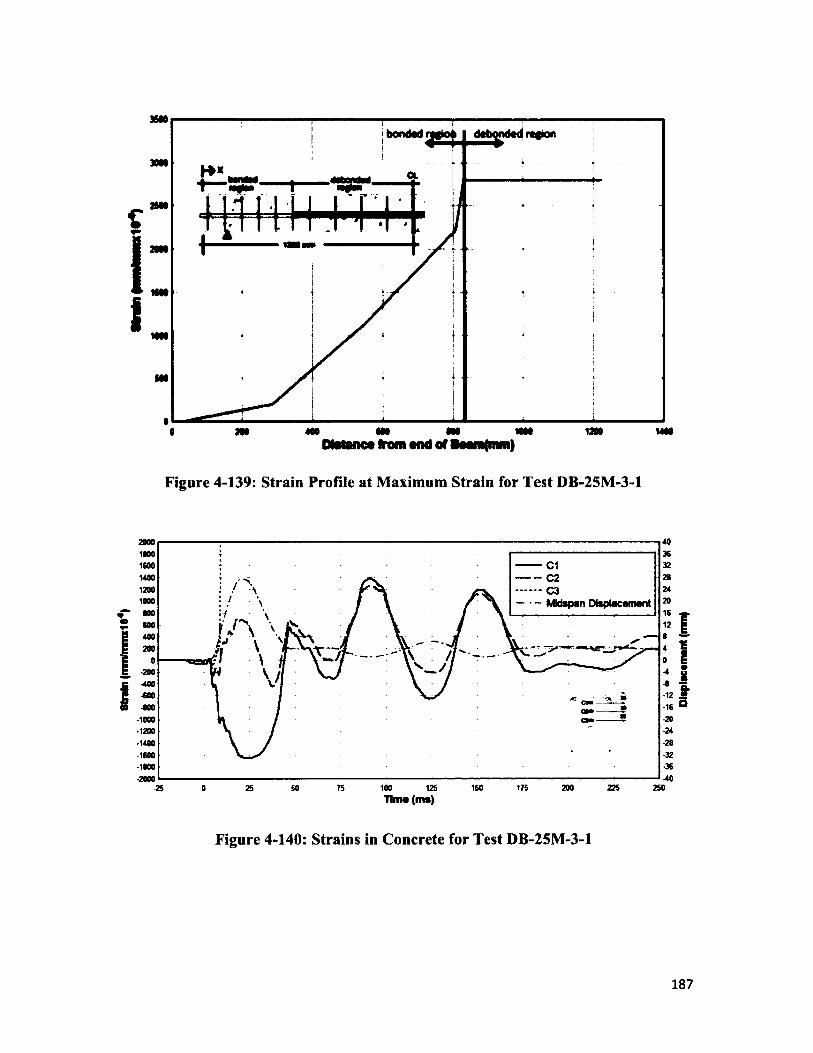
3SM
KM
c
1Itao
400 m 000 MOO 1300 MOO0DManc* from and of l* om(mni)
Figure 4-139: Strain Profile at Maximum Strain for Test DB-25M-3-1
200010001600140012001000000600400200
— C1- 02 — C3~ Midspan Dlsplacamant
m
•200•400•600-000
•1000•1200•1400•1600-1000•2000
•12-16-2024-2832-36-40
cm
cm
20050 75 100 125 150 175 225 250-25 0 25Tim* (ms)
Figure 4-140: Strains in Concrete for Test DB-25M-3-1
187
Dtep
lactm
ant
(mm
)
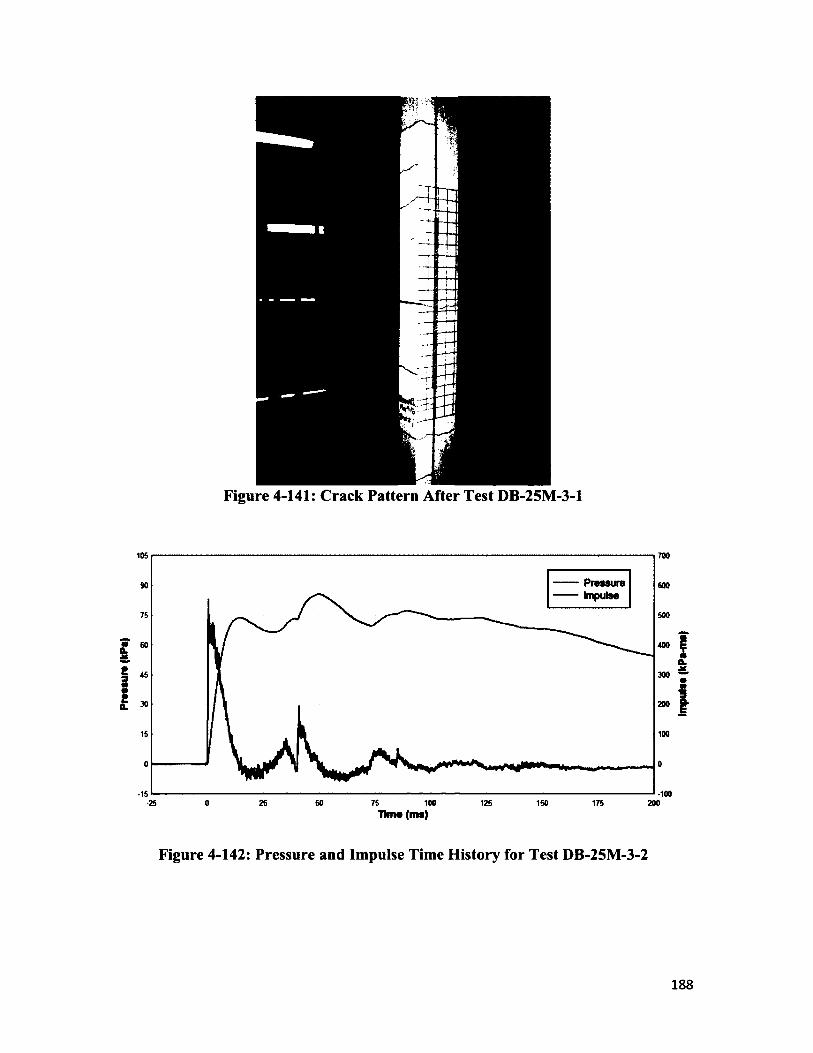
Press
ure
(kPa
)
Figure 4-141: Crack Pattern After Test DB-25M-3-1
105 700
PressureImpulse
600
500
400
300
200
100
•10025 50 75 100 125-25 0 150 175 200
Time (ms)
Figure 4-142: Pressure and Impulse Time History for Test DB-25M-3-2
188
Impu
lse
(kPs
-tns)
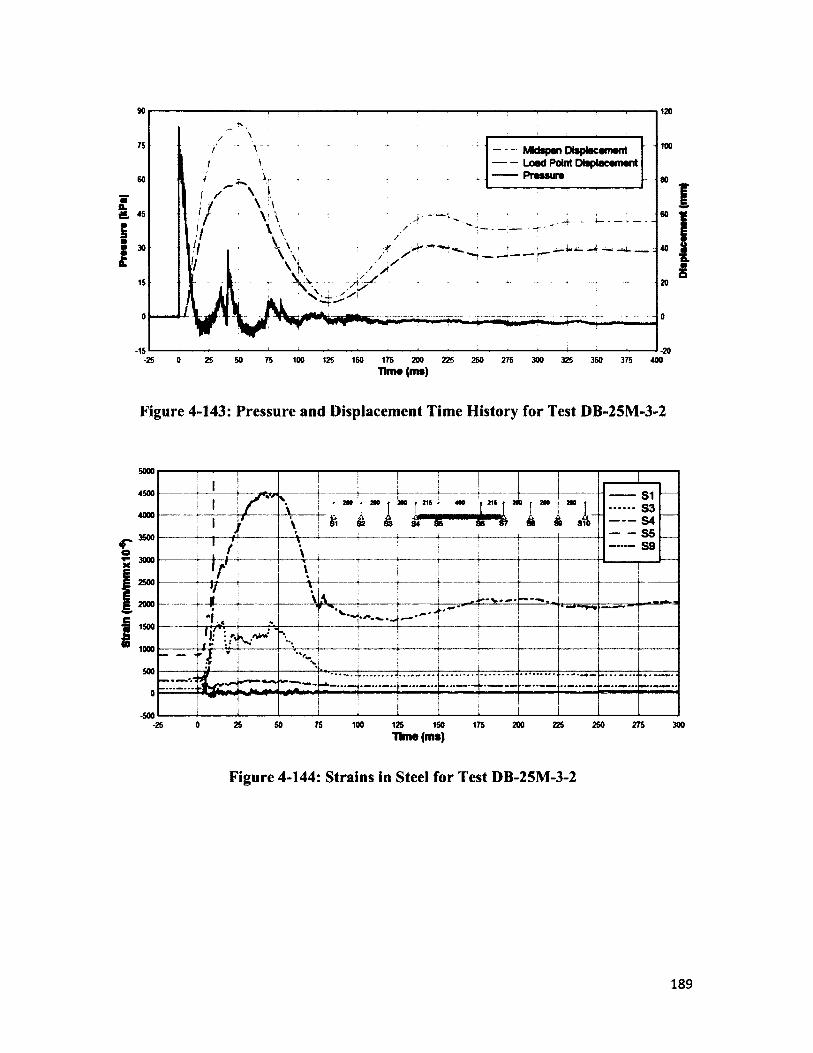
Strain
(m
mftn
mxI
O'4)
Praa
aura
(kP
a)120
100Mktepan Displacement Load Point Displacement Pressure
-15 -20150 175 225•25 0 25 50 75 100 125 200 250 275 300 325 350 375 400
Tima (ms)
Figure 4-143: Pressure and Displacement Time History for Test DB-25M-3-2
5000
4500 i Ij i
1S15 35 45 5 S 9
! I \ 1 ' - ». J l . J _ .
f 3M f no | 216 400r i - ! ~ ! " i . _
: I
I •
1:
1 1
3600; i
/ I — ... \ 81
««- * —» — 32 83 34 85 88 37 86 1 1 310
S ' J l' t ......
\
2500fr \%V
h ...JL V* —- __
1500 » v .f
1 r%
500
0
-500
* i '.. .........
*v„.%
--------- .................
“r a v T *_______ ■ _ . w .
________ 1-25 0 25 50 75 100 125 150 175 200 225 2S0 275 300
Tkne(ma)
Figure 4-144: Strains in Steel for Test DB-25M-3-2
189
(iuui) juouiaoatdaia
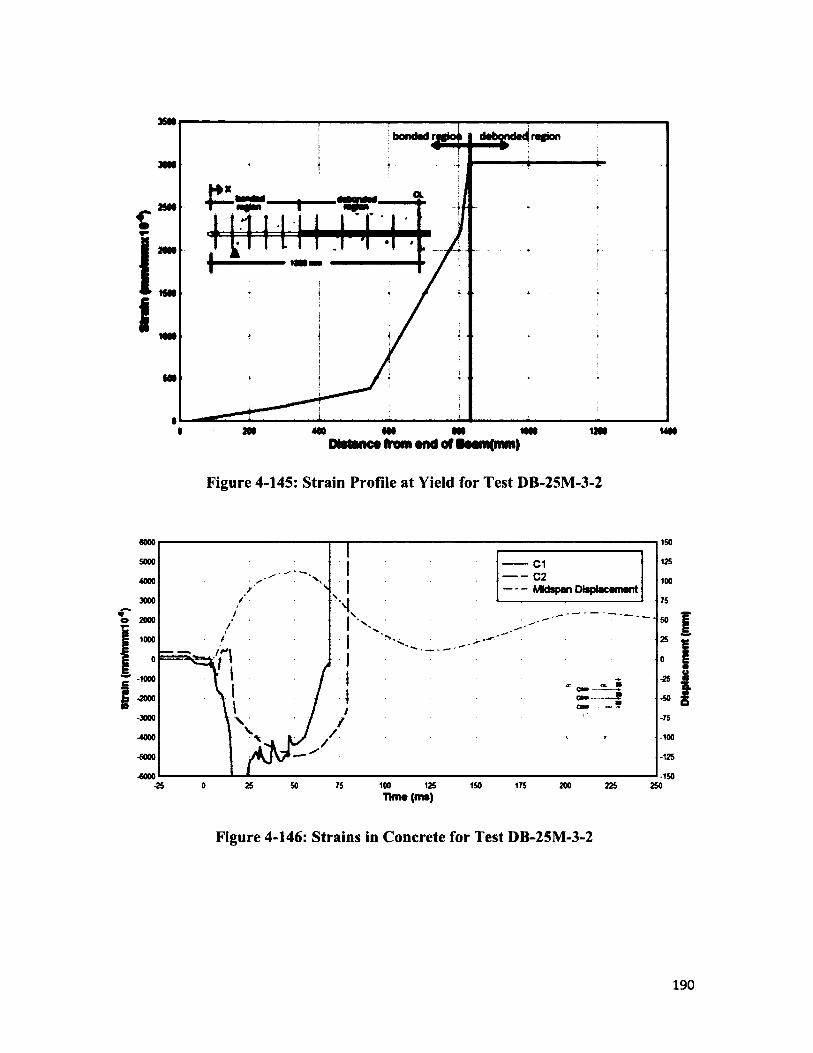
Strain
(m
nVm
mxI
O4)
36Ndabmdaq ragion
Dtrtanca from and of l aamfmm)
Figure 4-145: Strain Profile at Yield for Test DB-25M-3-2
1506000
1255000
- - C2- - Midspan Displacement
4000 100
3000
2000
1000
-1000
cm-75
-100
-5000 -125
-150100 125 150 175 200-25 0 25 50 75 225 250Tima (ms)
Figure 4-146: Strains in Concrete for Test DB-25M-3-2
190
Diap
lacam
ant
(mm
)
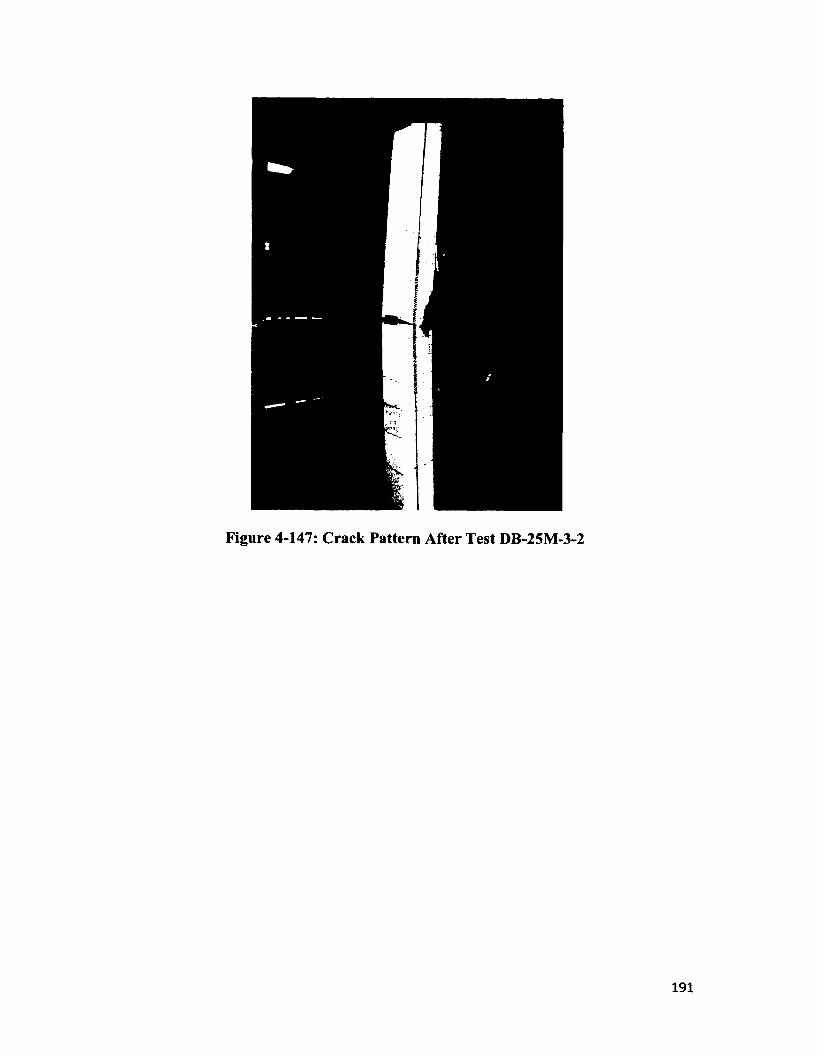
Figure 4-147: Crack Pattern After Test DB-25M-3-2
4.4 Comparison of Static and Dynamic Results
The strain profile in the bonded region was produced at different times during
each test so as to compare the strain profiles for static and dynamic tests. The first time at
which the strain profile was plotted was when the steel in the debonded region reached a
strain of 1500x1 O'6. This value was arbitrarily chosen to be representative o f
reinforcement behaviour in the elastic region.
The second strain profile was plotted was when the strain in the debonded region
reached either its static or dynamic yield strain, depending on whether the beam was
tested statically or with the shock tube. The yield strains used were those determined in
the ancillary testing for both static and dynamic cases. The yield strain was chosen since
the main purpose o f the experimental program is to determine whether current standards
for calculating the development length are sufficient for blast design. Since the
development length is a function o f the yield strain and yield stress, the strain profile at
the time when steel reached its yield strength is o f utmost importance.
The strain profile plotted was when the strain in the debonded region surpassed its
yield strain. Again, arbitrary strain values were chosen for consistency. For beams
containing 15M and 20M reinforcement, the strain used was approximately 3000x1 O'6.
For beams containing 25M reinforcement, the strain used was 3500x1 O'6. A greater strain
value was used for 25M reinforcement because the dynamic yield strain o f 25M rebar
was above 3000x 10‘6.
192
4.4.1 Comparison of SB-15M and DB-15M Beams
The strains in the bonded region for elastic, yield, and post-yield strains were
determined in all beams containing 15M reinforcement. The average strains in the
bonded region from Tests SB-15M-1 and SB-15M-2 were used to produce the static
strain profile (Table 4-15). The average strains in the bonded region from beams DB-
15M-2-1 and DB-15M-3-1 were used to produce the strain profile for shot 1, and the
average strains in the bonded region from beams DB-15M-2-2 and DB-15M-3-2 were
used to produce the strain profile for shot 2 (Table 4-16).
4.4.1.1 Elastic Region
At the time when the strain in the debonded region for all 15M reinforcement
reaches 1500x1 O'6, the strain profile was plotted and shown in Figure 4-148. The strain
profile for the static loading rate produced higher strain values than those for both
dynamic tests. This is evidence that the strain from the steel is transferred to the concrete
over a shorter length for high loading rates. Although the strains in shot 2, which
produced the greatest strain rates, are slightly higher than those in shot 1, the strain rates
are of the same order o f magnitude, thus having little effect on the difference in strains
produced. One reason for higher strain values in shot 2 is that the longitudinal
reinforcement had residual strains from shot 1.
193
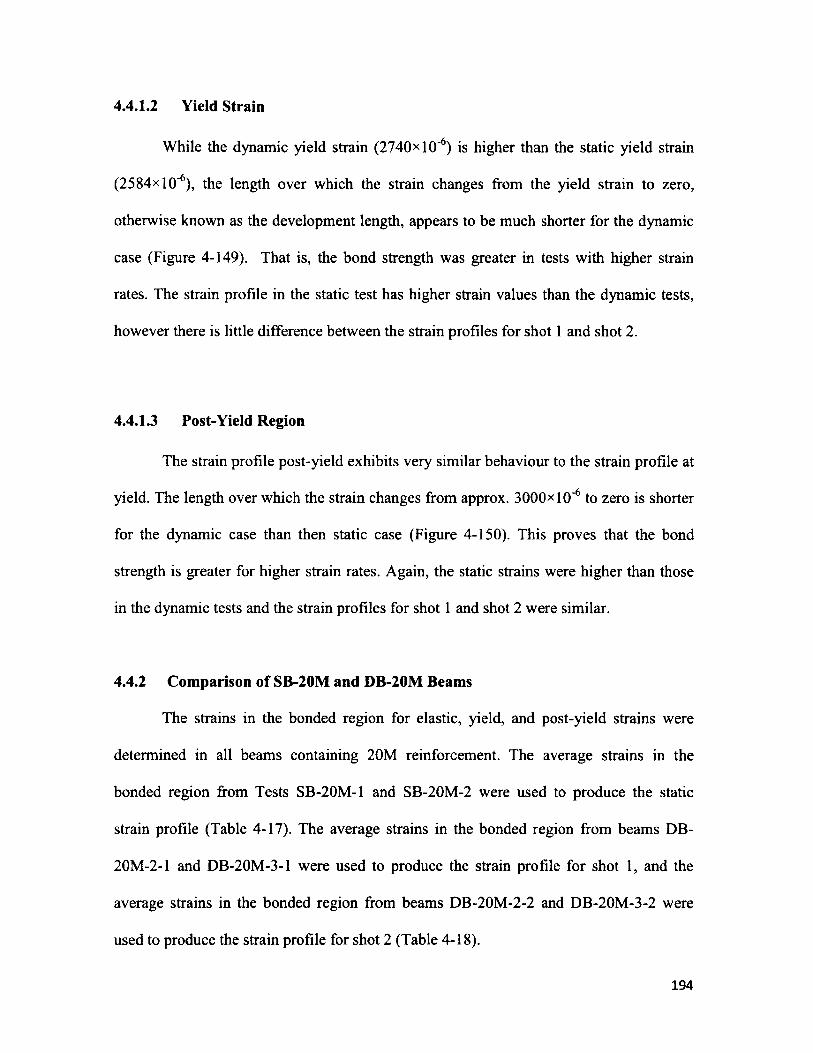
4.4.1.2 Yield Strain
While the dynamic yield strain (2740*1 O’6) is higher than the static yield strain
(2584*1 O'6), the length over which the strain changes from the yield strain to zero,
otherwise known as the development length, appears to be much shorter for the dynamic
case (Figure 4-149). That is, the bond strength was greater in tests with higher strain
rates. The strain profile in the static test has higher strain values than the dynamic tests,
however there is little difference between the strain profiles for shot 1 and shot 2.
4.4.1.3 Post-Yield Region
The strain profile post-yield exhibits very similar behaviour to the strain profile at
yield. The length over which the strain changes from approx. 3000*1 O'6 to zero is shorter
for the dynamic case than then static case (Figure 4-150). This proves that the bond
strength is greater for higher strain rates. Again, the static strains were higher than those
in the dynamic tests and the strain profiles for shot 1 and shot 2 were similar.
4.4.2 Comparison of SB-20M and DB-20M Beams
The strains in the bonded region for elastic, yield, and post-yield strains were
determined in all beams containing 20M reinforcement. The average strains in the
bonded region from Tests SB-20M-1 and SB-20M-2 were used to produce the static
strain profile (Table 4-17). The average strains in the bonded region from beams DB-
20M-2-1 and DB-20M-3-1 were used to produce the strain profile for shot 1, and the
average strains in the bonded region from beams DB-20M-2-2 and DB-20M-3-2 were
used to produce the strain profile for shot 2 (Table 4-18).
194
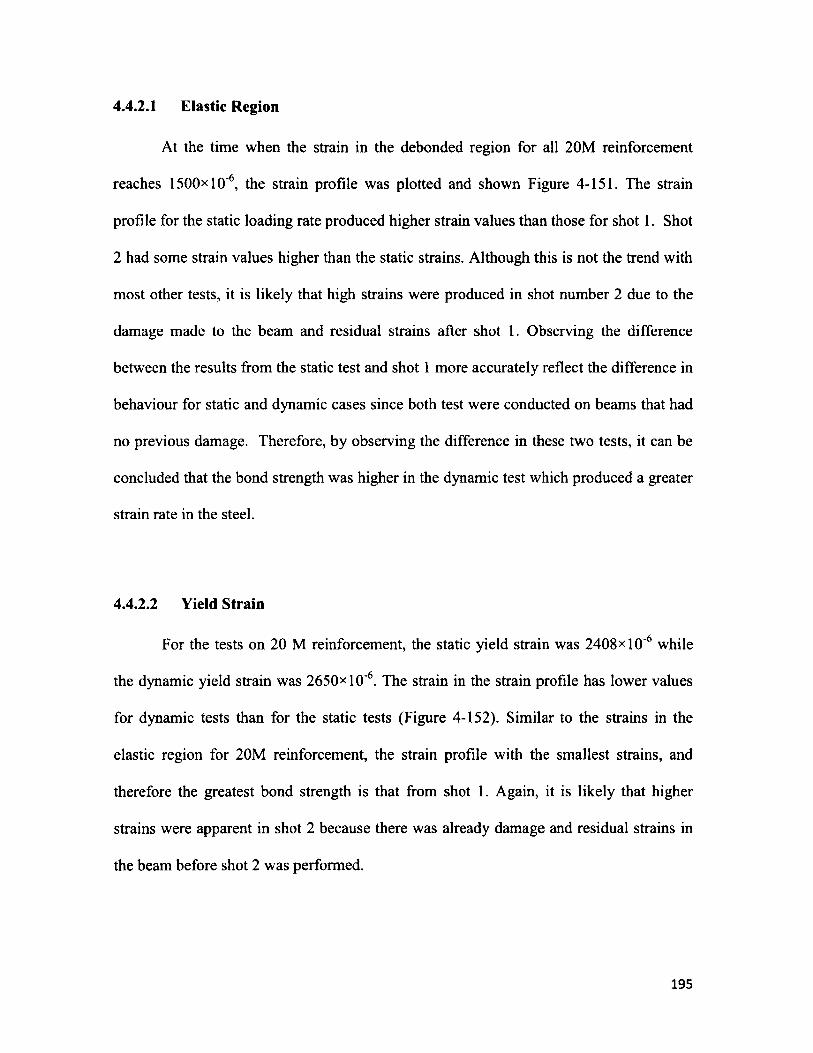
4.4.2.1 Elastic Region
At the time when the strain in the debonded region for all 20M reinforcement
reaches 1500*10'6, the strain profile was plotted and shown Figure 4-151. The strain
profile for the static loading rate produced higher strain values than those for shot 1. Shot
2 had some strain values higher than the static strains. Although this is not the trend with
most other tests, it is likely that high strains were produced in shot number 2 due to the
damage made to the beam and residual strains after shot 1. Observing the difference
between the results from the static test and shot 1 more accurately reflect the difference in
behaviour for static and dynamic cases since both test were conducted on beams that had
no previous damage. Therefore, by observing the difference in these two tests, it can be
concluded that the bond strength was higher in the dynamic test which produced a greater
strain rate in the steel.
4.4.2.2 Yield Strain
For the tests on 20 M reinforcement, the static yield strain was 2408x10‘6 while
the dynamic yield strain was 2650x 10'6. The strain in the strain profile has lower values
for dynamic tests than for the static tests (Figure 4-152). Similar to the strains in the
elastic region for 20M reinforcement, the strain profile with the smallest strains, and
therefore the greatest bond strength is that from shot 1. Again, it is likely that higher
strains were apparent in shot 2 because there was already damage and residual strains in
the beam before shot 2 was performed.
195
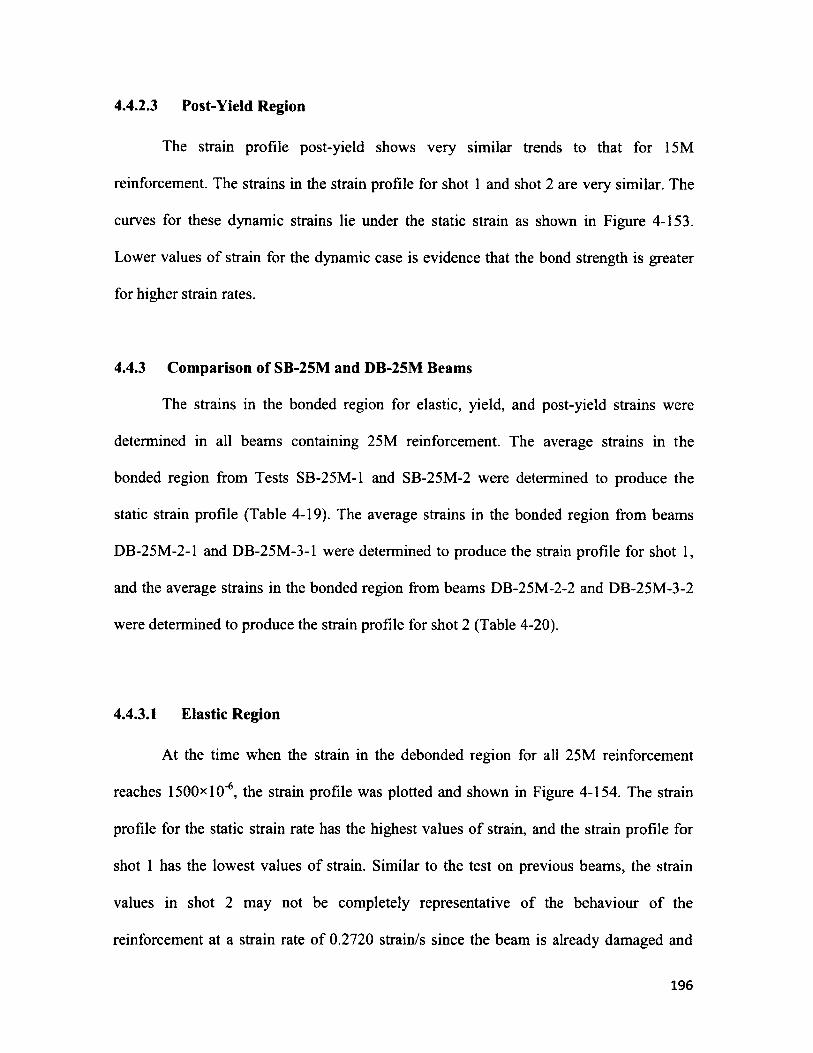
4.4.2.3 Post-Yield Region
The strain profile post-yield shows very similar trends to that for 15M
reinforcement. The strains in the strain profile for shot 1 and shot 2 are very similar. The
curves for these dynamic strains lie under the static strain as shown in Figure 4-153.
Lower values o f strain for the dynamic case is evidence that the bond strength is greater
for higher strain rates.
4.4.3 Comparison of SB-25M and DB-25M Beams
The strains in the bonded region for elastic, yield, and post-yield strains were
determined in all beams containing 25M reinforcement. The average strains in the
bonded region from Tests SB-25M-1 and SB-25M-2 were determined to produce the
static strain profile (Table 4-19). The average strains in the bonded region from beams
DB-25M-2-1 and DB-25M-3-1 were determined to produce the strain profile for shot 1,
and the average strains in the bonded region from beams DB-25M-2-2 and DB-25M-3-2
were determined to produce the strain profile for shot 2 (Table 4-20).
4.4.3.1 Elastic Region
At the time when the strain in the debonded region for all 25M reinforcement
reaches 1500x1 O'6, the strain profile was plotted and shown in Figure 4-154. The strain
profile for the static strain rate has the highest values o f strain, and the strain profile for
shot 1 has the lowest values o f strain. Similar to the test on previous beams, the strain
values in shot 2 may not be completely representative o f the behaviour o f the
reinforcement at a strain rate o f 0.2720 strain/s since the beam is already damaged and
196
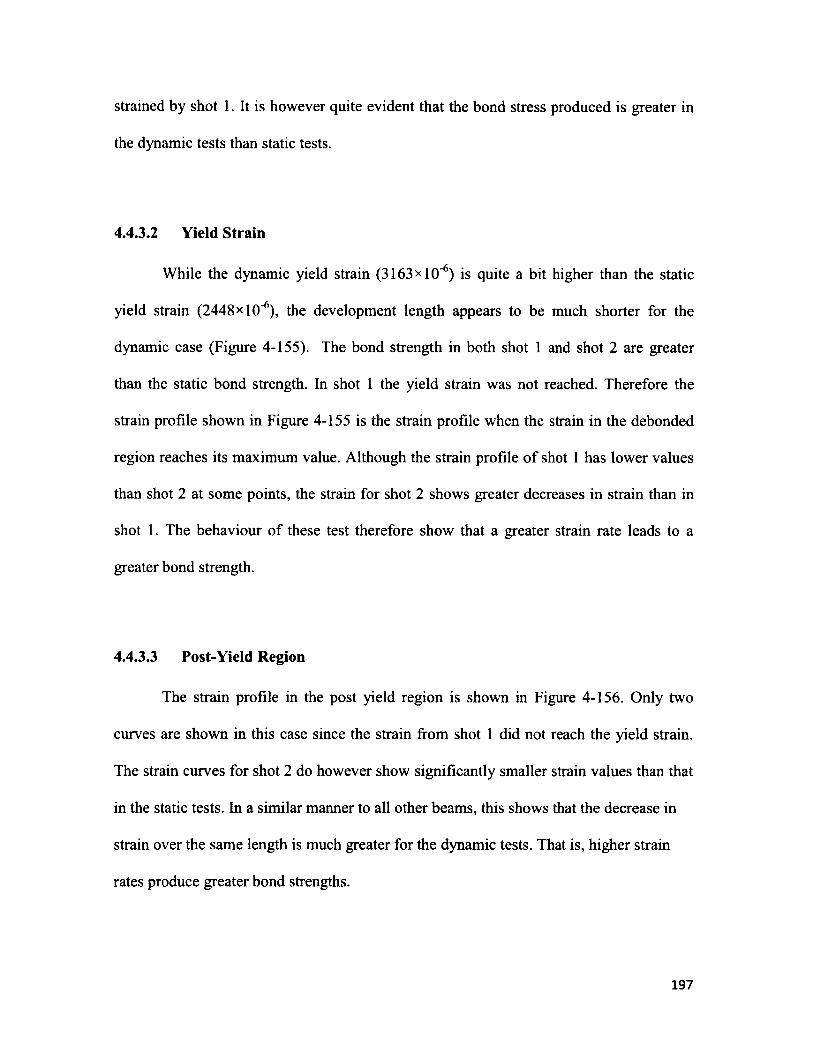
strained by shot 1. It is however quite evident that the bond stress produced is greater in
the dynamic tests than static tests.
4.4.3.2 Yield Strain
While the dynamic yield strain (3163x1 O'6) is quite a bit higher than the static
yield strain (2448*1 O'6), the development length appears to be much shorter for the
dynamic case (Figure 4-155). The bond strength in both shot 1 and shot 2 are greater
than the static bond strength. In shot 1 the yield strain was not reached. Therefore the
strain profile shown in Figure 4-155 is the strain profile when the strain in the debonded
region reaches its maximum value. Although the strain profile o f shot 1 has lower values
than shot 2 at some points, the strain for shot 2 shows greater decreases in strain than in
shot 1. The behaviour o f these test therefore show that a greater strain rate leads to a
greater bond strength.
4.4.3.3 Post-Yield Region
The strain profile in the post yield region is shown in Figure 4-156. Only two
curves are shown in this case since the strain from shot 1 did not reach the yield strain.
The strain curves for shot 2 do however show significantly smaller strain values than that
in the static tests. In a similar manner to all other beams, this shows that the decrease in
strain over the same length is much greater for the dynamic tests. That is, higher strain
rates produce greater bond strengths.
197
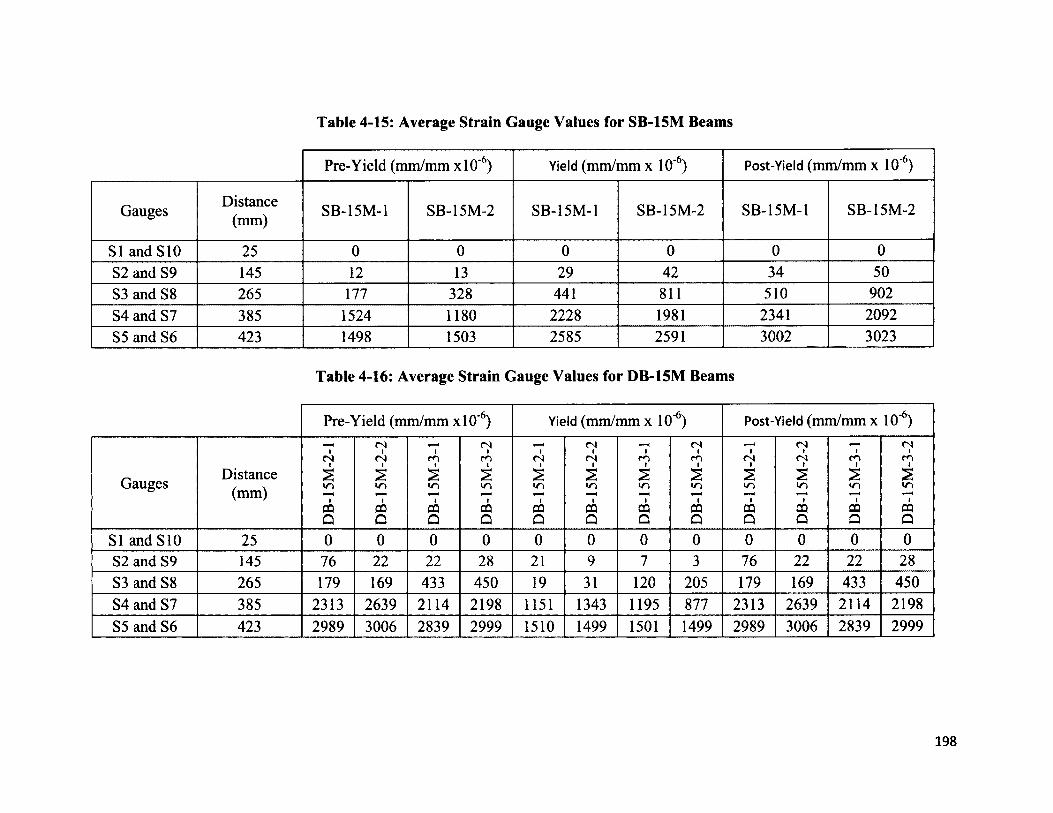
Table 4-15: Average Strain Gauge Values for SB-15M Beams
Pre-Yield (mm/mm xlO'6) Yield (mm/mm x 10"6) Post-Yield (mm/mm x 10’6)
GaugesDistance
(mm) SB-15M-1 SB-15M-2 SB-15M-1 SB-15M-2 SB-15M-1 SB-15M-2
SI and S 10 25 0 0 0 0 0 0S2 and S9 145 12 13 29 42 34 50S3 and S8 265 177 328 441 811 510 902S4 and S7 385 1524 1180 2228 1981 2341 2092S5 and S6 423 1498 1503 2585 2591 3002 3023
Table 4-16: Average Strain Gauge Values for DB-15M Beams
Pre-Yield (m m /m m xlO'6) Yield (m m /m m x 10’6) Post-Yield (m m /m m x 10‘6)— <N <N (N —. <N —i <N — (N<N (N m m <N (N m <N CN m
Distance 2 2 2 2 2 2 2 2 2 2 2 2Gauges(m m )
in >n in in in in in m m mi
CO1
CQi
CQi
CQi
CQ1
CQ1
CQ1
CQ1
CQ1
CQ1
CQ1
CQQ Q Q Q Q o O Q Q Q Q Q
SI and S10 25 0 0 0 0 0 0 0 0 0 0 0 0
S2 and S9 145 76 22 22 28 21 9 7 3 76 22 22 28S3 and S8 265 179 169 433 450 19 31 120 205 179 169 433 450S4 and S7 385 2313 2639 2114 2198 1151 1343 1195 877 2313 2639 2114 2198S5 and S6 423 2989 3006 2839 2999 1510 1499 1501 1499 2989 3006 2839 2999
198
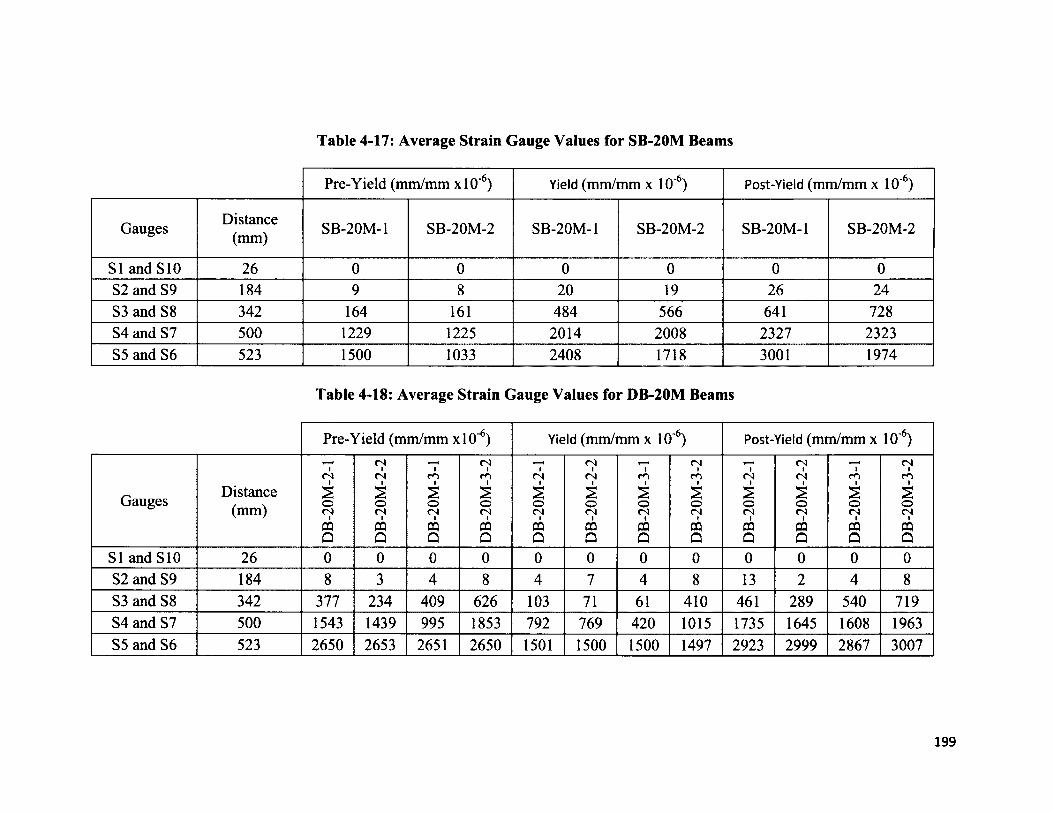
Table 4-17: Average Strain Gauge Values for SB-20M Beams
Pre-Yield (mm/mm xlO'6) Yield (mm/mm x 10'6) Post-Yield (mm/mm x 10"6)
Gauges Distance(mm) SB-20M-1 SB-20M-2 SB-20M-1 SB-20M-2 SB-20M-1 SB-20M-2
SI and S10 26 0 0 0 0 0 0S2 and S9 184 9 8 20 19 26 24S3 and S8 342 164 161 484 566 641 728S4 and S7 500 1229 1225 2014 2008 2327 2323S5 and S6 523 1500 1033 2408 1718 3001 1974
Table 4-18: Average Strain Gauge Values for DB-20M Beams
Pre-Yield (mm/mm xlO'6) Yield (mm/mm x 10~6) Post-Yield (mm/mm x 10'6)— . fN — . fN fN — . fN — c fN — fNfN fN <T) <N fN <N fN r n m
G a u p e sDistance £ s s s s s s s s s
(mm) <N fN fN fN fN (N (N (N fN fN fN fN
DQ CQ m CQ CQ CQ CQ CQ CQ S3 CQ CQQ Q Q Q Q Q Q Q Q Q Q Q
SI and S10 26 0 0 0 0 0 0 0 0 0 0 0 0S2 and S9 184 8 3 4 8 4 7 4 8 13 2 4 8S3 and S8 342 377 234 409 626 103 71 61 410 461 289 540 719S4 and S7 500 1543 1439 995 1853 792 769 420 1015 1735 1645 1608 1963S5 and S6 523 2650 2653 2651 2650 1501 1500 1500 1497 2923 2999 2867 3007
199
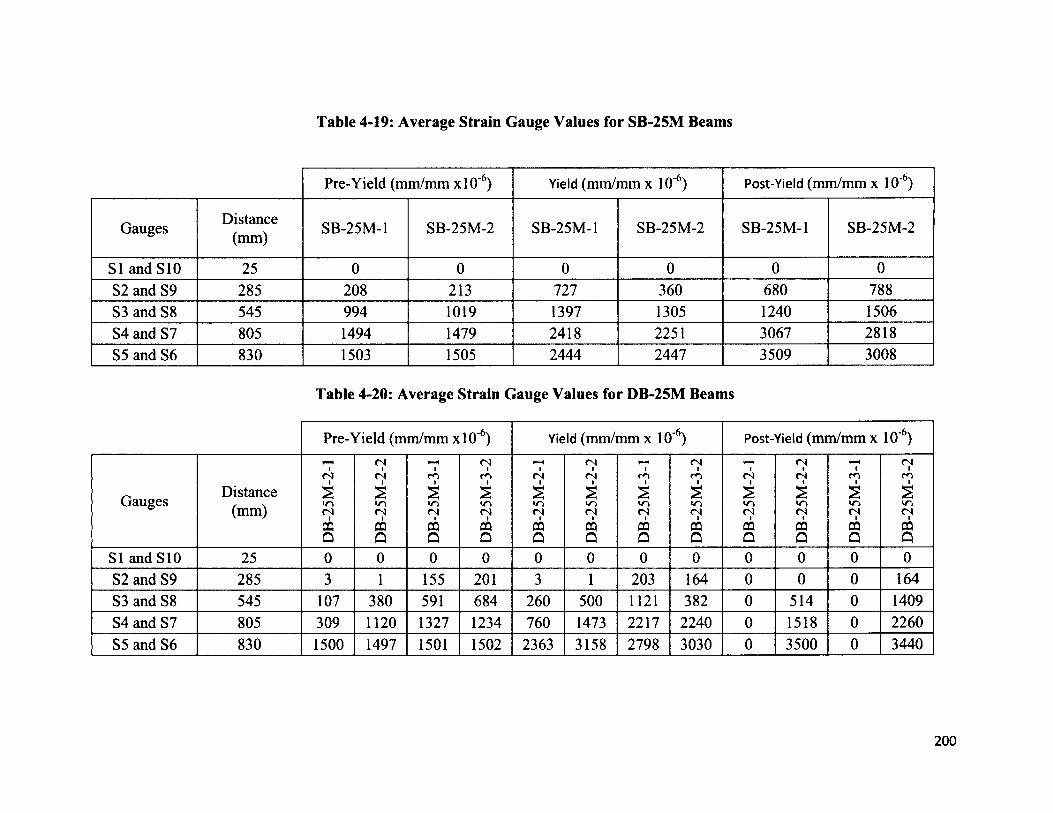
Table 4-19: Average Strain Gauge Values for SB-25M Beams
Pre-Yield (mm/mm xlO'6) Yield (mm/mm x 10‘6) Post-Yield (mm/mm x 10~6)
Gauges Distance(mm) SB-25M-1 SB-25M-2 SB-25M-1 SB-25M-2 SB-25M-1 SB-25M-2
SI and S 10 25 0 0 0 0 0 0S2 and S9 285 208 213 727 360 680 788S3 and S8 545 994 1019 1397 1305 1240 1506S4 and S7 805 1494 1479 2418 2251 3067 2818S5 and S6 830 1503 1505 2444 2447 3509 3008
Table 4-20: Average Strain Gauge Values for DB-25M Beams
Pre-Yield (mm/mm xlO'6) Yield (mm/mm x 10'6) Post-Yield (mm/mm x 10‘6)fmmi fN fN fN fN —i fN —i (NfN fN CO r<1 fN fN r*"> fN fN m m
Distance S s s s s s s s s s s s(mm) fN fN fN fN fN fN fN fN fN fN fN fN
CQ CQ CQ CQ CQ CQ CQ CQ CQ oa CQ CQQ Q Q Q Q Q Q Q Q Q Q Q
SI and S10 25 0 0 0 0 0 0 0 0 0 0 0 0S2 and S9 285 3 1 155 201 3 1 203 164 0 0 0 164S3 and S8 545 107 380 591 684 260 500 1121 382 0 514 0 1409S4 and S7 805 309 1120 1327 1234 760 1473 2217 2240 0 1518 0 2260S5 and S6 830 1500 1497 1501 1502 2363 3158 2798 3030 0 3500 0 3440
200
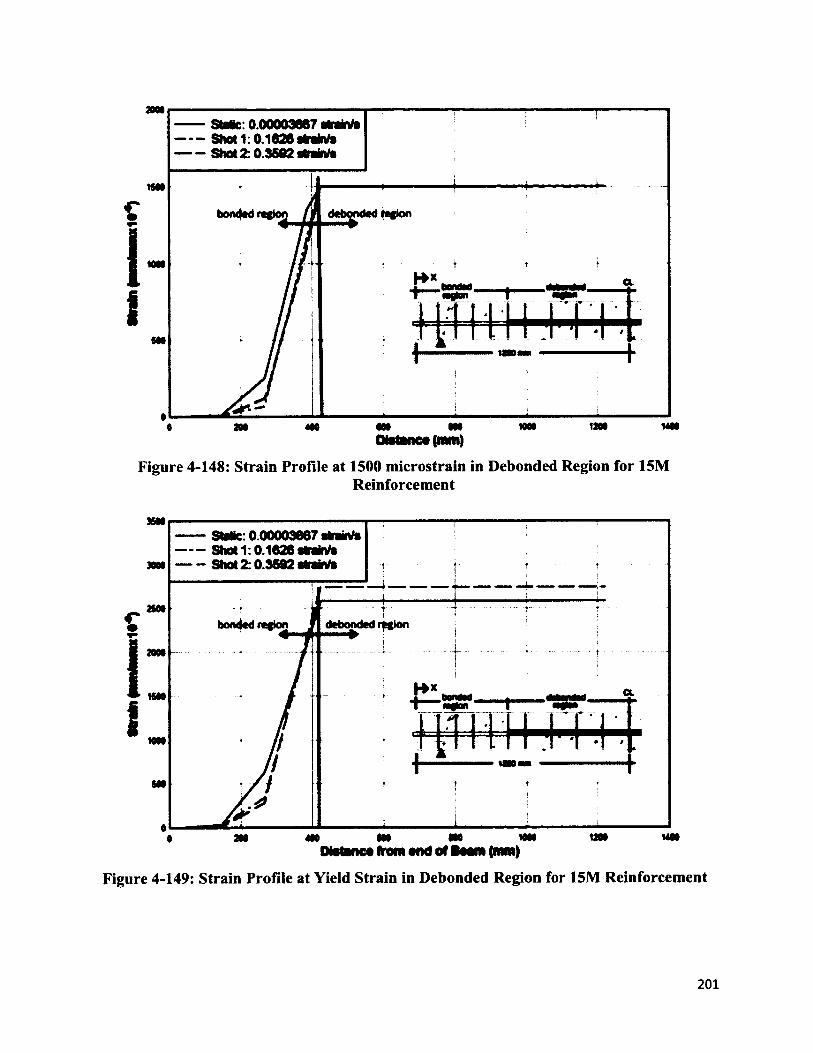
Static: 0.00003667 * 1 Shot 1:0.1626 aMnte Shot 2 0.3682 attain/*
ISM
f
1I
bonded region
O.
MM(M MSt m mDistance (mm)
Figure 4-148: Strain Profile at 1500 microstrain in Debonded Region for 15MReinforcement
Sialic: 0.00003667 aft Shot 1:0.1626 atraMS Shot 2:0.3592 strain/s
bonded region
CL
13MDistance Arom and of Boom (mm)
Figure 4-149: Strain Profile at Yield Strain in Debonded Region for 15M Reinforcement
201
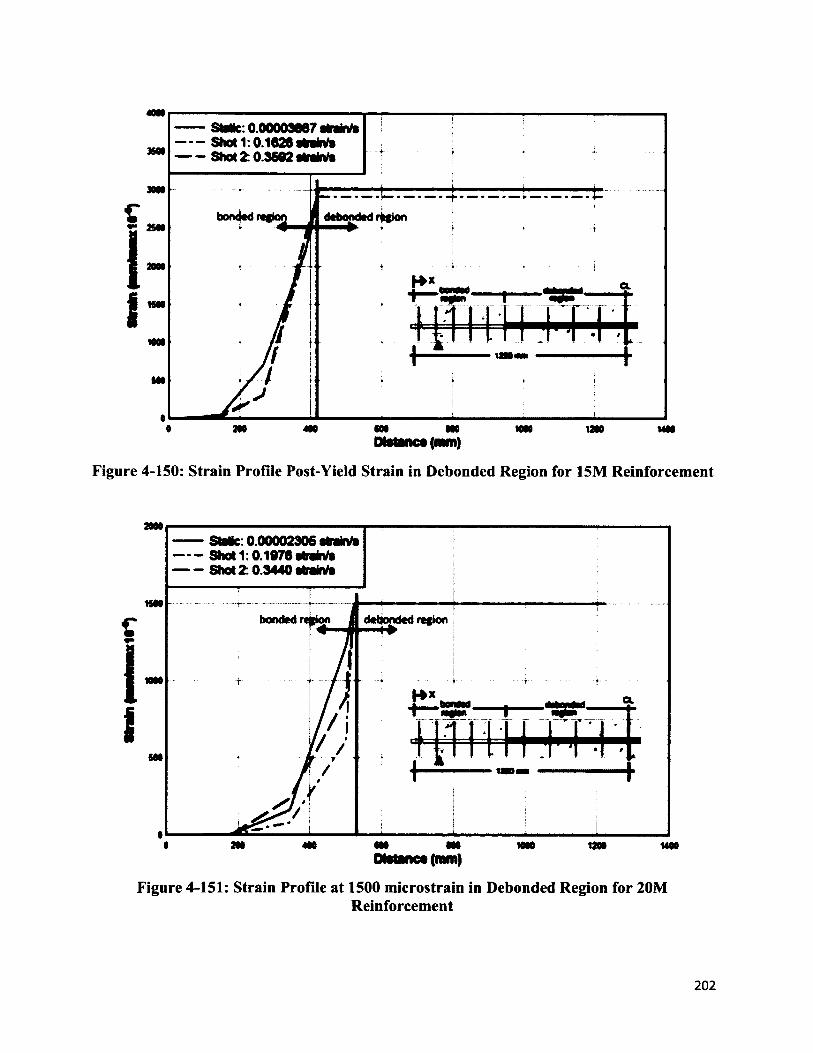
Static: 0.00003667 alra Shot 1:0.1626 straWs Shot 2:0.3682 strainfe
f
no m CM NO MM UNDistanca(mm)
Figure 4-150: Strain Profile Post-Yield Strain in Debonded Region for 15M Reinforcement
Static: 0.00002306 stain/s Shot 1:0.1976 straWs Shot 2. 0.3440 straws
bonded riC
II CL
NO
NO NO0 NO ON MN 1200 UNDistanca (mm)
Figure 4-151: Strain Profile at 1500 microstrain in Debonded Region for 20MReinforcement
202
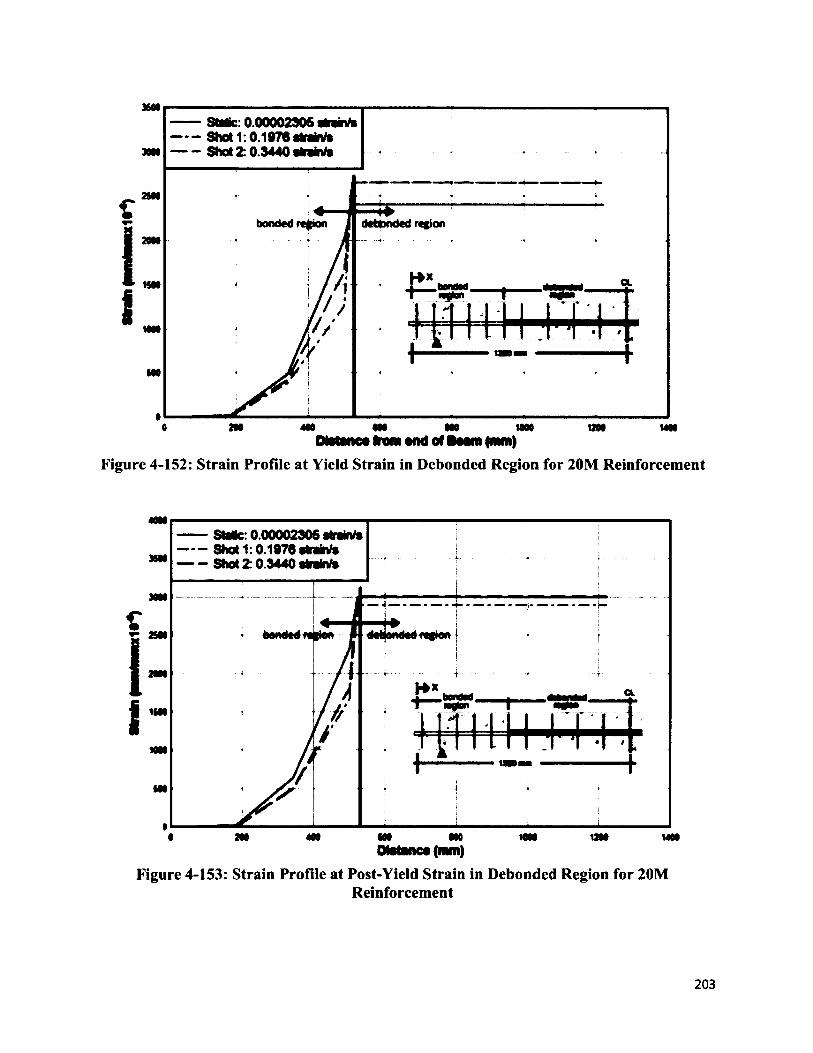
36MStatic: 0.00002305 sbain/k Shot 1:0.1976 strain/s Shot 2:0.3440 skata/s30N
2SN
bonded region20N
CLMM
MM
M0
0MO MO OM0 CM MM tMO MM
Oistanca from and of I c aw (mm)Figure 4-152: Strain Profile at Yield Strain in Debonded Region for 20M Reinforcement
— Static: 0.00002305 strain/*— Shot 1:0.1076 strain/*— Shot 2:0.3440 abakt/s
C MM
| _
I" CL
MO MO MO MO 1M00 MMDlatanca (mm)
Figure 4-153: Strain Profile at Post-Yield Strain in Debonded Region for 20MReinforcement
203
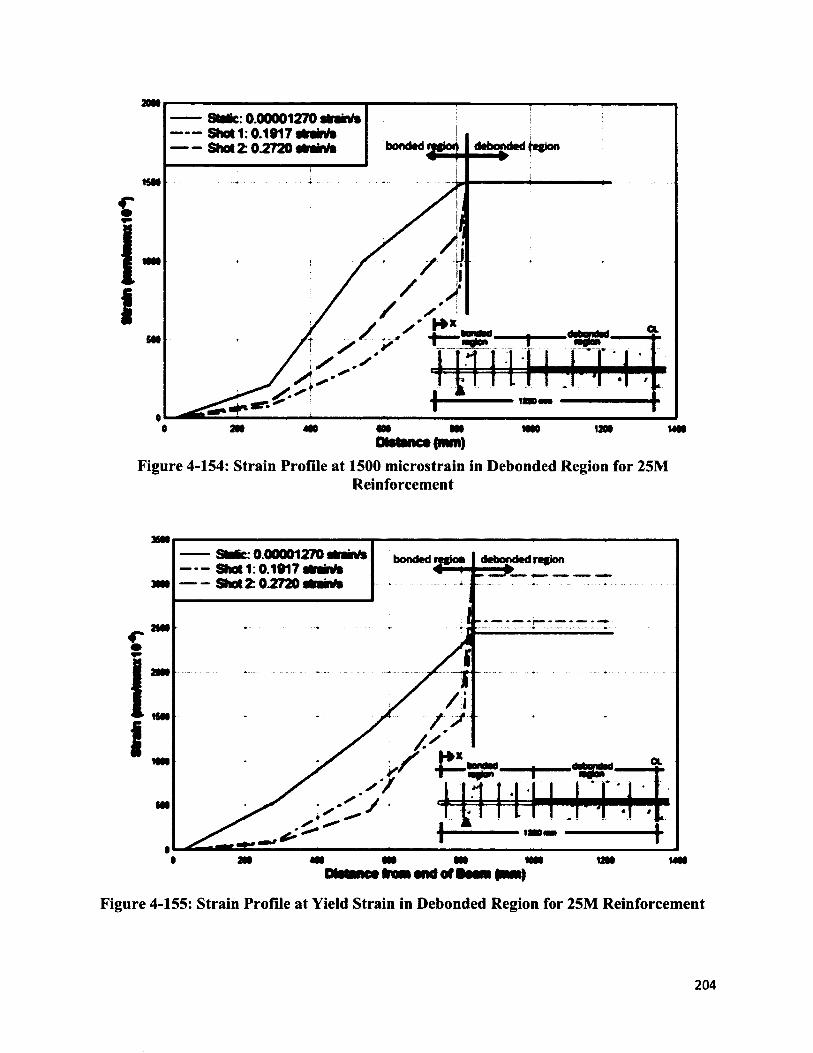
Static: 0.00001270 Shot 1:0.1017 sM Shot 2:0.2720 «M bonded
aSM
M m M l MM UN MMOMancti(mm)
Figure 4-154: Strain Profile at 1500 microstrain in Debonded Region for 25MReinforcement
3SM- Static: 000001270- Shot 1:0.1917 oM- Shot 2:0.2720 Mrai
debonded region
MM
MM
CL
IM
M l M l •Mm MM 13M MM»)
Figure 4-155: Strain Profile at Yield Strain in Debonded Region for 25M Reinforcement
204
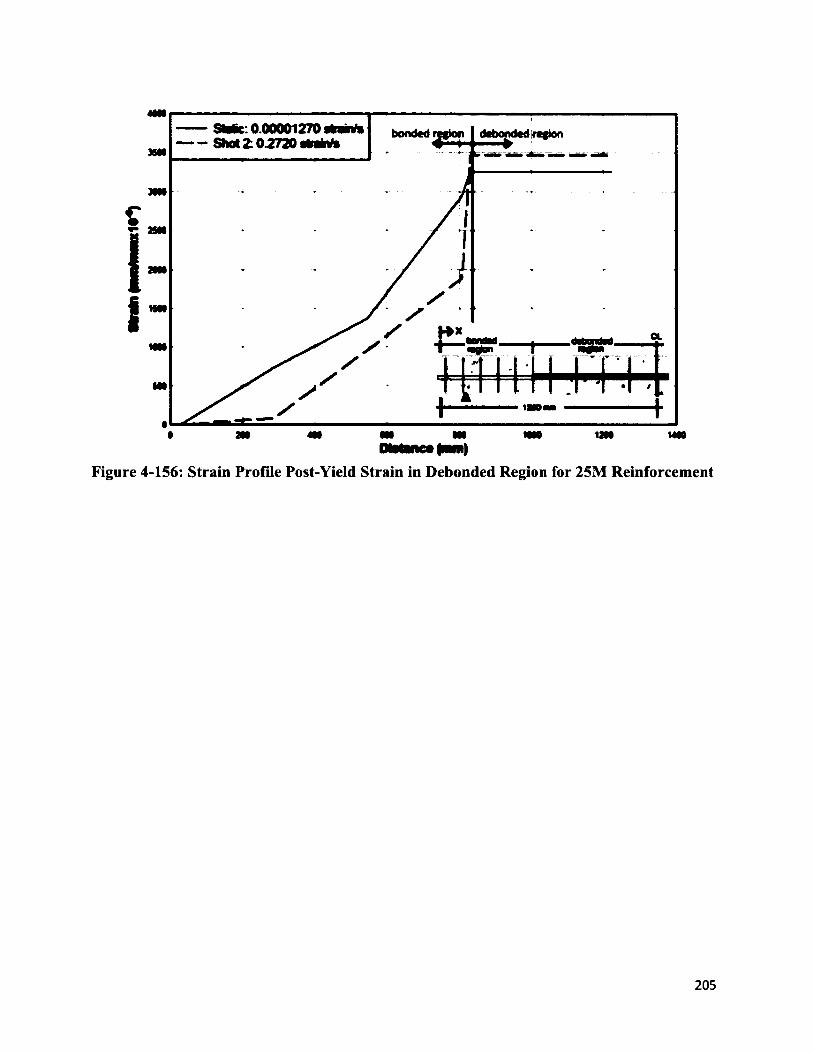
Stale: 0.00001270 tan Shot 2:0.2720 tartan*
bonded
CL
M
mm m m 12M MMOtatwtc* (MR)
Figure 4-156: Strain Profile Post-Yield Strain in Debonded Region for 25M Reinforcement
205

4.5 Summary of Results
The data acquired from the static and dynamic tests on the reinforced concrete beams
shoed many results that were consistent between beams. The following points summarize the
most important information gathered from the results o f experimental program:
1. The development length provided was adequate for transfer o f the dynamic yield stress of
the reinforcing steel in all beams.
2. No reinforcement slip occurred during any test.
3. Dynamic testing o f the reinforcing steel used strain rates of 0.1 strain/s and 0.2 strain/s to
estimate the dynamic yield strain o f the reinforcing bars in Shock Tube Testing.
4. In Shock Tube testing, a pressure and impulse combination was chosen so that
reinforcing steel in the concrete beam would just exceed its dynamic yield stress. The
average strain rate produced in the reinforcing steel during these tests was 0.18 strain/s.
The average maximum support rotation from these tests was 1.6°.
5. In Shock Tube testing where the maximum pressure and impulse combination were used,
the average strain rate produced in the steel was 0.325 strain/s. The average maximum
support rotation from these tests was 6.5°.
6. Strain profiles were produced to compare the static strain profile to the dynamic strain
profile for each size o f reinforcement. From the strain profiles, it was noticed that the
smallest strains occurred in the reinforcing steel in the beams undergoing Shock Tube
testing, and where no test had previously been performed on the beam.
206
4.6 Sources of Error
While the design, construction, and installation of test equipment were very carefully
implemented, there exist sources o f error within the experimental program. The construction of
tests specimens involved many steps with detailed designs. Each step was executed carefully and
involved precise installation and measurements. However, some errors installation,
measurement, and handling during construction resulted in small differences between the
constructed specimens. The static test beams were tested in the horizontal position while the
shock tube test beams were tested in a vertical position in the open face o f the shock tube. This
meant that the direction o f gravity loading and its effect on beam behaviour was different
between two test setups. Again, measurements were made for proper installation, but there do
exist sources o f error in this step. Once the beams were installed, additional measuring devices
were installed in a consistent manner before the tests were conducted. The tests were then
performed and data was acquired. Installation o f this equipment and operation o f the shock tube
and static test apparatus was another step within the experimental program where errors may
have been introduced. The following section describes the sources o f error from the installation
o f strain gauges, construction of specimens, installation of beams on test apparatus, installation
o f deflection measuring devices, and the installation and operation o f the data acquisition
systems.
4.6.1 Construction of Specimens
The construction o f test specimens, as described in Chapter 3, was a very long and
detailed process. Through the construction o f the test specimens, the goal was to achieve 5
207
identical beams containing each o f the selected rebar; 15M, 20M, and 25M. Although it is not
possible to construct the beams to be identical, measures were taken to ensure the details in each
beam were as similar as possible. While sources o f error may have resulted from each step in the
construction o f test specimens, only those having the greatest effect on the results are mentioned.
These errors are as follows:
• Steel gauges may have been installed so that their orientation did not exactly
coincide with the direction o f longitudinal reinforcement. Misalignment o f the
gauge could introduce error in the strain value in the longitudinal direction.
• Longitudinal steel may have been moved during construction, offsetting the
debonded region from its exact midspan location, and affecting the symmetry o f
the strain gauges
• Lead wires from the strain gauges may have been damaged during the installation
of the vinyl pipe to create the debonded region.
• Steel gauges directly outside of the debonded region may have been moved very
close to the debonded region during construction. If any voids were present in the
concrete after casting, then gauge S4 or S7, may have behaved as though they
were within the debonded region.
• Large voids existed in the concrete in some o f the beams due to improper
vibration o f the concrete mix. If these voids were located at the depth o f the
longitudinal reinforcement, than the bond o f the steel to the concrete would be
effected.
208
4.6.2 Installation of Specimen on Shock tube or Static Loading Apparatus
Once all beams were constructed, they were installed on either the static test apparatus or
the shock tube. While the installation o f the beams on the static setup was quite simple, some
errors were made. Beam SB-20M-2 was placed, and aligned on the supports using the crane in
the laboratory. During installation o f the beam the crane was accidentally moved while still
attached to the beam causing the beam to fall off its supports. Although the height o f the fall was
not very large, the impact o f the concrete beam on the floor led to opening o f the preformed
cracked and rupture of all the concrete gauges.
Installation o f the beam on the front o f the shock tube was slightly more difficult due to
low head room in the laboratory. The use o f cranes, forklifts and jacks did however make it
possible to get the beam in place at the center o f the load transfer device. Once in place, the
supports were installed and bolted tightly so the beam would not move vertically. During
installation of Beam DB-15M-1-1, the top surface o f the beam appeared to deflect at midspan.
This was caused by the fact that the supports were placed closer to the shock tube than the load
points. The location o f the supports was then repaired in an attempt to ensure no stresses were
applied to the beam before testing.
4.6.3 Data Acquisition Installation and Operation
Before testing, wire gauges or LVDTs were installed to measure displacements.
All wires and cables from gauges and LVDTs were attached to the data acquisition system in
order to record strains and displacements. Errors in installation o f wire gauges and LVDTs as
209
well as errors in the values recorded in the data acquisition may have occurred. These errors
include the following:
• If the displacement gauges (including both LVDTs and wire gauges) were not
installed perfectly perpendicular to the beam, then some error in the value o f the
displacement obtained during testing was introduced.
• While the beam is assumed to act as two rigid bodies, cracks were often observed
at the location of the load points. This is because there exists some resistance to
rotation.
• When the strain reached a value close to 12500x10-6 the strain leveled off and
higher strains would not be recorded. While the strain limit of the gauge is
30000x10-6, it is possible that the data acquisition will not record higher values
due to its limitations.
• Some strains in steel were negative. This was often recorded in gauges S3 or S8
during rebound of the beam. The reason for this is that when the steel in the
midspan goes into the plastic region, it has irrecoverable strains. Upon rebound
the steel is now longer, so at locations along the steel, adjacent to the plastically
strained material, areas o f compressive strain are formed.
• Concrete gauges broke quickly due to the high tensile strains produced at the
midspan of the beam during shock tube testing. For static tests, the application of
concrete gauges was more useful since the gauges last much longer. The goal of
using the gauges was to determine the strain profile in the beam at different time
steps. Unfortunately this could not be determined since only one o f three gauges
remained operable up to maximum deflection.
210
• There is a small deviation in pressure values from both pressure gauges at the
Shock Tube opening. For the pressure gauge located on the side o f the shock tube,
one source of error may be that as the load transfer device deflects, pressure
escapes from the sides of the shock tube. For the pressure gauge located at the
bottom of the shock tube, one source o f error could be that there is a buildup of
loose foils covering the pressure gauge within the shock tube caused by the
rupturing o f the diaphragm in each test.
• For shock tube testing, it is not possible to determine if the load at each load point
is equal. Some error may be introduced by the assumption that the load is evenly
distributed to both load points.
While sources of error do exist in the experimental program, many measures were taken
to reduce sources o f error. These include precise measurements during the construction of the
specimens, careful installation and placement o f the beams on the test apparatus, and the use of
multiple specimens to determine average values. The results o f the experimental program did
show some consistency and some very obvious trends in the data so that conclusions cold be
drawn.
211
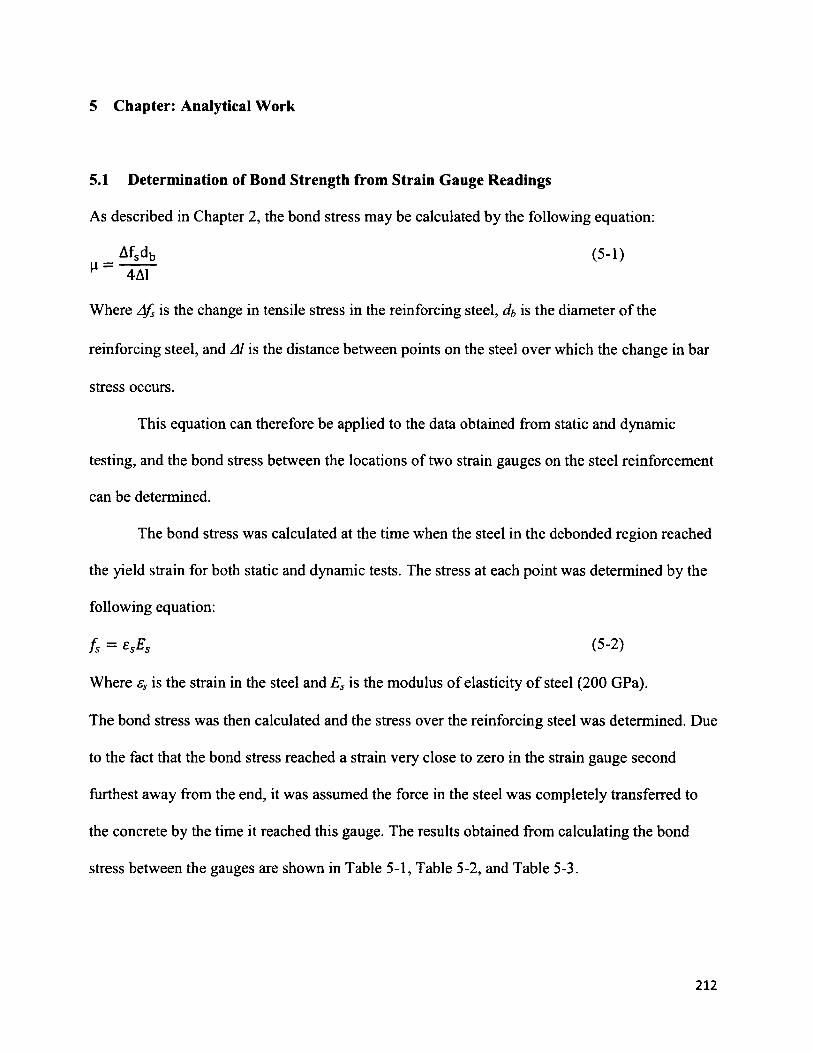
5 Chapter: Analytical Work
5.1 Determination of Bond Strength from Strain Gauge Readings
As described in Chapter 2, the bond stress may be calculated by the following equation:
= Afsdb (5-1)^ 4A1
Where Afs is the change in tensile stress in the reinforcing steel, is the diameter o f the
reinforcing steel, and Al is the distance between points on the steel over which the change in bar
stress occurs.
This equation can therefore be applied to the data obtained from static and dynamic
testing, and the bond stress between the locations o f two strain gauges on the steel reinforcement
can be determined.
The bond stress was calculated at the time when the steel in the debonded region reached
the yield strain for both static and dynamic tests. The stress at each point was determined by the
following equation:
fs = £sEs (5-2)
Where ss is the strain in the steel and Es is the modulus of elasticity o f steel (200 GPa).
The bond stress was then calculated and the stress over the reinforcing steel was determined. Due
to the fact that the bond stress reached a strain very close to zero in the strain gauge second
furthest away from the end, it was assumed the force in the steel was completely transferred to
the concrete by the time it reached this gauge. The results obtained from calculating the bond
stress between the gauges are shown in Table 5-1, Table 5-2, and Table 5-3.
212
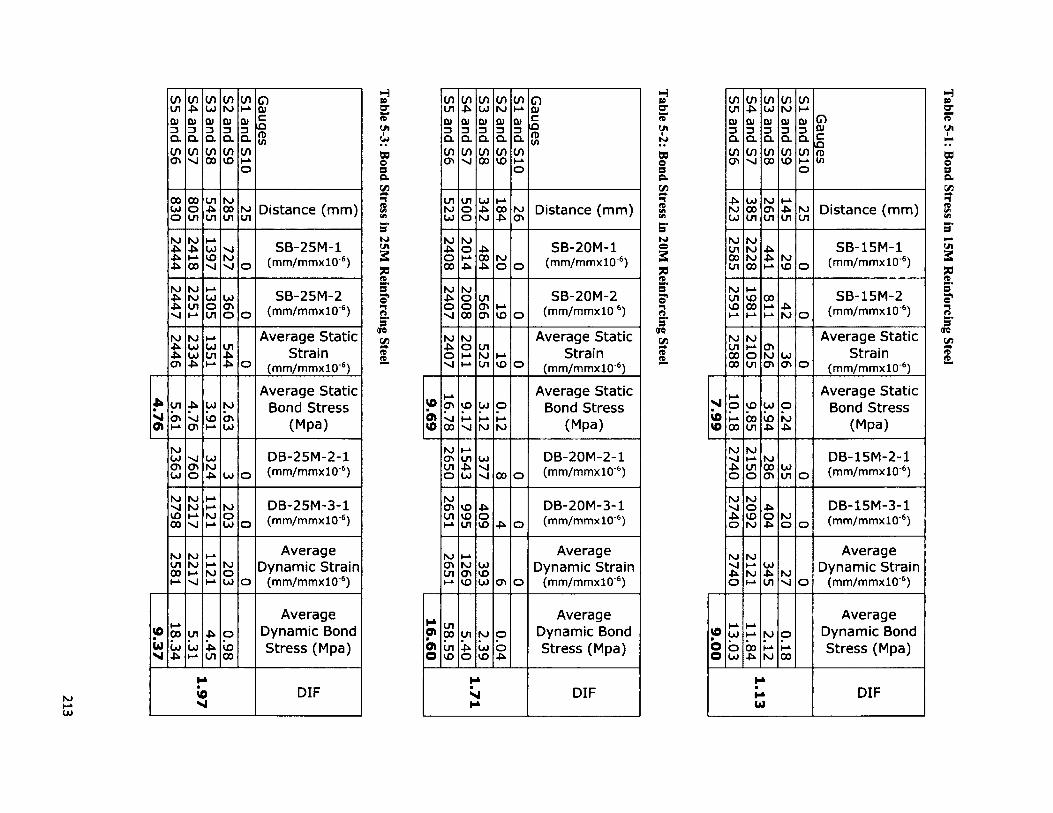
213
S5 and
S6S4
and S7
S3 and
S8S2
and S9
SI and
S10G
auges
HBfi21ft(S i
09©sa*+nftViVi
S5 and
S6S4
and S7
S3 and
S8S2
and S9
SI and
S10G
auges
H65gftOlI
ts>
03e8a
ftViVimm*
S5 and
S6S4
and S7
S3 and
S8S2
and S9
SI and
S10G
auges
830805545285 N>U1 Distance (mm)
523
U1oo
342 CO Mcn Distance (mm)
423385265
i-4acn
NJcn
Distance (m m )
244424181397
727
O
SB-25M-1(mm/mmxlO'6) 2
SB
24082014
484 N)O o
SB-20M-1(m m /m m xicr6)
K)O3so
25852228
441 Mco oSB-15M-1
(mm/mmxlO'6)
244722511305
360
O
SB-25M-2(m m /m m xicr6)
5*s**■»25*
24072008
566 I—4CO o
SB-20M-2(mm/mmxlO'6)
s*S1■1
5*25911981
811 NJ oSB-15M-2
(mm/mmxlO'6)
244623341351
544
O
Average Static Strain
(mm/mmxlO'6)
era( / )0+ft2.
24072
01
1
525 H 4co o
Average Static Strain
(m m /m m xlO 6)
era
cf i
ftft
25882105
626 U >cn o
A verage Static Strain
(mm/mmxlO'6)
4.765.614.763.912.63
Average Static Bond S tress
(Mpa)
9.6916.78
9.173.120
.12
Average Static Bond S tress
(Mpa)
7.99 8T0T
9.853.940.24
A verage Static Bond S tress
(Mpa)
2363760324
U ) O
DB-25M-2-1(m m /m m xl0'6)
26501543
377
00 oDB-20M-2-1(mm/mmxlO'6)
27402150
286 wcn o
DB-15M-2-1(m m /m m xl0'6)
279822171
12
1
203 oDB-25M-3-1(mm/mmxlO'6)
2651995409 o
DB-20M-3-1(mm/mmxlO'6)
27402092
404 Mo oDB-15M-3-1(m m /m m xl0'6)
258122171
12
1
203 o
Average Dynamic Strain
(mm/mmxlO'6)
26511269
393cr> o
Average Dynamic Strain
(mm/mmxlO'6)
27402
12
1
345 M —1 o
Average Dynamic Strain
(m m /m m xl(r6)
9.3718.34
5.314.45 8
60
Average Dynamic Bond S tress (Mpa)
16.6058.59
5.402.390.04
Average Dynamic Bond S tress (Mpa)
9.0013.03
h-k00
ZV
Z OI - 400
Average Dynamic Bond S tress (Mpa)
1.97 DIF
1.71 DIF
1.13 DIF
Table 5-1: Bond
Stress in
15M R
einforcing Steel
By calculating the bond stress for static tests and shock tube tests, it can be concluded that the
dynamic bond stress is greater than the static bond stress.
5.2 Em pirical Form ulas for Bond Strength
Many equations have been developed to estimate the bond strength o f steel to concrete
for deformed bars confined by transverse reinforcement. These equations are described in the
following section. It is important to note that these equations were derived for the use with
imperial units.
Orangun, Jirsa, and Breen (1977) analyzed splice length tests and development length
tests from a variety o f sources and developed the following equation for determining the bond
stress between concrete and reinforcement:
-^ = 1.2 + 3 ^ 1 +50^ + % - ( 5 ' 3 )
yjJJ d b ld 500s d b
Where, // is the bond strength, f c ’ is the compressive strength o f concrete, db is the
diameter o f the reinforcing bar, I d is the development length, A tr is the area o f transverse
reinforcement, f yt is the yield strength o f the transverse reinforcement, and s is the center-to-
center spacing o f the transverse reinforcement. cmi„ may be taken as the smaller o f the clear
bottom cover to the longitudinal reinforcement or the side cover to the longitudinal
reinforcement (Orangun, Jirsa and Breen 1977)
Darwin et al. (1996) also analyzed a variety o f bond tests and developed the following
equation for bond strength:
214
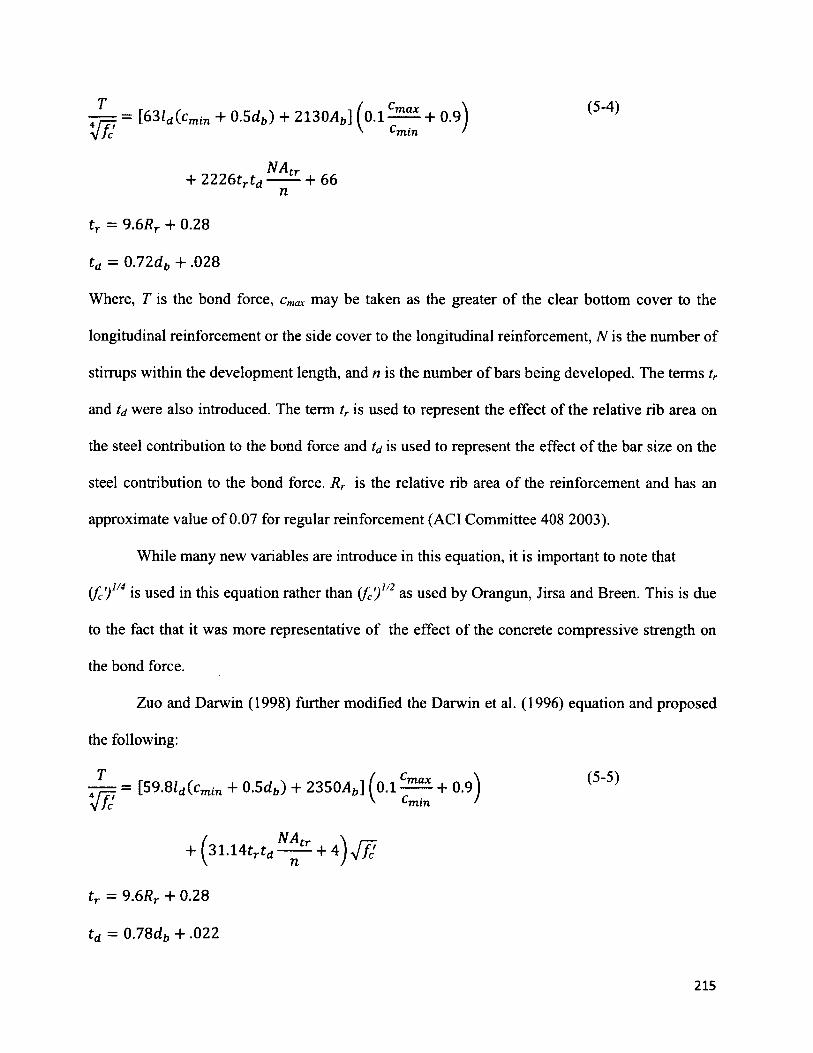
max[63 ld (cmin + 0.5d b) + 2130v4b] 0.1min
71
(5-4)
tr — 9.6 Rr + 0.28
td = 0.72 d b + .028
Where, T is the bond force, cmax may be taken as the greater o f the clear bottom cover to the
longitudinal reinforcement or the side cover to the longitudinal reinforcement, N is the number of
stirrups within the development length, and n is the number o f bars being developed. The terms tr
and td were also introduced. The term tr is used to represent the effect of the relative rib area on
the steel contribution to the bond force and td is used to represent the effect o f the bar size on the
steel contribution to the bond force. Rr is the relative rib area o f the reinforcement and has an
approximate value o f 0.07 for regular reinforcement (ACI Committee 408 2003).
While many new variables are introduce in this equation, it is important to note that
(fc) l/4 is used in this equation rather than {fc) 1/2 as used by Orangun, Jirsa and Breen. This is due
to the fact that it was more representative o f the effect o f the concrete compressive strength on
the bond force.
Zuo and Darwin (1998) further modified the Darwin et al. (1996) equation and proposed
the following:
max[59.8ld (cmin + 0.5d b) + 2350v4b] 0.1•min
(5-5)
tr = 9.6 Rr + 0.28
td = 0.78db + .022
215
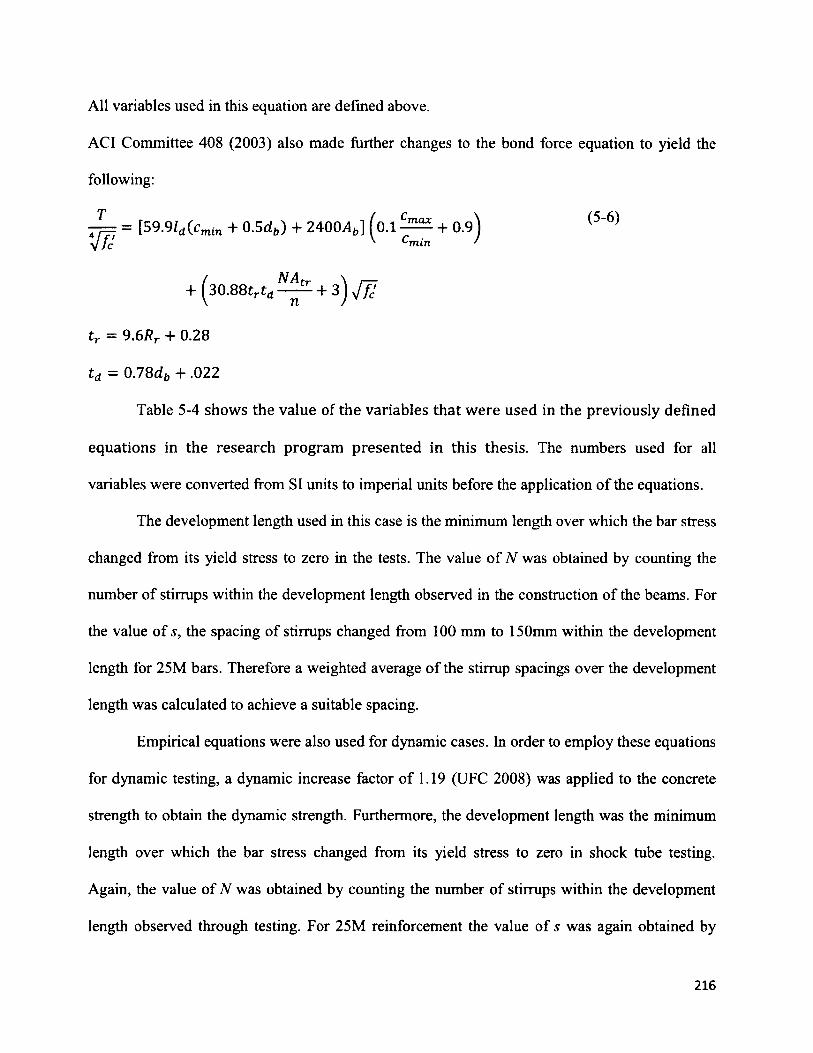
All variables used in this equation are defined above.
AC1 Committee 408 (2003) also made further changes to the bond force equation to yield the
following:
equations in the research program p resen ted in this thesis. The numbers used for all
The development length used in this case is the minimum length over which the bar stress
changed from its yield stress to zero in the tests. The value o f N was obtained by counting the
number o f stirrups within the development length observed in the construction o f the beams. For
the value o f s , the spacing of stirrups changed from 100 mm to 150mm within the development
length for 25M bars. Therefore a weighted average o f the stirrup spacings over the development
length was calculated to achieve a suitable spacing.
Empirical equations were also used for dynamic cases. In order to employ these equations
for dynamic testing, a dynamic increase factor o f 1.19 (UFC 2008) was applied to the concrete
strength to obtain the dynamic strength. Furthermore, the development length was the minimum
length over which the bar stress changed from its yield stress to zero in shock tube testing.
Again, the value o f N was obtained by counting the number of stirrups within the development
length observed through testing. For 25M reinforcement the value of s was again obtained by
max[59.9ld{cmin + 0.5d b) + 2400Ab] 0.1min
(5-6)
t r = 9.6 Rr + 0.28
t d = 0.78 d b + .022
Table 5-4 shows the value of the variables th a t w ere used in the previously defined
variables were converted from SI units to imperial units before the application o f the equations.
216
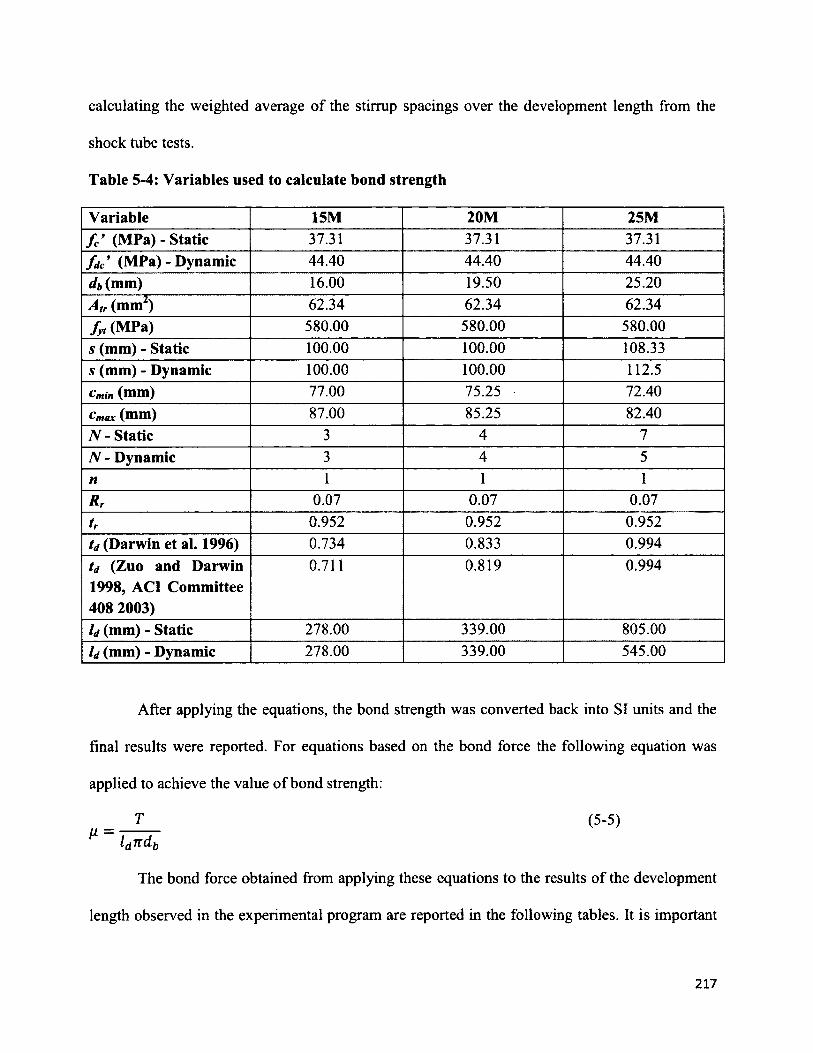
calculating the weighted average o f the stirrup spacings over the development length from the
shock tube tests.
Table 5-4: Variables used to calculate bond strength
Variable 15M 20M 25M/ / (MPa) - Static 37.31 37.31 37.31fd c (MPa) - Dynamic 44.40 44.40 44.40db (mm) 16.00 19.50 25.20A tr (mm2) 62.34 62.34 62.34f y t (MPa) 580.00 580.00 580.00s (mm) - Static 100.00 100.00 108.33s (mm) - Dynamic 100.00 100.00 112.5Cmin (mm) 77.00 75.25 - 72.40Cmax (illlll) 87.00 85.25 82.40N - Static 3 4 7N - Dynamic 3 4 5n 1 1 1
R r 0.07 0.07 0.07
tr 0.952 0.952 0.952td (Darwin et al. 1996) 0.734 0.833 0.994td (Zuo and Darwin 1998, ACI Committee 408 2003)
0.711 0.819 0.994
Id (mm) - Static 278.00 339.00 805.00Id (mm) - Dynamic 278.00 339.00 545.00
After applying the equations, the bond strength was converted back into SI units and the
final results were reported. For equations based on the bond force the following equation was
applied to achieve the value o f bond strength:
= _J_ <5*5>
The bond force obtained from applying these equations to the results o f the development
length observed in the experimental program are reported in the following tables. It is important
217
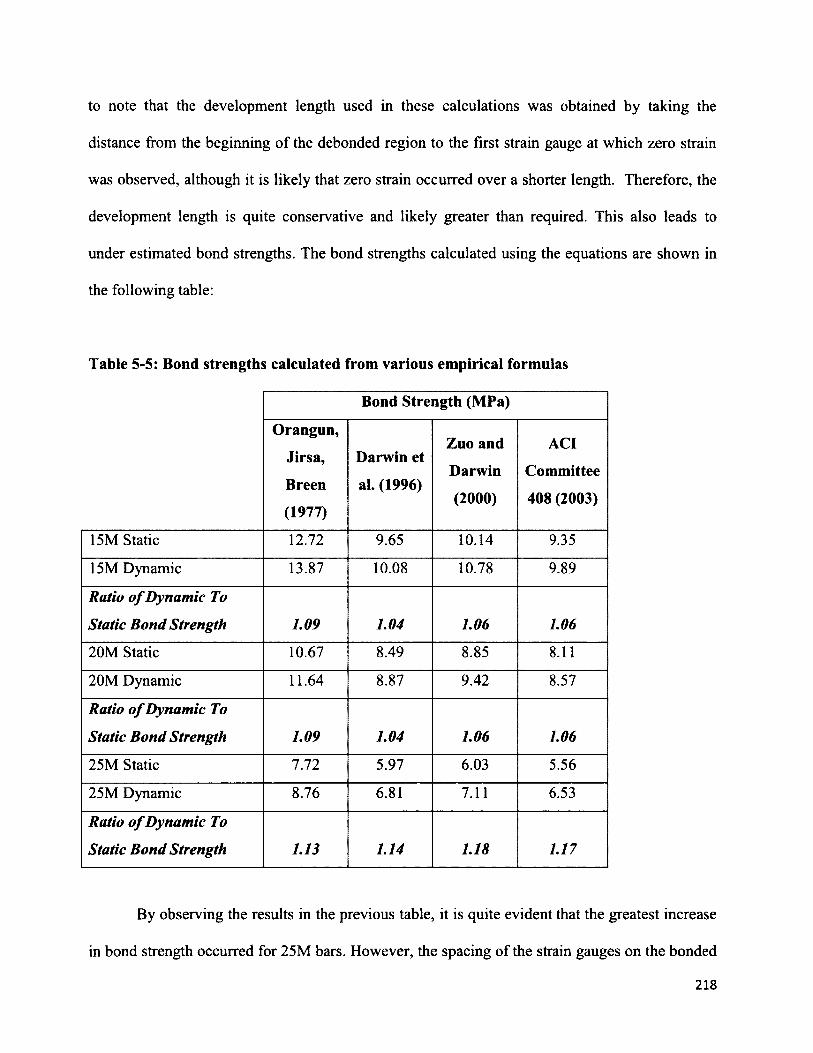
to note that the development length used in these calculations was obtained by taking the
distance from the beginning o f the debonded region to the first strain gauge at which zero strain
was observed, although it is likely that zero strain occurred over a shorter length. Therefore, the
development length is quite conservative and likely greater than required. This also leads to
under estimated bond strengths. The bond strengths calculated using the equations are shown in
the following table:
Table 5-5: Bond strengths calculated from various empirical formulas
Bond Strength (MPa)
Orangun,
Jirsa,
Breen
(1977)
Darwin et
al. (1996)
Zuo and
Darwin
(2000)
ACI
Committee
408 (2003)
15M Static 12.72 9.65 10.14 9.35
15M Dynamic 13.87 10.08 10.78 9.89
Ratio of Dynamic To Static Bond Strength 1.09 1.04 1.06 1.0620M Static 10.67 8.49 8.85 8.11
20M Dynamic 11.64 8.87 9.42 8.57
Ratio of Dynamic To Static Bond Strength 1.09 1.04 1.06 1.0625M Static 7.72 5.97 6.03 5.56
25M Dynamic 8.76 6.81 7.11 6.53
Ratio of Dynamic To Static Bond Strength 1.13 1.14 1.18 1.17
By observing the results in the previous table, it is quite evident that the greatest increase
in bond strength occurred for 25M bars. However, the spacing of the strain gauges on the bonded
218
area o f the 25M reinforcement was greater than that on both 15M and 20M reinforcement, thus
increasing the uncertainty o f the development length used to calculate the bond strength. Also,
previous tests reported that the greatest increase in bond strength occurred for smaller size
reinforcing bars (Shah 1963). It is therefore difficult to conclude whether the bar size had any
significant influence on the increase in bond strength.
It is also possible that the strength o f the reinforcement has an effect on the increase in
bond stress. From the tensile steel tests, 15M reinforcing bars had the greatest static yield
strength, followed by 25M bars, and 20M bars had the lowest strength. Therefore, no obvious
trend relating the increase in bond strength to the yield strength o f steel was observed here.
However, during tensile steel tests, the reinforcing steel shows increase in strength under rapid
loading rates. Therefore, it can be concluded that the DIF observed in steel is proportional to the
increase in bond stress under high loading rates.
Greater accuracy in the results could be achieved by increasing the number o f strain
gauges within the bonded region and decreasing the spacing. While it is difficult to determine
whether the size o f reinforcement or strength o f reinforcement had any effect on the bond stress,
it is clear that the bond stress increases with the loading rate. After comparing both static strain
profiles to dynamic strain profiles and bond stresses in both cases, it can be concluded that the
development length o f reinforcing steel required for static loading is also sufficient for dynamic
loading.
219
6 Chapter: Conclusions
6.1 Summary
The effect of strain rate on the development length of steel in reinforced concrete beams
was investigated. Current research shows that the effect strain rate on the strength properties of
both reinforced concrete and steel have been thoroughly investigated, while information on the
interaction between the two materials is limited. Some researchers have looked at the influence
o f loading rate on bond strength through pullout tests. In these investigations, it was found that
the bond strength increases with loading rate. However, standard pullout tests introduce extra
confining forces, which may have an effect on the increase in bond strength. More accuracy
could therefore be achieved through beam tests.
An experimental program was designed to investigate whether the development length
required by the CSA A23.3-04 (2004) was sufficient for blast design. A total o f 15 concrete
beams were tested; 6 under static loading and 9 under dynamic loading using the shock tube.
Loads great enough to achieve failure of the reinforced beams were employed in both test
methods. The strains in the steel at different times were studied. The time when the steel reached
its yield strength was thoroughly investigated to determine the approximate development length
for all tests.
The strain profile in the bonded region of the steel was developed for all tests. Static
strain profiles were compared to dynamic strain profiles for beams containing the same size of
reinforcement. Equations were applied to the determine the average bond stress in beams
undergoing static loading as well as the average bond stress in beams undergoing dynamic
220
loading. Finally, the bond stresses achieved in dynamic tests were compared to those achieved in
static tests.
6.2 Conclusions
The following conclusions can be drawn from the experimental program:
• The required development length for dynamic tests is always less than or equal to the
required development length for static tests.
• No reinforcement slip was observed in any test at the unloaded end.
• The bond stress between concrete and steel increases with increased strain rate.
• The equation used to determine the development length required for static loads is
sufficient for high loading rates.
• The DIF obtained from steel tests is proportional to the increase in bond strength.
6.3 Recommendations
Recommendations for future research are as follows:
• Provide a greater number o f strain gauges at closer spacings along the bonded region o f
reinforcing steel to obtain a more detailed and accurate strain profile.
221
• Construct beams with a shorter debonded region. This will allow greater strains to be
achieved in the steel reinforcement and the strain profile at high levels o f strain to be
analyzed.
• Investigate the effect o f steel strength on the increase in bond stress. This can be achieved
by testing beams o f the same size reinforcement, but providing different strengths
• Investigate the effect o f size of reinforcement on the increase in bond stress. By providing
a greater variety o f sizes o f reinforcing bars, trends in the effect of size o f reinforcement
on bond stress increase under dynamic loading can be more thoroughly investigated.
222
Bibliography
ACI Committee 318. (2008). “Building Code Requirements for Structural Concrete (ACI 318-
OS) and Commentary.” American Concrete Institute, Farmington Hills, MI, 204.
ACI Committee 408. (2003). “Bond and Development o f Straight Reinforcing Bars in Tension.”
ACI Technical Document, 1-48.
ACI Committee 439. (1969). “Effect o f Steel Strength and o f Reinforcement Ratio on the Mode
o f Failure and Strain Energy Capacity o f Reinforced Concrete Beams.” AC I Journal
Proceedings, 66(3), 165-173.
ASTM A 370-lla (2011). “Standard Test Methods and Definitions for Mechanical Testing of
Steel Products.” ASTM International, West Conshohocken, PA.
ASTM C873 (2010). “Standard Test Method for Compressive Strength o f Concrete Cylinders
Cast in Place in Cylindrical Molds.” ASTM International, West Conshohocken, PA.
Allen, R. L. (2006). The Port Chicago Mutiny: The Story o f the Largest Mass Mutiny Trial in
U.S. Naval History, Heyday, Berkeley, CA, 62-67.
Alsiwat, J. M., and Saatcioglu, M. (1992). “Reinforcement Anchorage Slip Under Monotonic
Loading.” Journal o f Structural Engineering, 118(9), 2421-2438.
ASCE. (1997). Design o f Blast Resistant Buildings in Petrochemical Facilities. Task Committee
on Blast Resistant Design. American Society o f Civil Engineers., Reston, VA.
Asprone, D., Cadoni, E., and Prota, A. (2009). “Tensile High Strain-Rate Behavior of
Reinforcing Steel From an Existing Bridge.” ACI Structural Journal, 106(4), 523-529.
223
Baker, W. E. et al. (1983). Explosion Hazards and Evaluation. Elsevier Scientific Publishing
Company, New York.
Bangash, T. (2006). Explosion-Resistant Buildings: Design, Analysis, and Case Studies.
Springer, London, UK.
CSA A23.3-04 (2004). “Design o f Concrete Structures.” Canadian Standards Association,
Mississauga, Ontario.
CSA S850-12 (2012). “Design and Assessment o f Buildings Subjected to Blast Loads.”
Canadian Standards Association, Mississauga, Ontario.
Comite Euro-International Du Beton (CEB). (1988). “Concrete Structures Under Impact and
Impulsive Loading: Synthesis Report.” CEB Bulletin No. 187, Lausanne, Switzerland.
Darwin, D. (2005). “Tension Development Length and Lap Splice Design for Reinforced
Concrete Members.” Progress in Structural Engineering and Materials, 7(4), 210-225.
Esfahani, M. R., and Kianoush, M. R. (2005). “Development/splice length o f reinforcing bars.”
AC I Structural Journal, 102(1), 22-30.
Flathau, W. J. (1971). “Dynamic Tests o f Large Reinforcing Bar Splices.” Rep. No. N-71-2, U.S.
Army Engineer Waterways Experiment Station, Vicksburg, Mississippi.
Fu, H. C., Erki, M. A., and Seckin, M. (1991). “Review of Effects o f Loading Rate on
Reinforced Concrete.” Journal o f Structural Engineering New York, N. Y., 117(12), 3660-3679.
Hansen, R. J., and Liepins, A. A. (1962). “Behavior o f Bond Under Dynamic Loading.” Journal
o f the American Concrete Institute, 59(4), 563-583.
224
Health and Safety Executive (HSE 2012). “Flixborough (Nypro UK) Explosion 1st June 1974.”
http://www.hse.gov.uk/comah/sragtech/caseflixboroug74.htm (September 11, 2012).
Hyde, D. W. (1992). “Conventional Weapons Effects Program (CONWEP).” Technical Report,
US Army Engineers Waterways Experimental Station, Vicksburg, MS.
Keenan, W. A., and Feldman, A. (1960). “Behavior and Design o f Deep Structural Members Part
6: The Yield Strength of Intermediate Grade Reinforcing Bars Under Rapid Loading.”
University o f Illinois, Urbana, IL.
Kingery, C. N., and Bulmash, G. (1984). “Airblast Parameters from TNT Spherical Air Burst
and Hemispherical Surface Burst.” ARBRL-TR-02555, Ballistic Research Laboratory, Aberdeen
Proving Ground, MD.
Kluge, R. W., and Tuma, E. C. (1945). “Lapped Bar Splices in Concrete Beams.” Journal o f the
American Concrete Institute, 17(1), 13-33.
Krauthammer, T., Marchand, K. A., Stevens, D. J., Bounds, W. L., and Nene, M. (1994).
“Effects o f Short Duration Dynamic Loads on RC Structures.” Concrete International, 16(10),
57-63.
Le Nard, H., and Bailly, P. (2000). “Dynamic Behaviour o f Concrete: the Structural Effects on
Compressive Strength Increase.” Mechanics o f Cohesive-Frictional Materials, 5(6), 491-510.
Li, Q. M., and Meng, H. (2003). “About the Dynamic Strength Enhancement o f Concrete-Like
Materials in a Split Hopkinson Pressure Bar Test.” International Journal o f Solids and
Structures, 40(2), 343-360.
225
Lloyd, A. (2010). “Performance o f Reinforced Concrete Columns under Shock Tube Induced
Shock Wave Loading.” PhD thesis, University o f Ottawa, Ottawa.
Lloyd, A., Jacques, E., Saatcioglu, M., Palermo, D., Nistor, I., and Tikka, T. (2011).
“Capabilities and Effectiveness o f using a Shock Tube to Simulate Blast Loading on Structures
and Structural Components.” AC I Special Publication, Behaviour o f Concrete Structures
Subjected to Blast and Impact Loadings.
Lu, Y., and Xu, K. (2004). “Modelling o f Dynamic Behaviour o f Concrete Materials Under Blast
Loading.” International Journal o f Solids and Structures, 41(1), 131-143.
Mac Donald, L. M. (2005). Curse o f the Narrows: The Halifax Explosion o f 1917.
HarperCollins, Toronto.
MacGregor, J. G. (1997). Reinforced Concrete: Mechanics and Design. Prentice Hall, Upper
Saddle River, N.J.
Malvar, L. J. (1998). “Review of static and dynamic properties o f steel reinforcing bars.” AC I
Materials Journal;, 95(5), 609-616.
Malvar, L. J., and Crawford, J. E. (1998). “Dynamic Increase Factors for Steel Reinforcing
Bars.” Twenty-Eighth DDESB Seminar, Karagozian & Case, Orlando, Florida, 1-16.
Malvar, L. J., and Ross, C. A. (1998). “Review o f Strain Rate Effects for Concrete in Tension.”
AC I Materials Journal, 95(6), 735-739.
Mirza, S. A., and MacGregor, J. G. (1979). “Variability o f Mechanical Properties o f Reinforcing
Bars.” ASCE Journal Structural Division, 105(5), 921-937.
226
Moehle, J. P., Wallace, J. W., and Hwang, S.. (1991). “Anchorage Lengths for Straight Bars in
Tension.” ACI Structural Journal, 88(5), 531-537.
Ngo, T., Mendis, P., Gupta, A., and Ramsay, J. (2007). “Blast Loading and Blast Effects on
Structures - An Overview.” Electronic Journal o f Structural Engineering, 7 76-91.
Orangun, C. O., Jirsa, J. O., and Breen, J. E. (1977). “Reevaluation of Test Data on Development
Length and Splices.” ACI Journal Proceedings, 74(3), 114-122.
Park, R., and Paulay, T. (1975). “Bond and Anchorage.” Reinforced Concrete Structures, John
Wiley and Sons Inc., University o f Canterbury, Christchurch, New Zealand, 392-495.
Park, R., and Ruitong, D. (1988). “Ductility o f Doubly Reinforced Concrete Beam Sections.”
ACI Structural Journal, 85(2), 217-225.
Psyllides, G. (2011). “Evangelos Florakis blast kills 12.” http://www.cyprus-
mail.com/cyprus/evangelos-florakis-blast-kills-12/20110711 (September 11, 2012).
Reinhardt, H. W. (1982). “Concrete Under Impact Loading - Tensile Strength and Bond.”
Heron, 27(3).
Shah, I. K. (1963). “Behavior o f bond under dynamic loading.” Massachusetts Institute of
Technology, Cambridge, Massachusetts.
Solomos, G., and Berra, M. (2010). “Rebar Pullout Testing Under Dynamic Hopkinson Bar
Induced Impulsive Loading.” Materials and Structures, 43(1-2), 247-260.
Soroushian, P., and Choi, K. (1987). “Steel Mechanical Properties at Different Strain Rates.”
Journal o f Structural Engineering New York, N. Y., 113(4), 663-672.
227
Stephens, H. W. (1997/ The Texas City Disaster, 1947. University o f Texas Press, Austin, TX.
Unified Facilities Criteria (UFC) 3-340-02. (2008). Structures to Resist the Effects o f Accidental
Explosions. United States o f America Department o f Defense, Washington, D.C.
Vos, E., and Reinhardt, H. W. (1982). “Influence o f Loading Rate on Bond In Reinforced
Concrete.” RILEM/CEB/IABSE/IASS Interassociation Symposium, Concrete Structures under
Impact and Impulsive Loading, Berlin, Germany, 170-181.
Vos, E. (1983). “Influence o f loading rate and radial pressure on bond in reinforced concrete : a
numerical and experimental approach.” Delft University Press.
Weathersby, J. H. (2003). “Investigation o f Bond Slip Between Concrete and Steel
Reinforcement Under Dynamic Loading Conditions.” PhD thesis, Louisiana State University,
Baton Rouge, Louisiana.
Yan, C., and Mindess, S. (1991). “Bond Between Concrete and Steel Reinforcing Bars Under
Impact Loading.” International Symposium on Brittle Matrix Composites (3rd), Elsevier Applied
Science, London, 184-192.
Yan, D., and Lin, G. (2006). “Dynamic Properties o f Concrete in Direct Tension.” Cement and
Concrete Research, 36(7), 1371-1378.
Yang, G., and Lok, T. (2007). “Analysis o f RC Structures Subjected to Air-Blast Loading
Accounting for Strain Rate Effect o f Steel Reinforcement.” International Journal o f Impact
Engineering, 34(12), 1924-1935.
228
Zech, B., and Wittmann, F. H. (1979). "Variability and Mean Value o f Strength o f Concrete as a
Function o f Load." AC I Journal, 77(39), 358-362.
229


![Reinforced concrete [Kompatibilitätsmodus] · • concrete: (100 mm)3. Steel reinforcement: 1D stress-strain relationship σ f fs y E h E 0 ε. Steel reinforcement: 3D plasticity](https://img.pdfslide.us/doc/110x75/5e14048ac517f838da7e4c7b/reinforced-concrete-kompatibilittsmodus-a-concrete-100-mm3-steel-reinforcement.jpg)