Embed Size (px)
Citation preview
IIL'PBROVING YOUR COMPETITIVE POSITION:
STR4 TEGIC AND FINANCIAL ASSESSMENT of
POLLUTION PREVENTION PROJECTS
TRAINING M m U A L
bY The Northeast Waste Management Officials' Association
The Massachusetts Office of Technical Assistance
1994

IMPROVING YOUR COMPETITIVE POSITION:
STRATEGIC AND FINANCUL ASSESSMENT of
POLLUTION PRE VENTION PROJECTS
TMINING MANUAL
Project Writers: Sam Perkins Andrew Gates
Project Managers: Terri Goldberg Dick Torborg Barbara Kelley
The Northeast Waste Management Officials' Association 129 Portland Street, 5th Floor
Boston, MA 021 14 617 367-8558
The Massachusetts Office of Technical Assistance Executive Office of Environmental Affairs
100 Cambridge Street, Suite 2109 Boston, MA 02202
617 727-3260
1994
copyright a1994 by the Northeast Waste Management Officials' Association and the Massachusetts Ofice of Technical Assistance
The Northeast Waste Management Officials' Association
The Northeast Waste Management Officials' Association (NEWMOA) is a non-profit interstate governmental association whose membership is composed of the hazardous and
Jersey, New York, Rhode Island and Vermont. NEWMOA was established by the
accordance with Section 1005 of the Resource Conservation and Recovery Act, has been formally recognized by the U.S. Environmental Protection Agency. NEWMOA is a forum for increased communication and cooperation among the member states, a vehicle for the development of unified positions on various issues and programs, and a source of research and training on hazardous and solid waste management and pollution prevention. NEWMOA's well-established pollution prevention (P2) program is active in the following areas: (1) managing the Northeast States Pollution Prevention Roundtable - a regional roundtable of state and EPA pollution prevention staff; (2) coordinating several committees of the NE Roundtable; (3) training state and EPA officials and industry representatives in pollution prevention concepts and methods; (4) publishing a quarterly newsletter on state pollution prevention activities; and (5) managing a clearinghouse of pollution prevention technical information.
~
solid waste program directors of Connecticut, Maine, Massachusetts, New Hampshire, New
Governors of the northeast states as an official interstate regional organization and, in
. ~~
. ~~~
~
For further information ,on NEWMOAs pollution prevention services contact:
Pollution Prevention Program NEWMOA
129 Portland Street, 5th Floor Boston, MA 02114
617 367-8558
The Massachusetts Office of Technical Assistance
The Massachusetts Office of Technical Assistance (MA OTA) was formed to provide large and small industries with a non-regulatory resource base to assist in toxics use reduction (TUR) planning. OTA offers the following free services to Massachusetts businesses: (1) performing on-site technical evaluations of source reduction opportunities, (2) conducting economic analyses that identify relative costs and benefits of TUR; (3) sponsoring conferences, workshops, and trade fairs to disseminate information on source reduction; (4) working with local agencies to train staff to recognize source reduction opportunities; and (5) responding to telephone and written requests for information
- For fbrther information on OTA services contact
MA OTA Executive Office of Environmental Affairs
100 Cambridge Street, Suite 2109 Boston, MA 02202
617 727-3260
ACKNOWLEDGMENTS
The project to develop this curriculum was hnded by a grant from the Northeast Hazardous Substance Research Center (NHSRC). Supplemental grants and services were also provided by the Massachusetts Office of Technical Assistance (MA OTA) and the Toxits Use Reduction Institute (TURI) at the University of Massachusetts, Lowell. NEWMOA is indebted to those organizations for their support.
This curriculum builds on earlier work presented in Costing and Financial Analysis of Pollution Prevention Projects: A Training Packet [ 19921, which was developed by Marlene Wittman and Terri Goldberg under the auspices of NEWMOA and MA OTA. The authors and editors wish to express their indebtedness to the predecessor publication, which provided much ofthe material, exercises and case studies that have been revised and expanded for this edition. For their advice and assistance in preparing this manual NEWMOA and MA OTA would also like to thank the following people: Patrick Demers, Doug DeVries, Jim DeWitt, Muriel Durgin, Andrew Gates, Terri Goldberg, Emily Hess, Barbara Kelley, Sam Perkins, Deborah Savage, Ken Tierney, and Dick Torborg.
DISCLAIMER
The views expressed in this report do not necessarily reflect those of NHSRC, the U.S EPA, MA OTA, MA TUN, NEWMOA, or the NEWMOA member states of any company, process or product name should not be considered an endorsement by the NHSRC, NEWMOA, the NEWMOA member states, MA OTA, MA TURI, or the U S EPA
Mention
... 111
ORGANIZATION and USE of CURRICULUM
This curriculum has been published in two parts to facilitate its use in instructional workshops. The Manual (Sections 1-59 contains the basic course material and is intended for distribution to workshop participants for additional explication, review and reference. The companion booklet, Instnutor’s Guide, contains explanatory information and teaching notes as well as exercises, case studies and overheads that can be used in the workshops. It is intended for presenters only and is published in loose-leaf form to permit easy copying of selected material.
For additional copies of the Mmunl or for information about attending or holding a workshop, please call:
Terri Goldberg, P2 Program Manager NEWMOA
129 Portland Street, 5th Fioor Boston, MA 02114
(617) 367-8558
printed on recycledpnper
iv
TABLE OF CONTENTS
Page
.. I 1
i i i iv
NEWMOA and MA OTA Descriptions Acknowledgments and Disclaimer Organization and Use of Curriculum
Section 1 - INTRODUCTION & OVERVIEW Purpose of this Material Capital Budgeting for Pollution Prevention Projects Financial Analysis - Objectives and Definitions
Section 2 - COST INFORMATION Definitions Process of Developing Cost Information Types and Sources of Cost Information
Section 3 - MEASURES OF PROFITABILITY Payback Period Accounting Rate of Retum Net Present Value Internal Rate of Return Inflation in Capital Budgeting
Section 4 - QUALITATIVE ISSUES Framework for Analyzing Issues Assessing Less Tangible Factors - Potential Liability Psychological Burden
1 5 7
11 12 16
27 28 28 32 34
37 39 42 45
Section 5 - APPENDICES (A) Glossary/Terminology 51 (B) Wrayburn Jewelry Case Study
(E) References 71
55 ' 63
67 (C) Spreadsheet Building & Capital Budgeting with 1-2-3 & Excel (D) Pollution Prevention Financial Assessment Models
V

Section 1 - INTRODUCTION AND OVERVIEW
PURPOSE OF THIS MATERIAL
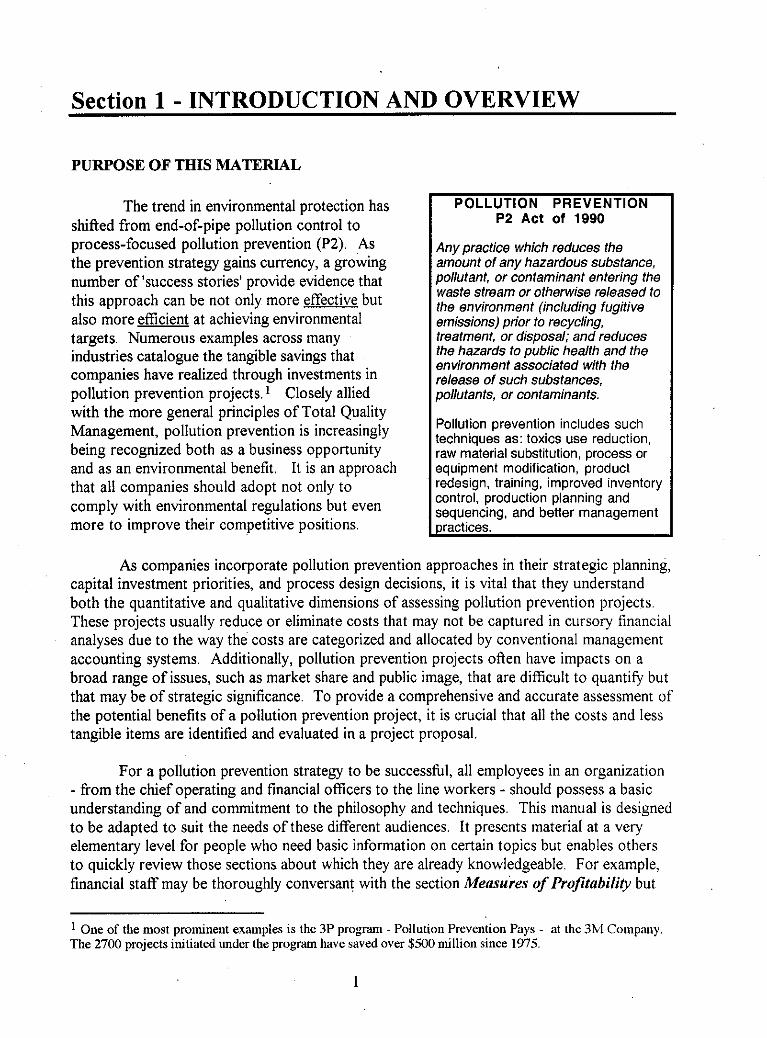
The trend in environmental protection has shifted from end-of-pipe pollution control to process-focused pollution prevention (PZ). As the prevention strategy gains currency, a growing number of 'success stories' provide evidence that this approach can be not only more effective but also more efficient at achieving environmental targets Numerous examples across many industries catalogue the tangible savings that companies have realized through investments in pollution prevention projects. Closely allied with the more general principles of Total Quality Management, pollution prevention is increasingly being recognized both as a business opportunity and as an environmental benefit. It is an approach that all companies should adopt not only to comply with environmental regulations but even more to improve their competitive positions
POLLUTION PREVENTION P2 Act of 1990
Any practice which reduces the amount of any hazardous substance, pollutant, or contaminant entering the waste stream or otherwise released to the environment (including fugitive emissions) prior to recycling, treatment, or disposal; and reduces the hazards to public health and the environment associated with the release of such substances, pollutants, or contaminants.
Pollution prevention includes such techniques as: toxics use reduction, raw material substitution, process or equipment modification, product redesign, training, improved inventory control, production planning and sequencing, and better management practices.
As companies incorporate pollution prevention approaches in their strategic planning, capital investment priorities, and process design decisions, it is vital that they understand both the quantitative and qualitative dimensions of assessing pollution prevention projects. These projects usually reduce or eliminate costs that may not be captured in cursory financial analyses due to the way the costs are categorized and allocated by conventional management accounting systems. Additionally, pollution prevention projects often have impacts on a broad range of issues, such as market share and public image, that are difficult to quantify but that may be of strategic significance. To provide a comprehensive and accurate assessment of the potential benefits of a pollution prevention project, it is crucial that all the costs and less tangible items are identified and evaluated in a project proposal.
For a pollution prevention strategy to be successful, all employees in an organization - from the chief operating and financial officers to the line workers - should possess a basic understanding of and commitment to the philosophy and techniques. This manual is designed to be adapted to suit the needs of these different audiences. It presents material at a very elementary level for people who need basic information on certain topics but enables others to quickly review those sections about which they are already knowledgeable. For example, financial staff may be thoroughly conversant with the section Mensures of Profitability but
1 One of the most prominent examples is the 3P program - Pollution Prevention Pays - at the 3M Cotnpiuiy. The 2700 projects initiated ilnder the program have saved over $500 million since 1975.
1
may benefit from practice in constructing process flow diagrams (PFD), while engineers are likely to be proficient at PFDs but may be unfamiliar with basic financial terms contained in the Terminologv appendix. A caution, however: because this manual contains material that varies from conventional practice, it may be unwise to skip sections completely without at least a brief review.
~
.~ ~
. ~~~ While this manual attempts to address a broad audience, it does focus primarily on the anticipated needs of those employees who are likely to form the core of a pollution prevention project team. Plant personnel who design, supervise or work on operational processes and others who oversee environmental practices and compliance are usually part of the group that is designated to identify pollution prevention options, specify equipment and evaluate a project's feasibility. Although these team members (referred to here as environmental and operational [E & 01 staQ may have limited exposure to the financial and general business matters of a corporation, they are invaluable contributors to the assessment of a project's quantitative and qualitative impacts. Their involvement in plant operations provides familiarity with relevant costs and insights into less tangible issues that may be obscured from the perspective of upper management and financial controllers,
~
This curriculum is designed to familiarize environmental and operational staff with the procedures and tools for evaluating the financial aspects of a pollution prevention project. Following a general introduction to the assessment process, the material focuses on two topics central to financial analysis - cost information and measures of profitability (described below) - and concludes with a discussion of qualitative issues.
)Cost Information defines and describes the relevant costs of a pollution prevention I project and identifies likely sources of cost information. Its objective is to enhance E&O stail's existing knowledge of cost activities and enable them to provide direct assistance in the cost information gathering stage of a project
Measures of Profitability presents such measures of profitability as internal fate of return and net present value and describes how they are applied to the cost information. It is intended to familiarize E&O staff with the basic concepts and practices of these financial analysis tools to enable them to work with financial staff in the development of sound proposals.
The process of assessing pollution prevention projects, particularly the financial analysis component, fits within the framework of the standard capital budgeting model yet expands on and broadens the way capital budgeting is often practiced.2 The approach described in this curriculum attempts to rectify the tendency in financial analyses to omit environmentally-related costs, which typically are lumped into overhead accounts, arbitrarily allocated to products and overlooked in the cost identification process. Additionally, this
~
2The standard capital budgeting model costs; anecdotal evidence, however, suggests that in Dractice many "indirect costs" tend to be excluded.
should incorporate a changes in operating and adnunistrative
2
manual elevates the level of attention focused on projects' more qualitative impacts. While ours is not the only way to evaluate a project, we believe the process presented here provides an accurate method to ensure that all important benefits and potential ramifications are included in an assessment. Initiators, developers and practitioners of this approach continue to look for a name that succinctly captures both its process and its purpose yet differentiates it from other methods. There is not yet a consensus on what to call this methodology In the interim, we use the term capital budgeting forpollution prevention projects. Please send us your suggestions.
Overview of Manual
The first section of this handbook provides an overview of capital budgeting and the objectives of financial analysis Section 2 defines the parameters of cost information and describes the procedures and sources for gathering and developing this information The third section details alternative methods for using the cost data to perform a financial analysis and explains the advantages and disadvantages of the different measures of profitability The fourth section introduces the various qualitative issues to be considered in coniunction with a financial analysis to determine the impact of a proposed project
To provide a common theme for the presentation of material, this manual draws the data for many of its examples from an actual pollution prevention initiative undertaken at the Wraybum Jewelry Company (We use a fictitious name at the company's request ) The brief synopsis that follows provides the background context of that data for a better understanding of its use in the examples We strongly encourage all readers to review the full Wruyburn Jewehy Company case (Appendix B) to fully understand and tie together the information presented in the various sections
~
3
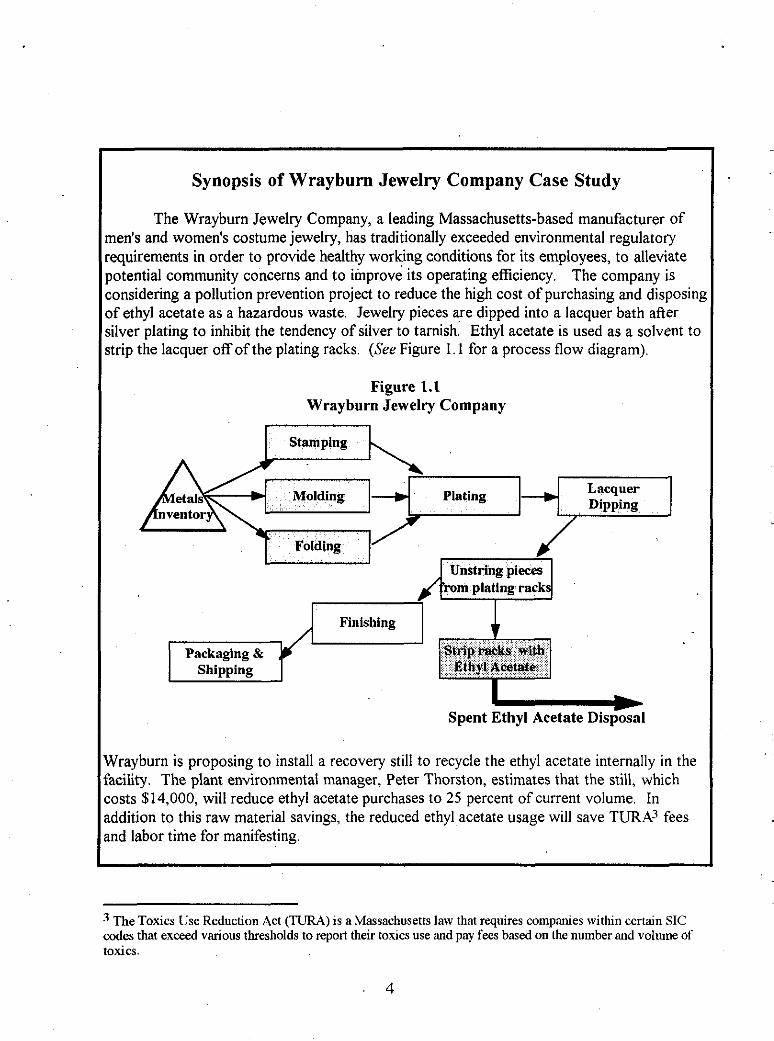
Synopsis of Wrayburn Jewelry Company Case Study
The Wrayburn Jewelry Company, a leading Massachusetts-based manufacturer of ien's and women's costume jewelry, has traditionally exceeded environmental regulatory equirements in order to provide healthy working conditions for its employees, to alleviate iotential community concerns and to improve its operating efficiency The company is onsidering a pollution prevention project to reduce the high cost of purchasing and disposing d ethyl acetate as a hazardous waste Jewelry pieces are dipped into a lacquer bath alter ilver plating to inhibit the tendency of silver to tarnish Ethyl acetate is used as a solvent to trip the lacquer off of the plating racks (See Figure 1 1 for a process flow diagram)
Figure 1.1 Wrayburn Jewelry Company
- Spent Ethyl Acetate Disposal
Vrayburn is proposing to install a recovery still to recycle the ethyl acetate internally in the icility. The plant environmental manager, Peter Thorston, estimates that the still, which osts $14,000, will reduce ethyl acetate purchases to 25 percent of current volume. In ddition to this raw material savings, the reduced ethyl acetate usage will save TURA' fees nd labor time for manifesting.
The Toxics Use Reduction Act (TURA) is a Massachusetts law that requires companies within certain SIC codes that exceed various thresholds to report their toxics use and pay fees based on the nuniber and volume of toxics.
4
CAPITAL BUDGETING for POLLUTION PREVENTION PROJECTS
Pollution prevention (P2) can take many forms, from simple "housekeeping" improvements, which cost little to implement, to expensive capital equipment installations. Although many P2 projects, such as material substitution or process redesign, do not have large outlays for the purchase of equipment, they may require significant engineering expense, may create incremental costs or savings, or may require extensive qualitative assessment related to such issues as product quality or employee health and safety. The analytical tools introduced in this curriculum are applicable to the assessment of most pollution prevention initiatives that fit under the umbrella of the capital budgeting process, which we define broadly to include both quantitative analysis and qualitative evaluation.
Pollution prevention projects are a recent addition to the list of typical capital budgeting projects and generally include:
new manufacturing equipment replacement equipment plant expansion and construction
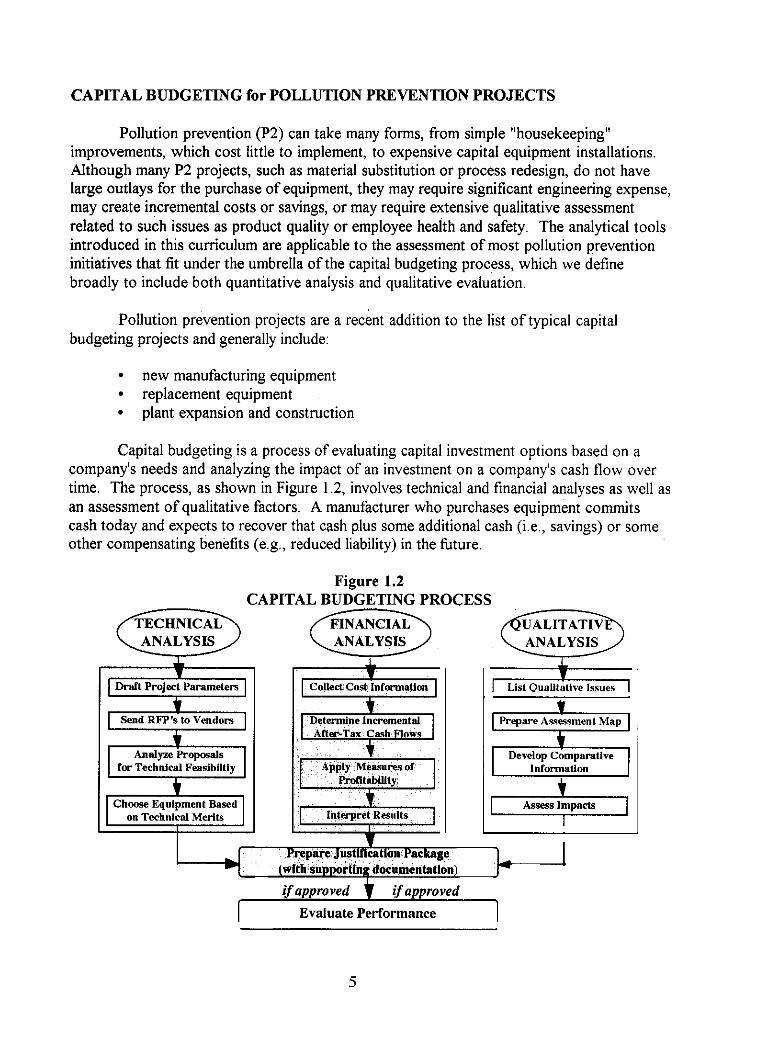
Capital budgeting is a process of evaluating capital investment options based on a company's needs and analyzing the impact of an investment on a company's cash flow over time. The process, as shown in Figure 1.2, involves technical and financial analyses as well as an assessment of qualitative factors. A manufacturer who purchases equipment commits cash today and expects to recover that cash plus some additional cash (i.e., savings) or some other compensating benefits (e.g., reduced liability) in the future.
Figure 1.2 CAPITAL BUDGETING PROCESS
Draft Project Parameten
. Prepare Justincation Package
(with supporting documentotioni I
= List QuaUtative Issues
Develop Comparative information
c Assess Impacts -
ifapproved f if approved
I Evaluate Performance 1
5
While accounting organizes and analyzes information about events that have already taken place, caoital budgeting tries to forecast the future and necessarily requires estimation of how events will unfold. The four principal issues that need to be estimated in capital budgeting are:
. .
cashflows, discount rate, impact of a project on a business' other cash flows, and impact on a business' future opportunities.
This curriculum deals explicitly with the first of these issues - identifying costs in order to estimate cash flows. The estimation of discount rates is best performed by a firm's financial management, and P2 project teams should ask them for that information. While the last two issues are beyond the scope of this curriculum to discuss in detail, they are important problems that need to be considered in the evaluation of all capital budgeting projects.
The capital budgeting process varies substantially between companies, depending upon size, corporate culture, ownership, management philosophy and other variables. In a small, family-owned company, the process may be very informal: the environmental engineer might approach the presidentlowner with a request for pollution prevention equipment based only a "back-of-the envelope" calculation of its merits. Conversely, in larger companies, the capital budgeting process might be so formal as to warrant a standardized evaluation format and justification package as well as a multi-level review and approval.
Regardless of the formality or complexity of the capital budgeting process at a particular company, the basic'evaluation of a project involves the following steps, which form the substance of this manual:
Collecting cost information;
* Interpreting quantitative results; and Considering qualitative factors.
Although this curriculum concentrates on the financial analysis aspects of the process,
Determining incremental after-tax cash flows; Applying financial analysis tools (measures of profitability);
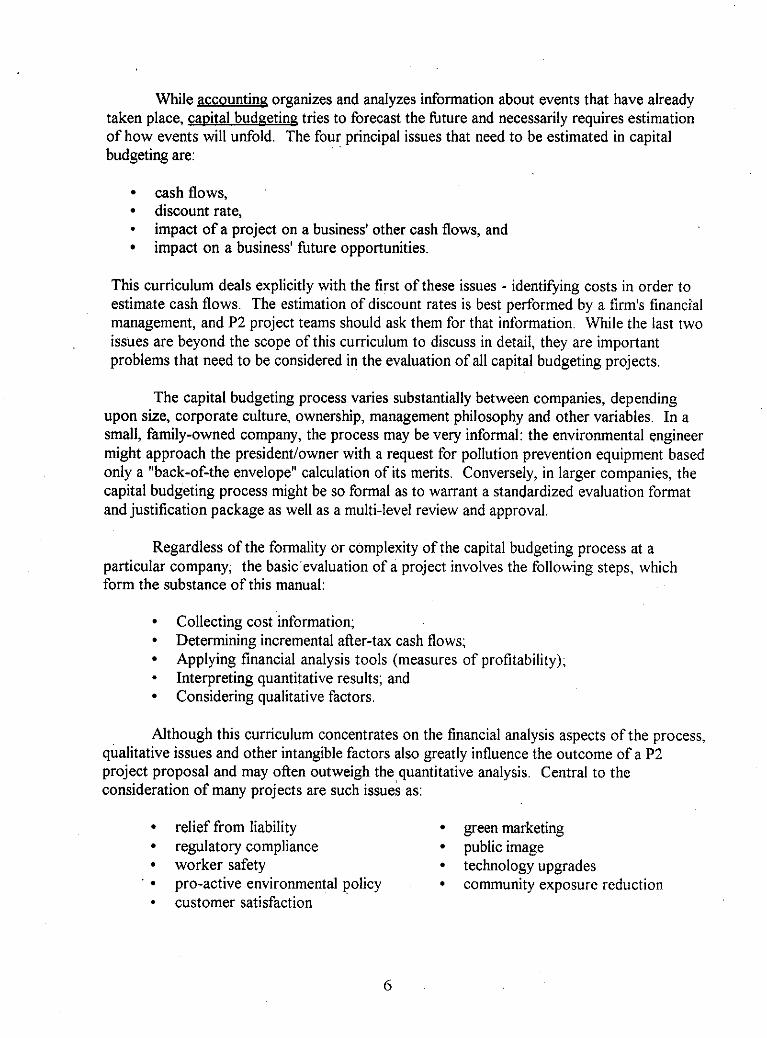
qualitative issues and other intangible factors also greatly influence the outcome of a P2 project proposal and may often outweigh the quantitative analysis. Central to the consideration of many projects are such issues as:
relief from liability green marketing regulatory compliance public image worker safety technology upgrades
' pro-active environmental policy community exposure reduction customer satisfaction
6
Decision-Making Criteria
Capital budgeting - technical, financial and qualitative analysis - provides information to guide the decision-making process, a complex mechanism in most companies that is usually dependent on various contextual factors. A pollution prevention project team should be aware of the other elements that influence decision-making in order to craft a justification package that has the optimal chance of success. Some of the most common factors are:
internal Dolitics. such as rivalrv between functions or divisions: this issue is best preempted by having broad representation on the project team.
proiect sourcehitiator status: a project directive issued by top management may be evaluated according to different criteria than an effort generated by the plant engineer.
proiect obiectives: a P2 project driven by concern about a company's public image as a polluter may be judged more by its qualitative benefits while the replacement of existing machinery may require a strong financial justification.
*
.
FlCNANCIAL ANALYSIS - OBJECTIVES AND DEFINITIONS
Except for those rare cases where management has no option other than to install specific equipment, financial evaluation of a project is one of the most important too'1.s in the decision-making process. Even where a regulatory mandate may restrict choices, financial analysis remains important to understanding the economic impact of an activity on an enterprise. The financial evaluation determines whether or not an investment will add' economic value to a business, given a company's current situation and investment options and the availability and cost of financing a project.
The financial assessment of a pollution prevention project has two phases:
Collecting cost information: identifying and assembling the relevant cost information.
Auolving measures of profitability: - analyzing the cost information using one or several measures of profitability: payback, accounting rate of return, net present value (NPV), internal rate of return (IRR).
.
The objective of these steps is to determine the after-tax cash flow produced by the investment over its economic lifetime and to calculate the value of those cash flows to a business based on a measure of profitability. The definitions of these key terms follow.
7
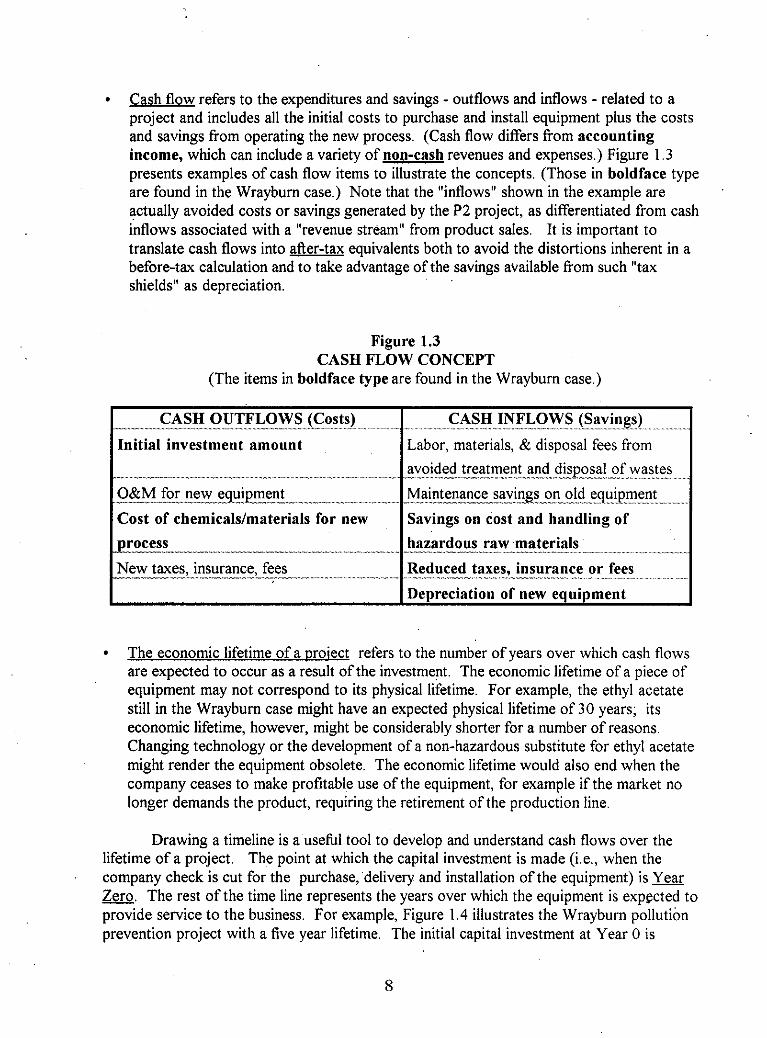
Cash flow refers to the expenditures and savings - outflows and inflows - related to a project and includes all the initial costs to purchase and install equipment plus the costs and savings from operating the new process. (Cash flow differs from accounting income, which can include a variety of non-cash revenues and expenses.) Figure 1.3 presents examples of cash flow items to illustrate the concepts. (Those in boldface type are found in the Wrayburn case.) Note that the "inflows" shown in the example are
inflows associated with a "revenue stream" from product sales. It is important to translate cash flows into after-tax equivalents both to avoid the distortions inherent in a before-tax calculation and to take advantage of the savings available from such "tax shields" as depreciation.
~
actually avoided costs or savings generated by the P2 project, as differentiated from cash . ~~
~
Figure 1.3 CASH FLOW CONCEPT
(The items in boldface type are found in the Wrayburn case.)
itial investment amount
.....
avings on cost and handling of hazardous raw materials
The economic lifetime of a oroiect refers to the number of years over which cash flows are expected to occur as a result of the investment. The economic lifetime of a piece of equipment may not correspond to its physical lifetime. For example, the ethyl acetate still in the Wrayburn case might have an expected physical lifetime of 30 years; its economic lifetime, however, might be considerably shorter for a number of reasons. Changing technology or the development of a non-hazardous substitute for ethyl acetate might render the equipment obsolete. The economic lifetime would also end when the company ceases to make profitable use of the equipment, for example if the market no longer demands the product, requiring the retirement of the production line.
Drawing a timeline is a useful tool to develop and understand cash flows over the lifetime of a project. The point at which the capital investment is made (Le., when the company check is cut for the purchase,'delivery and installation of the equipment) is Year - Zero. The rest of the time line represents the years over which the equipment is expected to provide service to the business. For example, Figure 1.4 illustrates the Wrayburn pollution prevention project with a five year lifetime. The initial capital investment at Year 0 is
8
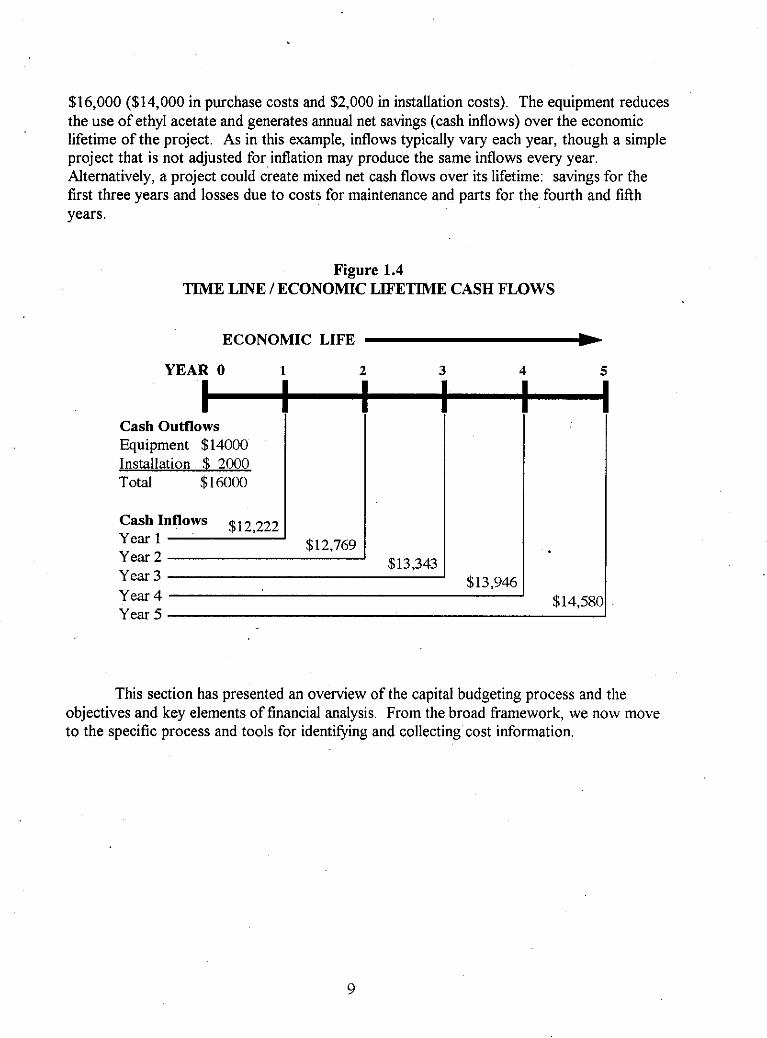
$16,000 ($14,000 in purchase costs and $2,000 in installation costs) The equipment reduces the use of ethyl acetate and generates annual net savings (cash inflows) over the economic lifetime of the project As in this example, inflows typically vary each year, though a simple project that is not adjusted for inflation may produce the same inflows every year Alternatively, a project could create mixed net cash flows over its lifetime savings for the first three years and losses due to costs for maintenance and parts for the fourth and fifth years
Figure 1.4 TIME LINE /ECONOMIC LIFETIME CASH FLOWS
ECONOMIC LIFE b YEAR 0 +
Cash Oufflows Equipment $14000 Installation $ 2000 Total $16000
Cash Inflows $12,222 Year 1 $12.769
3
$13.343 ' $13,945 Year 3 Year 4 $14.581 Year 5
This section has presented an overview of the capital budgeting process and the objectives and key elements of financial analysis. From the broad framework, we now move to the specific process and tools for identifying and collecting cost information.
9

Section 2 - COST INFORMATION
A financial analysis is only as accurate and realistic as the cost information it employs. Mathematical manipulation cannot compensate for the distorted effects of outdated, incomplete cost information, nor can financial analysis "fix" the lack of appropriate and relevant data. Therefore, the first phase of the financial analysis of a pollution prevention project entails gathering complete and accurate cost data in the form of relevant incremental costs calculated on an annualized basis, as defined below.
DEFINITIONS
Incremental costs: These costs, alternatively referred to as differential costs, are the changes, or differences, between the costs of the current process and the projected costs of the proposed project. These costs include one-time capital costs', such as equipment purchase, and ooerational costs, such as maintenance, waste disposal and utilities, which continue over the life-time of the project.
Relevant costs: Although this term is used in a variety of ways, we define it to mean those incremental costs that have a material impact on the decision and that are useful to those who evaluate the project proposal. The test for relevance depends on the circumstances of the particular case and must be considered within the context of a given project. For example, the elimination of one of twenty toxic chemicals may save only a few hours a year in employee safety training and manifesting, not enough to be relevant to the analysis. On the other hand, the discontinued use of the same amount of the & toxic chemical in a facility may enable the elimination of a range of activities with corresponding significant and relevant savings for the business.
- NOTE: A determination of relevunce should be mude only nfter the identification and initial review of glJ costs. Deciding a oriori thut a particulur item is not relevunt may lead to the exclusion of costs whose relevance only becomes apparent through its relationship to other issues or in projections of the 'out years' of a project.
Annualized basis: Costs should be converted to total annual amounts in order to perform the financial analysis with common metrics. For labor activities, the formula for this conversion could be expressed as:
Hours Spent on the Activity x Number of Occurrences per Year x Wage Rate
"Capital costs" refer to expenditures l'or'wpital assets, i .e,, items (such ils equipment) that Iiave a useful life of greater than one year and will be" capitalized" on a balance sheet. I t is distinguished from "cost of capital". which refers to the interest rate (cost) finns pay to use money (capit$). "Operating costs" are expenses for itenis that are consumed within one year.
11
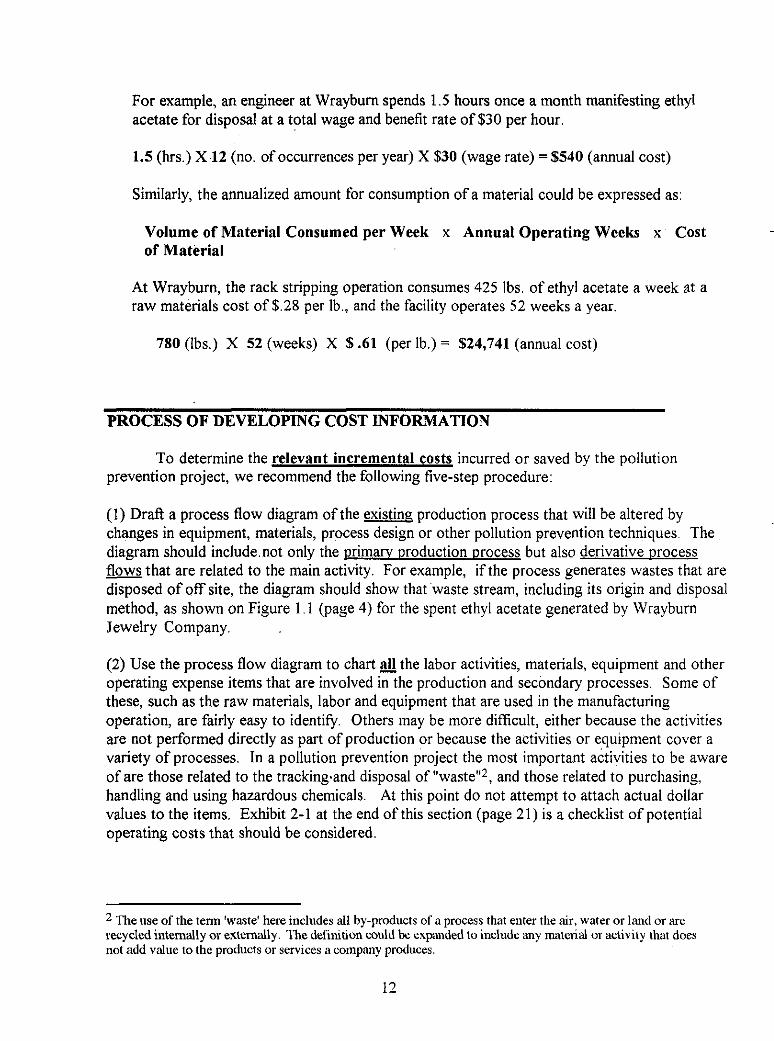
For example, an engineer at Wrayburn spends 1.5 hours once a month manifesting ethyl acetate for disposal at a total wage and benefit rate of $30 per hour.
1.5 (hrs.) X 12 (no. of occurrences per year) X $30 (wage rate) = $540 (annual cost)
Similarly, the annualized amount for consumption of a material could be expressed as:
Volume of Material Consumed per Week x Annual Operating Weeks x Cost of Material
~
At Wrayburn, the rack stripping operation consumes 425 Ibs. of ethyl acetate a week at a raw materials cost of $.28 per Ib., and the facility operates 52 weeks a year.
780 (Ibs.) X 52 (weeks) X $ .61 (per Ib.) = $24,741 (annual cost)
PROCESS OF DEVELOPING COST INFORMATION
To determine the relevant incremental costs incurred or saved by the pollution prevention project, we recommend the following five-step procedure:
(I) Draft a process flow diagram of the existing production process that will be altered by changes in equipment, materials, process design or other pollution prevention techniques. The diagram should include.not only the primaw production process but also derivative process flows that are related to the main activity. For example, if the process generates wastes that are disposed of off site, the diagram should show that.waste stream, including its origin and disposal method, as shown on Figure 1.1 (page 4) for the spent ethyl acetate generated by Wrayburn Jewelry Company.
(2) Use the process flow diagram to chart fl the labor activities, materials, equipment and other operating expense items that are involved in the production and secondary processes. Some of these, such as the raw materials, labor and equipment that are used in the manufacturing operation, are fairly easy to identify. Others may be more difficult, either because the activities are not performed directly as part of production or because the activities or equipment cover a variety of processes. In a pollution prevention project the most important activities to be aware of are those related to the trackingand disposal of "waste"', and those related to purchasing, handling and using hazardous chemicals. At this point do not attempt to attach actual dollar values to the items. Exhibit 2-1 at the end of this section (page 21) is a checklist of potential operating costs that should be considered.
~
2 The nse of the term 'waste' here includes all by-products of a process that enter the air, water or land or are recycled intemally or externally. The definition could be expanded to include any inaterial or actitivity that does not add valne to the products or services a company produces.
12
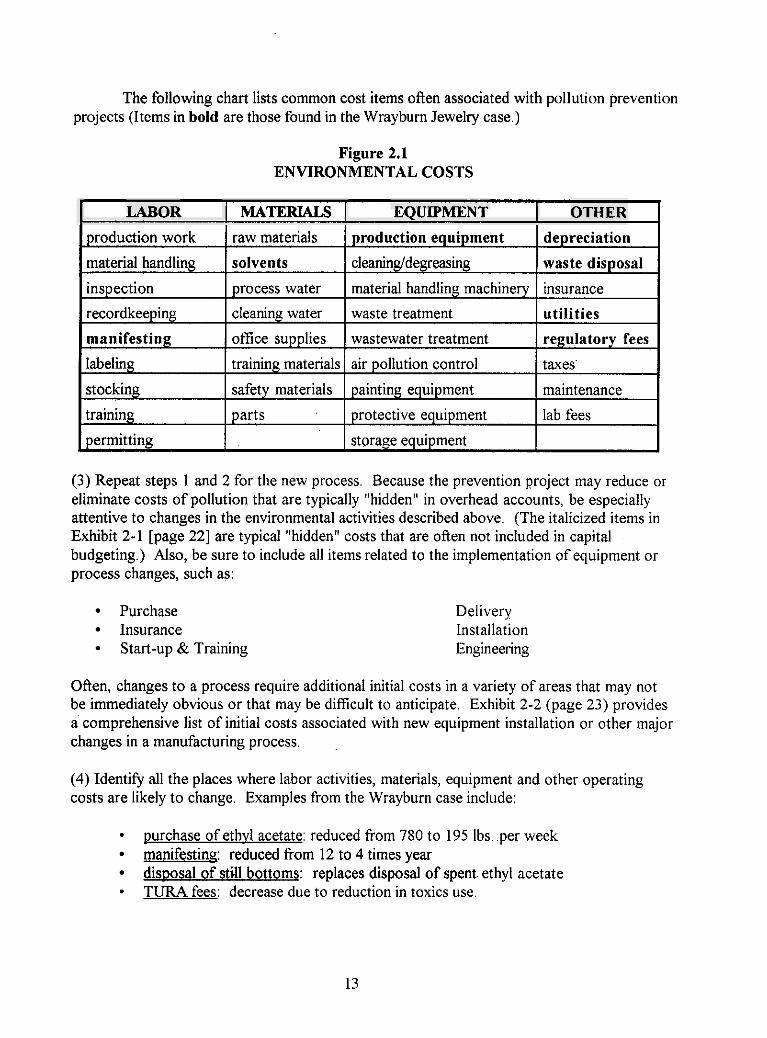
The following chart lists common cost items often associated with pollution prevention projects (Items in bold are those found in the Wrayburn Jewelry case.)
Figure 2.1 ENVIRONMENTAL COSTS
I LABOR EQUIPMENT OTHER i
(3) Repeat steps 1 and 2 for the new process. Because the prevention project may reduce or eliminate costs of pollution that are typically "hidden" in overhead accounts, be especially attentive to changes in the environmental activities described above. (The italicized items in Exhibit 2-1 [page 221 are typical "hidden" costs that are often not included in capital budgeting.) Also, be sure to include all items related to the implementation of equipment or process changes, such as:
Purchase Insurance Start-up & Training
Delivery Installation Engineering
Ofien, changes to a process require additional initial costs in a variety of areas that may not be immediately obvious or that may be difficult to anticipate. Exhibit 2-2 (page 23) provides a comprehensive list of initial costs associated with new equipment installation or other major changes in a manufacturing process.
(4) Identify all the places where labor activities, materials, equipment and other operating costs are likely to change. Examples from the Wrayburn case include:
purchase of ethvl acetate: reduced from 780 to 195 Ibs. .per week manifestinq: reduced from 12 to 4 times year disoosal of still bottoms: replaces disposal of spent. ethyl acetate
* TURA fees: decrease due to reduction in toxics use.
13
(5) Determine the costs in the current process and in the proposed project for those activities and items that will change because of the proposed project. Remember to translate all cost information to an annual basis. (Although it is possible to use a weekly, monthly or quarterly basis, an annual basis is preferable.) The following section - Types and Sources of Cost Information - describes how to find the information needed to determine the costs of various activities.
(6) Calculate the differences between the current and proposed processes (incremental costs). Start with the initial costs related to the purchase and installation of the new equipment. Next calculate the differences in the operating costs of the two processes, subtracting the 'new cost' from the 'old cost' to determine the difference as either a cost incurred by the project (outflow) or a savings gained (inflow). Be certain that all costs are translated into after-tax amounts. Calculation of the after-tax cash flow uses one of three formulae depending on the category of cost:
~
__
. ~ ~~~
~
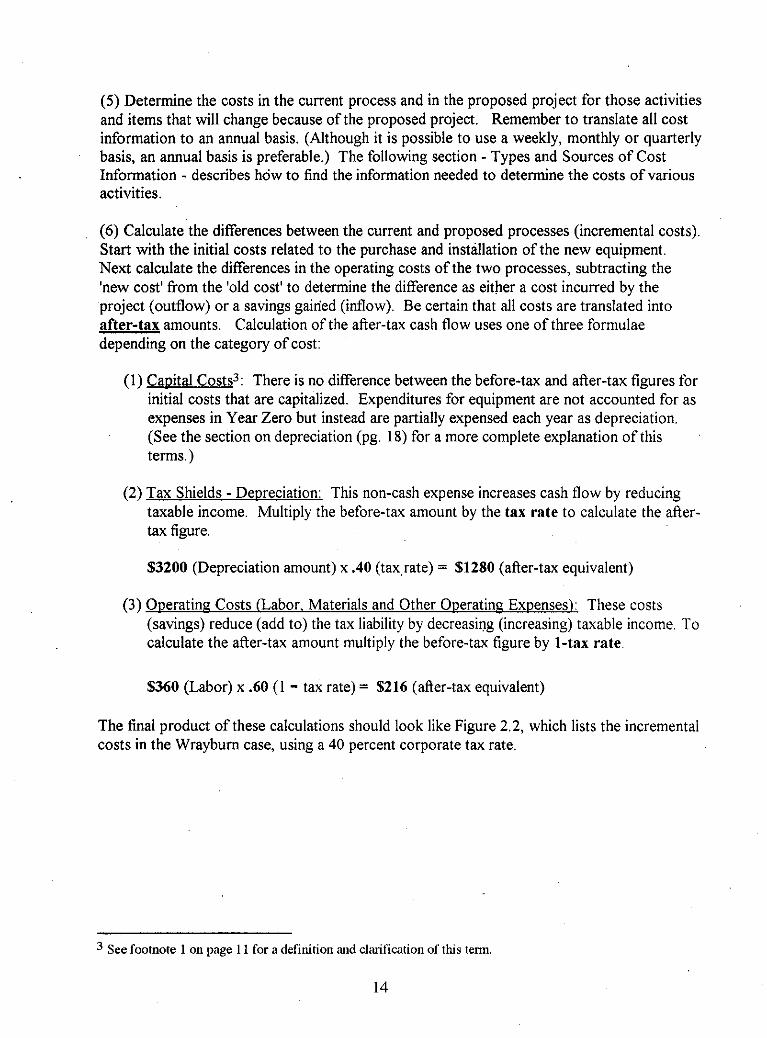
(1) CaDital Costs3: There is no difference between the before-tax and after-tax figures for initial costs that are capitalized. Expenditures for equipment are not accounted for as expenses in Year Zero but instead are partially expensed each year as depreciation. (See the section on depreciation (pg. 18) for a more complete explanation of this terms.)
(2) Tax Shields - Depreciation: This non-cash expense increases cash flow by reducing taxable income. Multiply the before-tax amount by the tax rate to calculate the after- tax figure.
$3200 (Depreciation amount) x .40 (tax,rate) = $1280 (after-tax equivalent)
(3) Operating Costs (Labor, Materials and Other Oueratine Expenses): These costs
~
(savings) reduce (add to) the tax liability by decreasing (increasing) taxable income. To calculate the after-tax amount multiply the before-tax figure by 1-tax rate
$360 (Labor) x .60 (1 - tax rate) = $216 (after-tax equivalent)
The final product of these calculations should look like Figure 2.2, which lists the incremental costs in the Wrayburn case, using a 40 percent corporate tax rate.
See footnote 1 on page 11 for a definition and cl. 'UI 'f' iwtion ofthis term.
14
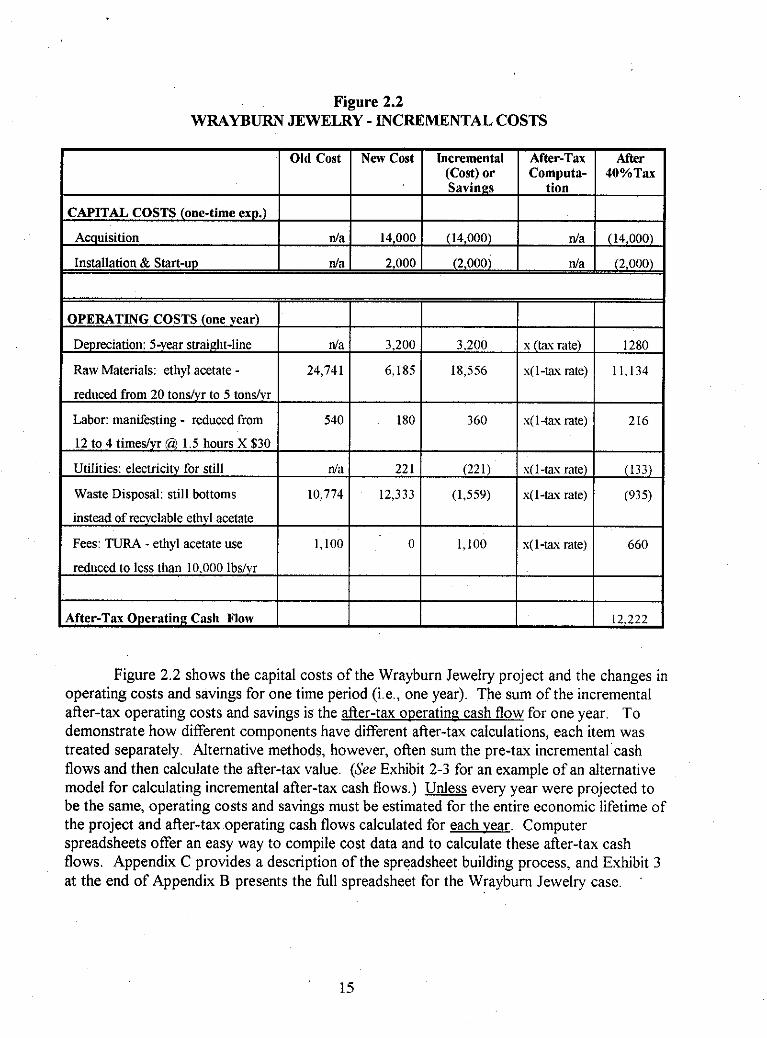
Figure 2.2 WRAYBURN JEWELRY - INCREMENTAL COSTS
CAPITAL COSTS (one-time exy.)
Acquisition
Installation & Start-up
Old Cost New Cost Incremental After-Tax After (Cost) or Computa- 40%Tax Savings tion
d a 14,000 (14,000) d a (14,000)
d a 2,000 (2,oooj n/a (2.000)
Figure 2.2 shows the capital costs of the Wrayburn Jewelry project and the changes in operating costs and savings for one time period (i.e., one year). The sum of the incremental after-tax operating costs and savings is the after-tax operating cash flow for one year. To demonstrate how different components have different after-tax calculations, each item was treated separately. Alternative methods, however, often sum the pre-tax incremental'cash flows and then calculate the after-tax value. (See Exhibit 2-3 for an example of an alternative model for calculating incremental after-tax cash flows.) Unless every year were projected to be the same, operating costs and savings must be estimated for the entire economic lifetime of the project and after-tax operating cash flows calculated for each year. Computer spreadsheets offer an easy way to compile cost data and to calculate these after-tax cash flows. Appendix C provides a description of the spreadsheet building process, and Exhibit 3 at the end of Appendix B presents the full spreadsheet for the Wrayburn Jewelry case. '
reduced to less than 10.000 lbs/vr
After-Tax Operating Cash Flow 12.222
TYPES AND SOURCES OF COST INFORMATION
The preceding section describes a method of determining the differential activities between old and new processes and calculating the incremental costs. To perform this procedure a project team must be able to attach accurate dollar amounts to each cost item. Finding this cost information, however, is rarely straightforward and may require both ingenuity and persistence, for the process will involve more than simply extracting numbers from a company's financial and cost accounting systems. As mentioned earlier, many environmental costs are "hidden" in a conventional cost accounting system and are therefore not readily accessible from that source. In addition to accounting records, the sources of cost information may include outside vendors, raw data such as purchase orders, and the subjective estimations of employees from various departments.
~
__
__
Before describing the means to uncover the cost information, the following section discusses how conventional cost accounting systems can distort the true impacts of environmental costs on products or processes. Because of these distortions, companies may have a poor understanding of these costs and thus neglect to include them when performing financial analyses. The purpose of this material is not to try to change the way companies do their cost accounting but rather to illustrate why it is so important to look beyond the information furnished by accounting reports and go directly to primary. sources for raw data.
Conventional Cost Accounting
In conventional cost accounting, costs are traditionally placed into one of three categories direct labor, direct materials, or overhead, all described more fully below
Direct Labor - Wages and benefits (including pension plan, vacation, holidays, etc ) As a ball park figure we suggest adding 25 percent to the gross hourly wage to account for labor-related costs paid to workers who assemble goods, operate equipment or directly supervise the production process
Direct Materials - all raw materials used in the production process that can be traced to individual products
Overhead - includes
> indirect labor: labor activities that S U D D O ~ ~ production and are performed by employees from support departments [e g , equipment maintenance],
> indirect materials: materials that are consumed in production but that are not part of the finished product [e g , cleaning solvent],
> operating costs: costs related to the operation of a production process [e g , electricity] (These are often lumped in with indirect materials )
> general corporate overhead: costs associated with corporate administration and other general facility costs
~
16
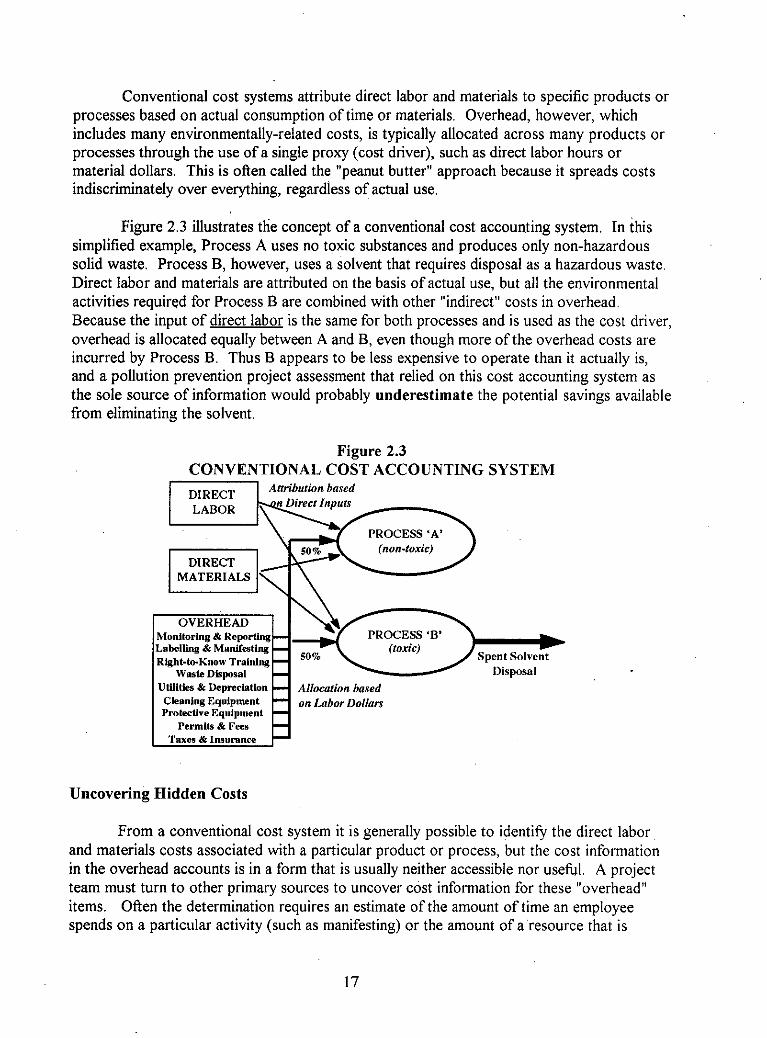
Conventional cost systems attribute direct labor and materials to specific products or processes based on actual consumption of time or materials. Overhead, however, which includes many environmentally-related costs, is typically allocated across many products or processes through the use of a single proxy (cost driver), such as direct labor hours or material dollars. This is often called the "peanut butter" approach because it spreads costs indiscriminately over everything, regardless of actual use.
Figure 2.3 illustrates the concept of a conventional cost accounting system. In this simplified example, Process A uses no toxic substances and produces only non-hazardous solid waste. Process B, however, uses a solvent that requires disposal as a hazardous waste. Direct labor and materials are attributed on the basis of actual use, but all the environmental activities required for Process B are combined with other "indirect" costs in overhead. Because the input of direct labor is the same for both processes and is used as the cost driver, overhead is allocated equally between A and B, even though more of the overhead costs are incurred by Process B. Thus B appears to be less expensive to operate than it actually is, and a pollution prevention project assessment that relied on this cost accounting system as the sole source of information would probably underestimate the potential savings available from eliminating the solvent.
Figure 2.3 CONVENTIONAL COST ACCOUNTING SYSTEM
PROCESS 'A' (non-toxic)
DIRECT MATERIALS
PROCESS 'B'
Spent Solvent Wash DLwosal Disposal
UUlities & Depreciation Allocution based I Cleaning Equipment onLaborDollan Protective Equipment
Permlls & Fees Taxes .4 Insursnce
Uncovering Hidden Costs
From a conventional cost system it is generally possible to identify the direct labor and materials costs associated with a particular product or process, but the cost information in the overhead accounts is in a form that is usually neither accessible nor useful. A project team must turn to other primary sources to uncover cost information for these "overhead" items. Often the determination requires an estimate of the amount of time an employee spends on a particular activity (such as manifesting) or the amount of a resource that is
17
consumed in the production process (such as the electricity used by a piece of equipment). Although such estimates often lack precision, if they are made by the people who actually perform the work or who are knowledgeable about a process, the information should be sufficiently accurate. Moreover, with planning it may be possible to conduct actual measurements of these activities to provide more accurate cost data. The following sections provide suggestions about where and how to locate information for examples of the kinds of costs usually hidden in the overhead pools. (See Exhibit 2-4 for a more comprehensive list of sources of cost information.)
__ __
Indirect Labor Costs
Manifesting, labeling and recordkeeping of wastes: the environmental or manufacturing staff can provide an estimate of the number of hours per week, per shipment, or per ton.
Purchase, handling and recordkeeping of toxic materials: actual purchase orders are probably completed by the purchasing department, which could also estimate time spent on paperwork. Other incoming recordkeeping and handling may be performed by materials handlers, the stockroom andor environmental staff
Indirect Material Costs
Waste disposal, protective and safety equipment, miscellaneous supplies: the accounting (payables) department can supply invoices for these items. Alternatively, vendors are often an excellent source for such information. Estimates of the use of a material in a particular process or its presence in a waste stream can be determined by observation and by operational staff.
~
Indirect Costs of Operating Eouioment
These are the costs associated with the use of capital equipment: insurance, maintenance, utilities and depreciation. In a conventional corporate accounting system they might be included in either manufacturing or corporate overhead. Rarely will general facility costs (e.g., heating, property taxes) change with a pollution prevention project unless the project is of such a scale as to require enlargement or reduction in the overall space used or a change in an operating environment, such as the construction of a temperature and moisture- controlled room. Changes in the costs associated with replacement or addition of equipment, however, are significant and have a major impact on the financial evaluation. Several specific operational costs related to equipment include: -
0 ' Depreciation: Depreciation is an accounting convention used to record the using 'up of assets - plant and equipment - in the normal course of business operation. Assets that have a useful life of longer than one-year are not treated as current expenses but are "capitalized" to reflect their value to the company over their useful lifetime - usually 3-10 years for equipment and up to 30 years for buildings. To record a company's use of these assets, a fraction of the asset's cost is charged as an expense in
__
18
each of the accounting periods that it provides service to the business. This gradual conversion of plant and equipment from "capital" into an expense is called depreciation, and the annual amount charged is the depreciation expense. In addition to the cost of the buildings and equipment themselves, many other initial costs (detailed in Exhibit 2-2) that are incurred in planning, construction, installation or start-up are also depreciable expenses that can be capitalized. It is important to check with a company's financial staff to determine the costs of a proposed project that should be depreciated.
As a non-cash exuense, depreciation is a source of cash flow because annual depreciation charges decrease taxable income, and thus the tax that is not Daid represents a cash savings that should be included in a project analysis. This use of depreciation is known as a tax shield because the expense "shields" income from taxes.
There are a number of ways to calculate the annual depreciation expense, but this curriculum considers only the straight line method, which assumes that the asset provides service in a level stream over the economic lifetime of a project. This method charges as an expense an equal fraction of the cost of the assets each year. Consider a piece of equipment costing $16,000 with no salvage value and a useful service life of 5 years:
Annual Depreciation
.
= (Machine Cost - Salvage)/Lifetime of Machine
= $16,000 - 0 5
Depreciation Charge
The depreciation charge reduces taxable income and lowers taxes and thus represents a cash savings to a company For example.
Depreciation Charge = $3,200 per year
Tax Rate 40% x- .40 T a d c a s h Savings = $1,280
= $3,200 per year
Insurance may be either a cost or a savings, or may not be affected by a pollution prevention project. If a project dramatically changes a facility's waste disposal status, for example eliminating the use of all toxic and hazardous substances, environmental liability insurance may be reduced. On the other hand, expensive new equipment might necessitate an increase in fire and property insurance. An insurance agent should be able to provide an estimate of a project's potential impacts on insurance premiums.
19
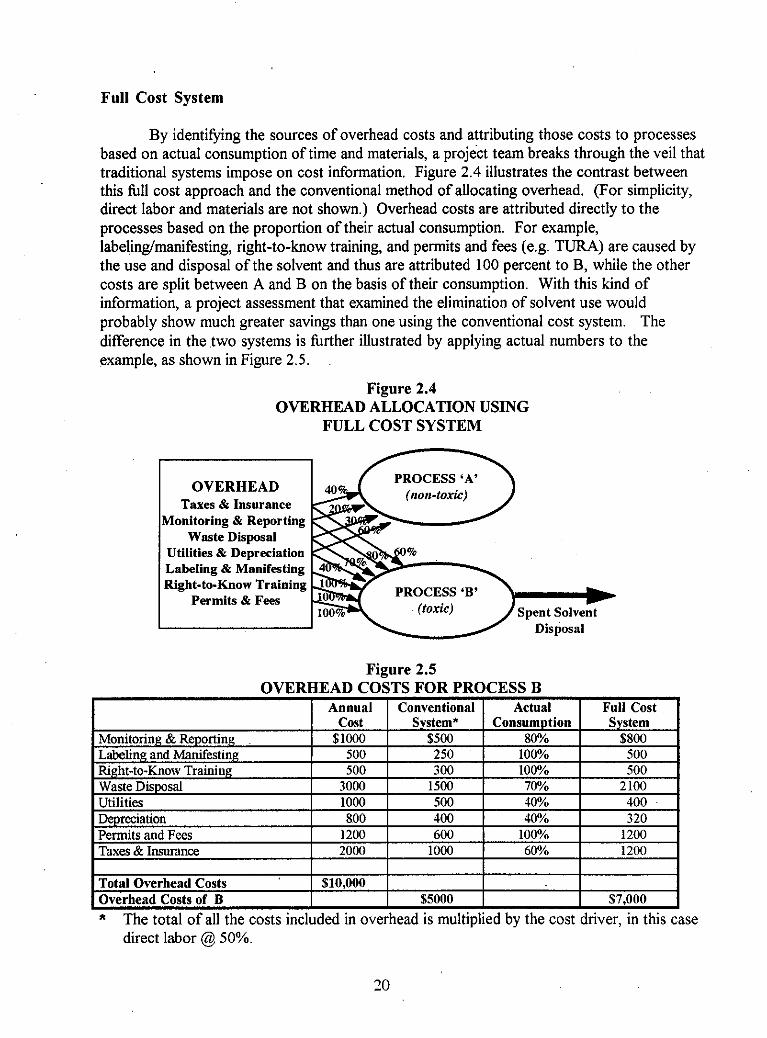
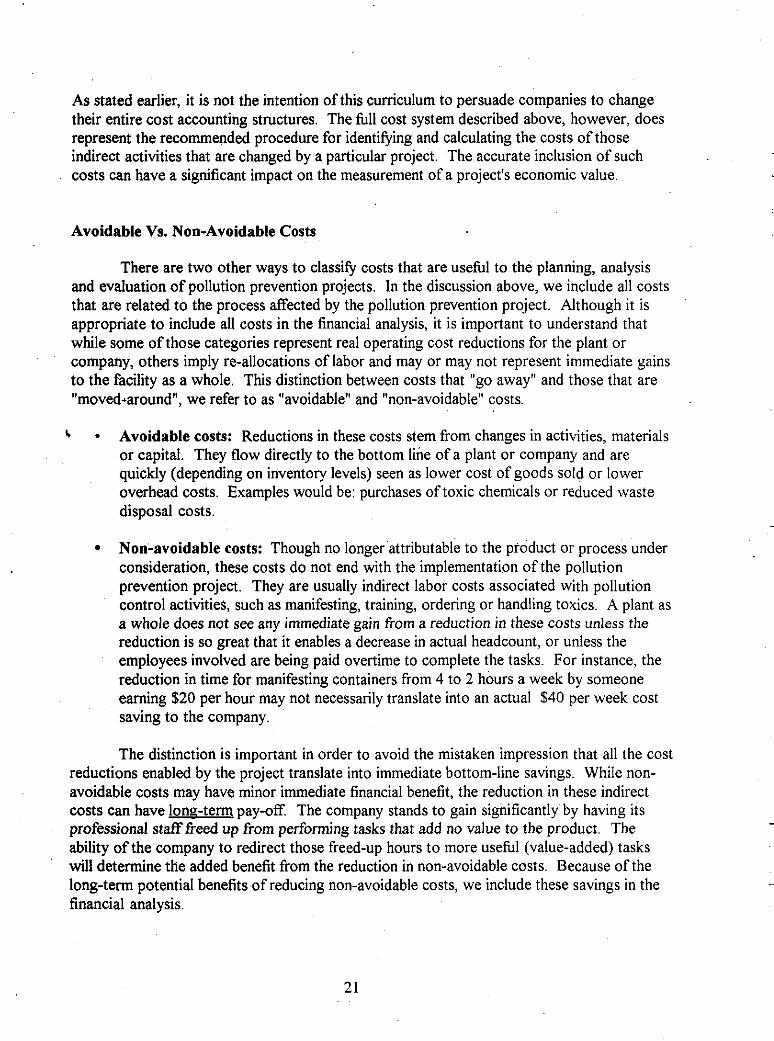
Full Cost System
By identifying the sources of overhead costs and attributing those costs to processes based on actual consumption of time and materials, a project team breaks through the veil that traditional systems impose on cost information. Figure 2.4 illustrates the contrast between this full cost approach and the conventional method of allocating overhead. (For simplicity,
processes based on the proportion of their actual consumption. For example, labeling/manifesting, right-to-know training, and permits and fees (e.g. TURA) are caused by the use and disposal of the solvent and thus are attributed 100 percent to B, while the other costs are split between A and B on the basis of their consumption. With this kind of information, a project assessment that examined the elimination of solvent use would probably show much greater savings than one using the conventional cost system. The difference in the two systems is further illustrated by applying actual numbers to the example, as shown in Figure 2.5.
~
~
direct labor and materials are not shown.) Overhead costs are attributed directly to the . ~~
__
Figure 2.4 OVERHEAD ALLOCATION USING
FULL COST SYSTEM - n OVERHEAD
Taxes & Insurance Monitoring & Reporting
Waste Disposal Utilities & Depreciation Labeling & Manifesting Right-to-Know Training
Permits & Fees
’ x PRoCESS‘A’ (non-toxic)
Spent Solvent PROCESS ‘B’
(toxic) - \ / Disposal
Figure 2.5 OVERHEAD COSTS FOR PROCESS B
I Overhead Costs of B $5000 I $7,000 I * The total of all the costs included in overhead is multiplied by the cost driver. in this case
direct labor @ 50%.
As stated earlier, it is not the intention of this curriculum to persuade companies to change their entire cost accounting structures. The full cost system described above, however, does represent the recommended procedure for identifying and calculating the costs of those indirect activities that are changed by a particular project. The accurate inclusion of such costs can have a significant impact on the measurement of a project's economic value
Avoidable Vs. Non-Avoidable Costs
There are two other ways to classify costs that are useful to the planning, analysis and evaluation of pollution prevention projects. In the discussion above, we include all costs that are related to the process affected by the pollution prevention project. Although it is appropriate to include all costs in the financial analysis, it is important to understand that while some of those categories represent real operating cost reductions for the plant or company, others imply re-allocations of labor and may or may not represent immediate gains to the facility as a whole. This distinction between costs that "go away" and those that are "movedaound", we refer to as "avoidable" and "non-avoidable" costs.
6 Avoidable costs: Reductions in these costs stem from changes in activities, materials or capital. They flow directly to the bottom line of a plant or company and are quickly (depending on inventory levels) seen as lower cost of goods sold or lower overhead costs. Examples would be: purchases of toxic chemicals or reduced waste disposal costs.
Non-avoidable costs: Though no longefattributable to the product or process under consideration, these costs do not end with the implementation of the pollution prevention project. They are usually indirect labor costs associated with pollution control activities, such as manifesting, training, ordering or handling toxics. A plant as a whole does not see any immediate gain from a reduction in these costs unless the reduction is so great that it enables a decrease in actual headcount, or unless the employees involved are being paid overtime to complete the tasks. For instance, the reduction in time for manifesting containers from 4 to 2 hours a week by someone earning $20 per hour may not necessarily translate into an actual $40 per week cost saving to the company.
The distinction is important in order to avoid the mistaken impression that all the cost reductions enabled by the project translate into immediate bottom-line savings. While non- avoidable costs may have minor immediate financial benefit, the reduction in these indirect costs can have long-term pay-off. The company stands to gain significantly by having its professional staff freed up from performing tasks that add no value to the product. The ability of the company to redirect those freed-up hours to more useful (value-added) tasks will determine the added benefit from the reduction in non-avoidable costs. Because of the long-term potential benefits of reducing non-avoidable costs, we include these savings in the financial analysis.
21
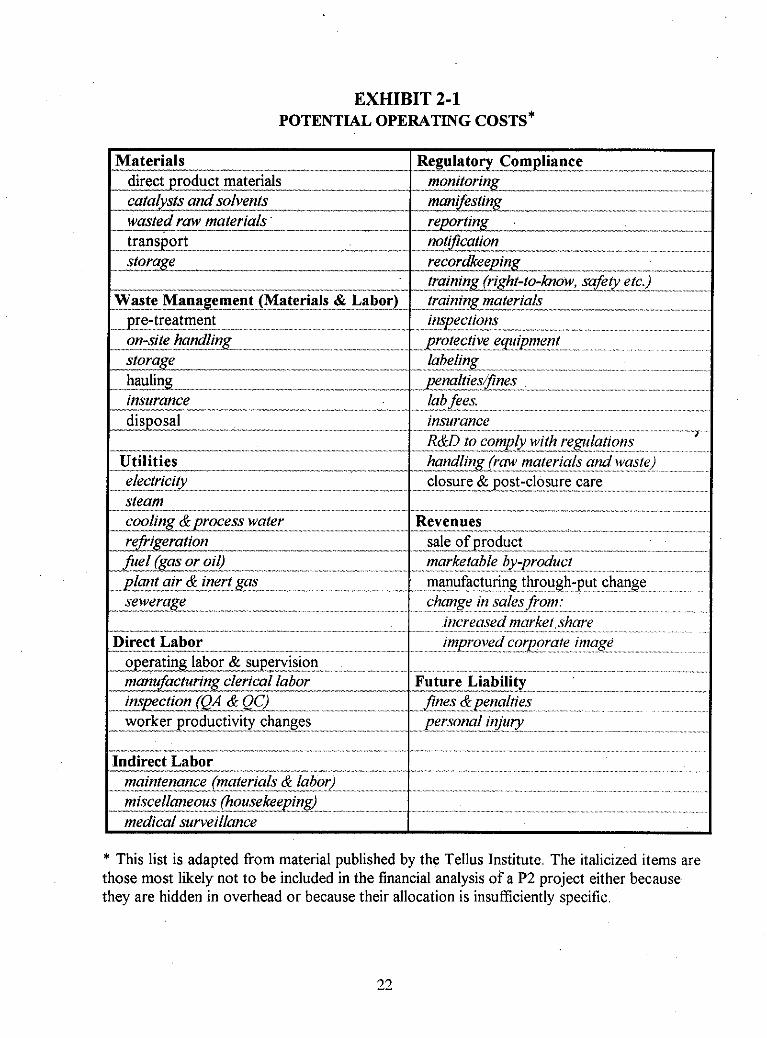
EXHIBIT 2-1 POTENTIAL OPERATING COSTS*
_I Materials ,,-II_ - Regulatory Compliance
2--"".-"-_---- catal sts and solvents - ....
~- transjeort **"I .... 11 ......... -... ........ nohication .._-__l____l__
direct product materials *"ll_."" monitoring
wasted raw materials
-I "___ ,I_._II_I_Ix__-___
m9es t ing .--I ".-."I"III-II.I ll..ll.." ..... r e p o r t i n c l l l . . ~ _ _ -
....... recordkeeping ................ ........................... .... .. ............. training ..... (rig&-to-know, safety .... etc.) .... .................
......................
s tor ze _l _l_-_.-____"____^""__-_I_ ,.._ ,._. *l.**___ll ...., ..., Waste Management
" re-treatment .........................................
....................
.................
. . . . . . . . . . . . . . . .
... ...................... .......
........ __ ..................
........... "
. . . . . . . . . . . . . .
. . . . .
. . . . . . . . . . . . . . . . . . . . . . . . . . . . . . . . . . . . . . . . .
............... -. .. .- ... . . . . . . . . . . . . . . . . . . . . . . . . . . . . . . . . .
* This list is adapted from material published by the Tellus Institute. The italicized items are those most likely not to be included in the financial analysis of'a P2 project either because they are hidden in overhead or because their allocation is insufficiently specific.
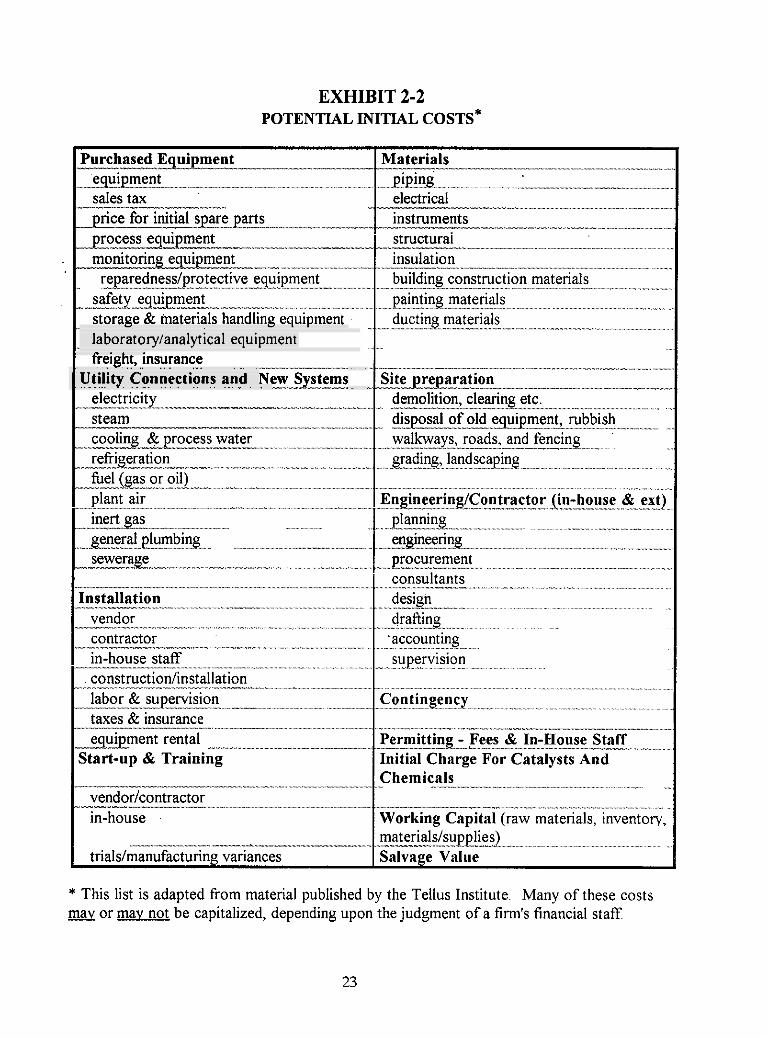
EXHIBIT 2-2 POTENTIAL INITIAL COSTS*
~ - - - - . ~ - - _ _ - l
..".-.-._I__.- equipment ----- --~-" .. .................................... ......
monitoring -I equipment -.l ....... reEredness/grotective .____.I . equipment .............
.................... safety equipment ".I _l.....l.**l.._l.* ............................................... storage & materials handling equipment laboratory/analyticaI equipment freight, insurance . . . . . . . . . . .
Utility .... Connections and I . . . . . . . . . . . . . . . . . . . . . . electricity . - steam cooling & process water
.................. ..... ....................................
- --"-*"~-"IxI .....................
............... ................................... refrigeration .... ....... "."_-l""".. .......................
...............................................
I .........................................
.......... erdplumbing __._ ................... ....................... .......
sewerage I --,._ .............. .....*....._ll.. ................................
I vendor Installation ..II.""I._l.__I..". ..................... . . . . . . . . . . . . . . . . . . . . . . . .
... ......................................................................
...-....-...........-......-....I . . . . . . . . . . . . . . . . . . .
............................................
.... .................. taxes & insurance ........... ....... .- ...........
*ll_"_l .. ...
vendorlcontractor in-house
............ .....,..., ........................
..,.--...ll_...,.,.I.. . ...... ..
Materials .......................... "- .... ...............
..................................................................................
..I .................
..........................................
......................................
..........................................................................
-. .._ll.-_.ll--.-......--..-. ............................. Site ll_l_ preparation l-*-" ~
demolition, clearing etc disposal of old equipment, rubbish
.........".."..".".....I walkwys, ... ".,l roads, and fencing .................. . . . .
.
Engineering/Contractor ... -. ....... ........ (in-house & ext) ^ * plannin8 I ..........
ineering .."ll I *.
curement ..... consultants - ...... design
drafting -. 'accounting supervision
Contingency ...................
Permitting .__^-_I_-" - Fees ,.,--.... "l__" & In-House Staff [nitial Charge For Catalysts And Zhemicals
.........................................................
....... ....
....................... -. ........................
. . . . ....... ........
..... . . . . . . . ,,.x . . . . . . . . . . . . . . . . . . . . . . . . . . . . . . . . .
..I" . . . . . . . . . . . . . . . . . . . . . . . . . . . . . . . . . . .
.... . . . . . . . . . . . .
. . . . . . . . . . . . . . . . . . . . . . . .
. . . . . . . . . . . . . . . . . . . . . . . . .
. . . . . . . . . . . . . . . . . . . . . . . . . . . . . . . . . .
................. . . ..... *_ .. ....
"-.l.._.. ............
~ .--.__^_.Ix..I. ...... ... ".___ .............. .I..
,.I .. ..-"I ....................... ." ............................. Working Capital (raw materials, inventory, nateriaIs/sup$ies) "..I* ....... ,"
3alvage Value ................................................
* This list is adapted from material published by the Tellus Institute. Many of these costs mav or mav not be capitalized, depending upon the judgment of a firm's financial staff,
23
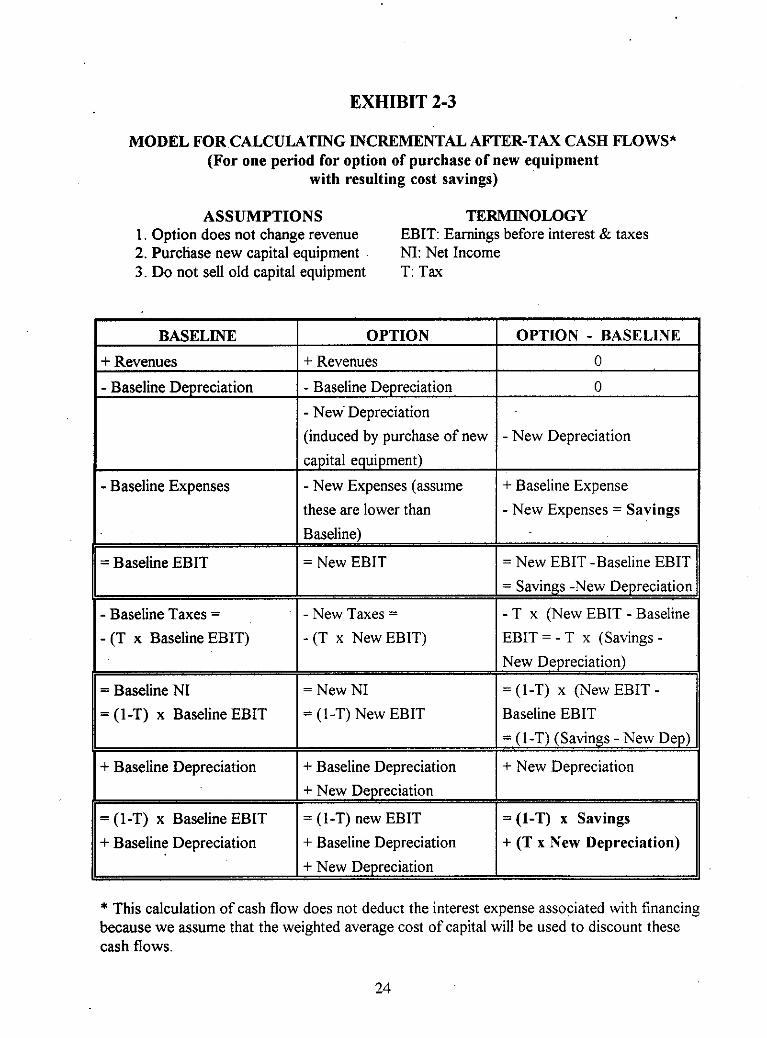
EXHIBIT 2-3
MODEL FOR CALCULATING INCREMENTAL AFTJCR-TAX CASH FLOWS* (For one period for option of purchase of new equipment
with resulting cost savings)
ASSUMPTIONS TERMINOLOGY 1. Option does not change revenue 2. Purchase new capital equipment 3. Do not sell old capital equipment
EBIT: Earnings before interest & taxes NI: Net Income T: Tax
- Baseline Expenses t- = Baseline EBIT
- Baseline Taxes =
- (T x Baseline EBIT)
= Baseline NI = (1-T) x Baseline EBIT
+ Baseline Depreciation
= (1-T) x Baseline EBIT + Baseline Depreciation
OPTION + Revenues - Baseline Depreciation - New- Depreciation (induced by purchase of new capital equipment) - New Expenses (assume these are lower than Baseline)
= New EBIT
- New Taxes =
- (T x New EBIT)
= New NI = (I-T) New EBIT
+ Baseline Depreciation + New Depreciation
= (1-T) new EBIT + Baseline Depreciation + New Depreciation
OPTION - BASELINE 0 - New Depreciation
+ Baseline Expense 1 - New Expenses = Savings
- T x (New EBIT - Baseline E B I T = - T x (Savings- New Depreciation)
=(I-T) x (NewEBIT- Baseline EBIT = (I-T) (Savings -New Dep)
+ New Depreciation
+ (T x New Depreciation)
* This calculation of cash flow does not deduct the interest expense associated with financing because we assume that the weighted average cost of capital will be used to discount these cash flows.
24
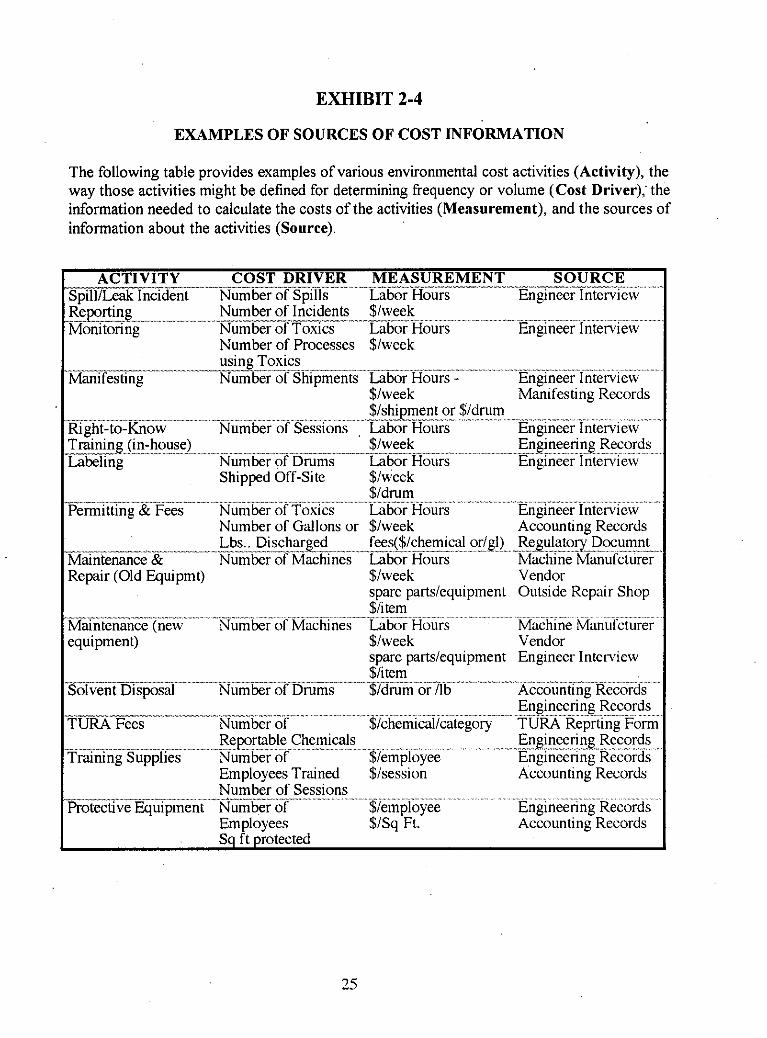
EXHIBIT 2-4
EXAMPLES OF SOURCES OF COST INFORMATION
The following table provides examples of various environmental cost activities (Activity), the way those activities might be defined for determining frequency or volume (Cost Driver); the information needed to calculate the costs of the activities (Measurement), and the sources of information about the activities (Source).
ACTIVITY COST DRIVER MEASUREMENT . S O U R C E ...... Spill/Leak Incident Number of Spills Labor Hours ngineer Intervie Reporting Number . of ll____l__ Incidents ... $/week . ........... Monitoring Number of Toxics Labor Hours Engineer Interview
Manifesting Number of Shipments Labor rvi
_.__x -_ll --ll-ll_l_ll. _" .I __..---_" I _-
--..I ..........................
Number of Processes $/week __lll_ll.-lll...ll*~..,~.,,.,...~-.---~-.,...~. using Toxics .. . . ....
R-~g-h~ .................................................................................................................................................................
$/week Manifesting Records ... $/shipment or $/drum
Number of Sessions , Labor Hours
Shipped Off-Site $/week
Engineer Interview Training (in-house) Labeling Engineer 1 nterview
............... Engineering Records . -. ..... - .......................
~~
$/drum ._
S Labor Hours .........................
Number of Gallons or $/week -_-I_ 11111-"1 Lbs.. Discharged fees($/chemical or/ Maintenance & Number of Machines Labor Hours Repair (Old Equipmt) $/week
Il"l-,.II.."IxI." I **"_ ^- II___.,_.,__ ........
spare partsiequipment $/item
I_II. I. ....x..I.".-..*..... ................ ............................... . . . . . . . . . . . . Maintenance (new Number of Machines Labor Hours equipment) $/week
Solvent Disoosal Number of Drums rum or Ilb
spare partdequipment $/item
-.---Ix*",-_.l__I1.. ___I__-.-_.-
........................................ Engineer Interview Accounting Records
Machine Manufcturer Vendor Outside Repair Shop
Machine Manurciurer Vendor Engineer Interview
Accounting Records
............
....... . Engineerinlg Records
TURA Fees Number of chemical/category TURA Reprting Forn Engineering Records
$/employee Engineering Records Employees Trained $/session Accounting Records Number of Sessions
Protective Equipment Number of employee Engineering Records Employees $/Sq Ft. Accounting Records
..*._-.**...*..__....*.................*..I ..........xx.._l_l.... ...... ......................... .~-/.. .............................................................. ............ .........
......................................................................................................................
.lllx _. .. ......*..I.......I. I. .................. . ~ / . . .............. . . . . . . . . . . . . . . . . .
25

Section 3 - MEASURES OF PROFITABILITY
After the relevant costs and savings have been identified and translated into cash flows, the information can be analyzed to determine the potential economic value a pollution prevention project might add to a business There are four common methods - measures of profitability - for performing the analysis Payback Period, Accounting Rate of Return (ROR), Net Present Value (NPV), and Internal Rate of Return (IRR) The following section demonstrates these methods, explains the interpretation of their results and discusses their appropriate uses, advantages and limitations As a general rule Net Present Value and Internal Rate of Return are superior to Payback and Accounting ROR, due principally to the consideration of the time value of money, a concept discussed later in this section Because companies can employ any of the four methods (with variations), however, it is important that P2 practitioners be familiar with their use and interpretation This section will demonstrate each method using the cash flow information from the Wrayburn Jewelry example seen in the previous sections1 It is important to keep in mind that while financial analysis is an intrinsic aspect of the assessment of pollution prevention projects, the results must be considered in conjunction with potential positive and negative qualitative impacts, which are discussed in Section 4
METHOD #1: PAYBACK PERIOD ANALYSIS: Reveals the amount of t h e needed for an investment to return the initial capital expenditures.
Payback period analysis is the simplest of the four financial analysis methods. It measures how long a project will take to return its original investment and ranks projects according to the length of the period: the shorter the payback period, the more attractive the project. The calculation to determine the payback period is more intuitive than formulaic; and it changes depending on the nature of the cash flows:
If annual cash flows are equal, the initial investment amount is divided by the annual cash flow. If the first year cash flow is greater than the initial investment, the initial investment amount is divided by the first year cash flow. If cash flows vary, and the initial investment is greater than the first year cash flow, succeeding years' cash flows are added incrementally until they equal the initial investment amount.
Payback period analysis has two drawbacks: it ignores the time value of money, and it ignores cash flows that occur after the initial investment has been recouped. A chart that tracks the percentage payback of all the cash flows over the life of the project offers one response to the latter objection. This refinement preserves the simplicity of the payback method yet increases its usefulness. Figure 3 . 1 shows both the simple and the modified payback period methods.
A synopsis of Wraybnrn Jewelry can be found on page 4 of Section 1. and the.full case with Exhibits is included as Appendix B.
27
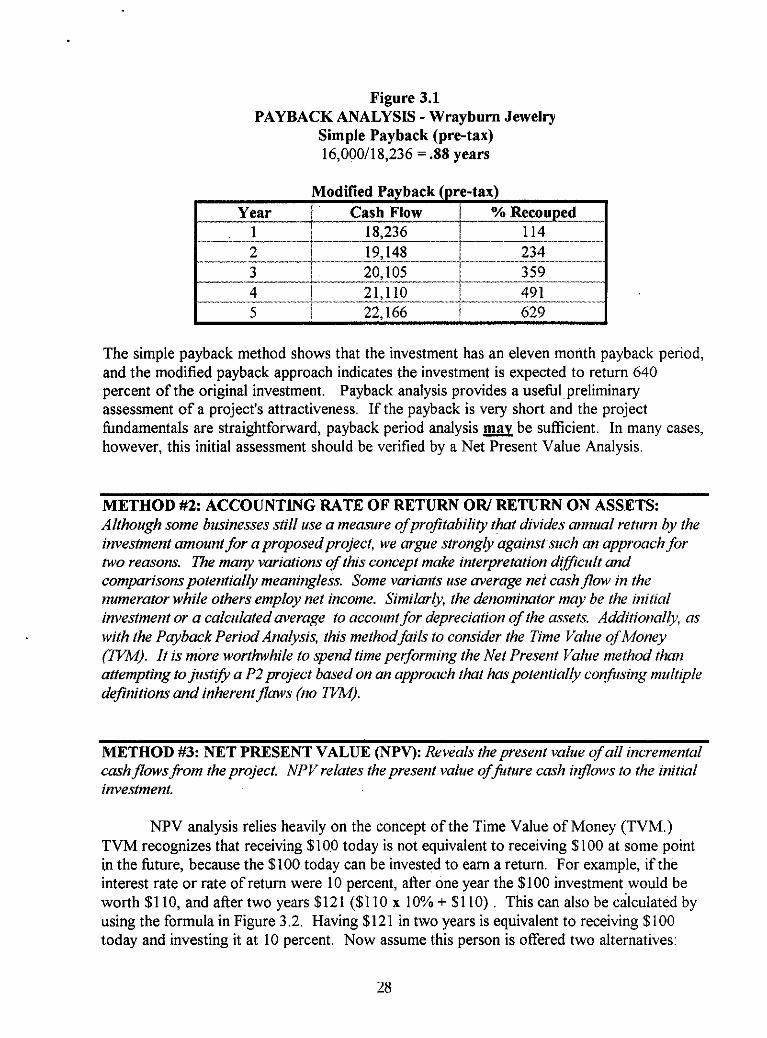
Figure 3.1 PAYBACK ANALYSIS - Wrayburn Jewelry
Simple Payback (pre-tax) 16,000/18,236 = .88 years
The simple payback method shows that the investment has an eleven month payback period, and the modified payback approach indicates the investment is expected to return 640 percent of the original investment. Payback analysis provides a useful preliminary assessment of a project's attractiveness. If the payback is very short and the project fundamentals are straightforward, payback period analysis mav be sufficient. In many cases, however, this initial assessment should be verified by a Net Present Value Analysis.
METHOD #2: ACCOUNTING RATE OF RETURN OR/ RETURN ON ASSETS: Although some businesses still use a measure ofprofitability that divides annual return by the investment amount for a proposed project, we argue strongly against such an approach for two reasons. The many variations of this concept make interpretation dij$cult and comparisons potentially meaningless. Some variants use average net cash flow in the numerator while others employ net income. Similarly? the denominator may be the initial investment or a calculated average to account for depreciation of the assets. Additionally, os with the Payback Period Analysis, this method fails to consider the Time Value of Money (W). It is more worthwhile to spend time performing the Net Present Value method than attempting to justih a P2 project based on an approach that has potentially confusing multiple definitions and inherent flaws (no m).
~
METHOD #3: NET PRESENT VALUE (NPV): Reveals the present value of all incremental cashflowsfrom the project. NPV relates the present value offture cash iilflows to the initial investment.
NPV analysis relies heavily on the concept of the Time Value of Money (TVM.) -
TVM recognizes that receiving $100 today is not equivalent to receiving $100 at some point in the future, because the $100 today can be invested to earn a return For example, if the interest rate or rate of return were 10 percent, after one year the $100 investment would be worth $1 10, and after two years $121 ($1 10 x 10% + $1 10) This can also be calculated by using the formula in Figure 3 2 Having $121 in two years is equivalent to receiving $100 today and investing it at 10 percent Now assume this person is offered two alternatives
__
28
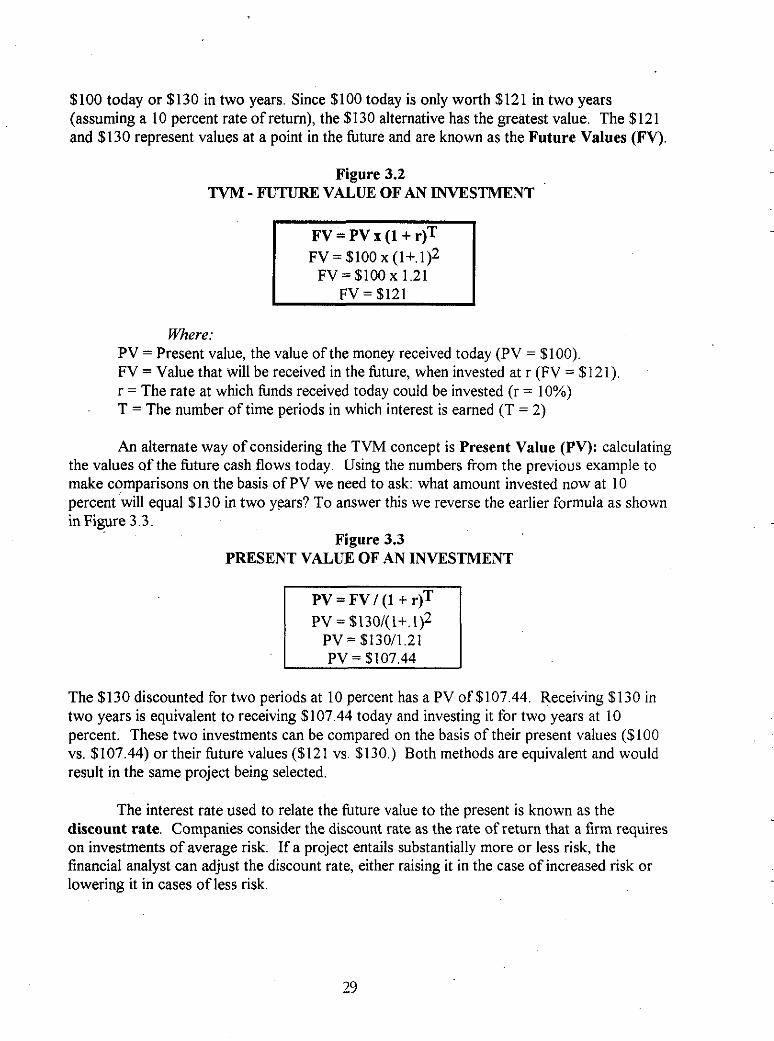
$100 today or $130 in two years. Since $100 today is only worth $121 in two years (assuming a 10 percent rate of return), the $130 alternative has the greatest value. The $121 and $130 represent values at a point in the future and are known as the Future Values (FV).
Figure 3.2 TVM - "I'URJC VALUE OF AN INVESTMENT
FV = $100 x 1.21
Where: PV = Present value, the value of the money received today (PV = $100). FV = Value that will be received in the future, when invested at r (FV = $121). r = The rate at which funds received today could be invested (r = 10%) T = The number of time periods in which interest is earned (T = 2)
An alternate way of considering the TVM concept is Present Value (PV): calculating the values of the future cash flows today. Using the numbers from the previous example to make comparisons on the basis of PV we need to ask: what amount invested now at 10 percent will equal $130 in two years? To answer this we reverse the earlier formula as shown in Figure 3.3.
Figure 3.3 PRESENT VALUE OF AN INVESTMENT
PV = FV / ( I + r)T PV = $130/(1+.1)2
P V = $130/1.21
The $130 discounted for two periods at 10 percent has a PV of $107 44. Receiving $130 in two years is equivalent to receiving $107.44 today and investing it for two years at 10 percent. These two investments can be compared on the basis of their present values ($100 vs. $107.44) or their future values ($121 vs $130.) Both methods are equivalent and would result in the same project being selected.
The interest rate used to relate the future value to the present is known as the discount rate. Companies consider the discount rate as the rate of return that a firm requires on investments of average risk. If a project entails substantially more or less risk, the financial analyst can adjust the discount rate, either raising it in the case of increased risk or lowering it in cases of less risk.
29
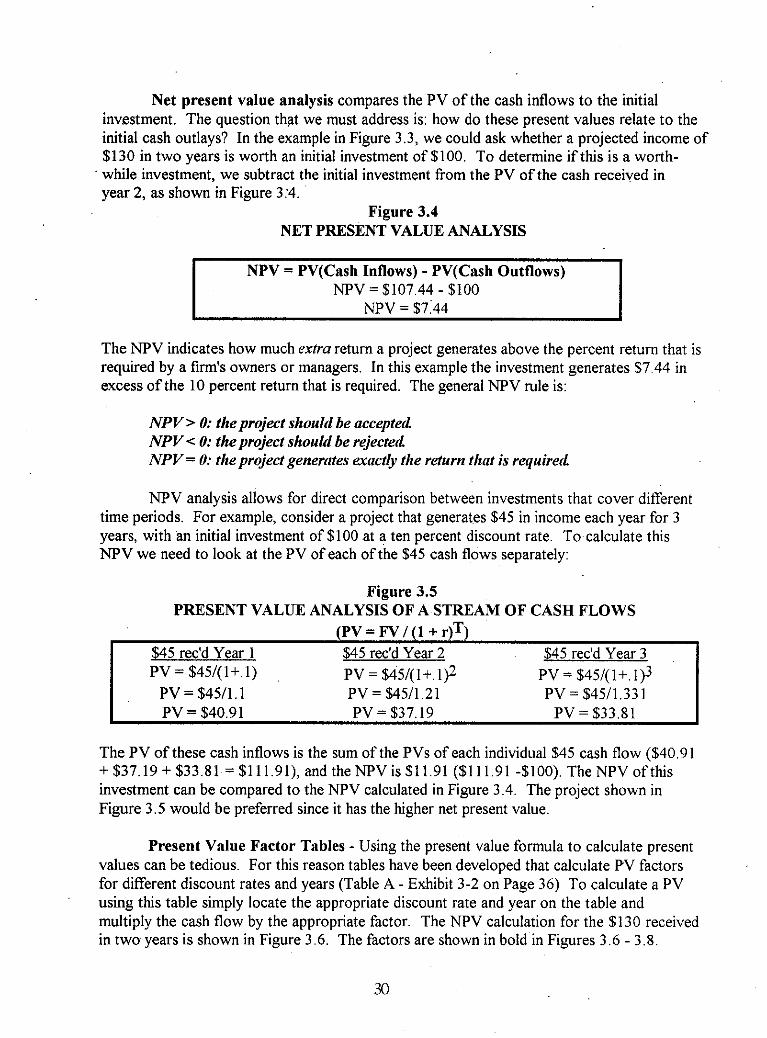
Net present value analysis compares the PV of the cash inflows to the initial investment. The question that we must address is: how do these present values relate to the initial cash outlays? In the example in Figure 3.3, we could ask whether a projected income of $130 in two years is worth an initial investment of $100. To determine if this is a worth-
year 2, as shown in Figure 3:4.
__
' while investment, we subtract the initial investment from the PV of the cash received in __
Figure 3.4 NET PRESENT VALUE ANALYSIS
NPV = PV(Cash Inflows) - PV(Cash Outflows) NPV=$107.44 - $100
NPV = $7'44
The NPV indicates how much extra return a project generates above the percent return that is required by a firm's owners or managers. In this example the investment generates $7.44 in excess of the 10 percent return that is required. The general NPV rule is:
NPV =. 0: the project should be nccepterl NPV < 0: the project should be rejectell NPV = 0: the project generates exactly the return thnt is requirerl
NPV analysis allows for direct comparison between investments that cover different time periods. For example, consider a project that generates $45 in income each year for 3 years, with an initial investment of $100 at a ten percent discount rate. To calculate this NPV we need to look at the PV of each of the $45 cash flows separately:
Figure 3.5 PRESENT VALUE ANALYSIS OF A STREAM OF CASH FLOWS
(PV = FV / (I + r)T) $45 redd Year 2 PV = $45/(1+ 1)2 PV = $45/1 21
$45 redd Year 1 PV = $45/(1+ 1)
PV = $45/1 1
$45 rec'd Year 3 PV = $45/(1+ l)3 PV = $4511 33 1
I PV = $33.81 PV = $40.91 PV= $37.19
The PV of these cash inflows is the sum of the PVs of each individual $45 cash flow ($40.91 + $37.19 + $33.8 1 = $1 1 1.91), and the NPV is $1 1.91 ($1 1 1.9 1 -$loo). The NPV of this investment can be compared to the NPV calculated in Figure 3.4. The project shown in Figure 3.5 would be preferred since it has the higher net present value. -
Present Value Factor Tables - Using the present value formula to calculate present values can be tedious. For this reason tables have been developed that calculate PV factors for different discount rates and years (Table A - Exhibit 3-2 on Page 36) To calculate a PV using this table simply locate the appropriate discount rate and year on the table and multiply the cash flow by the appropriate factor. The NPV calculation for the $130 received in two years is shown in Figure 3.6. The factors are shown in bold in Figures 3.6 - 3.8.
-
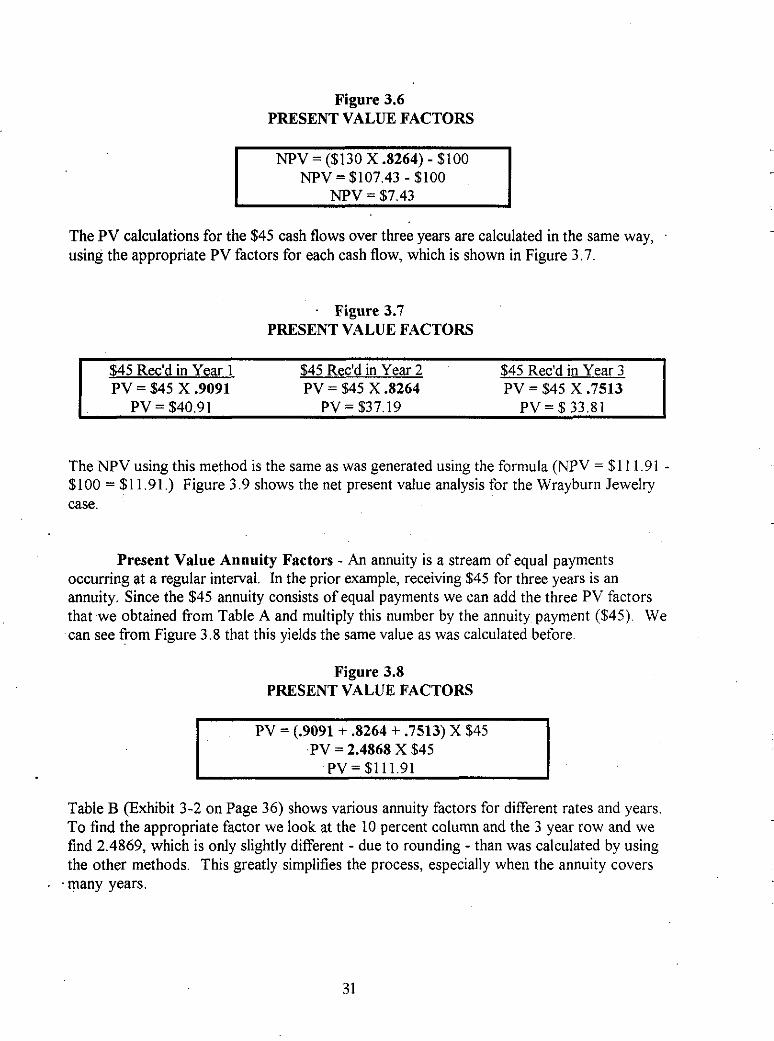
Figure 3.6 PRESENT VALUE FACTORS
The PV calculations for the $45 cash flows over three years are calculated in the same way, . using the appropriate PV factors for each cash flow, which is shown in Figure 3.7.
. Figure 3.7 PRESENT VALUE FACTORS
$45 Rec'd in Year 1 PV = $45 X .9091
$45 Rec'd in Year 2 PV = $45 X .8264
$45 Rec'd in Year 3 PV = $45 X .7513
PV = $40.91 PV= $37.19 PV=$33 .81
The NPV using this method is the same as was generated using the formula (NPV = $ 1 11 91 - $100 = $1 1.91.) Figure 3.9 shows the net present value analysis for the Wrayburn Jewelry case.
Present Value Annuity Factors - An annuity is a stream of equal payments occurring at a regular interval. In the prior example, receiving $45 for three years is an annuity. Since the $45 annuity consists of equal payments we can add the three PV factors that we obtained from Table A and multiply this number by the annuity payment ($45) We can see from Figure 3 8 that this yields the same value as was calculated before
Figure 3.8 PRESENT VALUE FACTORS
I PV = (.9091+ ,8264 + .7513) X $45 I -PV = 2.4868 X $45
PV=$111.91
Table B (Exhibit 3-2 on Page 36) shows various annuity factors for different rates and years. To find the appropriate factor we look at the 10 percent column and the 3 year row and we find 2.4869, which is only slightly different - due to rounding - than was calculated by using the other methods. This greatly simplifies the process, especially when the annuity covers
.many years.
31
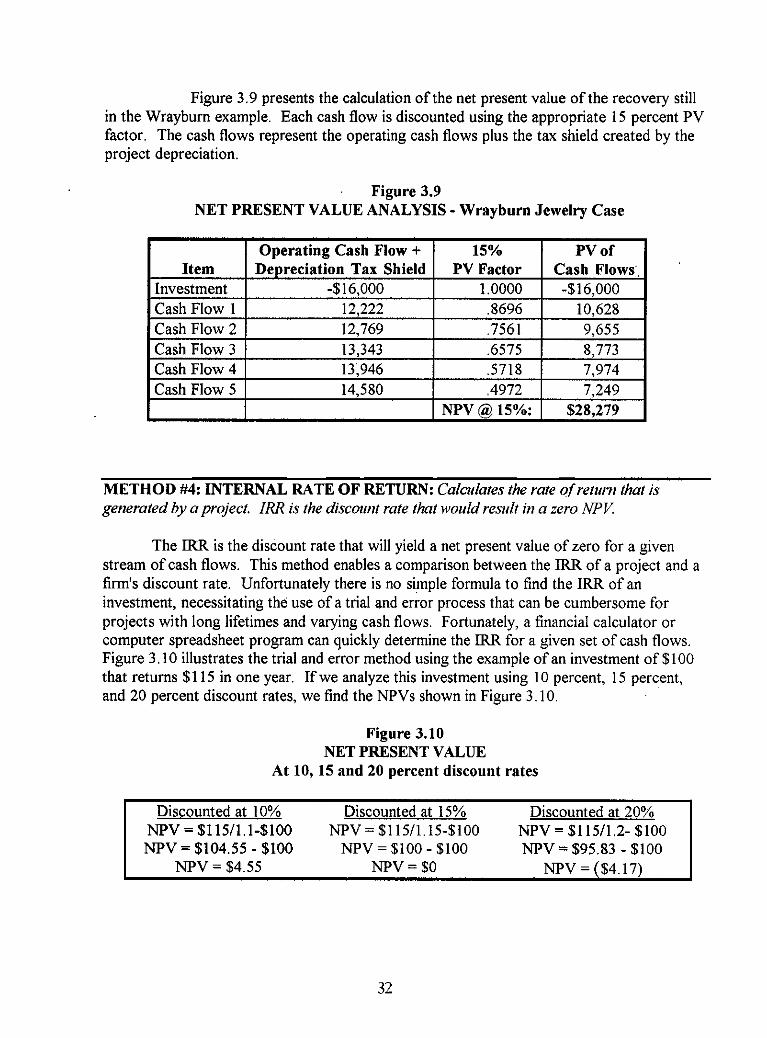
Figure 3.9 presents the calculation of the net present value of the recovery still in the Wrayburn example. Each cash flow is discounted using the appropriate 15 percent PV factor. The cash flows represent the operating cash flows plus the tax shield created by the project depreciation.
Discounted at 10% Discounted at 15% Discounted at 20% NPV = $1 15/1. 15-$100 NPV = $1 lY1.1-$100 NPV= $115/1.2- $100
Figure 3.9 NET PRESENT VALUE ANALYSIS - Wrnyburn Jewelry Case
-
METHOD #4: INTERNAL RATE OF RETURN: C’a/cti/a/rs ihe role ofrertu7t /ha/ 1,s
generated by a project. IRR is the discount rate that would result in a zero NPK
The IRR is the discount rate that will yield a net present value of zero for a given stream of cash flows. This method enables a comparison between the IRR of a project and a firm’s discount rate. Unfortunately there is no simple formula to find the IRR of an investment, necessitating the use of a trial and error process that can be cumbersome for projects with long lifetimes and varying cash flows. Fortunately, a financial calculator or computer spreadsheet program can quickly determine the IRR for a given set of cash flows. Figure 3.10 illustrates the trial and error method using the example of an investment of $100 that returns $1 15 in one year. If we analyze this investment using 10 percent, 15 percent, and 20 percent discount rates, we find the NPVs shown in Figure 3.10.
Figure 3.10 NET PRESENT VALUE
At 10, 15 and 20 percent discount rates
NPV=$104.55 - $100 Npv = $100 - $100 NPV = $4.55 NPV = $0 NPV = ($4.17)
NPV = $95 83 - $100
__
32
Discounting at 10 percent leads to a positive NPV, discounting at 20 percent leads to a negative NPV, therefore, the IRR must lie between 10 percent and 20 percent. When discounted at a rate of 15 percent the NPV of the investment is zero, therefore, the IRR of this investment is 15 percent. The general rule for using IRR is:
If IRR > Discount rate then accept the project. If IRR < Discount rate then reject theproject.
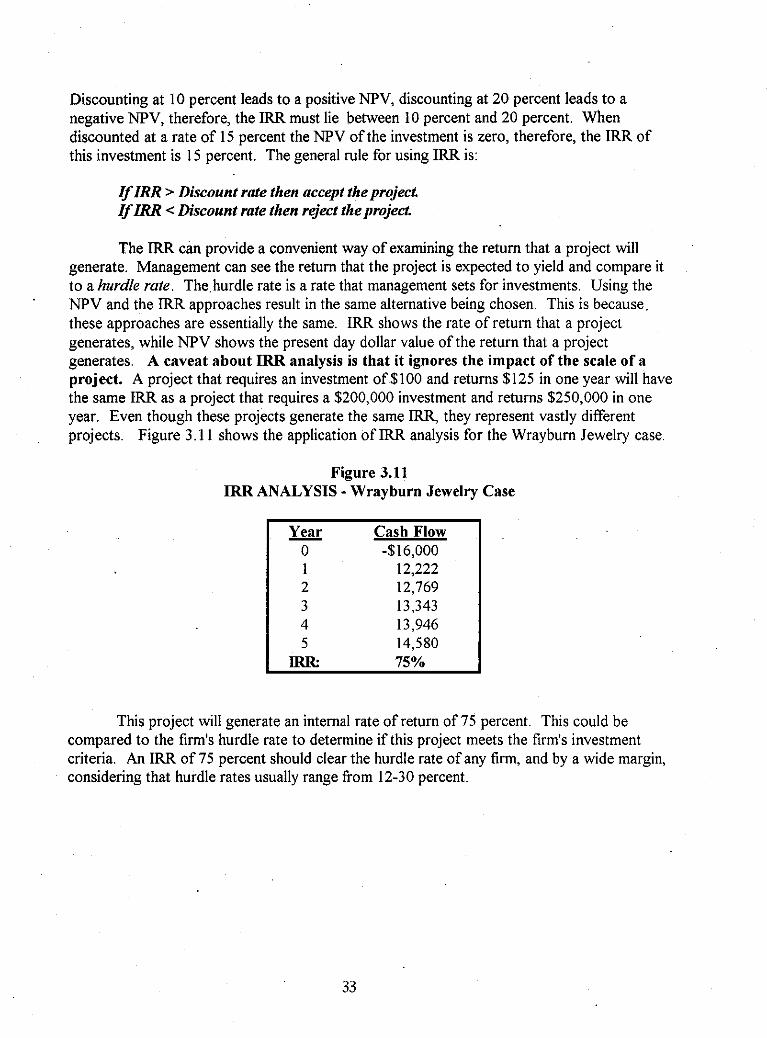
The IRR can provide a convenient way of examining the return that a project will generate. Management can see the return that the project is expected to yield and compare it to a hurdle rate. The,hurdle rate is a rate that management sets for investments. Using the NPV and the IRR approaches result in the same alternative being chosen. This is because. these approaches are essentially the same. IRR shows the rate of return that a project generates, while NPV shows the present day dollar value of the return that a project generates. A caveat about IRR analysis is that it ignores the impact of the scale of a project. A project that requires an investment of $100 and returns $125 in one year will have the same IRR as a project that requires a $200,000 investment and returns $250,000 in one year. Even though these projects generate the same IRR, they represent vastly different projects. Figure 3.1 1 shows the application of IRR analysis for the Wraybum Jewelry case.
'
Figure 3.11 IRR ANALYSIS - Wrayburn Jewelry Case
- Year Cash Flow 0 -$16,000 1 12,222 2 12,769 3 13,343 4 13,946 5 14,580
IRR: 75%
This project will generate an internal rate of return of 75 percent This could be compared to the firm's hurdle rate to determine if this project meets the firm's investment criteria. An IRR of 75 percent should clear the hurdle rate of any firm, and by a wide margin, considering that hurdle rates usually range from 12-30 percent.
33
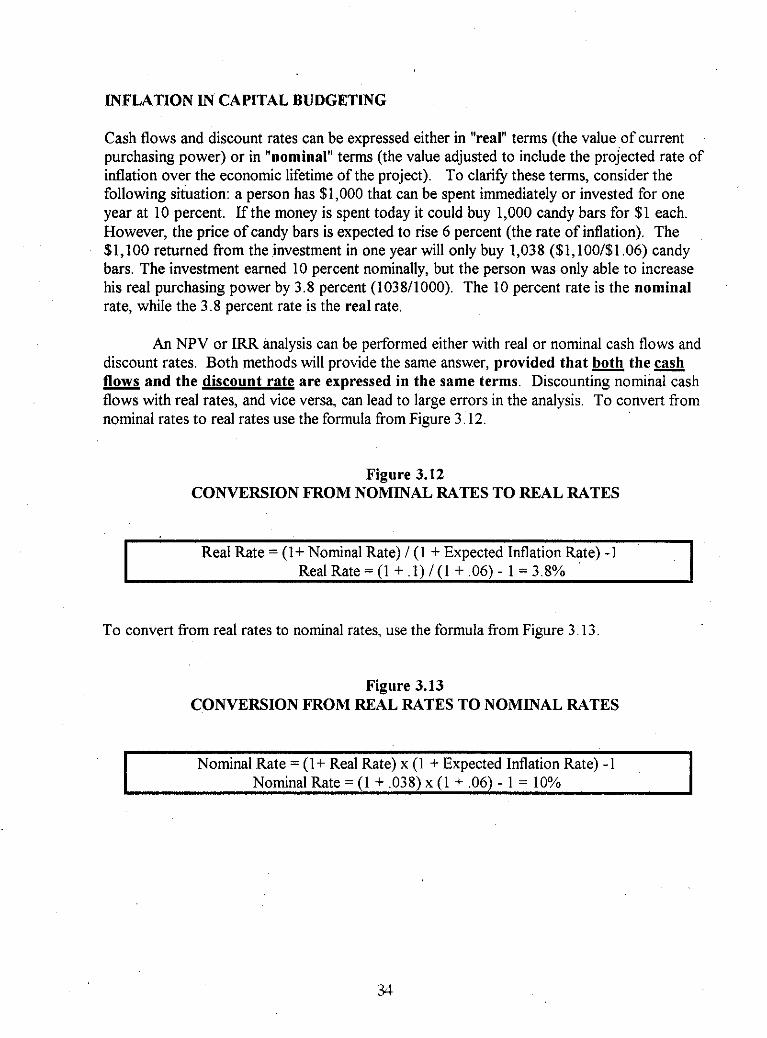
INFLATION IN CAPITAL BUDGETING
Cash flows and discount rates can be expressed either in "real" terms (the value of current purchasing power) or in "nominal" terms (the value adjusted to include the projected rate of inflation over the economic lifetime of the project). To clarify these terms, consider the following situation: a person has $1,000 that can be spent immediately or invested for one year at 10 percent. If the money is spent today it could buy 1,000 candy bars for $1 each. However, the price of candy bars is expected to rise 6 percent (the rate of inflation). The $1,100 returned from thelnvestment in one year will only buy 1,038 ($1,100/$1.06) candy bars. The investment earned 10 percent nominally, but the person was only able to increase his real purchasing power by 3.8 percent (1038/1000). The 10 percent rate is the nominal rate, while the 3.8 percent rate is the real rate.
~
~
__
An NPV or IRR analysis can be performed either with real or nominal cash flows and discount rates. Both methods will provide the same answer, provided that both the - flows and the discount rate are expressed in the same terms. Discounting nominal cash flows with real rates, and vice versa, can lead to large errors in the analysis. To convert from nominal rates to real rates use the formula from Figure 3.12.
Figure 3.12 CONVERSION FROM NOMINAL RATES TO REAL RATES
Real Rate = (1+ Nominal Rate) / (1 + Expected Inflation Rate) -1 Real Rate= (1 + . l ) / (1 + .06) - 1 = 3.8%
To convert from real rates to nominal rates, use the formula from Figure 3.13.
Figure 3.13 CONVERSION FROM REAL RATES TO NOMINAL RATES
Nominal Rate = (1+ Real Rate) x (1 + Expected Inflation Rate) -1 Nominal Rate = (1 + ,038) x (1 + .06) - 1 = 10%
34
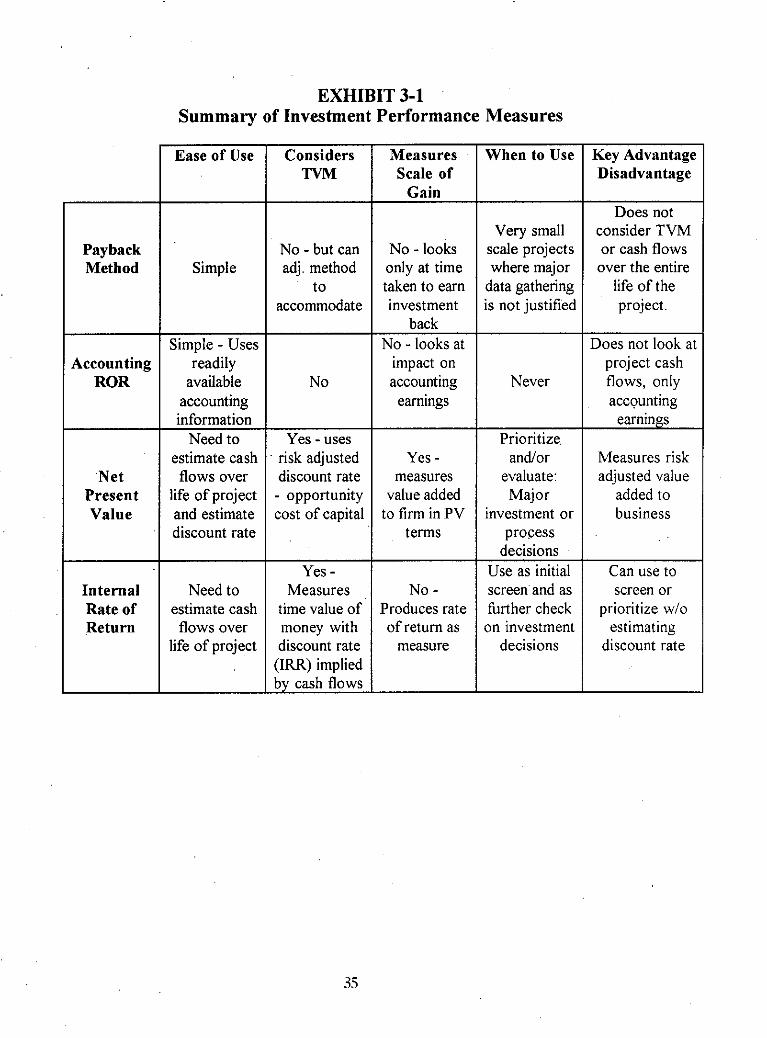
Payback Method
No - but can adj. method
to accommodate
Accounting ROR
No - looks only at time taken to earn investment
back
Net Present Value
No
Yes - uses risk adjusted discount rate - opportunity cost of capital
Internal Rate of Return
No - looks at impact on accounting earnings
Yes - measures
value added to firm in PV
terms
EXHIBIT 3-1 Summary of Investment Performance Measures
Ease of Use
Simple
Simple - Uses readily
available accounting information
Need to estimate cash flows over
life of project and estimate discount rate
Need to estimate cash flows over
life of project
Considers I Measures TVM I scale of
Gain +
Measures
discount rate measure (IRR) implied
Disadvantage
Very small scale projects where major
data gathering is not justified
Never
Prioritize, and/or
evaluate: Major
investment or process
decisions Use as initial screen and as further check on investment
decisions
Does not consider TVM or cash flows over the entire
life of the project.
Does not look at project cash flows, only accounting
earnings
Measures risk adjusted value
added to business
Can use to screen or
prioritize w/o estimating
discount rate
I
35
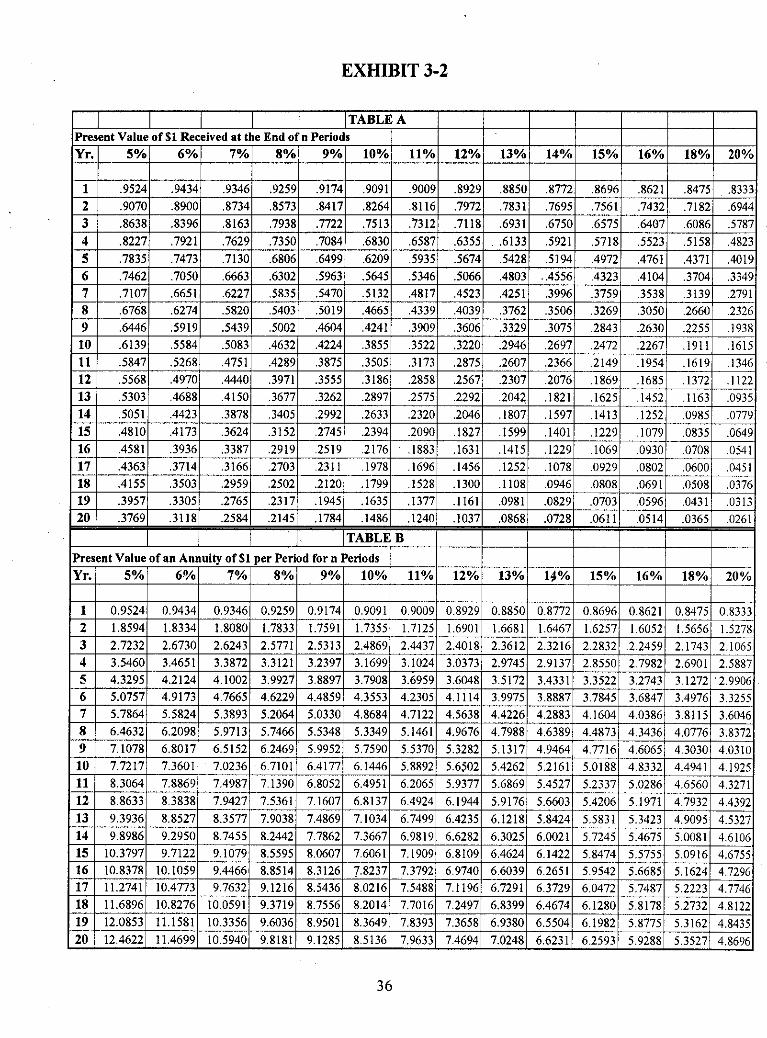
EXHIBIT 3-2
1 I I I I 1 TABLE A
I I I I I I I
Present Value of $1 Received at the End of n Periods Yr. I 5%1 6%/ 7%1 8%1 9%1 lo%] 11% 12% 13% 14% 15% 16% 18% 20%
36
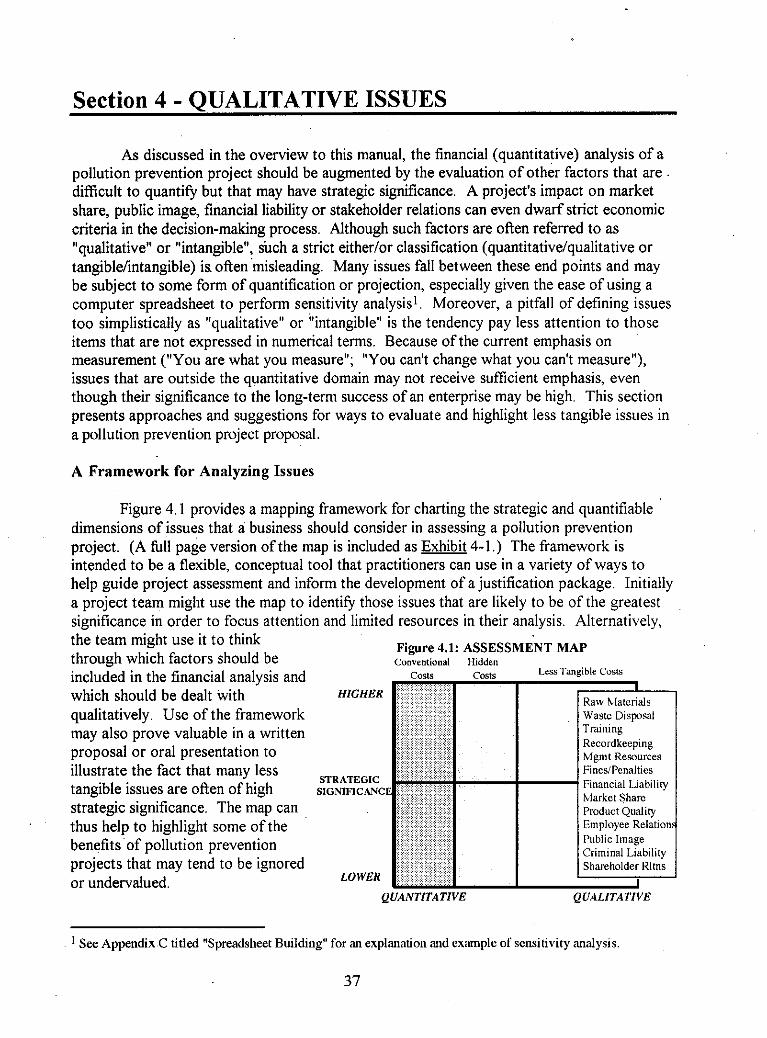
Section 4 - QUALITATIVE ISSUES
As discussed in the overview to this manual, the financial (quantitative) analysis of a pollution prevention project should be augmented by the evaluation of other factors that are . difficult to quantify but that may have strategic significance. A project's impact on market share, public image, financial liability or stakeholder relations can even dwarf strict economic criteria in the decision-making process. Although such factors are often referred to as "qualitative" or "intangible", such a strict either/or classification (quantitative/qualitative or tangiblehtangible) is ofien'misleading. Many issues fall between these end points and may be subject to some form of quantification or projection, especially given the ease of using a computer spreadsheet to perform sensitivity analysis'. Moreover, a pitfall of defining issues too simplistically as "qualitative" or "intangible" is the tendency pay less attention to those items that are not expressed in numerical terms. Because of the current emphasis on measurement ("You are what you measure"; "You can't change what you can't measure"), issues that are outside the quantitative domain may not receive sufficient emphasis, even though their significance to the long-term success of an enterprise may be high. This section presents approaches and suggestions for ways to evaluate and highlight less tangible issues in a pollution prevention project proposal
A Framework for Analyzing Issues
Figure 4.1 provides a mapping framework for charting the strategic and quantifiable dimensions of issues that a business should consider in assessing a pollution prevention project. (A full page version of the map is included as Exhibit 4-1 .) The framework is intended to be a flexible, conceptual tool that practitioners can use in a variety of ways to help guide project assessment and inform the development of a justification package. Initially a project team might use the map to identify those issues that are likely to be of the greatest significance in order to focus attention and limited resources in their analysis. Alternatively. the team might use it to think through which factors should be
Figure 4.1: ASSESSMENT MAP Conventional Hidden
Less Tangible Costs included in the financial analysis and COStS
which should be dealt with HIGHER
qualitatively. Use of the framework may also prove valuable in a written proposal or oral presentation to illustrate the fact that many less STRATEO,C FinesiPenalties
tangible issues are ofien of high
thus help to highlight some of the
Financial Liability SIGNIF'ICANC
strategic significance. The map can
benefits'of pollution prevention projects that may tend to be ignored or undervalued.
Employee Relation
LOWER
QUANTITATIVE QUALITATIVE
See Appendix C titled "Spreadsheet Building'' for an explanation a d example of sensitivity analysis
37
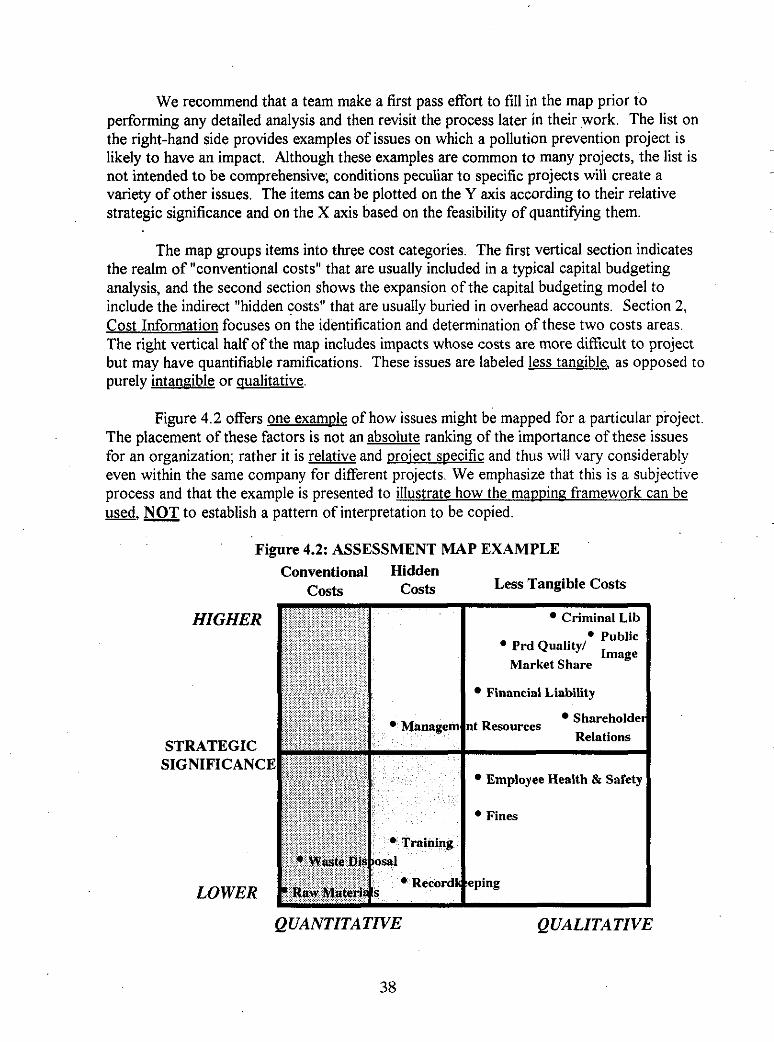
We recommend that a team make a first pass effort to fill in the map prior to performing any detailed analysis and then revisit the process later in their work. The list on the right-hand side provides examples of issues on which a pollution prevention project is likely to have an impact. Although these examples are common to many projects, the list is not intended to be comprehensive, conditions peculiar to specific projects will create a variety of other issues. The items can be plotted on the Y axis according to their relative strategic significance and on the X axis based on the feasibility of quantifying them.
~
~
The map groups items into three cost categories. The first vertical section indicates the realm of "conventional costs" that are usually included in a typical capital budgeting analysis, and the second section shows the expansion of the capital budgeting model to include the indirect "hidden costs" that are usually buried in overhead accounts. Section 2, Cost Information focuses on' the identification and determination of these two costs areas. The right vertical half of the map includes impacts whose costs are more difficult to project but may have quantifiable ramifications. These issues are labeled less tangible, as opposed to purely intangible or aualitative.
Figure 4.2 offers one example of how issues might be mapped for a particular project. The placement of these factors is not an absolute ranking of the importance of these issues for an organization; rather it is and proiect specific and thus will vary considerably even within the same company for different projects. We emphasize that this is a subjective process and that the example is presented to illustrate how the mapping framework can be used, NOT to establish a pattern of interpretation to be copied.
Figure 4.2: ASSESSMENT MAP EXAMPLE
HIGHER
STRATEGIC SIGNIFICANC
LOWER
Conventional 1 ".-.- Xidden costs Less Tangible Costs
L O S r S
5
Criminal Lib
Market Share
Financinl Linbility
Shareholde
Employee Health & Safetj
QUANTITATIVE
38
QUALITATIVE
Once a team has identified the project impacts that are less tangible but strategically significant, it needs to assess those impacts and incorporate them into a justification package. The following section provides guidance on some of the more common less tangible issues.
ASSESSING LESS TANGIBLE FACTORS
The Assessment Map provides a general framework for thinking about the relative importance of the various impacts of a pollution prevention project. These include effects on: product quality, productivity, public image, market share, stakeholder relations and employee health and safety. This section explains why these issues may be important and suggests ways that a project team can focus attention on them to emphasize their significance. Some of these issues, such as "public image", tend to be straightforward: the impact of a P2 project is presumed to be positive, and the question is: "to what extent and how quickly". Other issues, such as product quality, arise as (possibly) unintended consequences of the effort to reduce waste. In these cases pollution prevention changes may have either a positive or a negative impact. After determining the nature of the impact, the project team must figure out how best to communicate hlly the positive benefits, or it must consider ways to restructure the project to minimize unwanted consequences.
Product aualitv: Customers are increasingly demanding environmentally-friendly products yet are rarely willing to surrender price or quality to achieve their demands. A pollution prevention project that is detrimental to product quality (e.g., through inferior material substitution or process changes that fail to meet design specifications) will rapidly translate 'into lost sales or into increased costs of rework and downtime. Alternatively, a pollution prevention initiative may improve quality and/or enable a product to be marketed as "green", a benefit that may engender greater market acceptance and boost sales. Concerns about impacts on quality need to be addressed upfront by:
conducting sufficient engineering review and testing before specifying equipment or changing a product or process; securing guarantees by the vendor, perhaps in the form of a performance bond; planning for incremental ramp-up of production using the new process or new material; and/or securing customer feedback to determine what impact changes may have on consumer acceptance.
A project proposal should include a section on product quality that outlines possible concerns and describes in detail the measures that a team has taken to ensure that these concerns have been anticipated, addressed and resolved. Almost nothing will kill a project faster than the fear that it may harm product quality, and the justification package must allay those fears.as much as possible.
39
Impact on Productivitv/Capacitr. Process changes resulting from the implementation of a pollution prevention project could potentially increase or decrease the productivity and/or effective capacity of a plant For example, an aqueous degreaser may reduce solvent use but may require a longer cycle time to remove contaminants effectively, thereby increasing throughput time and lowering productivity On the other hand, installing new equipment to add a parallel process line might both reduce solvent use required for product changeovers and increase productive capacity As with determining effects on product quality, engineering review of new process specifications is crucial to assess a project's effect on production Thorough review should enable the impact on productivity/capacity to be estimated with sufficient accuracy to permit its inclusion in the financial analysis. If this is not possible, the potential impacts should be explored and described qualitatively, perhaps using sensitivity analysis to quantify their effect
~
~
~
Public image: The importance of an environmentally-correct image has greatly increased in the past decade, and many companies now tout their "green" credentials. For example, Sun Oil Company recently launched a major ad campaign to publicize its signing of the CERES (formerly Valdez) principles, the first Fortune 500 company to do so. While a good public image is important for its own intangible reasons, its value is increasing as the link between a company's public image and market acceptance of its products becomes stronger. Image can be especially important to a company that has suffered a paor environmental reputation. For example, Polaroid, which had received a lot of negative publicity for its toxic discharges, now promotes its pro-active strategies of pollution prevention and recycling. The company has received widespread recognition. for many of its innovative environmental programs.
Although almost any pollution prevention project can bolster the environmental record of a business, one that directly addresses a publicly-recognized problem can be especially valuable. If a proposed P2 project eliminates a source of bad publicity, such as the discharge of effluent that discolors a waterway, the public relations benefits of the project should be strongly emphasized in the justification package. To demonstrate this impact, a team might include a brief description of a similar company that used its environmental activities to strengthen its image and improve its financial position.
~
Market share he . . consumer acceptance): Numerous surveys have documented the trend of green consumerism, and companies have responded by emphasizing environmental attributes in new product development. The growing inclination of consumers to buy "green" refers to purchases of products or services that are environmentally-benign or that are offered by companies with good environmental records. A pollution prevention project that "creates" a green process or product may have a significant impact on sales, depending upon customer demand. A project justification proposal could promote the value of this factor by including survey data related to the particular industry or product type. Additionally the report could show how a specific product or company, in a similar situation or industry, either gained market share after emphasizing its green qualities or lost market share due to a poor environmental record. To hrther demonstrate
-
__
40
the significance of this issue, developing computer-generated scenarios based on experiences of similar companies could be valuable in demonstrating how even small impacts on market share can generate large returns on the bottom line .
Stakeholder relations: The term "stakeholders" can broadly include almost any person, group or organization with which a business has contact: employees, stockholders, lending institutions, customers, suppliers, surrounding communities and others. Though small, privately-held firms may not be as susceptible to shareholder pressure as large corporations, they may be equally or more sensitive to the interests of such other stakeholders as the surrounding community and employees. For businesses in small towns where they are one of the major employers, many of these interests overlap. The benefits of a pollution prevention project may affect relationships with these groups in different ways, as detailed in some of the other issues (public image, employee health and safety, market share). Generally, most firms place importance on the value of being recognized as a good neighbor. If this is an important issue to the company, it should be mentioned as part of the justification argument in a project proposal.
Emplovee health and safetv: Improving working conditions can have both substantial short and long-term benefits, including lower worker compensation rates due to safer conditions, lower health care payments, increased productivity, reduced absenteeism and reduced OSHA regulatory oversight. If a project enables immediate reductions in insurance or OSHA regulations, those projections can be incorporated into the financial analysis. Additionally, one can build support.for a project by citingthe gains other companies have realized by improving employee health and safety. Combining equipment/process specifications with occupational health and safety data can provide documentation of expected improvements in working conditions.
Pro-active environmental stratem: Environmental regulation shows a clear trend toward increasingly stringent limitations for contaminants in air emissions, wastewater, and hazardous waste. Companies that incorporate these anticipated tougher levels in their strategic planning will have advantages over those that are content to comply with current standards. P2 projects have the ability, inherent in their prevention philosophy, to position a company to meet or surpass projected future toxic use and discharge limits. A strong argument for a pollution prevention project is its capacity to alleviate such unknown factors as purchase price, disposal costs, or new health issues, that accompany the use of substances known to be environmentally damaging. A project team can mention these issues in a project justification packet and point to proposed new regulations or regulatory trends to support their arguments.
41
Financial liability: The financial liability from using and disposing of hazardous substances is potentially unlimited. One of the greatest benefits of a pollution prevention stratem is its'capacitv to reduced exposure to ootential liability: Finahcial liability may be associated with:
Disposal Storage Transportation Real property damage Civil actions Toxic tort suits Finedpenalties
Although reduction of liability can be one of the most significant advantages of a pollution prevention strategy, this benefit is usually difficult to characterize and thus may be 'undenveighted' in a project assessment. The monetary estimation of potential liability is problematic both because of the difficulty of making the estimates realistic and reliable and because of disclosure requirements by The Securities and Exchange Commission (SEC) and the Financial Accounting Standards Board (FASB). Those agencies may require companies to establish accounting reserves to cover liabilities that are expressed in monetary terms. For example, the consequences of such requirements dissuaded General Electric Corporation from hlly implementing a detailed liability model that it had developed for use in-house.
~
Companies, environmental consultants, the academic community and others have developed a variety of methods that attempt to characterize potential liability risk. These range from precise projections of financial exposure based on historical data of actual occurrences,. such as the model developed by GE, to current work at a university that attempts to use hzzy logic to translate mangers' qualitative responses into quantitative assessments. As no method has gained wide acceptance and many are complex and require considerable time and expertise to employ, it is beyond the scope of this manual to describe their design or use in detail. (For hrther information on this subject see Appendix E.) However, even without a quantitative projection, it is possible for a pollution prevention project team to develop a fairly concrete picture of the nature and potential consequences of specific sources of liability.
Liability Risk Assessment -
The following steps offer an approach to thinking about liability risk that balances the need for accurate information with the cost of conducting an analysis As with the Assessment Map above, the process described here is more a conceptual framework than it is a rigid procedure that will be applicable to all projects and conditions The use of ethyl acetate in the Wraybum case provides an example for assessing liability
-
42
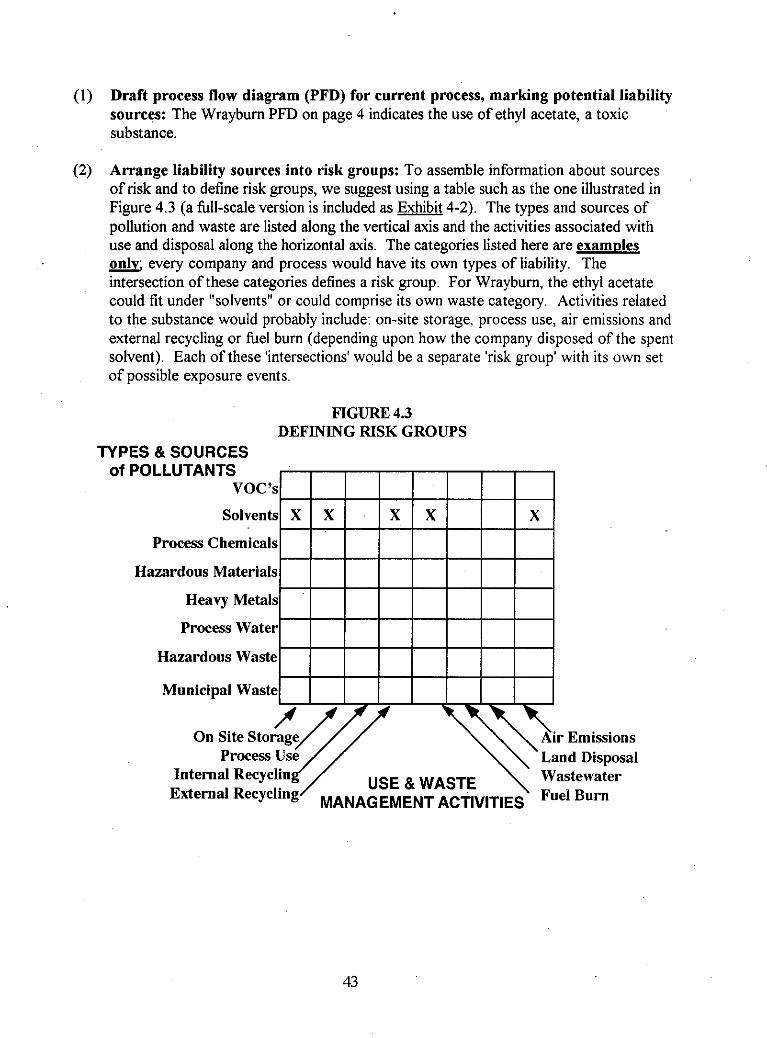
(1) Draft process flow diagram (PFD) for current process, marking potential liability sources: The Wrayburn PFD on page 4 indicates the use of ethyl acetate, a toxic substance.
(2) Arrange liability sources into risk groups: To assemble information about sources of risk and to define risk groups, we suggest using a table such as the one illustrated in Figure 4.3 (a full-scale version is included as Exhibit 4-2). The types and sources of pollution and waste are listed along the vertical axis and the activities associated with use and disposal along the horizontal axis. The categories listed here are examales & every company and process would have its own types of liability. The intersection of these categories defines a risk group. For Wrayburn, the ethyl acetate could fit under "solvents" or could comprise its own waste category Activities related to the substance would probably include: on-site storage. process use, air emissions and external recycling or fuel burn (depending upon how the company disposed of the spent solvent). Each of these 'intersections' would be a separate 'risk group' with its own set of possible exposure events.
FIGURE 4.3 DEFINING RISK GROUPS
TYPES & SOURCES of POLLUTANTS
VOC'S
Solvents
Process Chemicals
Hazardous Materials
Heavy Metals
Process Water
Hazardous Waste
Municipal Waste
On Site Storage Air Emissions Process Use Land Disposal
Wastewater Fuel Burn
External Internal Recycling Recyclin 'n MANAGEMENT ACTIVITIES USE &WASTE
43
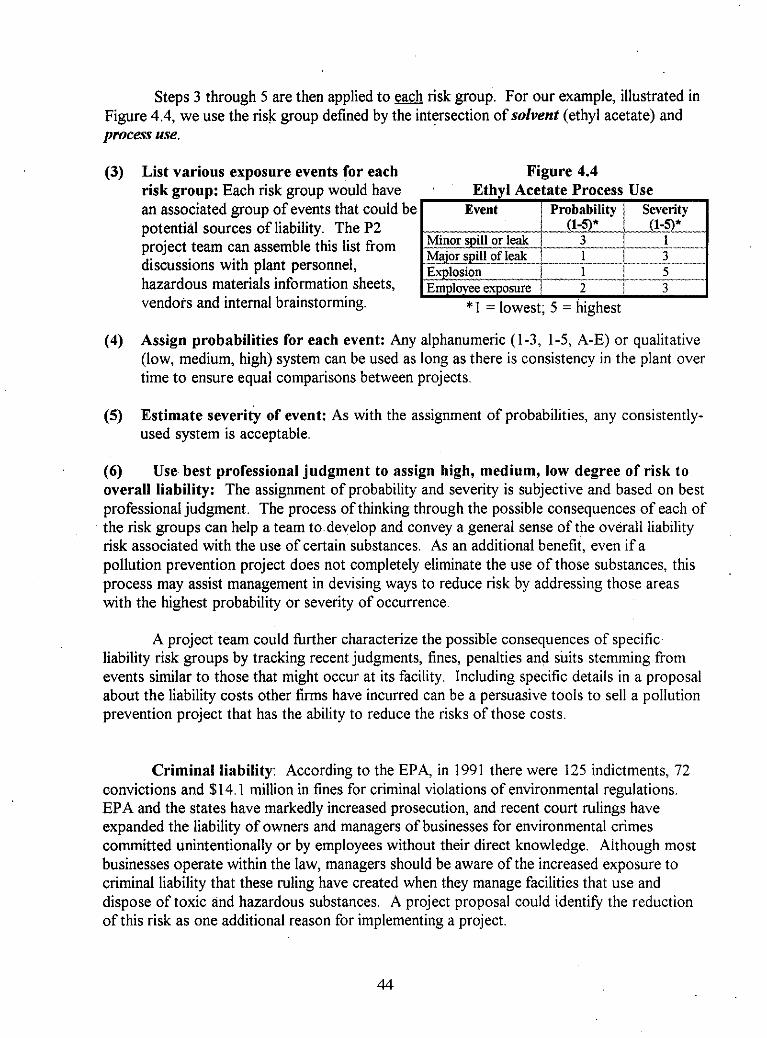
Steps 3 through 5 are then applied to & risk group. For our example, illustrated in Figure 4.4, we use the risk group defined by the intersection of solvent (ethyl acetate) and process use.
(3) List various exposure events for each Figure 4.4 risk group: Each risk group would have an associated group of events that could be
project team can assemble this list from discussions with plant personnel, hazardous materials information sheets, vendors and internal brainstorming.
Assign probabilities for each event: Any alphanumeric (1-3, 1-5, A-E) or qualitative (low, medium, high) system can be used as long as there is consistency in the plant over time to ensure equal comparisons between projects.
' Ethyl Acetate Process Use
potential sources of liability. The P2 ~
* I = lowest; 5 = highest
(4)
(5) Estimate severity of event: As with the assignment of probabilities, any consistently- used system is acceptable.
(6) overall liability: The assignment of probability and severity is subjective and based on best professional judgment The process of thinking through the possible consequences of each of the risk groups can help a team to develop and convey a general sense of the overall liability risk associated with the use of certain substances As an additional benefit, even if a pollution prevention project does not completely eliminate the use of those substances, this process may assist management in devising ways to reduce risk by addressing those areas with the highest probability or severity of occurrence
Use best professional judgment to assign high, medium, low degree of risk to
~
A project team could krther characterize the possible consequences of specific liability risk groups by tracking recent judgments, fines, penalties and suits stemming from events similar to those that might occur at its facility Including specific details in a proposal about the liability costs other firms have incurred can be a persuasive tools to sell a pollution prevention project that has the ability to reduce the risks of those costs
Criminal liability: According to the EPA, in 1991 there were 125 indictments, 72 convictions and $14.1 million in fines for criminal violations of environmental regulations. EPA and the states have markedly increased prosecution, and recent court rulings have expanded the liability of owners and managers of businesses for environmental crimes committed unintentionally or by employees without their direct knowledge. Although most businesses operate within the law, managers should be aware of the increased exposure to criminal liability that these ruling have created when they manage facilities that use and dispose of toxic and hazardous substances. A project proposal could identify the reduction of this risk as one additional reason for implementing a project.
-
__
44
PSYCHOLOGICAL BURDEN
The Successful implementation of a pollution prevention strategy has the ability to reduce the psychological burden that usually accompanies the management of environmentally-regulated processes. When a business reduces or eliminates its pollutant- causing activities to the point where it is no longer under the jurisdiction of a regulatory body, the benefit to owners and employees is immeasurable. Anyone who has received a certified letter from the EPA Supefind division, been cited by a state environmental'agency for non- compliance, or simply spent innumerable hours completing emissions reports knows how enervating such events or activities can be. A pollution prevention project that starts or drives a company along the road to "zero regulatory oversight" has a large reward as its final destination.
In some cases the initiation of a pollution prevention project can appear to add to managerial head-aches, at least in the short-term. For a company that is currently in compliance with existing regulations and has developed and instituted a sound environmental program that manages wastes in an acceptable manner, the effort, time and cost of starting a P2 project that is not mandated by regulation may seem burdensome and excessive. Proponents of a P2 project may encounter the argument: "Why rock the boat? we're in compliance now." Issues described in this section - market share, public image, employee health and safety - can offer sound arguments to promote a particular P2 project in these cases.
Responding to advances in environmental and health knowledge and technical expertise, environmental officials continue to promulgate ever-more-stringent regulations. With increased knowledge about the dangers of pollutants and refinements to the sensitivity of analytical tools to measure them, regulatory agencies correspondingly ratchet-down the allowable limits on their discharge. While regulatory compliance companies to meet tougher environmental targets, market forces are starting to &them along that path with even greater speed. Green consumerism, manufacturers' demands on suppliers, and socially responsible investing all encourage more pro-active management of environmental issues. Thus, simply being satisfied with meeting t&& compliance requirements and environmental standards will leave companies stranded in both the regulatory and competitive backwaters, while organizations with forward-looking strategies pass them by. A pollution prevention strategy can be a necessary basic ingredient both for meeting future regulatory limits and for improving the company's competitive position.
45

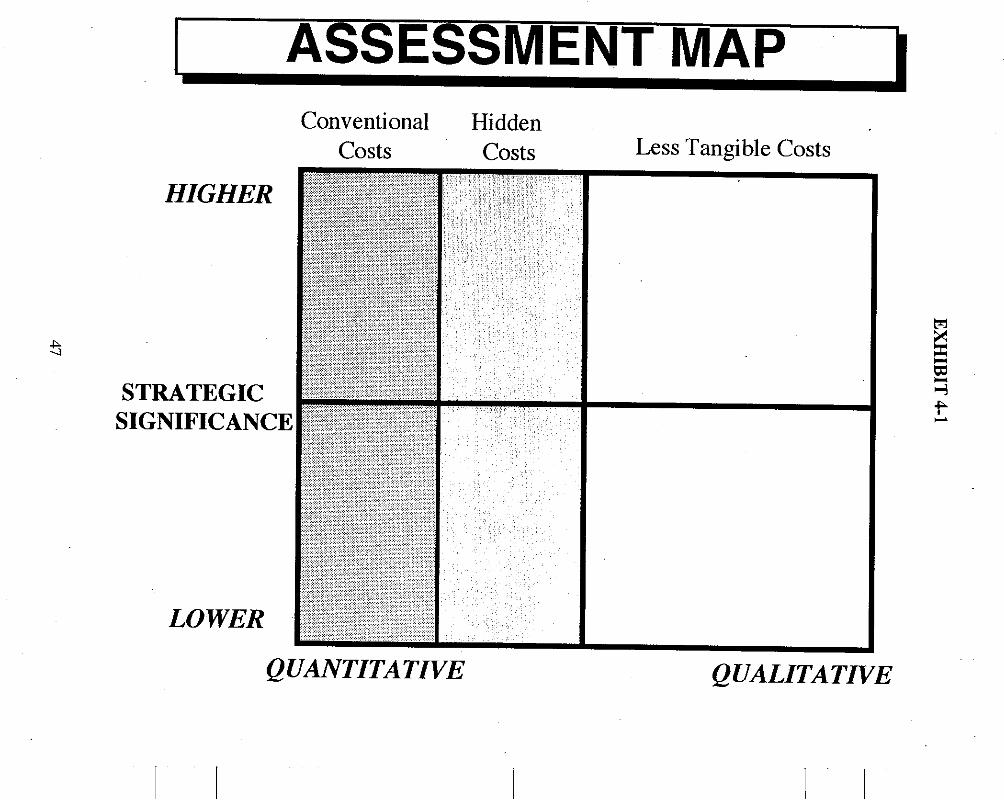
L ASSESSMENT MAP Conventional Hidden
costs costs Less Tangible Costs
HIGHER
STRATEGIC
QUANTITATIVE QUALITATIVE
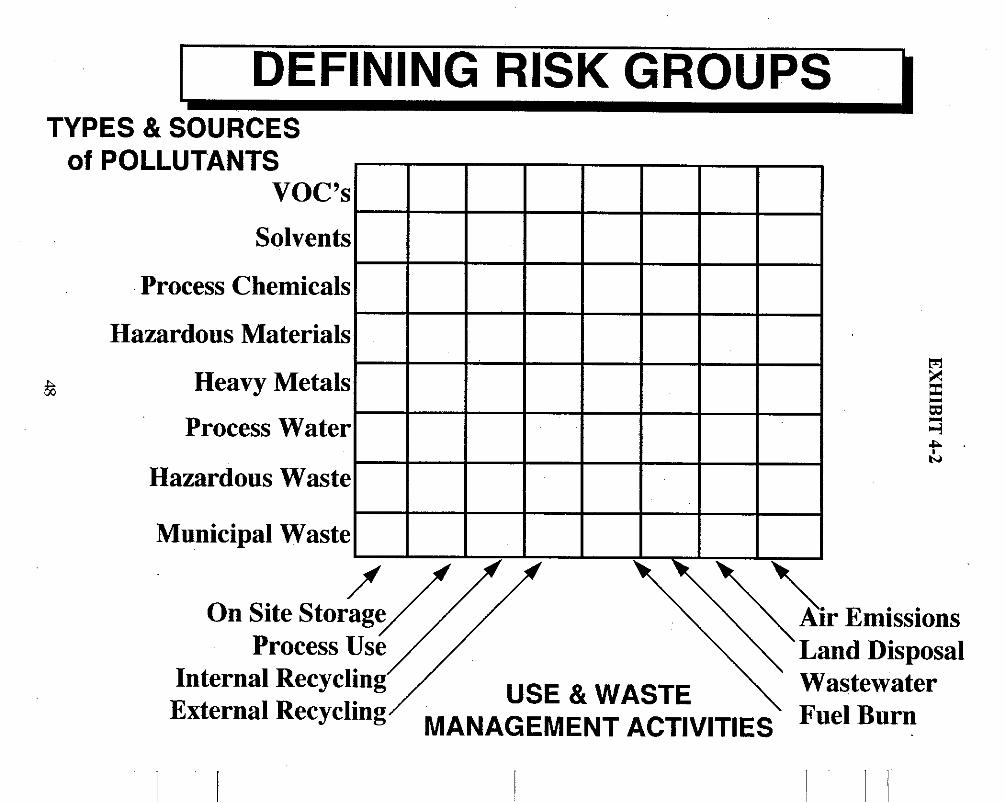
- DEFINING RISK GROUPS
SECTION 5
APPENDICES
(A) Glossary & Terminology (Bj Wrayburn Jewelry Case Study (Cj Spreadsheet Building &
Capital Budgeting with Spreadsheet Software (1-2-3 & Excel)
(Dj P2 Financial Assessment Models (E) References
49

Atmendix A - GLOSSARY & TERMINOLOGY
Financial and managerial accounting employ many specific terms in their practice. Although some are precisely defined, others acquire several different meanings as they come to be used in a variety of contexts. The advent of "environmental accounting" has exacerbated this trend, creating widely variant definitions of such terms as "hll-cost", "life-cycle'' and "cost-benefit". This Glossary & Terminology appendix presents definitions and explanations of some of the most common terms used in accounting and financial analysis.
GLOSSARY
Accounting Rate of Return - The rate of return of an investment, over its lifetime, based on the net income that the project generates. Average net income of the project divided by the initial investment.
Annuity - A level stream of equal dollar payments that exists for a fixed period of time
Capital Budgeting - The process of planning and evaluating expenditures whose returns are expected to extend beyond one year.
Depreciation - A non-cash expense that is used to allocate the cost of a piece of equipment over its economic lifetime. The only impact of depreciation is to reduce the taxable income of the firm.
Depreciation Tau Shield - This represents the tax savings that are created each year, in a profitable firm, due to depreciation. The depreciation tax shield is calculated by multiplying the annual depreciation figure by the firm's tax rate.
Discount Rate - The interest rate used to discount future cash flows to their present values. This represents the rate of return that could be earned by investing in a project with risks comparable to the project being considered. . '
Future Value - Value of a sum of money at a future date when it is grown at a periodic interest rate.
Hurdle Rate - The minimum rate of return that a project must generate in order to be accepted by the firm. Projects that provide a rate of return below this rate will not be undertaken by the firm.
Zncrenrental Cash Flows - The difference of a firm's cash flows with and without a project. Only cash flows that change with a particular project are relevant to the analysis.
Internal Rate ofReturn - The discount rate at which the net present value of an investment is zero. The JRR of a project can be compared to a firm's hurdle rate to determine economic attractiveness. The General IRR rule is: If IRRz hurdle rate then accept project. If IRR < hurdle rate then reject project.
Net Present Value - The initial investment of a project subtracted from the present value of future cash flows, discounted at the opportunity cost of capital. NPV shows how much value will be created (destroyed) if a project is undertaken by the firm. The general NPV Rule is: If NPV 2 0 then accept the project. If NPV < 0 then reject the project.
Nominal Cash Flows - A cash flow is nominal if it represents the actual dollars, adjusted for projected inflation, that are expected to be received (paid out) in future periods.
Nominal Interest Rates - The nominal interest rate is the actual rate that an investment would earn. It can be viewed as the real interest rate plus the rate of inflation (c j real interest rates).
Payback Period - The number of years required for a firm to recover a project's initial investment from the cash flows generated by that investment.
Present Value - The value of a future cash flow discounted at the appropriate interest rate.
Real Cash Fl0,vs - A cash flow is real if it is expressed in terms of current purchasing power.
Real Interest Rates - The real interest rate does not include the rate of inflation. The real rate represents how much the purchasing power of a sum of money has increased (cc nomirzal interest rate).
__ ~
~
~
TERMINOLOGY
A basic distinction is between financial and managerial accounting
Financial Accounting describes the information that a company prepares in order to report its financial performance and condition. If a company is privately-held, this information is only for the benefit of the owners and for a determination of state and federal tax liability. A publicly-owned company, however, must provide financial information to such external parties as shareholders, ,creditors, suppliers, bankers, government agencies and the general public. The form and substance of financial statements is set and revised periodically by the Financial Accounting Standards Board (FASB) and is codified as GAAP - generally accepted accounting principles. Financial accounting information is presented in three types of financial statements:
52
> Income statement: to report sales, expenses and income for a set period of time (e.g., one quarter or one year).
> Balance sheet: to report the financial condition of a company at one point in time (a snap-shot) - cash, receivables, inventory, debt, equity etc.
> Cash flow statement: to report the actual flows of cash into and out of a business during a set period of time. This statement is important because the intricacies of accounting rules often create a large disparity between the level of- shown on the income statement and the amount of actual that flows into a company.
Managerial Accounting: In contrast to financial accounting, managerial accountins is intended solely for internal use and is not required by any governmental body or regulatory agency. The objective of managerial accounting is to provide information that enables managers to make decisions that further a company's pursuit of its strategic business mission. Because companies operate in vastly different ways and use different criteria to make decisions, the structure and content of managerial accounting reports vary greatly from company to company, even within the same industry. Although managerial accounting traditionally has involved only financial information presented in terms of . costs, businesses are increasingly collecting, analyzing and using non-financial operating data in conjunction with cost information to assist in managerial decision-making. General examples of business issues for which managerial accounting information is used includes:
- strategic planning - product profitability analysis - operational control - resource utilization - tracking of quality
Cost information, with which we are concerned here, can be organized and presented in a variety of ways. Conventional managerial accounting seeks to allocate all costs incurred by an company to the products, product lines, or services produced. Costs, such as labor and materials, which are directly attributable to the production unit, are labeled direct costs. Many other costs, which are not easily attributable to particular products, are lumped together into cost pools labeled 'overhead' that are then allocated to products on the basis of a cost driver, such as labor hours or material dollars.
Activity-Based Costing: The practice of allocating overhead cost pools on the basis of labor hours made sense in the early days of industrial activity when labor was the major input of a product's cost and overhead was relatively small Today. however, in most manufacturing companies, the labor input is dwarfed by the overhead of expensive plant and equipment and large management, research and sales staff Activity-based costing (ABC) seeks to reduce the distortions to product costing caused by using such measures as labor hours to allocate large overhead pools 'overhead' costs to products on the basis of the activities that are actually performed in production For example, costs related to inventory management might be attributed to
The practice attempts to attribute
53
products on the basis of the numbers of different parts in a product. The underlying concept of activity-based costing is central to the costing of pollution prevention projects: examining the costs of activities related to particular products or processes.
Full-Cost Accounting is the term with perhaps the widest variations of use. As a strict accounting term defined by GAAP, full cost accounting refers to the requirement that a business include all costs (expenses) and revenues in its financial statements. In environmental accounting, the term denotes the practice of attributing all costs in a direct manner to products, production processes or services. The process is conceptually similar to Total Cost Assessment (TCA), a term and method developed by the Tellus Institute for analyzing P2 projects. In addition to including all costs, TCA also emphasizes a lengthening of the project lifetime in order not to omit savings that may be realized only after a project has been in place many years.
Life-Cycle Cost Analysis is now commonly used in several related but different ways. As an environmental public policy tool, life-cycle costing refers to the effort to identify and quantify the costs of all the components and inputs of a product throughout its lifetime, from research and development to final dissolution. Although the state-of-the- art of life-cycle costing is still in its infancy, this type of analysis is gaining currency in environmental debates as a means to compare the impacts and costs of competing products or materials. For example, there have been several life-cycle assessments (LCA) of disposable versus cotton diapers and of polystyrene versus paper cups.
(Modified) life-cycle costing is also a tool that companies are beginning to use to analyze the costs of a product or service over its extended economic life, including R&D and disposal. It is a more limited analysis than the public policy-driven LCA and is used for different reasons.
'
~
Cost Benefit Analysis is a public policy tool that is used to evaluate the social costs and benefits of a proposed regulation or project. Analysts assess policies by monetizing '
the positive and negative impacts through the use of historically-derived formulae. Although the term "cost benefit analysis" is occasionally used to refer to the capital budgeting process, it is not in its strict sense applicable to business decision making.
54
Appendix B - WRAYBURN JEWELRY COMPANY
Company Background
Wrayburn Jewelry is a leading US manufacturer and distributor of men's and women's jewelry, personal leather goods, and personal accessory items'. Wrayburn's major manufacturing facility is located in Sutton, a small Massachusetts town. The Sutton facility employs 400 non-union workers on the shop floor, and 100 in management positions. This facility produces the firm's line of men's and women's high fashion costume jewelry pieces, as well as private label brands.
Wrayburn has traditionally been a maternal company where working conditions are constantly upgraded so as to improve worker satisfaction. This approach has lead to a steady, well motivated and loyal workforce. This maternal attitude has also extended to the surrounding community of Sutton. The facility has always been community oriented, and has been aware of the potetitial environmental concerns of the town of Sutton and its residents. Because of this, the facility has maintained a strategy of exceeding regulatory requirements. For example, the firm was twenty years ahead of regulatory requirements when it installed its waste treatment plant. The firm was also ahead of regulations when it installed extra exhaust hoods for the comfort of employees.
In terms of the capital budgeting process, William Sutherland, the Vice President of Quality and Environmental Affairs, drafts the capital budget for the upcoming fiscal year. He presents the budget directly to the board of directors. As such, the company does not have an extensive approval process, requiring only the sign-off of the board. During the year Sutherland has the discretion to approve expenditures up to $1,000; expenditures in excess of this must be approved by corporate headquarters.
Manufacturing Process
Despite the fact that Wrayburn's jewelry designs are constantly changing, the materials used remain the same. Metal sheets are simply molded, stamped, folded or plated according to the design schematics. The plant produces two types of finishes- white and yellow. The white finishes include silver plate, rhodium and tin-based finishes. For various artistic and production reasons Wrayburn has found silver to be the most desirable metal to use for white finishes. Because silver tarnishes, however, the silver plated pieces must be lacquer dipped prior to finishing. The silver jewelry pieces are strung onto plating racks and passed through a dip lacquering system. The silver pieces are then removed from the racks, and the plating racks are stripped of the lacquer using ethyl acetate. Currently the firm purchases the ethyl acetate, uses it to exhaustion, and then pays for its disposal as a hazardous waste. (See Exhibit 1 for the facility's process flow diagram.)
We use fictitious names for the company, its employees and locations in this case study to ensure confidentiality.
55
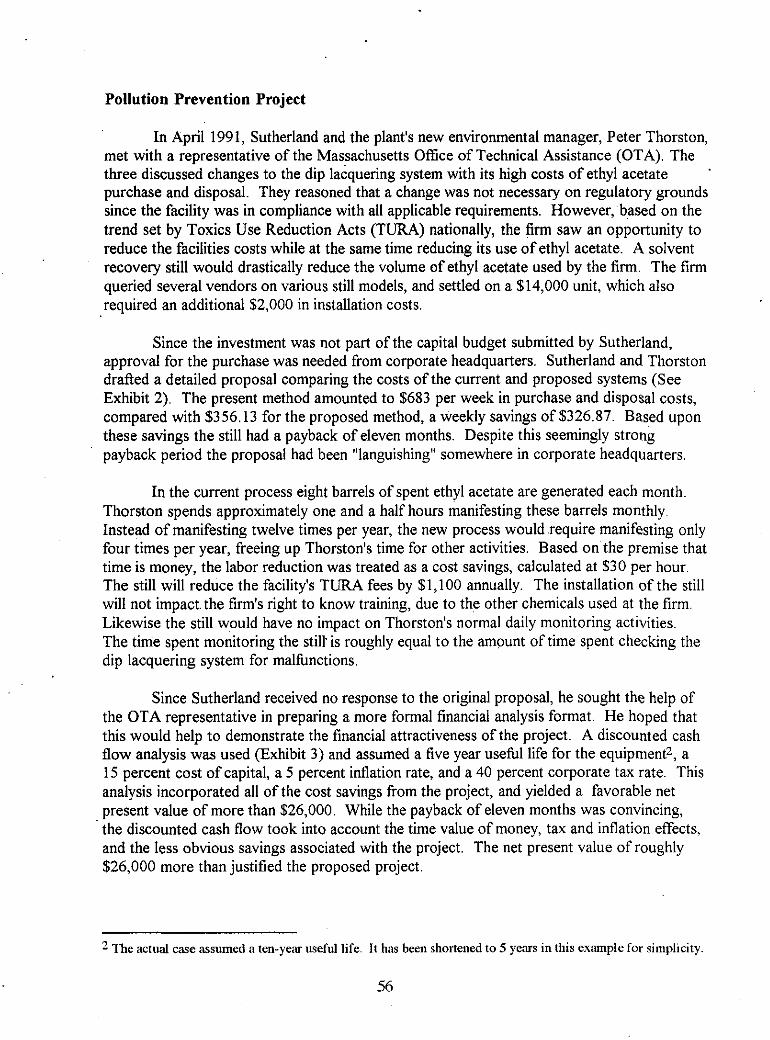
Pollution Prevention Project
In April 1991, Sutherland and the plant's new environmental manager, Peter Thorston, .~ met with a representative of the Massachusetts Office of Technical Assistance (OTA). The
three discussed changes to the dip lacquering system with its high costs of ethyl acetate purchase and disposal. They reasoned that a change was not necessary on regulatory grounds since the facility was in compliance with all applicable requirements. However,'based on the trend set by Toxics Use Reduction Acts (TURA) nationally, the firm saw an opportunity to reduce the facilities costs while at the same time reducing its use of ethyl acetate. A solvent recovery still would drastically reduce the volume of ethyl acetate used by the firm. The firm queried several vendors on various still models, and settled on a $14,000 unit, which also required an additional $2,000 in installation costs.
~
__
Since the investment was not part of the capital budget submitted by Sutherland, approval for the purchase was needed from corporate headquarters. Sutherland and Thorston drafted a detailed proposal comparing the costs of the current and proposed systems (See Exhibit 2). The present method amounted to $683 per week in purchase and disposal costs, compared with $356.13 for the proposed method, a weekly savings of $326.87. Based upon these savings the still had a payback of eleven months. Despite this seemingly strong payback period the proposal had been "languishing" somewhere in corporate headquarters.
In the current process eight barrels of spent ethyl acetate are generated each month. Thorston spends approximately one and a half hours manifesting these barrels monthly. Instead of manifesting twelve times per year, the new process would require manifesting only four times per year, freeing up Thorston's time for other activities. Based on the premise that time is money, the labor reduction was treated as a cost savings, calculated at $30 per hour. The still will reduce the facility's TURA fees by $1,100 annually. The installation of the still will not impact.the firm's right to know training, due to the other chemicals used at the firm. Likewise the still would have no impact on Thorston's normal daily monitoring activities. The time spent monitoring the still' is roughly equal to the amount of time spent checking the dip lacquering system for malfunctions.
~
Since Sutherland received no response to the original proposal, he sought the help of the OTA representative in preparing a more formal financial analysis format. He hoped that this would help to demonstrate the financial attractiveness of the project. A discounted cash flow analysis was used (Exhibit 3) and assumed a five year useful life for the equipment', a 15 percent cost of capital, a 5 percent inflation rate, and a 40 percent corporate tax rate. This analysis incorporated all of the cost savings from the project, and yielded a favorable net present value of more than $26,000. While the payback of eleven months was convincing, the discounted cash flow took into account the time value of money, tax and inflation effects, and the less obvious savings associated with the project. The net present value of roughly $26,000 more than justified the proposed project.
-
* The actual case assumed a ten-year useful life. I t has been shortened to 5 years in this example for simplicity
56
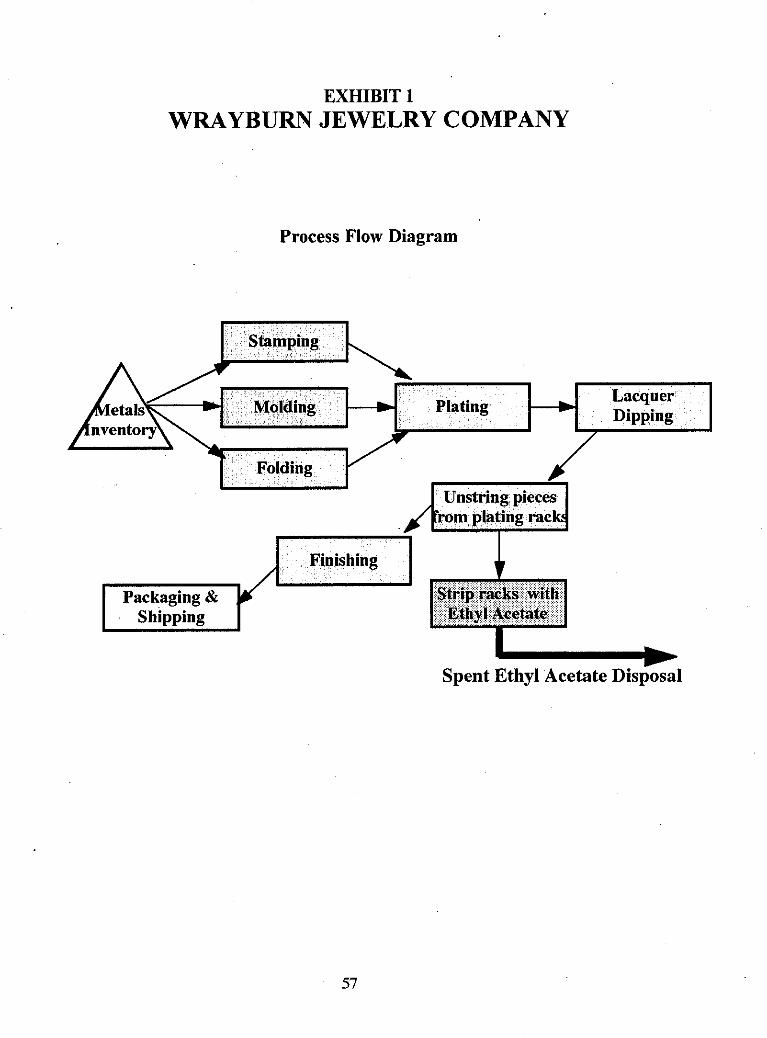
EXHIBIT 1 WRAYBURN JEWELRY COMPANY
Process Flow Diagram
Spent Ethyl Acetate Disposal
57
EXHIBIT 2 WRAYBURN JEWELRY COMPANY
Cost Savings for Ethyl Acetate Still
CURRENT METHOD: Purchase/UselDisposaI
Purchase Costs: Current consumption of ethyl acetate stripping:
600 - 700 racks per day = 100 gals/wk Density = 7.8 Ibs./gal. Weekly purchases in pounds = 780 Ibs. Cost of new ethyl acetate = $0.61 per Ib. Weekly cost to purchase ethyl acetate = $0.61 x 780 = > > $475.80
Disuosal Costs: Evaporatioddragout losses = 5% Current weekly disposal volume = total purchased volume less 5% =
.95 x 780 = 740lbdweek Disposal cost of spent ethyl. acetate = $0.28 per Ib. Weekly cost to dispose of ethyl acetate = .28 x 740 Ibs = > > $207.20
Total current weekly cost for ethyl acetate > > > > $683.00
PROPOSED METHOD: Purchasehtecover In-housemake-up as required. Purchase of solvent still will permit recovery of approximately 75% ethyl acetate, disposal of balance as still bottoms.
Purchase Costs: Purchase cost of ethyl acetate per week =
.25 x 780lbs/week x $ 0.61 195 Ibs. x $0.58 = > > > > > > $118.95
Disuosal Costs: Disposal volume of still bottoms =
.25 x 740 Ibs./wk = 185 lbs/wk
Disposal cost of still bottoms estimated @ $ 1 28 per Ib (Note disposal cost of - still bottoms is significantly higher because recyclable product has been removed
Weekly disposal cost of still bottoms = ~
185 Ibs x $ 128fib = > > > > > > $237.18
Total proposed weekly cost for ethyl acetate > > > > $356.13 _----_---__
58
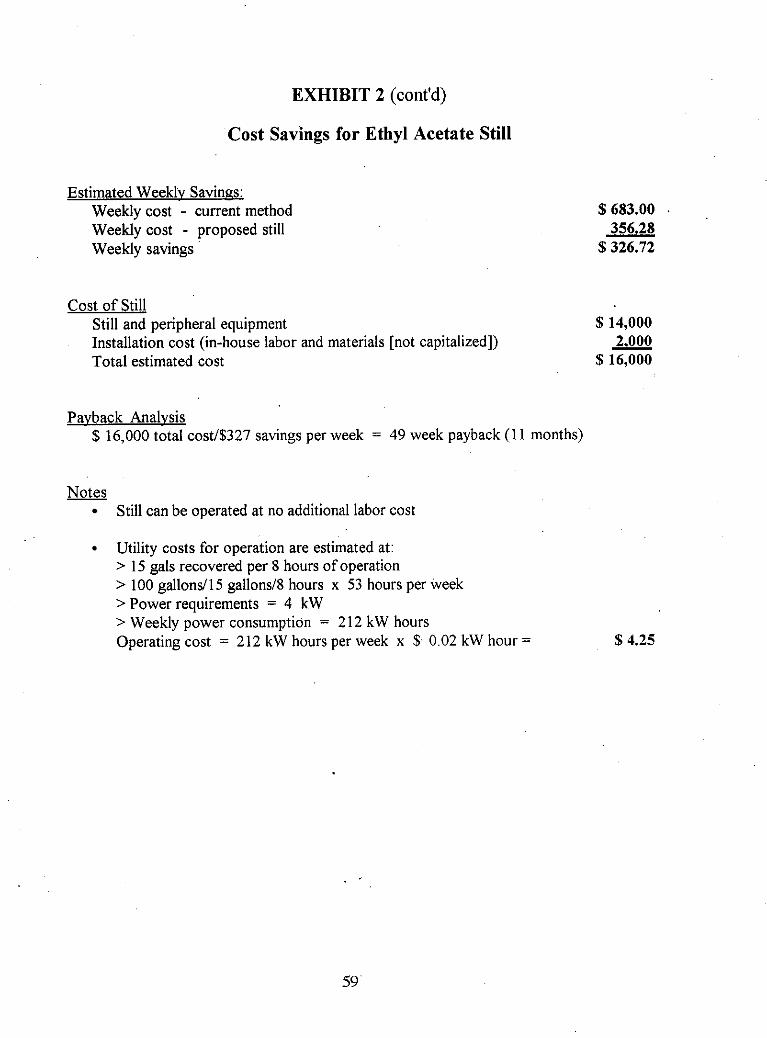
EXHIBIT 2 (cont'd)
Cost Savings for Ethyl Acetate Still
Estimated Weeklv Savings: Weekly cost - current method Weekly cost - proposed still Weekly savings
Cost of Still Still and peripheral equipment Installation cost (in-house labor and materials [not capitalized]) Total estimated cost
$683.00 356.28
$326.7'2
Pavback Analvsis $ 16,000 total costB327 savings per week = 49 week payback (1 1 months)
$14,000
$ 16,000 t.000
Notes Still can be operated at no additional labor cost
Utility costs for operation are estimated at: > 15 gals recovered per 8 hours of operation > 100 gallondl5 gallons/8 hours x 53 hours per week > Power requirements = 4 kW > Weekly power consumption = 212 kW hours Operating cost = 212 kW hours per week x $ 0.02 kW hour = $4.25
59 '
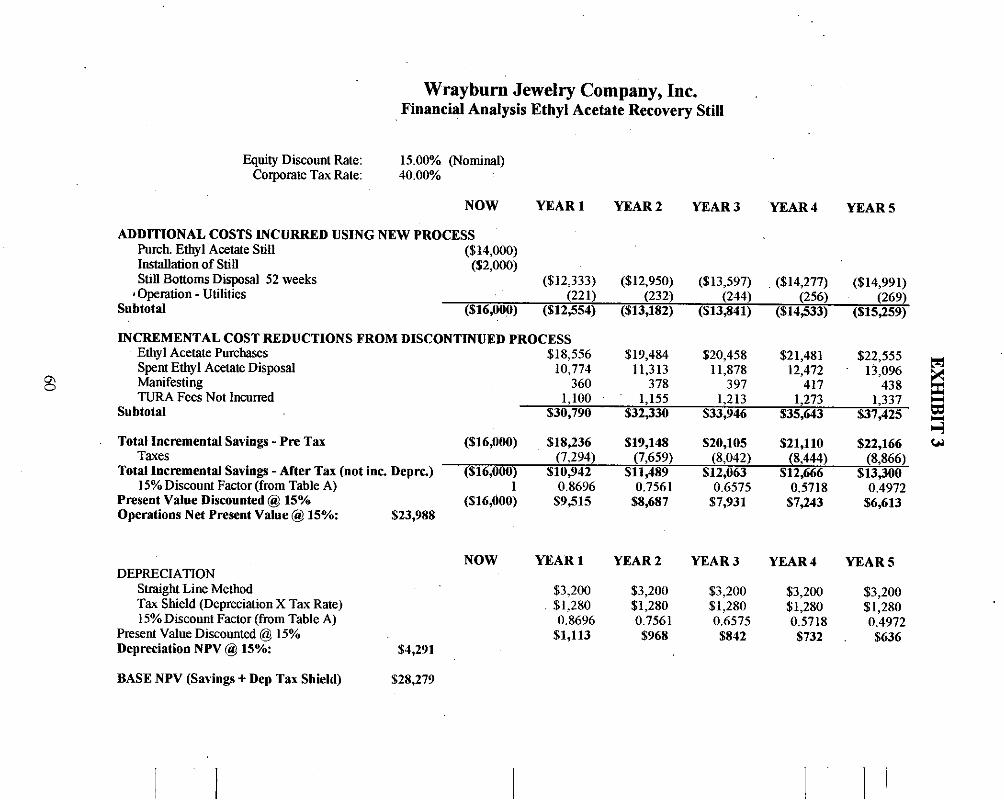
Wrayburn Jewelry Company, Inc. Financial Analysis Ethyl Acetate Recovery Still
Equity Discount Rate: 15.00% (Nominal) Corporate Tax Rate: 40.00%
NOW YEAR1 YEAR2 YEAR3 YEAR4 YEAR5
ADDITIONAL COSTS INCURRED USING NEW PROCESS h c h Ethyl Acetate Still ($14,000) Installation of Still ($2.000) Still Bottoms Disposal 52 weeks ($12,333) ($12,950) ($13,597) ($14,277) ($14,991)
8 Operation - Utilities (221) (232) (244) (256) (269) Subtotal ($l6,000) (512,554) ($13,182) ($13,841) ($14333) (S15JJ9)
INCREMENTAL COST REDUCTIONS FROM DISCONTINUED PROCESS Ethyl Acetate Purchases $18,556 $19,484 $20,458 $21,481 $22,555
13,096 438
Spent Ethyl Acetate Disposal 10,774 11,313 11,878 12,472 M e s t i n g 360 378 397 417
Subtotal $30,790 532,330 $33,946 535,643 $37,425
Ca 0
B 3
TURA Fees Not Incurred 1,100 1,155 1,213 1,273 1,337
Total Incremental Savings - Pre Tax ($16,000) $18,236 519,148 $20,105 $21,110 $22,166 W
Total Incremental Savings -After Tax (not inc. Depre) (516,000) %10,942 $11.489 512.063 $12.666 $13300 Taxes (7,294) (7,659) (8,042) (8,444) (8,866) .~ ~ ~
- . .~ .~~ 15% Discount Factor (from Table A) i 0.8696 0.7561 0.6575 0.5718 0.4972
Present Value Discounted @ 15% ($16,000) $9,515 $8,687 $7,931 S7J43 $6,613 Operations Net Present Value @ 15%: $23,988
DEPRECIATION Straight Line Method Tax Shield (Depreciation X Tax Rate) 15%Discount Factor (from Table A)
Present Value Discounted @ 15% Depreciation NPV @ 15%: $1,291
BASE NPV (Savings + Dep Tax Shield) $28,279
NOW YEAR1 YEAR2 YEAR3 YEAR4 YEARS
$3,200 $3,200 $3,200 $3,200 $3,200 $1,280 $1,280 $1,280 $1,280 $1,280 0.8696 0.7561 0.6575 0.5718 0.4972 $1,113 $968 5842 $732 . $636
I ' I
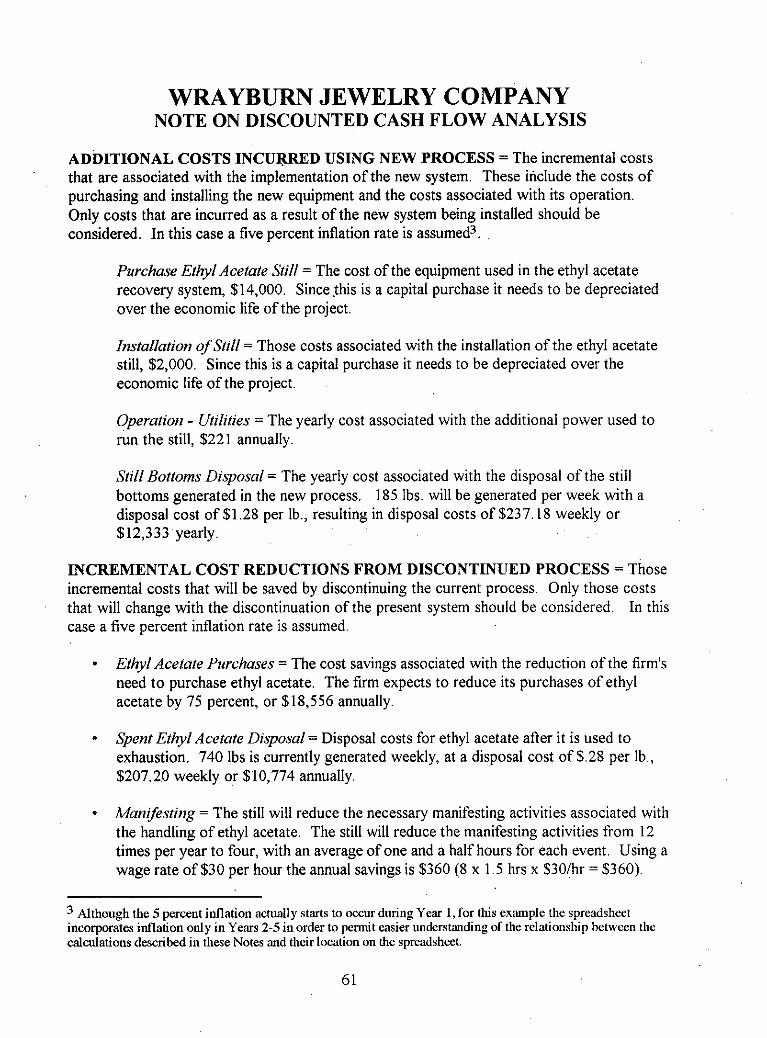
WRAYBURN JEWELRY COMPANY NOTE ON DISCOUNTED CASH FLOW ANALYSIS
ADDITIONAL COSTS INCURRED USING NEW PROCESS = The incremental costs that are associated with the implementation of the new system. These include the costs of purchasing and installing the new equipment and the costs associated with its operation. Only costs that are incurred as a result of the new system being installed should be considered, In this case a five percent inflation rate is assumed3.
Purchase Ethyl Acetate Still = The cost of the equipment used in the ethyl acetate recovery system, $14,000. Since this is a capital purchase it needs to be depreciated over the economic life of the project.
Installation of Still = Those costs associated with the installation of the ethyl acetate still, $2,000. Since this is a capital purchase it needs to be depreciated over the economic life of the project.
Operation - Utilities = The yearly cost associated with the additional power used to run the still, $221 annually.
StillBottonzs Disposal = The yearly cost associated with the disposal of the still bottoms generated in the new process. 185 Ibs. will be generated per week with a disposal cost of $1.28 per Ib., resulting in disposal costs of $237.18 weekly or $12,333 yearly.
INCREMENTAL COST REDUCTIONS FROM DISCONTINUED PROCESS = Those incremental costs that will be saved by discontinuing the current process. Only those costs that will change with the discontinuation of the present system should be considered. In this case a five percent inflation rate is assumed.
* Ethyl Acetate Purchases = The cost savings associated with the reduction of the firm's need to purchase ethyl acetate. The firm expects to reduce its purchases of ethyl acetate by 75 percent, or $18,556 annually.
Spent Ethyl Acetate Disposal = Disposal costs for ethyl acetate after it is used to exhaustion. 740 lbs is currently generated weekly, at a disposal cost of $28 per Ib., $207.20 weekly or $10,774 annually.
Manifesting = The still will reduce the necessary manifesting activities associated with the handling of ethyl acetate. The still will reduce the manifesting activities from 12 times per year to four, with an average of one and a half hours for each event. Using a wage rate of $30 per hour the annual savings is $360 (8 x 1.5 hrs x $30/hr = $360).
Although the 5 percent iilnatioti actually starts to occur during Year I , for this example the spreadsheet incorporates iflation only in Years 2-5 in order to permit easier understanding of the relationship between the calculations described in these Notes and their location on the spreadsheet.
61
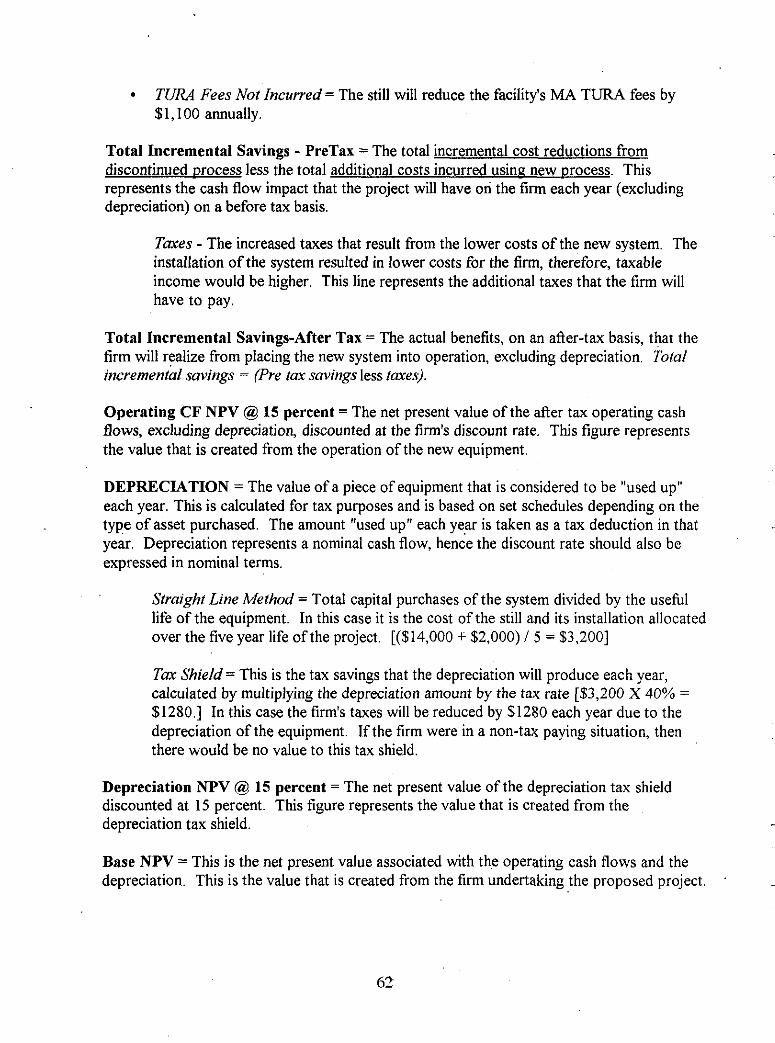
TURA Fees Not Incurred = The still will reduce the facility's MA TURA fees by $1,100 annually.
Total Incremental Savings - PreTax = The total incremental cost reductions from .~
discontinued Drocess less the total additional costs incurred using new Drocess. This represents the cash flow impact that the project will have on the firm each year (excluding depreciation) on a before tax basis.
~
~
Tuxes - The increased taxes that result from the lower costs of the new system. The installation of the system resulted in lower costs for the firm, therefore, taxable income would be higher. This line represents the additional taxes that the firm will have to pay.
Total Incremental Savings-After Tax = The actual benefits, on an after-tax basis, that the firm will realize from placing the new system into operation, excluding depreciation. Total incremental savings = (Pre tux savings less taxes).
Operating CF NPV @. 15 percent = The net present value of the after tax operating cash flows, excluding depreciation, discounted at the firm's discount rate. This figure represents the value that is created from the operation of the new equipment.
DEPRECIATION = The value of a piece of equipment that is considered to be "used up" each year. This is calculated for tax purposes and is based on set schedules depending on the type of asset purchased. The amount "used up" each year is taken as a tax deduction in that year. Depreciation represents a nominal cash flow, hence the discount rate should also be expressed in nominal terms.
__
Strnzght Line Method = Total capital purchases of the system divided by the useful life of the equipment. In this case it is the cost of the still and its installation allocated over the five year life ofthe project. [($14,000 f $2,000) / 5 = $3,2001
Tax Shield = This is the tax savings that the depreciation will produce each year, calculated by multiplying the depreciation amount by the tax rate [$3,200 X 40% = $1280.1 In this case the firm's taxes will be reduced by $1280 each year due to the depreciation of the equipment. If the firm were in a non-tax paying situation, then there would be no value to this tax shield.
Depreciation NPV @. 15 percent = The net present value of the depreciation tax shield discounted at 15 percent. This figure represents the value that is created from the depreciation tax shield.
Base NPV = This is the net present value associated with the operating cash flows and the depreciation. This is the value that is created from the firm undertaking the proposed project. '
~
62
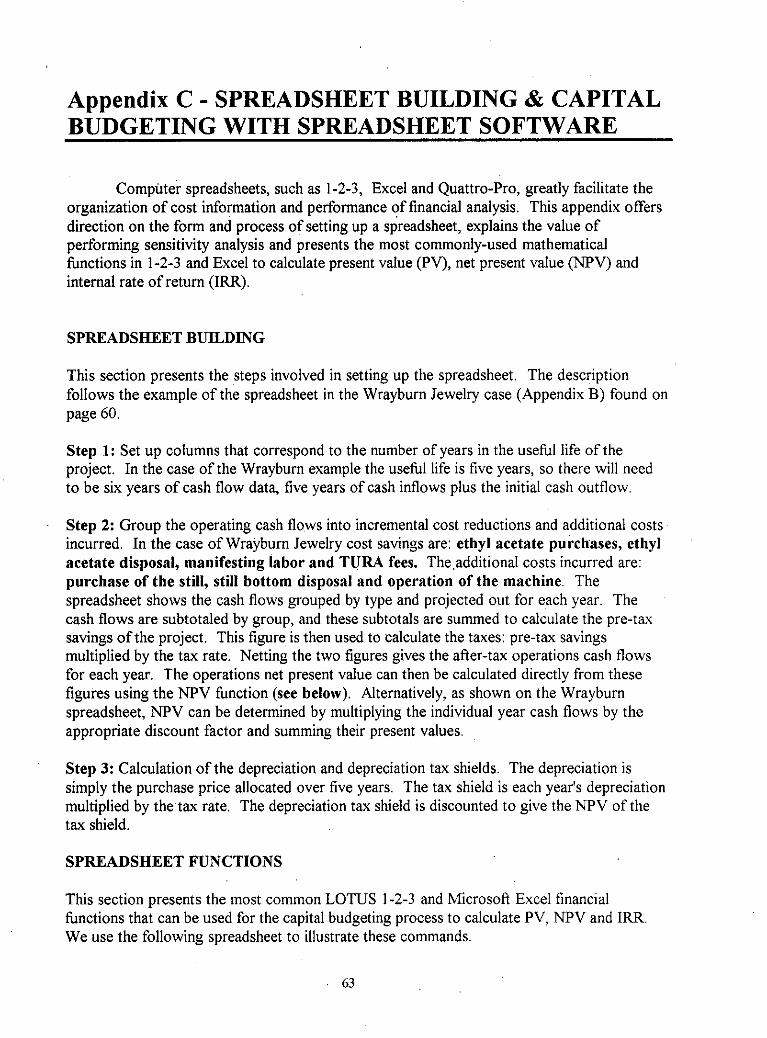
Appendix C - SPREADSHEET BUILDING & CAPITAL BUDGETING WITH SPREADSHEET SOFTWARE
Computer spreadsheets, such as 1-2-3, Excel and Quattro-Pro, greatly facilitate the organization of cost information and performance of financial analysis. This appendix offers direction on the form and process of setting up a spreadsheet, explains the value of performing sensitivity analysis and presents the most commonly-used mathematical functions in 1-2-3 and Excel to calculate present value (PV), net present value (NPV) and internal rate of return (IRR).
SPREADSHEET BUILDING
This section presents the steps involved in setting up the spreadsheet. The description follows the example of the spreadsheet in the Wrayburn Jewelry case (Appendix B) found on page 60.
Step 1: Set up columns that correspond to the number of years in the useful life of the project. In the case of the Wrayburn example the usehl life is five years, so there will need to be six years of cash flow data, five years of cash inflows plus the initial cash outflow.
Step 2: Group the operating cash flows into incremental cost reductions and additional costs incurred. In the case of Wrayburn Jewelry cost savings are: ethyl acetate purchases, ethyl acetate disposal, manifesting labor and TURA fees. The.additiona1 costs incurred are: purchase of the still, still bottom disposal and operation of the machine. The spreadsheet shows the cash flows grouped by type and projected out for each year. The cash flows are subtotaled by group, and these subtotals are summed to calculate the pre-tax savings ofthe project. This figure is then used to calculate the taxes: pre-tax savings multiplied by the tax rate. Netting the two figures gives the after-tax operations cash flows for each year. The operations net present value can then be calculated directly from these figures using the NPV hnction (see below). Alternatively, as shown on the Wrayburn spreadsheet, NPV can be determined by multiplying the individual year cash flows by the appropriate discount factor and summing their present values.
Step 3: Calculation of the depreciation and depreciation tax shields. The depreciation is simply the purchase price allocated over five years. The tax shield is each year's depreciation multiplied by the tax rate. The depreciation tax shield is discounted to give the NPV of the tax shield.
SPREADSHEET FUNCTIONS
This section presents the most common LOTUS 1-2-3 and Microsol? Excel financial functions that can be used for the capital budgeting process to calculate PV. NPV and IRR We use the following spreadsheet to illustrate these commands.
63
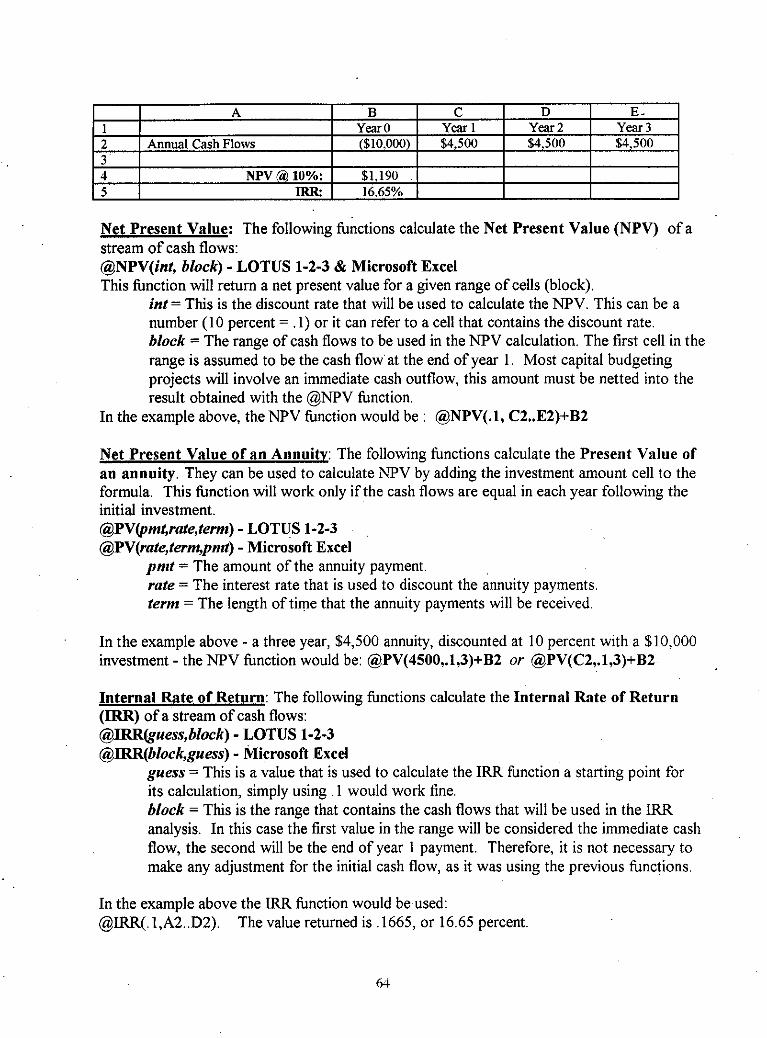
Net Present Value: The following functions calculate the Net Present Value (NPV) of a stream of cash flows: @NPV(inf, block) - LOTUS 1-2-3 & Microsoft Excel This hnction will return a net present value for a given range of cells (block).
inf = This is the discount rate that will be used to calculate the NPV. This can be a number (10 percent = .1) or it can refer to a cell that contains the discount rate. block = The range of cash flows to be used in the NPV calculation. The first cell in the range is assumed to be the cash flow'at the end of year 1. Most capital budgeting projects will involve an immediate cash outflow, this amount must be netted into the result obtained with the @NPV function.
In the example above, the NPV function would be : @NPV(.l, C2..E2)+B2
Net Present Value of an Annuitv: The following hnctions calculate the Present Value of an annuity. They can be used to calculate NPV by adding the investment amount cell to the formula. This fimction will work only if the cash flows are equal in each year following the initial investment. @PV@mf,rate,term) - LOTUS 1-2-3 @PV(rate,tmm,pmt) - Microsoft Excel
pnif = The amount of the annuity payment. rafe = The interest rate that is used to discount the annuity payments. ferm = The length of time that the annuity payments will be received.
In the example above - a three year, $4,500 annuity, discounted at 10 percent with a $10,000 investment - the NPV function would be: @PV(4500,.1,3)+B2 or @PV(C2,.1,3)+B2
Internal Rate of Return: The following functions calculate the Internal Rqte of Return (IRR) of a stream of cash flows: @JRR@uess,block) - LOTUS 1-2-3 @IRR(block,guess) - Microsoft Excel
guess = This is a value that is used to calculate the IRR hnction a starting point for its calculation, simply using , 1 would work fine. block = This is the range that contains the cash flows that will be used in the IRR analysis. In this case the first value in the range will be considered the immediate cash flow, the second will be the end of year 1 payment. Therefore, it is not necessary to make any adjustment for the initial cash flow, as it was using the previous functions.
In the example above the IRR function would be used: @IRR(.I,M..D2). The value returned is ,1665, or 16.65 percent
Heloful Hints
Have the computer do the work for you, performing as many of the calculations 'as possible. Take time to plan out how the spreadsheet will work, this will help you understand the formulas that will need to be used. Annual cash flows should be set up so that only the first year's cash flows are entered. All others should be calculated by multiplying the previous year's cash flow by one plus the inflation rate. Input the discount rate at the top of the spreadsheet, and calculate NPV by referencing that cell as the discount rate. This will assure that both components are always using the same rate. Follow the same logic as above when calculating taxes and tax shields. By changing the one tax rate at the top all tax information in the spreadsheet will change. Do some of the calculations by hand or by alternate methods to double check that the spreadsheet is working correctly. For example, as shown in the Wrayburn example, you can calculate NPV by using the NPV function and by summing the present values of all the cash flows. The answers should be identical (except for the effects of rounding)
SENSITIVITY ANALYSIS
A cleanly printed computer spreadsheet has the power to lend deceptive legitimacy to the numbers of a financial analysis. Thus, it is essential to keep in mind that the components of capital budgeting are inherently based on assumptions and estimates. If the projections turn out to be unrealistic, then it is important to know what type of impact this could have on the evaluation of the project. One of the major benefits of using a computer spreadsheet is the capability to quickly change the assumptions in order to evaluate a project under a different set of conditions. This process, known as sensitivity analysis, can be an important tool to understand the margin of error of the various assumptions involved in the project.
If cash flows can be reduced by 30 percent, and the project still yields a positive NPV, then the analyst can feel fairly comfortable with that component. However, if the financial attractiveness of the project is impacted by a five percent decrease in cash flows, then the analyst might want to re-examine the cash flow estimates to determine how reasonable they are. In addition to cash flows, the analyst can examine the impact of changes in discount rates, tax rates and the useful life of the project. By performing the sensitivity analysis, the analyst can determine the factors to which the assessment is most sensitive and can take extra care to ensure that these factors are realistic and accurate.
65

Appendix D - P2 FINANCIAL ASSESSMENT MODELS
Corporate, consulting, academic and regulatory organizations have all developed standardized models that businesses can use to perform pollution prevention (P2) project assessments. While some of the models employ manual worksheets, others are computer- driven, simplifying the data input and calculation process. Both kinds offer clear benefits, especially to those inexperienced in assessing P2 projects:
- Ease of use: Some models lead users through the cost collection and evaluation process in a step-by-step procedure that makes the assessment easy to complete. Comorehensive lists of potential costs and savings: These lists are useful to make sure that all potential items have been addressed.
It is important that users understand the underlying concepts and methods of these models and be aware that sometimes the structured formats may constrain or limit the parameters of an assessment and lead to the omission of potentially important information.
NEWMOA and MA OTA do not endorse any of the following models. These brief descriptions are presented for those interested in obtaining more information. The TELLUS model - PZFINANCE - has been licensed by several states agencies in the Northeast and may be available through:
Maine Department of Environmental Protection (ME DEP) Massachusetts Toxics Use Reduction Institute (MA TUN) New Jersey Department of Environmental Protection and Energy (NJ DEPE) *
(1) TELLUS - PZ/FINANCE
Overview: PZMJNANCE is a spreadsheet software system designed for data collection and analysis essential to a comprehensive financial evaluation of pollution prevention projects. The system uses a Total Cost Assessment (TCA) approach, which differs from conventional practices in four key ways: a broader inventory of cost and savings; allocation of all costs and savings to specific process and product lines rather than to overhead accounts; expanded time horizons for the capture of long-term benefits; and the use of profitability indicators that incorporate the time value of money. PZFINANCE is a flexible tool designed to complement a company's existing project evaluation practices while ensuring that prevention investments receive balanced and unbiased treatment during the capital budgeting process. For companies or projects with no formal budgeting process, P2RINANCE offers a valuable starting point for introducing a TCA approach.
Computer requirements: Excel Version 4.0 for Windows or Lotus 1-2-3 for DOS Version 3 1 (or higher).
IBM-compatible computer capable of running either Microsoft
61
For further information please contact: Dr. Deborah E. Savage Dr. Allen L. White TELLUS Institute 11 Arlington Street Boston, MA 021 16-341 1 (617) 266-5400 fax: 266-8303
(2) GENERAL ELECTRIC - FINANCIAL ANALYSIS OF WASTE MANAGEMENT ALTERNATIVES
Overview: The stated purpose of the GE method is "...to aid professionals in selecting and justifying waste management investment decisions which are both environmentally sound and reduce GE's long-term liabilities." The method, designed to be used at the plant level by process and environmental engineers working with financial professionals, was developed as a tool to help the user identify possible options for waste minimization and focus on the most profitable projects. Direct and potential liability costs associated with current and alternative waste management practices are identified, quantified and compared to evaluate the economic viability of waste minimization investments.
Computer requirements: IBM-compatible microcomputer with Lotus 1-2-3 version 2.01.
For further information please contact: Jean Lebedeff General Electric Company 3 135 Easton Turnpike Mail Drop WlL Fairfield, CT 0643 1 (203) 373-3078
(3)
Overview: The stated purpose ofthe manual "...is to promote a complete objective analysis of the economic benefits of pollution prevention projects" The manual further states. "This manual enables you to calculate the true cost of the current materials and waste management practice and then evaluate the financial payback of the P2 alternative." The EPA method establishes a hierarchy of costs, arranged in increasing uncertainty, as follows:
POLLUTION PREVENTION BENEFITS MANUAL (U.S. EPA)
Tier 0 - Usual Costs Tier 1 - Hidden Costs Tier 2 - Liability Costs Tier 3 - Less Tangible Costs
i.e. equipment, labor, materials i.e. compliance and permits i.e. penalties/fines and hture liabilities Le. consumer responses and employee relations
68
At each tier, the user calculates all costs associated with the current process and the alternative pollution prevention project and then estimates key financial indicators of the economic viability of the project for that tier. The evaluation is performed incrementally with the results added a tier at a time until the assessment concludes that the project is viable or until all tiers have been completed.
For further information please contact Dr. Ron McHugh U.S. EPA 401 M Street SW Washington, DC 20460 (202) 382-2693
(4) PRECOSIS
Overview: PRECOSIS, consisting of a set of programs and a user's manual, is intended to "support analysis of financial advantage in waste reduction schemes." The software was designed to support participants at a series of seminars on waste minimization sponsored by the U.S. Environmental Protection Agency in 1989. The method has since been enhanced and placed in general distribution under license by the George Beetle Company. The software is a menu-driven program consisting of ten data input tables and two output reports containing financial calculations.
Computer requirements: IBM-compatible microcomputer with 5 12 kilobytes of memory
For further information please contact: George Beetle Company 533 Arbutus Street Philadelphia, PA 191 19 (215) 438-0598
69

Appendix E - REFERENCES
Listings are alphabetical by author, or by publication or organization if author is unknown or anonymous.
1.
2.
3.
4.
5 .
6.
7.
8.
9.
10.
11.
12.
American Institute for Pollution Prevention. A Primer for Financial Analvsis of Pollution Prevention Proiects, 1992
Bailey, Paul. "Life-Cycle Costing and Pollution Prevention", Pollution Prevention m, Winter 1990/91, pp. 27-39.
Brealey, R. A,, S.C. Myers. Princioles of Coroorate Finance. 4th ed. New York: McGraw-Hill, Inc. 1991.
Cooper, Robin. "Implementing an Activity-Based Cost System". Handbook of Cost Management, Spring 1990, pp. 33-41.
Cunningham, Virginia, James Patterson, and Joseph McGough. Environmental Cost Analvsis Svstem. Van Nostrand Reinhold Company, New York, 1986.
Department of Health Services Toxic Substances Control Division, Alternative 'Technology Section. "Economic Implications of Waste Reduction, Recycling, Treatment and Disposal of Hazardous Wastes". July 1988.
Dharmavaram, Seshasayi, J. Brian Mount, and Bernard Donahue. "Automated Economic Analysis Model for Hazardous Waste Minimization". Journal of Air and Waste Manaeement Association, Vol. 40 No. 7, July 1990.
Executive Enterprises Publications, Co. Understanding Environmental Accounting & Disclosure Todax 1992.
Feller, Robert H. "Securities and Exchange Commission and environmental disclosure", Journal of Production, Vol. 1 No. 2 1993.
Fromm, Carl and David Butler, Jacobs Engineering Group. "Practical Guidelines for Estimating the Profitability of Waste Minimization Measures", unpublished.
General Electric Corporate Environmental Programs. Financial Analvsis of Waste Management Alternatives, 1987.
Gibby, Daniel, "Accounting: Environmental Liability Exposure: How Will It Effect Your Financial Statement?", Corporate Controller, Vol. 5, No. 1 Sept/Oct. 1992, pp.
~
48-50
71
13.
14.
15.
16.
17.
18.
19.
20.
21.
22.
23.
24.
25.
26.
27.
Hayes, R.H., K.B. Clarke and S.C. Wheelwright. Dynamic Manufacturing. New York: The Free Press, 1988.
(The) Hazardous Waste Consultant, "Economic Justification for Waste Minimization Projects", Novembermecember 1989, pp 1-22 - 1-23.
Helfand, Gloria. The Simule Economics of Pollution Prevention The Council of Environmental Quality, 1992.
Higgins, Robert. Analvsis for Financial Manaeement, Irwin: Boston, MA, 1992
ICF Consulting Associates Inc. "Economic Incentives for the Reduction of Hazardous Wastes: Final Report", December 1985.
Kaplan R. S., A. A. Atkinson. Advanced Manaeement Accounting. Englewood Cliffs, NJ: Prentice Hall 1989.
Kennedy, Mitchell L. "Getting to the Bottom Line: How TCA Shows the Real Cost of Solvent Substitution," Pollution Prevention Review, Spring 1994.
Lis, James, and Kenneth Chilton. The Limits of Pollution Prevention. Center for the Study of American Business, 1992.
MacLean, Richard W. "Economics of Waste Minimization", presented at the Waste Minimization and Clean Technoloev: Moving Toward the 2 1st Centuw Conference, May 10, 1989.
MacLean, Richard W. "Motivating Industry Toward Waste Minimization and Clean Technology", presented at the Waste Minimization and Clean Technoloev: Moving Toward the 21st Centurv Conference, May 10, 1989.
Massachusetts Ofice of Safe Waste Management. "Social Benefits. Social Costs, and The Economics of Hazardous Waste Reduction", June, 1988.
Merklein, Ernest. "Environmental Liability Management: Funding the Risk," Business Controller, Vol. 3, No. 4, Fall 1990, pp. 30-34.
,
Meyers, S.C. "Finance Theory and Financial Strategy". Interfaces 14: January-February 1984 (pp 126-137).
NEWMOA and MA OTA. "Costing and Financial Analysis of Pollution Prevention Projects: A Training Packet," 1992.
Office of the Chief of Engineers. "Economic Analysis of Hazardous Waste Minimization Alternatives", August 1992.
72
28. Peer Consultants, P. C. and George Beetle. "User's Guide for Economic Assessments (PPEA) Version 1. l", , Prepared for: US EPA, Center for Environmental Research Information, Cincinnati, Ohio, April 1990.
Pollution Prevention Review, Vol, 1 No. 1, Winter 1990/91 p. 27-40
Purcell, Arthur. "Merck Makes it EASY", Waste Minimization and Recvcling Reoort, issue 46, Sept. 1990, pp. 6-8.
Raftelis, George. "Financial and Accounting,Measures as Part of Pollution Prevention Assessments", Environmental Finance, Vol. 1 No. 2, Summer 1991.
Rooney, Charles. "Economics of Pollution Prevention: How Waste Reduction Pays", Pollution Prevention Review, Summer 1993.
Rosell, Debra. "How to Apply FAS 5, 'Accounting for Contingencies', to Environmental Liabilities," The Journal of Coruorate Accounting & Finance, Vol. 3, No. 4, Summer 1992 pp. 449-459.
Ross, S. A,, R. W. Westerfield and J. F. Jaffe, Corporate Finance. 3rd ed. Homewood, IL, Boston, MA: Irwin 1993.
Tellus Institute, Risk Analysis Group. "Alternative Approaches to the Financial Evaluation of Industrial Pollution Prevention Investments", November 199 1 .
Tellus Institute. "Total Cost Assessment: Accelerating Industrial Pollution Prevention Through Innovative Project Financial Analysis With Applications to the Pulp and Paper Industry", December 1991.
Tellus Institute, User's Manual for P2 Finance, 1993
Todd, Rebecca. "Accounting and the Environment", NY University, 1989, unpublished
U.S. EPA Ofice of Solid Waste & Ofice of Policy, Planning and Evaluation, Pollution Prevention Benefits Manual, Volume I and 11: The Manual and Appendices, Draft, Dec. 1988.
US EPA,"Waste Minimization Workshops Economic Assessments", January 1989.
US EPA Ofice of Pollution Prevention and Toxics, Design for the Environment, July 1994
29.
30.
3 1.
32.
33.
34.
35.
36.
37.
38.
39.
40.
41.
42. US EPA Office of Pollution Prevention and Toxics, Environmental Accounting Resource Listing, July 1994
73
43. US EPA Ofice of Pollution Prevention and Toxics, Workshop Proceedings: Accounting and CaDital Budgeting for Environmental Costs Workshop, May 1994
State of Washington. "Economic Evaluation", Draft, March 1991.
Water Pollution Control Federation, "Hazardous Waste Reduction: The Bottom Line"
White, Allen, Monica Becker, and Deborah Savage, "Environmentally-Smart Accounting: Using Total Cost Assessment to Accelerate Industrial Pollution Prevention", Pollution Prevention Review, Summer 1993,
~
-
44.
45.
46.
For more information on how to obtain these publications contact:
Terri Goldberg, P2 Program Manager NEWMOA
129 Portland Street Boston, MA 02114
(617) 367-8558
74