Embed Size (px)
Citation preview
Stormy Energy Futureand
Security Strategy for Asia
2016-9-9 Renewable Energy Institute
Former Executive Director, IEAPresident, the Sasakawa Peace FoundationNobuo TANAKA
Mtoe
-300
0
300
600
900
1 200
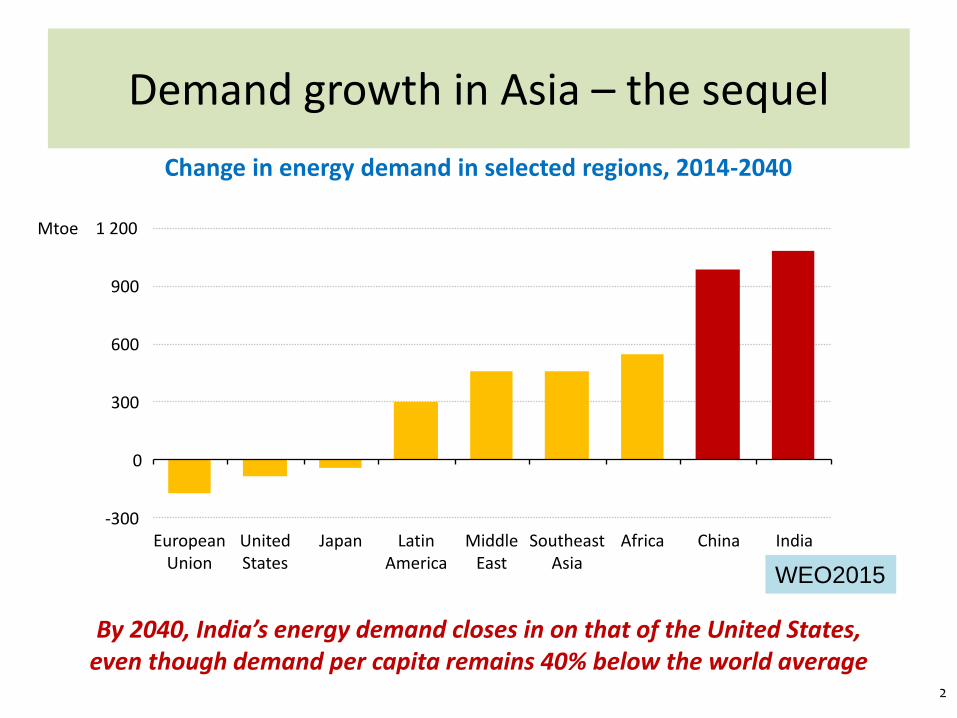
Demand growth in Asia – the sequel
By 2040, India’s energy demand closes in on that of the United States, even though demand per capita remains 40% below the world average
EuropeanUnion
UnitedStates
Japan LatinAmerica
MiddleEast
SoutheastAsia
Africa China India
Change in energy demand in selected regions, 2014-2040
WEO2015
2
-5
+5
+10
+15
2020 2030 2040
Middle East
Brazil
CanadaUnited States
Net decline in output from other producers
Oil production growthin United States, Canada, Brazil & the Middle East
2014
Increase to 2040: 14 mb/d
mb/d
Increase to 2040: 14 mb/d
IEA data
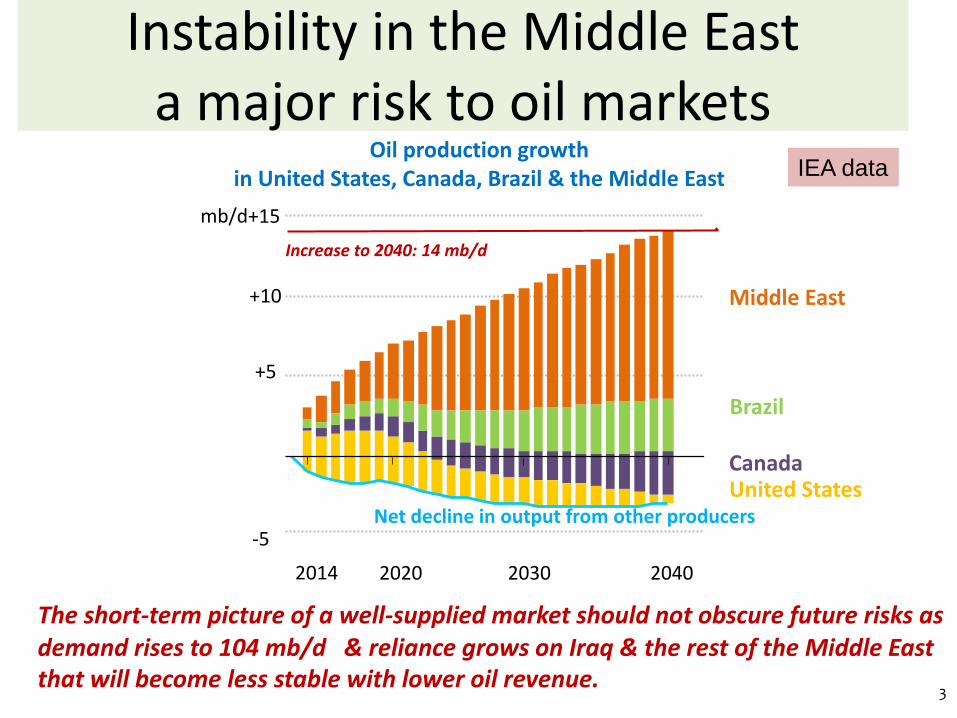
Instability in the Middle Easta major risk to oil markets
The short-term picture of a well-supplied market should not obscure future risks as demand rises to 104 mb/d & reliance grows on Iraq & the rest of the Middle Eastthat will become less stable with lower oil revenue.reliance grows on Iraq & the rest of the Middle East
3
IEA Data
4
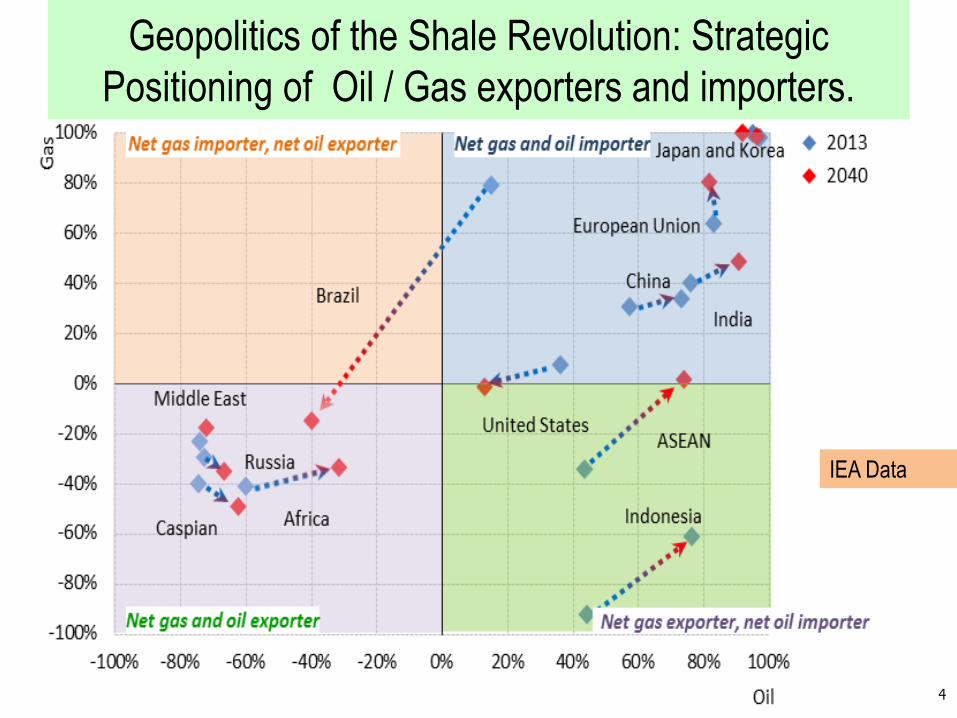
Geopolitics of the Shale Revolution: Strategic
Positioning of Oil / Gas exporters and importers.
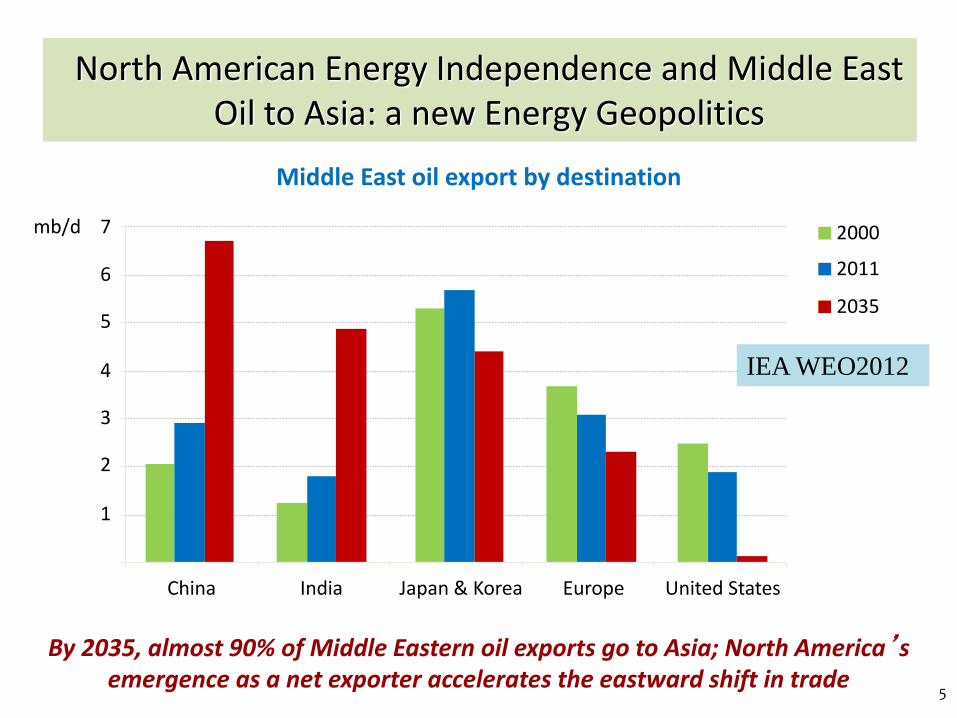
North American Energy Independence and Middle East Oil to Asia: a new Energy Geopolitics
Middle East oil export by destination
By 2035, almost 90% of Middle Eastern oil exports go to Asia; North America’s emergence as a net exporter accelerates the eastward shift in trade
7
United StatesJapan & Korea EuropeChina India
mb/d 2000
2011
2035
1
2
3
4
5
6
IEA WEO2012
5

USDOD China Report 2015 6
China’s Oil and Gas Import Transit Routes:
One Belt and One Road (一帯一路)
Figure 2. China’s Import Transit Routes.
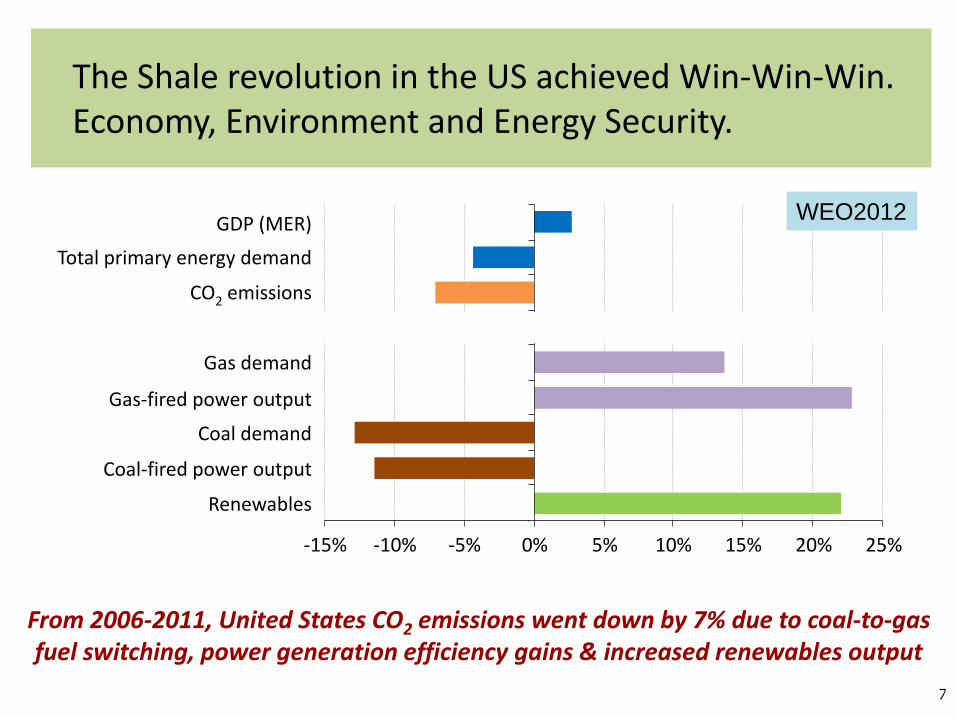
The Shale revolution in the US achieved Win-Win-Win. Economy, Environment and Energy Security.
-15% -10% -5% 0% 5% 10% 15% 20% 25%
Renewables
Coal-fired power output
Coal demand
Gas-fired power output
Gas demand
CO2 emissions
Total primary energy demand
GDP (MER)
From 2006-2011, United States CO2 emissions went down by 7% due to coal-to-gas fuel switching, power generation efficiency gains & increased renewables output
WEO2012
7
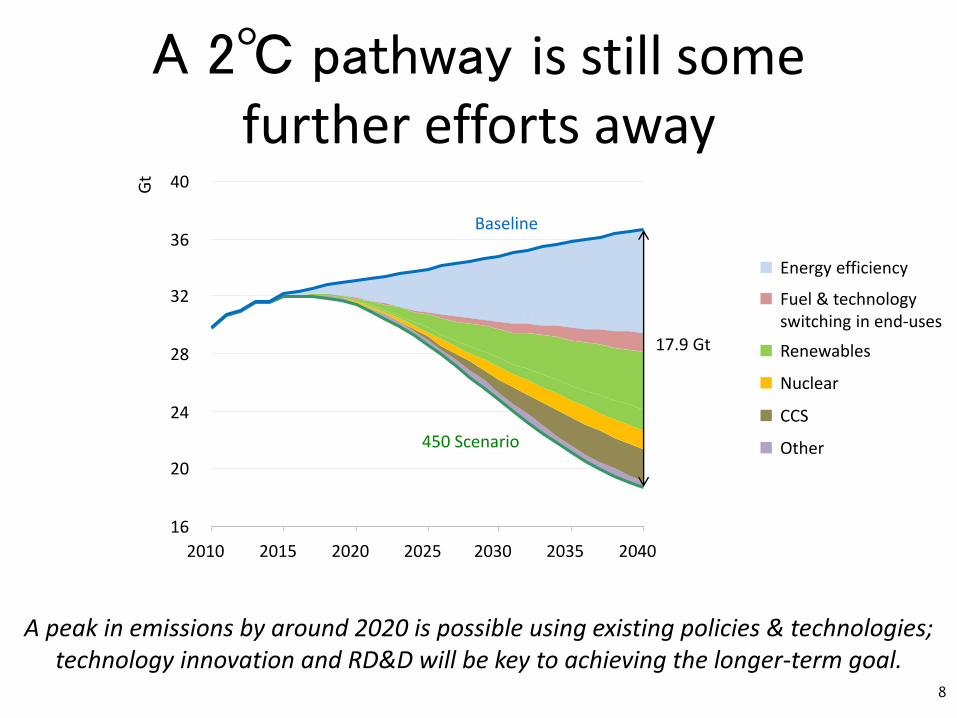
A 2℃ pathway is still some further efforts away
16
20
24
28
32
36
40
2010 2015 2020 2025 2030 2035 2040
Gt
Baseline
450 Scenario
17.9 Gt
A peak in emissions by around 2020 is possible using existing policies & technologies; technology innovation and RD&D will be key to achieving the longer-term goal.
Energy efficiency
Fuel & technology switching in end-uses
Renewables
Nuclear
CCS
Other
8
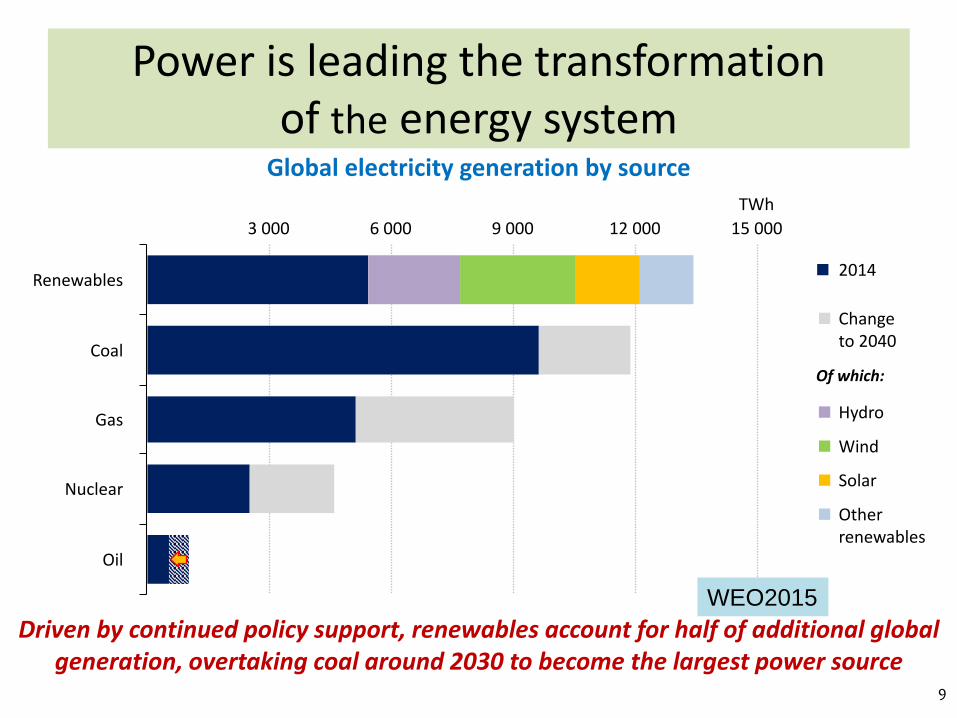
Power is leading the transformationof the energy system
Global electricity generation by source
Driven by continued policy support, renewables account for half of additional global generation, overtaking coal around 2030 to become the largest power source
3 000 12 000 15 000
TWh
Changeto 2040
2014Renewables
Coal
Gas
Nuclear
Oil
Hydro
Wind
Solar
Otherrenewables
Of which:
6 000 9 000
WEO2015
9
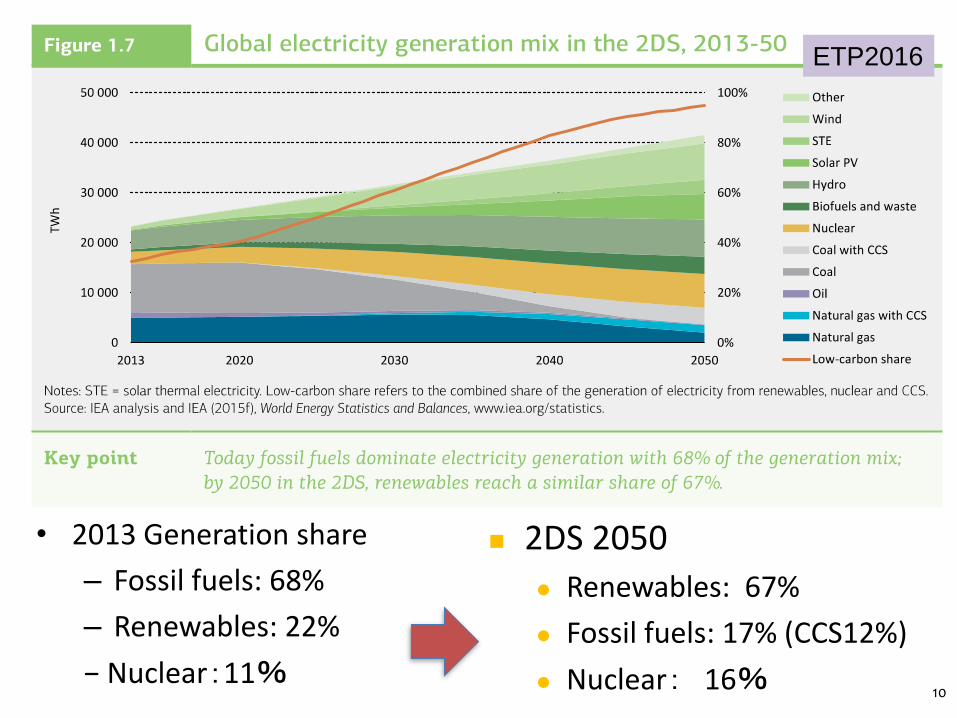
• 2013 Generation share
– Fossil fuels: 68%
– Renewables: 22%
− Nuclear:11%
2DS 2050
Renewables: 67%
Fossil fuels: 17% (CCS12%)
Nuclear: 16%
ETP2016
10
Energy self-sufficiency* by fuel in 2011
Source: Energy Data Center, IEA.
* Self-sufficiency =domestic production /total primary energy supply
Note: Does not include fuels not in the fossil fuels, renewables and nuclear categories.
11%
14%
15%
21%
6%
46%
12%
23%
28%
16%
9%
17%
32%
17%
10%
1%
10%
1%
1%
0% 10% 20% 30% 40% 50% 60% 70% 80% 90% 100%
IEA
European Union
Korea
Luxembourg
Belgium
Japan
France
Spain
Slovak Republic
Ireland
Switzerland
Italy
Portugal
Hungary
Turkey
Germany
Finland
Austria
Sweden
Greece
Czech Republic
United Kingdom
Poland
India
United States
Netherlands
China
New Zealand Fossil fuels
Renewables
Nuclear
24%
52%
96%
10%
8%
26%
14%
11%
0% 20% 40% 60% 80% 100% 120% 140%
EU28
IEA28
ASEANFossil fuelsRenewablesNuclear
Collective Energy Security and Sustainability
by Diversity, Connectivity and Nuclear
WEO 2013 basis
11
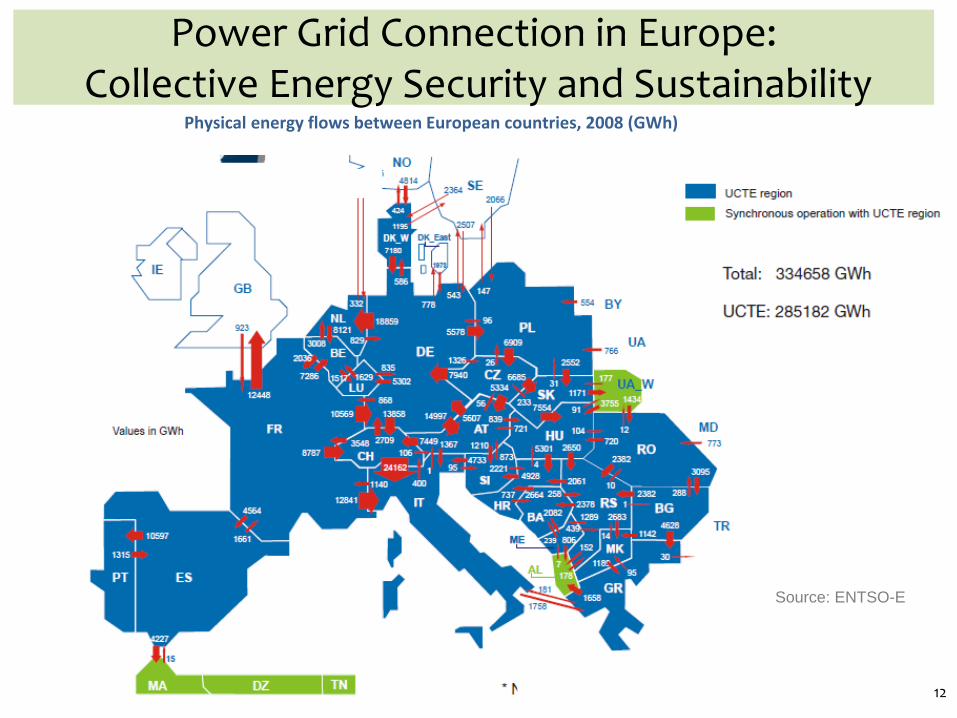
Power Grid Connection in Europe:Collective Energy Security and Sustainability
Physical energy flows between European countries, 2008 (GWh)
Source: ENTSO-E
12
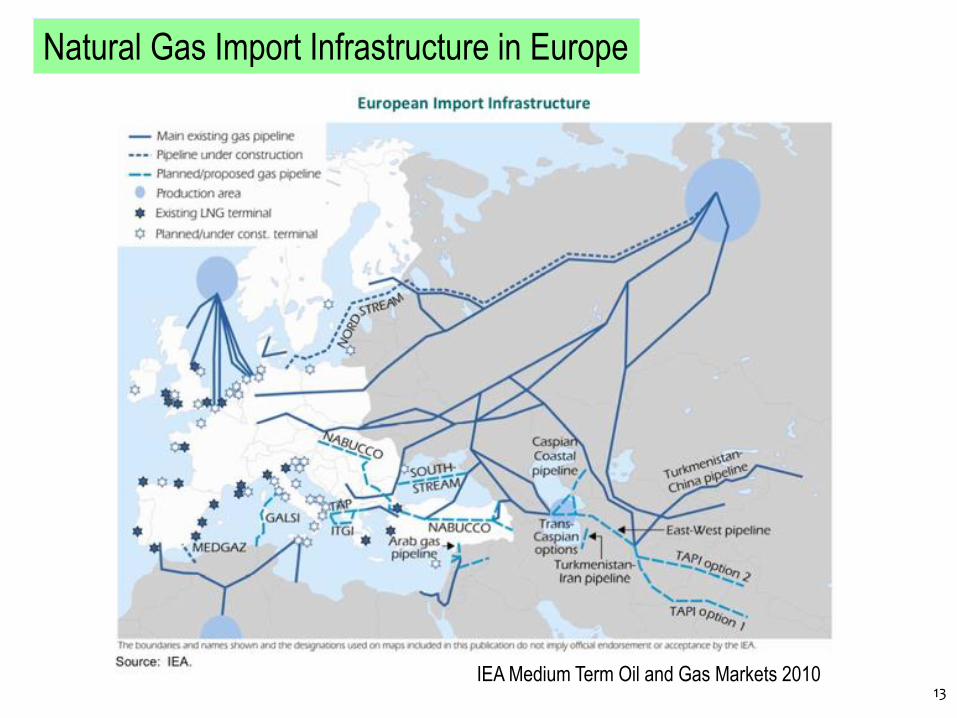
Natural Gas Import Infrastructure in Europe
IEA Medium Term Oil and Gas Markets 201013
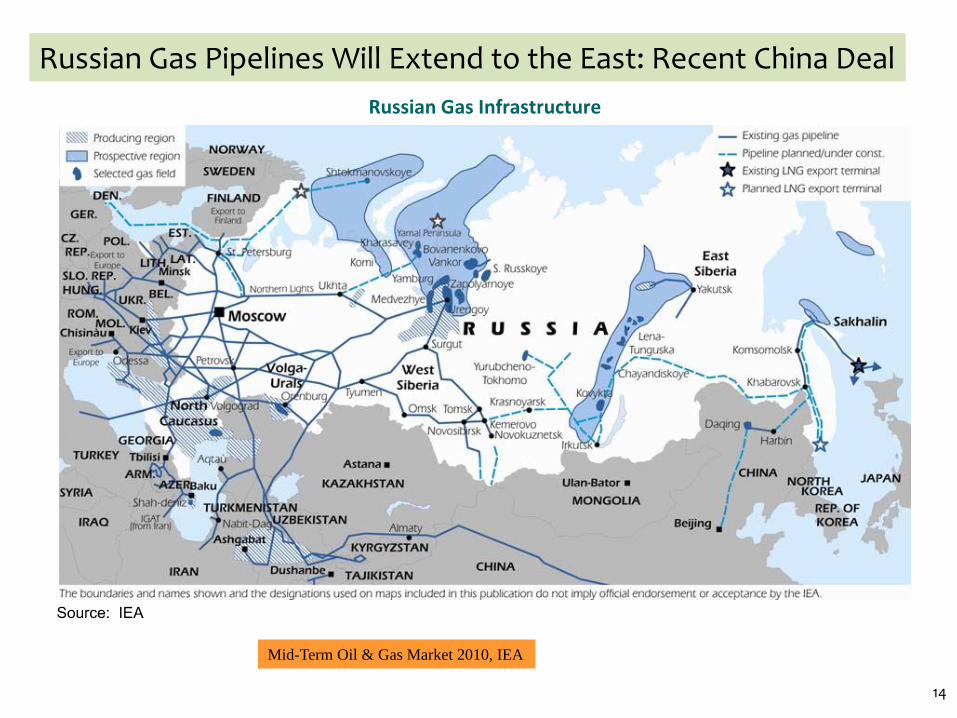
Mid-Term Oil & Gas Market 2010, IEA
Russian Gas Pipelines Will Extend to the East: Recent China Deal
14
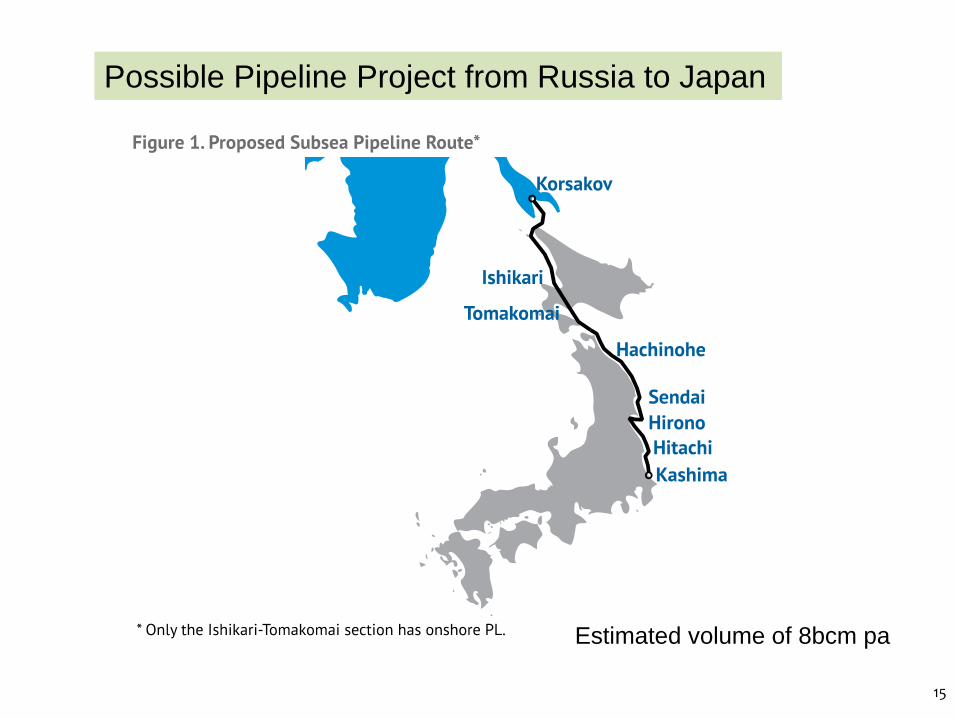
Possible Pipeline Project from Russia to Japan
Estimated volume of 8bcm pa
15
Чистая энергия
387
I stage
II stage
Sakhalin GRES
Nokliki GTES
Sakhalin GRES-2
Yuzhno-sakhalin TPP
Mayskaya GRES
Sovgavan TPP
Comsomol TPP 1-3
Amur TPP
Nikolaev TPP
CL 500 kV
III Stage
TP Gornozavodskaya
Dolinskaya TPP
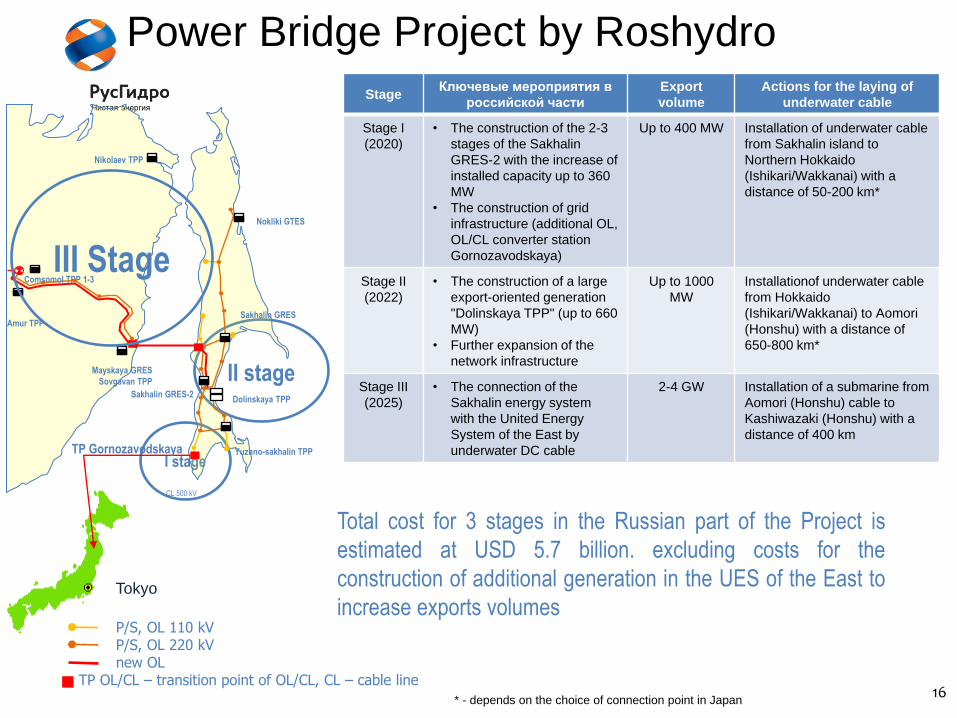
Total cost for 3 stages in the Russian part of the Project is
estimated at USD 5.7 billion. excluding costs for the
construction of additional generation in the UES of the East to
increase exports volumesP/S, OL 110 kVP/S, OL 220 kVnew OL
TP OL/CL – transition point of OL/CL, CL – cable line
Tokyo
StageКлючевые мероприятия в
российской части
Export
volume
Actions for the laying of
underwater cable
Stage I
(2020)
• The construction of the 2-3
stages of the Sakhalin
GRES-2 with the increase of
installed capacity up to 360
MW
• The construction of grid
infrastructure (additional OL,
OL/CL converter station
Gornozavodskaya)
Up to 400 MW Installation of underwater cable
from Sakhalin island to
Northern Hokkaido
(Ishikari/Wakkanai) with a
distance of 50-200 km*
Stage II
(2022)
• The construction of a large
export-oriented generation
"Dolinskaya TPP" (up to 660
MW)
• Further expansion of the
network infrastructure
Up to 1000
MW
Installationof underwater cable
from Hokkaido
(Ishikari/Wakkanai) to Aomori
(Honshu) with a distance of
650-800 km*
Stage III
(2025)
• The connection of the
Sakhalin energy system
with the United Energy
System of the East by
underwater DC cable
2-4 GW Installation of a submarine from
Aomori (Honshu) cable to
Kashiwazaki (Honshu) with a
distance of 400 km
* - depends on the choice of connection point in Japan
Power Bridge Project by Roshydro
16
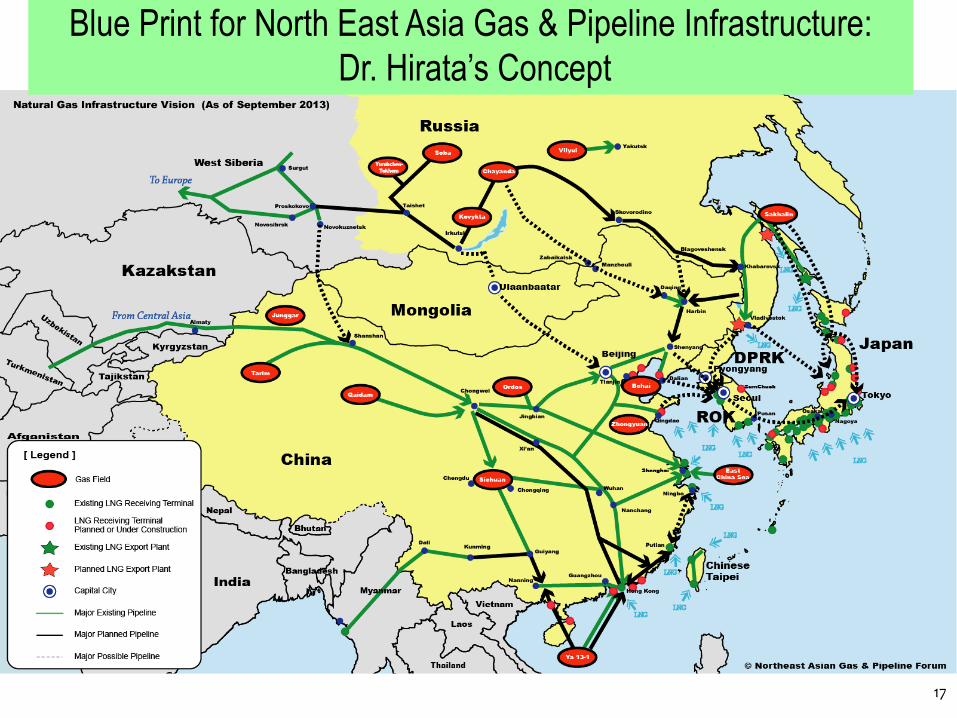
Blue Print for North East Asia Gas & Pipeline Infrastructure:
Dr. Hirata’s Concept
17
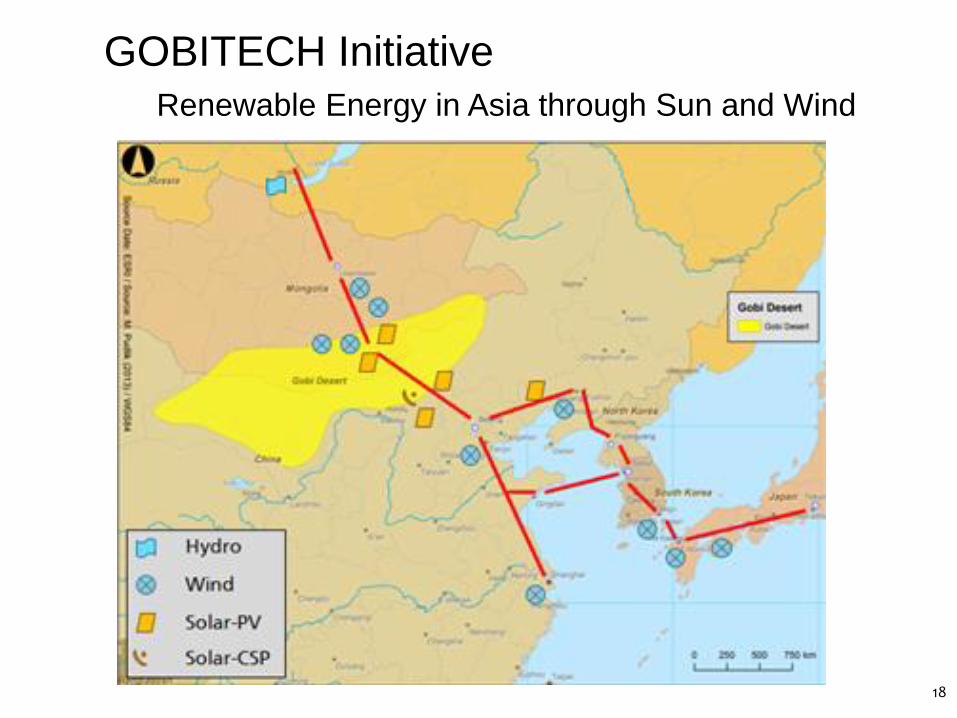
GOBITECH Initiative
Renewable Energy in Asia through Sun and Wind
18
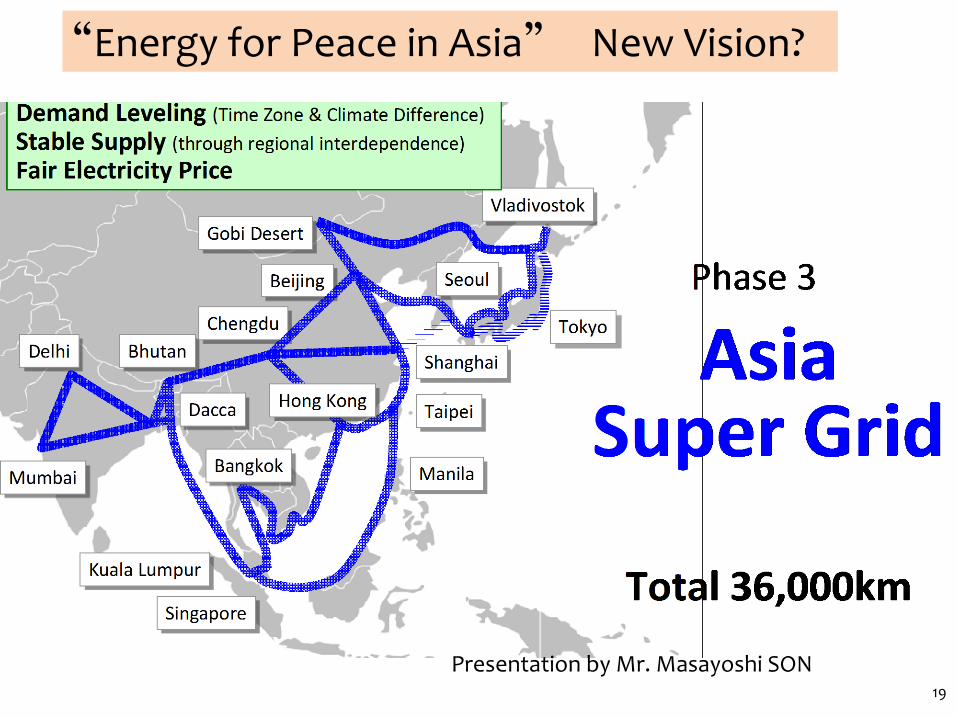
Presentation by Mr. Masayoshi SON19
“Energy for Peace in Asia” New Vision?
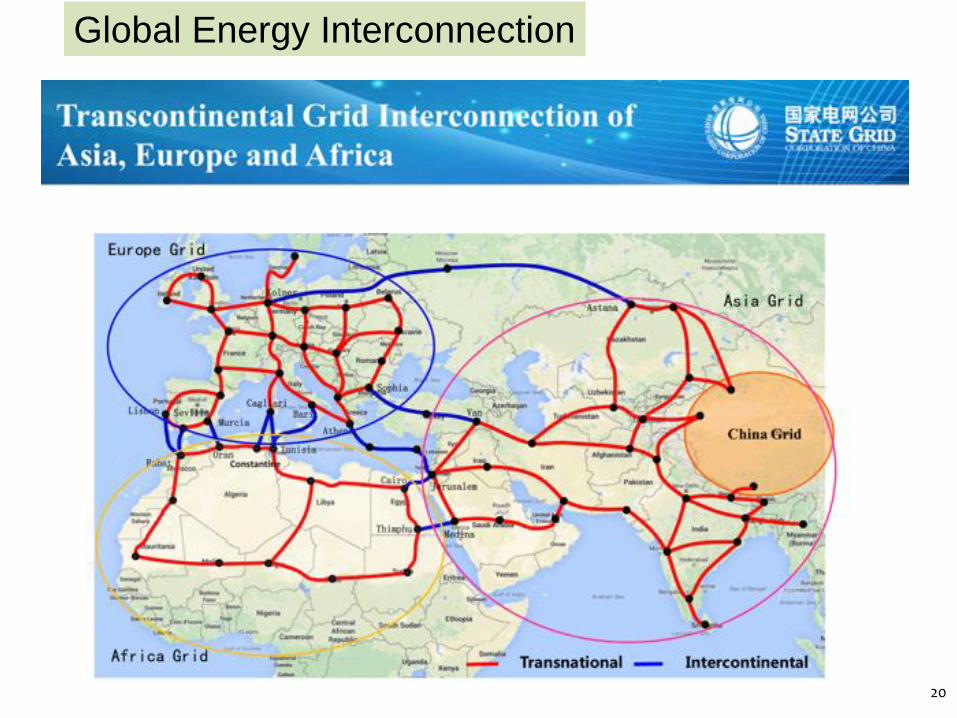
Global Energy Interconnection
20
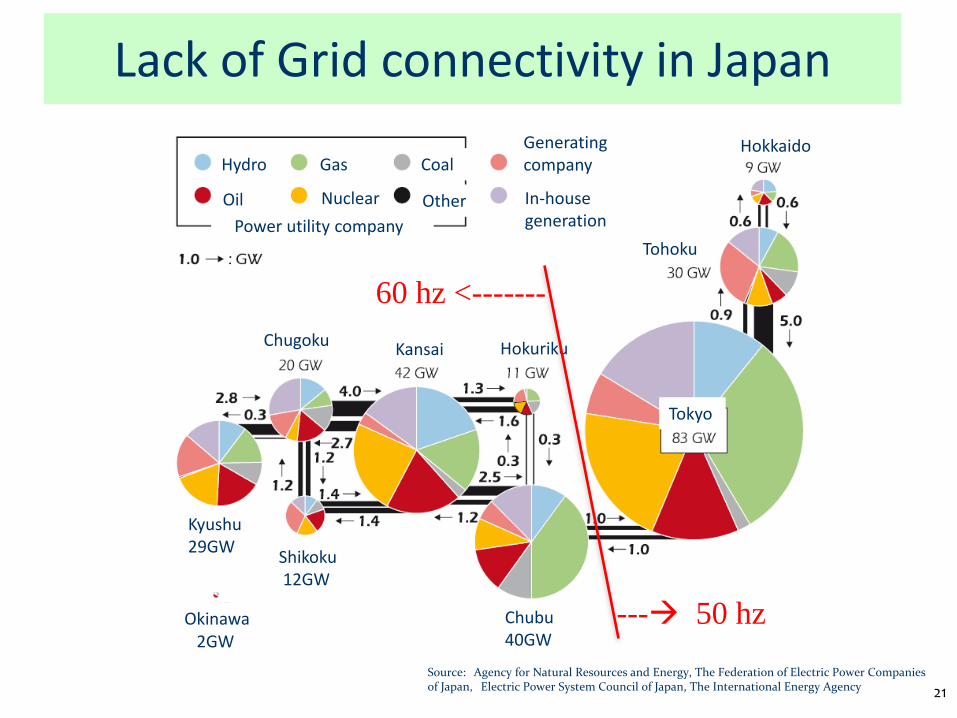
Lack of Grid connectivity in Japan
Source: Agency for Natural Resources and Energy, The Federation of Electric Power Companies of Japan, Electric Power System Council of Japan, The International Energy Agency
Tokyo
Hokkaido
Tohoku
HokurikuKansaiChugoku
Kyushu29GW
Shikoku12GW
Chubu 40GW
Okinawa2GW
Hydro
Oil
Gas
Nuclear
Coal
Other
Power utility company
Generating company
In-house generation
--- 50 hz
60 hz <-------
21
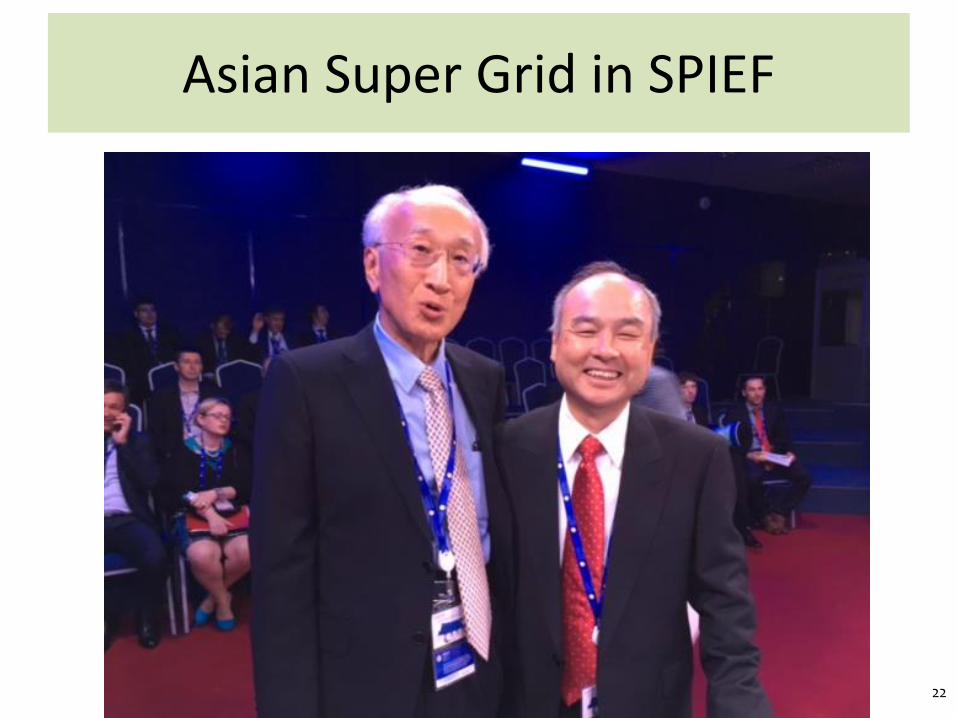
Asian Super Grid in SPIEF
22
![Head of Middle East/ South Asia Markets ICIS · PDF fileHead of Middle East/ South Asia Markets ICIS Singapore ... Head of Middle East, South Asia Markets. ... [Pata] GAIL HDPE/LLDPE](https://img.pdfslide.us/doc/110x75/5aa1714f7f8b9a84398ba14c/head-of-middle-east-south-asia-markets-icis-of-middle-east-south-asia-markets.jpg)