Embed Size (px)
Citation preview
Storms
Say Thanks to the AuthorsClick http://www.ck12.org/saythanks
(No sign in required)

To access a customizable version of this book, as well as otherinteractive content, visit www.ck12.org
CK-12 Foundation is a non-profit organization with a mission toreduce the cost of textbook materials for the K-12 market bothin the U.S. and worldwide. Using an open-content, web-basedcollaborative model termed the FlexBook®, CK-12 intends topioneer the generation and distribution of high-quality educationalcontent that will serve both as core text as well as provide anadaptive environment for learning, powered through the FlexBookPlatform®.
Copyright © 2015 CK-12 Foundation, www.ck12.org
The names “CK-12” and “CK12” and associated logos and theterms “FlexBook®” and “FlexBook Platform®” (collectively“CK-12 Marks”) are trademarks and service marks of CK-12Foundation and are protected by federal, state, and internationallaws.
Any form of reproduction of this book in any format or medium,in whole or in sections must include the referral attribution linkhttp://www.ck12.org/saythanks (placed in a visible location) inaddition to the following terms.
Except as otherwise noted, all CK-12 Content (including CK-12Curriculum Material) is made available to Users in accordancewith the Creative Commons Attribution-Non-Commercial 3.0Unported (CC BY-NC 3.0) License (http://creativecommons.org/licenses/by-nc/3.0/), as amended and updated by Creative Com-mons from time to time (the “CC License”), which is incorporatedherein by this reference.
Complete terms can be found at http://www.ck12.org/terms.
Printed: January 6, 2015

www.ck12.org Chapter 1. Storms
CHAPTER 1 Storms
Lesson Objectives
• Describe how atmospheric circulation patterns cause storms to form and travel.• Understand the weather patterns that lead to tornadoes, and identify the different types of cyclones.• Know what causes a hurricane to form, what causes it to disappear, and what sorts of damage it can do.• Know the damage that heat waves and droughts can cause.
Vocabulary
• anticyclone• blizzard• cyclone• heat wave• hurricane• lake-effect snow• lightning• mid-latitude cyclone• nor’easter• thunder• thunderstorm• tornado• tropical depression
Introduction
Weather happens every day, but only some days have storms. Storms vary immensely depending on whether they’rewarm or cold, coming off the ocean or off a continent, occurring in summer or winter, and many other factors. Theeffects of storms also vary depending on whether they strike a populated area or a natural landscape. HurricaneKatrina is a good example, since the flooding after the storm severely damaged New Orleans, while a similar stormin an unpopulated area would have done little damage.
Thunderstorms
Thunderstorms are extremely common: Worldwide there are 14 million per year; that’s 40,000 per day! Most dropa lot of rain on a small area quickly, but some are severe and highly damaging.
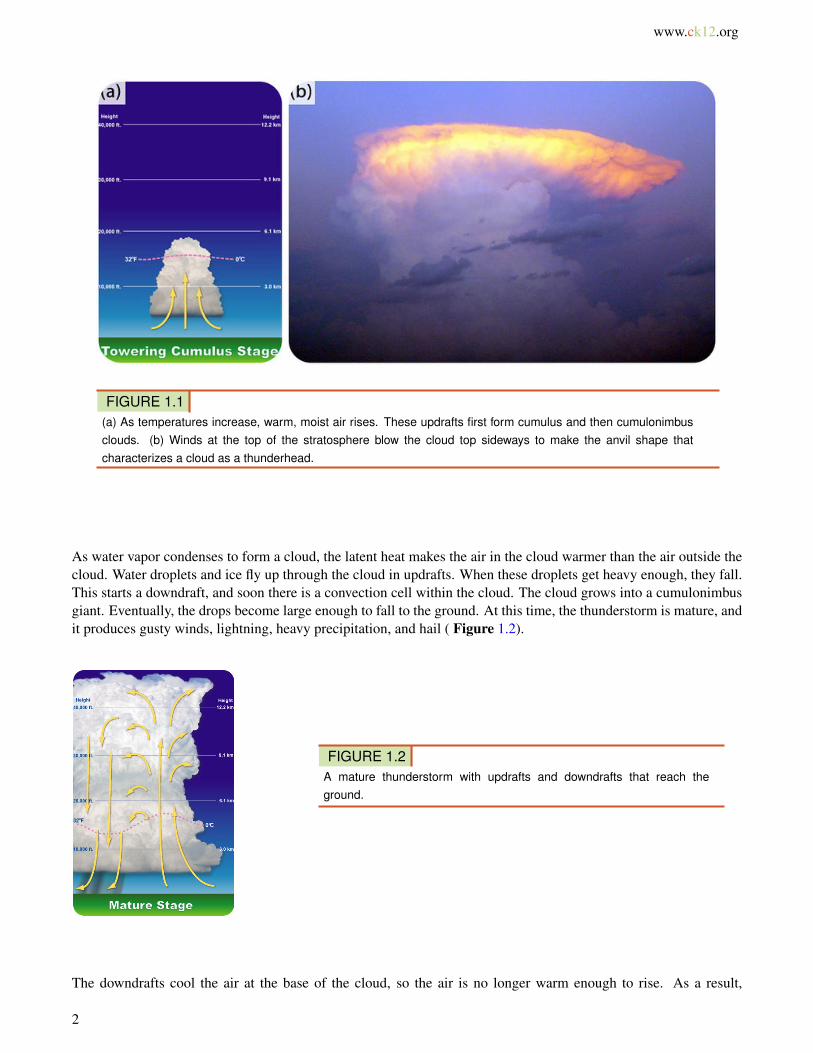
Thunderstorms form when ground temperatures are high, ordinarily in the late afternoon or early evening in springand summer. The Figure 1.1 show two stages of thunderstorm buildup.
1
www.ck12.org
FIGURE 1.1(a) As temperatures increase, warm, moist air rises. These updrafts first form cumulus and then cumulonimbusclouds. (b) Winds at the top of the stratosphere blow the cloud top sideways to make the anvil shape thatcharacterizes a cloud as a thunderhead.
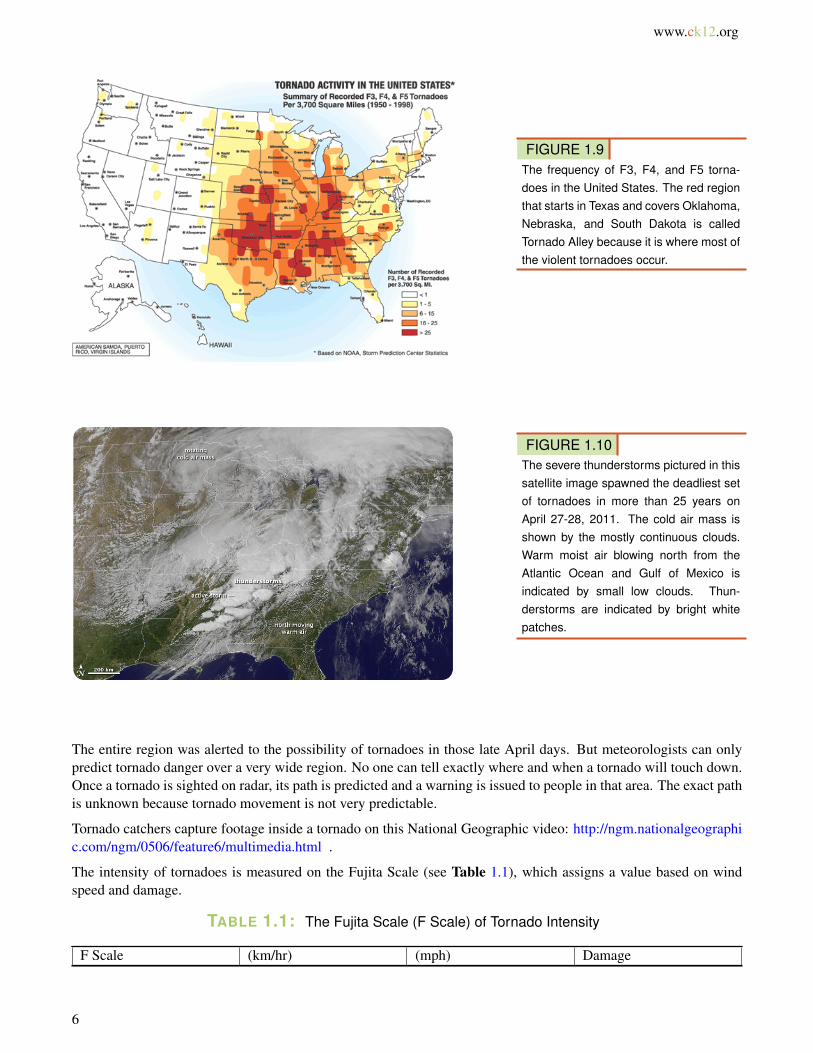
As water vapor condenses to form a cloud, the latent heat makes the air in the cloud warmer than the air outside thecloud. Water droplets and ice fly up through the cloud in updrafts. When these droplets get heavy enough, they fall.This starts a downdraft, and soon there is a convection cell within the cloud. The cloud grows into a cumulonimbusgiant. Eventually, the drops become large enough to fall to the ground. At this time, the thunderstorm is mature, andit produces gusty winds, lightning, heavy precipitation, and hail ( Figure 1.2).
FIGURE 1.2A mature thunderstorm with updrafts and downdrafts that reach theground.
The downdrafts cool the air at the base of the cloud, so the air is no longer warm enough to rise. As a result,
2

www.ck12.org Chapter 1. Storms
convection shuts down. Without convection, water vapor does not condense, no latent heat is released, and thethunderhead runs out of energy. A thunderstorm usually ends only 15 to 30 minutes after it begins, but otherthunderstorms may start in the same area.
With severe thunderstorms, the downdrafts are so intense that when they hit the ground it sends warm air from theground upward into the storm. The warm air gives the convection cells more energy. Rain and hail grow huge beforegravity pulls them to Earth. Severe thunderstorms can last for hours and can cause a lot of damage because of highwinds, flooding, intense hail, and tornadoes.
Thunderstorms can form individually or in squall lines along a cold front. In the United States, squall lines form inspring and early summer in the Midwest where the maritime tropical (mT) air mass from the Gulf of Mexico meetsthe continental polar (cP) air mass from Canada ( Figure 1.3).
FIGURE 1.3Cold air from the Rockies collided withwarm, moist air from the Gulf of Mexicoto form this squall line.
So much energy collects in cumulonimbus clouds that a huge release of electricity, called lightning, may result (Figure 1.4). The electrical discharge may be between one part of the cloud and another, two clouds, or a cloud andthe ground.
A key ingredient of thunderstorms is explored in this National Geographic Video, Natural Disaster, Landslides, andmore: Lightning 101 (2:38) at http://video.nationalgeographic.com/video/environment/environment-natural-disasters/landslides-and-more/lightning/ .
Lightning heats the air so that it expands explosively. The loud clap is thunder. Light waves travel so rapidly thatlightning is seen instantly. Sound waves travel much more slowly, so a thunderclap may come many seconds afterthe lightning is spotted.
Thunderstorms kill approximately 200 people in the United States and injure about 550 Americans per year, mostlyfrom lightning strikes. Have you heard the common misconception that lightning doesn’t strike the same placetwice? In fact, lightning strikes the New York City’s Empire State Building about 100 times per year ( Figure 1.5).
An online guide to severe storms from the University of Illinois is found here: http://ww2010.atmos.uiuc.edu/%28Gh%29/guides/mtr/svr/home.rxml .
Tornadoes
Tornadoes, also called twisters, are fierce products of severe thunderstorms ( Figure 1.6). As air in a thunderstormrises, the surrounding air races in to fill the gap, forming a funnel.
3

www.ck12.org
FIGURE 1.4Lightning behind the town of DiamondHead, Hawaii.
FIGURE 1.5Lightning strikes some places many times a year, such as the Eiffel Towerin Paris.
FIGURE 1.6A tornado is a funnel shaped, whirling column of air extending downward from a cumulonimbus cloud. Theformation of this tornado outside Dimmit, Texas, in 1995 was well studied.
4

www.ck12.org Chapter 1. Storms
A tornado lasts from a few seconds to several hours. The average wind speed is about 177 kph (110 mph), but somewinds are much faster. A tornado travels over the ground at about 45 km per hour (28 miles per hour) and goes about25 km (16 miles) before losing energy and disappearing ( Figure 1.7).
FIGURE 1.7This tornado struck Seymour, Texas, in1979.
An individual tornado strikes a small area, but it can destroy everything in its path. Most injuries and deaths fromtornadoes are caused by flying debris ( Figure 1.8). In the United States an average of 90 people are killed bytornadoes each year. The most violent two percent of tornadoes account for 70% of the deaths by tornadoes.
FIGURE 1.8Tornado damage at Ringgold, Georgia inApril 2011.
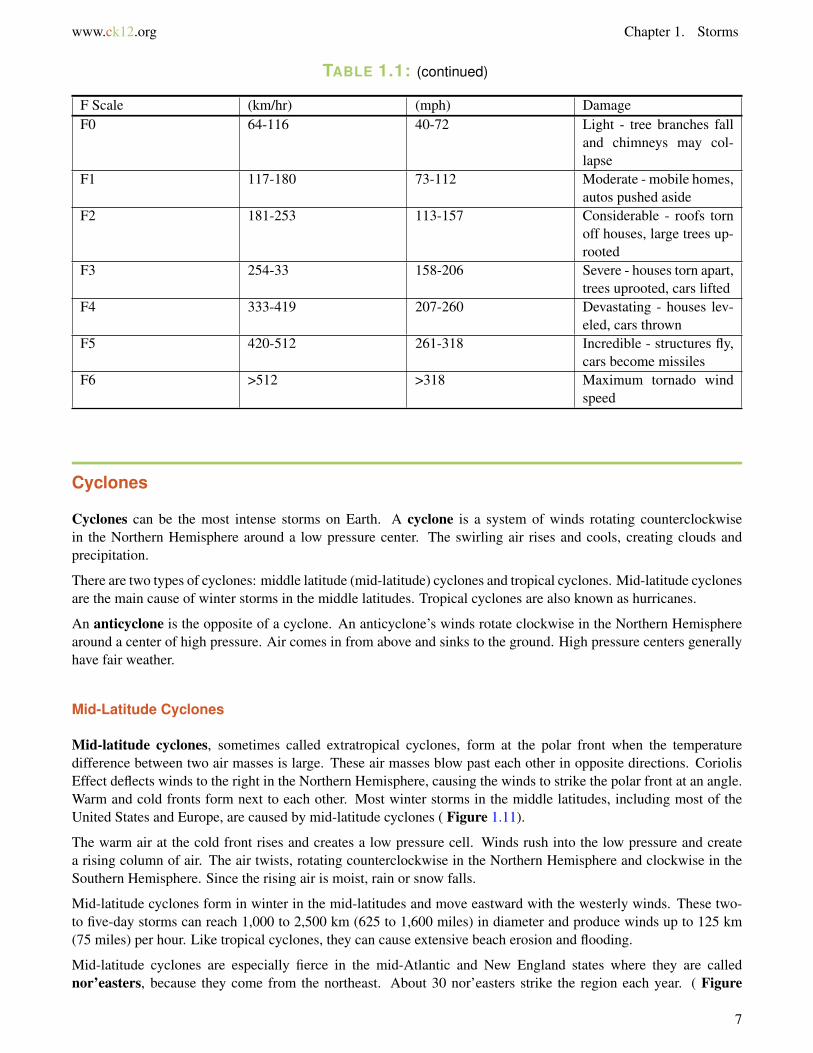
Tornadoes form at the front of severe thunderstorms. Lines of these thunderstorms form in the spring where wheremaritime tropical (mT) and continental polar (cP) air masses meet. Although there is an average of 770 tornadoesannually, the number of tornadoes each year varies greatly ( Figure 1.9).
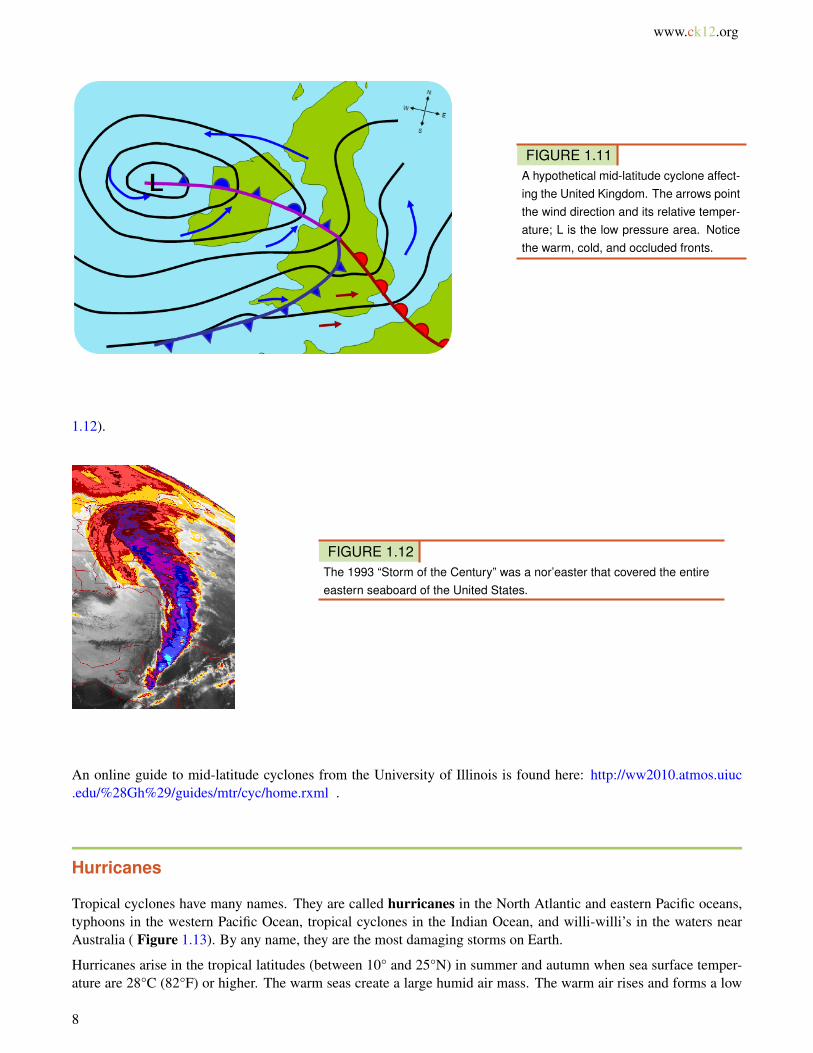
In late April 2011, the situation was ripe for the deadliest set of tornadoes in 25 years. In addition to the meeting ofcP and mT mentioned above, the jet stream was blowing strongly in from the west. The result was more than 150tornadoes reported throughout the day ( Figure 1.10).
5
www.ck12.org
FIGURE 1.9The frequency of F3, F4, and F5 torna-does in the United States. The red regionthat starts in Texas and covers Oklahoma,Nebraska, and South Dakota is calledTornado Alley because it is where most ofthe violent tornadoes occur.
FIGURE 1.10The severe thunderstorms pictured in thissatellite image spawned the deadliest setof tornadoes in more than 25 years onApril 27-28, 2011. The cold air mass isshown by the mostly continuous clouds.Warm moist air blowing north from theAtlantic Ocean and Gulf of Mexico isindicated by small low clouds. Thun-derstorms are indicated by bright whitepatches.
The entire region was alerted to the possibility of tornadoes in those late April days. But meteorologists can onlypredict tornado danger over a very wide region. No one can tell exactly where and when a tornado will touch down.Once a tornado is sighted on radar, its path is predicted and a warning is issued to people in that area. The exact pathis unknown because tornado movement is not very predictable.
Tornado catchers capture footage inside a tornado on this National Geographic video: http://ngm.nationalgeographic.com/ngm/0506/feature6/multimedia.html .
The intensity of tornadoes is measured on the Fujita Scale (see Table 1.1), which assigns a value based on windspeed and damage.
TABLE 1.1: The Fujita Scale (F Scale) of Tornado Intensity
F Scale (km/hr) (mph) Damage
6
www.ck12.org Chapter 1. Storms
TABLE 1.1: (continued)
F Scale (km/hr) (mph) DamageF0 64-116 40-72 Light - tree branches fall
and chimneys may col-lapse
F1 117-180 73-112 Moderate - mobile homes,autos pushed aside
F2 181-253 113-157 Considerable - roofs tornoff houses, large trees up-rooted
F3 254-33 158-206 Severe - houses torn apart,trees uprooted, cars lifted
F4 333-419 207-260 Devastating - houses lev-eled, cars thrown
F5 420-512 261-318 Incredible - structures fly,cars become missiles
F6 >512 >318 Maximum tornado windspeed
Cyclones
Cyclones can be the most intense storms on Earth. A cyclone is a system of winds rotating counterclockwisein the Northern Hemisphere around a low pressure center. The swirling air rises and cools, creating clouds andprecipitation.
There are two types of cyclones: middle latitude (mid-latitude) cyclones and tropical cyclones. Mid-latitude cyclonesare the main cause of winter storms in the middle latitudes. Tropical cyclones are also known as hurricanes.
An anticyclone is the opposite of a cyclone. An anticyclone’s winds rotate clockwise in the Northern Hemispherearound a center of high pressure. Air comes in from above and sinks to the ground. High pressure centers generallyhave fair weather.
Mid-Latitude Cyclones
Mid-latitude cyclones, sometimes called extratropical cyclones, form at the polar front when the temperaturedifference between two air masses is large. These air masses blow past each other in opposite directions. CoriolisEffect deflects winds to the right in the Northern Hemisphere, causing the winds to strike the polar front at an angle.Warm and cold fronts form next to each other. Most winter storms in the middle latitudes, including most of theUnited States and Europe, are caused by mid-latitude cyclones ( Figure 1.11).
The warm air at the cold front rises and creates a low pressure cell. Winds rush into the low pressure and createa rising column of air. The air twists, rotating counterclockwise in the Northern Hemisphere and clockwise in theSouthern Hemisphere. Since the rising air is moist, rain or snow falls.
Mid-latitude cyclones form in winter in the mid-latitudes and move eastward with the westerly winds. These two-to five-day storms can reach 1,000 to 2,500 km (625 to 1,600 miles) in diameter and produce winds up to 125 km(75 miles) per hour. Like tropical cyclones, they can cause extensive beach erosion and flooding.
Mid-latitude cyclones are especially fierce in the mid-Atlantic and New England states where they are callednor’easters, because they come from the northeast. About 30 nor’easters strike the region each year. ( Figure
7
www.ck12.org
FIGURE 1.11A hypothetical mid-latitude cyclone affect-ing the United Kingdom. The arrows pointthe wind direction and its relative temper-ature; L is the low pressure area. Noticethe warm, cold, and occluded fronts.
1.12).
FIGURE 1.12The 1993 “Storm of the Century” was a nor’easter that covered the entireeastern seaboard of the United States.
An online guide to mid-latitude cyclones from the University of Illinois is found here: http://ww2010.atmos.uiuc.edu/%28Gh%29/guides/mtr/cyc/home.rxml .
Hurricanes
Tropical cyclones have many names. They are called hurricanes in the North Atlantic and eastern Pacific oceans,typhoons in the western Pacific Ocean, tropical cyclones in the Indian Ocean, and willi-willi’s in the waters nearAustralia ( Figure 1.13). By any name, they are the most damaging storms on Earth.
Hurricanes arise in the tropical latitudes (between 10° and 25°N) in summer and autumn when sea surface temper-ature are 28°C (82°F) or higher. The warm seas create a large humid air mass. The warm air rises and forms a low
8

www.ck12.org Chapter 1. Storms
pressure cell, known as a tropical depression. Thunderstorms materialize around the tropical depression.
If the temperature reaches or exceeds 28°C (82°F) the air begins to rotate around the low pressure (counterclockwisein the Northern Hemisphere and clockwise in the Southern Hemisphere). As the air rises, water vapor condenses,releasing energy from latent heat. If wind shear is low, the storm builds into a hurricane within two to three days.
FIGURE 1.13A cross-sectional view of a hurricane.
Hurricanes are huge with high winds. The exception is the relatively calm eye of the storm where air is rising upward.Rainfall can be as high as 2.5 cm (1") per hour, resulting in about 20 billion metric tons of water released daily in ahurricane. The release of latent heat generates enormous amounts of energy, nearly the total annual electrical powerconsumption of the United States from one storm. Hurricanes can also generate tornadoes.
Hurricanes are assigned to categories based on their wind speed. The categories are listed on the Saffir-Simpsonhurricane scale ( Table 1.2).
TABLE 1.2: Saffir - Simpson Hurricane Scale
Category Kph Mph Estimated Damage1 (weak) 119-153 74-95 Above normal; no real
damage to structures2 (moderate) 154-177 96-110 Some roofing, door, and
window damage, consid-erable damage to vegeta-tion, mobile homes, andpiers
3 (strong) 178-209 111-130 Some buildings damaged;mobile homes destroyed
4 (very strong) 210-251 131-156 Complete roof failure onsmall residences; majorerosion of beach areas;major damage to lowerfloors of structures nearshore
5 (devastating) >251 >156 Complete roof failure onmany residences and in-dustrial buildings; somecomplete building failures
9
www.ck12.org
Hurricanes move with the prevailing winds. In the Northern Hemisphere, they originate in the trade winds and moveto the west. When they reach the latitude of the westerlies, they switch direction and travel toward the north ornortheast. Hurricanes may cover 800 km (500 miles) in one day.
Damage from hurricanes comes from the high winds, rainfall, and storm surge. Storm surge occurs as the storm’slow pressure center comes onto land, causing the sea level to rise unusually high. A storm surge is often made worseby the hurricane’s high winds blowing seawater across the ocean onto the shoreline. Flooding can be devastating,especially along low-lying coastlines such as the Atlantic and Gulf Coasts. Hurricane Camille in 1969 had a 7.3 m(24 foot) storm surge that traveled 125 miles (200 km) inland.
Hurricanes typically last for 5 to 10 days. Over cooler water or land, the hurricane’s latent heat source shut downsand the storm weakens. When a hurricane disintegrates, it is replaced with intense rains and tornadoes.
Hurricanes are explored in a set of National Geographic videos found at National Geographic Video, Natural disaster,Hurricanes:
• “Hurricanes 101” is an introduction to the topic.• “How Katrina Formed” looks at the history of Hurricane Katrina as it formed and passed through the Gulf
coast.• Follow that up with “Doomed New Orleans,” which explores how the devastation to the city is a man-made
disaster.• “The Hurricane Ike of 1900” looks at what happened in the days when there was little warning before a
hurricane hit a coastal city.
There are about 100 hurricanes around the world each year, plus many smaller tropical storms and tropical depres-sions. As people develop coastal regions, property damage from storms continues to rise. However, scientists arebecoming better at predicting the paths of these storms and fatalities are decreasing. There is, however, one majorexception to the previous statement: Hurricane Katrina.
Lots of information about hurricanes is found in this online guide from the University of Illinois: http://ww2010.atmos.uiuc.edu/%28Gh%29/guides/mtr/hurr/home.rxml .
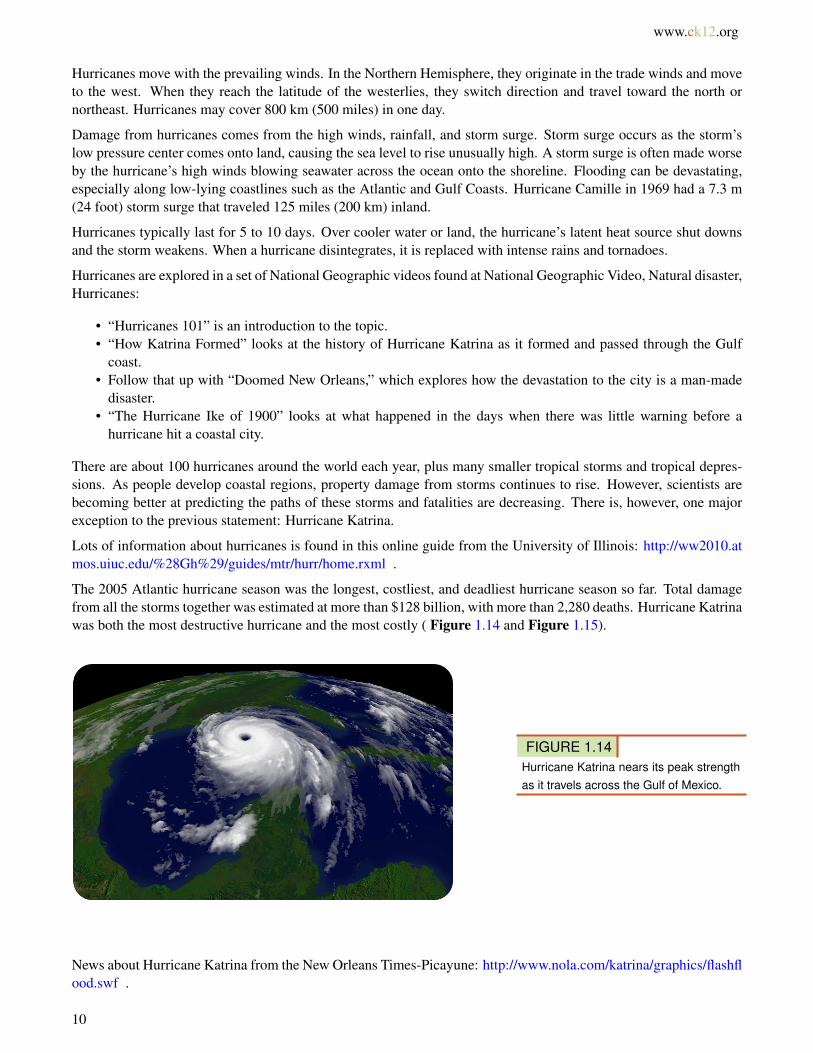
The 2005 Atlantic hurricane season was the longest, costliest, and deadliest hurricane season so far. Total damagefrom all the storms together was estimated at more than $128 billion, with more than 2,280 deaths. Hurricane Katrinawas both the most destructive hurricane and the most costly ( Figure 1.14 and Figure 1.15).
FIGURE 1.14Hurricane Katrina nears its peak strengthas it travels across the Gulf of Mexico.
News about Hurricane Katrina from the New Orleans Times-Picayune: http://www.nola.com/katrina/graphics/flashflood.swf .
10

www.ck12.org Chapter 1. Storms
An animation of a radar image of Hurricane Katrina making landfall is seen here: http://upload.wikimedia.org/wikipedia/commons/9/97/Hurricane_Katrina_LA_landfall_radar.gif .
NASA’s short video, In Katrina’s Wake: http://www.youtube.com/watch?v=HZjqvqaLltI .
FIGURE 1.15Flooding in New Orleans after HurricaneKatrina caused the levees to break andwater to pour through the city.
Blizzards and Lake-Effect Snow
A blizzard is distinguished by certain conditions ( Figure 1.16):
• Temperatures below –7°C (20°F); –12°C (10°F) for a severe blizzard.• Winds greater than 56 kmh (35 mph); 72 kmh (45 mph) for a severe blizzard.• Snow so heavy that visibility is 2/5 km (1/4 mile) or less for at least three hours; near zero visibility for a
severe blizzard.
Blizzards happen across the middle latitudes and toward the poles, usually as part of a mid-latitude cyclone. Bliz-zards are most common in winter, when the jet stream has traveled south and a cold, northern air mass comes intocontact with a warmer, semitropical air mass ( Figure 1.17). The very strong winds develop because of the pressure
11

www.ck12.org
FIGURE 1.16A near white out in a blizzard in Mas-sachusetts.
gradient between the low pressure storm and the higher pressure west of the storm. Snow produced by the stormgets caught in the winds and blows nearly horizontally. Blizzards can also produce sleet or freezing rain.
FIGURE 1.17Blizzard snows blanket the East Coast ofthe United States in February 2010.
In winter, a continental polar air mass travels down from Canada. As the frigid air travels across one of the GreatLakes, it warms and absorbs moisture. When the air mass reaches the leeward side of the lake, it is very unstable andit drops tremendous amounts of snow. This lake-effect snow falls on the snowiest, metropolitan areas in the UnitedStates: Buffalo and Rochester, New York ( Figure 1.18).
Heat Wave
Even more insidious are the deadliest weather phenomena, a heat wave. A heat wave is different for differentlocations; it is a long period of hot weather, at least 86°F (30°C) for at least three days in cooler locations but much
12

www.ck12.org Chapter 1. Storms
FIGURE 1.18Frigid air travels across the Great Lakesand dumps lake-effect snow on the lee-ward side.
more in hotter locations. Heat waves have increased in frequency and duration in recent years.
What do you think caused the heat wave in the Figure 1.19? A high pressure zone kept the jet stream further norththan normal for August.
FIGURE 1.19A heat wave over the United States as in-dicated by heat radiated from the ground.The bright yellow areas are the hottestand the blue and white are coolest.
13

www.ck12.org
Lesson Summary
• Thunderstorms arise over warm ground when updrafts form cumulonimbus clouds that rain and hail.• Tornadoes form most commonly from thunderstorms. They are relatively short-lived and small, but they do
an enormous amount of damage where they strike.• Cyclones of all sorts are large and damaging; they include nor’easters and hurricanes.
Review Questions
1. Describe in detail how a thunderstorm forms and where the energy to fuel it comes from. Start with a warm dayand no clouds.
2. How does a thunderstorm break apart and disappear?
3. Why does a thunderstorm get more severe rather than losing energy and disappearing?
4. What are lightning and thunder?
5. Discuss the pros and cons of living in an area that is prone to tornadoes versus one that is prone to hurricanes.
6. Where are tornadoes most common in the United States?
7. What is a cyclone? What are the two types of cyclone and how do they differ?
8. Describe in detail how a hurricane forms.
9. What level is the most damaging hurricane on the Saffir-Simpson scale? What sorts of damage do you expectfrom such a strong hurricane?
10. What causes damage from hurricanes?
11. What could have been done in New Orleans to lessen the damage and deaths from Hurricane Katrina?
12. Do you think New Orleans should be rebuilt in its current location?
13. Where do blizzards develop?
Further Reading / Supplemental Links
Hunt for the Supertwister from PBS: http://access.ncsa.illinois.edu/Stories/supertwister/index.htm
Points to Consider
• Why is predicting where tornadoes will go and how strong they will be so difficult?• How would the damage done by Hurricane Katrina have been different if the storm had taken place 100 years
ago?• What knowledge do meteorologists need to better understand storms?
14
www.ck12.org Chapter 1. Storms
References
1. (a) Courtesy of the US National Oceanic and Atmospheric Administration; (b) User:MONGO/WikimediaCommons. (a) http://commons.wikimedia.org/wiki/File:Tstorm-tcu-stage.jpg; (b) http://commons.wikimedia.org/wiki/File:Thunderhead.anvil.jpg . Public Domain
2. Courtesy of National Oceanic and Atmospheric Administration. http://commons.wikimedia.org/wiki/File:Tstorm-mature-stage.jpg . Public Domain
3. Courtesy of Hal Pierce (SSAI/NASA GSFC). http://earthobservatory.nasa.gov/IOTD/view.php?id=5509 .Public Domain
4. Flickr:poorboy1225. http://www.flickr.com/photos/20144155@N00/5683294429/ . CC BY 2.05. M. G. Loppé. http://commons.wikimedia.org/wiki/File:Lightning_striking_the_Eiffel_Tower_-_NOAA.jpg .
Public Domain6. Courtesy of Harald Richter, US National Oceanic and Atmospheric Administration. http://commons.wikim
edia.org/wiki/File:Dimmit_Sequence.jpg . Public Domain7. Courtesy of National Severe Storms Laboratory/US National Oceanic and Atmospheric Administration. http
://commons.wikimedia.org/wiki/File:Seymour_Texas_Tornado.jpg . Public Domain8. Courtesy of National Weather Service. http://commons.wikimedia.org/wiki/File:Ringgold_tornado_damage.j
pg . Public Domain9. Courtesy of the US Federal Emergency Management Agency. http://commons.wikimedia.org/wiki/File:Torna
do_Alley.gif . Public Domain10. Courtesy of GOES Project Science team/NASA’s Earth Observatory. http://earthobservatory.nasa.gov/Natural
Hazards/view.php?id=50347 . Public Domain11. User:MichaelBillington/Wikipedia. http://commons.wikimedia.org/wiki/File:Uk-cyclone-2.png . Public Do-
main12. Courtesy of NASA. http://commons.wikimedia.org/wiki/File:Storm_of_the_century_satellite.gif . Public
Domain13. Courtesy of US National Oceanic and Atmospheric Administration. http://commons.wikimedia.org/wiki/Fi
le:Hurricane_structure_graphic.jpg . Public Domain14. Courtesy of NESDIS/US National Oceanic and Atmospheric Administration. http://commons.wikimedia.org
/wiki/File:Katrina-noaaGOES12.jpg . Public Domain15. Courtesy of Petty Officer 2nd Class Kyle Niemi, US Coast Guard. http://commons.wikimedia.org/wiki/File:K
atrinaNewOrleansFlooded.jpg . Public Domain16. Liz West. http://www.flickr.com/photos/calliope/98817822/ . CC BY 2.017. Courtesy of Jeff Schmaltz, NASA/MODIS Rapid Response Team. http://earthobservatory.nasa.gov/Natural
Hazards/view.php?id=42680 . Public Domain18. Courtesy of SeaWiFS Project and NASA/Goddard Space Flight Center. http://earthobservatory.nasa.gov/IOT
D/view.php?id=989 . Pubic Domain19. Courtesy of Jesse Allen, NASA/NASA’s Earth Observatory. http://earthobservatory.nasa.gov/IOTD/view.p
hp?id=7968 . Public Domain
15